Abstract
The seismic performance of four different kinds of steel plate shear walls (SPSWs) before and after corrosion are investigated in this paper, including flat steel plate shear walls (FSPSWs), SPSWs with vertical slots in the middle (VSSPSWs), SPSWs with orthogonal stiffeners (OSPSWs) and SPSWs with silts on both sides (BSPSWs). A numerical model that can be validated by existing quasi-static cyclic tests is developed by ABAQUS 6.13. The seismic performance of SPSWs under cyclic loading and atmospheric corrosion is investigated. The results show that (1) compared with FSPSWs, the ultimate shearing strength, initial stiffness, energy dissipation, and ductility of OSPSWs are significantly improved under cyclic loads when both VSSPSWs and BSPSWs are reduced in ultimate shearing strength and energy dissipation. (2) The performance of the FSPSW is most affected by atmospheric corrosion but setting stiffeners can significantly improve the hysteretic performance after corrosion. Meanwhile, the effect of the VSSPSW is better than that of the BSPSW in decreasing the ultimate shearing strength, although both decrease more tardily than that of the FSPSW. (3) The relationships between the ultimate shearing strength and corrosion time of SPSWs are fitted into four equations in this paper, which can be used in practical situations.
1. Introduction
Steel structure buildings have the advantages of better seismic performance, shorter construction periods, and environmental protection and can be widely used for China’s urban construction in the future. With the advantages of high initial stiffness, excellent ductility, and uncomplicated connection, the steel plate shear wall (SPSW) is an ideal lateral force-resisting system [1,2,3,4,5]. Meanwhile, the SPSW can carry loads using the post-buckling strength and dissipate energy by the plastic development of steel under earthquake loads, so there exist outstanding mechanical properties and energy dissipation capacity on SPSW [6,7]. However, the SPSW easily buckles and has poor out-of-plane stiffness when subjected to earthquake loads, and due to connecting with the boundary column, the tension field can be formed in the SPSW, which can decrease the ultimate shearing resistance of the SPSW [8,9].
In order to solve the above problems of the SPSW, many experimental and theoretical investigations were conducted. Ahmadi et al. [10] conducted experimental and numerical investigations on the seismic performance of steel slit shear walls, and the results showed this lateral force-resisting system had a good seismic performance. Compared to the non-stiffened flat steel plate, the stiffener can effectively improve the seismic performance of the SPSW [11]. Haddad et al. [12] conducted an experimental investigation on the seismic performance of stiffened and unstiffened SPSWs; the results showed that the SPSW with stiffeners could considerably improve the ultimate shearing resistance, ductility, and energy dissipation capacity.
All this time, the corrosion problem of steel structures has attracted much attention. There have been lots of studies on the corrosion mechanism and mechanical property degradation of corroded steel; the results showed that corrosion could lead to the rapid aging of steel, reduction in strength, and stress concentration, which finally decreases the ultimate shearing strength of structure [13,14,15,16,17,18,19,20,21,22,23,24,25,26], so it is significant to investigate the performance of corroded steel structures. Woloszyk et al. [27,28,29] applied a random field approach to the modeling of corroded steel surfaces and confirmed that the irregularity of corrosion for steel surfaces is one of the main reasons for the decrease in mechanical properties. Zhao et al. [30,31,32] conducted a numerical investigation of pitting steel and systematically explored how factors such as the shape, depth, and arrangement of pitting holes can reduce the tensile performance of steel.
In addition to material properties, some experimental and numerical investigations have also been conducted on the properties of corroded components. Zheng et al. [33,34] implemented an accelerated corrosion test in a chloride environment and obtained a mutual verification between his finite element (FE) model and the experimental results. Wang et al. [35,36] investigated the effect of corroded steel frame joints on seismic performance through experimental and numerical investigations. Xu and Zhang et al. [37,38,39] established FE numerical models of corroded steel columns in simulated corrosion and cyclic loading tests. The above results indicated that the seismic performance of the steel frame and components was seriously damaged by corrosion. As the corrosion degree increased, the deformation capacity, energy dissipation capacity, and mechanical properties of the steel frame and components were significantly reduced.
Although scholars have conducted a large number of experimental and numerical studies for SPSWs, the comparative research on the seismic performance of different types of flat steel plates is still insufficient. Meanwhile, although many experiments and numerical analyses on corroded steel components have been finished, there is still little research on the seismic performance of SPSWs after corrosion [40,41,42]. Therefore, in order to investigate the seismic performance of different kinds of SPSWs before and after corrosion, four different types of SPSWs are proposed in this paper, and numerical analyses of four kinds of SPSWs are performed by using ABAQUS based on the test-validated modeling method. In addition, the seismic performance of specimens at different corrosion levels is investigated. Finally, the fitted formulae of ultimate shearing resistance for corroded SPSWs are proposed. The analyses results of seismic performance and fitted formulae can be applied to practical engineering design.
2. FEM of SPSWs
2.1. Model Design
Four different kinds of SPSWs are studied in this paper, including flat steel plate shear walls (FSPSWs), SPSWs with orthogonal stiffeners (OSPSWs), SPSWs with vertical slots in the middle (VSSPSWs), and SPSWs with silts on both sides (BSPSWs), as presented in Figure 1. According to the Chinese codes GB50017-2017 [43], JCJ/T380-2015 [44], and GB50011-2010 [45], the dimension details of specimens are designed as shown in Figure 1. Meanwhile, HW 400 × 400 × 20 × 24, HN 350 × 250 × 14 × 20, and HN 300 × 200 × 12 × 20 are used as the boundary column, boundary beams (top beam and bottom beam), and middle beam, respectively. The flat steel plate, which has a 6 mm thickness, is only welded to the boundary beam, and the welded connection is adopted between the beams and boundary columns. The section dimension of the stiffener of specimen OSPSW is −3000 × 50 × 6, and stiffeners are arranged on two surfaces of flat steel plate. Q235 steel is used for the infilled flat steel plate, and Q355 steel is selected for all other components.
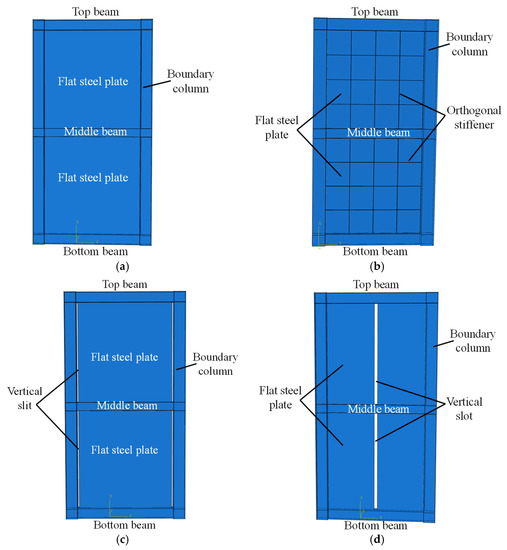
Figure 1.
Diagrams of specimens: (a) FSPSW; (b) OSPSW; (c) BSPSW; (d) VSSPSW.
The detailed dimensions and profiles of the four kinds of SPSW specimens are presented in Figure 2. The boundary conditions of FEM models for specimens are shown in Figure 3, and the boundary condition of flat steel plates is that the upper and lower sides are only connected with the frame beam. The constitutive relation of the material is shown in Figure 4, and σy is the yield strength, σu is the ultimate strength, σst is 85% of σu. Modeling with S4R four-node shell elements, the “Merge” command is used to simulate the connection between the beam and frame column, and the “Tie” command is applied to simulate the infilled steel plate welded to the beam. The element size of the infilled steel plate is 30 mm × 30 mm, and the element size of the boundary frame is 35 mm × 35 mm. The vertical load, such as gravity, is simulated with an axial force of 2500 kN, and the horizontal load is applied at a coupling point consisting of the top of the boundary column until the specimen is damaged.
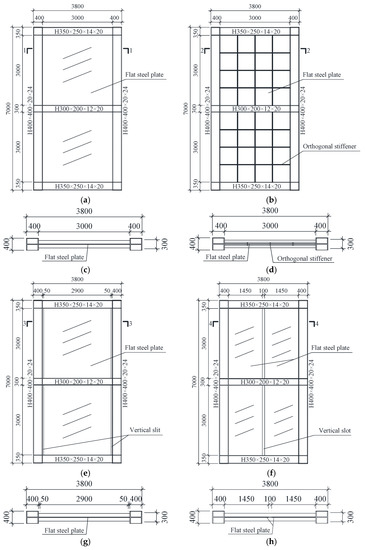
Figure 2.
Dimension details of specimens: (a) FSPSW; (b) OSPSW; (c) Section 1-1 of FSPSW; (d) Section 2-2 of OSPSW; (e) BSPSW; (f) VSSPSW; (g) Section 3-3 of BSPSW; (h) Section 4-4 of VSSPSW.
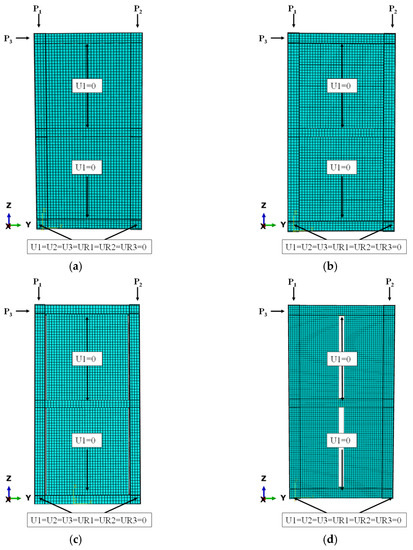
Figure 3.
The boundary conditions of FEM models for SPSWs: (a) FSPSW; (b) OSPSW; (c) VSSPSW; (d) BSPSW.
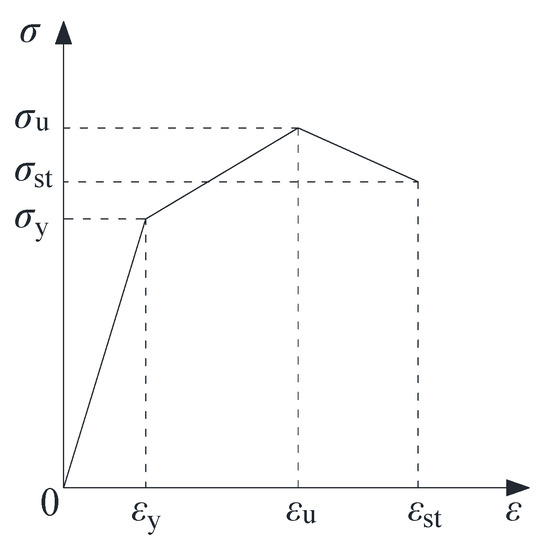
Figure 4.
The constitutive relation of steel in the FEM model.
2.2. Model Validation
Due to the lack of tests on flat steel plate shear walls, test specimen S–4 from Ref. [46] is selected to compare the test results with the FEM results. The dimensions of each component are shown in Table 1, the material properties are shown in Table 2, and the test specimens are shown in Figure 5.

Table 1.
Dimension details of test components [46].

Table 2.
Material properties [46].
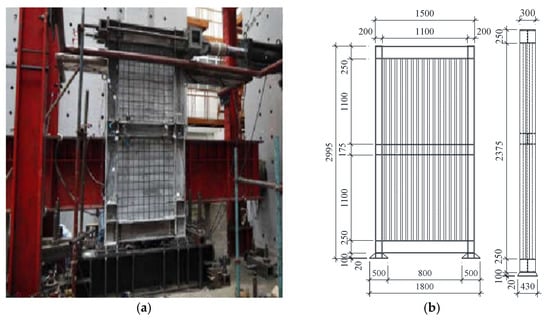
Figure 5.
Test specimen S–4 [46]: (a) Test site equipment; (b) Dimensions of the test specimen.
According to the literature [46] and the Chinese standards of JGJ101-96 [47], the lateral load was applied by using the combination of the load control method and displacement control method, as shown in Figure 6. Before the test specimen yielded, the lateral load was applied by using the load control method, the spacing between each loading step was 100 kN and repeated once at each loading step; when the test specimen yielded, the lateral load was applied by using the displacement control method, and the story drift ratio θ was used as load displacement, the spacing of θ between each load step was 0.25%, and the spacing of θ between each load step increased to 0.5% after of the θ reached 1.0%, with two cycles for each loading step.
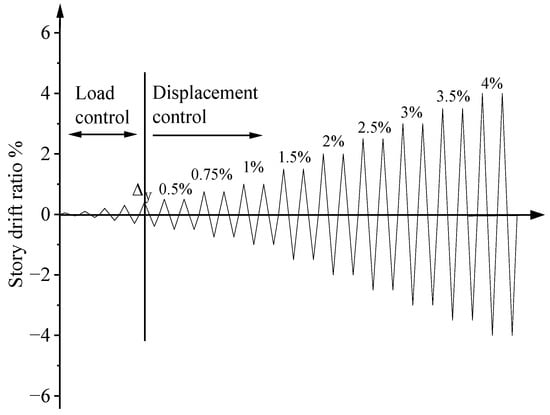
Figure 6.
Cyclic loading of S−4 [46].
The comparisons of load-displacement curves derived from the FEM and test are shown in Figure 7, and the characteristic values are shown in Table 3. There existed strong consistency between the two hysteretic curves, which were obtained from the FEM and test, respectively, and there was little difference in the initial stiffness of the FEM model and test at the elastic stage. The general trend of the skeleton curves was primarily in line with the ultimate shearing resistance. Compared to the test data, the errors of the lateral stiffness, load, and displacement at the yield point, peak load, and corresponding displacement from the FEM model were 4%, 15%, 11%, 16%, 16%, and 8%, respectively, so the FEM results are by and largely coincident with the test.
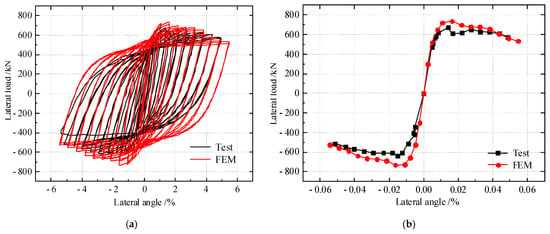
Figure 7.
The contrast of load-angle curves of S−4: (a) Hysteretic curves; (b) Envelope curves.

Table 3.
Characteristic parameters of specimens.
The comparisons of the invalidation phenomenon of specimen S−4 from the test and FEM are shown in Figure 8. There was an awfully noticeable out−of−plane deformation on the whole steel plates, parts of them were torn, and severe buckling occurred at the boundary column flanges and webs. By contrast, it can be concluded that the model accurately forecasts the buckling effects of specimen S−4. Therefore, it is observed that the modeling method in Section 2.1 is practicable, and subsequent studies can also be modeled using this method.
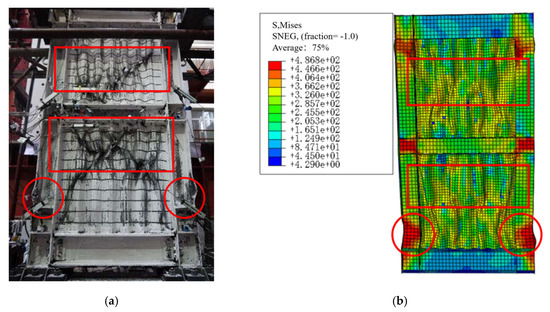
Figure 8.
Comparison of the invalidation phenomenon: (a) Test phenomenon; (b) FEM result.
3. Comparative Study of SPSW Seismic Performance
3.1. Comparison of the Load−Displacement Curves
The FEM and numerical analysis of the four kinds of SPSWs under cyclic loads are conducted through a modeling method similar to that in Section 2. Figure 9 depicts the load-displacement curves of the specimens, and Table 4 shows their characteristic results. After yielding, the hysteretic loop of the OSPSW is the fullest among them, the pinching of the hysteretic loop of BSPSW is the most obvious, and the initial stiffness of the FSPSW decreases more slowly after arriving at the peak load, while the trends of initial stiffness degradation for the VSSPSW, OSPSW, and BSPSW are mainly consistent. Compared with the FSPSW, the initial stiffness, yield load, peak load, and ductility of the OSPSW increased by 86.3%, 25.9%, 29.3%, and 34%, respectively, while the four corresponding values of the BSPSW decreased by 15.1%, 31.4%, 28.8%, and 48.2%, respectively. The initial stiffness and ductility of the VSSPSW are 35.6% and 22.2% lower than those of the BSPSW, respectively, but the yield and peak loads are 27.9% and 19.6% higher, respectively.
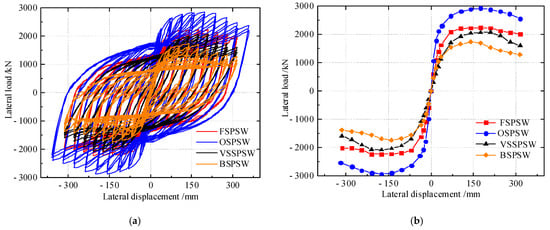
Figure 9.
Load-displacement curves of the FSPSW, OSPSW, VSSPSW, and BSPSW: (a) Hysteretic curves; (b) Envelope curves.

Table 4.
Characteristic results of the FSPSW, OSPSW, VSSPSW, and BSPSW.
The results show that the OSPSW has a larger initial stiffness, ultimate shear-resistant capacity, and better stretchability, while the initial stiffness, yield load, peak load, and ductility of the VSSPSW and BSPSW are lower than those of the FSPSW. Therefore, setting stiffeners can effectively improve the hysteretic performance of SPSWs. Slotting results in a reduction in the hysteretic performance of the SPSW to a certain extent, while the hysteretic property of the VSSPSW is superior to that of the BSPSW.
3.2. Comparison of Energy Dissipation Capacity
How much energy a structure or component absorbs after plastic deformation during an earthquake is its energy dissipation capacity, which is evaluated by the energy dissipation coefficient he and calculated according to Equation (1).
where SABC and SCDA represent the areas surrounded by the hysteretic curve and the x-axis, respectively, and SOBF and SODE represent the areas of OBE and ODF, respectively, as shown in Figure 10.
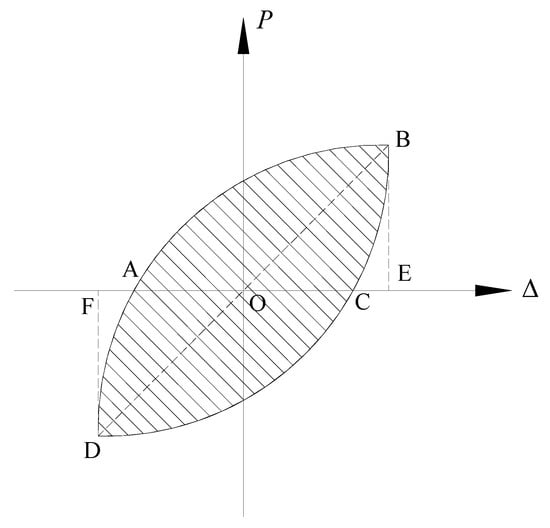
Figure 10.
Calculation diagram of the energy dissipation coefficient.
The energy dissipation values at each loading step for the specimens are shown in Figure 11. Compared with FSPSW, VSSPSW, and BSPSW, the total energy dissipation of OSPSW increases by 38%, 89.3%, and 138.6%, respectively. At each loading step, the energy dissipation value and rate of the OSPSW are larger than those of the FSPSW, VSPSW, and BSPSW. The energy dissipation value of each loading step of the FSPSW is larger than that of the VSSPSW and BSPSW, and the energy dissipation rate of the FSPSW slightly decreases after the loading step reaches 6δ. Meanwhile, before reaching 4δ, the energy dissipation value of the BSPSW is greater than that of the VSSPSW. With increasing loading steps, the energy dissipation rate of the BSPSW becomes slower, and the energy dissipation value is less than that of the VSSPSW. Therefore, setting reinforcement can enhance the energy dissipation capacity of SPSWs, and slotting will decrease the energy dissipation capacity of SPSWs. It is noted that slotting in the middle part has a better energy dissipation capacity than slotting on both sides.
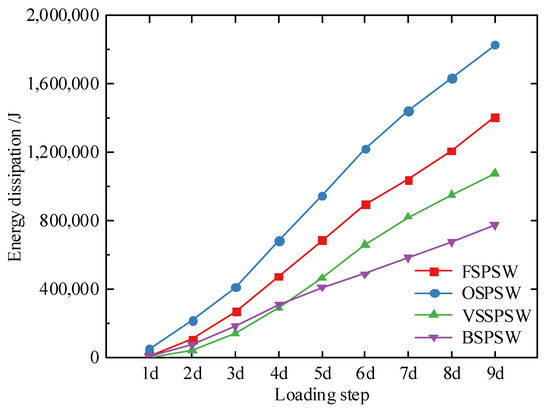
Figure 11.
Energy dissipation of the FSPSW, OSPSW, VSSPSW, and BSPSW.
3.3. Stress Development and Distribution Comparison
The stress distributions of the SPSWs at failure are shown in Figure 12. For the FSPSW, the infilled steel plate buckles slightly, and severe buckling occurs at the top and bottom parts of the boundary column and connections between the columns and middle beam. For the OSPSW, because of the stiffeners, the buckling on the flat steel plate is less than that of the FSPSW, and slight buckling deformation occurs at the top and bottom parts of the columns. The plastic hinge occurs successively at both ends of the middle beam and column. For the VSSPSW, due to slotting at the middle part, the distribution of stress on the flat steel plate is well proportioned, slight buckling deformation occurs at the top and bottom of the columns, and there is no full section yielding. For the BSPSW, the variation in stresses for the steel plate is diagonally distributed along the tensile band. The peak stress still arises at the bottom of the column and the beam-column connection. This result is consistent with the failure mode of this result and FSPSW, and the bottom of the boundary column exhibits severe buckling. Therefore, setting stiffeners and slotting in the middle part can inhibit the generation of the plastic hinge at the column end and inhibit the buckling of the flat steel plate, in which slotting in the middle part has a better effect.
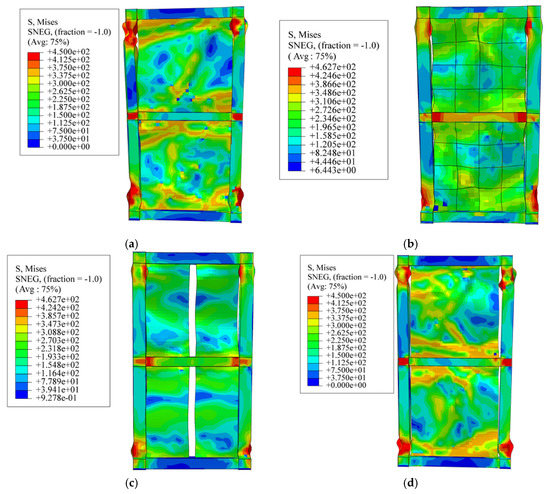
Figure 12.
Stress distribution of damaged FEM specimens: (a) FSPSW; (b) OSPSW; (c) VSSPSW; (d) BSPSW.
3.4. Comparison of Implementation Costs of SPSWs
The usage amount of steel specimens is presented in Table 5. Compared to FSPSW, the usage amount of steel of OSPSW increases by 19.9%, and the usage amount of steel of VSSPSW and BSPSW decreases by 3.4%. It can be seen from Section 3.1 that compared to FSPSW, the K0, Pm, and μ of OSPSW increase 86.3%, 29.3%, and 34%, and the three corresponding values of VSSPSW decrease 56.1%, 7.6%, and 81.3%, respectively; and the three corresponding values of BSPSW decrease 15.1%, 28.8%, and 48.2%. It is revealed that the OSPSW has better seismic performance. Meanwhile, it can be seen from Section 3.1 that compared with FSPSW, VSSPSW, and BSPSW, the total energy dissipation of OSPSW increases by 38%, 89.3%, and 138.6%, respectively. The above analysis results show that although the specimen OSPSW has a little more usage amount of steel than other specimens, the values of K0, Pm, and μ of OSPSW are much larger. Therefore, the specimen OSPSW is suggested to be used for practical engineering.

Table 5.
Characteristic results and usage amount of steel of specimens.
4. Comparative Research on the Seismic Performance of SPSWs under Atmospheric Corrosion
4.1. Material Properties after Corrosion
The results of the accelerated corrosion test from Ref. [33] are selected in this paper, and the fitting formula of Ref. [33] is picked to compute the yield strength of steel after corrosion, as shown in Equation (2).
where fy represents the yield strength of corroded steel; E represents the elastic modulus of corroded steel; fy and E0 represent the yield strength and elastic modulus of steel that is not corroded, respectively, and fy0 = 235 MPa or 355 MPa, E0 = 206,000 MPa.
In this paper, the corrosion rate of the test is calculated to be 1208 μm·a−1, and the atmospheric corrosion rate in the Beijing area is 11.7 μm·a−1 [48]. The actual corrosion time is obtained through these two rates. Table 6 shows the switch from the simulated corrosion test time to the actual corrosion time.

Table 6.
The actual corrosion time and elastic modulus of corrosion steel.
4.2. Comparison of the Hysteretic Performance of Eroded SPSWs
Hysteretic curves and envelope curves of the eroded test piece for three kinds of corrosion days is shown in Figure 13a–f, with characteristic results shown in Table 7. At different corrosion levels, the hysteretic curve of the OSPSW is the fullest, with the largest initial stiffness, peak load, and ductility coefficient, but the stiffness degradation of the OSPSW is the most obvious at 60 and 120 days of corrosion. The BSPSW, which has the minimum hysteretic loop area, is basically consistent with the FSPSW in the trend of stiffness degradation and ultimate shearing resistance decrease. VSPSWs have the lowest stiffness and ductility among them, but the energy dissipation capacity of VSPSWs is second only to that of OSPSWs.
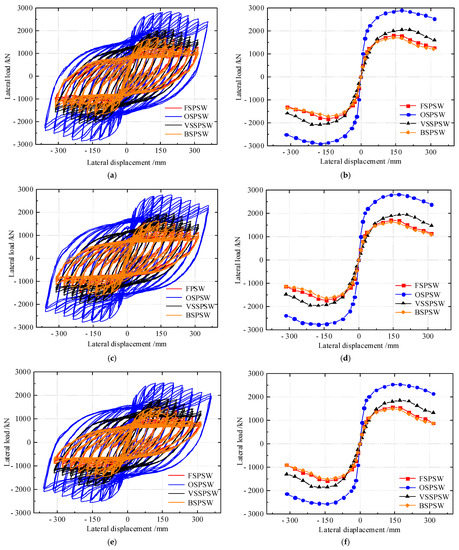
Figure 13.
Load-displacement curves of corrosion SPSWs: (a) hysteretic curves of corrosion for 20 d; (b) envelope curves of corrosion for 20 d; (c) hysteretic curves of corrosion for 60 d; (d) envelope curves of corrosion for 60 d; (e) hysteretic curves of corrosion for 120 d; (f) envelope curves of corrosion for 120 d.

Table 7.
Characteristic results of FSPSW, OSPSW, VSSPSW, and BSPSW at diverse corrosion days.
When the experimental corrosion time of SPSWs is 20 days, in contrast to FSPW, the characteristic results of the OSPSW are increased dramatically; more specifically, the initial stiffness and ductility coefficient is improved by 129.3% and 100.0%, respectively. Meanwhile, the yield and peak load increased by 56.0% and 57.7%, respectively. The initial stiffness and ductility coefficient of the VSSPSW decrease by 25.0% and 16.6%, respectively, whereas the yield load and the peak load increase by 19.4% and 13.8%, respectively. The ductility coefficient is reduced by only the initial 2.1% less than the other initial stiffness, and the yield load and peak load are decreased by 5.2%, 5.1%, and 5.5%, respectively.
When the experimental corrosion time of SPSWs is 60 days, in contrast to FSPW, the characteristic results of the OSPSW are obviously increased. The initial stiffness and ductility coefficient improved by 134.8% and 101.7%. Simultaneously, the yield load and peak load increased by 60.9% and 62.0%, respectively. The initial stiffness and ductility coefficients of the VSSPSW decrease by 22.8% and 14.2%, respectively, while the yield and peak load increase by 19.1% and 13.6%, respectively. The BSPSW decreases by 4.3%, 4.1%, and 4.5% in the initial stiffness, yield load, and peak load, respectively, while the ductility coefficient increases by 1.7%.
When the experimental corrosion time of SPSWs is 120 days, in contrast to FSPW, the characteristic results of the OSPSW are increased. The initial stiffness and ductility coefficient improved by 137.7% and 108.9%, respectively, while the yield load and peak load rise by 66.1% and 63.8%, respectively. The initial stiffness and ductility coefficients of the VSSPSW decrease by 23.0% and 19.0%, respectively, while the yield and peak load increase by 23.3% and 17.6%, respectively. The BSPSW decreases by 4.0%, 4.8%, and 5.4% in the initial stiffness, yield load, and peak load, respectively, while the ductility coefficient increases by 5.8%.
Consequently, the initial stiffness, ductility, yield load, and energy dissipation capacity of SPSWs are improved effectively through setting stiffeners, which also can inhibit the stiffness degradation of SPSWs under different corrosion levels. With increasing corrosion time, the initial stiffness and ductility coefficient of the FSPSW decrease faster than those of the VSSPSW and BSPSW. Thus, the slotting of the flat steel plate can effectively inhibit the hysteretic performance decrease after corrosion.
4.3. The Hysteretic Performance of SPSWs under Different Corrosion Days
Load-displacement curves of SPSWs under different corrosion days are shown in Figure 14. Pinching occurs in the hysteretic loop of the FSPSW with the passage of corrosion time, and the ultimate shearing resistance decreases rapidly in the early stage of corrosion. Compared to FSPSW without corrosion, when the corrosion time reaches 20 days, 60 days, and 120 days, the initial stiffness of the FSPSW falls by 21.1%, 25.5%, and 31.8%, respectively; the yield load decreases by 20.0%, 24.3%, and 30.3%, respectively; the peak load decreases by 18.9%, 23.2%, and 29.4%, respectively; and the ductility coefficient decreases by 35.1%, 37.6%, and 40.8%, respectively.
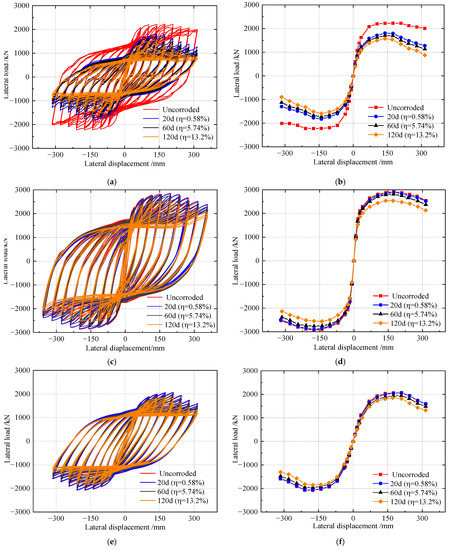
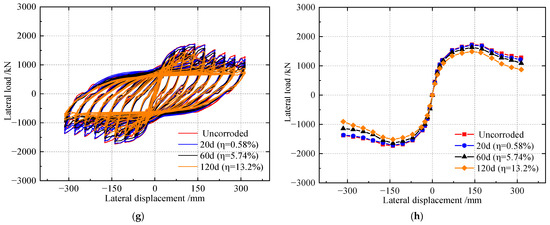
Figure 14.
Comparison of SPSWs under different corrosion days: (a) Hysteretic curves of FSPSW; (b) Envelop curves of FSPSW; (c) Hysteretic curves of OSPSW; (d) Envelop curves of OSPSW; (e) Hysteretic curves of VSSPSW; (f) Envelop curves of VSSPSW; (g) Hysteretic curves of BSPSW; (h) Envelop curves of BSPSW.
As the corrosion time increases, no pinching occurs in the hysteretic loop of the OSPSW, but the ultimate shearing resistance decreases significantly when the corrosion time is 120 d, indicating that the OSPSW has good hysteretic performance after corrosion. Compared to OSPSW without corrosion, when the corrosion time reaches 20 days, 60 days, and 120 days, the stiffness of the corroded OSPSW reduces by 2.8%, 6.1%, and 12.9%, respectively; the yield load decreases by 0.8%, 3.3%, and 8.1%, respectively; the peak load decreases by 1.0%, 3.8%, and 10.5%, respectively, bringing ductility coefficients down 3.1%, 6.2%, and 7.7%, respectively.
As the corrosion time increases, the pinching occurs in the hysteretic loop of the VSSPSW, and the overall trend of the envelope curves is consistent in principle. Compared with the non-corrosion, the initial stiffness of the VSSPSW decreases by 7.6%, 10.3%, and 18.0%, respectively, when the accelerated corrosion time reaches 20 days, 60 days, and 120 days; the yield load decreases by 1.9%, 7.4%, and 11.7%, respectively; the peak load decreases by 0.6%, 6.1%, and 10.6%, respectively; and the ductility factor decreases by 1.9%, 3.0%, and 13.0%, respectively.
As the corrosion time increases, the pinching occurs in the hysteretic loop of the BSPSW similarly, and the overall tendency of the envelope curves is broadly the same. Compared with the BSPSW without corrosion, the initial stiffness of corroded BSPSW decreases by 13.9%, 18.0%, and 24.6%, respectively, after 20 days, 60 days, and 120 days; yield load decreases by 0.3%, 4.6%, and 12.9%, respectively; peak load decreases by 1.2%, 5.7%, and 13.9%, respectively; and ductility factor decreases by 5.8%, 6.0%, and 7.1%, respectively.
Consequently, due to the corrosion, the ultimate shearing resistance, initial stiffness, ductility, and energy dissipation capability of specimens are reduced. For the FSPSW, when uncorroded, the ultimate shearing resistance decreases, and the stiffness degradation is gentle. After corrosion, the decline in the envelope curve is significant, and furthermore, the initial stiffness, yield load, and ultimate load decrease more severely than those of the other three specimens. At the same time, the area of the FSPSW hysteretic loop is greatly reduced after corrosion, so corrosion greatly affects the seismic performance of the FSPSW. For the OSPSW, the initial stiffness, yield load, and ductility coefficient decrease slightly before 60 days of corrosion. The performance indexes decrease after corrosion for 120 days, but the reduction is the gentlest among the four specimens. The hysteretic loop is still full, indicating that the OSPSW has good seismic performance. For corroded VSSPSWs and BSPSWs, the decline in the indexes is gentler than that of FSPW, indicating that slotting can effectively inhibit the decline in SPSW performance after corrosion. At the same time, the hysteretic curve of the corroded VSSPSW is more abundant than that of the corroded BSPSW, with greater ultimate shearing resistance and better seismic performance.
4.4. Comparison of Stress Distribution of SPSWs before and after Corrosion
The stress distributions after the corrosion of the specimens are shown in Figure 15. As the corrosion time increases, the plastic area at the boundary column end of the FSPSW gradually increases. After corrosion for 120 days, serious buckling deformation occurs in the flat steel plate. Comparative analyses show that for the corroded SPSW, setting stiffeners and slotting can restrain the generation of plastic hinges at both ends of the boundary column, inhibit the buckling of flat steel plate, and improve the ductility after corrosion. Among them, the middle vertical slot effect is better.
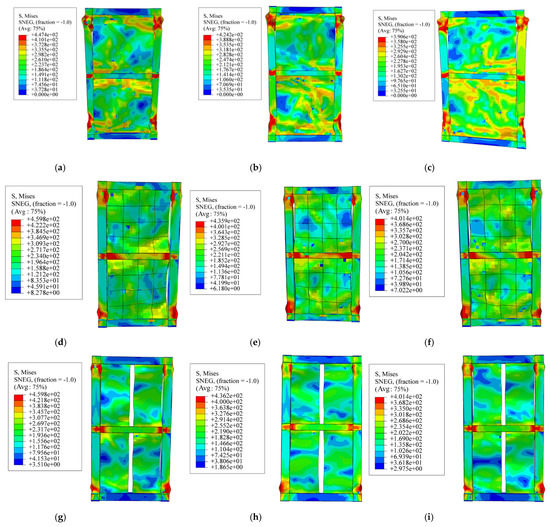
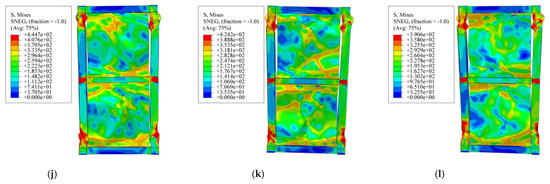
Figure 15.
Stress distribution of FEM results for different corrosion times: (a) corroded FSPSW for 20 d; (b) corroded FSPSW for 60 d; (c) corroded FSPSW for 120 d; (d) corroded OSPSW for 20 d; (e) corroded OSPSW for 60 d; (f) corroded OSPSW for 120 d; (g) corroded VSSPSW for 20 d; (h) corroded VSSPSW for 60 d; (i) corroded VSSPSW for 120 d; (j) corroded BSPSW for 20 d; (k) corroded BSPSW for 60 d; (l) corroded BSPSW for 120 d.
4.5. Fitting the Ultimate Shearing Resistance
After converting 0, 20, and 120 days, which are accelerated corrosion test times to 5.657, 16.972, and 33.945 years in actual outdoor corrosion times, respectively, the ultimate shearing resistance of SPSWs with changing etching time is shown in Figure 16. Equations (3)–(6) are fitting formulae for the ultimate shearing resistance of the SPSWs with an exponential function.
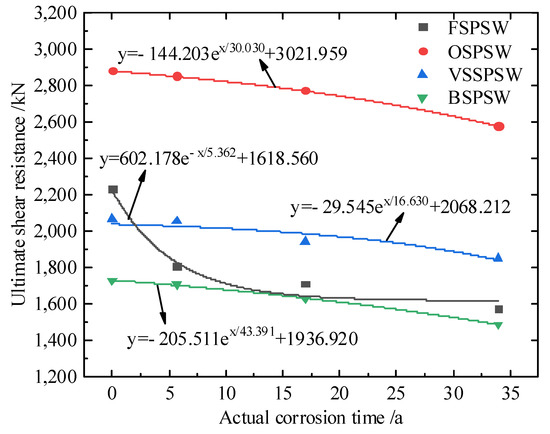
Figure 16.
Fitting formulae of ultimate shearing resistance of SPSWs.
From the fitting curve, it is observed that with increasing corrosion time, the ultimate shearing resistance of the FSPSW decreases remarkably, and it mainly occurs when it starts to corrode. Stiffeners or slotting of the flat steel plate can effectively inhibit the decline of ultimate shearing resistance after corrosion.
5. Conclusions
This paper proposes four kinds of SPSWs and studies the seismic performance of the four specimens before and after corrosion through FE models. The research results are summarized as follows:
(1) The FEM model that can be validated by quasi-static cyclic tests of specimen S–4 in Ref. [46] is developed. The comparative results indicate that the errors between the FEM results and test data in lateral stiffness, yield load, yield displacement, ultimate load, and ultimate displacement are 4%, 15%, 11%, 16%, and 8%, respectively, so the results of the FEM model can validate well the test results.
(2) Under cyclic loading, compared to other specimens, the ultimate shearing resistance, initial stiffness, and ductility of OSPSW are higher, and the total energy dissipation value of the OSPSW is 38% higher than that of FSPSW, while that of the VSSPSW and BSPSW are less 23.5% and 44.8%, respectively. The stiffener can also retard the formation of a plastic hinge at the column end and inhibit the buckling of the flat steel plate. It is revealed that although the OSPSW has a little more usage amount of steel, setting stiffeners can make the SPSW has a better seismic performance.
(3) Under atmospheric corrosion, the seismic performance of OSPSW is affected least among them. Compared to other specimens, the ultimate shearing resistance, ductility, and energy dissipation capacity of the OSPSW are largest under different corrosion levels. With corrosion time increasing, the stiffness of OSPSW degrades most slowly; stiffeners can also inhibit the occurrence of plastic hinges and out-of-plane buckling. It is indicated that setting stiffeners can make corroded SPSWs have better seismic performance.
(4) Under atmospheric corrosion, the seismic performance of FSPSW is affected most among them, but its peak load and energy dissipation capacity are still higher than those of the BSPSW. Although slotting reduces the energy dissipation capacity and ultimate shearing resistance of SPSWs, it can effectively inhibit the reduction in the seismic performance after corrosion, and slotting at the middle part is better than at both sides.
(5) In order to truly reflect the variation of ultimate shearing resistance with corrosion time, the formulae of ultimate shearing resistance for the four specimens are fitted, which can be used for practical engineering.
Author Contributions
X.M.: Software, Investigation, Data curation, Writing—original draft preparation, Writing—review and editing; Y.H.: Conceptualization, Methodology, Formal analysis, Project administration, Writing—review and editing; X.C.: Software, Validation, Data curation, Writing—original draft preparation; L.J.: Conceptualization, Methodology, Project administration, Visualization, Funding acquisition; Y.L.: Visualization, Funding acquisition; H.Z.: Supervision. All authors have read and agreed to the published version of the manuscript.
Funding
This research was funded by open scientific funding in the Key Laboratory of Environmental Change and Natural Disasters of the Ministry of Education, Beijing Normal University (No. 01. Funder: Liqiang Jiang); open scientific funding in Fujian University Engineering Research Center for Disaster Prevention and Mitigation of Southeast Coastal Engineering Structures in China (No. 2019003. Funder: Liqiang Jiang); Natural Science Foundation of Hunan Province, China (No. 2021JJ41083. Funder: Liqiang Jiang); the Scientific Research Project of Hunan Education Department (No. 20B598. Funder: Liqiang Jiang); the Scientific Research Fund of Institute of Engineering Mechanics, China Earthquake Administration (No. 2020D12. Funder: Liqiang Jiang); Open Funding of Hunan Tieyuan Civil Engineering Testing Co., Ltd. (No. HNTY2021K05. Funder: Liqiang Jiang).
Data Availability Statement
The raw data required to reproduce these findings cannot be shared at this time due to time limitations. The processed data required to reproduce these findings cannot be shared at this time due to time limitations.
Conflicts of Interest
The authors declare no conflict of interest.
References
- Yang, R. Study on Buckling Analysis and Hysteretic Behavior of Composite Shear Walls with Pseudo Corrugated Cross-ribbed Flat Steel Plates. Master’s Thesis, Chang’an University, Xi’an, China, 2021. [Google Scholar]
- Tahaii, S.M.; Hamidi, H.; Vaseghi Amiri, J. Inelastic Seismic Demand of Steel-Plate Shear Wall Structures: Emphasis on the PTD Effect. Int. J. Civ. Eng. 2022, 20, 1145–1163. [Google Scholar] [CrossRef]
- Jiang, L.; Zheng, H.; Hu, Y. Experimental seismic performance of steel-and composite steel-panel wall strengthened steel frames. Arch. Civ. Mech. Eng. 2017, 17, 520–534. [Google Scholar] [CrossRef]
- Hu, Y.; Zhao, J.; Jiang, L. Seismic risk assessment of steel frames equipped with steel panel wall. Struct. Des. Tall Spec. Build. 2017, 26, e1368. [Google Scholar] [CrossRef]
- Paslar, N.; Farzampour, A.; Hatami, F. Infill plate interconnection effects on the structural behavior of steel plate shear walls. Thin-Walled Struct. 2020, 149, 106621. [Google Scholar] [CrossRef]
- Azandariani, M.; Gholhaki, M.; Kafi, M. Experimental and numerical investigation of low-yield-strength (LYS) steel plate shear walls under cyclic loading. Eng. Struct. 2020, 203, 109866. [Google Scholar] [CrossRef]
- Tan, J.; Su, M.; Wang, Y.; Wang, K.; Cao, Y.; Li, P. Experimental study on cyclic shear performance of steel plate shear wall with different buckling restraints. Structures 2022, 35, 469–482. [Google Scholar] [CrossRef]
- Ye, J.; Jiang, L. Collapse mechanism analysis of a steel moment frame based on structural vulnerability theory. Arch. Civ. Mech. Eng. 2018, 18, 833–843. [Google Scholar]
- Lv, Y.; Li, L.; Wu, D.; Chen, Y.; Li, Z.; Chouw, N. Shear–displacement diagram of steel plate shear walls with precompression from adjacent frame columns. Struct. Des. Tall Spec. Build. 2019, 28, e1585. [Google Scholar] [CrossRef]
- Ahmadi, Z.; Aghakouchak, A.A.; Mirghaderi, S.R. Steel slit shear walls with an efficient geometry. Thin-Walled Struct. 2021, 159, 107296. [Google Scholar] [CrossRef]
- Suo, Y.; Fan, S.; Li, C.; Zeng, S.; Liu, C. Parametric analysis on hysteresis performance and restoring force model of LYP steel plate shear wall with two-side connections. Int. J. Steel Struct. 2020, 20, 1960–1978. [Google Scholar] [CrossRef]
- Haddad, O.; Sulong, N.H.R.; Ibrahim, Z. Cyclic performance of stiffened steel plate shear walls with various configurations of stiffeners. J. Vibroeng. 2018, 20, 459–476. [Google Scholar] [CrossRef]
- Sultana, S.; Wang, Y.; Sobey, A.J.; Wharton, J.A.; Shenoi, R.A. Influence of corrosion on the ultimate compressive strength of steel plates and stiffened panels. Thin-Walled Struct. 2015, 96, 95–104. [Google Scholar] [CrossRef]
- Jamil, I.; Bano, H.; Castano, J.G.; Mahmood, A. Characterization of atmospheric corrosion near the coastal areas of Arabian sea. Mater. Corros. 2018, 69, 898–907. [Google Scholar] [CrossRef]
- Nguyen, M.N.; Wang, X.; Leicester, R.H. An assessment of climate change effects on atmospheric corrosion rates of steel structures. Corros. Eng. Sci. Techn. 2013, 48, 359–369. [Google Scholar] [CrossRef]
- Tidblad, J. Atmospheric corrosion of metals in 2010–2039 and 2070–2099. Atmos. Environ. 2012, 55, 1–6. [Google Scholar] [CrossRef]
- Tanjung, I.; Nasution, A.R.; Harahap, A.G.; Fonna, S.; Ariffin, A.K.; Huzni, S. Atmospheric Corrosion Analysis on Low Carbon Steel Plate Profile and Elbow in Medan Belawan District. Key Eng. Mater. 2021, 892, 142–149. [Google Scholar]
- Seechurn, Y.; Surnam, B.Y.R.; Wharton, J.A. Marine atmospheric corrosion of carbon steel in the tropical microclimate of Port Louis. Mater. Corros. 2022, 72, 1474–1489. [Google Scholar] [CrossRef]
- Nuraini, L.; Prifiharni, S.; Priyotomo, G.; Sundjono; Gunawan, H.; Purawiardi, I. Atmospheric corrosion performance of different steels in early exposure in the coastal area region West Java, Indonesia. In AIP Conference Proceedings; AIP Publishing LLC: Melville, NY, USA, 2018. [Google Scholar]
- Kumar, V.; Sharma, N.; Tiwari, S.K.; Kango, S. Atmospheric corrosion of materials and their effects on mechanical properties: A brief review. Mater. Today 2021, 44, 4677–4681. [Google Scholar] [CrossRef]
- Xu, Y.; Huang, Y.; Cai, F.; Lu, D.; Wang, X. Study on corrosion behavior and mechanism of AISI 4135 steel in marine environments based on field exposure experiment. Sci. Total Environ. 2022, 830, 154864. [Google Scholar] [CrossRef]
- Liu, H.; Gu, T.; Asif, M.; Zhang, G.; Liu, H. The corrosion behavior and mechanism of carbon steel induced by extracellular polymeric substances of iron-oxidizing bacteria. Corros. Sci. 2017, 114, 102–111. [Google Scholar] [CrossRef]
- Tang, F.; Chen, G.; Brow, R.K. Chloride-induced corrosion mechanism and rate of enamel-and epoxy-coated deformed steel bars embedded in mortar. Cement Concrete Res. 2016, 82, 58–73. [Google Scholar] [CrossRef]
- Qin, S.; Cui, W. Effect of corrosion models on the time-dependent reliability of steel plated elements. Mar. Struct. 2003, 16, 15–34. [Google Scholar] [CrossRef]
- Li, L.; Li, C.; Mahmoodian, M.; Shi, W. Corrosion induced degradation of fatigue strength of steel in service for 128 years. Structures 2020, 23, 415–424. [Google Scholar] [CrossRef]
- Lu, Y.; Wang, R.; Han, Q.; Yu, X.; Yu, Z. Experimental investigation on the corrosion and corrosion fatigue behavior of butt weld with G20Mn5QT cast steel and Q355D steel under dry–wet cycle. Eng. Fail Anal. 2022, 134, 105977. [Google Scholar] [CrossRef]
- Woloszyk, K.; Garbatov, Y. Random field modelling of mechanical behaviour of corroded thin steel plate specimens. Eng. Struct. 2020, 212, 110544. [Google Scholar] [CrossRef]
- Wang, Y.; Zhou, X.; Wang, H.; Kong, D.; Xu, S. Stochastic constitutive model of structural steel based on random field of corrosion depth. Case Studies Constr. Mater. 2022, 16, e00972. [Google Scholar] [CrossRef]
- Woloszyk, K.; Garbatov, Y. An enhanced method in predicting tensile behaviour of corroded thick steel plate specimens by using random field approach. Ocean Eng. 2020, 213, 107803. [Google Scholar] [CrossRef]
- Zhao, Z.; Zhang, H.; Xian, L.; Liu, H. Tensile strength of Q345 steel with random pitting corrosion based on numerical analysis. Thin-Walled Struct. 2020, 148, 106579. [Google Scholar] [CrossRef]
- Sheng, J.; Xia, J. Effect of simulated pitting corrosion on the tensile properties of steel. Constr. Build. Mater. 2017, 131, 90–100. [Google Scholar] [CrossRef]
- Guo, Q.; Zhao, Y.; Xing, Y.; Jiao, J.; Fu, B.; Wang, Y. Experimental and numerical analysis of mechanical behaviors of long-term atmospheric corroded Q235 steel. Structures 2022, 39, 115–131. [Google Scholar] [CrossRef]
- Zhang, X.; Zheng, S.; Zhao, X. Experimental and numerical study on seismic performance of corroded steel frames in chloride environment. J. Constr. Steel Res. 2020, 171, 106164. [Google Scholar] [CrossRef]
- Zheng, S.; Zhang, X.; Zhao, X.; Liu, Y. Experimental and restoring force model research on the seismic behavior of corroded steel frame beams in offshore atmospheric environment. Eng. Mech. 2018, 35, 98–106, 115. [Google Scholar]
- Wang, H.; Xu, S.; Li, A.; Kang, K. Experimental and numerical investigation on seismic performance of corroded welded steel connections. Eng. Struct. 2018, 174, 10–25. [Google Scholar] [CrossRef]
- Xu, Q.; Shang, X.; Zheng, S. Cyclic Behavior of Steel Frame Joints in the Offshore Atmospheric Environment. Int. J. Steel Struct. 2020, 20, 870–884. [Google Scholar] [CrossRef]
- Xu, S.; Zhang, Z.; Qin, G. Study on the seismic performance of corroded H-shaped steel columns. Eng. Struct. 2019, 191, 39–61. [Google Scholar] [CrossRef]
- Karagah, H.; Shi, C.; Dawood, M.; Belarbi, A. Experimental investigation of short steel columns with localized corrosion. Thin-Walled Struct. 2015, 87, 191–199. [Google Scholar] [CrossRef]
- Zheng, S.; Zhang, X.; Zhao, X. Experimental investigation on seismic performance of corroded steel columns in offshore atmospheric environment. Struct. Des. Tall Spec. Build. 2019, 28, e1580. [Google Scholar] [CrossRef]
- Beben, D. Backfill corrosivity around corrugated steel plate culverts. J. Perform. Constr. Facil. 2015, 29, 04014159. [Google Scholar] [CrossRef]
- Wei, X.; Li, G.; Xiao, L.; Zhou, L.; He, K.; Han, B. Shear strength reduction of trapezoidal corrugated steel plates with artificial corrosion pits. J. Constr. Steel Res. 2021, 180, 106583. [Google Scholar]
- Kudus, S.A. Modal analysis of corrugated plate by finite element analysis. Int. Integr. Eng. 2020, 12, 252–258. [Google Scholar]
- GB 50017-2017; Standard for Design of Steel Structures. Chinese Architecture and Industry Press: Beijing, China, 2017.
- JCJ/T 380-2015; Technical Specification for Steel Plate Shear Wall. Chinese Architecture and Industry Press: Beijing, China, 2016.
- GB 50011-2010; Code for Seismic Design of Buildings. Chinese Architecture and Industry Press: Beijing, China, 2016.
- Hao, B. Cyclic Test Vertically Corrugated Steel Plate Shear Walls with Various Openings. Master’s Thesis, Tianjin University, Tianjin, China, 2018. [Google Scholar]
- JGJ101-96; Specificating of Testing Method for Earthquake Resistant Building. Chinese Architecture and Industry Press: Beijing, China, 1997.
- Ma, X.; Hu, Y.; Jiang, L.; Jiang, L.; Nie, G.; Zheng, H. Study on the Seismic Performance of Stiffened Corrugated Steel Plate Shear Walls with Atmospheric Corrosion. Materials 2022, 15, 4920. [Google Scholar] [CrossRef] [PubMed]
Publisher’s Note: MDPI stays neutral with regard to jurisdictional claims in published maps and institutional affiliations. |
© 2022 by the authors. Licensee MDPI, Basel, Switzerland. This article is an open access article distributed under the terms and conditions of the Creative Commons Attribution (CC BY) license (https://creativecommons.org/licenses/by/4.0/).
