Article

Seismic Vulnerability Analysis of Masonry Structures Built with Disassembled Brick Wall Sections

1
School of Civil Engineering, Harbin Institute of Technology, Harbin 150090, China
2
Key Laboratory of Structures Dynamic Behaviour and Control of the Ministry of Education, Harbin Institute of Technology, Harbin 150090, China
3
Key Laboratory of Smart Prevention and Mitigation of Civil Engineering Disasters of the Ministry of Indutry and Information Technology, Harbin Institute of Technology, Harbin 150090, China
*
Author to whom correspondence should be addressed.
Buildings 2022, 12(11), 1831; https://doi.org/10.3390/buildings12111831
Submission received: 12 October 2022 / Revised: 24 October 2022 / Accepted: 25 October 2022 / Published: 1 November 2022
(This article belongs to the Special Issue Dynamic Response of Structures)

Abstract

:
Disassembling brick wall pieces into brick wall sections and constructing masonry buildings with disassembled brick wall sections (DBWSs) can reduce construction waste production at source and help achieve carbon peak and carbon neutrality. A finite element model (FEM) for typical MSBD is established based on the calibrated finite element analysis method to evaluate the seismic performance of masonry structures built with disassembled brick wall sections (MSBD). Subsequently, the peak ground acceleration is selected as the ground motion intensity index, and the maximum inter-story displacement angle is chosen as the structural damage index. The 20 ground motion records are selected and scaled by peak acceleration in 0.2 g steps to form 120 structure-ground vibration samples for incremental dynamic analysis (IDA) and seismic vulnerability analysis. The IDA results indicated that with the gradual increase in peak ground acceleration, the maximum inter-story displacement angle increases and the model transits from the elastic stage to the elastoplastic stage. Because the characteristics of ground motion records are different, the order of structural plasticity development will be different and the number of ground motion records needs to be considered in the seismic performance assessment. The calculation model will not collapse under the 7 and 8 degree design-based earthquake and the probability of moderate and severe damage of the structure under the rare earthquake is minimal, according to the seismic vulnerability curves. The seismic vulnerability analysis results indicate that MSBD has good seismic performance under earthquakes and meets the requirements of “perfect subjected to frequent earthquake, reparable subjected to design based earthquake, no collapse subjected to rare earthquake.” The seismic vulnerability analysis based on probability statistics can provide a reference for seismic design and evaluation of earthquake damage.

1. Introduction

Due to its advantages in terms of easy production, straight forward construction, and durability, clay bricks are frequently employed in civil building projects worldwide. China issued a ban on the production and use of clay bricks in 2004 to save energy and land resources [1]. With the rapid development of society, some masonry structures are facing the situation of renovation or demolition, owing to the function that does not meet the requirements of modern society, the seismic fortification level that does not meet the current standards and the need for urban reconstruction, etc. [2,3,4,5]. However, the quality of the brick walls of the masonry houses that are planned to be demolished may still be good, and most of the demolished materials are treated as construction wastes [6], which is incompatible with the road of green development of construction projects. At present, countries, such as China and Germany, are vigorously building a circular economy system [7]. In this context, the dismantling and reuse of brick wall sections can reduce the production of construction waste at source and help achieve carbon peaking and carbon neutrality [8]. One method of reusing masonry structural elements is to recover bricks of good quality. This method is largely driven by the specific high-value or unique vintage look of the bricks [9]. Another method of reusing masonry structural elements is to crush and grind bricks and mortar blocks to a certain fineness. Brick powder of certain fineness has pozzolanic activity and hydration activity [10,11], which can be used as an admixture to reduce the amount of cement. This method can reduce resource consumption and environmental pollution caused by cement production.
In addition, using disassembled brick wall sections (DBWSs) to build new masonry structures is an effective method. The notion of employing well-preserved brick wall parts to build new masonry homes introduced by the Cubo project [12], which focuses on the renovation of residential houses. Zhou [13] analyzed the mechanical properties of the disassembled bricks and the brick wall specimens made from the disassembled bricks. It was stated that the disassembled process had little effect on the masonry properties, and its bearing capacity calculation could also be carried out regarding the current code. Ucer [14] obtained the DBWSs from the demolition site and tested the mechanical properties. The strength of the bricks and wall sections was found to be more than the current code’s minimal requirement, and the bonds between brick and mortar were good. In other words, the DBWSs can be used to build new houses, provided proper design methods are used.
The seismic performance of masonry structures is significantly influenced by the performance of the brick walls and linkages between walls and structural columns. Nevertheless, for seismic performance, most existing studies focus on reinforced masonry structures and masonry structures built with new materials. Additionally, little attention has been paid to the research on the seismic performance of masonry structures built with disassembled brick wall sections (MSBD). Compared with usual masonry structures, the spacing between constructional columns of MSBD is smaller. It is worth evaluating the seismic performance of buildings with MSBD characteristics. Accurate seismic vulnerability analysis is a necessary condition for reliable prediction in seismic risk assessment. In the previous studies, four vulnerability analysis methods were proposed, including the expert judgment method, empirical analysis method, theoretical analysis method, and mixed analysis method [15,16]. The advantage of the theoretical analysis method is using numerical simulations for the study, which is not limited by specific conditions and can analyze the vulnerability of structures lacking research data.
Therefore, this paper proposed a modeling method of MSBD based on Abaqus software and confirmed the validity of the finite element analysis methods. Based on the usual MSBD, a simplified five-story masonry cross wall was created as the calculation model and 20 ground motion records were chosen for nonlinear incremental dynamic analysis (IDA). Based on the IDA curves and the structural performance level, the seismic vulnerability curves of the calculation model can be created. The seismic capacity of the structure can be determined according to the conditional probability of the structure reaching each limit state, which can serve as a guide for seismic design and earthquake damage assessment.

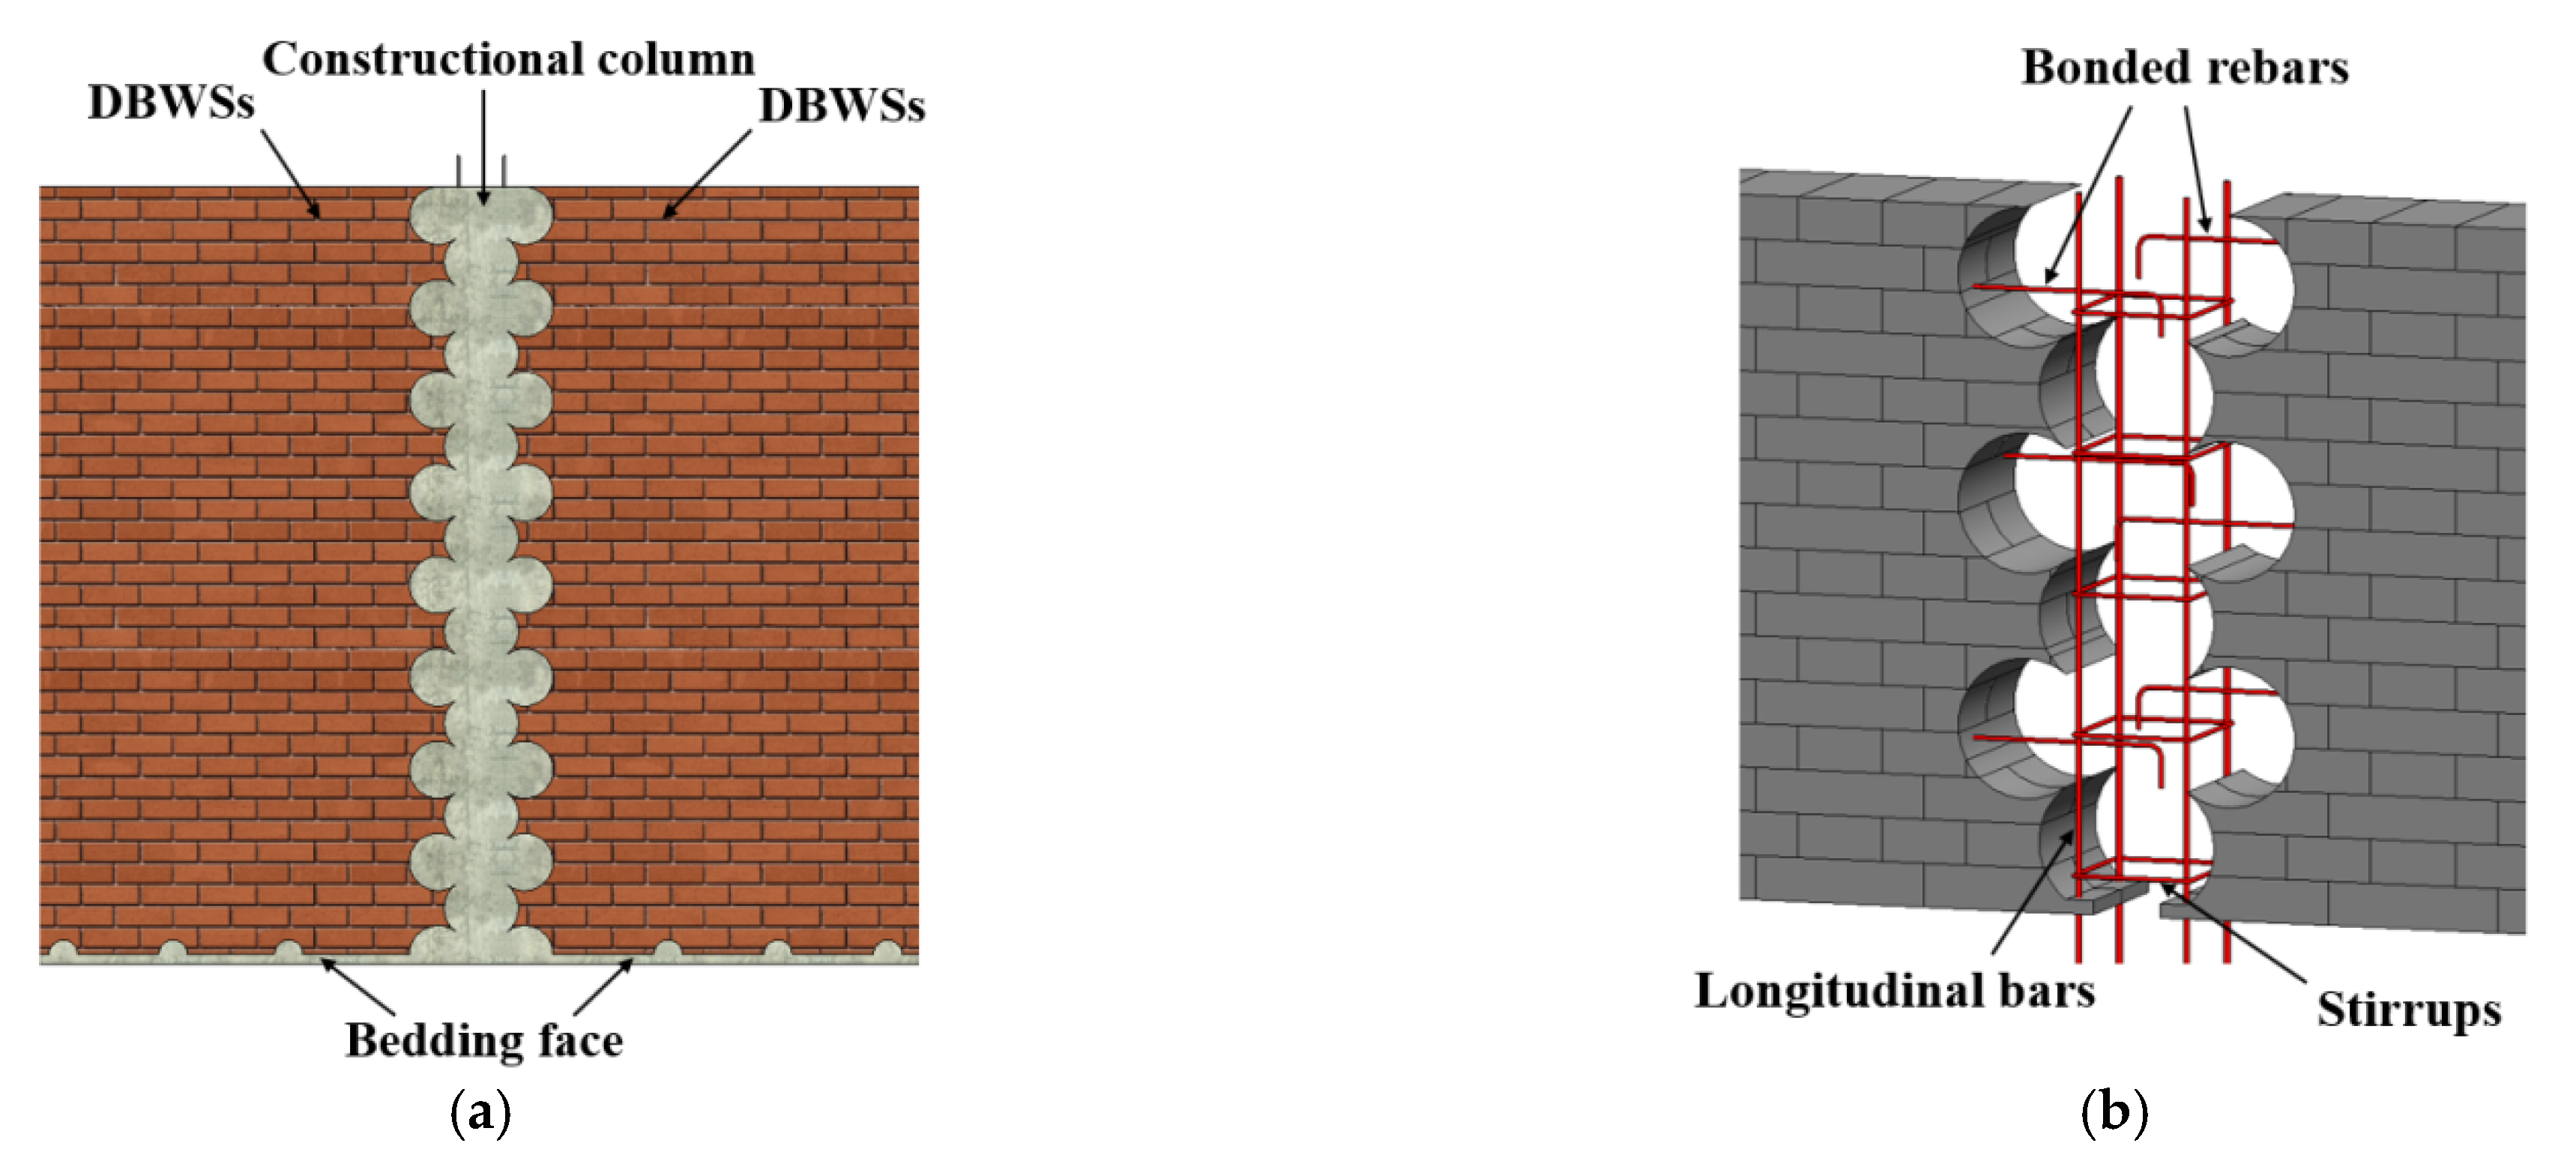
2. Masonry Structures Built with DBWSs

To ensure the durability and seismic performance of MSBD, the brick wall sections without surface damage in a dry and low erosive environment should be selected as the objects for disassembling, and the mechanical properties of the DBWSs should be examined. The actual size of the wall pieces, the permitted size of the transport trucks, the lifting capacity of the lifting equipment, etc., should be considered when determining the size of the DBWSs. The width of the DBWSs is recommended to be 1.0~4.8 m and the height of the DBWSs is recommended to be 0.9~3.6 m, according to GB 50003-2011 [17] and 18CG40 + 18CJ79-1 [18].
Wall components for brick masonry houses comprise both wall pieces and wall pieces with cavities. The roof slab of the floor on which the brick wall to be cut is disassembled must first be removed before the brick wall pieces may be divided into brick wall sections. For brick wall components without cavities, the cutting strategy should be chosen based on the actual wall layout and the previously indicated specifications for cutting size. According to the principle of the holes’ staggered tangency, the coring machine will be utilized to create holes on both sides of the proposed DBWSs, as shown in Figure 1a. The diameter, distance of holes, and dimension of shear keys should be determined according to the connecting performance of the DBWSs and column, cutting efficiency, operability, etc. The recommended value for diameter, the distance of holes, and the dimension of shear keys are illustrated in Table 1. It was found that there is a risk of damage to the DBWSs during disassembling, lifting, and transportation. Hence, a clamping frame suitable for lifting and transporting the DBWSs was proposed by our research group, as shown in Figure 1b. The clamping frame is set on both sides of the DBWSs, and there are wooden slats between the clamping frame and the DBWSs. The clamping frames are attached to each other by bolts on both sides and at the bottom and are lifted off by lifting points located on the top of the clamping frames. The clamping frame can be fitted and connected to the crane’s hook after the holes have been drilled through both sides of the DBWSs. Once the holes have been drilled through the bottom of the DBWSs, the DBWSs can be raised off the ground. At this point, it should be noted that to prevent the DBWSs from tipping over during the disassembly process, temporary supports must be placed up. Additionally, brick wall components containing cavities can be disassembled using the approach described above.
The reliable connection method between the components can ensure the continuity of the wall system, which is the premise of precast concrete shear wall structure to be widely promoted. Similarly, this requirement applies to MSBD. According to GB 50003-2011 [17], tie bars should be placed every 500 mm along the height of the wall, and the connection between the constructional column and the wall should be made into the toothing indenting. In this study, to solve the problem of vertical joints between the DBWSs, the connection method of “holes + bonded rebars + columns” was proposed based on the characteristics of the DBWSs themselves. The construction details of vertical joints in the plane between the DBWSs are shown in Figure 2. Uniformly distributed bonded rebars along the height of the DBWSs and the large size of shear keys can ensure a reliable connection between the DBWSs and the constructional column, ensuring the continuity of load transfer. The L-shaped connection and T-shaped connection between the DBWSs can be completed by referring to the above method.

3. Finite Element Models

3.1. General Strategy

In this section, the numerical simulation of the masonry structure model is carried out using the finite element analysis program ABAQUS. Generally speaking, masonry wall modeling approaches are classified into integral modeling and separated modeling [19]; the choice depends on the accuracy required for the study. The integral modeling approach treats masonry as homogeneous material and models masonry walls as a series of continuous units [20], as shown in Figure 3a. It is more advantageous in modeling relatively large and complex masonry walls. This method, however, cannot be used to describe precise failure modes. The separated modeling approach in Figure 3b considers elements, mortars, and interfaces to provide accurate results. However, the applicability of this method in the analysis of large masonry buildings is constrained by the high computational cost [20]. Alternatively, a simplified separated modeling approach in Figure 3c can be used to simplify calculation costs, which reduces mortar joints to non-thickness interfaces, and half of the mortar’s thickness was added to the element’s thickness to take into account the mortar’s thickness. The accuracy of the simulation findings could be slightly affected by this streamlined approach, but researchers still heavily favor this approach because of the huge cost savings [21].

3.2. Calibration of the Finite Element Model (FEM)

Recently, an experimental study on in-plane static cyclic loading of a two-story masonry structure model built with the DBWSs has been carried out. The findings of this study in terms of force–displacement curves and observed failure modes were used to confirm the validity of the finite element analysis methods. The simplified separated modeling approach was used to establish the FEM of MSBD. Due to masonry walls’ highly nonlinear and brittle characteristics, a dynamic explicit solver was selected as the numerical solving method. A dynamic explicit solver does not require an assembly matrix, which makes it easy to solve complex contact problems, compared to the standard solver. As the model grows, dynamic explicit solver requires fewer resources than standard solver. It should be noted that the dynamic explicit solver essentially uses slow loading to model static problems that require increased computation time to reduce the effect of inertial forces. Generally, quasi-static analysis can be accomplished by taking more than 10 times the period corresponding to the structure’s lowest order modal. Simultaneously, the kinetic energy and internal energy of the model must be assessed. When the material’s kinetic energy does not exceed 10% of the internal energy, the loading process can essentially be ensured to be quasi-static [23].

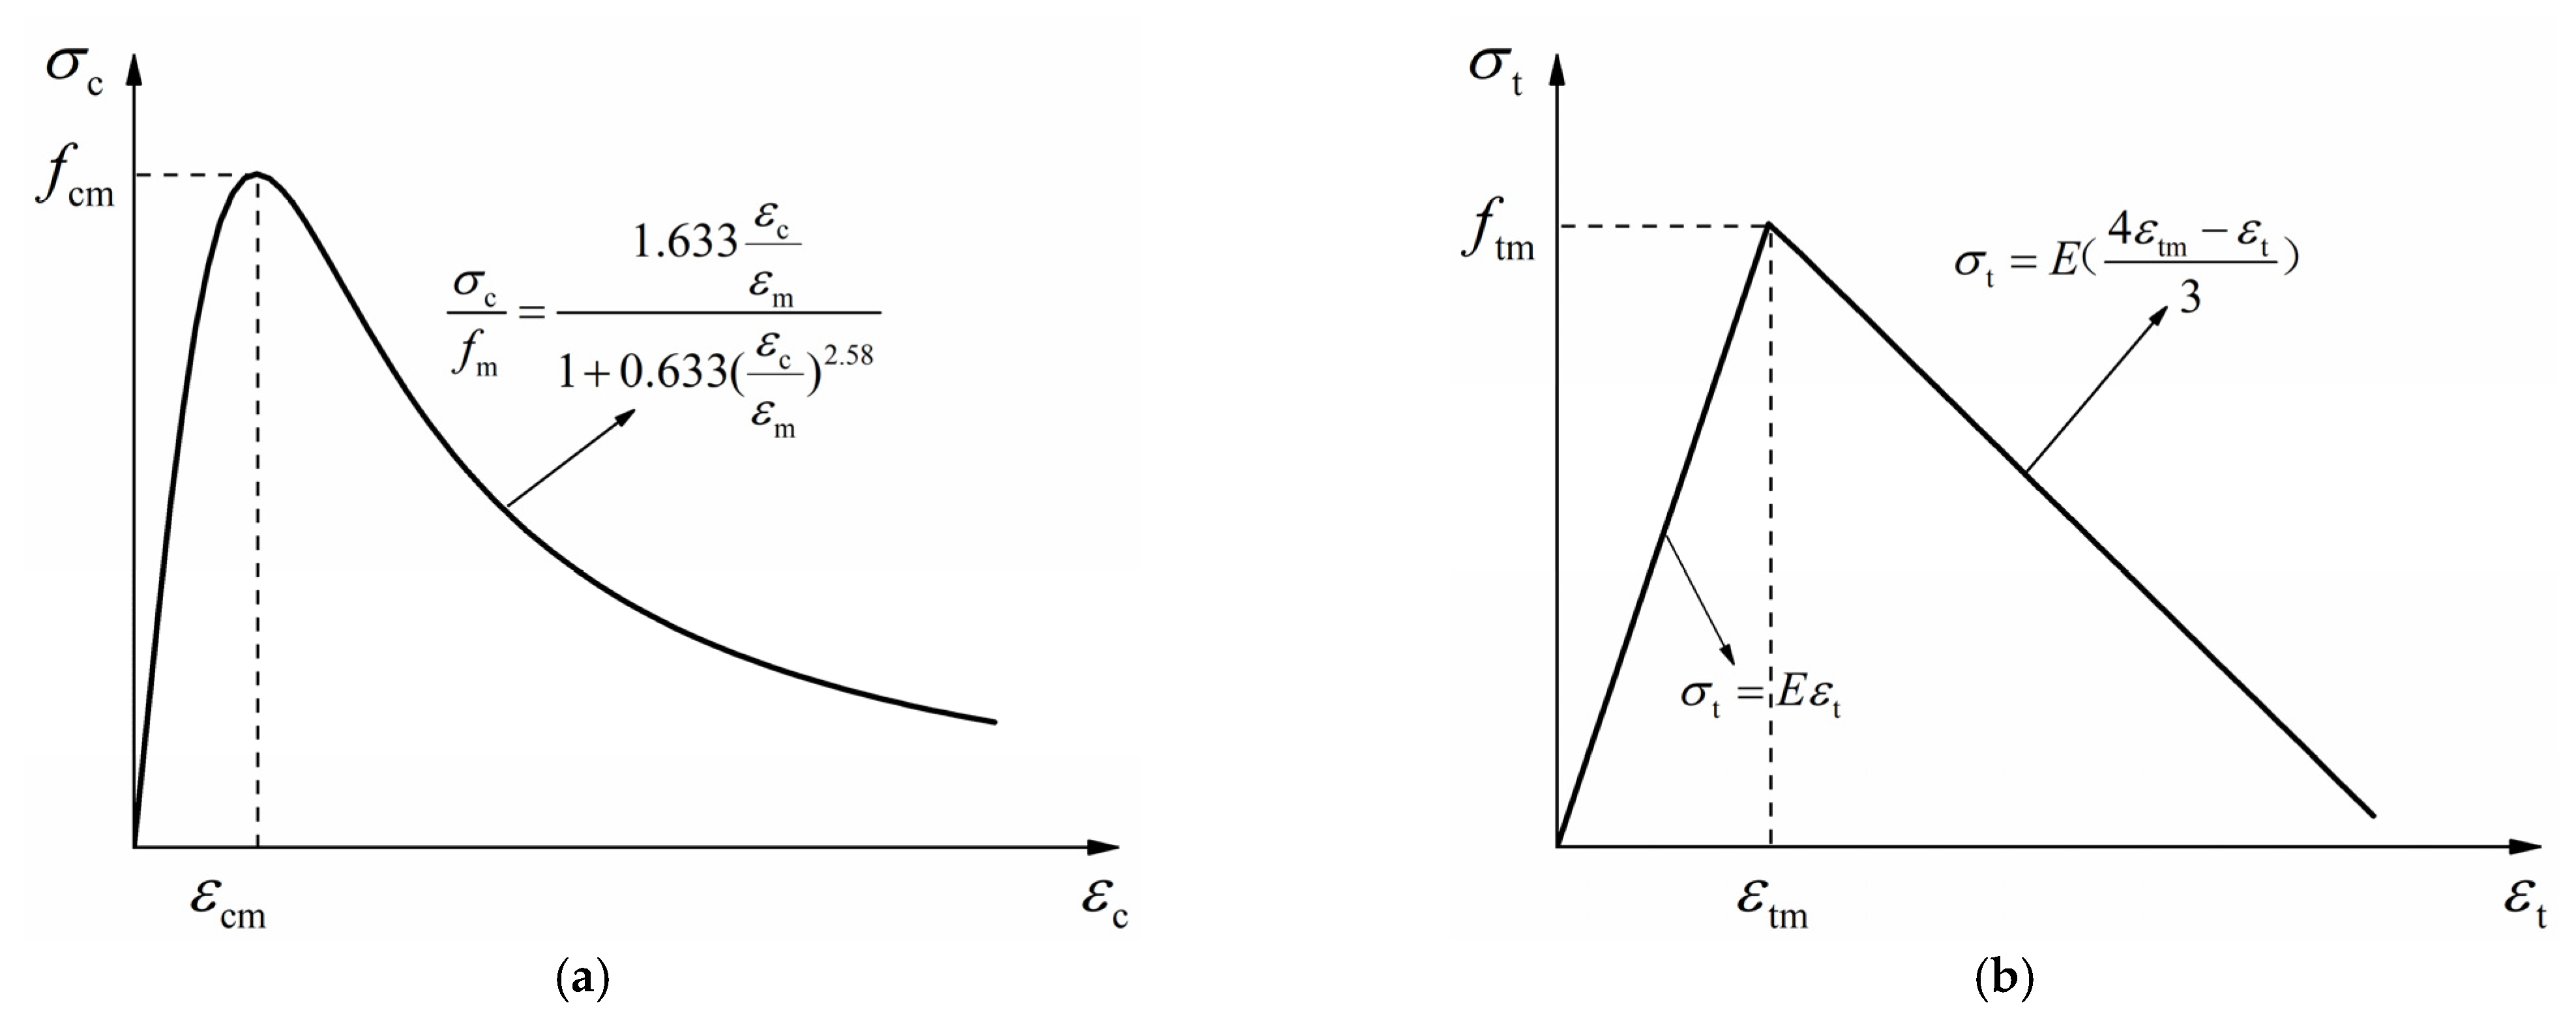
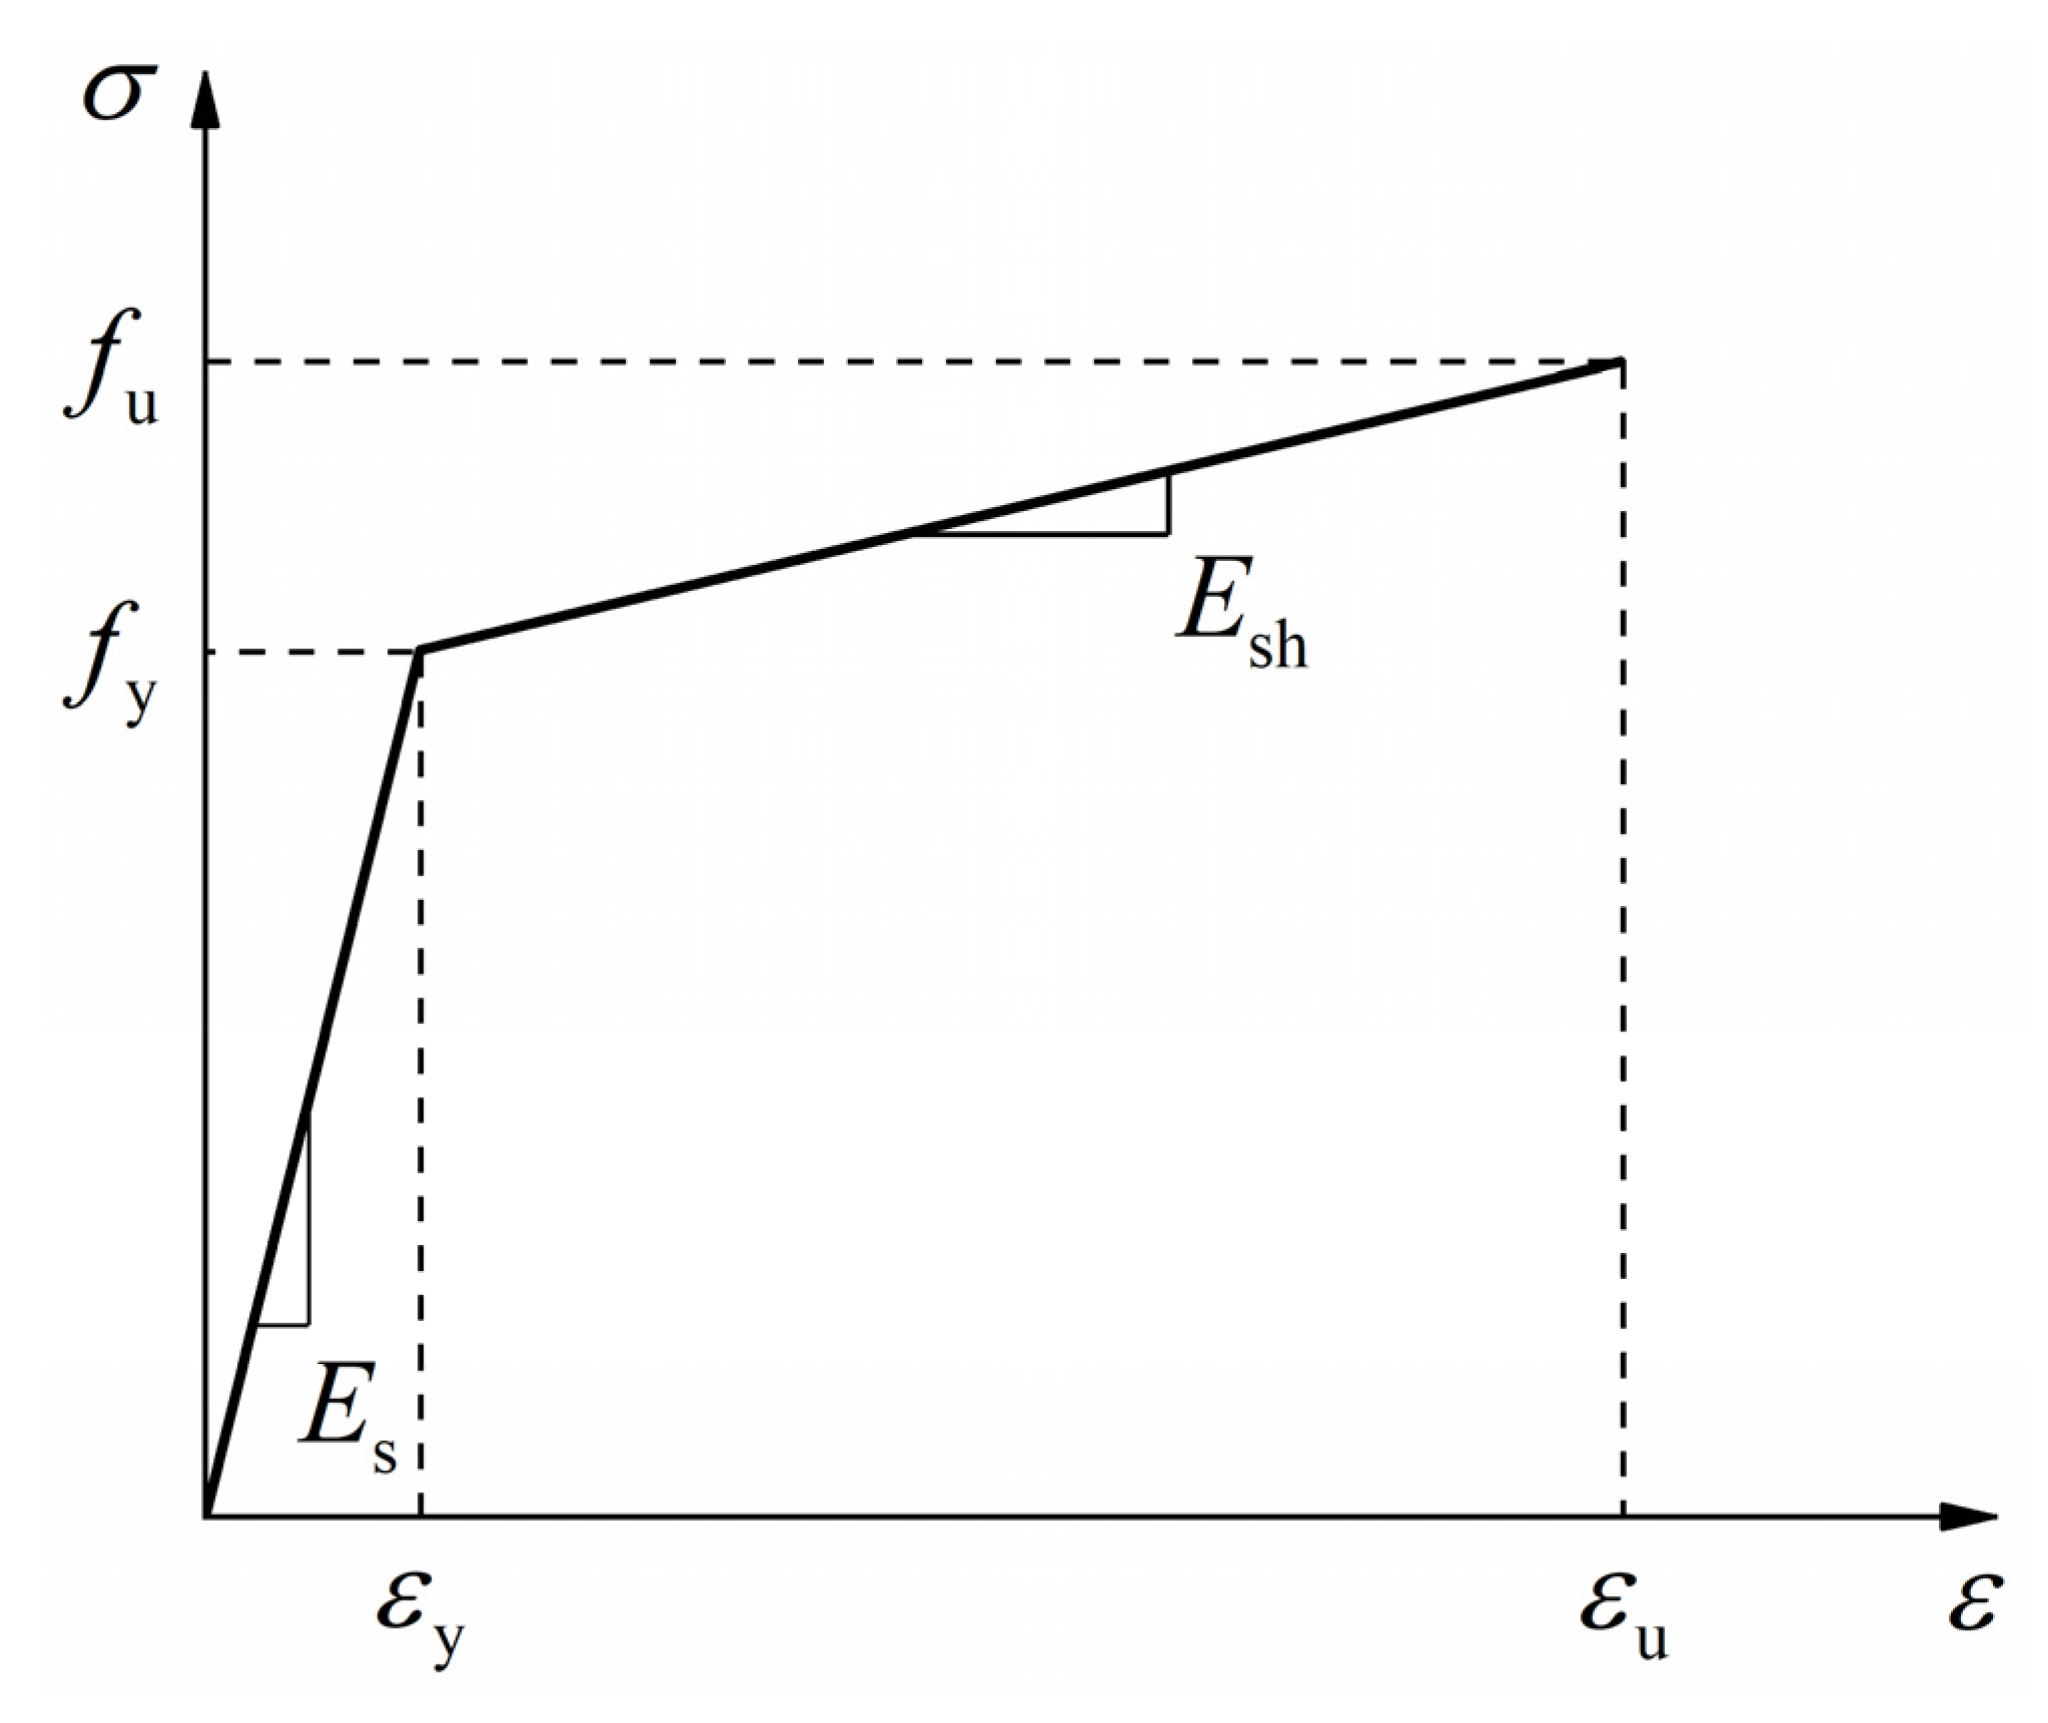
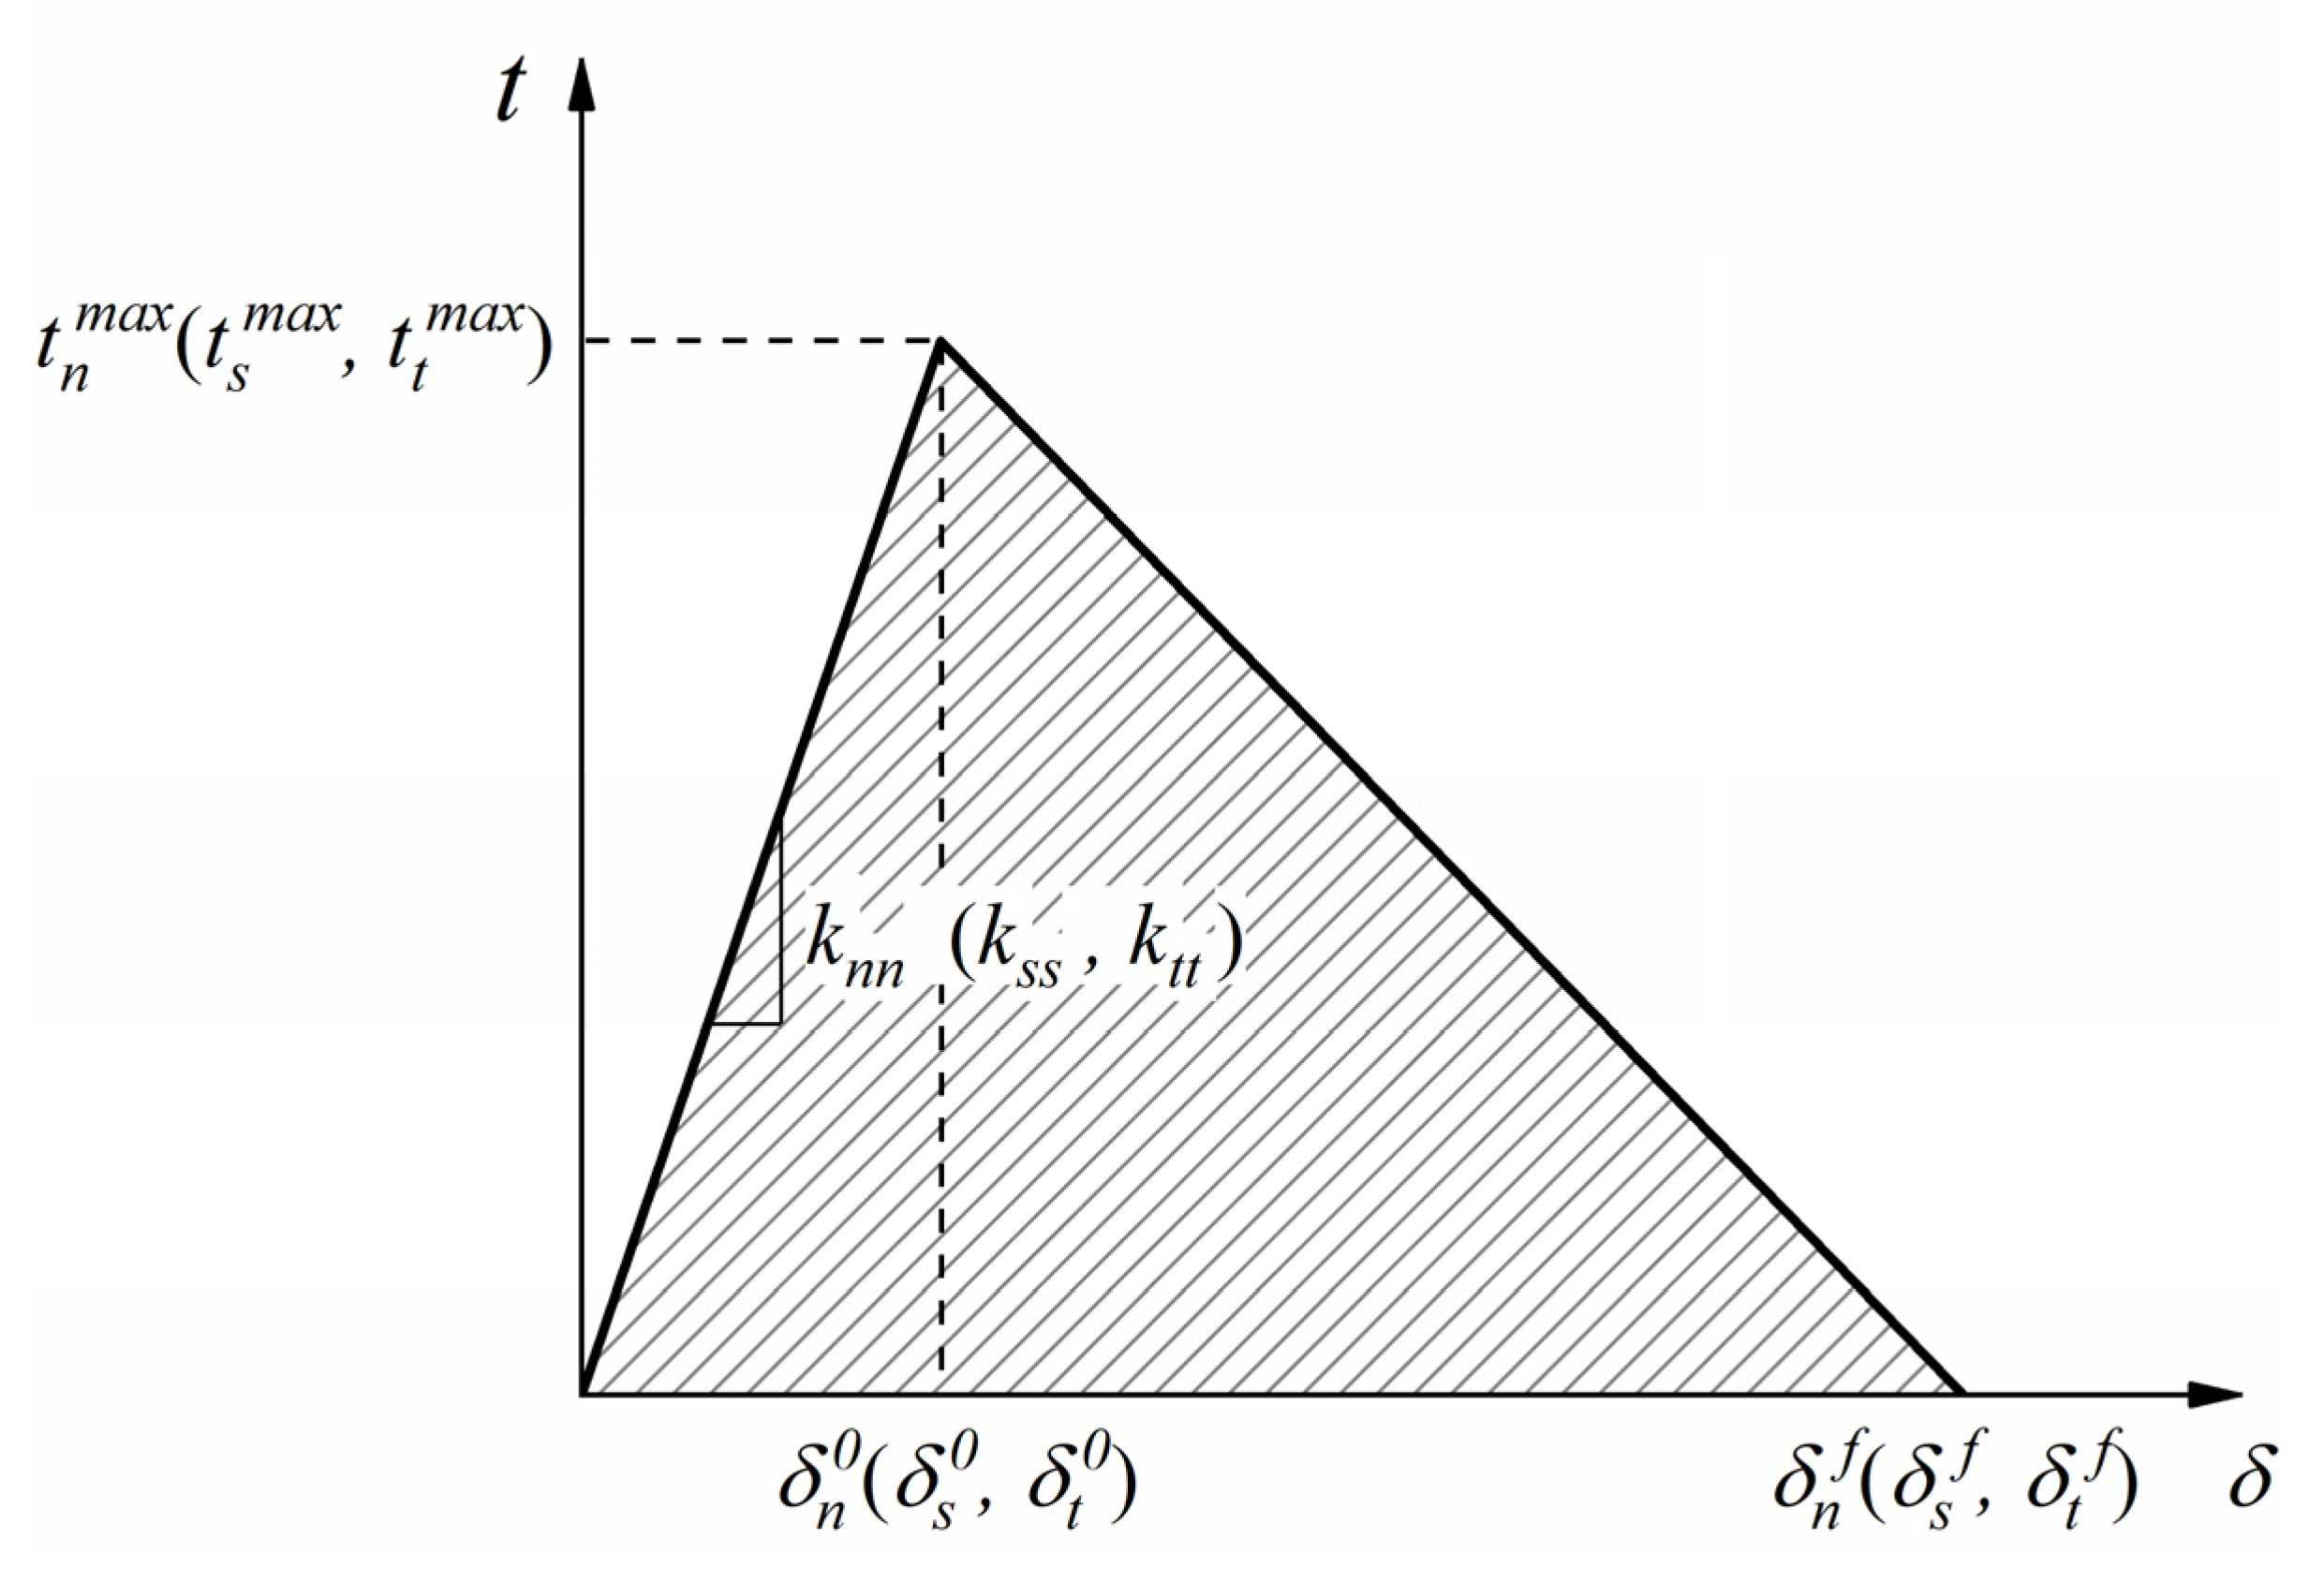
3.2.1. Material Constitutive Model

The objects of finite element analysis are masonry walls with structural columns, including extended units of bricks and mortar, concrete and reinforcement. Due to its capability of taking into account the fully inelastic behavior of concrete in compression and tension, the concrete damaged plasticity (CDP) model in ABAQUS can be used to study the mechanical properties of brittle materials, such as concrete and masonry, under uniaxial loading or cyclic loading [21,24]. For masonry modeling, Yang [25] and Sekender Ali [26] produced a model that was considered for stress–strain relationship and was presented in Figure 4. Yang [25] established the masonry uniaxial compressive stress–strain relationship based on the unitary equilibrium condition through a mesoscopic model. Yang model [25] can be stated as:
σ c f cm = η 1 + ( η 1 ) ( ε c ε cm ) η / ( η 1 ) ε c ε cm
where σc is the compression stress of masonry; εc is the compression strain of masonry; fcm is the peak compression stress of masonry; f cm = 0.78 f 1 0.5 ( 1 + 0.07 f 2 ) where f1 is the average compressive strength of bricks, f2 is the average compressive strength of mortar; εcm is the peak compression strain of masonry; ε cm = 0.005 / f cm where η is the ratio of the initial tangential modulus to the peak cutline modulus, generally taken as 1.633.
Sekender Ali [26] used a simplified bilinear model to describe the uniaxial tensile stress–strain relationship in masonry. Sekender Ali [26] model can be expressed, as shown in Equation (2):
σ t = { E ε t , ε t ε tm E ( 4 ε tm - ε t ) 3 , ε tm < ε t 4 ε tm  
where σt is the tension stress of the masonry; εt is the tension strain of the masonry; εtm is the peak tension strain of the masonry; E is the elastic modulus of masonry; E = 370 f cm f cm .
Extended units of bricks and mortar modeling are considered as an integral model of bricks and mortar, except that the weak layer of masonry is modeled by an interface model. Thus, the stress–strain relationship of masonry is still used in the simplified separated model for the extended units. The Poisson’s ratio of masonry and the extended units was set as 0.15.
For concrete modeling, the uniaxial stress–strain relationships used for concrete proposed by GB50010-2010 were considered. The Poisson’s ratio of concrete was set as 0.2. Damage factors for both masonry and concrete were calculated based on the Sidoroff energy equivalence principle [27]. The bilinear elastic–plastic stress–strain model with strain hardening was taken into consideration for modeling steel reinforcement, and it is shown in Figure 5. Based on the results of the material testing, the steel reinforcement’s parameters were established, and the Poisson’s ratio was set at 0.3.

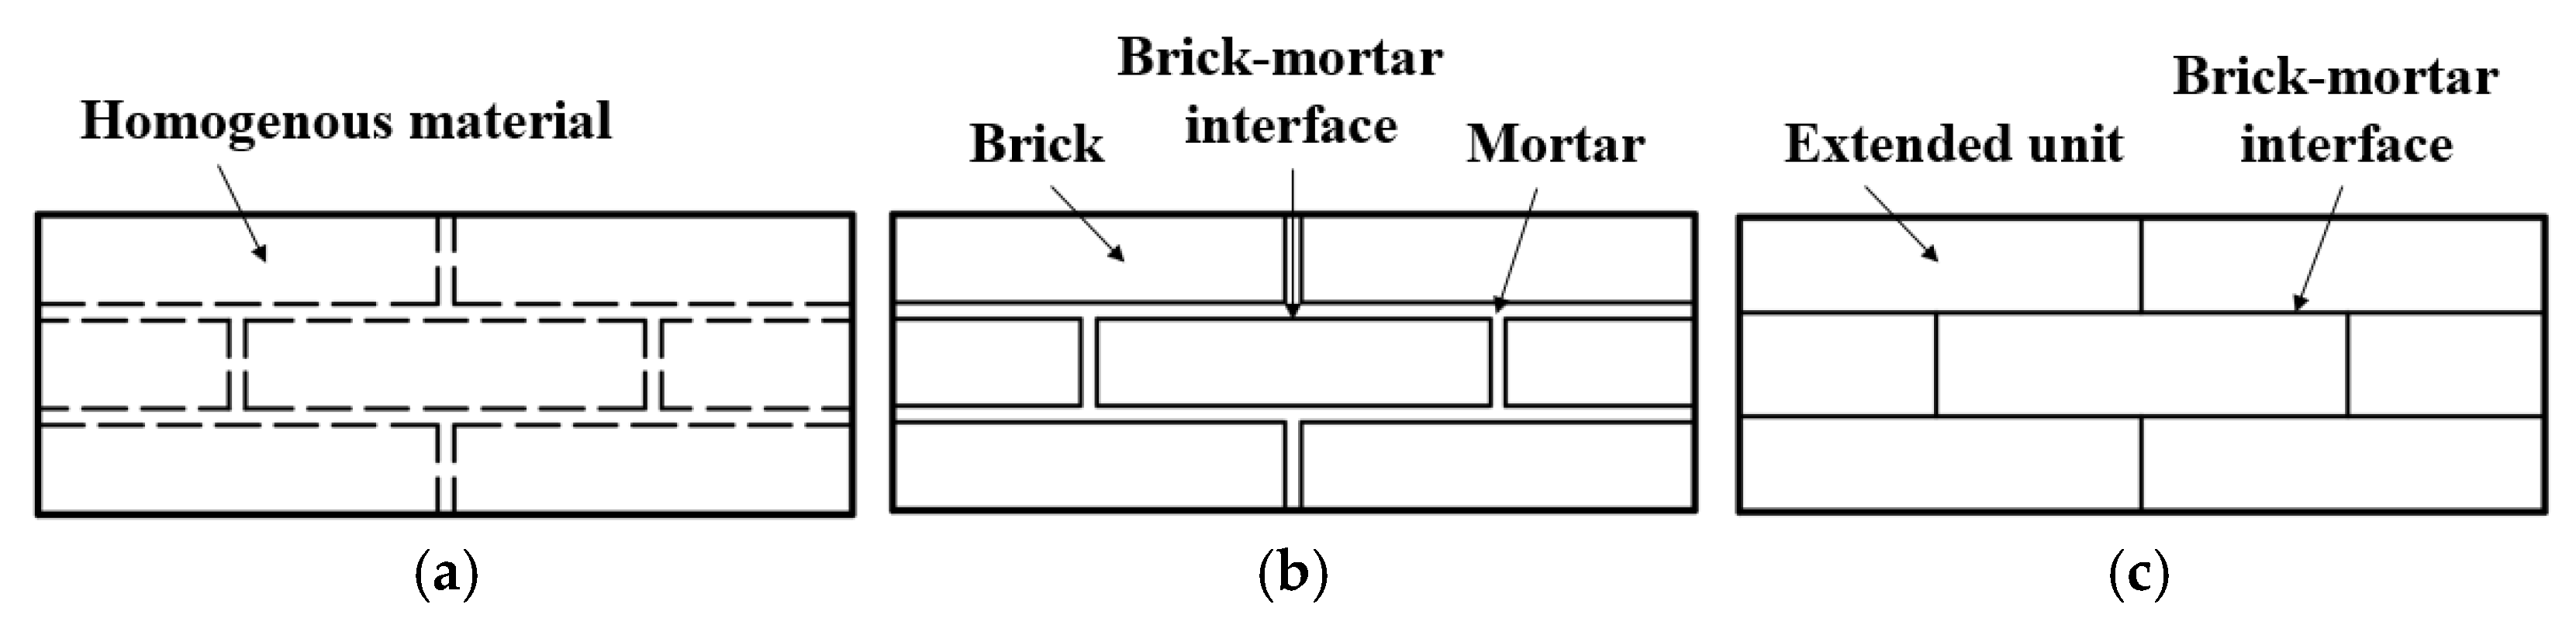
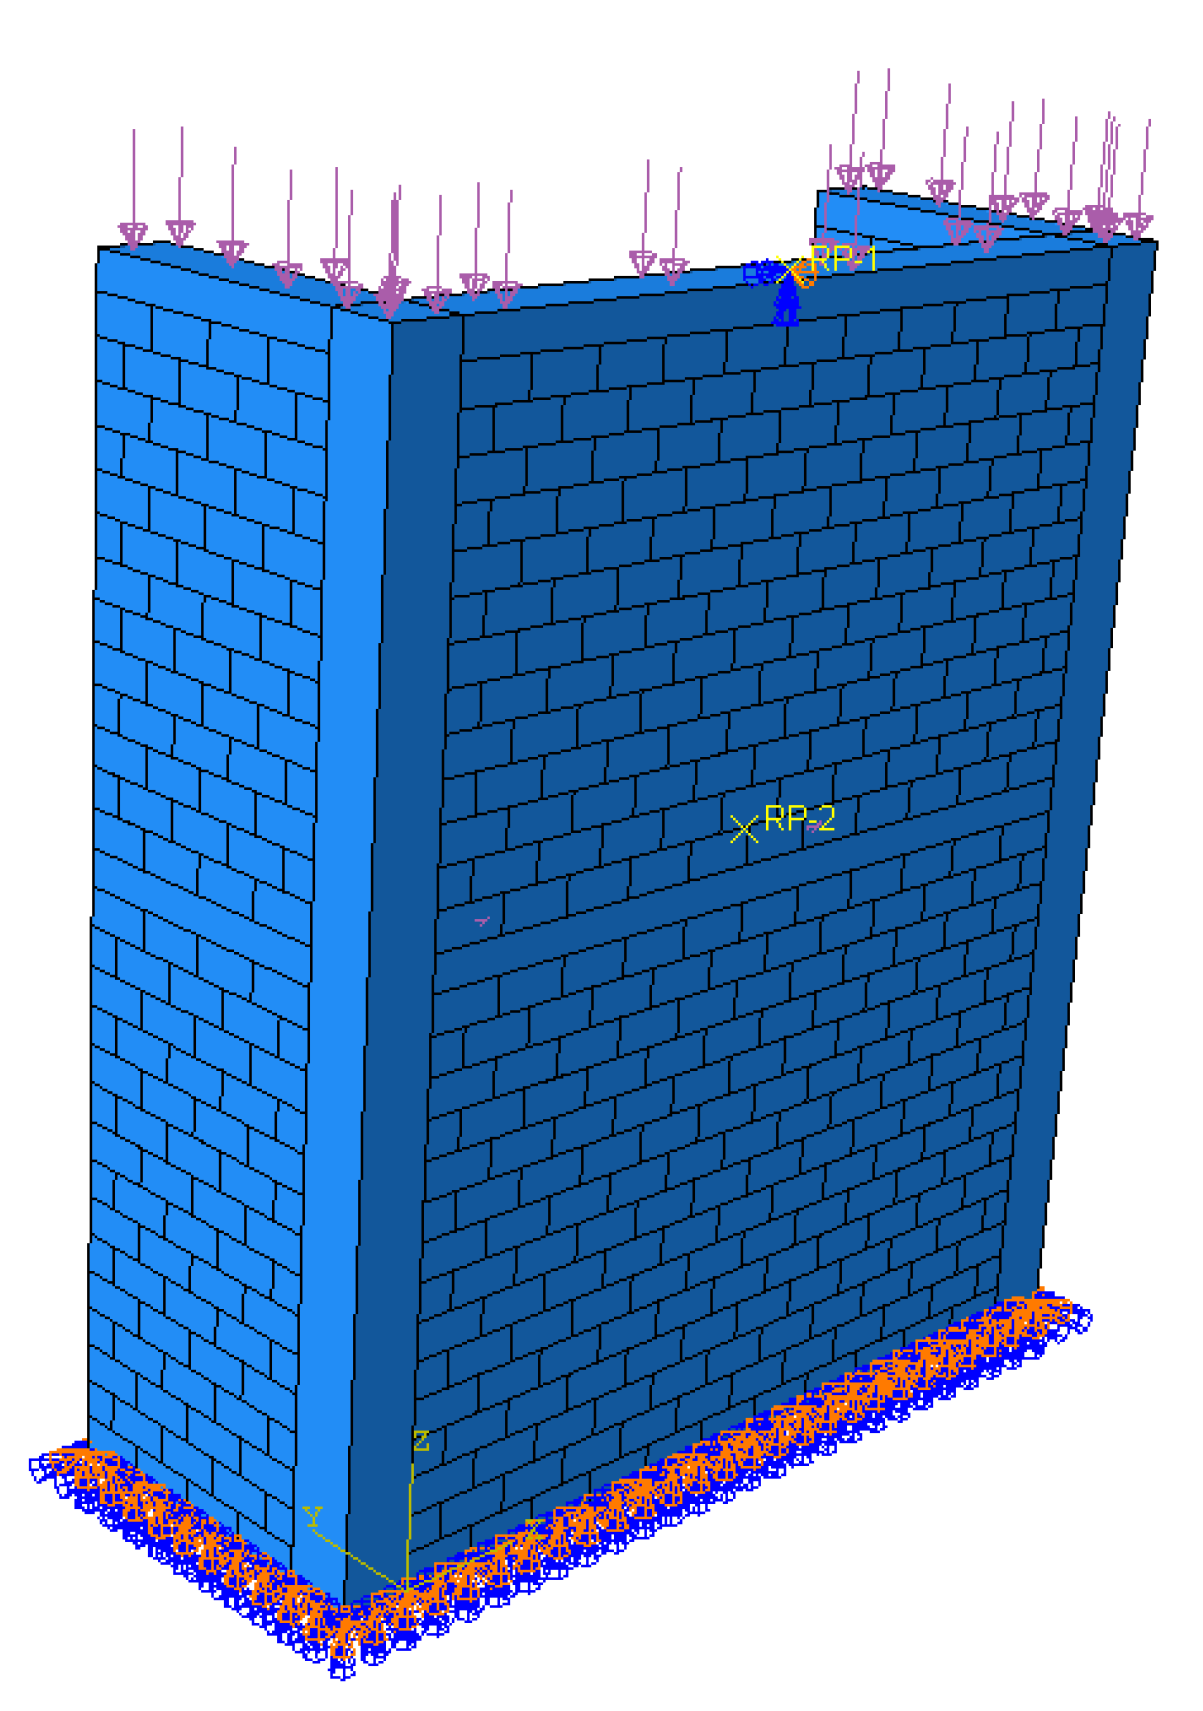
3.2.2. Modelling Approach

The FEM in simplified separated modeling was composed of extended units, concrete columns, concrete foundation beams, concrete slabs, and steel reinforcements. The C3D8R was used for extended units, concrete foundation beams, and concrete slabs. The T3D2 was used for steel reinforcements. The proper FEM mesh size was chosen based on the mesh sensitivity analysis. The global mesh size of the FEM was set to 60, and the sweeping approach was employed. The “Tie” constraint was used to establish the interaction between extended units, concrete columns, concrete foundation beams, concrete slabs. The relationship between concrete columns and steel reinforcements was established via the “Embedded” constraint.
Under horizontal loads, the damage to masonry usually occurs at the mortar interface, which has a certain tensile and shear strength, and the adjacent part has a friction effect after the joint interface is damaged. It is possible to accurately simulate the shear behavior of masonry by modeling the joint interfaces between the expanded units using a surface-based cohesive approach [28]. The interaction between the expanded units was modeled using the “General” contact. The cohesive interface model is a bilinear constitutive model, which is based on a bilinear traction separation model in tension and shear in ABAQUS [29]. The interface strength begins to degrade once the specified ultimate strength is reached in the traction separation model, which initially exhibits a linear elastic behavior. Using the laws of initial damage and damage evolution in contact properties, the mechanical properties of degradation can be simulated. The traction separation model [30] can be expressed, as shown in Equation (3):
t = { t n t s t t } = [ k n n 0 0 0 k s s 0 0 0 k t t ] { δ n δ s δ t } = K δ
where t n max , t s max , t t max are the ultimate traction forces in the linear elastic phase, respectively, which are usually taken as the tensile and shear strength of the mortar; δ n 0 , δ s 0 , δ t 0 are the corresponding displacements; K is the stiffness matrix of joint interfaces; k n n = E u E m h m ( E u E m ) , k s s = k t t = G u G m h m ( G u G m ) where E u is the elastic modulus of brick, E m is the elastic modulus of mortar, G u is the shear modulus of brick, G m is the shear modulus of mortar, h m is the thickness of mortar. The critical mixed-mode fracture energy needed to destroy joint surfaces can be seen as the darkened area in Figure 6, which is based on the Benzeggagh–Kenane law. The normal and tangential fracture energies can be calculated from the interfacial tensile and shear strength due to the difficulty in measuring fracture energies in tests [28,31]. The maximum traction forces, the stiffness matrix, and the critical mixed-mode fracture energy determine the cohesive interface model.

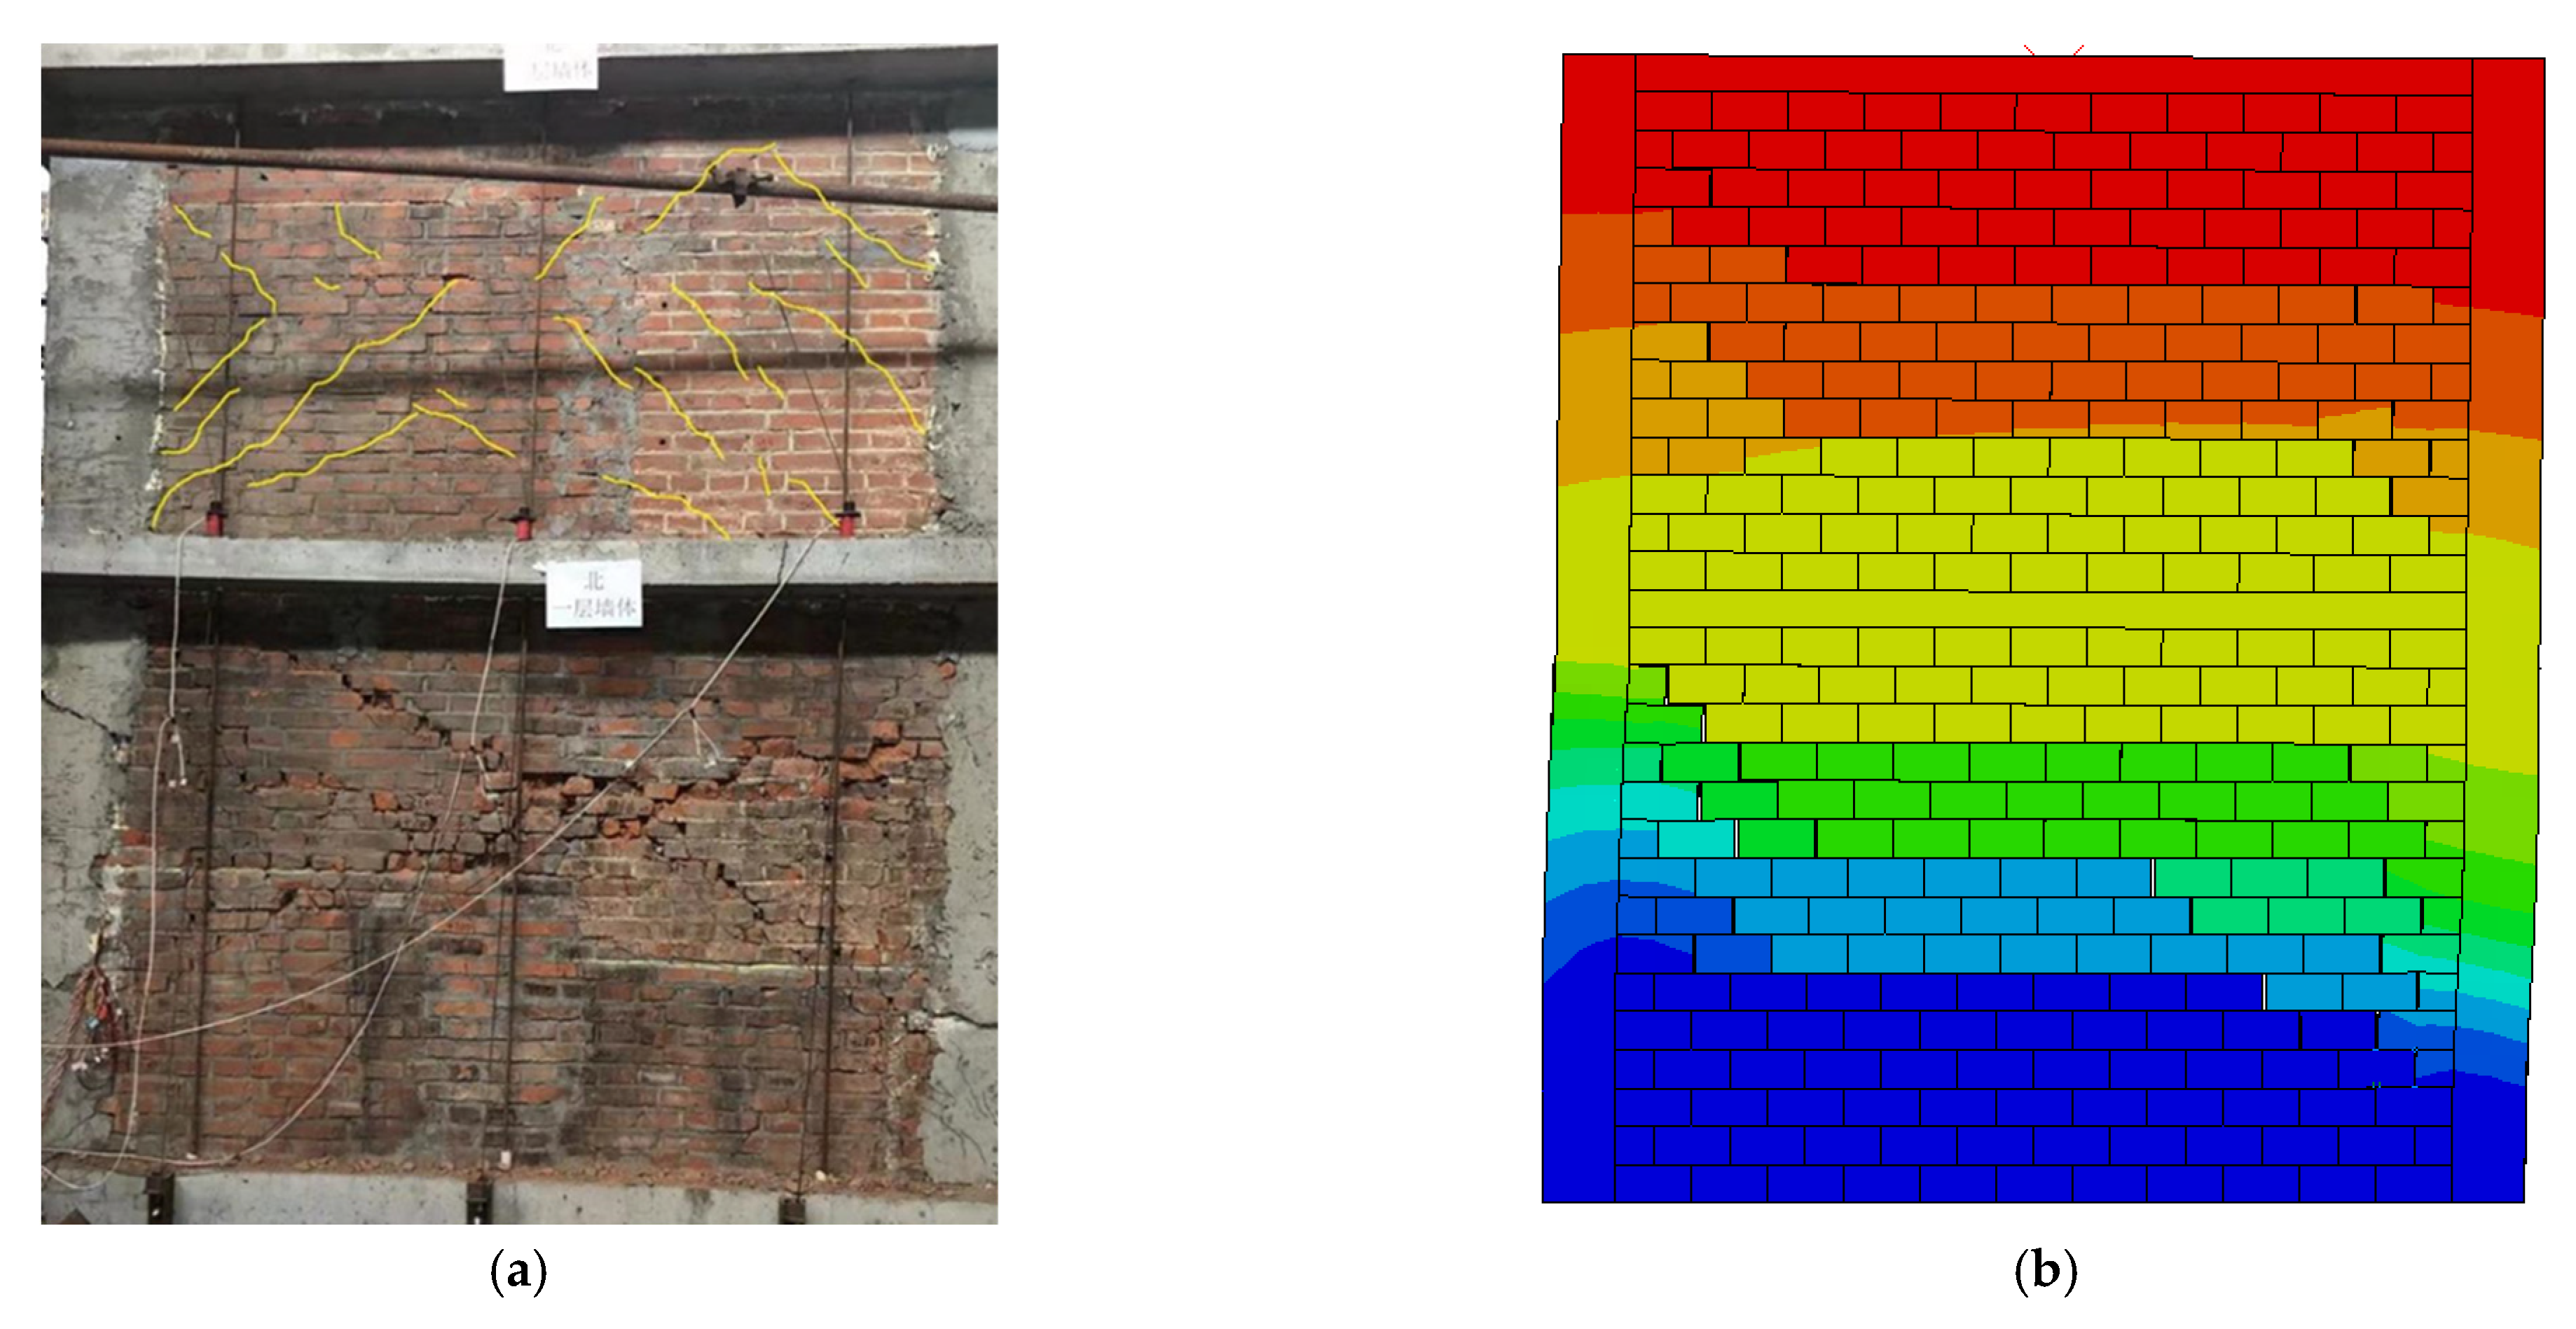
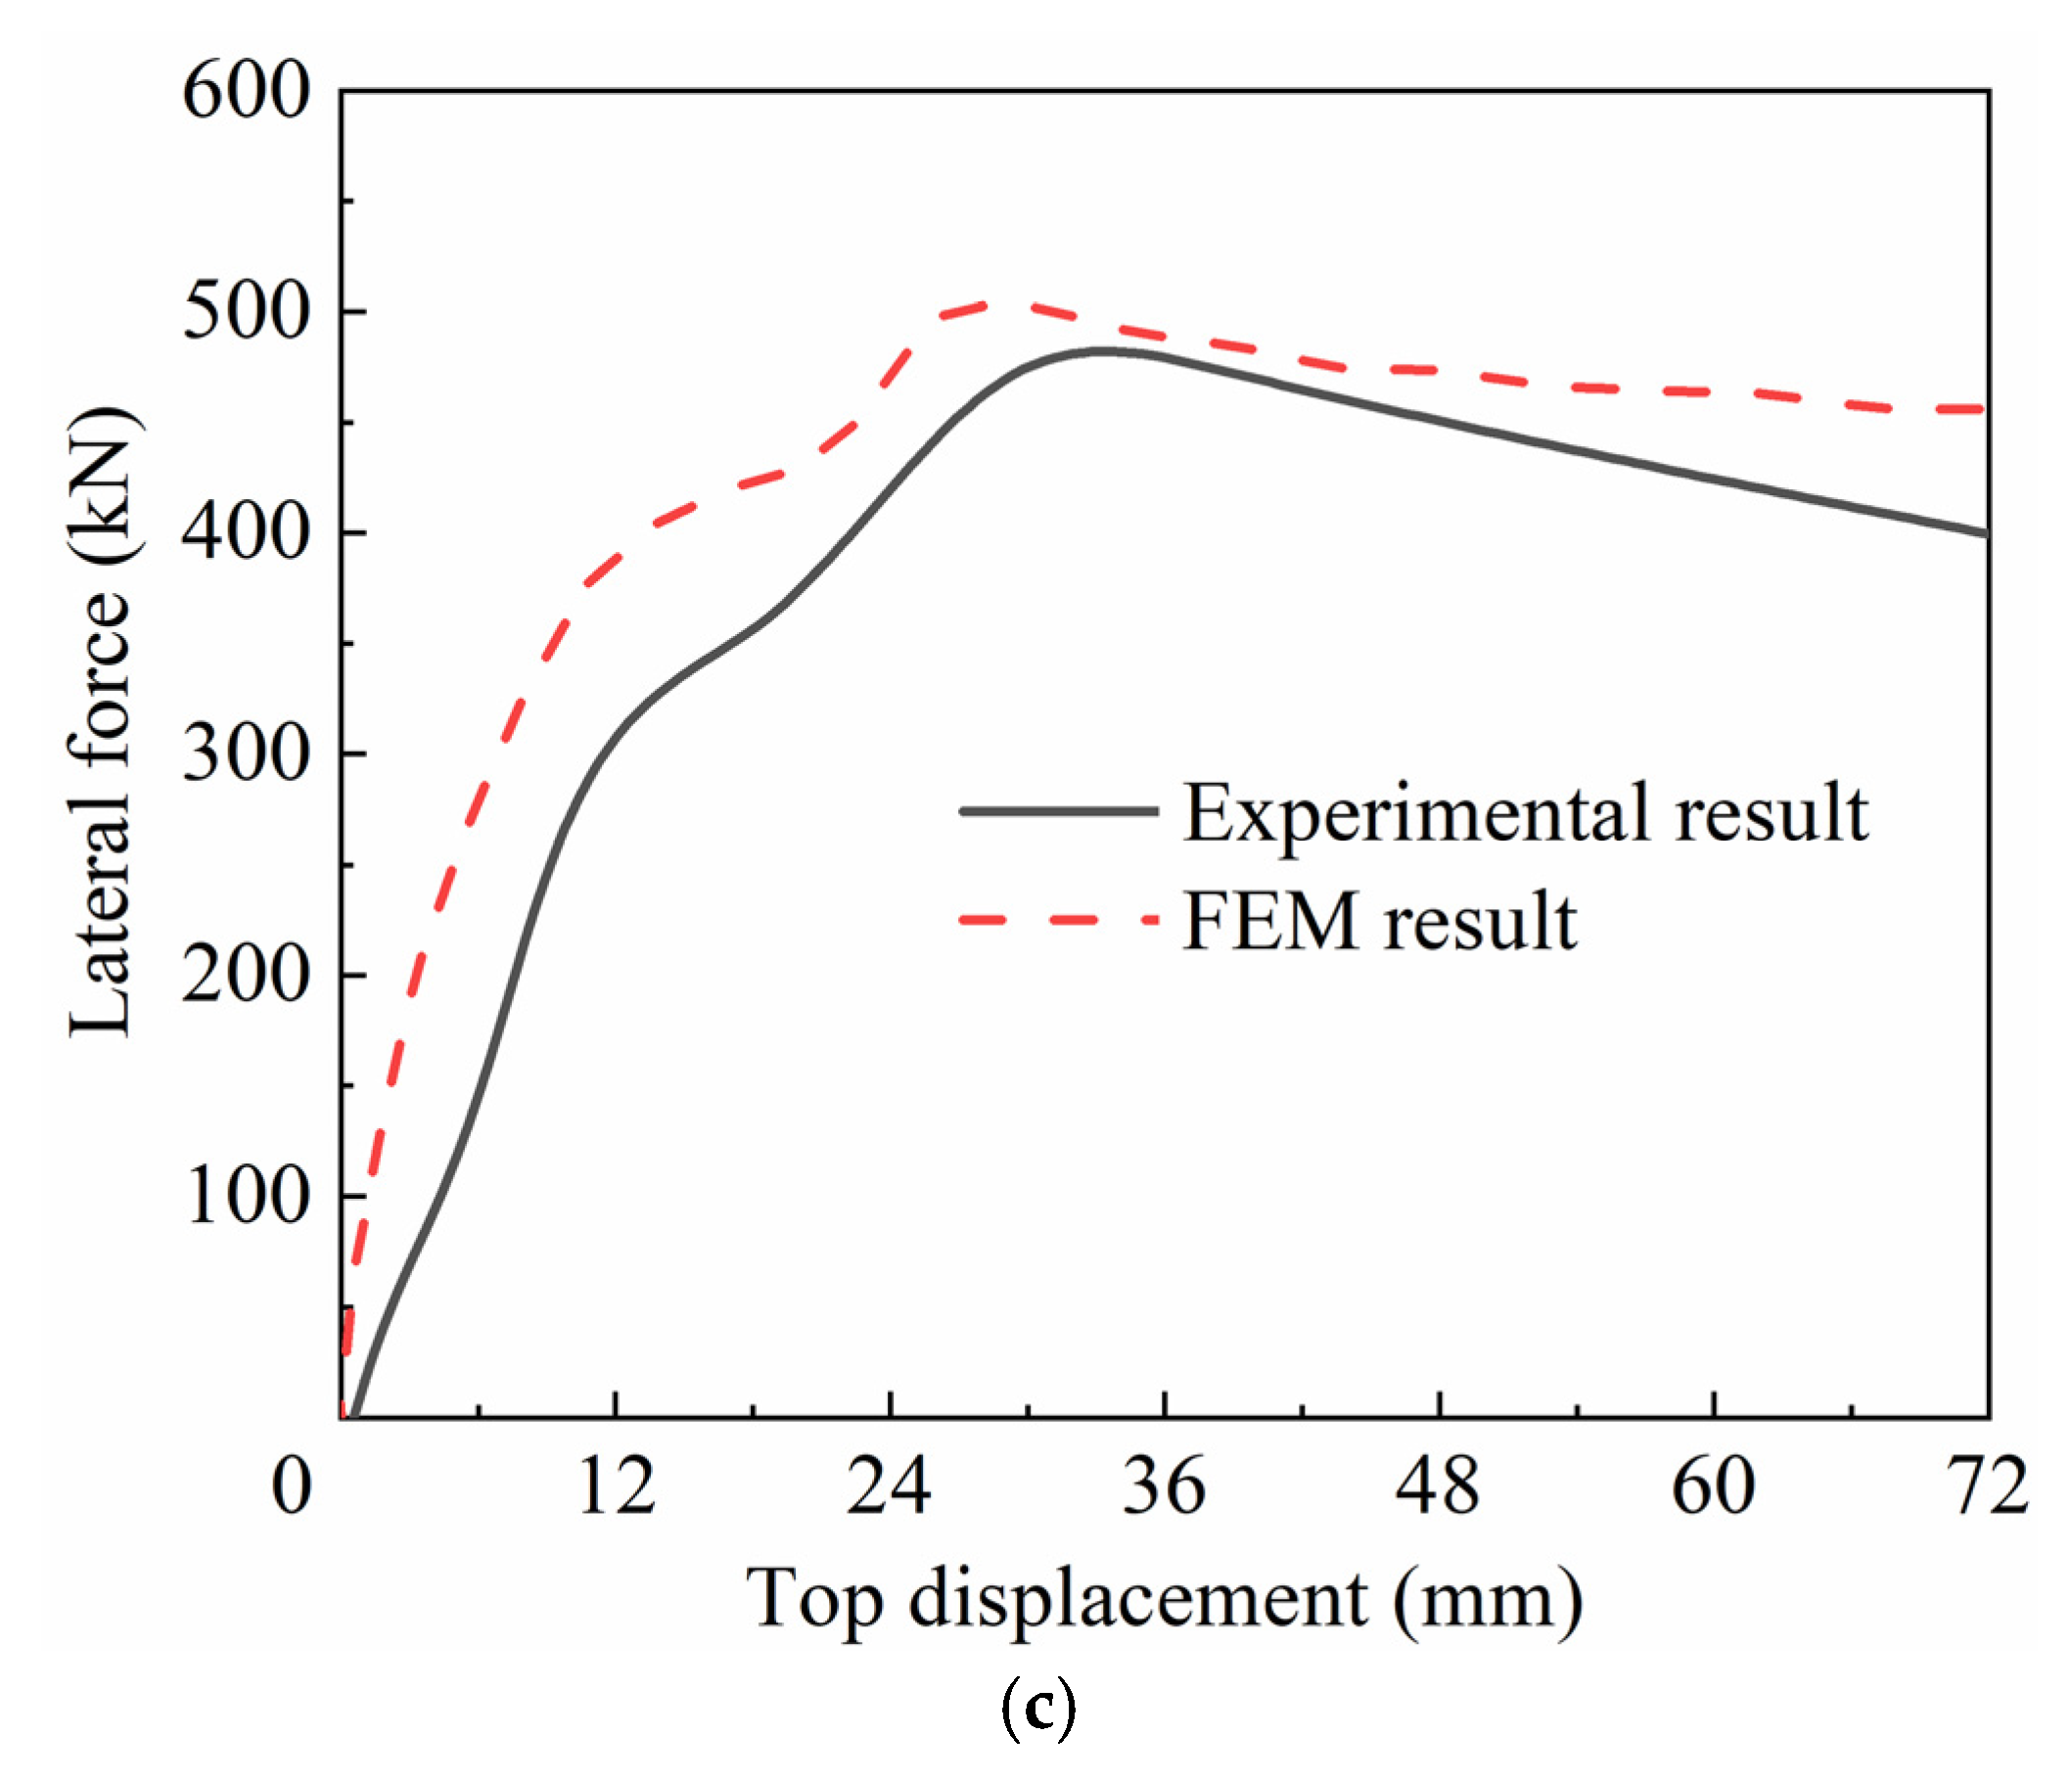
3.2.3. Comparison with Experimental Results

The experimental study on in-plane static cyclic loading of a two-story masonry structure model built with the DBWSs was performed at the structural and seismic laboratory of Harbin Institute of Technology. Due to the limitation of the test site and loading device, the model plane size was determined as 3.24 m × 3.24 m, the wall thickness was 240 mm, the height of the 1st floor was 2.0 m, and the height of the 2nd floor was 1.7 m. The dimension of bricks used in the DBWSs was 240 mm × 115 mm × 53 mm. All the DBWSs and columns were built over reinforced concrete foundation beams and bolted to a strong and rigid floor designed to prevent the experimental model from moving during cyclic loading.
The material properties used for masonry in the FEM, especially compressive strength, shear strength, density, and elasticity modulus, shall be determined by referring to GB 50003-2011 [17], GB/T 50129-2011 [32], and GB/T 50315-2011 [33]. Other properties, including concrete’s compressive strength, tensile strength, density, and elasticity modulus, were determined by referring to GB 50010-2010 [34]. The mechanical properties of masonry, concrete, and steel used in the FEM are shown in Table 2.
In the CDP model, it is also necessary to specify the relevant material parameters to define the plastic flow potential function and yield surface accurately. The default values for flow potential eccentricity ( ε = 0.1 ), the ratio between biaxial and uniaxial compressive yield stress ( f b 0 / f c 0 = 1.16 ), the ratio between the second stress invariants on the tensile and the compressive meridians (K = 2/3), and the viscosity parameter (μ = 0.001) were determined, according to the Abaqus user’s manual [35] and previous studies [30,36,37,38,39,40,41]. In addition, to correctly simulate masonry behavior during the calibration process, the dilation angles of 36° and 20° for concrete and masonry materials were considered.
Due to the symmetry of load and geometry of the studied masonry structure model built with the DBWSs, only one-half model was built to improve computational efficiency in the current study. For boundary conditions, the displacements of the 1st and 2nd floor slab in X rotation, Y translation, and Z rotation were restricted. For the loading method, unidirectional displacement loading is applied to the reference point to consider the computational efficiency, coupled to the top surface of the 2nd floor slab. The vertical loads were applied to the 1st and 2nd floor slab, resulting in vertical stress of 0.5 MPa for the 2nd floor walls and 0.6 MPa for the 1st floor walls, as illustrated in Figure 7. The damage of the floor slab was not considered; only the part in contact with the wall pieces was created and set as a rigid body.
Figure 8a,b represent the damage distribution between the experimental model and the FEM. In terms of failure and cracking mode, the FEM results were found to be in good agreement with the experimental results. In addition, the force–displacement curves of the FEM and the experimental model were compared in Figure 8c. The force–displacement curves were nearly identical; however, the FEM’s stiffness of the rising phase of the force–displacement curve was slightly greater than that of the experimental model. The differences are related to the loading method and the assumptions of the material constitutive model. Low-cyclic reversed loading was used in the experimental model. The accumulation of compressive and tensile damage under cyclic loading led to a decrease in the stiffness of the experimental model, and the assumption of homogeneous materials was equivalent to enhancing the mechanical properties of materials. However, the FEM was unable to account for the aforementioned factors temporarily.
The stiffness, strength, and ductility of the experimental model were generally accurately represented by the simplified separated FEM, demonstrating the applicability of the methods and assumptions used in the finite element modeling, which will be implemented in the subsequent seismic vulnerability analysis.

4. Seismic Vulnerability Analysis for MSBD

The seismic vulnerability analysis of buildings can predict damage before earthquakes and help designers improve structures’ seismic performance [16]. It can also be used to evaluate the losses after earthquakes and provide a basis for disaster estimation, relief, and reconstruction. IDA can reflect the change process of strength, stiffness, and deformation capacity of structures under different ground motions, which can be used to analyze the vulnerability of MSBD [42]. Furthermore, IDA can forecast the probability of damage at different degrees of earthquake activity, which can establish a rationale for seismic performance assessment based on scientific data.

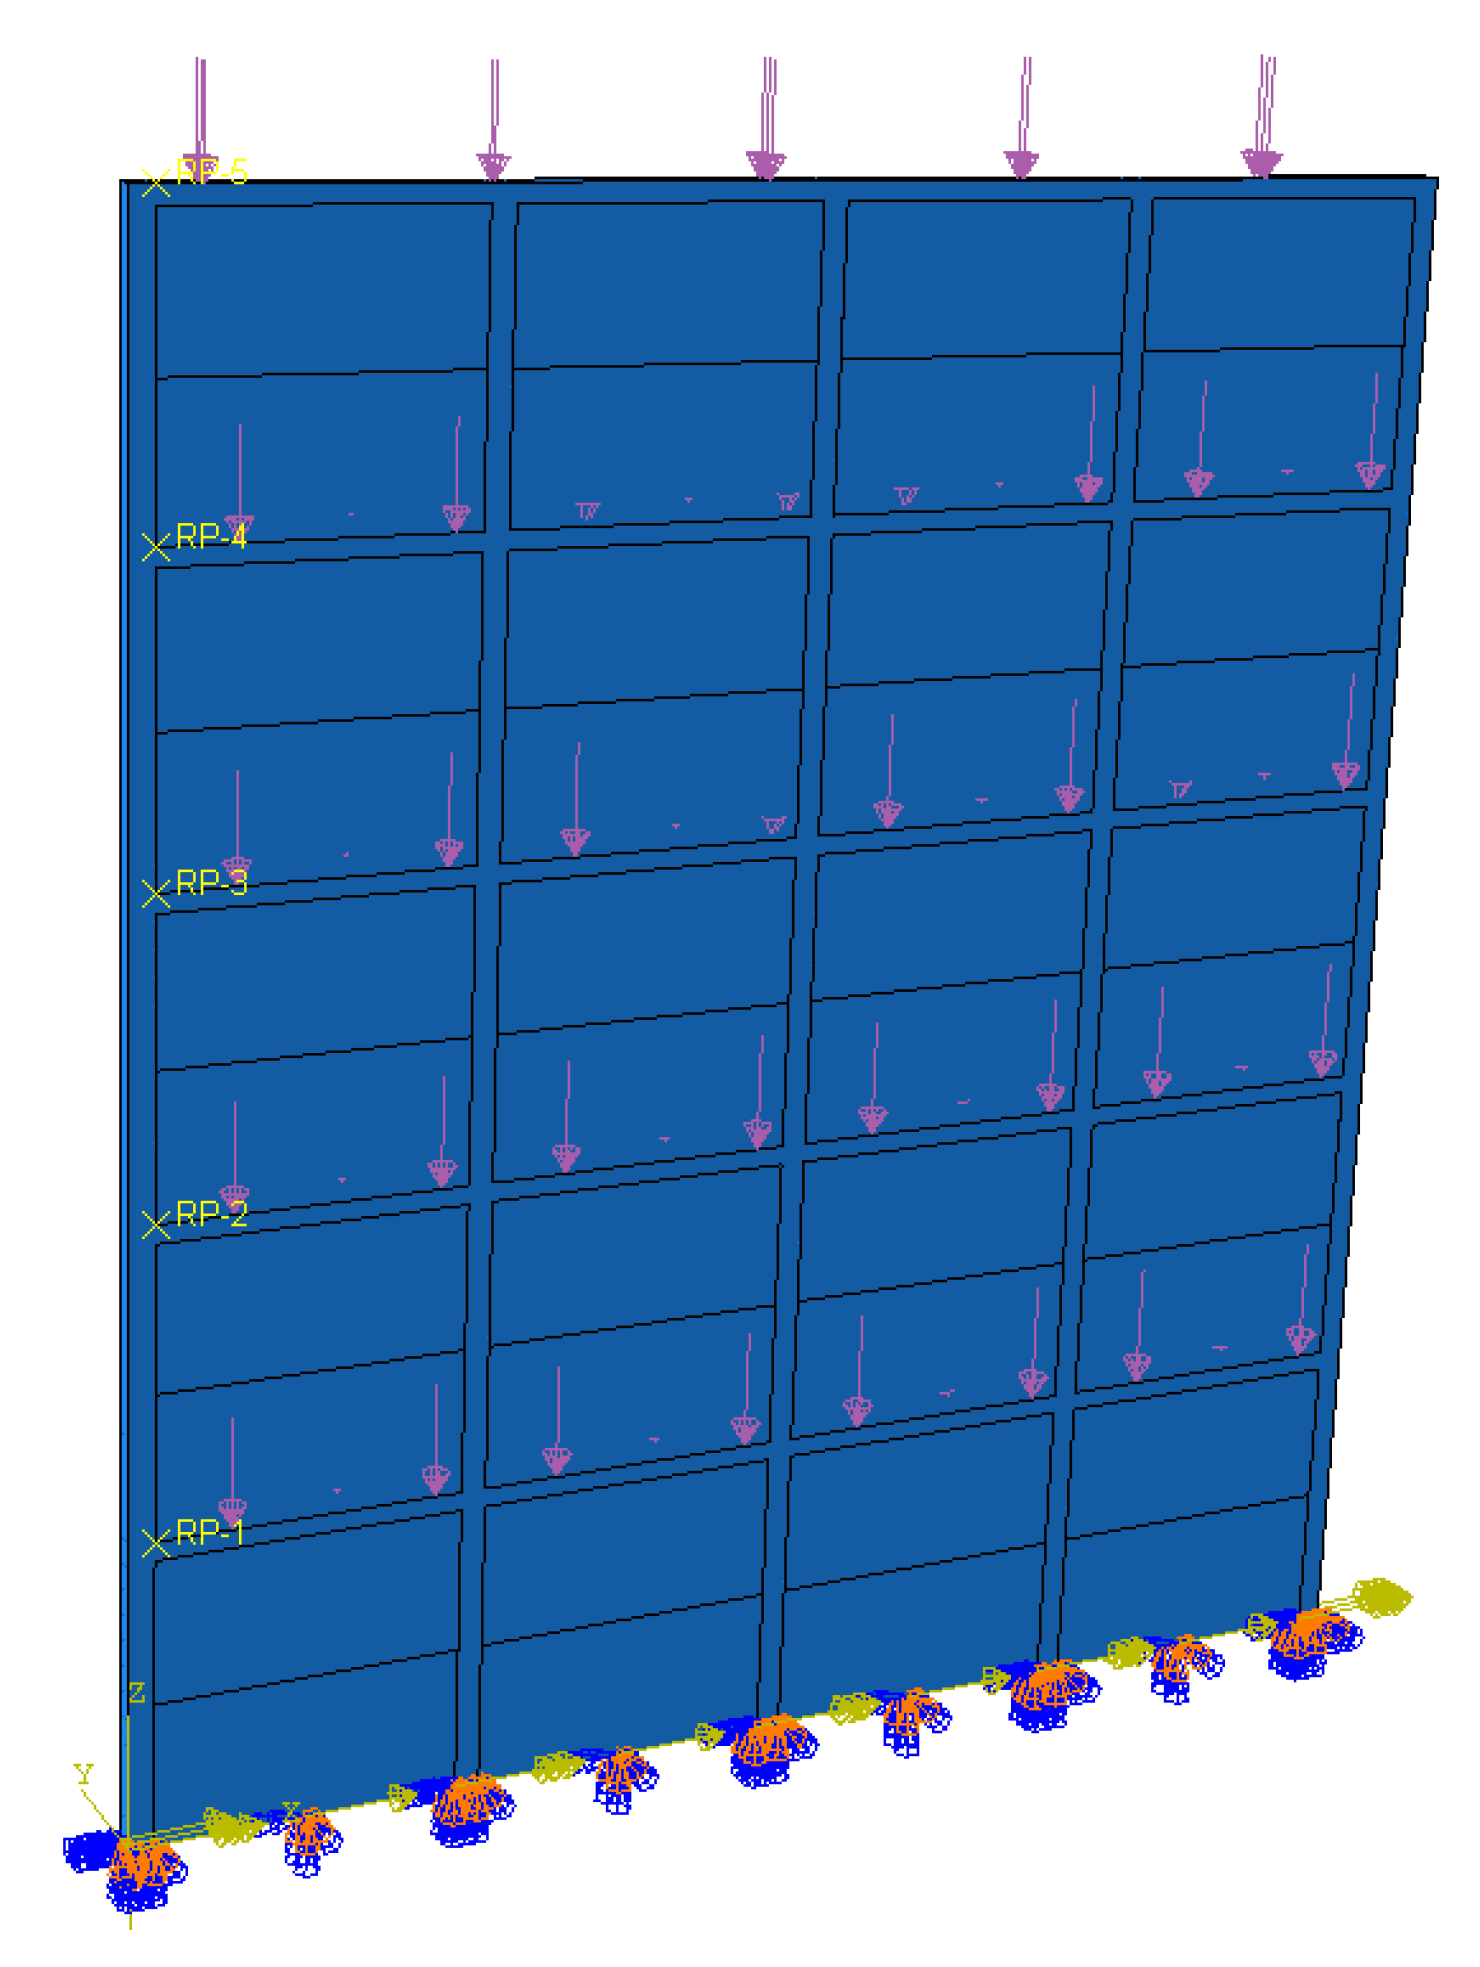
4.1. FEM for Seismic Vulnerability Analysis

In this paper, the masonry structure model built with the DBWSs was simplified as a three-dimensional masonry wall piece for analysis, since only the in-plane failure mechanism of masonry structures was concerned, and the out-of-plane failure mechanism was not considered for the time being. The influence of DBWSs dimensions on the seismic performance of brick masonry structures should be taken into consideration in the structural design, compared to conventional masonry structures. Therefore, a five-story masonry crosswall was designed as the calculation model for vulnerability analysis. The thickness of crosswall was 240 mm, the width of each DBWSs was 3.0 m, and the height of each floor was 3.0 m. The dimensions of structural columns and ring beams were 240 mm × 240 mm and 180 mm × 240 mm, respectively. The thickness of the concrete protective layer of structural columns and ring beams was 20 mm, and the reinforcement was configured according to the structure. All parameters of the computational model were determined to meet the GB50003-2011 [17] requirements.
The calculation model was built the same way as in Section 3.2, and the material parameters were the same as in Table 2. A vertical load of 0.2 MPa was applied to the ring beam of each floor. For the computational model, it should be noted that when all wall parts are built using the separated modeling approach and considering the contact between units, the modeling and computational workloads will be relatively large, and appropriate simplification of the computational model can be considered. Therefore, the DBWSs were established with a height of 1.41 m, and only the contact between DBWSs was considered, as shown in Figure 9.

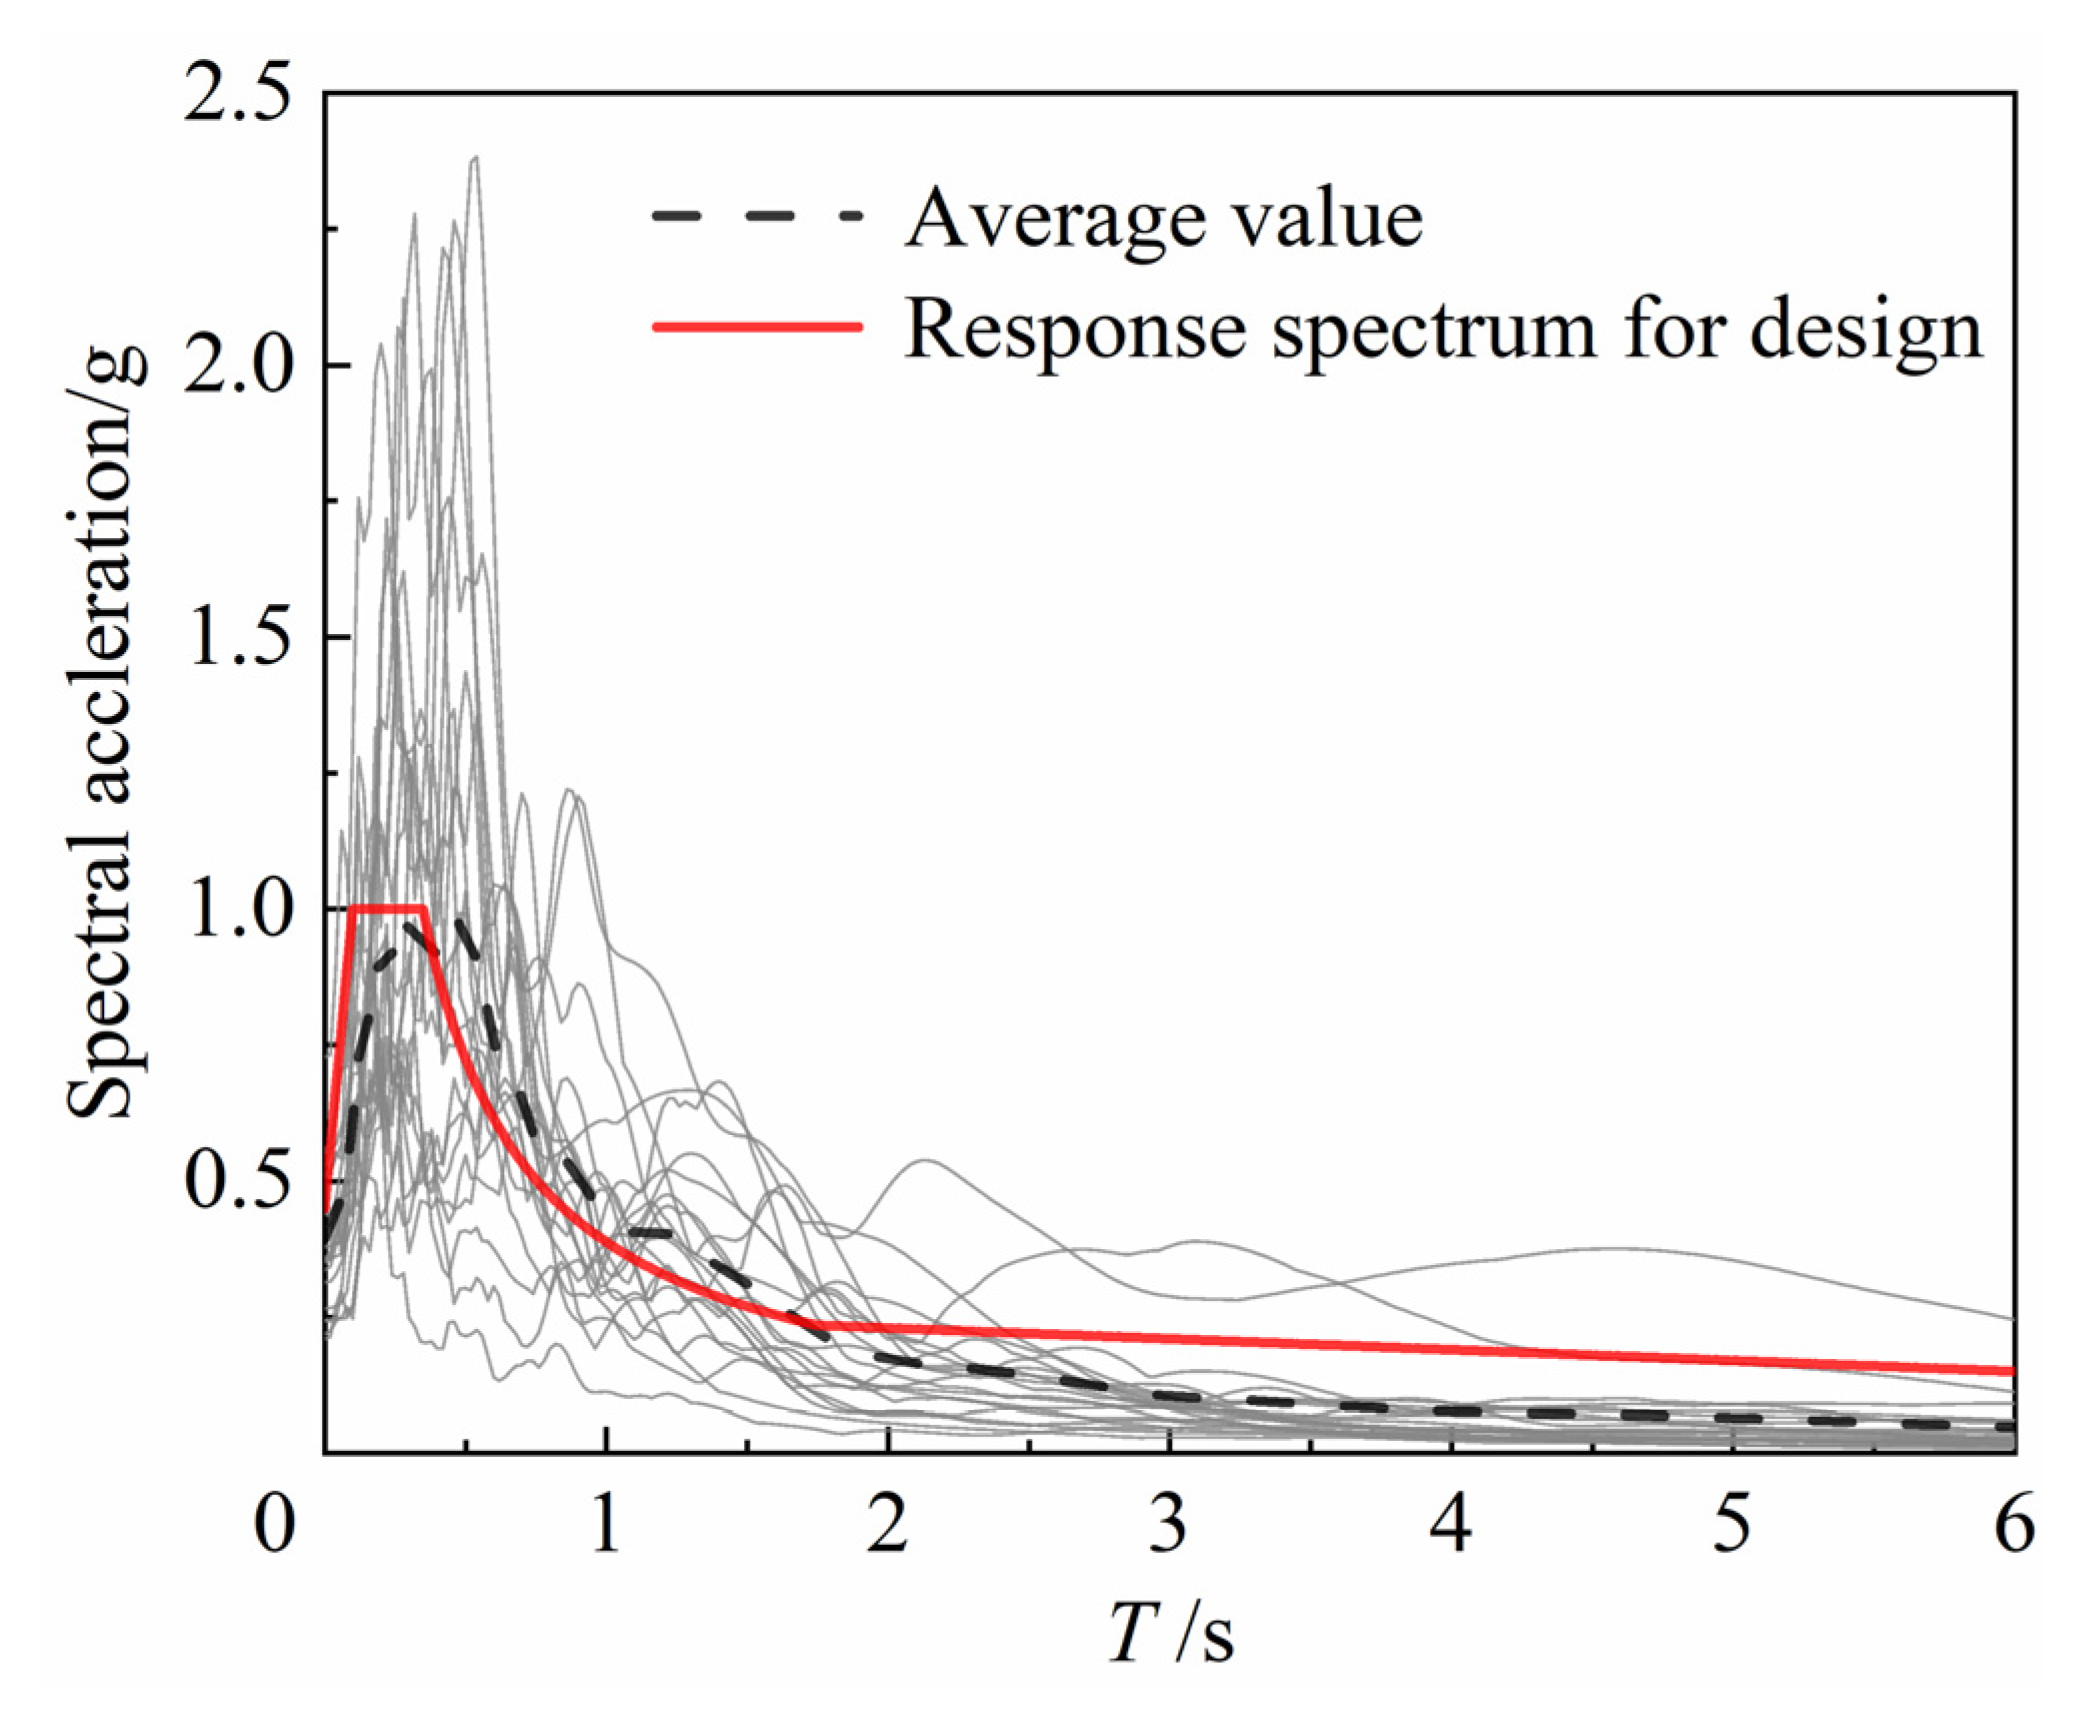
4.2. Selection of Ground Motion Records

According to Riddell’s study [43], the correlation of the peak ground acceleration index decreased with increasing structural period and was applicable to short-period building structures. The period of masonry buildings was generally not higher than 0.4 s, a short-period structure. Further, the seismic hazard levels in GB50011-2011 [44] were prescribed in terms of peak ground acceleration; hence, the peak ground acceleration ( A pg ) was selected as the ground motion intensity index. To reduce the impact of ground motion uncertainty on the seismic vulnerability analysis, 20 ground motion records were selected from the strong shaking record database of the Pacific Earthquake Research Center, regarding the wave selection principles suggested in the FEMA-P695 [45], as shown in Table 3. The selected seismic records’ average response spectrums generally agree with the Chinese code design response spectrum [44], as presented in Figure 10.

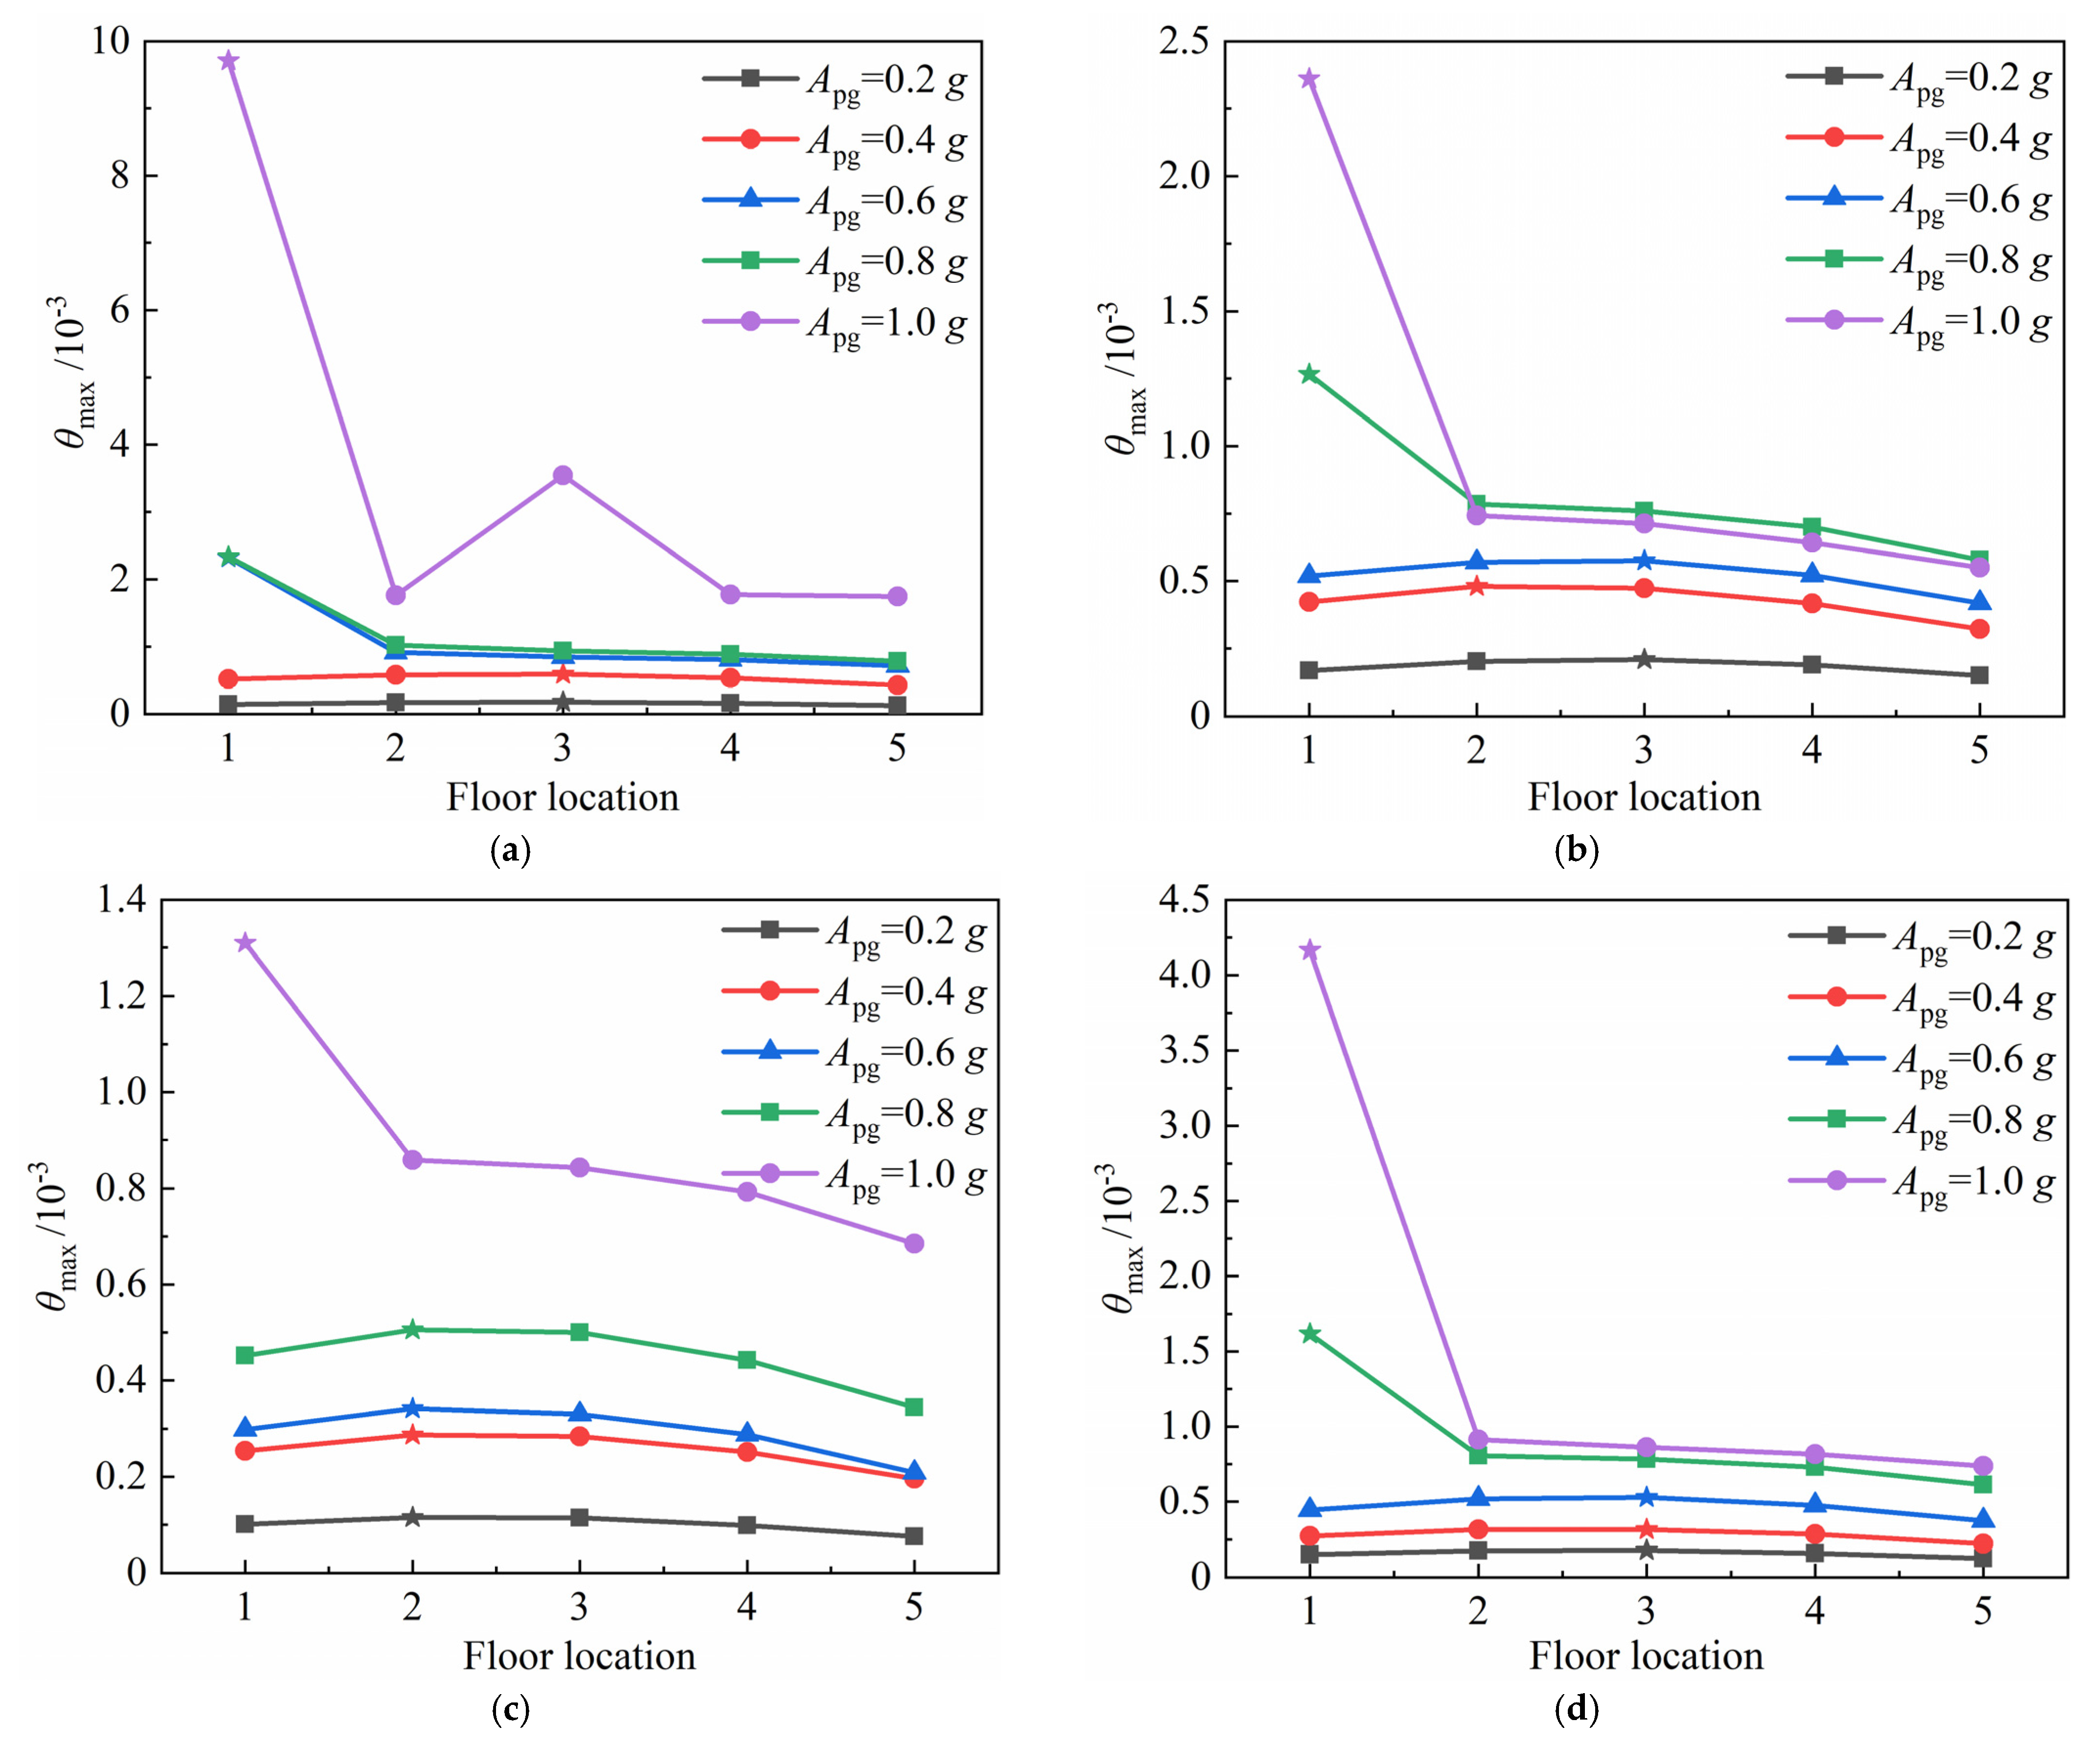
4.3. Judgment of Structural Performance Level

The applicability and accuracy of the structural damage index directly affect the shape of the vulnerability curve and conditional exceedance probability. Displacement indexes are mainly adopted for seismic vulnerability analysis, including maximum inter-story displacement angle and maximum inter-story displacement [46,47]. The maximum inter-story displacement angle ( θ max ) can reflect the influence of factors, such as structural form, material, story height, and damage; thus, it is selected as the structural damage index.
The performance level cutting point on the IDA curves should be identified to evaluate the seismic performance of structures during earthquakes. Based on the three-level fortification requirements of GB50011-2010 [44], the recommendations of FEMA [48] and previous studies [46,49,50,51], the performance level of masonry structure was divided into four grades, operational (OP), immediate occupancy (IO), life safety (LS) and collapse prevention (CP). The inter-story displacement angle limits of each performance level are shown in Table 4.

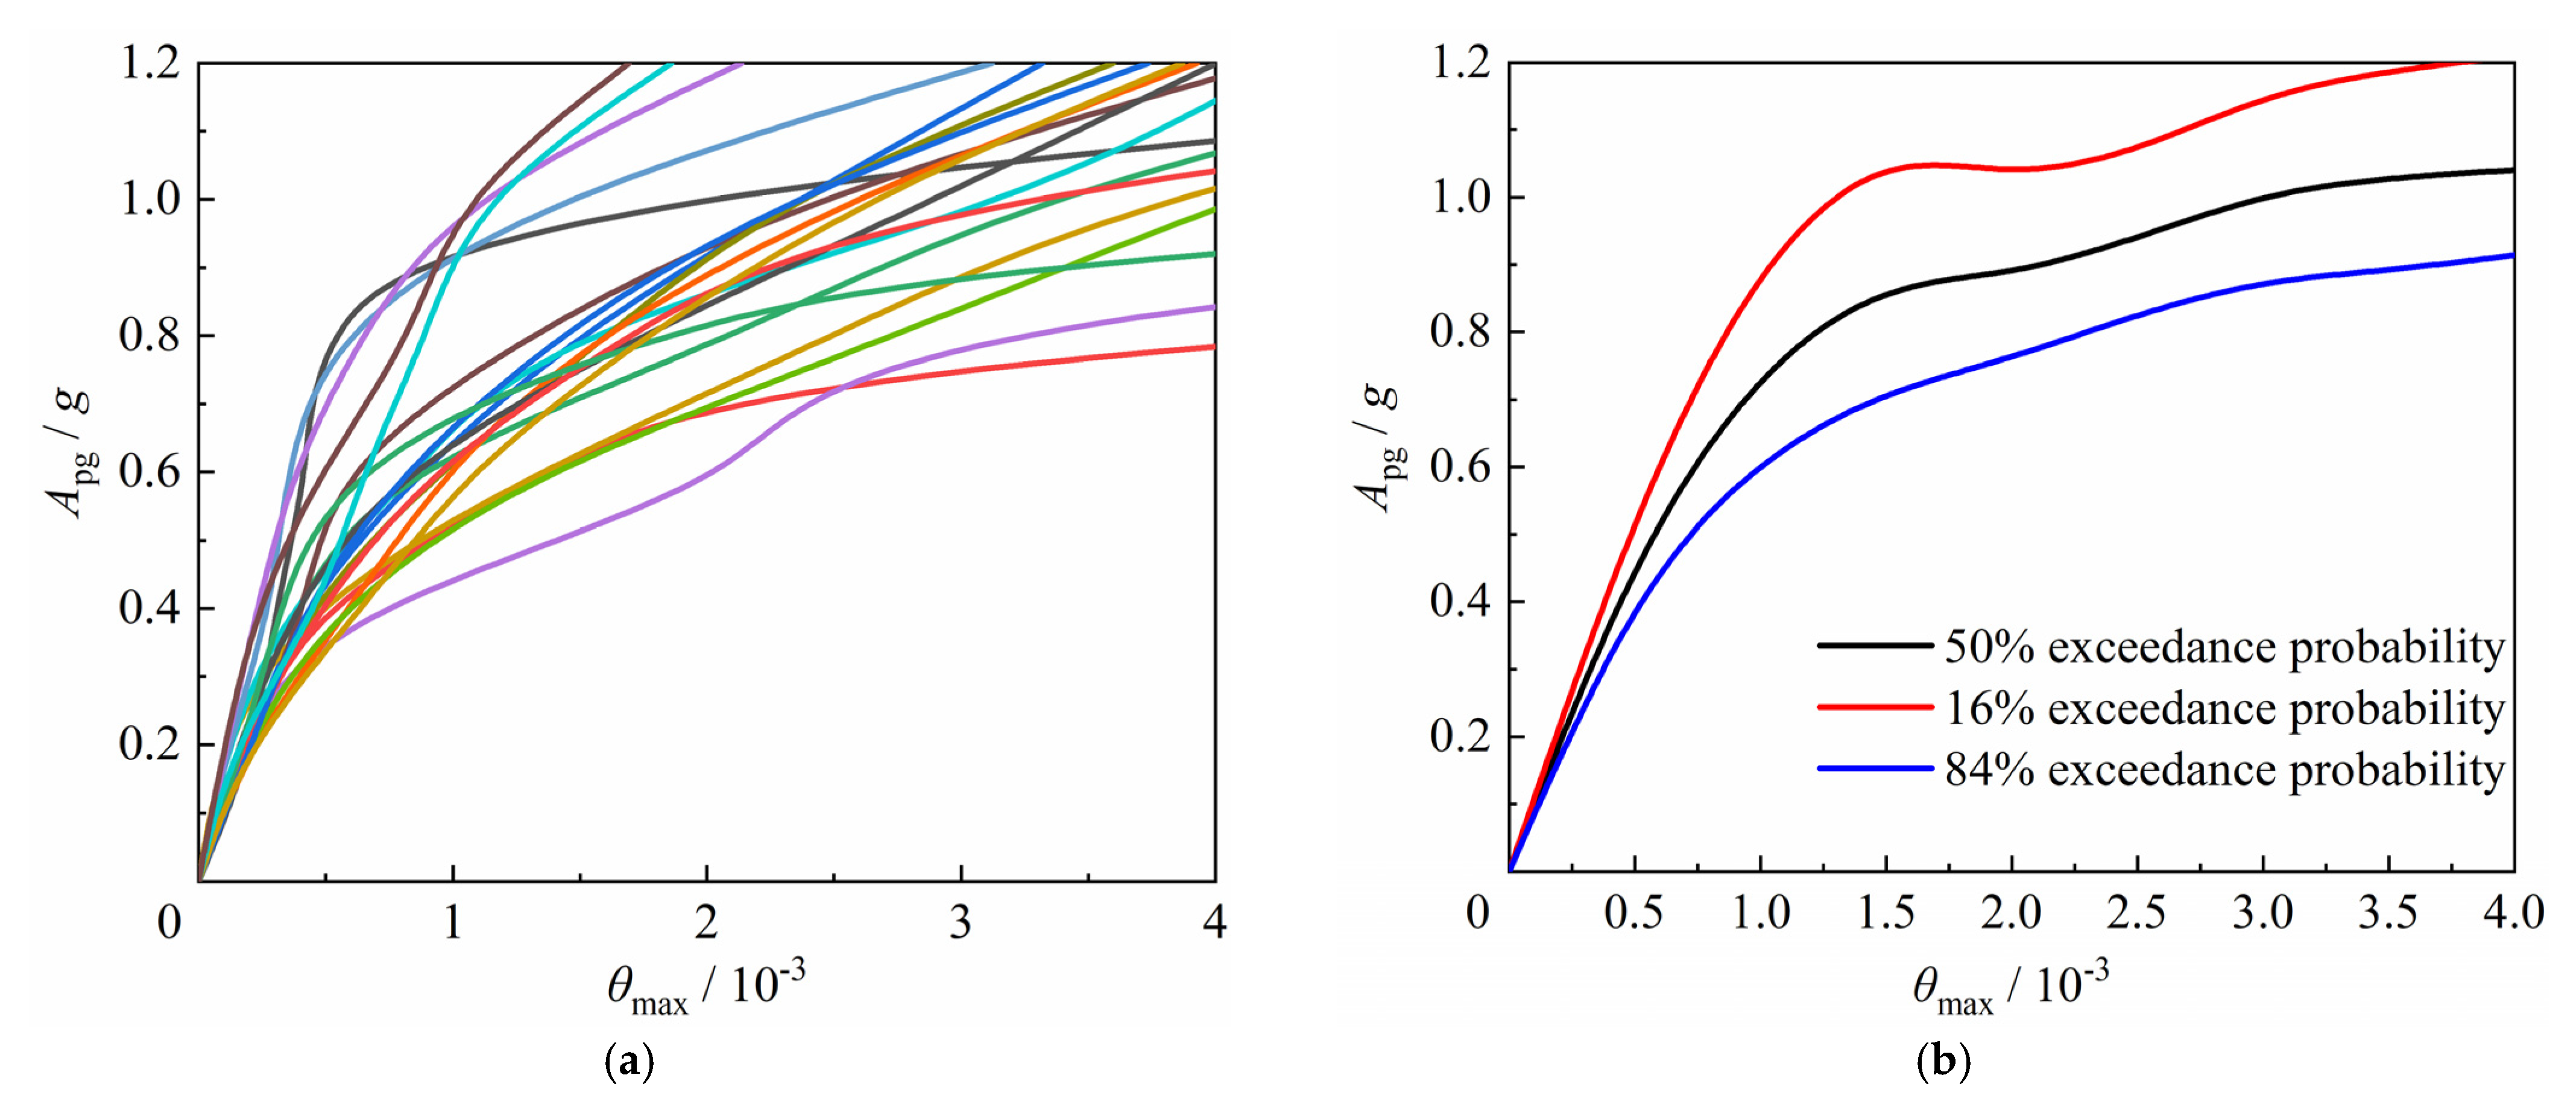
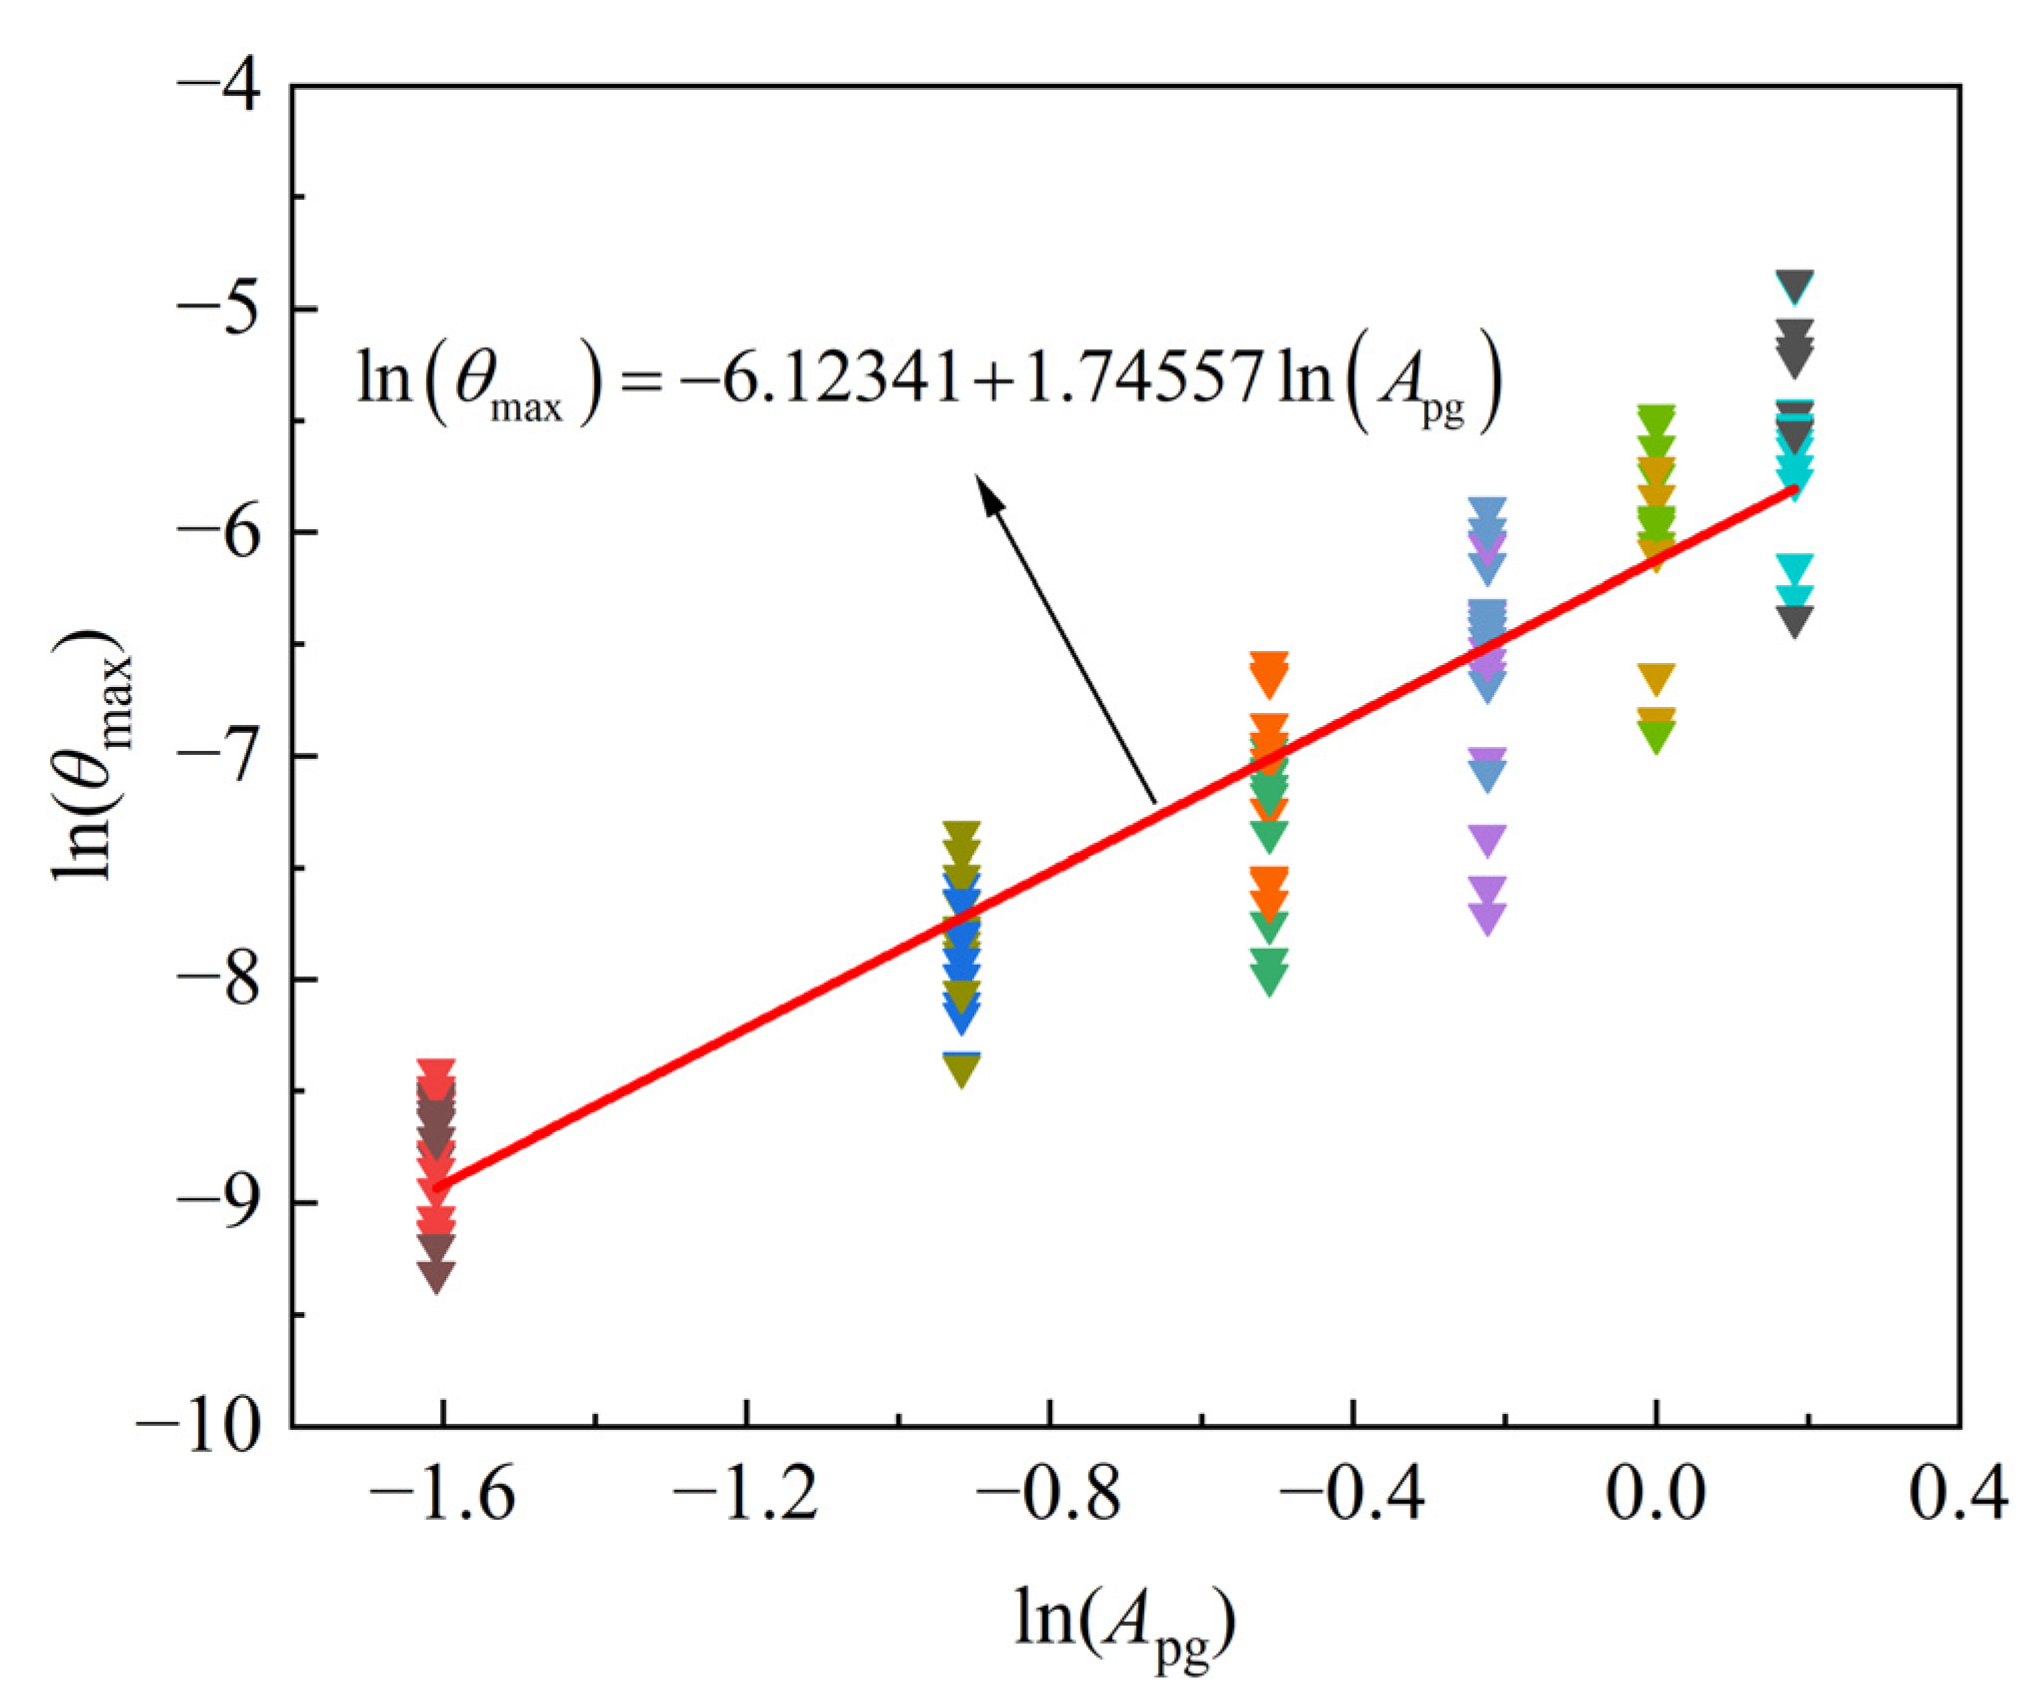
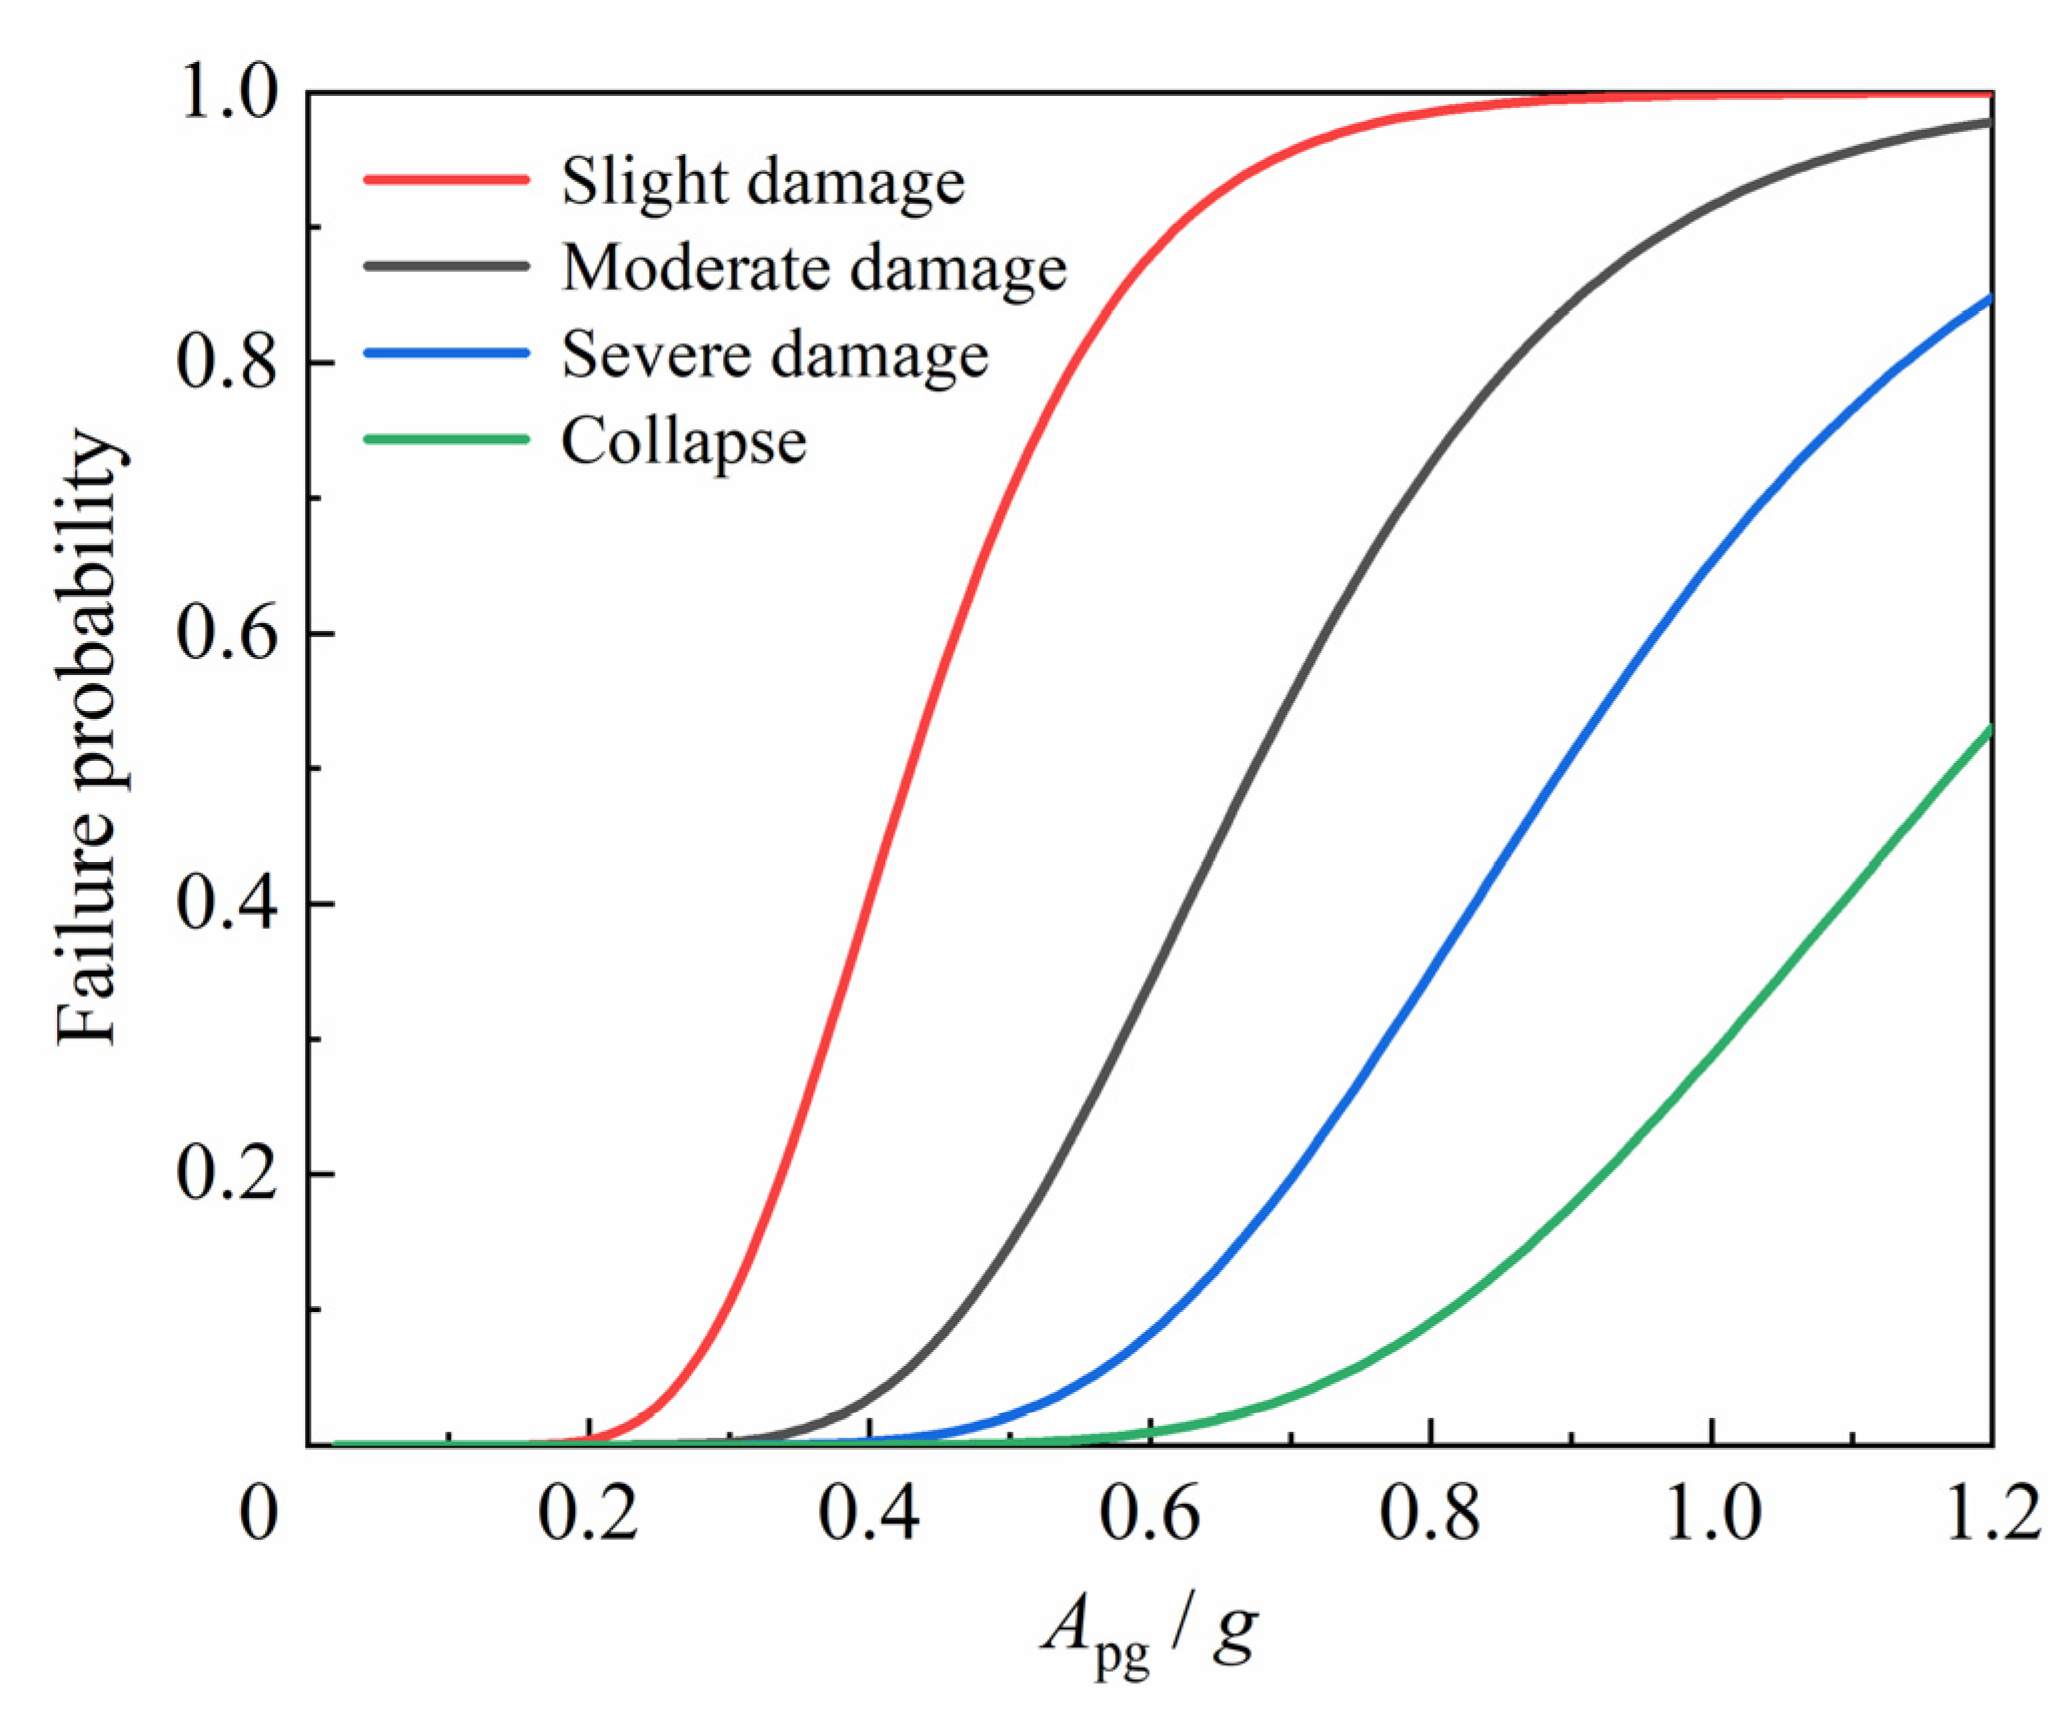
4.4. Seismic Vulnerability Curve

The 20 ground motion records selected previously were scaled by peak acceleration in 0.2 g steps to form 120 structure–ground vibration samples. The maximum inter-story displacement angle for different ground motion intensities can be determined utilizing Abaqus to conduct elastic–plastic time–history analysis on the calculation model. After multiple calculations and integration of relevant data, 20 IDA curves can also be obtained. Statistical methods were used to measure the analysis results of IDA curves [52], and the 16%, 50%, and 84% exceedance probability curves of the overall analysis results are illustrated in Figure 11.
As can be seen from Figure 11, when the peak ground acceleration was small, the model was in the elastic stage, and the IDA curves exhibited a monotonic increasing trend. The model entered the elasto-plastic stage and damage intensification and stiffness degradation began, and the IDA curves displayed a non-monotonic increasing trend as the peak ground acceleration gradually increased. When the model was seriously damaged, 16% of the 20 ground motion records had a peak acceleration of no more than 1.18 g, 50% had a peak acceleration of no more than 1.02 g, and 84% had a peak acceleration of no more than 0.88 g.
Figure 12 shows the maximum inter-story displacement angle and the location of the floor under four groups of ground motion records to obtain the complete development of the inter-story displacement angle of the calculation model. A pentagram demonstrates the floor in Figure 12, where the maximum inter-story displacement angle was located. It was found that when the peak ground acceleration was small, the maximum inter-story displacement angle of the calculation model mainly appeared on the 2nd and 3rd floors. On the other hand, when the peak ground acceleration was large, the maximum inter-story displacement angle of the calculation model mainly appeared on the 1st floor. In particular, with the increase in peak ground acceleration, the inter-story displacement angle became smaller under CAP000. Due to the different spectrum characteristics of ground motion records, the order of development of structural plasticity may differ and the floor location at which the maximum inter-story displacement angle may change accordingly. It is necessary to select a sufficient number of ground motions for the calculation to reflect the weakness of a structure in IDA fully.
It is worth noting that under various ground motion records, the IDA curves are discrete. In order to accurately reflect the seismic capacity of the model under different ground motion records, vulnerability curves can be drawn based on the IDA results. Through the structural failure probability, it may assess its seismic performance and reduce discreteness. The seismic vulnerability curves are generated using the maximum inter-story displacement angle and peak ground acceleration obtained in the previous IDA. According to Mackie’s study [53], the maximum inter-story displacement angle ( θ max ) can be calculated by a power model, which can be expressed as in Equation (4), where a and b are the linear regression coefficients. According to the IDA results, the probabilistic structure demand model can be obtained by a linear regression analysis based on Equation (4), as is depicted in Equation (5) and Figure 13.
θ max = a A pg b
ln ( θ max ) = 6.12341 + 1.74557 ln ( A pg )
According to Hwang’s recommendations [54], structure demand and capacity parameters followed the lognormal distributions. The failure probability of structure demand exceeding the structure capacity P f can be expressed as:
P f = φ [ ln ( θ ^ ) ln ( C ^ ) β c 2 + β d 2 ]
where θ ^ and β d are the mean value and logarithmic standard deviation of the structure demand parameter, C ^ and β c are the mean value and logarithmic standard deviation of the structural capacity parameter, which could be determined from the performance level points in Table 4. According to Schneider’s study [47], when Apg was used as the independent variable of vulnerability curves, β c 2 + β d 2 could be taken as 0.5. In addition, φ ( x ) the standard normal distribution could be described as Equation (7).
φ ( x ) = 1 2 π x exp ( t 2 2 ) d t
Based on Equations (5) and (6), it was possible to determine the failure probability of the maximum inter-story displacement angle reaching each performance level under different ground motion intensities, as demonstrated in Figure 14.
The slope of vulnerability curves was notably different under different performance levels, according to investigations on vulnerability curve characteristics. The slope of vulnerability curves was progressively slower from the operational level (OP) to the collapse prevention level (CP). The vulnerability matrix of the calculation model under 7- and 8-degree earthquakes is shown in Table 5.
It can be seen from Table 5 that the failure probability under the rare earthquake of 8 degrees (0.4 g) at the performance levels of OP to CP was noted as 40.37%, 3.43%, 0.25%, and 0%, respectively. In general, the seismic performance of the model structure under earthquake action was relatively good. Under a rare earthquake, the structure may be moderately damaged; however, the failure probability is not very large; thus, the structure will not be seriously damaged or even collapse. The brick masonry structure was mainly anti-seismic by the wall pieces when the intensity of the ground motion was minimal. With the increase in ground motion intensity, the structural column gradually played a role after the structure cracks, especially when the structure entered a more serious damage state, such as serious damage and collapse. Small spacing and a robust restraining effect provided by the MSBD structural columns significantly improve the structure’s ductility and contribute to preventing the structure from collapsing.

5. Conclusions

In the current study, the operation methods of disassembling the brick wall pieces into brick wall sections and building masonry structures with DBWSs were proposed, providing a new choice for reusing masonry structural elements. To evaluate the seismic performance of MSBD, the FEM was established based on Abaqus, and the FEM results were compared with an experimental model to verify the accuracy and practicality of the modeling method. The 20 ground motion records were selected and scaled by peak acceleration in 0.2 g steps to form 120 structure–ground vibration samples for incremental dynamic and seismic vulnerability analysis. The research can provide a reference for seismic design and earthquake damage evaluation of MSBD, which promote the application of DBWSs in building masonry structures. The following conclusions can be drawn from the obtained findings:
(1) The FEM captures the experimental model’s stiffness, strength, and ductility with acceptable accuracy, proving the material constitution’s applicability and assumptions used in finite element modeling. This modeling method can be regarded as an effective and reliable tool for seismic vulnerability analysis of MSBD.
(2) Based on elastic–plastic analysis under various ground motions, it is possible to determine the progression of a structure from elastic deformation to plastic deformation and ultimately to collapse under an earthquake. From the IDA curves of the calculation model, it can be seen that the maximum inter-story displacement angle increased with the gradual increase in peak ground acceleration. The damage degree gradually increased, the stiffness gradually decreased, and the model transited from the elastic stage to the elastoplastic stage.
(3) Due to the different spectrum characteristics of ground motion records, the order of structural plasticity development will be different, and the factor of floors needs to be considered in the seismic performance assessment. To completely reflect the weakness of the structure, a sufficient number of ground motions need to be selected for IDA.
(4) From the seismic vulnerability curves of the calculation model, it can be seen that the structure would not collapse under the 7 and 8 degree design-based earthquake and the probability of moderate and severe damage of the structure under the rare earthquake was also minimal. The structure fulfills the requirements for “no collapse subjected to rare earthquake.” The seismic performance evaluation of structures can use the probabilistic statistics-based seismic vulnerability analysis as a reference.

Author Contributions

Conceptualization, Z.S. and W.Z.; methodology, Z.S. and W.Z.; software, Z.S.; validation, Z.S. and Y.W.; formal analysis, Z.S.; investigation, Z.S.; resources, W.Z.; data curation, Z.S.; writing—original draft preparation, Z.S.; writing—review and editing, Y.W. and X.H.; visualization, Z.S.; supervision, Y.W. and X.H.; project administration, W.Z.; funding acquisition, W.Z. All authors have read and agreed to the published version of the manuscript.

Funding

This research was funded by Nation Key Research and Development Program of China (Grant No. 2017YFC0806104) and Heilongjiang Touyan Innovation Team Program (Grant No. 2019–49).

Institutional Review Board Statement

Not applicable.

Informed Consent Statement

Not applicable.

Data Availability Statement

The data presented in this study are available on request from the corresponding author. The data are not publicly available as the data contain confidential information, which cannot be publicly disclosed.

Conflicts of Interest

The authors declare no conflict of interest.

References

  1. National Development and Reform Commission. Opinions on further work to ban the use of solid clay bricks. Energy Conserv. Environ. Prot. 2004, 3–4, 6. [Google Scholar]
  2. Zhong, X.; Chen, X. Demolition, rehabilitation, and conservation: Heritage in Shanghai’s urban regeneration, 1990–2015. J. Archit. Urban. 2017, 41, 82–91. [Google Scholar] [CrossRef]
  3. Lauritzen, E.K. Third International RILEM Symposium on Demolition and Reuse of Concrete and Masonry Odense, Denmark, 24–27 October 1993. Mater. Struct. 1994, 27, 307–310. [Google Scholar] [CrossRef]
  4. Ghisellini, P.; Ji, X.; Liu, G.; Ulgiati, S. Evaluating the transition towards cleaner production in the construction and demolition sector of China: A review. J. Clean. Prod. 2018, 195, 418–434. [Google Scholar] [CrossRef]
  5. Kasai, Y. The Second International RILEM Symposium on demolition and reuse of concrete and masonry. Mater. Struct. 1989, 22, 312–319. [Google Scholar]
  6. Elias Özkan, S. Deconstruction of earthquake damaged buildings in Turkey. In Proceedings of the Deconstruction and Materials Reuse—11th Rinker International Conference on Deconstruction and Materials Reuse, Gainesville, FL, USA, 7–10 May 2003; pp. 138–150. [Google Scholar]
  7. Lieder, M.; Rashid, A. Towards circular economy implementation: A comprehensive review in context of manufacturing industry. J. Clean. Prod. 2016, 115, 36–51. [Google Scholar] [CrossRef]
  8. Ige, O.; Danso, H. Physico-mechanical and thermal gravimetric analysis of adobe masonry units reinforced with plantain pseudo-stem fibres for sustainable construction. Constr. Build. Mater. 2021, 273, 121686. [Google Scholar] [CrossRef]
  9. Brick Development Association, BDA Comment on the Use of Reclaimed Clay Bricks. Available online: https://www.brick.org.uk/admin/resources/g-reclaimed-brickwork.pdf (accessed on 1 March 2022).
  10. Liu, S.; Dai, R.; Cao, K.; Gao, Z. The role of sintered clay brick powder during the hydration process of cement pastes. Iran. J. Sci. Technol. Trans. Civ. Eng. 2017, 41, 159–165. [Google Scholar] [CrossRef]
  11. Rahhal, V.F.; Trezza, M.A.; Tironi, A.; Castellano, C.C.; Pavlíková, M.; Pokorný, J.; Irassar, E.F.; Jankovský, O.; Pavlík, Z. Complex characterization and behavior of waste fired brick powder-portland cement system. Materials 2019, 12, 1650. [Google Scholar] [CrossRef] [Green Version]
  12. Phooey Architects, Cubo House. Available online: http://www.phooey.com.au/projects/90/cubo-house (accessed on 3 April 2022).
  13. Zhou, K.; Chen, H.-M.; Wang, Y.; Lam, D.; Ajayebi, A.; Hopkinson, P. Developing advanced techniques to reclaim existing end of service life (EoSL) bricks—An assessment of reuse technical viability. Dev. Built Environ. 2020, 2, 100006. [Google Scholar] [CrossRef]
  14. Ucer, D.; Ulybin, A.; Zubkov, S.; Elias-Ozkan, S.T. Analysis on the mechanical properties of historical brick masonry after machinery demolition. Constr. Build. Mater. 2018, 161, 186–195. [Google Scholar] [CrossRef]
  15. Dolce, M.; Kappos, A.; Zuccaro, G.; Coburn, A. Report of the EAEE Working Group 3: Vulnerability and risk analysis. In Proceedings of the 10th European Conference on Earthquake Engineering, Vienna, Austria, 28 August–2 September 1994; pp. 3049–3077. [Google Scholar]
  16. Shakya, M.; Varum, H.; Vicente, R.; Costa, A. Seismic vulnerability assessment methodology for slender masonry structures. Int. J. Archit. Herit. 2018, 12, 1297–1326. [Google Scholar] [CrossRef]
  17. GB 50003-2011; Code for Design of Masonry Structures. Ministry of Housing and Urban-Rural Development of the People’s Republic of China: Beijing, China, 2011.
  18. 18CG40+18CJ79-1; Assembled Masonry Wall Construction. China Institute of Building Standard Design & Re-Search: Beijing, China, 2018.
  19. Lourenço, P.B. Computations on historic masonry structures. Prog. Struct. Eng. Mater. 2002, 4, 301–319. [Google Scholar] [CrossRef]
  20. Lourenço, P.J.B.B. Computational Strategies for Masonry Structures. Ph.D. Thesis, Technische Universiteit Delft, Delft, The Netherlands, 1997. [Google Scholar]
  21. Yekrangnia, M.; Mohammadi, M. A new strut model for solid masonry infills in steel frames. Eng. Struct. 2017, 135, 222–235. [Google Scholar] [CrossRef]
  22. Ferreira, T.M.; Mendes, N.; Silva, R. Multiscale seismic vulnerability assessment and retrofit of existing masonry buildings. Buildings 2019, 9, 91. [Google Scholar] [CrossRef] [Green Version]
  23. Tahmasebinia, F.; Ranzi, G.; Zona, A. Probabilistic three-dimensional finite element study on composite beams with steel trapezoidal decking. J. Constr. Steel Res. 2013, 80, 394–411. [Google Scholar] [CrossRef]
  24. Agnihotri, P.; Singhal, V.; Rai, D.C. Effect of in-plane damage on out-of-plane strength of unreinforced masonry walls. Eng. Struct. 2013, 57, 1–11. [Google Scholar] [CrossRef]
  25. Yang, W.Z. Constitutive model of masonry under compression. Build. Struct. 2008, 38, 80–82. [Google Scholar]
  26. Ali, S.S.; Page, A.W. Finite element model for masonry subjected to concentrated loads. J. Struct. Eng. 1988, 114, 1761–1784. [Google Scholar] [CrossRef]
  27. Sidoroff, F. Description of anisotropic damage application to elasticity. In Physical Non-Linearities in Structural Analysis; Springer: Berlin, Germany, 1981; pp. 237–244. [Google Scholar]
  28. Mohammed, M.S. Finite element analysis of unreinforced masonry walls. Al-Rafidain Eng. J. (AREJ) 2010, 18, 55–68. [Google Scholar] [CrossRef]
  29. Lourenço, P.; Rots, J. Analysis of Masonry Structures with Interface Elements; Faculty of Civil Engineering, Delft University of Technology: Delft, The Netherlands, 1994. [Google Scholar]
  30. Abdulla, K.F.; Cunningham, L.S.; Gillie, M. Simulating masonry wall behaviour using a simplified micro-model approach. Eng. Struct. 2017, 151, 349–365. [Google Scholar] [CrossRef]
  31. Dolatshahi, K.M.; Aref, A.J. Two-dimensional computational framework of meso-scale rigid and line interface elements for masonry structures. Eng. Struct. 2011, 33, 3657–3667. [Google Scholar] [CrossRef]
  32. GB/T 50129-2011; Standard for Test Method of Basic Mechanics Properties of Masonry. Ministry of Housing and Urban-Rural Development of the People’s Republic of China: Beijing, China, 2011.
  33. GB/T 50315-2011; Technical Standard for Site Testing of Masonry Engineering. Ministry of Housing and Urban-Rural Development of the People’s Republic of China: Beijing, China, 2011.
  34. GB 50010-2010; Code for Design of Concrete Structures. Ministry of Housing and Urban-Rural Development of the People’s Republic of China: Beijing, China, 2010.
  35. Smith, M. ABAQUS/Standard User’s Manual, version 6.9; Dassault Systèmes Simulia Corp.: Providence, RI, USA, 2009. [Google Scholar]
  36. Dhanasekar, M.; Haider, W. Explicit finite element analysis of lightly reinforced masonry shear walls. Comput. Struct. 2008, 86, 15–26. [Google Scholar] [CrossRef]
  37. Farahani, E.M.; Maalek, S. An investigation of the seismic behavior of a deck-type reinforced concrete arch bridge. Earthq. Eng. Eng. Vib. 2017, 16, 609–625. [Google Scholar] [CrossRef]
  38. Medeiros, P.; Vasconcelos, G.; Lourenço, P.B.; Gouveia, J. Numerical modelling of non-confined and confined masonry walls. Constr. Build. Mater. 2013, 41, 968–976. [Google Scholar] [CrossRef]
  39. Yekrangnia, M.; Bakhshi, A.; Ghannad, M.A. Force-displacement model for solid confined masonry walls with shear-dominated failure mode. Earthq. Eng. Struct. Dyn. 2017, 46, 2209–2234. [Google Scholar] [CrossRef]
  40. Dolatshahi, K.M.; Aref, A.J.; Yekrangnia, M. Bidirectional behavior of unreinforced masonry walls. Earthq. Eng. Struct. Dyn. 2014, 43, 2377–2397. [Google Scholar] [CrossRef]
  41. Dolatshahi, K.M.; Yekrangnia, M. Out-of-plane strength reduction of unreinforced masonry walls because of in-plane damages. Earthq. Eng. Struct. Dyn. 2015, 44, 2157–2176. [Google Scholar] [CrossRef]
  42. Dolsek, M. Incremental dynamic analysis with consideration of modeling uncertainties. Earthq. Eng. Struct. Dyn. 2009, 38, 805–825. [Google Scholar] [CrossRef]
  43. Riddell, R.; Garcia, J.E. Hysteretic energy spectrum and damage control. Earthq. Eng. Struct. Dyn. 2001, 30, 1791–1816. [Google Scholar] [CrossRef]
  44. GB 50011-2010; Code for Seismic Design of Buildings. Ministry of Housing and Urban-Rural Development of the People’s Republic of China: Beijing, China, 2010.
  45. Fema, P. Quantification of Building Seismic Performance Factors; US Department of Homeland Security: Washington, DC, USA, 2009. [Google Scholar]
  46. Riahi, Z.; Elwood, K.J.; Alcocer, S.M. Backbone model for confined masonry walls for performance-based seismic design. J. Struct. Eng. 2009, 135, 644–654. [Google Scholar] [CrossRef]
  47. Schneider, P.J.; Schauer, B.A. HAZUS—Its development and its future. Nat. Hazards Rev. 2006, 7, 40–44. [Google Scholar] [CrossRef]
  48. Seminar, C. NEHRP Guidelines for the Seismic Rehabilitation of Buildings (FEMA 273); Building Seismic Safety Council: Washington, DC, USA, 1997. [Google Scholar]
  49. Cao, X.-Y.; Feng, D.-C.; Li, Y. Assessment of various seismic fragility analysis approaches for structures excited by non-stationary stochastic ground motions. Mech. Syst. Signal Process. 2023, 186, 109838. [Google Scholar] [CrossRef]
  50. Pasticier, L.; Amadio, C.; Fragiacomo, M. Non-linear seismic analysis and vulnerability evaluation of a masonry building by means of the SAP2000 V. 10 code. Earthq. Eng. Struct. Dyn. 2008, 37, 467–485. [Google Scholar] [CrossRef]
  51. Ruiz-García, J.; Miranda, E. Inelastic displacement ratios for evaluation of existing structures. Earthq. Eng. Struct. Dyn. 2003, 32, 1237–1258. [Google Scholar] [CrossRef]
  52. Cao, X.-Y.; Feng, D.-C.; Wang, Z.; Wu, G. Parametric investigation of the assembled bolt-connected buckling-restrained brace and performance evaluation of its application into structural retrofit. J. Build. Eng. 2022, 48, 103988. [Google Scholar] [CrossRef]
  53. Mackie, K.R.; Stojadinović, B. Fragility Basis for California Highway Overpass Bridge Seismic Decision Making; Pacific Earthquake Engineering Research Center, College of Engineering, University of California: Berkeley, CA, USA, 2005. [Google Scholar]
  54. Hwang, H.; Liu, J.B.; Chiu, Y.-H. Seismic Fragility Analysis of Highway Bridges; Center for Earthquake Research and Information, The University of Memphis: Memphis, TN, USA, 2001. [Google Scholar]
Figure 1. Disassembling details: (a) the coring machine to form holes at both sides of the DBWSs; (b) the clamping frames details.
Buildings 12 01831 g001
Figure 2. Construction details: (a) horizontal connection between the DBWSs; (b) the reinforcement configuration at vertical joints details.
Buildings 12 01831 g002
Figure 3. Modeling approaches: (a) separated modeling approach; (b) integral modeling approach; (c) simplified separated modeling approach [22].
Buildings 12 01831 g003
Figure 4. Stress–strain relationships used for masonry: (a) Compressive behavior based on Yang model [25]; (b) Tensile behavior based on Sekender Ali model [26].
Buildings 12 01831 g004
Figure 5. Stress–strain relationships used for steel reinforcement.
Buildings 12 01831 g005
Figure 6. Traction separation model [30].
Buildings 12 01831 g006
Figure 7. One-half model of MSBD.
Buildings 12 01831 g007
Figure 8. Comparison between the cracking modes and force–displacement curves of the experimental and FEM results: (a) cracking pattern of experimental results; (b) lateral displacement contour of numerical modeling results; (c) force–displacement curves.
Buildings 12 01831 g008aBuildings 12 01831 g008b
Figure 9. Calculation model.
Buildings 12 01831 g009
Figure 10. Response spectrums.
Buildings 12 01831 g010
Figure 11. IDA curves under earthquake: (a) IDA curves under 20 ground motion records; (b) 16%, 50%, and 84% exceedance probability curves.
Buildings 12 01831 g011
Figure 12. Inter-story displacement angle under 4 groups ground motion records: (a) DLT352; (b) CAP000; (c) MUL279; (d) CHY101E.
Buildings 12 01831 g012
Figure 13. The probabilistic structure demand model.
Buildings 12 01831 g013
Figure 14. Vulnerability curves.
Buildings 12 01831 g014
Table 1. The recommended value for diameter, the distance of holes, and the dimension of shear keys/mm [17].
Diameter (D)Horizontal Distance (B)Vertical Distance (H)Width (b)Height (h)
120809080180
160100125100250
200120160120320
Table 2. Mechanical properties of materials.
MaterialPropertyValue
MasonryCompressive strength3.40 MPa
Shear strength0.304 MPa
Modulus of elasticity2320 MPa
Density2000 kg/m3
Poisson’s ratio0.15
ConcreteCompressive strength23.41 MPa
Tensile strength2.57 MPa
Modulus of elasticity29,254 MPa
Density2500 kg/m3
Poisson’s ratio0.2
SteelYield strength of HPB300346 MPa
Yield strength of HRB400485 MPa
Modulus of elasticity210,000 MPa
Density7850 kg/m3
Poisson’s ratio0.3
Table 3. The selected ground motion records.
Earthquake NameRecord
Sequence Number
Peak Ground AccelerationEarthquake Name Record
Sequence Number
Peak Ground Acceleration
San_FernandoPEL0900.21 gNorthridge-01MUL2790.52 g
Friuli-ItalyTMZ2700.31 gKobe-JapanNIS0000.51 g
Imperial_ValleyDLT3520.35 gKobe-JapanSHI0000.24 g
Imperial_ValleyE112300.38 gKocaeli-TurkeyARC0000.22 g
Superstition_HillsICC0000.36 gKocaeli-TurkeyDZC2700.36 g
Loma_PrietaCAP0000.53 gChiChiCHY101E0.35 g
Loma_PrietaG030000.56 gChiChiCHY101N0.44 g
Cape_MendocinoRIO3600.55 gDuzce-TurkeyBOL0000.73 g
LandersCLW-TR0.42 gHector_MineHEC0000.27 g
LandersYER2700.24 gHector_MineHEC0900.34 g
Table 4. Inter-story displacement angle limits of each performance level.
Performance levelsOperationalImmediate OccupancyLife SafetyCollapse Prevention
Damage stateSlight damageModerate damageSevere damageCollapse
Inter-story displacement angle0.00050.00110.00180.0029
Table 5. Vulnerability matrix.
Design IntensityThe Failure Probability under Different Performance Levels
Slight DamageModerate DamageSevere
Damage
Collapse
7
degree
Frequent earthquake0000
Design-based earthquake0000
Rare earthquake0.99000
8
degree
Frequent earthquake0000
Design-based earthquake0.39000
Rare earthquake40.373.430.250
Publisher’s Note: MDPI stays neutral with regard to jurisdictional claims in published maps and institutional affiliations.

