
Triangulation Method to Assess Indoor Environmental Conditions and Occupant Comfort and Productivity towards Low Energy Buildings in Malaysia

 ,
,  and
and 
Abstract
1. Introduction
2. Materials and Methods
3. Results and Discussion
4. Conclusions
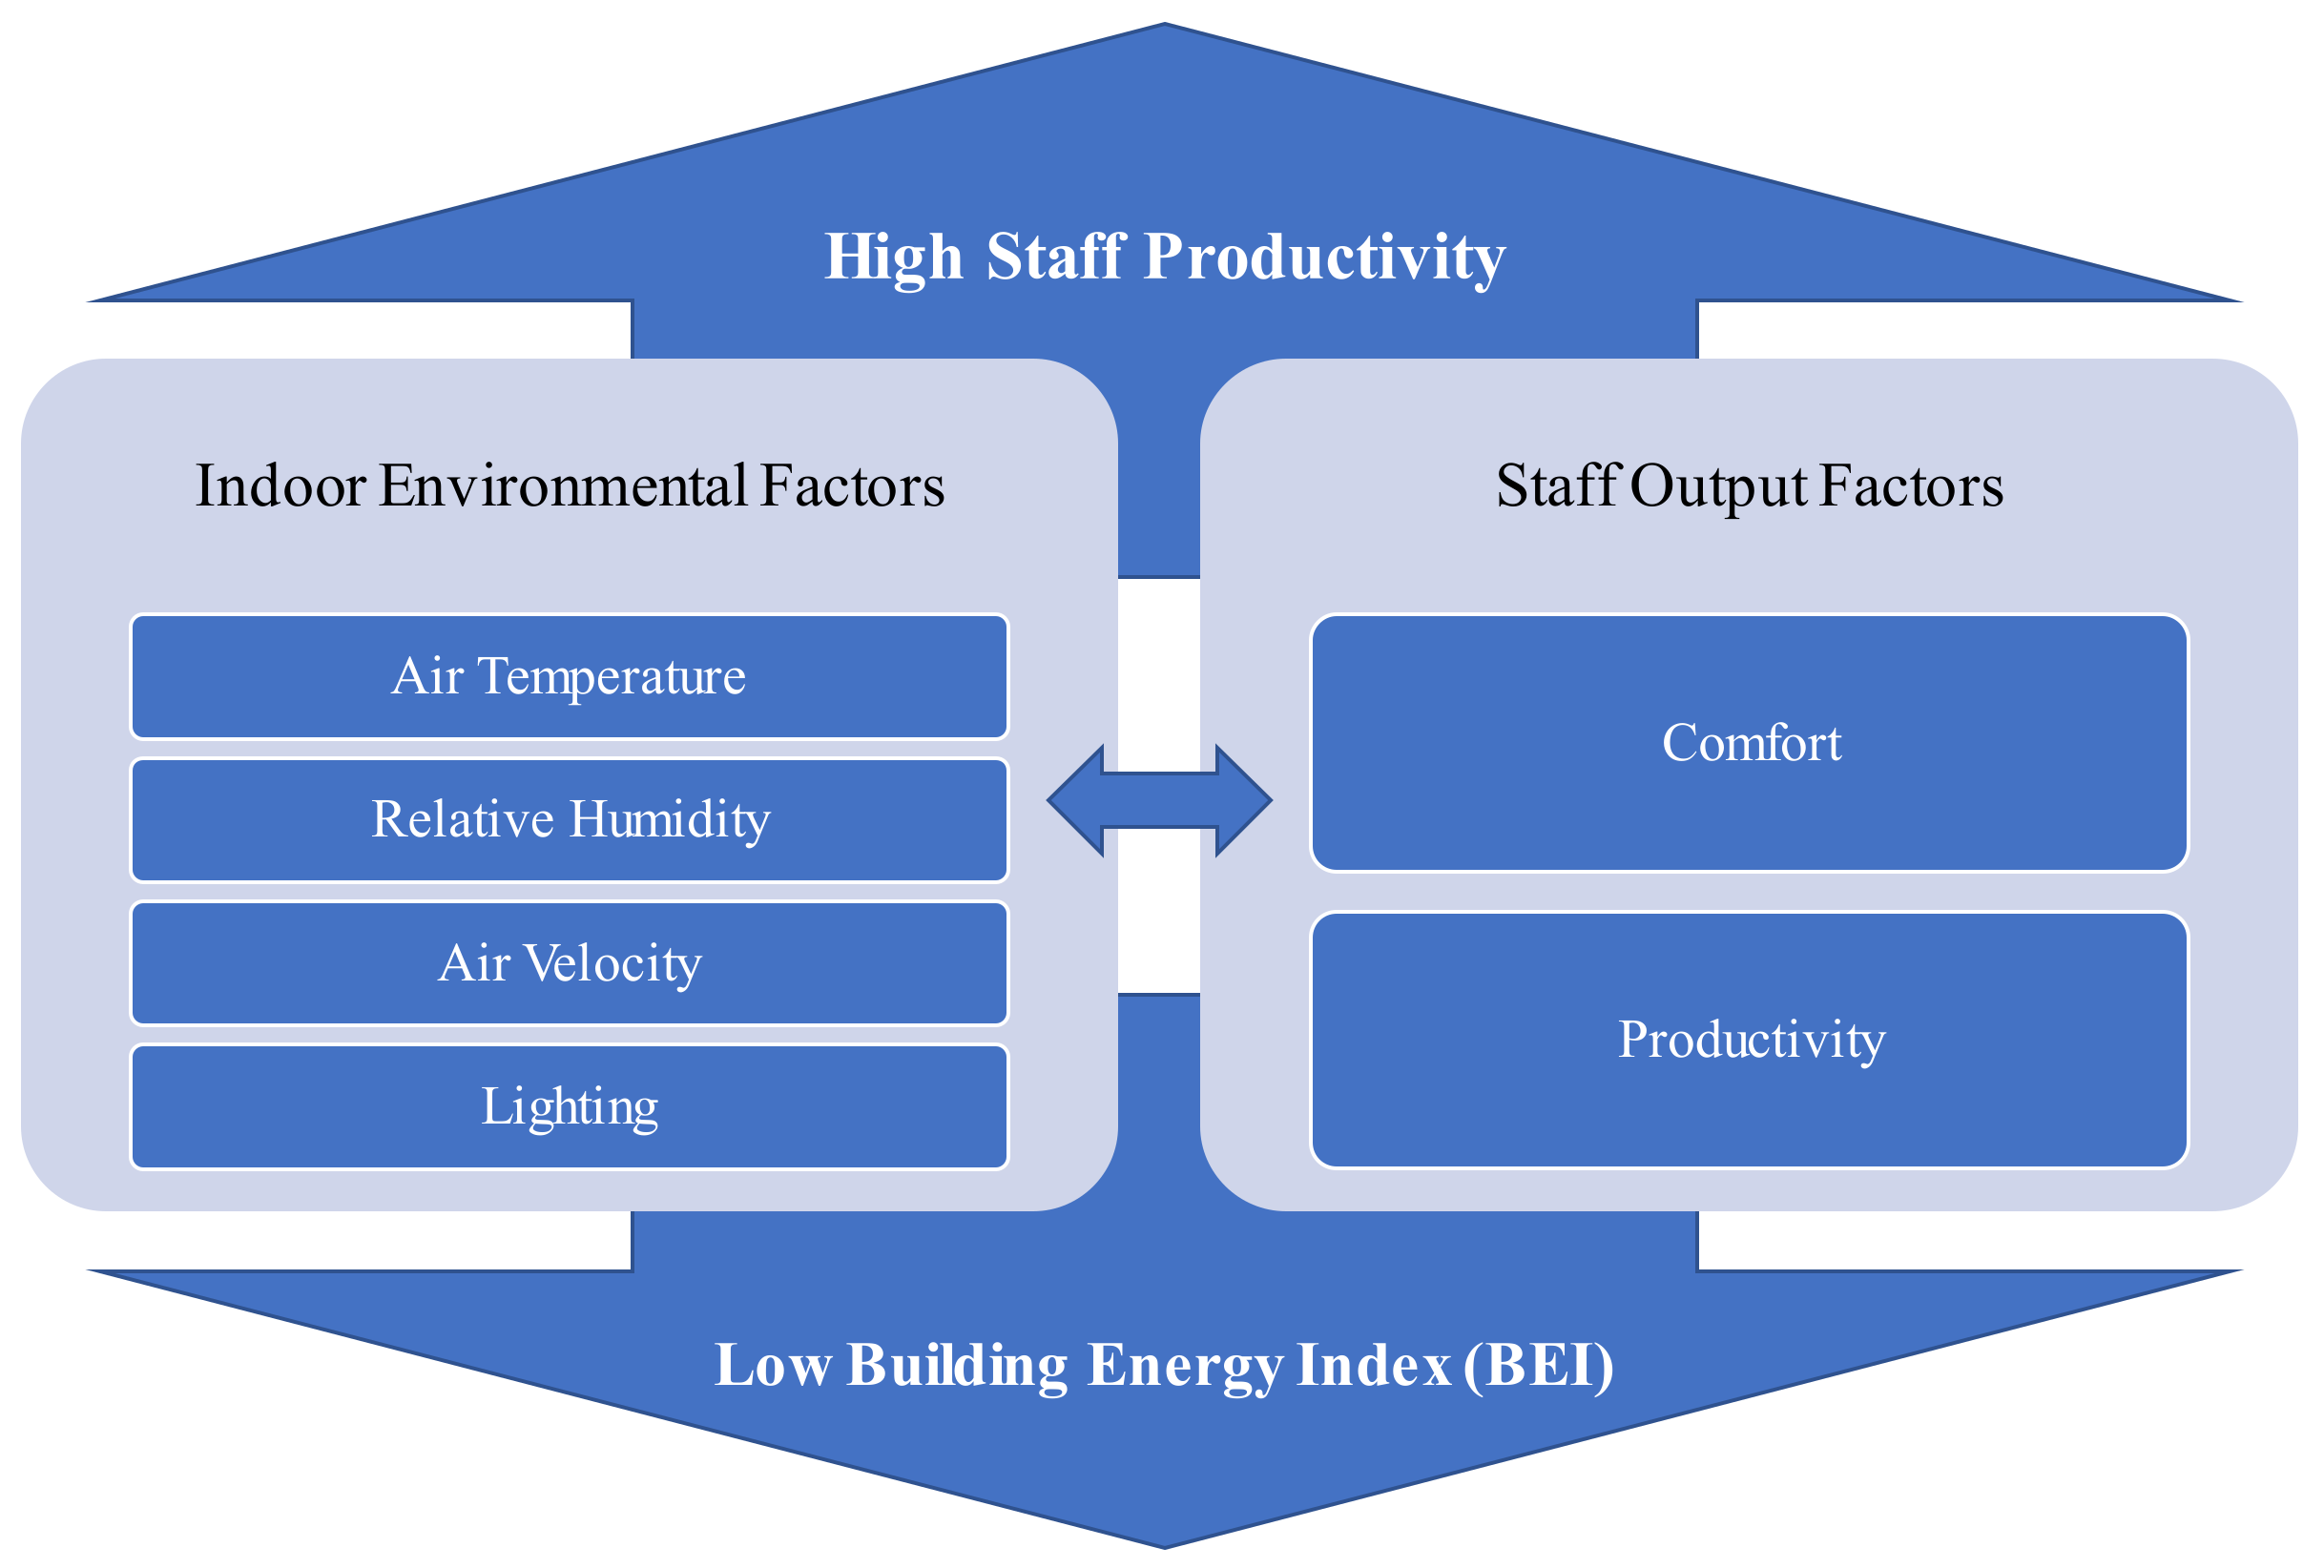
- The general benchmarking results for the whole building indicate that most temperature variables are lower than the benchmark. However, most of the air variables have no difference from the benchmark. Moreover, the overall comfort variable was similar to the benchmark. Interestingly, the productivity variable was better than the benchmark.
- The results of physical measurements indicated that 87.50% of the studied areas/zones do not comply with comfort perception. Thus, the majority of office areas should be adjusted to provide comfortable and productive environments.
- The simulation analysis showed that a reduction of 3 h in the operating hours with an increase in chillers’ temperature by just 1.5 °C managed to provide optimum results. The application was demonstrated by adjusting the working hours of the chillers to 0900–1600 with a temperature of 25.5 °C, maintaining indoor conditions and reducing the building’s BEI to 89.48 kWh/m2/year with an energy saving of 21.51%.
- This simple adjustment of chillers operation not only reduces the building’s BEI, but also can enhance staff comfort and productivity. The result of the hierarchical multiple regression analysis showed the expected level of change based on Beta values (i.e., considering all other variables can lead to a 42% change to staff comfort and 8% change to productivity).
Author Contributions
Funding
Acknowledgments
Conflicts of Interest
References
- Al-Obaidi, K.M.; Munaaim, M.A.C.; Ismail, M.A.; Rahman, A.M.A. Designing an integrated daylighting system for deep-plan spaces in Malaysian low-rise buildings. Sol. Energy 2017, 149, 85–101. [Google Scholar] [CrossRef]
- Al-Obaidi, K.M.; Ismail, M.A.; Abdul Rahman, A.M. Effective use of hybrid turbine ventilator to improve thermal performance in Malaysian tropical houses. Build. Serv. Eng. Res. Technol. 2016, 37, 755–768. [Google Scholar] [CrossRef]
- García-Solórzano, L.A.; Esparza-López, C.J.; Al-Obaidi, K.M. Environmental design solutions for existing concrete flat roofs in low-cost housing to improve passive cooling in western Mexico. J. Clean. Prod. 2020, 277, 123992. [Google Scholar] [CrossRef]
- Holopainen, R.; Tuomaala, P.; Hernandez, P.; Häkkinen, T.; Piira, K.; Piippo, J. Comfort assessment in the context of sustainable buildings: Comparison of simplified and detailed human thermal sensation methods. Build. Environ. 2014, 71, 60–70. [Google Scholar] [CrossRef]
- Bates, G.P.; Schneider, J. Hydration status and physiological workload of UAE construction workers: A prospective longitudinal observational study. J. Occup. Med. Toxicol. 2008, 3, 21. [Google Scholar] [CrossRef]
- González-Alonso, J.; Crandall, C.G.; Johnson, J.M. The cardiovascular challenge of exercising in the heat. J. Physiol. 2008, 586, 45–53. [Google Scholar] [CrossRef] [PubMed]
- Dutta, P.; Chorsiya, V. Scenario of climate change and human health in India. Int. J. Innov. Res. Dev. 2013, 2, 157–160. [Google Scholar]
- Fisk, W.J.; Black, D.; Brunner, G. Benefits and costs of improved IEQ in US offices. Indoor Air 2011, 21, 357–367. [Google Scholar] [CrossRef]
- Upfront, W.B.E.C. Coordinated Action for the Building and Construction Sector to Tackle Embodied Carbon; World Green Building Council: London, UK, 2019. [Google Scholar]
- Torcellini, P.; Pless, S.; Deru, M.; Crawley, D. Zero energy Buildings: A Critical Look at the Definition; No. NREL/CP-550-39833; National Renewable Energy Lab. (NREL): Golden, CO, USA, 2006.
- Butti, K.; Perlin, J. A Golden Thread: 2500 Years of Solar Architecture and Technology; Cheshire Books: Palo Alto, CA, USA, 1980. [Google Scholar]
- Kjellstrom, T.; Lemke, B.; Otto, M. Mapping occupational heat exposure and effects in South-East Asia: Ongoing time trends 1980–2011 and future estimates to 2050. Ind. Health 2013, 51, 56–67. [Google Scholar] [CrossRef]
- Esparza-López, C.J.; Pozo, C.E.D.; Al-Obaidi, K.M.; González-Trevizo, M.E. Improving the thermal performance of indirect evaporative cooling by using a wet fabric device on a concrete roof in hot and humid climates. Energies 2022, 15, 2213. [Google Scholar] [CrossRef]
- Forsthoff, A.; Mehnert, P.; Neffgen, H. Comparison of laboratory studies with predictions of the required sweat rate index (ISO 7933) for climates with moderate to high thermal radiation. Appl. Ergon. 2001, 32, 299–303. [Google Scholar] [CrossRef]
- Lan, L.; Lian, Z. Use of neurobehavioral tests to evaluate the effects of indoor environment quality on productivity. Build. Environ. 2009, 44, 2208–2217. [Google Scholar] [CrossRef]
- Seppänen, O.A.; Fisk, W. Some quantitative relations between indoor environmental quality and work performance or health. HvacR Res. 2006, 12, 957–973. [Google Scholar] [CrossRef]
- Mofidi, F.; Akbari, H. Personalized energy costs and productivity optimization in offices. Energy Build. 2017, 143, 173–190. [Google Scholar] [CrossRef]
- Alashwal, A.M.; Ismail, M.A.B.; Al-Obaidi, K.M.; Yahya, S.N.N.S.; Al-Sabahi, M.H. Zero Carbon Building Assessment for UM Chancellery Building and Other UM Office Buildings; Transforming Research into Action; UM Living Lab.: Kuala Lumpur, Malaysia, 2017; Volume 1, pp. 1–25. [Google Scholar]
- Kofoworola, O.F.; Gheewala, S.H. Life cycle energy assessment of a typical office building in Thailand. Energy Build. 2009, 41, 1076–1083. [Google Scholar] [CrossRef]
- Hensen, J.L.M. On the Thermal Interaction of Building Structure and Heating and Ventilating System. Ph.D. Thesis, Eindhoven University of Technology, Eindhoven, The Netherlands, 1991. [Google Scholar]
- Refrigerating, & American National Standards Institute. Thermal Environmental Conditions for Human Occupancy; American Society of Heating, Refrigerating and Air-Conditioning Engineers: Atlanta, GA, USA, 2004; Volume 55. [Google Scholar]
- Kaushik, A.; Arif, M.; Tumula, P.; Ebohon, O.J. Effect of thermal comfort on occupant productivity in office buildings: Response surface analysis. Build. Environ. 2020, 180, 107021. [Google Scholar] [CrossRef]
- He, X.; An, L.; Hong, B.; Huang, B.; Cui, X. Cross-cultural differences in thermal comfort in campus open spaces: A longitudinal field survey in China’s cold region. Build. Environ. 2020, 172, 106739. [Google Scholar] [CrossRef]
- Bueno, A.M.; de Paula Xavier, A.A.; Broday, E.E. Evaluating the connection between thermal comfort and productivity in buildings: A systematic literature review. Buildings 2021, 11, 244. [Google Scholar] [CrossRef]
- Roelofsen, P. A computer model for the assessment of employee performance loss as a function of thermal discomfort or degree of heat stress. Intell. Build. Int. 2016, 8, 195–214. [Google Scholar] [CrossRef]
- Tarantini, M.; Pernigotto, G.; Gasparella, A. A co-citation analysis on thermal comfort and productivity aspects in production and office buildings. Buildings 2017, 7, 36. [Google Scholar] [CrossRef]
- Lipczynska, A.; Schiavon, S.; Graham, L.T. Thermal comfort and self-reported productivity in an office with ceiling fans in the tropics. Build. Environ. 2018, 135, 202–212. [Google Scholar] [CrossRef]
- Vimalanathan, K.; Ramesh Babu, T. The effect of indoor office environment on the work performance, health and well-being of office workers. J. Environ. Health Sci. Eng. 2014, 12, 113. [Google Scholar] [CrossRef] [PubMed]
- Kekäläinen, P.; Niemelä, R.; Tuomainen, M.; Kemppilä, S.; Palonen, J.; Riuttala, H.; Nykyri, E.; Seppänen, O.; Reijula, K. Effect of reduced summer indoor temperature on symptoms, perceived work environment and productivity in office work: An intervention study. Intell. Build. Int. 2010, 2, 251–266. [Google Scholar]
- King, D. Engineering a Low Carbon Built Environment: The Discipline of Building Engineering Physics; Royal Academy of Engineering: London, UK, 2010. [Google Scholar]
- Xing, Y.; Hewitt, N.; Griffiths, P. Zero carbon buildings refurbishment––A Hierarchical pathway. Renew. Sustain. Energy Rev. 2011, 15, 3229–3236. [Google Scholar] [CrossRef]
- Cohen, L.; Manion, L.; Morrison, K. Research Methods in Education; Routledge: London, UK, 2002. [Google Scholar]
- Yin, R.K. Case Study Research and Applications-Design and Methods; SAGE Publication: Thousand Oaks, CA, USA, 2018. [Google Scholar]
- Peretti, C.; Schiavon, S. Indoor Environmental Quality Surveys. A brief Literature Review; Indoor Air: Dallas, TX, USA, 2011; Available online: https://escholarship.org/uc/item/0wb1v0ss (accessed on 10 August 2022).
- Gou, Z.; Lau, S.S.Y. Post-occupancy evaluation of the thermal environment in a green building. Facilities 2013, 31, 357–371. [Google Scholar] [CrossRef]
- All Tools. The Building Use Studies (BUS) Occupant Survey: Origins and Approach Q&A. Available online: https://www.usablebuildings.co.uk/UsableBuildings/Unprotected/BUSOccupantSurveyQ&A.pdf (accessed on 10 August 2022).
- Palmer, J. Post-occupancy evaluation of buildings. In A Handbook of Sustainable Building Design and Engineering; Routledge: London, UK, 2013; pp. 387–396. [Google Scholar]
- Al-Obaidi, K.M. Innovative Roofing System for Solar Heat Reduction under Malaysian Sky Conditions. Ph.D. Thesis, Universiti Sains Malaysia, Pulau Pinang, Malaysia, January 2015. [Google Scholar]
- GBI. Green Building Index. 2013. Available online: http://new.greenbuildingindex.org/ (accessed on 30 June 2022).
- BSEEP. Building Energy Efficiency Technical Guideline for Passive Design. Malaysia. 2013. Available online: http://bseep.gov.my/App_ClientFile/df08bc24-99fb-47a3-937f-dc25df9d3997/Assets/Building%20Energy%20Efficiency%20Technical%20Guideline%20for%20Passive%20Design.pdf (accessed on 30 June 2022).
- Al-Tamimi, N.A.M.; Syed Fadzil, S.F. Thermal performance analysis for ventilated and unventilated glazed rooms in Malaysia (comparing simulated and field data). Indoor Built Environ. 2011, 20, 534–542. [Google Scholar] [CrossRef]
- Lim, Y.W.; Ahmad, M.H. The effects of direct sunlight on light shelf performance under tropical sky. Indoor Built Environ. 2015, 24, 788–802. [Google Scholar] [CrossRef]
- Al-Obaidi, K.M.; Al-Duais, H.S.; Alduais, N.A.M.; Alashwal, A.; Ismail, M.A. Exploring the environmental performance of liquid glass coating using Sol-Gel technology and responsive Venetian blinds in the tropics. J. Build. Eng. 2022, 62, 105329. [Google Scholar] [CrossRef]
- Cheung, T.; Schiavon, S.; Parkinson, T.; Li, P.; Brager, G. Analysis of the accuracy on PMV—PPD model using the ASHRAE Global Thermal Comfort Database II. Build. Environ. 2019, 153, 205–217. [Google Scholar] [CrossRef]
- Cohen, P.; West, S.G.; Aiken, L.S. Applied Multiple Regression/Correlation Analysis for the Behavioral Sciences; Psychology Press: New York, NY, USA, 2014. [Google Scholar]
- McGowan, M.K. Don’t Sweat It: Comfort Conditioning Can Increase Thermal Comfort, Decrease Energy Use. Available online: https://www.ashrae.org/news/ashraejournal/comfort-conditioning-and-thermal-comfort (accessed on 10 August 2022).


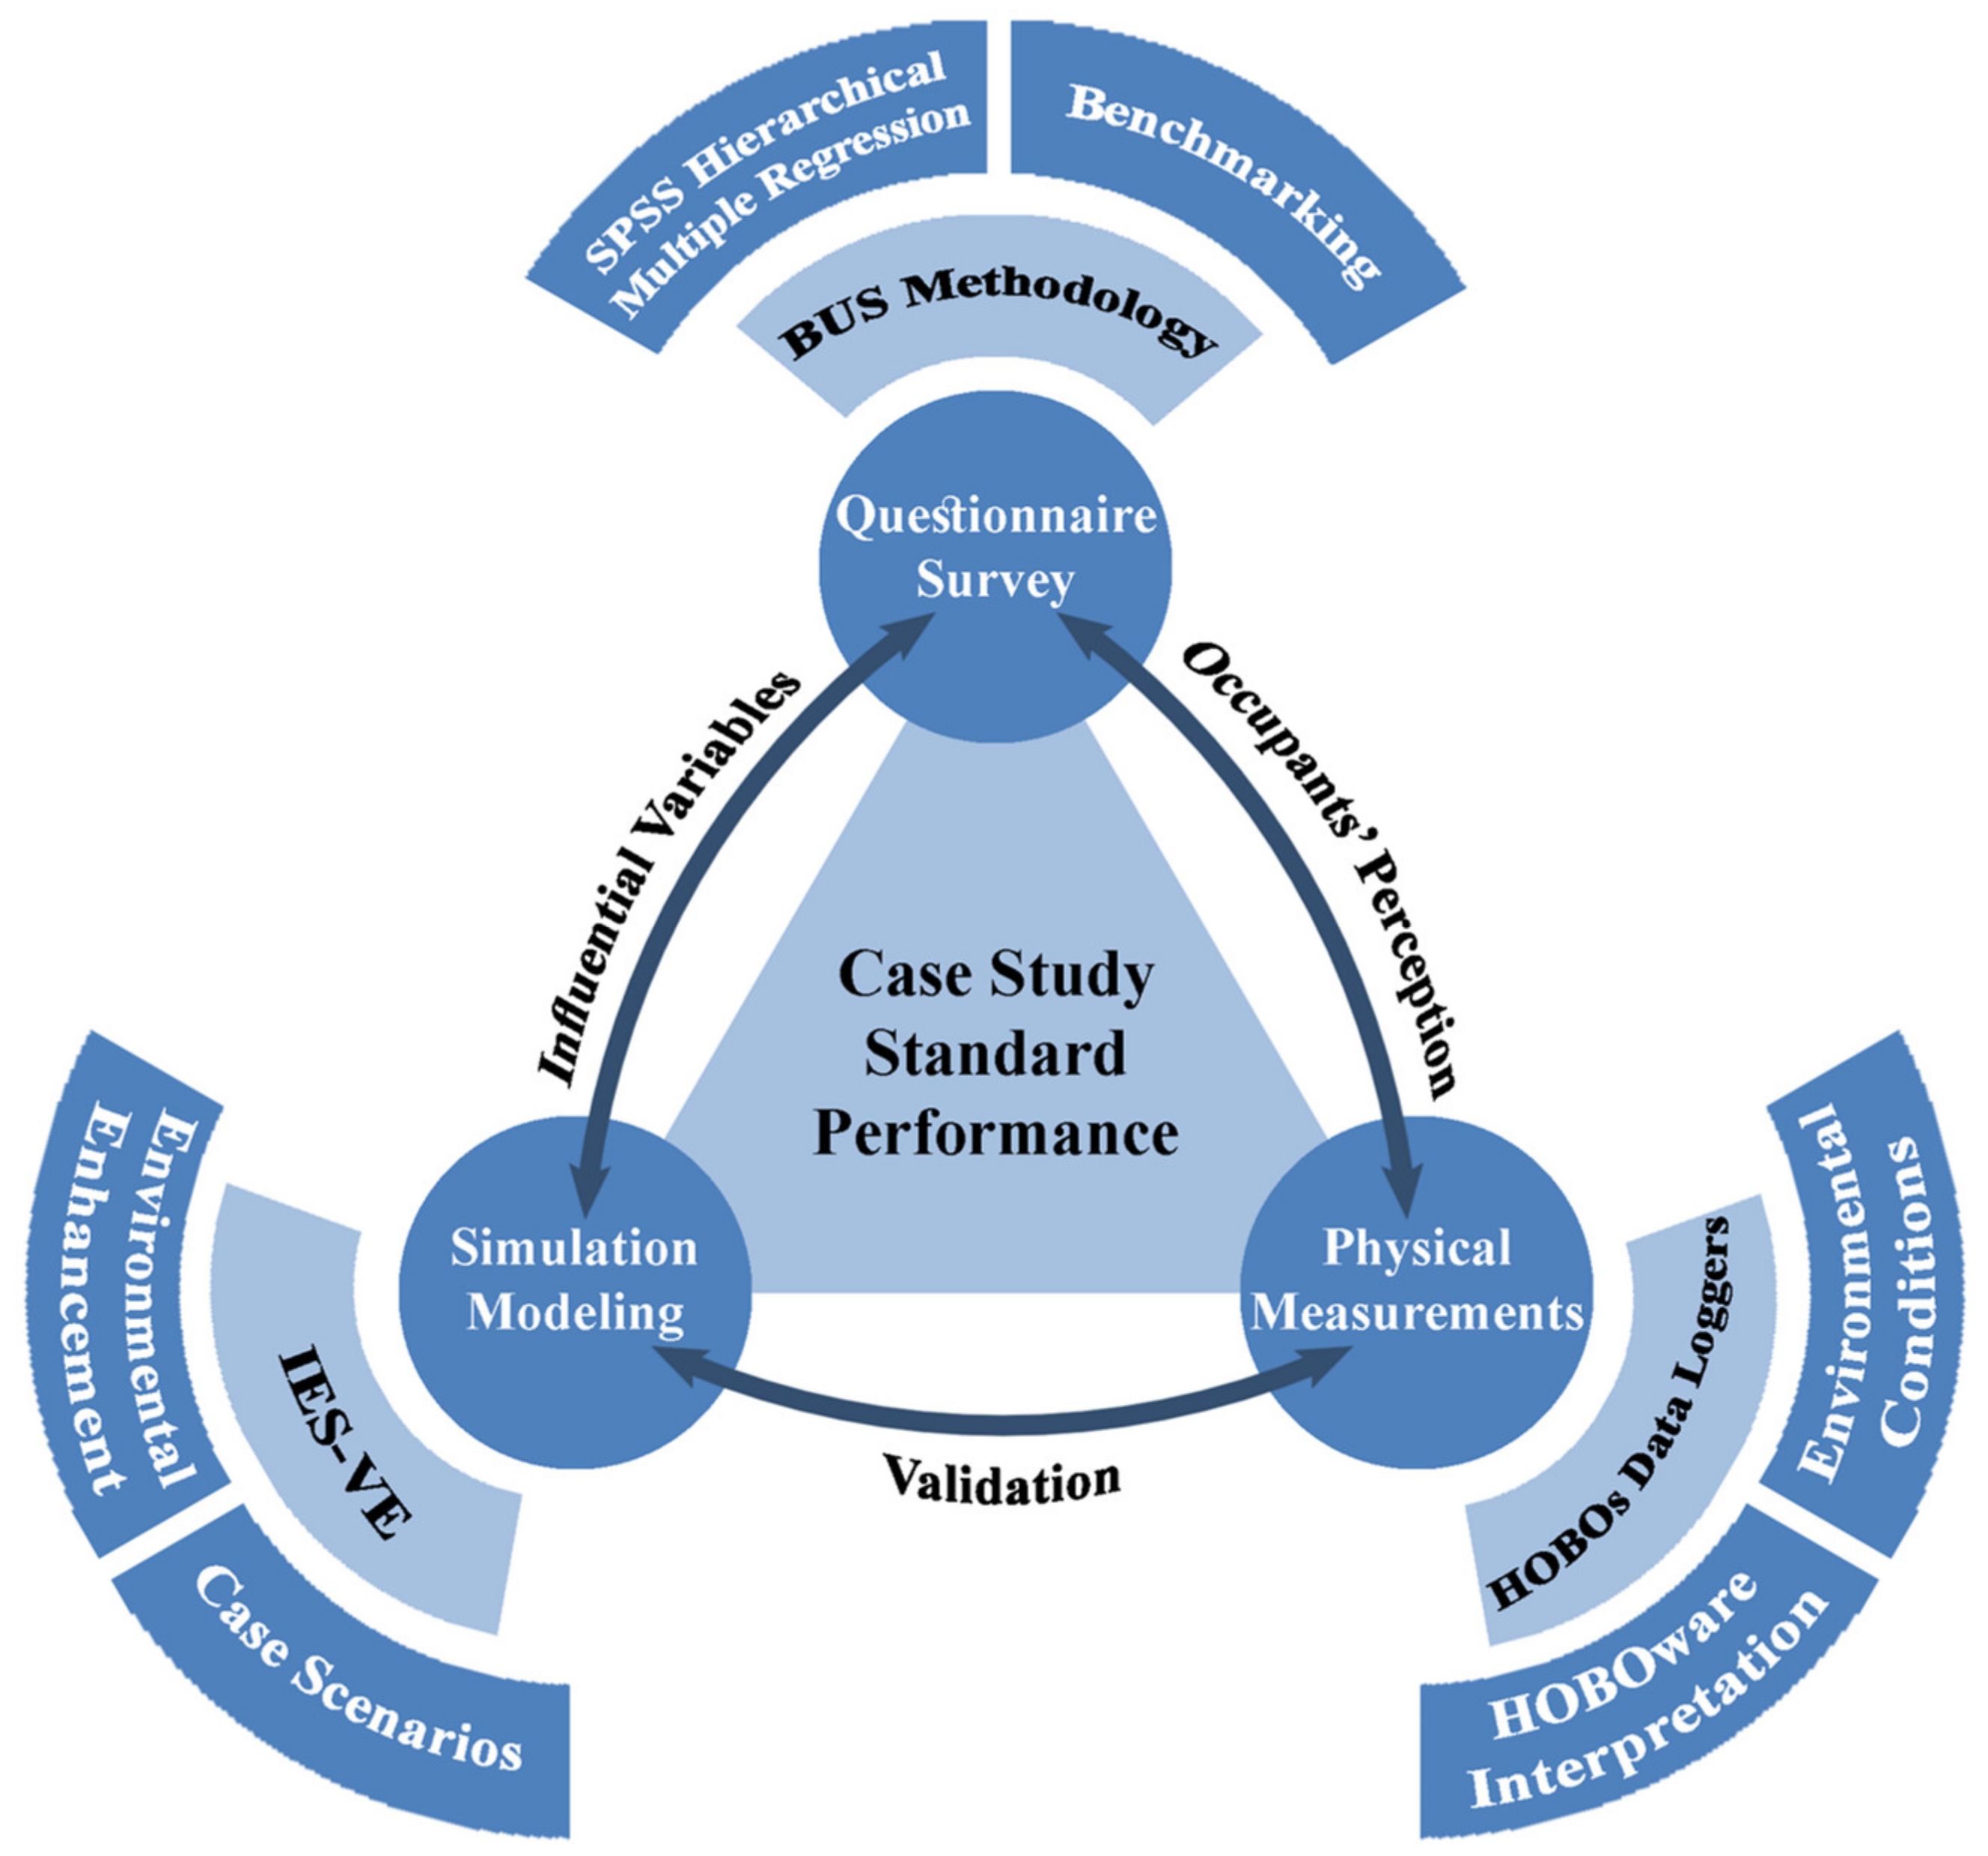
| Research Question | Research Objective | Method Approached | Purpose of Method | Type of Analysis | |
|---|---|---|---|---|---|
| Q.1. What essential indoor comfort factors influence occupants’ satisfaction and productivity? | 1st Objective: To identify the critical indoor comfort factors influencing occupants’ satisfaction and productivity. | Developed triangulation methodology to measure a case study performance | Structured questionnaire survey method (BUS survey) | To indicate the occupants’ perception of the indoor comfort conditions and satisfaction | BUS benchmarking, SPSS hierarchical multiple regression |
| Q.2. How do indoor environmental conditions affect the operations of an office building in Malaysia? | 2nd Objective: To evaluate the effects of indoor environmental conditions at an office building in Malaysia. | Physical measurements method (HOBOs data loggers) | To acquire the indoor conditions during the same period of the occupants’ perception | HOBOware interpretation, descriptive analysis | |
| Q.3. How to reduce the Building Energy Index (BEI) of an office building in Malaysia without interfering with the comfort and productivity of the staff? | 3rd Objective: To develop a method for reducing the Building Energy Index (BEI) for office buildings in Malaysia with comfortable and productive staff. | Simulation modelling method (IES-VE software) | To obtain the lowest BEI results without interfering with the staff comfort and productivity | Simulate several case scenarios with indoor environment enhancements | |
| Demographic | Characteristics | Missing | Frequency | Valid Percentage |
|---|---|---|---|---|
| Age | Under 30 years | 8 | 48 | 24.0% |
| 30 or over | 152 | 76.0% | ||
| Gender | Male | 11 | 57 | 28.9% |
| Female | 140 | 71.1% | ||
| Number of occupants in the working area | Alone | 8 | 24 | 12.0% |
| Shared with 1 other | 8 | 4.0% | ||
| With 2–4 others | 22 | 11.0% | ||
| With 5–8 others | 28 | 14.0% | ||
| With more than 8 | 118 | 59.0% | ||
| Setting next to a window | Yes | 1 | 90 | 43.5% |
| No | 117 | 56.5% | ||
| Worked in this building | Less than a year | 1 | 28 | 13.5% |
| A year or more | 179 | 86.5% | ||
| Worked in present work area | Less than a year | 1 | 41 | 19.8% |
| A year or more | 166 | 80.2% | ||
| Floor | Ground floor (OS) | - | 23 | 11.1% |
| Second floor (OS) | 33 | 15.9% | ||
| Third floor (CS) | 23 | 11.1% | ||
| Fourth floor | 4 | 1.9% | ||
| Fifth floor | 1 | 0.5% | ||
| Sixth floor (OS) | 41 | 19.7% | ||
| Seventh floor (CS) | 35 | 16.8% | ||
| Eighth floor (CS) | 23 | 11.1% | ||
| Ninth floor (CS) | 25 | 12.0% |
| Variable | Mean | Std. Error of Mean | Std. Deviation | Variance | Benchmarking Results |
|---|---|---|---|---|---|
| Temperature Variables | |||||
| Temperature: comfort overall | 4.74 | 0.076 | 1.073 | 1.152 | Green (above the benchmark—comfortable) |
| Range: hot/cold | 4.84 | 0.079 | 1.111 | 1.235 | Red (above the benchmark—too cold) |
| Stability: stable/varies | 4.51 | 0.078 | 1.107 | 1.226 | Red (above the benchmark—varies) |
| Air (Humidity & Velocity) Variables | |||||
| Air movement: still/draughty | 4.05 | 0.079 | 1.109 | 1.230 | Green (above the benchmark—acceptable) |
| Air humidity: dry/humid | 4.12 | 0.068 | 0.953 | 0.908 | Amber (no difference with the benchmark) |
| Air freshness: fresh/stuffy | 4.11 | 0.074 | 1.046 | 1.094 | Amber (no difference with the benchmark) |
| Air smell: odorless/smelly | 3.91 | 0.080 | 1.126 | 1.267 | Amber (no difference with the benchmark) |
| Air Conditions overall | 4.76 | 0.062 | 0.886 | 0.784 | Green (above the benchmark—satisfactory) |
| Lighting Variables | |||||
| Lighting: overall satisfactory | 4.79 | 0.077 | 1.100 | 1.210 | Amber (no difference with the benchmark) |
| Natural light: too little/too much | 4.36 | 0.086 | 1.225 | 1.501 | Red (above the benchmark—too much) |
| Glare from the sun: none/too much | 3.98 | 0.105 | 1.490 | 2.220 | Amber (no difference with the benchmark) |
| Artificial light: too little/too much | 4.37 | 0.079 | 1.115 | 1.244 | Red (above the benchmark—too much) |
| Glare from lights: none/too much | 4.21 | 0.084 | 1.195 | 1.429 | Red (above the benchmark—too much) |
| Other Essential Variables | |||||
| Comfort: overall satisfactory | 4.87 | 0.058 | 0.829 | 0.687 | Amber (no difference with the benchmark) |
| Productivity: −40% to +40% | 6.55 +15.5% | 0.100 | 1.388 | 1.925 | Green (above the benchmark—increased) |
| Model | R | R2 | Adjusted R2 | Std. Error of the Estimate | Change Statistics | Durbin-Watson | ||||
|---|---|---|---|---|---|---|---|---|---|---|
| R2 Change | F Change | df1 | df2 | Sig. F Change | ||||||
| 1 | 0.200 a | 0.040 | 0.004 | 0.793 | 0.040 | 1.125 | 6 | 162 | 0.350 | |
| 2 | 0.695 b | 0.484 | 0.418 | 0.606 | 0.444 | 9.842 | 13 | 149 | 0.000 | 1.963 |
| Model | Unstandardized Coefficients | Standardized Coefficients | Sig. | Collinearity Statistics | |||
|---|---|---|---|---|---|---|---|
| B | Std. Error | Beta | Tolerance | VIF | |||
| 1 | (Constant) | 4.880 | 0.542 | 0.000 | |||
| What is your age? | 0.239 | 0.153 | 0.126 | 0.120 | 0.911 | 1.098 | |
| What is your sex? | 0.145 | 0.135 | 0.085 | 0.284 | 0.955 | 1.047 | |
| Is your office or work area? | −0.012 | 0.045 | −0.020 | 0.797 | 0.972 | 1.029 | |
| Do you sit next to a window in your regular workspace? | 0.038 | 0.124 | 0.024 | 0.758 | 0.988 | 1.012 | |
| How long have you worked in this building? | −0.312 | 0.236 | −0.130 | 0.187 | 0.616 | 1.624 | |
| How long have you worked in your present work area? | −0.073 | 0.193 | −0.037 | 0.704 | 0.637 | 1.571 | |
| 2 | (Constant) | 1.988 | 0.635 | 0.002 | |||
| What is your age? | 0.072 | 0.124 | 0.038 | 0.560 | 0.811 | 1.234 | |
| What is your sex? | 0.221 | 0.109 | 0.129 | 0.045 | 0.855 | 1.169 | |
| Is your office or work area? | −0.012 | 0.036 | −0.020 | 0.745 | 0.915 | 1.093 | |
| Do you sit next to a window in your regular workspace? | −0.083 | 0.106 | −0.051 | 0.439 | 0.787 | 1.271 | |
| How long have you worked in this building? | −0.269 | 0.185 | −0.112 | 0.148 | 0.582 | 1.717 | |
| How long have you worked in your present work area? | −0.029 | 0.154 | −0.015 | 0.849 | 0.585 | 1.709 | |
| Temperature comfort | 0.046 | 0.058 | 0.061 | 0.431 | 0.590 | 1.696 | |
| Temperature (hot-cold) | 0.161 | 0.053 | 0.230 | 0.003 | 0.605 | 1.653 | |
| Temperature stable | −0.010 | 0.056 | −0.013 | 0.861 | 0.596 | 1.677 | |
| Air movement | −0.058 | 0.058 | −0.081 | 0.323 | 0.517 | 1.934 | |
| Air humidity | 0.039 | 0.078 | 0.045 | 0.616 | 0.440 | 2.272 | |
| Air freshness | 0.051 | 0.077 | 0.063 | 0.506 | 0.383 | 2.613 | |
| Air smell | −0.093 | 0.058 | −0.124 | 0.108 | 0.591 | 1.691 | |
| Air conditions overall (Air) | 0.352 | 0.067 | 0.380 | 0.000 | 0.665 | 1.503 | |
| Lighting overall | 0.103 | 0.061 | 0.138 | 0.095 | 0.517 | 1.935 | |
| Natural light | 0.156 | 0.062 | 0.227 | 0.013 | 0.424 | 2.359 | |
| Glare from the sun and sky | −0.119 | 0.049 | −0.224 | 0.016 | 0.411 | 2.435 | |
| Artificial light | 0.130 | 0.060 | 0.180 | 0.032 | 0.498 | 2.008 | |
| Glare from lights | −0.136 | 0.054 | −0.197 | 0.012 | 0.571 | 1.752 | |
| Model | R | R2 | Adjusted R2 | Std. Error of the Estimate | Change Statistics | Durbin-Watson | ||||
|---|---|---|---|---|---|---|---|---|---|---|
| R2 Change | F Change | df1 | df2 | Sig. F Change | ||||||
| 1 | 0.173 a | 0.030 | −0.007 | 1.384 | 0.030 | 0.805 | 6 | 156 | 0.567 | |
| 2 | 0.435 b | 0.190 | 0.075 | 1.326 | 0.160 | 1.998 | 14 | 142 | 0.022 | 2.170 |
| Model | Unstandardized Coefficients | Standardized Coefficients | Sig. | Collinearity Statistics | |||
|---|---|---|---|---|---|---|---|
| B | Std. Error | Beta | Tolerance | VIF | |||
| 1 | (Constant) | 6.510 | 0.950 | 0.000 | |||
| What is your age? | 0.530 | 0.273 | 0.161 | 0.054 | 0.902 | 1.109 | |
| What is your sex? | 0.029 | 0.239 | 0.010 | 0.902 | 0.956 | 1.046 | |
| Is your office or work area? | 0.003 | 0.081 | 0.003 | 0.975 | 0.973 | 1.028 | |
| Do you sit next to a window in your regular workspace? | 0.045 | 0.221 | 0.016 | 0.838 | 0.982 | 1.019 | |
| How long have you worked in this building? | −0.301 | 0.428 | −0.072 | 0.482 | 0.597 | 1.674 | |
| How long have you worked in your present work area? | −0.215 | 0.352 | −0.061 | 0.543 | 0.630 | 1.587 | |
| 2 | (Constant) | 4.819 | 1.468 | 0.001 | |||
| What is your age? | 0.236 | 0.278 | 0.072 | 0.399 | 0.793 | 1.261 | |
| What is your sex? | 0.121 | 0.247 | 0.041 | 0.624 | 0.821 | 1.217 | |
| Is your office or work area? | 0.013 | 0.081 | 0.013 | 0.875 | 0.897 | 1.115 | |
| Do you sit next to a window in your regular workspace? | 0.076 | 0.242 | 0.027 | 0.756 | 0.752 | 1.330 | |
| How long have you worked in this building? | −0.262 | 0.425 | −0.062 | 0.539 | 0.555 | 1.801 | |
| How long have you worked in your present work area? | −0.050 | 0.355 | −0.014 | 0.889 | 0.570 | 1.756 | |
| Temperature comfort | −0.018 | 0.131 | −0.014 | 0.893 | 0.568 | 1.761 | |
| Temperature (hot-cold) | −0.087 | 0.120 | −0.072 | 0.472 | 0.566 | 1.767 | |
| Temperature stable | −0.061 | 0.129 | −0.048 | 0.638 | 0.555 | 1.802 | |
| Air movement | −0.063 | 0.130 | −0.052 | 0.625 | 0.504 | 1.984 | |
| Air humidity | −0.002 | 0.173 | −0.001 | 0.990 | 0.441 | 2.265 | |
| Air freshness | 0.122 | 0.171 | 0.087 | 0.477 | 0.380 | 2.628 | |
| Air smell | −0.147 | 0.129 | −0.113 | 0.257 | 0.575 | 1.740 | |
| Air conditions overall | 0.190 | 0.160 | 0.119 | 0.238 | 0.567 | 1.763 | |
| Lighting overall | −0.066 | 0.137 | −0.051 | 0.631 | 0.514 | 1.945 | |
| Natural light | −0.081 | 0.139 | −0.069 | 0.560 | 0.403 | 2.484 | |
| Glare from the sun and sky | 0.066 | 0.110 | 0.073 | 0.550 | 0.389 | 2.571 | |
| Artificial light | 0.120 | 0.134 | 0.098 | 0.372 | 0.479 | 2.086 | |
| Glare from lights | −0.218 | 0.120 | −0.185 | 0.073 | 0.546 | 1.833 | |
| All things considered, how do you rate the overall comfort of the building environment? | 0.531 | 0.183 | 0.305 | 0.004 | 0.518 | 1.930 | |
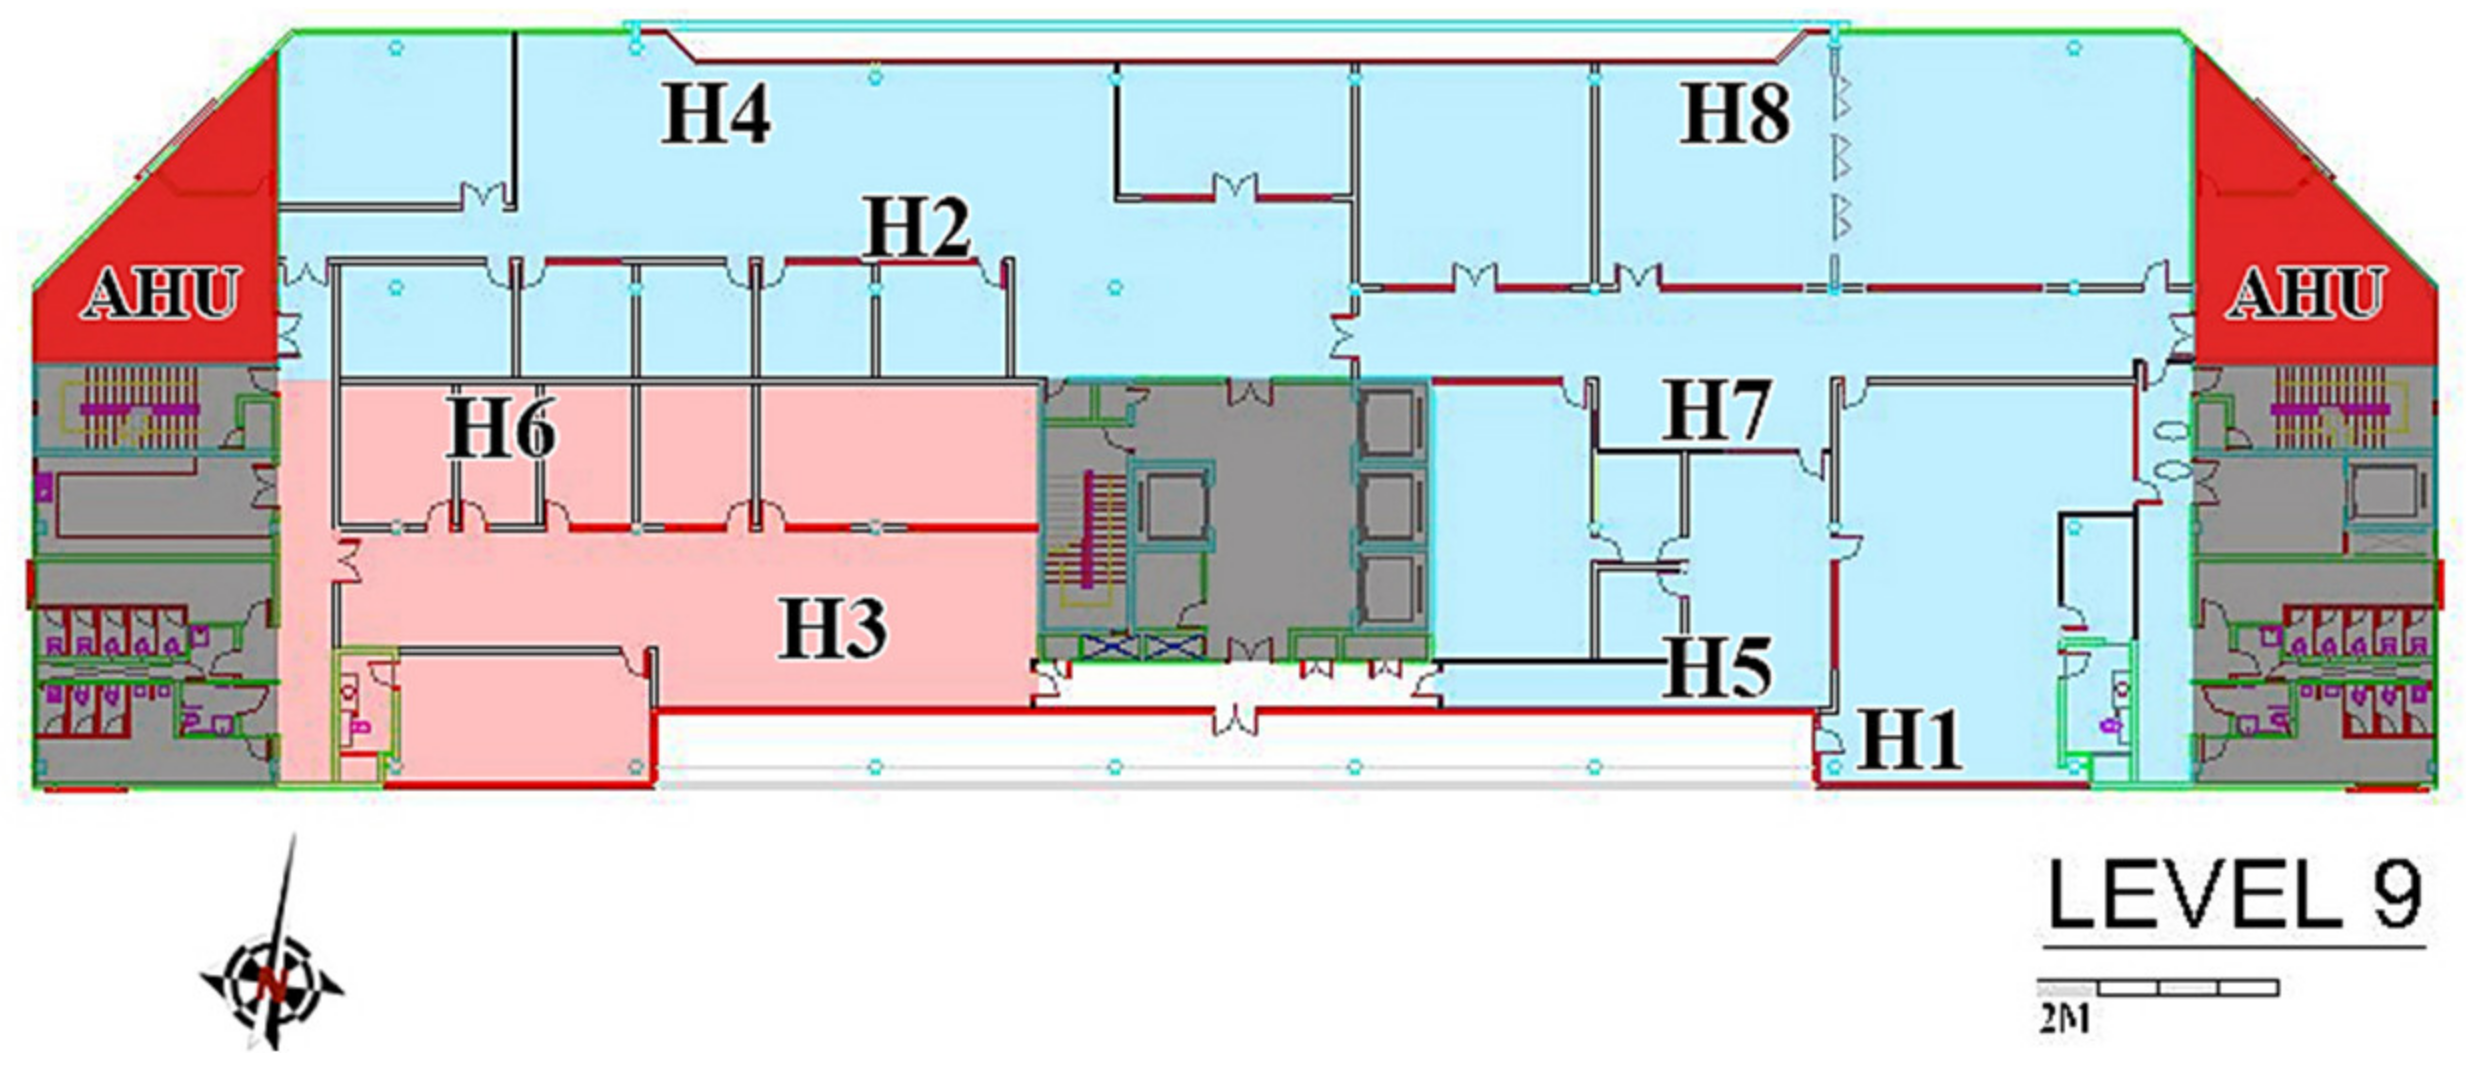
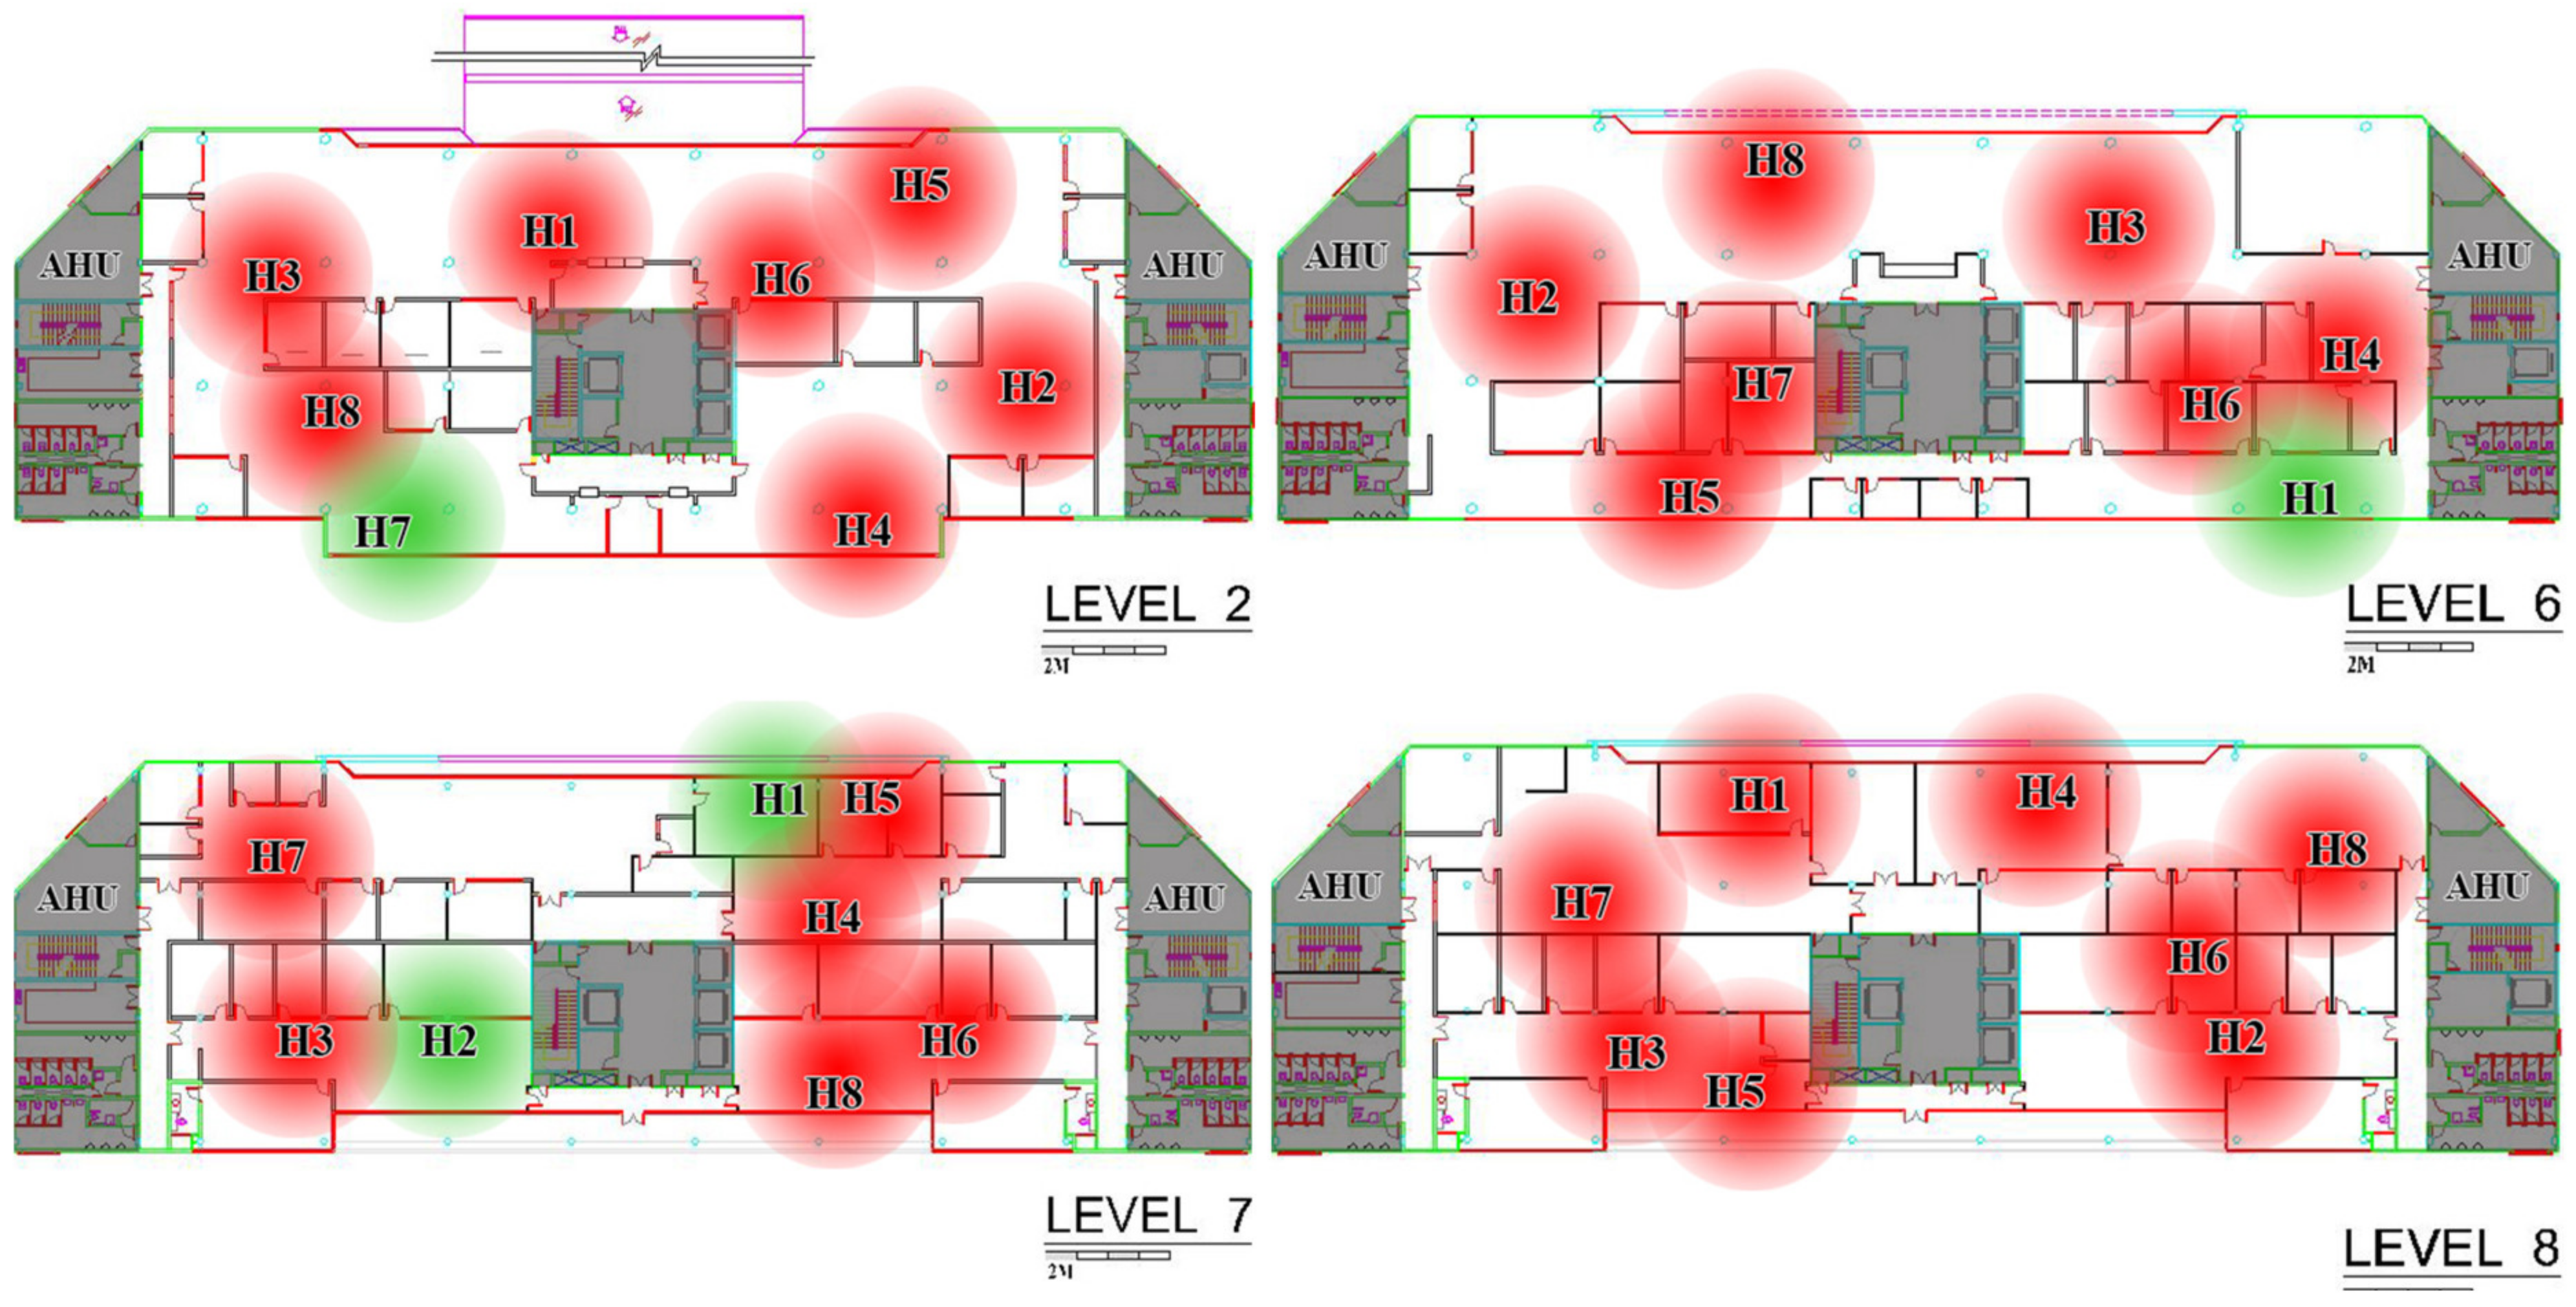
| Floor | Data Logger | Temp °C | RH % | Vel. m/s | Illuminance Lux | ||
|---|---|---|---|---|---|---|---|
| 9:00 | 12:00 | 15:00 | |||||
| Level 2 | H1 | 21.69 | 73.36 | 0.170 | 157.68 | 212.86 | 208.93 |
| H2 | 21.88 | 65.44 | 0.055 | 108.40 | 143.90 | 112.35 | |
| H3 | 22.70 | 74.10 | 1.152 | 100.48 | 122.20 | 124.18 | |
| H4 | 25.41 | 53.93 | 1.070 | 2524.75 | 4964.78 | 4229.65 | |
| H5 | 21.69 | 65.50 | 0.806 | 404.03 | 703.63 | 918.48 | |
| H6 | 20.87 | 68.90 | 0.385 | 106.40 | 137.98 | 151.75 | |
| H7 | 25.57 | 62.10 | 0.386 | 806.10 | 1395.43 | 1198.33 | |
| H8 | 23.68 | 69.45 | 0.950 | 236.50 | 376.45 | 411.93 | |
| Level 6 | H1 | 24.29 | 63.94 | 0.068 | 985.48 | 1326.45 | 812.03 |
| H2 | 22.67 | 75.74 | 0.165 | 114.30 | 124.18 | 130.08 | |
| H3 | 22.41 | 72.17 | 1.186 | 171.48 | 203.00 | 191.20 | |
| H4 | 21.97 | 73.29 | 0.549 | 92.65 | 90.70 | 92.65 | |
| H5 | 25.18 | 65.03 | 0.759 | 788.38 | 1022.93 | 618.90 | |
| H6 | 23.81 | 65.72 | 0.302 | 120.23 | 132.05 | 102.48 | |
| H7 | 22.22 | 77.29 | 0.618 | 214.83 | 197.08 | 120.23 | |
| H8 | 23.76 | 69.94 | 1.038 | 1046.55 | 1722.60 | 1409.23 | |
| Level 7 | H1 | 23.23 | 72.19 | 0.055 | 1320.55 | 3244.18 | 2717.90 |
| H2 | 24.03 | 73.44 | 0.074 | 323.25 | 406.03 | 346.90 | |
| H3 | 24.25 | 72.46 | 1.214 | 218.775 | 281.83 | 201.05 | |
| H4 | 22.87 | 75.24 | 0.549 | 86.73 | 122.18 | 114.30 | |
| H5 | 23.38 | 71.92 | 0.956 | 934.20 | 2244.90 | 1923.63 | |
| H6 | 23.61 | 70.58 | 0.372 | 216.78 | 319.30 | 275.93 | |
| H7 | 22.87 | 77.17 | 0.600 | 139.95 | 151.73 | 147.76 | |
| H8 | 24.38 | 68.31 | 1.122 | 1241.70 | 2438.08 | 1509.75 | |
| Level 8 | H1 | 22.92 | 75.39 | 0.089 | 1322.48 | 2497.23 | 1643.75 |
| H2 | 23.25 | 73.88 | 0.053 | 183.30 | 230.60 | 155.70 | |
| H3 | 23.33 | 71.92 | 1.220 | 386.33 | 354.76 | 193.15 | |
| H4 | 22.37 | 77.82 | 0.683 | 250.33 | 425.73 | 266.08 | |
| H5 | 23.51 | 71.72 | 0.863 | 1805.38 | 1501.85 | 354.78 | |
| H6 | 23.15 | 74.30 | 0.380 | 69.00 | 80.83 | 61.10 | |
| H7 | 21.88 | 80.21 | 0.782 | 143.85 | 157.65 | 139.93 | |
| H8 | 21.82 | 80.32 | 0.791 | 51.20 | 51.20 | 27.55 | |
| No. | Case Scenarios Simulation | Yearly Energy Consumption (kWh) | BEI (kWh/m2/year) | Energy Saving | |
|---|---|---|---|---|---|
| ON-OFF | Temp (°C) | ||||
| 1 | 0900–1600 | 25.5 | 1,700,190 | 89.48 | 21.51% |
| 2 | 0830–1600 | 25.5 | 1,741,860 | 91.68 | 19.58% |
| 3 | 0900–1600 | 25.0 | 1,750,740 | 92.14 | 19.18% |
| 4 | 0900–1630 | 25.5 | 1,773,410 | 93.34 | 18.12% |
| 5 | 0800–1600 | 25.5 | 1,774,740 | 93.41 | 18.06% |
| 6 | 0830–1600 | 25.0 | 1,794,430 | 94.44 | 17.16% |
| 7 | 0730–1600 | 25.5 | 1,798,940 | 94.68 | 16.95% |
| 8 | 0900–1600 | 24.5 | 1,801,130 | 94.80 | 16.84% |
| 9 | 0830–1630 | 25.5 | 1,812,590 | 95.40 | 16.32% |
| 10 | 0900–1630 | 25.0 | 1,826,030 | 96.11 | 15.69% |
| 11 | 0800–1600 | 25.0 | 1,829,250 | 96.28 | 15.54% |
| 12 | 0900–1700 | 25.5 | 1,841,640 | 96.93 | 14.97% |
| 13 | 0800–1630 | 25.5 | 1,843,310 | 97.02 | 14.89% |
| 14 | 0830–1600 | 24.5 | 1,846,850 | 97.20 | 14.74% |
| 15 | 0900–1600 | 24.0 | 1,851,370 | 97.44 | 14.53% |
| 16 | 0730–1600 | 25.0 | 1,855,300 | 97.65 | 14.34% |
| 17 | 0730–1630 | 25.5 | 1,865,690 | 98.19 | 13.87% |
| 18 | 0830–1630 | 25.0 | 1,867,150 | 98.27 | 13.80% |
| 19 | 0900–1630 | 24.5 | 1,878,500 | 98.86 | 13.28% |
| 20 | 0830–1700 | 25.5 | 1,878,560 | 98.87 | 13.27% |
| 21 | 0800–1600 | 24.5 | 1,883,600 | 99.14 | 13.04% |
| 22 | 0900–1730 | 25.5 | 1,893,110 | 99.64 | 12.60% |
| 23 | 0900–1700 | 25.0 | 1,896,260 | 99.80 | 12.46% |
| 24 | 0830–1600 | 24.0 | 1,899,100 | 99.95 | 12.32% |
| 25 | 0800–1630 | 25.0 | 1,899,740 | 99.98 | 12.30% |
| 26 | 0900–1600 | 23.5 | 1,901,440 | 100.08 | 12.21% |
| 27 | 0800–1700 | 25.5 | 1,907,320 | 100.39 | 11.94% |
| 28 | 0730–1600 | 24.5 | 1,911,500 | 100.61 | 11.75% |
| 29 | 0830–1630 | 24.5 | 1,921,560 | 101.13 | 11.29% |
| 30 | 0730–1630 | 25.0 | 1,923,880 | 101.26 | 11.18% |
| 31 | 0730–1700 | 25.5 | 1,928,020 | 101.47 | 10.99% |
| 32 | 0830–1730 | 25.5 | 1,928,190 | 101.48 | 10.98% |
| 33 | 0900–1630 | 24.0 | 1,930,800 | 101.62 | 10.86% |
| 34 | 0830–1700 | 25.0 | 1,935,040 | 101.84 | 10.67% |
| 35 | 0800–1600 | 24.0 | 1,937,790 | 102.00 | 10.53% |
| 36 | 0900–1730 | 25.0 | 1,949,650 | 102.61 | 10.00% |
| 37 | 0900–1700 | 24.5 | 1,950,720 | 102.67 | 9.94% |
| 38 | 0830–1600 | 23.5 | 1,951,200 | 102.69 | 9.92% |
| 39 | 0900–1600 | 23.0 | 1,951,360 | 102.70 | 9.91% |
| 40 | 0800–1730 | 25.5 | 1,955,380 | 102.91 | 9.73% |
| 41 | 0800–1630 | 24.5 | 1,956,000 | 102.95 | 9.69% |
| 42 | 0800–1700 | 25.0 | 1,965,580 | 103.45 | 9.25% |
| 43 | 0730–1600 | 24.0 | 1,967,540 | 103.55 | 9.17% |
| 44 | 0730–1730 | 25.5 | 1,974,760 | 103.93 | 8.83% |
| 45 | 0830–1630 | 24.0 | 1,975,800 | 104.00 | 8.77% |
| 46 | 0730–1630 | 24.5 | 1,981,910 | 104.31 | 8.50% |
| 47 | 0900–1630 | 23.5 | 1,982,950 | 104.37 | 8.44% |
| 48 | 0830–1730 | 25.0 | 1,986,510 | 104.55 | 8.29% |
| 49 | 0730–1700 | 25.0 | 1,987,980 | 104.63 | 8.22% |
| 50 | 0830–1700 | 24.5 | 1,991,350 | 104.81 | 8.06% |
| 51 | 0800–1600 | 23.5 | 1,991,820 | 104.83 | 8.04% |
| 52 | 0830–1600 | 23.0 | 2,003,130 | 105.43 | 7.52% |
| 53 | 0900–1700 | 24.0 | 2,005,010 | 105.53 | 7.43% |
| 54 | 0900–1730 | 24.5 | 2,006,030 | 105.58 | 7.39% |
| 55 | 0800–1630 | 24.0 | 2,012,090 | 105.90 | 7.11% |
| 56 | 0800–1730 | 25.0 | 2,015,410 | 106.07 | 6.96% |
| 57 | 0730–1600 | 23.5 | 2,023,410 | 106.50 | 6.58% |
| 58 | 0800–1700 | 24.5 | 2,023,680 | 106.51 | 6.57% |
| 59 | 0830–1630 | 23.5 | 2,029,870 | 106.84 | 6.28% |
| 60 | 0900–1630 | 23.0 | 2,034,930 | 107.10 | 6.05% |
| 61 | 0730–1730 | 25.0 | 2,036,420 | 107.18 | 5.98% |
| 62 | 0730–1630 | 24.0 | 2,039,780 | 107.36 | 5.82% |
| 63 | 0830–1730 | 24.5 | 2,044,670 | 107.61 | 5.61% |
| 64 | 0800–1600 | 23.0 | 2,045,680 | 107.67 | 5.55% |
| 65 | 0830–1700 | 24.0 | 2,047,500 | 107.76 | 5.47% |
| 66 | 0730–1700 | 24.5 | 2,047,780 | 107.78 | 5.46% |
| 67 | 0900–1700 | 23.5 | 2,059,140 | 108.38 | 4.93% |
| 68 | 0900–1730 | 24.0 | 2,062,250 | 108.54 | 4.79% |
| 69 | 0800–1630 | 23.5 | 2,068,020 | 108.84 | 4.53% |
| 70 | 0800–1730 | 24.5 | 2,075,280 | 109.23 | 4.18% |
| 71 | 0730–1600 | 23.0 | 2,079,110 | 109.43 | 4.01% |
| 72 | 0800–1700 | 24.0 | 2,081,600 | 109.56 | 3.89% |
| 73 | 0830–1630 | 23.0 | 2,083,790 | 109.67 | 3.80% |
| 74 | 0730–1630 | 23.5 | 2,097,470 | 110.39 | 3.17% |
| 75 | 0730–1730 | 24.5 | 2,097,920 | 110.42 | 3.14% |
| 76 | 0830–1730 | 24.0 | 2,102,660 | 110.67 | 2.92% |
| 77 | 0830–1700 | 23.5 | 2,103,480 | 110.71 | 2.89% |
| 78 | 0730–1700 | 24.0 | 2,107,400 | 110.92 | 2.70% |
| 79 | 0900–1700 | 23.0 | 2,113,110 | 111.22 | 2.44% |
| 80 | 0900–1730 | 23.5 | 2,118,290 | 111.49 | 2.20% |
| 81 | 0800–1630 | 23.0 | 2,123,780 | 111.78 | 1.95% |
| 82 | 0800–1730 | 24.0 | 2,134,980 | 112.37 | 1.43% |
| 83 | 0800–1700 | 23.5 | 2,139,360 | 112.60 | 1.23% |
| 84 | 0730–1630 | 23.0 | 2,155,000 | 113.42 | 0.51% |
| 85 | 0730–1730 | 24.0 | 2,159,250 | 113.64 | 0.32% |
| 86 | 0830–1700 | 23.0 | 2,159,300 | 113.65 | 0.31% |
| 87 | Existing | 2,166,000 | 114.00 | 0.00% | |
Publisher’s Note: MDPI stays neutral with regard to jurisdictional claims in published maps and institutional affiliations. |
© 2022 by the authors. Licensee MDPI, Basel, Switzerland. This article is an open access article distributed under the terms and conditions of the Creative Commons Attribution (CC BY) license (https://creativecommons.org/licenses/by/4.0/).
Share and Cite
Al-Sabahi, M.H.; Ismail, M.A.; Alashwal, A.M.; Al-Obaidi, K.M. Triangulation Method to Assess Indoor Environmental Conditions and Occupant Comfort and Productivity towards Low Energy Buildings in Malaysia. Buildings 2022, 12, 1788. https://doi.org/10.3390/buildings12111788
Al-Sabahi MH, Ismail MA, Alashwal AM, Al-Obaidi KM. Triangulation Method to Assess Indoor Environmental Conditions and Occupant Comfort and Productivity towards Low Energy Buildings in Malaysia. Buildings. 2022; 12(11):1788. https://doi.org/10.3390/buildings12111788
Chicago/Turabian StyleAl-Sabahi, Mohammed Hatim, Muhammad Azzam Ismail, Ali Mohammed Alashwal, and Karam M. Al-Obaidi. 2022. "Triangulation Method to Assess Indoor Environmental Conditions and Occupant Comfort and Productivity towards Low Energy Buildings in Malaysia" Buildings 12, no. 11: 1788. https://doi.org/10.3390/buildings12111788
APA StyleAl-Sabahi, M. H., Ismail, M. A., Alashwal, A. M., & Al-Obaidi, K. M. (2022). Triangulation Method to Assess Indoor Environmental Conditions and Occupant Comfort and Productivity towards Low Energy Buildings in Malaysia. Buildings, 12(11), 1788. https://doi.org/10.3390/buildings12111788