Abstract
Harsh climatic conditions in the Nordic countries are being worsened by climate change, which increases the moisture load on building façades. New types of defects are being observed in air cavities in well-designed and well-built wooden façades and roofs. More knowledge is required on the microclimatic conditions in air cavities and roofs, and their implications for organic growth and biological deterioration. The present study collects and presents sensor data from three buildings in Norway. Collected air temperature, air humidity, and wood moisture data are compared to mould growth criteria found in scientific literature, building physics software, and national and international standards. The data shows great differences in air cavity microclimates between the case buildings and between different sensor positions within the instrumented air cavities. Air cavity temperatures are found to be lower than exterior temperatures for a substantial portion of the time. For tall buildings, the vertical positioning of a sensor influences the data more than the orientation of the façade. All three buildings feature monitoring positions with both acceptable and critically high levels of moisture to indicate mould risk. There is great variation in the estimated risk of mould growth according to the different criteria. The study indicates that the coastal climate in the south-west of Norway presents a challenge in terms of resilient building design to avoid mould growth in the ventilated air cavity.
1. Introduction
Building façades and roofs serve to protect the building structure from all types of weather year-round. Their long-term durability is therefore a major concern. To assess the requirements of durability, it is necessary to know which climatic parameters the materials will be exposed to throughout their design lifetime. In the Nordic countries, the exterior climate is harsh, with strong winds, wind-driven precipitation, freeze-thaw cycles, and large and frequent temperature fluctuations, often in varying combinations [1]. With climate change, the climate is expected to involve increased temperatures and precipitation levels [2]. Façades will thus be exposed to even more harsh weather through their lifetimes. In the Nordic countries, wood as a building material sees widespread usage, being used in load-bearing structures, as well as façade elements. The need for climate change mitigation has also led to an increase in the use of cross-laminated timber (CLT) structures [3] and solar panels integrated as roofing and façade materials (BIPV) [4].
To protect the underlying structure from weather exposure, façades and roofs in the Nordic climate are commonly built according to the principle of dual-barrier weatherproofing, also known as “two-stage weatherproofing” [5]. The exterior barrier is the cladding, which functions as a rain barrier. The inner barrier is the water-repellent but vapour permeable wind barrier, which permits drying of the structure. Between the two barriers is a ventilated air cavity for moisture removal through drainage and ventilation drying [6,7]. Since the air cavity is ventilated to the exterior air at the top and bottom, as well as through any open joints in the cladding, the exterior climate will greatly affect the microclimate of the air cavity. However, the correlation between the exterior climate and cavity microclimate has not been adequately investigated for a Nordic climate, as documented in a recent literature review [5]. The term “microclimate” is understood as the set of climatic conditions within a limited area, that may differ from those of the surrounding area [8]. Relevant microclimate parameters involve temperature and moisture conditions; rain intrusion; air flow characteristics; and how these parameters behave in relation to those of the exterior climate [5]. Theoretically assessing the microclimate is a complex challenge, although the governing equations are known [9]. Simplified models used in commercially available building physics software tend to underestimate the moisture conditions by overestimating drying rates [10]. In Nordic climates in particular, this tendency could result in hazardous conditions going unnoticed. Therefore, field studies are necessary to investigate and validate the microclimatic conditions of ventilated façades.
Wood is an organic material that needs to be protected from biological degradation to achieve a long service life, but it is otherwise resistant against other forms of degradation [11,12]. An increase in building defect cases involving wooden façades is now observed in certain parts of Norway [13,14], with battens rotting while the cladding has remained intact. The façades are designed and built according to principles traditionally considered to be sound [15], which suggests that unexpected microclimatic conditions in the air cavity may be the cause of the observed defects. The microclimate assumed during the design appears to underestimate the potential for organic growth. The growth of microorganisms is a well-known hazard for wood structures, and while there is no general agreement over the exact parameter thresholds where it occurs [16], it is well known that the combination of high moisture loads and moderate temperatures over time facilitates a high risk of mould growth. A previous literature review concluded that there is a lack of available research literature documenting the microclimatic conditions in air cavities using dual-barrier weatherproofing applicable for long-term durability assessments [5]. Existing studies on the topic have largely approached the subject in different ways, in measuring different parameters or using very different wall or roof assemblies. Hence, the studies cannot be directly compared, and it is not feasible to draw any general conclusions about cavity microclimates from the literature [5].
Evidently, it is essential to chart the microclimatic conditions of ventilated wooden façades and roofs in a Nordic climate and analyse the risk of biological degradation. Considering this general need, the present study investigates the following research questions:
- What moisture and temperature conditions may be expected in ventilated air cavities behind façade cladding and roofing?
- What is the risk of mould growth in façades and roofs featuring dual-barrier weatherproofing?
The following limitations apply to the research: The studies have been conducted on three buildings in two climate zones in Norway. Two of the buildings are situated in a climate zone where challenging conditions have been reported. The last building is a reference building monitored in detail as a research laboratory.
The measurement series extend over two years for the reference building and one year for the two others. The buildings are relatively new at the start of measurements or have recently had their façade refurbished. Thus, built-in moisture may affect the results to some degree.
Two of the buildings are inhabited dwellings in ordinary use and have not been designed or modified to facilitate research, nor is the use of the buildings affected by the measurements. The reference building is heavily monitored for research purposes but is otherwise an office building in daily use [17].
Sensors were not placed in the buildings with the present study in mind. All sensors were mounted in untreated wood commonly used in wooden façades, either in the battens of the façade in question, or in a separate piece of construction lumber attached to the battens.
The study measures temperature and humidity in the cavity air, as well as wood moisture. Other parameters of interest that were not monitored include: surface temperatures, air flow, and air pressure. Exterior climate was not monitored on site (except for the reference building) but was retrieved from nearby meteorological weather stations. Local climate variations may therefore be a source of uncertainty.
It is not deemed to be within the scope of the study to evaluate the design or workmanship of the case buildings.
2. Theoretical Framework
2.1. Air Cavities
Roofs and façades must work as a climate barrier against the varied exterior climate, while facilitating a healthy and comfortable indoor climate [18]. To ensure this function, heat and moisture must either be prevented from entering the structure or be continuously removed [19]. Ventilated façades and sloped roofs made of wood are a commonly used building principle to achieve this in the Nordic countries [15]. These buildings use the principle of dual-barrier weatherproofing, also known as “two-stage weatherproofing” [5], wherein the exterior cladding functions as a rain screen while a vapour permeable wind barrier layer permits the structure to dry outwards [20]. These layers are separated by an air cavity that facilitates ventilation and drainage. The air cavity is continuous through the façade and ventilated to the outdoor air at the bottom and top of the walls and roofs. The principle of dual-barrier weatherproofing is illustrated in Figure 1. Weatherproofing façades, roofs, and structural transitions using dual barriers has proven to grant effective and long-lasting protection against wind-driven rain [21].
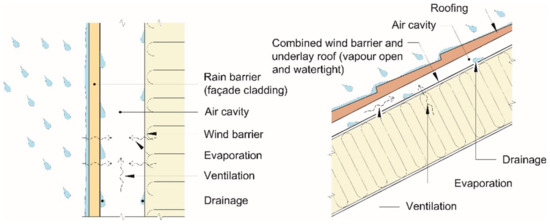
Figure 1.
The principle of dual-barrier weatherproofing [5].
The cladding forms the exterior layer of the façade and acts as a rain barrier that keeps most of the precipitation away from the wind barrier layer. It also acts as a physical protection barrier for the inner wall assembly. The cladding needs to withstand the climatic and mechanical stresses of the weather and allow expansion and contraction due to temperature and/or moisture. The cladding also protects the wind barrier from disintegration by solar UV radiation. Lastly, the cladding is also important for the aesthetic expression of the façade [21].
The air cavity between the cladding and the wind barrier is open to the exterior air at the top and bottom so that air flows can pass through the cavity and provide ventilation [22]. The purpose of the air cavity is [13,20]:
- To work as a capillary break between the rain barrier and the wind barrier, so that wind-driven rain that soaks the rain screen cannot transfer through to the inner wall assembly by capillary action.
- To provide drainage for water that penetrates the rain screen.
- To remove excess moisture from the inner wall assembly and the interior side of the cladding through ventilation drying, to prevent mould growth and rot.
For sloped roofs, the air cavity also serves to remove heat and interrupt thermal conduction through the roof assembly, to prevent the melting of snow on the roof. Snowmelt can re-freeze on roof overhangs or in roof gutters [23], which may cause leaks, the deterioration of roof components, and hazardous ice formation [24,25]. The necessary air cavity width to prevent snowmelt is usually significantly larger than what is necessary to achieve ventilation drying [23].
The wind barrier layer forms the inner surface of the air cavity. This layer needs to act as a wind break, to prevent cold exterior air from permeating the insulation layer and compromising its insulation properties. It must also act in tandem with the inner vapour barrier, to prevent the leakage of (warm, humid) interior and (cold) exterior air through the roof or wall assembly. The wind barrier surface must be water-repellent to ensure that water that penetrates the rain screen will be drained through the lower opening of the air cavity rather than soaking the inner wall assembly. If the façade is greatly exposed to wind-driven rain, it is recommended that the wind barrier should be as vapour permeable as possible, so that moisture has the ability to dry outwards [21].
For the ventilated façade to achieve the functional requirements, the air cavity must be designed according to its annual wind-driven rain load, other local climate conditions, the type of wall assembly, and the type of façade cladding [13]. Building design guides recommend different minimum cavity widths for different types of cladding, from 19 mm for horizontally oriented wood siding boards, to 55 mm for vertical siding boards [13]. For horizontal siding boards and façade panels, the air cavity is formed by placing vertical battens between the wind barrier layer and the cladding. For a vertical siding board, which requires horizontal mounts, cross battens are mounted horizontally on the vertical battens and the cladding is attached to these.
For ventilated sloped roofs, the minimum roof angle should be 6° [26], but roof angles are recommended to be greater than 10–15° to ensure sufficient drainage and watertight perforations [27]. The roof has a ventilated air cavity underneath the roofing [22], where roof panels may be mounted directly onto longitudinal battens, and roof tiles are mounted on additional, horizontal tile battens. This also allows air flows across the roof. Roofs may be ventilated from the eaves to the ridge, or from eaves to eaves.
2.2. Parameters That Affect the Cavity Climate
The microclimate of the air cavity is affected by several factors of heat and moisture transport. Heat transfer in the air cavity (Figure 2) will to a large degree be determined by solar radiation and the temperature of the air ventilated into the cavity, but may also be affected by thermal conduction from the interior side, heat transfer due to moisture (condensation/evaporation), and thermal conduction through the cladding.
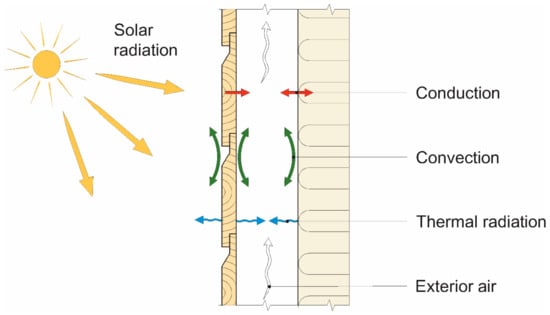
Figure 2.
Heat transfer mechanisms in an air cavity. Figure drawn based on physics described by [28].
The ventilation of an air cavity is typically expressed as an air change rate—the hourly number of air exchanges between the cavity and the exterior air [29]. The driving force of the air flow is a combination of the stack effect and pressure differences across the air cavity [13]. The stack effect is caused by temperature differences between the air cavity openings (natural convection) [30]. It is to a large degree determined by the amount of incident solar radiation on the façade [31]. Pressure differences across the air cavity are caused by wind acting on the façade (forced convection) [30]. Key parameters to calculate this wind-driven ventilation are, among others, the wind velocity and the difference in air pressure coefficients, cp, at the two air cavity openings [32]. Furthermore, the building’s geometry, the local topography, the placement and size of the air cavity openings, the air cavity dimensions, the surface roughness of the air cavity, the permeability of the cladding, temperature, and the Reynolds number of the air cavity all contribute [30]. The air flow is also affected by the pressure loss through the air cavity, which reduces the driving force of pressure differentials. The pressure loss is a combination of losses at the cavity inlet and outlet, air flows around battens (local losses), and friction losses against the cavity surfaces [32].
Ventilation of the air cavity ensures the continuous removal of humid air, so that less humid air can flow in and provide drying of the rear wall and the interior side of the cladding. This type of drying is called “ventilation drying” and is of key importance to moisture control in the air cavity and the surrounding materials. Adequate drying will protect organic matter from moisture defects. The drying rate in the air cavity is closely correlated with the air flow rate. It is hence essential to know the temperature conditions, the air flow rate, and the driving force of the air flow to determine the ventilation drying of a wall assembly [33]. The importance of proper ventilation of the air cavity increases with higher insulation thicknesses, as the latter causes the relative humidity (RH) to increase, and thus the risk of mould growth in wooden structures. Ventilation is especially important for roofs and façades exposed to wind-driven rain [34].
Moisture transported into the air cavity and surrounding materials primarily originates from the exterior environment, in the form of precipitation and humid air entering through gaps in the cladding [35], or humid air entering through the openings of the air cavity [36]. Humidity in the air exists in the form of water vapour and is commonly expressed in terms of relative humidity (RH) [%] or absolute humidity (AH) [g/kg or g/m3]. Precipitation in the form of wind-driven rain is among the most severe climatic stress a façade may endure [37,38], and has become the focus of much research [35]. Lesser moisture sources include the drying of built-in moisture or leaks of humid indoor air through the wall assembly. To quantify the moisture transport in an air cavity, it is necessary to know the temperature profile through the air cavity. The temperature profile depends on the temperature of intake air and the thermal exchange between the surfaces of the air cavity [33].
The consequences of condensation may include moisture defects, mould, and rot. How a material stores heat and moisture, depends on its hygrothermal properties, which also determine its drying properties. The hygrothermal conditions of an air cavity are chiefly determined by the moisture and thermal flows of the air. Hygrothermal simulation programs are often used to analyse the moisture performance of building envelopes. These include the risk of mould growth. For ventilated façades and roofs, the ventilation rate in the air cavity is an important parameter [5,39].
2.3. Consequences of Air Cavity Climate
Inadequate ventilation of an air cavity may lead to insufficient and slow drying, bringing a risk of moisture defects, especially when combined with high air humidity levels, low sun exposure, and static air [13]. Moisture defects may foster mould growth and lead to indoor air quality issues [21]. Conversely, excessive ventilation may also cause moisture defects, by cooling the interior side of the cladding and increasing the risk of condensation. This may again lead to the growth of algae and black fungi [13].
The presence of mould in indoor air is associated with occupant discomfort and respiratory health problems including asthma [40,41,42,43]. In Norway, ventilated air cavities are located outside the airtight layers of the building envelope, so it is unknown as to whether mould growth in the cavities would present any health risk to building occupants. In the context of the present article, deterioration of building materials and risks to façade integrity are the primary concerns associated with mould growth.
Fungi that infect wood materials may be divided into two categories: rot and (blue, white, black) stain fungi [44]. Rot fungi creates enzymes that break down cellulose and lignin, deteriorating the structural properties of the wood. Stain fungi, as the name suggests, causes discolouration of the wood surface but does not affect its structural properties. Common stain fungi include mould (mildew) and blue stain fungi [44]. Certain species of mould may also release mycotoxins, which may cause allergic reactions in humans [45]. The presence of stain fungi on a surface is a typical indicator of high wood moisture levels, and that rot fungi may potentially develop. Common to all species of fungi is the need for moisture, air (oxygen and nitrogen), and nutrients such as biological construction materials over time to grow [21,46]. Fungi spreads through spores, which are ever-present in the air, or directly through infected materials [21,44]. Water is released as part of the fungal deterioration of wood, which the fungi may transport through mycelium to drier parts of the wood material, facilitating further growth [44]. If the fundamental growth conditions for fungi are met, the growth rate will be determined by whether microclimatic conditions such as temperature and relative humidity (RH) remain within the fungi’s tolerance limits over time [21,46,47]. Once a fungal infection has taken hold, its spread may occur at lower RH levels than what was required to initiate the growth in the first place [36]. It is therefore essential to dry the structure during the construction phase, quickly enough that fungal infections on surfaces do not have time to develop [48].
Determining the exact conditions required for fungal growth in wood to be initiated and spread is a complex and difficult task. It is also dependent on the species of fungus [36,44,46]. Several studies have been conducted trying to determine the threshold of fungal growth, drawing different conclusions. A literature review by Gradeci et al. [16] systematically compares criteria and models for mould growth in wood-based materials. A key output of the study is a combination of mould growth criteria curves, among others, Clarke et al. [49], Johansson et al. [50], Biohygro-thermal [51,52], Mould Germination Graph (MGGM) [53,54,55] and the m model [56]. Gradeci et al. also presents a selection of mould growth criteria from national and international standards [16].
The VTT mould growth model [57,58,59,60,61,62,63], which is used by the simulation program WUFI Mould Index VTT [64] is also mentioned by Gradeci et al. [16]. The VTT program is based on a mathematical empirical model based on laboratory measurements of mould growth on pine and spruce [57,59,60], and further developed to include more materials [61,62,63]. The model predicts a mould growth index as a function of the surface material, temperature, relative humidity (RH), and time. The mould growth index indicates the probability of mould growth activity on a scale from 0 to 6, where the value reflects the predicted amount of mould growth on the surface [59].
The criteria for mould growth include temperature, RH, and wood moisture content. The wood moisture content is defined as the relation between the weight of the moisture in the wood and the dry weight of the wood, expressed as a percentage (weight-%) [46]. Wood moisture is the sum of free water in the pore cavities and bound water in pore walls [46]. The minimum wood moisture content required to initiate mould growth is found to vary considerably, from 20 weight-% [36,44,45,46,48], 28–30 weight-% [36], down to 16–18 weight-% for more vulnerable wood products such as chip boards [45]. Optimal growth conditions for most types of fungi occur at slightly higher levels of wood moisture.
The wood moisture content is greatly affected by the moisture of the surroundings since wood is a hygroscopic material. It will absorb and release moisture to the surrounding air, depending on its temperature and relative humidity [46]. Following long exposure to a given temperature or RH, the wood moisture content will stabilize around equilibrium moisture content for the local microclimate [46].
3. Methods
3.1. Instrumentation of the Case Buildings
The case buildings for this study are designated Fjogstad-Hus (residential), Norgeshus (residential), and the ZEB Laboratory (office/laboratory) and are all located in Norway, as shown in Figure 3. Sensors are mounted into pieces of untreated wood in the façade air cavities of the three buildings, as well as the roof air cavity of the ZEB Laboratory. The sensors, OmniSense S-160, measure temperature [°C] (±0.3 °C), RH [%] (±2%), og AH [g/kg] of the cavity air, as well as wood moisture content [weight-%]. For Fjogstad-Hus and Norgeshus, sensor data for one year is retrieved, while the ZEB Laboratory has two years of data. All data has a temporal resolution of one hour. The locations of the sensors in the three buildings are shown in Table 1 and in Figure 4, Figure 5 and Figure 6, and further described in the instrumentation reports [14,65] and a M.Sc. thesis [66]. All buildings are assessed in the instrumentation reports to be designed according to sound principles and well-constructed; and the principle of dual-barrier weatherproofing is followed. Fjogstad-hus is clad in white-painted, horizontal wood siding boards and a 23 mm air cavity. Norgeshus has a cladding consisting of white-painted, vertical wood siding boards and a 59 mm air cavity. The ZEB Laboratory features building integrated photovoltaic (BIPV) panels on the south, east, and west façades and on the roof (which is sloped at 32 degrees and faces south); and vertical, black-coloured wood siding boards on the north façade. The air cavity is 111 mm wide for all façades and 126 mm for the roof.
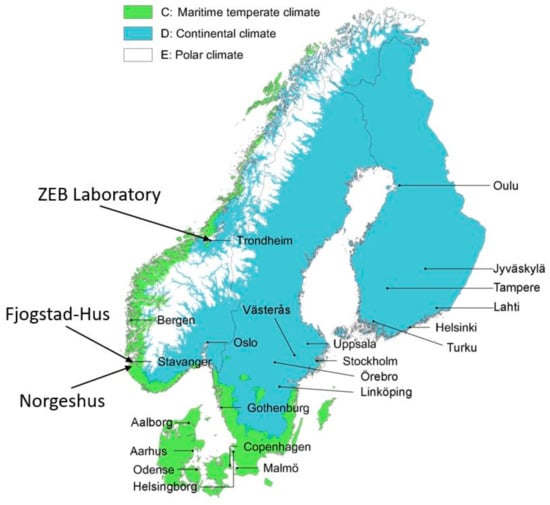
Figure 3.
The location of the case buildings on a climate classification map of the Nordic countries according to the Köppen-Geiger classification system. All cities above 100,000 inhabitants are marked. Figure based on [67], used with permission.

Table 1.
The sensor positions in the case buildings.

Figure 4.
Sensor positions for Fjogstad-hus.
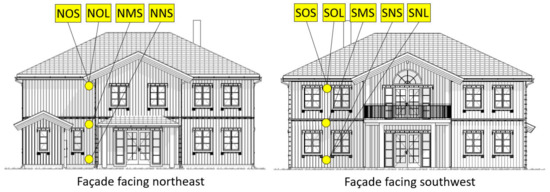
Figure 5.
The sensor positions for Norgeshus.
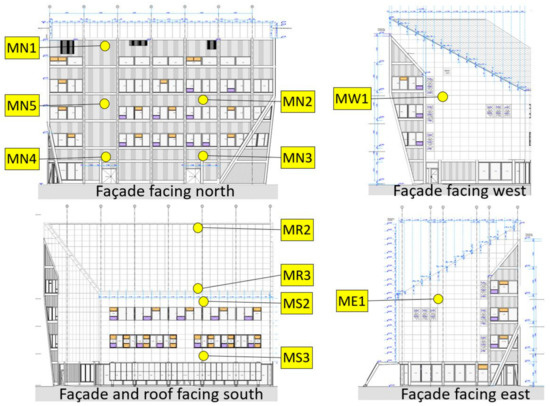
Figure 6.
The sensor positions for the ZEB Laboratory.
3.2. Exterior Climate Data
Measured climate data of the exterior climate in South-west Norway is retrieved from the database of the Norwegian Centre for Climate Services (NCCS), “SeKlima” [68]. The climate data for Trondheim is retrieved from SINTEF’s weather station next to the ZEB Laboratory but is complemented with precipitation measurements retrieved from SeKlima.
3.3. Correction Formulas
To correct for the different conductivity of different wood types, measurements from wood moisture sensors must be corrected according to correction curves for the individual wood species. The curves are based on a comparison between measured wood moisture and gravimetric measurements [69]. The correction curve for correcting sensor data for Norway spruce is described by Equation (1) [69].
3.4. Mould Growth Criteria
Two fitted curves are made based on a combination of the mould growth criteria collected by Gradeci et al. [16], seen in Figure 7. The lower curve is based on the most conservative criteria for the onset of mould growth found by Gradeci et al. for any given temperature. As such, it combines the mould growth criteria described by Johanson et al. [50] for low temperatures, the ESP-r A model [49] for low-medium temperatures, the Mould Germination Graph (MGGM) [53,54,55] for medium-high temperatures, and the m-model [56] for the highest temperatures in the analysed temperature range. The upper curve is more risk tolerant, being constructed from the least strict mould growth criteria Gradeci et al. [16] analysed. This curve is based on LIM II (biohygro-thermal) [51,52] for lower temperatures and Johanson et al. [50] for higher temperatures. The MGGM model was not used to construct the upper curve because it is divergent and discontinuous from the other curves and would only be applicable in a very narrow temperature interval (approx. 10–13 °C). Using both a conservative and a risk tolerant curve for analyses, measured data can be compared to a wide range of criteria for the onset of mould growth. The fitted curves are used as limit values, one conservative where mould growth may occur, and one risk tolerant wherein all models agree mould growth would occur if exceeded for long enough, to analyse for how much of the time the sensors measure critical moisture and temperature conditions.
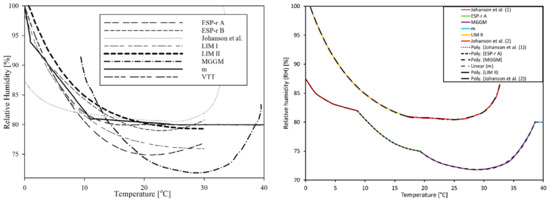
Figure 7.
Adaptation (right) of different criteria graphs for the onset of mould growth, collected by Gradeci et al. [16] (left). Original image used with permission. Note that the numbers (1) and (2) in the legend refer to different parts of the same curve seen in the left-side image, that correspond to the upper or lower graph depending on temperature range.
3.5. VTT Parametric Study
The VTT mould growth model was chosen to analyse the data as it is a commonly used and verified mould growth model [70], and easily accessible as an add-on to the WUFI software. WUFI Mould Index is used to conduct an analysis of whether the sensor data indicate conditions for the onset of mould growth in the air cavities of the three buildings. For this analysis, the material parameters in the simulation program are identical and conservative, so that the climate is the only variable between the analyses. Thus, the data from all sensors are compared on equal terms, and the simulations are unlikely to underestimate the mould growth potential. The set material parameters are described in Table 2. The VTT parametric study outputs a mould growth indicator on a scale from 0 to 6, where the value reflects the predicted amount of mould growth on the surface [59].

Table 2.
Parameters for the WUFI VTT simulations.
3.6. Other Analyses
Since the mould growth criteria vary to such a large degree [16], it is chosen to conduct four additional, analyses of how the measured temperature and moisture conditions correlate to different, simplified mould growth criteria. This way, each set of sensor data can be analysed using several different methods, creating a more comprehensive understanding of mould growth risk for each sensor position.
The first analysis concerns the number of hours wherein the sensors have measured critical wood moisture content values, as described in Section 2.3.
Second, critical air RH values are analysed in a similar way. The critical relative air humidity (RHcrit) is determined from Equation (2) [58], wherein T denotes the air temperature. [°C]. RHcrit,min is set to 80%, as is typical for moisture-sensitive materials such as wood.
Third, an analysis is performed counting the number of hours wherein RH and temperature meet different criticality criteria for mould growth. For these criteria, RH and temperature are not co-dependent, but standard minimum values. The criteria presented here will cover most of the minimum criteria mentioned in Tables 5 and 6 in Gradeci et al. [16]. In addition, they cover the national and international standard criteria for mould growth presented in Table 8 in Gradeci et al. [16].
- Temperature ≥ 0 °C and RH 80–85%
- Temperature ≥ 0 °C and RH 85–90%
- Temperature ≥ 0 °C and RH 90–95%
- Temperature ≥ 0 °C and RH 95–100%
- Temperature ≥ 5 °C and RH 80–85%
- Temperature ≥ 5 °C and RH 85–90%
- Temperature ≥ 5 °C and RH 90–95%
- Temperature ≥ 5 °C and RH 95–100%
A final analysis counts the hourly measurements of air cavity temperatures, compared to exterior air temperatures.
4. Results
4.1. Temperature, RH, and Wood Moisture
The climatic parameters of air temperature, air RH, and wood moisture of the air cavities of the three case buildings are presented as box plots in Figure 8, Figure 9, and Figure 10, respectively. The cross in the box plot represents the average value, while the horizontal line shows the median. The height of the boxes spans between the 25th and the 75th percentile of the data (the interquartile range). The upper whisker spans the 75th percentile +1.5 times the interquartile range, the lower whisker spans the 25th percentile −1.5 times the interquartile range. Outlying data points are plotted outside the whiskers. While the average air temperature for the three locations is very similar, they exhibit very different moisture conditions. In South-west Norway, the range of cavity air temperatures is smaller and relative humidity generally higher than in Trondheim, but the ZEB Laboratory displays a greater variance in wood moisture content. Notably, for all locations, more outliners are found for higher temperatures, lower relative humidity, and higher wood moisture content than the opposite.
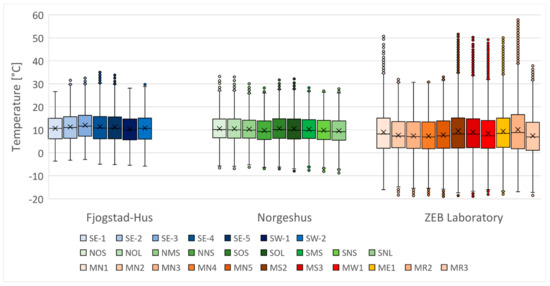
Figure 8.
The measured cavity air temperatures in the three case buildings.
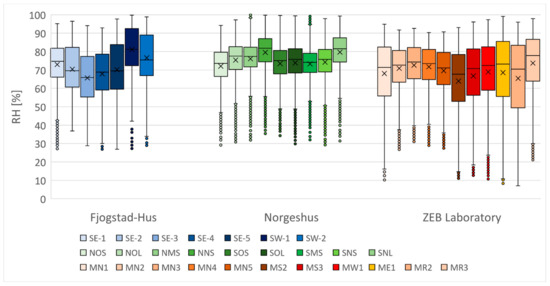
Figure 9.
The measured cavity air relative humidity (RH) for the three case buildings.
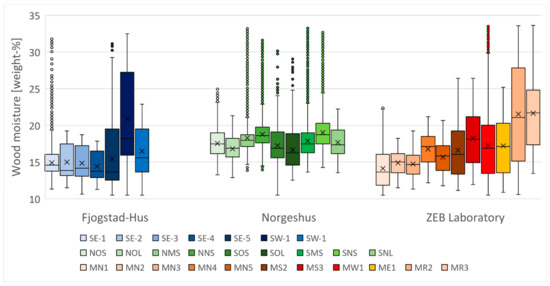
Figure 10.
The measured wood moisture content in the air cavities of the three case buildings.
Table 3 shows the maximum and minimum temperatures recorded at each site. Air cavity temperatures were retrieved from the sensors. For Fjogstad-Hus and Norgeshus, exterior air temperatures were retrieved from the database of the Norwegian Climate Service Center [68], while for the ZEB Laboratory, exterior climate was measured on-site. It is notable that for each of the site, a lower minimum air temperature was recorded in the cavity than in the exterior air. The ZEB Laboratory displays substantially higher maximum temperatures in the air cavity compared to the exterior air, and this may be because the building façade is very dark and thus absorbs more solar radiation.

Table 3.
The maximum and minimum temperatures measured in the air cavity of each building, and the highest and lowest recorded exterior air temperatures.
Correlation values between pairs of sensors that belong to the same group, or are otherwise related, are presented in Table 4. There is a generally high correlation between data series in the same positions. The outlier in the MN (ZEB Laboratory north façade) series is MN1, which is located high up on the wall. Compared to the rest of the sensors, it has lower correlation with the data from other sensors and with the exterior air temperature. The same can be seen for MR2 and MS2, located near the top of the roof and the south wall, respectively.

Table 4.
A pairwise correlation between sensor data series. The “series” SEA is the average of the four series SE-1 to SE-5. Likewise, MNA is the average of MN1 to MN5. “Ext.” is the external temperature measured on site of the ZEB Laboratory.
The correlation between cavity air temperatures and exterior air temperature is generally high. Neither Fjogstad-Hus nor Norgeshus has weather monitoring on-site, yet both see reasonably high correlation with the temperature data from the closest public weather stations.
4.2. Mould Growth Criteria
A scatter plot of the air cavity and air RH measurements from each sensor has been overlaid the fitted curves created from the results of Gradeci et al. [16] to create a visual summary of the mould growth conditions for each sensor location. An example is shown in Figure 11. The point cloud contains approximately 17,500 data points collected by the sensor. The intention of the figure is not to show the individual points, but to display the range of measured conditions. For brevity, the rest of the visual summaries are contained in the File S1 for this article. The share of measurements exceeding the upper and lower graphs in Figure 7 is instead summarized with the results of the simplified analyses in Table 5. For every sensor location, a significant percentage of the measurements (14–52%) exceed the lower curve. A smaller, yet notable percentage of the measurements also exceed the upper curve, in theory signalling a risk of mould growth according to even the strictest criteria collected by Gradeci et al. [16]. However, it should be noted that the data does not have a time component and does not consider the continuous duration of the periods wherein mould risk occurred.
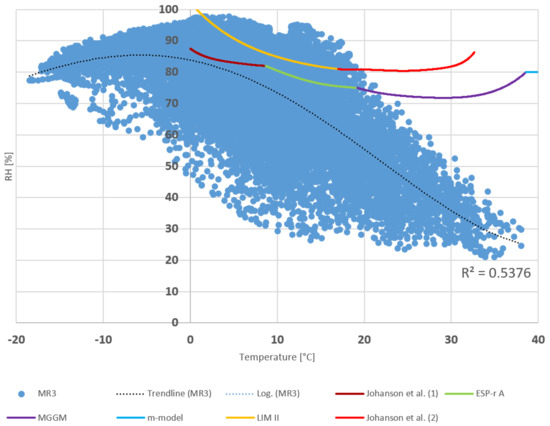
Figure 11.
An example of visual summary of mould growth conditions for a sensor, here exemplified by the lower roof sensor on the ZEB Laboratory. A “trend line” is created to show the distribution of typical RH values for every temperature. Note that a substantial share of the data points exceed the criteria for the onset of mould growth, collected by Gradeci et al. [16]. This share for every monitoring point is summarized in Table 5.

Table 5.
Results of the curve fitting analysis and the simplified mould growth criteria analysis. The analyses are separated by colour for legibility.
The results of the WUFI VTT parametric study are summarized alongside other analysis results in Table 6. The development of the mould growth index for the ZEB Laboratory is shown in Figure 12. For this analysis, the values displayed in Table 6 correspond to the peak values of the curves seen in Figure 12. The results of the other analyses described in Section 3.4 are also shown in Table 5 and Table 6.

Table 6.
A share of measurements [%] exceeding various criteria for mould growth for every sensor. The VTT parametric study results for each sensor are also shown in the right column. The analyses are separated by colour for legibility.
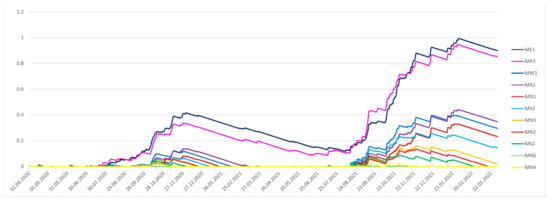
Figure 12.
Development of the VTT Mould Growth Index for the ZEB Laboratory.
The wood moisture measurements show three clear outliers: Sensors SW-1, MR2, and MR3 all have significantly higher periods of wood moisture content > 25% than the other sensors. However, sensors MR2 and MR3 display much lower levels of air humidity (as seen in Table 5), and on-site inspection suggests that the high moisture levels are caused by rain intrusion. Conversely, SW-1 displays consistently higher RH levels, which indicates a much higher mould growth potential as seen in the VTT analysis. The outlier sensors in the ZEB Laboratory score < 1 in the mould growth index, while SW-1 achieves an index value close to 5. It is worth noticing that the wood moisture measurements and the VTT mould growth index do not correlate substantially, as illustrated by for instance sensors SW-2 and MS2. While the two display quite similar values of wood moisture content distribution, MS2 has a mould growth index score of 0.09 while SW-2 reaches 4.02.
Figure 13, Figure 14 and Figure 15 show the difference between air cavity temperatures measured at Fjogstad-Hus, Norgeshus, and the ZEB Laboratory, respectively. The ZEB Laboratory features a dark cladding (charred wood), while the other two buildings are painted white. The ZEB Laboratory exhibits a larger share of measurements wherein the cavity air temperature is lower than the exterior, than the two others, but also a higher share of significantly higher temperatures in the cavity than the exterior. However, it should be noted that the exterior air temperature at the ZEB Laboratory is measured on-site, while the other two locations have exterior temperatures retrieved from nearby meteorological stations.
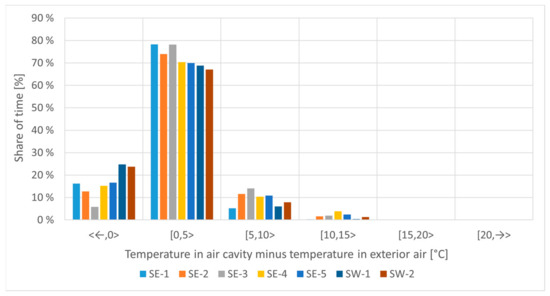
Figure 13.
The difference between air cavity temperature and exterior temperature, Text, for Fjogstad-Hus. Exterior temperature retrieved from Stavanger–Våland weather station, situated 5.23 km away.
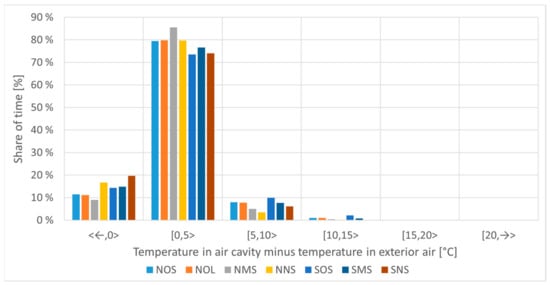
Figure 14.
The difference between air cavity temperature and exterior temperature, Text, for Norgeshus. Exterior temperature retrieved from Obrestad fyr weather station, situated 5.04 km away.
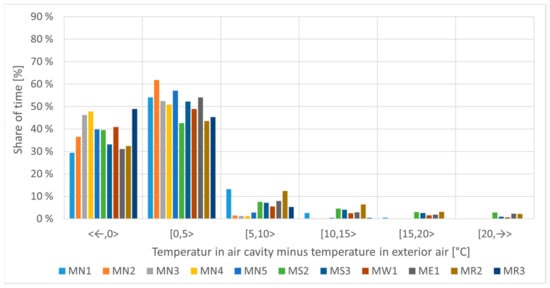
Figure 15.
The difference between air cavity temperature and exterior temperature for the ZEB Laboratory. Exterior temperature is measured on-site.
5. Discussion
5.1. Expected Microclimate in the Air Cavity
The measurements indicate that the temperature of the air cavity correlates largely within a few degrees of the exterior air, and that the cavity air temperature may be colder than the exterior air temperature a significant percentage of the time. This tendency was also reported by sources found in literature [22,66,71]. However, the difference between the climate zones is substantial, with the ZEB Laboratory experiencing colder cavity air temperatures than the exterior air 29–49% of the time, while the cavities in South-west Norway exhibit colder temperatures only 6–25% of the time. As the temperature in the air cavity decreases in comparison to the exterior air, the relative humidity increases. Conversely, however, higher temperatures in the cavity air than the exterior air are also common, and higher temperatures increase the risk of mould growth (up to around 40 °C). For the north-facing façade of the ZEB Laboratory, the share of hours with lower cavity temperatures than the exterior air is largest at the bottom of the façade (MN4), and lowest at the top (MN1). Similar behaviour was documented by Viljanen et al. [72] The same is true of the south-facing façade, but the roof (sloped at 32 degrees, facing south) exhibits the opposite behaviour.
The air cavity experiences greater annual temperature amplitudes than the exterior air, with cavity air temperatures sometimes being significantly higher than the exterior. This is seen to a greater degree in the ZEB Laboratory than the other two buildings. It is not known whether this is because of geographical variations, or because the building has a darker cladding than the others.
Cavity air temperatures may also be even colder than the coldest recorded exterior temperatures, although the difference is negligible for the ZEB Laboratory, where exterior and cavity temperatures are recorded at the same site. Local temperature differences may distort the data for the other two locations.
The measured cavity air temperatures appear to be more influenced by the vertical position of the monitoring points than the orientation of the façade. For a tall building such as the ZEB Laboratory, this effect is significant, with the higher monitoring positions on the façade and roof displaying temperatures much higher than the monitoring positions lower on the same wall. The top sensor on the north façade displays a maximum temperature 20 °C higher than the lowest sensor on the same façade. This maximum temperature is only 1 °C lower than the maximum temperature recorded on the sun-exposed south façade, whose top sensor is placed one floor below due to the shape of the building. As described by Sandberg and Mosfegh, the flow of heated air in an air cavity is complex and the temperature may vary depending on the placement of the sensor in the cavity [73]. Little correlation is observed between wood moisture content and the humidity of the exterior air. For all monitoring positions presented in this study, data completeness is very high (>95%). It is therefore unlikely that conditions may have occurred in a way that would change the conclusions without being picked up by the sensors.
5.2. Risk Assessment of Mould Growth
The study has used three different models to evaluate the risk of mould growth and compared the sensor data to three different constant criteria for mould growth risk. All monitoring positions can be considered to experience critical conditions parts of the time, according to one or more of the methods and criteria. However, some monitoring positions stand out according to all criteria and may be considered highly at risk of organic growth and decomposition.
The various methods indicate different levels of risk for every monitoring position; this may be because most of the methods lack a time component to evaluate whether a critical limit is exceeded for extended durations—allowing mould growth to occur—or whether it happens too sporadically to be a problem. The duration of exposure required for mould growth to occur is difficult to predict and depends on multiple factors, including temperature, humidity, presence of liquid water, and the type of wood [74].
There is great variation in the indicated mould growth risk, even between monitoring points located close apart within the same façade. A prominent example is that of sensors SNS and SNL in Norgeshus, which are mounted in almost the same position but attached to different battens. In façades featuring open joints, the problem can be exacerbated by rain intrusion. A recent study indicates that substantial localized rain intrusion may occur in façade joints even when following the specifications of national recommendations [35].
Some monitoring positions indicate very high levels of mould growth risk. Both monitoring positions on the south-west façade of Fjogstad-Hus show high levels of moisture and appear vulnerable according to most criteria. Both may be considered critical, but SW-1 is outstandingly so. It is not within the scope of the present study to investigate why the moisture conditions are so high, but it is evident that some form of control of the wall ought to be performed. The adjoining façade of the same building, facing south-west, exhibits substantially lower risk of mould growth compared to the south-west façade. An in-depth analysis of these or similar façades and their response to the climatic conditions may be the subject of a future study. Overall, the climatic conditions of South-west Norway appear to present a challenge for wooden façades, which is expected to be exacerbated by climate change, warranting further study.
6. Conclusions
Three buildings have been investigated in two different climatic zones of Norway. The microclimate of air cavities behind ventilated façades and roofs varies greatly, not just according to their geographical positioning, but also the orientation of the façade/roof and the elevation of the monitoring points. Each monitoring point exhibits great variety of cavity temperatures and moisture levels throughout the monitoring period. The cavity air temperature is found to be lower than the exterior temperature a substantial portion of the time, more so in Trondheim than in South-west Norway. The cavity air temperature may also be substantially higher than the exterior.
All monitoring positions exhibit a risk of mould growth according to one or several of the methods. There is great variation among the monitoring positions within each building. There is also great variation in the mould growth risk indicated by the different methods. The overall assessment is that conditions are more critical for mould growth in South-west Norway than in Trondheim, which implies a greater challenge to the resilient design of ventilated façades. The south-west façade of Fjogstad-Hus in particular shows alarming levels of moisture and should be controlled on site and possibly adjusted.
Future studies of the topic should aim to collect more data of air cavities in these and other buildings in the long term. A more overall understanding of the microclimatic challenges could be pursued by investigating more climatic parameters, notably air flow characteristics, cavity surface temperatures, or temperature distributions through the width of the air cavity. Exterior climate parameters of interest include windspeed, wind direction, wind-driven rain, and solar radiation. A future study could also incorporate several buildings within the same area. It is recommended to source exterior climate data locally using a weather station on-site, to improve the accuracy of comparisons between cavity and exterior microclimates. Inspection of the case buildings would also provide valuable input, to assess actual mould growth or uncovering other unknown factors influencing the long-term condition of the microclimate of the air cavity.
Supplementary Materials
The following supporting information can be downloaded at: https://www.mdpi.com/article/10.3390/buildings12101739/s1, File S1: Microclimate of air cavities—Data.
Author Contributions
Conceptualization, S.B.I., L.G. and T.K.; methodology, S.B.I., E.A., L.G. and T.K.; software: S.B.I.; validation: S.B.I. and T.K.; formal analysis, S.B.I.; investigation, S.B.I.; resources: L.G. and T.K.; writing—original draft preparation, S.B.I. and E.A.; writing—review and editing, S.B.I., E.A. and T.K.; visualization: S.B.I.; supervision, E.A. and T.K.; funding acquisition, L.G. and T.K. All authors have read and agreed to the published version of the manuscript.
Funding
Please add: This research was funded by The Research Council of Norway through the following two projects: SFI Klima 2050, grant number 237859, and Norgeshus–Verktøykasse for klimatilpasning av boliger, grant number 309400.
Institutional Review Board Statement
Not applicable.
Informed Consent Statement
Not applicable.
Data Availability Statement
Sensor data is available in the spreadsheet attached as Supplementary Materials to this article.
Acknowledgments
The authors would like to extend a thanks to CAD operators Remy Eik and Bjørnar Nørstebø at SINTEF, and to Berit Time (SINTEF) and Snorre Bjørkum (Norgeshus) for support.
Conflicts of Interest
The authors declare no conflict of interest.
References
- O’Brien, K.; Sygna, L.; Haugen, J.E. Vulnerable or Resilient? A Multi-Scale Assessment of Climate Impacts and Vulnerability in Norway. Clim. Chang. 2004, 64, 193–225. [Google Scholar] [CrossRef]
- Hanssen-Bauer, I.; Førland, E.J.; Haddeland, I.; Hisdal, H.; Mayer, S.; Nesje, A.; Nilsen, J.E.Ø.; Sandven, S.; Sandø, A.B.; Sorteberg, A.; et al. Klima i Norge 2100—Kunnskapsgrunnlag for Klimatilpasning Oppdatert i 2015; Norwegian Environmental Agency/Norwegian Climate Service Center: Oslo, Norway, 2015. [Google Scholar]
- Pierobon, F.; Huang, M.; Simonen, K.; Ganguly, I. Environmental Benefits of Using Hybrid CLT Structure in Midrise Non-Residential Construction: An LCA Based Comparative Case Study in the U.S. Pacific Northwest. J. Build. Eng. 2019, 26, 100862. [Google Scholar] [CrossRef]
- Gullbrekken, L.; Kvande, T.; Time, B. Roof-Integrated PV in Nordic Climate—Building Physical Challenges. In Proceedings of the 6th International Building Physics Conference, IBPC 2015, Turin, Italy, 14–17 June 2015; Elsevier Ltd.: Amsterdam, The Netherlands, 2015; Volume 78, pp. 1962–1967. [Google Scholar]
- Ingebretsen, S.B.; Andenæs, E.; Kvande, T. Microclimate of Air Cavities in Ventilated Roof and Façade Systems in Nordic Climates. Buildings 2022, 12, 683. [Google Scholar] [CrossRef]
- Svendsen, S.D. The Principle of One-Stage and Two-Stage Seals. In Proceedings of the International Symposium on Weathertight Joints for Walls, Oslo, Norway, 25 September 1967; pp. 298–301. [Google Scholar]
- Birkeland, Ø. The Mechanism of Rain Penetration; CIB Report No. 11; CIB: Oslo, Norway, 1967; pp. 33–34. [Google Scholar]
- Lexico Dictionaries. Microclimate, English, Meaning & Definition for UK English, Lexico Dictionaries–English. Available online: https://www.dictionary.com/browse/microclimate (accessed on 19 April 2022).
- Bouchair, A. Solar Induced Ventilation in the Algerian and Similar Climates. Ph.D. Thesis, University of Leeds, Leeds, UK, 1989. [Google Scholar]
- Van Belleghem, M.; Steeman, M.; Janssens, A.; De Paepe, M. Heat, Air and Moisture Transport Modelling in Ventilated Cavity Walls. J. Build. Phys. 2015, 38, 317–349. [Google Scholar] [CrossRef]
- Viitanen, H.; Vinha, J.; Salminen, K.; Ojanen, T.; Peuhkuri, R.; Paajanen, L.; Lähdesmäki, K. Moisture and Bio-Deterioration Risk of Building Materials and Structures. J. Build. Phys. 2010, 33, 201–224. [Google Scholar] [CrossRef]
- Brischke, C.; Bayerbach, R.; Rapp, A.O. Decay-Influencing Factors: A Basis for Service Life Prediction of Wood and Wood-Based Products. Wood Mater. Sci. Eng. 2006, 1, 91–107. [Google Scholar] [CrossRef]
- Bunkholt, N.S.; Time, B.; Kvande, T. Luftede Kledninger—Anbefalinger for Klimatilpasning; SINTEF Community: Trondheim, Norway, 2021. [Google Scholar]
- Gullbrekken, L.; Time, B.; Harboe, T.; Kvande, T. Trekledning—Instrumentering Av Luftede Trefasader Hos Fjogstad Hus; SINTEF Community: Trondheim, Norway, 2021. [Google Scholar]
- Edvardsen, K.I.; Ramstad, T.Ø. Trehus Håndbok 5, 4th ed.; SINTEF Akademisk Forlag: Oslo, Norway, 2018. [Google Scholar]
- Gradeci, K.; Labonnote, N.; Time, B.; Köhler, J. Mould Growth Criteria and Design Avoidance Approaches in Wood-Based Materials—A Systematic Review. Constr. Build. Mater. 2017, 150, 77–88. [Google Scholar] [CrossRef]
- Nocente, A.; Time, B.; Mathisen, H.M.; Kvande, T.; Gustavsen, A. The ZEB Laboratory: The Development of a Research Tool for Future Climate Adapted Zero Emission Buildings. J. Phys. Conf. Ser. 2021, 2069, 012109. [Google Scholar] [CrossRef]
- Säwén, T.; Stockhaus, M.; Hagentoft, C.E.; Bunkholt, N.S.; Wahlgren, P. Model of Thermal Buoyancy in Cavity-Ventilated Roof Constructions. J. Build. Phys. 2021, 45, 413–431. [Google Scholar] [CrossRef]
- Gullbrekken, L. Climate Adaption of Piched Wooden Roofs. Ph.D. Thesis, Norwegian University of Science and Technology, Trondheim, Norway, 2018. [Google Scholar]
- Kvande, T. Byggforskserien 542.003 Totrinnstetning Mot Slagregn På Fasader. Luftede Kledninger Og Fuger; SINTEF Community: Oslo, Norway, 2013. [Google Scholar]
- Lisø, K.R.; Kvande, T. Klimatilpasning Av Bygninger, 1st ed.; SINTEF Community: Trondheim, Norway, 2007; ISBN 978-82-536-0960-7. [Google Scholar]
- Bunkholt, N.S.; Gullbrekken, L.; Kvande, T. Influence of Local Weather Conditions on Ventilation of a Pitched Wooden Roof. J. Civ. Eng. Arch. 2020, 14, 37–45. [Google Scholar] [CrossRef]
- Gaarder, J.E. Byggforskserien 525.101 Skrå, Luftede Tretak Med Isolerte Takflater; SINTEF Community: Oslo, Norway, 2021. [Google Scholar]
- Blom, P. Venting of Attics and Pitched, Insulated Roofs. J. Therm. Envel. Build. Sci. 2001, 25, 32–50. [Google Scholar] [CrossRef]
- Andenæs, E.; Skagseth, V.A.; Bunkholt, N.S.; Kvande, T.; Lohne, J. Experiences with External Drainage Systems from Compact Roofs in Norwegian Climates. E3S Web Conf. 2020, 172, 21010. [Google Scholar] [CrossRef]
- Noreng, K. Byggforskserien 525.207 Kompakte Tak; SINTEF Community: Oslo, Norway, 2018. [Google Scholar]
- Ramstad, T.; Thommesen, J.E. Byggforskserien 525.002 Takformer, Taktyper Og Oppbygning; SINTEF Community: Oslo, Norway, 2018. [Google Scholar]
- Lee, S.; Park, S.H.; Yeo, M.S.; Kim, K.W. An Experimental Study on Airflow in the Cavity of a Ventilated Roof. Build. Environ. 2009, 44, 1431–1439. [Google Scholar] [CrossRef]
- Hagentoft, C.-E. Introduction to Building Physics; 1:7; Studentlitteratur: Gothenburg, Sweden, 2001; ISBN 91-44-01896-7. [Google Scholar]
- Nore, K.; Blocken, B.; Thue, J.V. On CFD Simulation of Wind-Induced Airflow in Narrow Ventilated Facade Cavities: Coupled and Decoupled Simulations and Modelling Limitations. Build. Environ. 2010, 45, 1834–1846. [Google Scholar] [CrossRef]
- Mundt-Petersen, S.O.; Harderup, L.E. Predicting Hygrothermal Performance in Cold Roofs Using a 1D Transient Heat and Moisture Calculation Tool. Build. Environ. 2015, 90, 215–231. [Google Scholar] [CrossRef]
- Gullbrekken, L.; Uvsløkk, S.; Geving, S.; Kvande, T. Local Loss Coefficients inside Air Cavity of Ventilated Pitched Roofs. J. Build. Phys. 2018, 42, 197–219. [Google Scholar] [CrossRef]
- Falk, J.; Sandin, K. Ventilated Rainscreen Cladding: A Study of the Ventilation Drying Process. Build. Environ. 2013, 60, 173–184. [Google Scholar] [CrossRef]
- Mundt-Petersen, S.O.; Harderup, L.E.; Arfvidsson, J. Important Factors Affecting the Risk of Mold Growth in Well-Insulated Wood Frame Walls in Northern European Climates. In Proceedings of the Thermal Performance of the Exterior Envelopes of Whole Buildings XII International Conference, Clearwater, FL, USA, 1–5 December 2013. [Google Scholar]
- Støver, E.A.; Sundsøy, M.H.; Andenæs, E.; Geving, S.; Kvande, T. Rain Intrusion through Horizontal Joints in Façade Panel Systems—Experimental Investigation. Buildings 2022, 12, 1497. [Google Scholar] [CrossRef]
- Geving, S.; Thue, J.V. Fukt i Bygninger; Håndbok 50; Norsk Byggforskningsinstitutt: Oslo, Norway, 2002. [Google Scholar]
- Blocken, B.; Carmeliet, J. A Review of Wind-Driven Rain Research in Building Science. J. Wind Eng. Ind. Aerodyn. 2004, 92, 1079–1130. [Google Scholar] [CrossRef]
- Kvande, T.; Lisø, K.R.; Time, B. Luftede Kledninger. Klimapåkjenninger, Erfaringer Og Anbefalinger; SINTEF Community: Oslo, Norway, 2007. [Google Scholar]
- Falk, J.; Molnár, M.; Larsson, O. Investigation of a Simple Approach to Predict Rainscreen Wall Ventilation Rates for Hygrothermal Simulation Purposes. Build. Environ. 2014, 73, 88–96. [Google Scholar] [CrossRef]
- Jaakkola, M.S.; Jaakkola, J.J.K. Indoor Molds and Asthma in Adults. In Advances in Applied Microbiology; Academic Press: Cambridge, MA, USA, 2004; Volume 55, pp. 309–338. [Google Scholar]
- Sauni, R.; Uitti, J.; Jauhiainen, M.; Kreiss, K.; Sigsgaard, T.; Verbeek, J.H. Remediating Buildings Damaged by Dampness and Mould for Preventing or Reducing Respiratory Tract Symptoms, Infections and Asthma (Review). Evid.-Based Child Health 2013, 8, 944–1000. [Google Scholar] [CrossRef]
- Bornehag, C.G.; Sundell, J.; Bonini, S.; Custovic, A.; Malmberg, P.; Skerfving, S.; Sigsgaard, T.; Verhoeff, A. EUROEXPO Dampness in Buildings as a Risk Factor for Health Effects, EUROEXPO: A Multidisciplinary Review of the Literature (1998–2000) on Dampness and Mite Exposure in Buildings and Health Effects. Indoor Air 2004, 14, 243–257. [Google Scholar] [CrossRef]
- Park, J.-H.; Cox-Ganser, J.M.; Kreiss, K.; White, S.K.; Rao, C.Y. Hydrophilic Fungi and Ergosterol Associated with Respiratory Illness in a Water-Damaged Building. Environ. Health Perspect. 2008, 116, 45–50. [Google Scholar] [CrossRef]
- Evans, F.G. Soppskader På Tre; Fokus På Tre; TreFokus AS Og Norsk Treteknisk Institutt: Oslo, Norway, 2009. [Google Scholar]
- Thue, J.V. Bygningsfysikk Grunnlag; Fagbokforlaget: Bergen, Norway, 2016; ISBN 978-82-450-1994-0. [Google Scholar]
- Tronstad, S. Tre Og Fuktighet—Fra Produsent Til Forbruker. In Teknisk Håndbok, 4th ed.; Norsk Treteknisk Institutt: Oslo, Norway, 2013. [Google Scholar]
- Viitanen, H. Factors Affecting the Development of Biodeterioration in Wooden Constructions. Mater. Struct. 1994, 27, 483–493. [Google Scholar] [CrossRef]
- Geving, S. Fuktskader: Årsaker, Utredning Og Tiltak—Håndbok 3; SINTEF Akademisk Forlag: Oslo, Norway, 2011. [Google Scholar]
- Clarke, J.A.; Johnstone, C.M.; Kelly, N.J.; McLean, R.C.; Anderson, J.A.; Rowan, N.J.; Smith, J.E. A Technique for the Prediction of the Conditions Leading to Mould Growth in Buildings. Build. Environ. 1999, 34, 515–521. [Google Scholar] [CrossRef]
- Johansson, S.; Wadsö, L.; Sandin, K. Estimation of Mould Growth Levels on Rendered Façades Based on Surface Relative Humidity and Surface Temperature Measurements. Build. Environ. 2010, 45, 1153–1160. [Google Scholar] [CrossRef]
- Sedlbauer, K. Prediction of Mould Fungus Formation on the Surface of and inside Building Components; Fraunhofer Institute: Munich, Germany, 2001. [Google Scholar]
- Sedlbauer, K. Prediction of Mould Growth by Hygrothermal Calculation. J. Therm. Envel. Build. Sci. 2002, 25, 321–336. [Google Scholar] [CrossRef]
- Ayerst, G. The Effects of Moisture and Temperature on Growth and Spore Germination in Some Fungi. J. Stored Prod. Res. 1969, 5, 127–141. [Google Scholar] [CrossRef]
- Smith, S.L.; Hill, S.T. Influence of Temperature and Water Activity on Germination and Growth of Aspergillus Restrictus and A. Versicolor. Trans. Br. Mycol. Soc. 1982, 79, 558–560. [Google Scholar] [CrossRef]
- Moon, H.J.; Augenbroe, G.L.M. Towards a Practical Mould Growth Risk Indicator. Build. Serv. Eng. Res. Technol. 2004, 25, 317–326. [Google Scholar] [CrossRef]
- Togerö, Å.; Tengberg, C.S.; Bengtsson, B. M-Model: A Method to Assess the Risk for Mould Growth in Wood Structures with Fluctuating Hygrothermal Conditions; Tampere University of Technology: Tampere, Finland, 2011; Volume 2, pp. 883–890. [Google Scholar]
- Viitanen, H.; Bjurman, J. Mould Growth on Wood under Fluctuating Humidity Conditions. Mater. Org. 1995, 29, 27–46. [Google Scholar]
- Hukka, A.; Viitanen, H.A. A Mathematical Model of Mould Growth on Wooden Material. Wood Sci. Technol. 1999, 33, 475–485. [Google Scholar] [CrossRef]
- Viitanen, H.; Ritschkoff, A.-C. Mould Growth in Pine and Spruce Sapwood in Relation to Air Humidity and Temperature; Swedish University of Agricultural Sciences, Department of Forest Products: Uppsala, Sweden, 1991. [Google Scholar]
- Viitanen, H. Modelling the Time Factor in the Development of Mould Fungi: The Effect of Critical Humidity and Temperature Conditions on Pine and Spruce Sapwood. Holzforschung 1997, 51, 6–14. [Google Scholar] [CrossRef]
- Viitanen, H.; Ojanen, T. Improved Model to Predict Mould Growth in Building Materials. In Proceedings of the Thermal Performance of the Exterior Envelopes of Whole Buildings XI Conference, Clearwater, FL, USA, 1–5 December 2007. [Google Scholar]
- Ojanen, T.; Viitanen, H.; Peuhkuri, R.; Lähdesmäki, K.; Vinha, J.; Salminen, K. Mold Growth Modeling of Building Structures Using Sensitivity Classes of Materials. In Proceedings of the 11th International Conference on Thermal Performance of the Exterior Envelopes of Whole Buildings, Buildings XI, Clearwater, FL, USA, 4–8 November 2010; pp. 1–10. [Google Scholar]
- Ojanen, T.; Peuhkuri, R.; Viitanen, H.; Lähdesmäki, K.; Vinha, J.; Salminen, K. Classification of Material Sensitivity: New Approach for Mould Groeth Modeling. In Proceedings of the 9th Nordic Symposium on Building Physics, Tampere, Finland, 29 May–2 June 2011; Volume 2, pp. 867–874. [Google Scholar]
- Fraunhofer IBP WUFI Mould Index VTT. Available online: https://wufi.de/en/2017/03/31/wufi-mould-index-vtt/ (accessed on 23 September 2022).
- Gullbrekken, L.; Kvande, T.; Time, B. Instrumentering Av Luftede Trefasader På Orre for Norgeshus Varhaug; SINTEF Community: Trondheim, Norway, 2021. [Google Scholar]
- Rønningen, E.S. Feltstudie Av Klimatiske Forhold i Luftespalter Bak Kledning Og Taktekning. Master’s Thesis, Norwegian University of Science and Technology, Trondheim, Norway, 2020. [Google Scholar]
- Thodesen, B.; Kvande, T.; Tajet, H.T.T.; Time, B.; Lohne, J. Adapting Green-Blue Roofs to Nordic Climate. Nord. J. Archit. Res. 2018, 30, 99–128. [Google Scholar]
- NCCS Norwegian Centre for Climate Services. Available online: https://seklima.met.no/ (accessed on 19 May 2022).
- Bunkholt, N.S.; Time, B.; Kvande, T. Trefuktmålinger: Litteraturundersøkelse Og Korrelasjonskurver; Klima 2050: Trondheim, Norway, 2022. [Google Scholar]
- Lie, S.K.; Thiis, T.K.; Vestøl, G.I.; Høibø, O.; Gobakken, L.R. Can Existing Mould Growth Models Be Used to Predict Mould Growth on Wooden Claddings Exposed to Transient Wetting? Build. Environ. 2019, 152, 192–203. [Google Scholar] [CrossRef]
- Gullbrekken, L.; Kvande, T.; Time, B. Ventilated Wooden Roofs: Influence of Local Weather Conditions—Measurements. Energy Procedia 2017, 132, 777–782. [Google Scholar] [CrossRef]
- Viljanen, K.; Lü, X.; Puttonen, J. Factors Affecting the Performance of Ventilation Cavities in Highly Insulated Assemblies. J. Build. Phys. 2021, 45, 67–110. [Google Scholar] [CrossRef]
- Sandberg, M.; Moshfegh, B. Buoyancy-Induced Air Flow in Photovoltaic Facades—Effect of Geometry of the Air Gap and Location of Solar Cell Modules. Build. Environ. 2002, 37, 211–218. [Google Scholar] [CrossRef]
- Lie, S.K.; Vestøl, G.I.; Høibø, O.; Gobakken, L.R. Surface Mould Growth on Wooden Claddings—Effects of Transient Wetting, Relative Humidity, Temperature and Material Properties. Wood Mater. Sci. Eng. 2019, 14, 129–141. [Google Scholar] [CrossRef]
Publisher’s Note: MDPI stays neutral with regard to jurisdictional claims in published maps and institutional affiliations. |
© 2022 by the authors. Licensee MDPI, Basel, Switzerland. This article is an open access article distributed under the terms and conditions of the Creative Commons Attribution (CC BY) license (https://creativecommons.org/licenses/by/4.0/).