Article

Numerical Study on Static and Dynamic Load Response of Temporary Support System for Group Tunnels Excavation

1
School of Mechanics and Civil Engineering, China University of Mining and Technology, Beijing 100083, China
2
School of Architecture and Civil Engineering, Anhui Polytechnic University, Wuhu 241000, China
*
Authors to whom correspondence should be addressed.
Buildings 2022, 12(10), 1719; https://doi.org/10.3390/buildings12101719
Submission received: 9 August 2022 / Revised: 7 October 2022 / Accepted: 14 October 2022 / Published: 18 October 2022
(This article belongs to the Special Issue Recent Advances in Structural Engineering)

Abstract

:
In this study, the static response of the preliminary pilot tunnels excavation to the ground, and the dynamic response of the group cavern system under seismic excitation under the use of the construction of a metro station based on the Pile-Beam-Arch approach are investigated through numerical calculation. The results suggest that the excavation sequences of “top first and then bottom” and “middle first and then both sides” can generate the minimum ground settlement. When the pilot tunnels were excavated, the horizontal PGA (peak ground acceleration) amplification coefficient tends to increase with significant nonlinear characteristics under the excitation of EI Centro wave with a horizontal acceleration of 0.15 g, and the horizontal PGA amplification coefficient reaches the maximum at the ground surface. The effect of horizontal acceleration around the upper pilot tunnels increases. Under the static load, the maximum principal stress of the lining structure after the completion of the pilot tunnels is largely concentrated at the foot of the arch of the pilot tunnel, and the maximum principal stress value is 1.124 MPa. The maximum principal stress is primarily concentrated at the foot of the arch and the foot of the upper and lower guide tunnel under seismic excitation, and the maximum principal stress value is 1.424 MPa. This study reveals that a reasonable excavation sequence can be employed when the pilot tunnels are being excavated to control the settlement. Furthermore, the support of the arch and footing of the pilot tunnels should be enhanced during the seismic design.

1. Introduction

With the increasing traffic pressure in modern society, the demand for underground engineering construction is increasing. Urban subway stations are built with high construction difficulty and safety risks and are often located in busy urban areas with complex and changing surrounding environments and restricted construction conditions; construction must also pay attention to the influence of neighboring buildings and underground pipelines, etc. Under this major environment, underground engineering construction methods for different construction environments are produced [1,2,3,4]. The PBA method is one of the main innovative technologies in underground engineering construction, which is an organic combination of the open-cut frame construction method and the concealed excavation method, and is mainly divided into four stages in the construction process: the required pilot tunnels excavation, and then the support system is formed by the construction of enclosure piles, top longitudinal beams, and top arches, etc. Under the protection of the support system, the internal structure of the subway station is formed by excavation in turn, which can minimize the impact caused by excavation in the construction process. During the construction process, the ground movement caused by excavation and the damage to nearby structures and public facilities can be minimized [5,6,7,8]. It has a very broad application and market prospect due to its unique construction process advantages [9].
Ground disturbance is inevitable when the PBA method is being constructed. The number, shape, and location of the pilot tunnels are the main factors for the ground deformation under static load, and the amount of ground deformation generated in the excavation stage of the pilot tunnels is the largest in the whole construction stage [10,11,12,13,14]. It has been shown that the excavation of multiple adjacent pilot tunnels will cause a “group tunnels effect”, i.e., multiple pilot tunnels will affect each other, and the surface settlement caused by them will be greater than the superimposed effect of individual pilot tunnel settlement. In addition to the great influence of the excavation on the surface settlement, the stress field changes around the pilot tunnels in different locations are also very different, and the stress disturbance in the bottom pilot tunnel is more significant than that in the upper pilot tunnel [15].
Underground structures, like surface structures, are subject to complex external loads, including dynamic loads such as earthquakes. For underground structures, it is widely believed that the displacement and amplitude produced by underground structures under earthquake action are relatively smaller than those of surface structures due to the restraint of the surrounding soil, and the seismic action on underground structures will be smaller than that on surface structures, so people pay less attention to the seismic resistance of underground structures. Most of the existing studies have focused on the seismic resistance of surface structures [16,17,18,19,20]. However, the large earthquakes that have occurred in recent years have shown that underground structures can also be severely damaged when subjected to strong ground motions, and many studies have investigated the damage patterns of tunnel structures during seismic events [21,22,23,24,25], and the issue of seismic damage to underground building structures is gradually gaining attention.
The underground soil-structure interactions are complex, and the factors for the seismic response of this system are more complex still. In order to analyze the seismic response law of the underground space structure, it is known from the research results that the presence of underground cavities affects the propagation of seismic waves [26,27,28]. The shape and burial depth of underground structures are the main factors for the seismic response [29,30]. In addition, the incident direction, duration, amplitude, type of seismic waves, and soil shear wave velocity affect the dynamic response of underground space structures and surrounding rocks during the propagation of seismic waves [31,32,33,34,35]. Because there are many complex influencing factors of the soil-structure interaction system, shaking table tests and numerical simulation methods are often used to verify [36,37,38,39,40], and with the development of computer technology, numerical simulation calculations are also gradually applied to the analysis of dynamic response; some studies use numerical methods to analyze the earthquake damage and collapse mechanisms of underground structures [41,42,43,44,45], which makes the study of the dynamic response of underground structures more mature and in-depth.
From the above study, it can be seen that the research object mainly focuses on the construction of completed subway station structures and tunnel structures subjected to dynamic effects such as earthquakes. When the PBA method is used to construct subway stations, various types of support systems are formed during the whole construction process due to such links as pilot tunnel excavation. If there is insufficient resistance to seismic action during the construction process, it is easy to cause accidents in special strata such as sand and pebbles. Therefore, it is necessary to investigate the seismic response of the support system during the concealed excavation construction of shallowly buried subway stations. The pilot tunnel construction, as a temporary support structure for the PBA method of subway construction, is an important part of the subway structure, and it is of great practical significance to protect this part of the structure from being damaged and its function from being affected in an earthquake. In addition, both static response and dynamic response have significant effects on underground structures such as tunnels and subways. The current research is mostly focused on the study of the dynamic and static response of single or double tunnels. There are relatively few studies on the dynamic and static response of multiple pilot tunnels excavation. Therefore, this paper takes Beijing Metro Line 7 as the engineering background, takes the pilot tunnels excavation as the research object, establishes a numerical analysis model through FLAC3D software, and uses the established model to conduct numerical simulation research on the dynamic and static load of the temporary support system of pilot tunnels. The research content is divided into two parts as follows: the first part is the static response, i.e., the stratigraphic response of the excavation process of the pilot tunnels; the second part is the dynamic response, i.e., the seismic dynamic response of the structure and the surrounding rock after the excavation of the pilot tunnels are completed. The deformation and damage law of the temporary support system during the construction of the pilot tunnels is summarized by investigating the dynamic and static response of the pilot tunnels. This law can be adopted to guide the construction and structural seismic strengthening measures of similar projects.

2. Project Overview

An in-depth study is conducted in the previous content [15]. Daguanying Station of Beijing Metro Line 7 is in an underground and double-decker island platform style, 236 m in length, 22.9 m in width, as well as 15.15 m in height. The overburden thickness of the vault is nearly 9 m. The station is constructed using the Pile-Beam-Arch method (Figure 1) and passes through four soil layers, i.e., pebble layer 1, pebble layer 2, artificial soil, and strongly weathered conglomerate and mudstone. When the PBA method is adopted, numerous steps are involved. The first step is the excavation of small pilot tunnels. The existing research [10,11,12,13,14,15] suggested that the settlement caused by the pilot tunnel excavation is the largest in the whole construction. Thus, the pilot tunnel excavation is the critical step if the final settlement caused by the subway excavation is minimized. Thus, this study uses eight pilot tunnels (4 upper and 4 lower) in the construction of pilot tunnels. The pilot tunnels are located in pebble layer 1, pebble layer 2, as well as significantly weathered conglomerate and mudstone.

3. Static Response of the Pilot Tunnels Excavation

3.1. Numerical Model

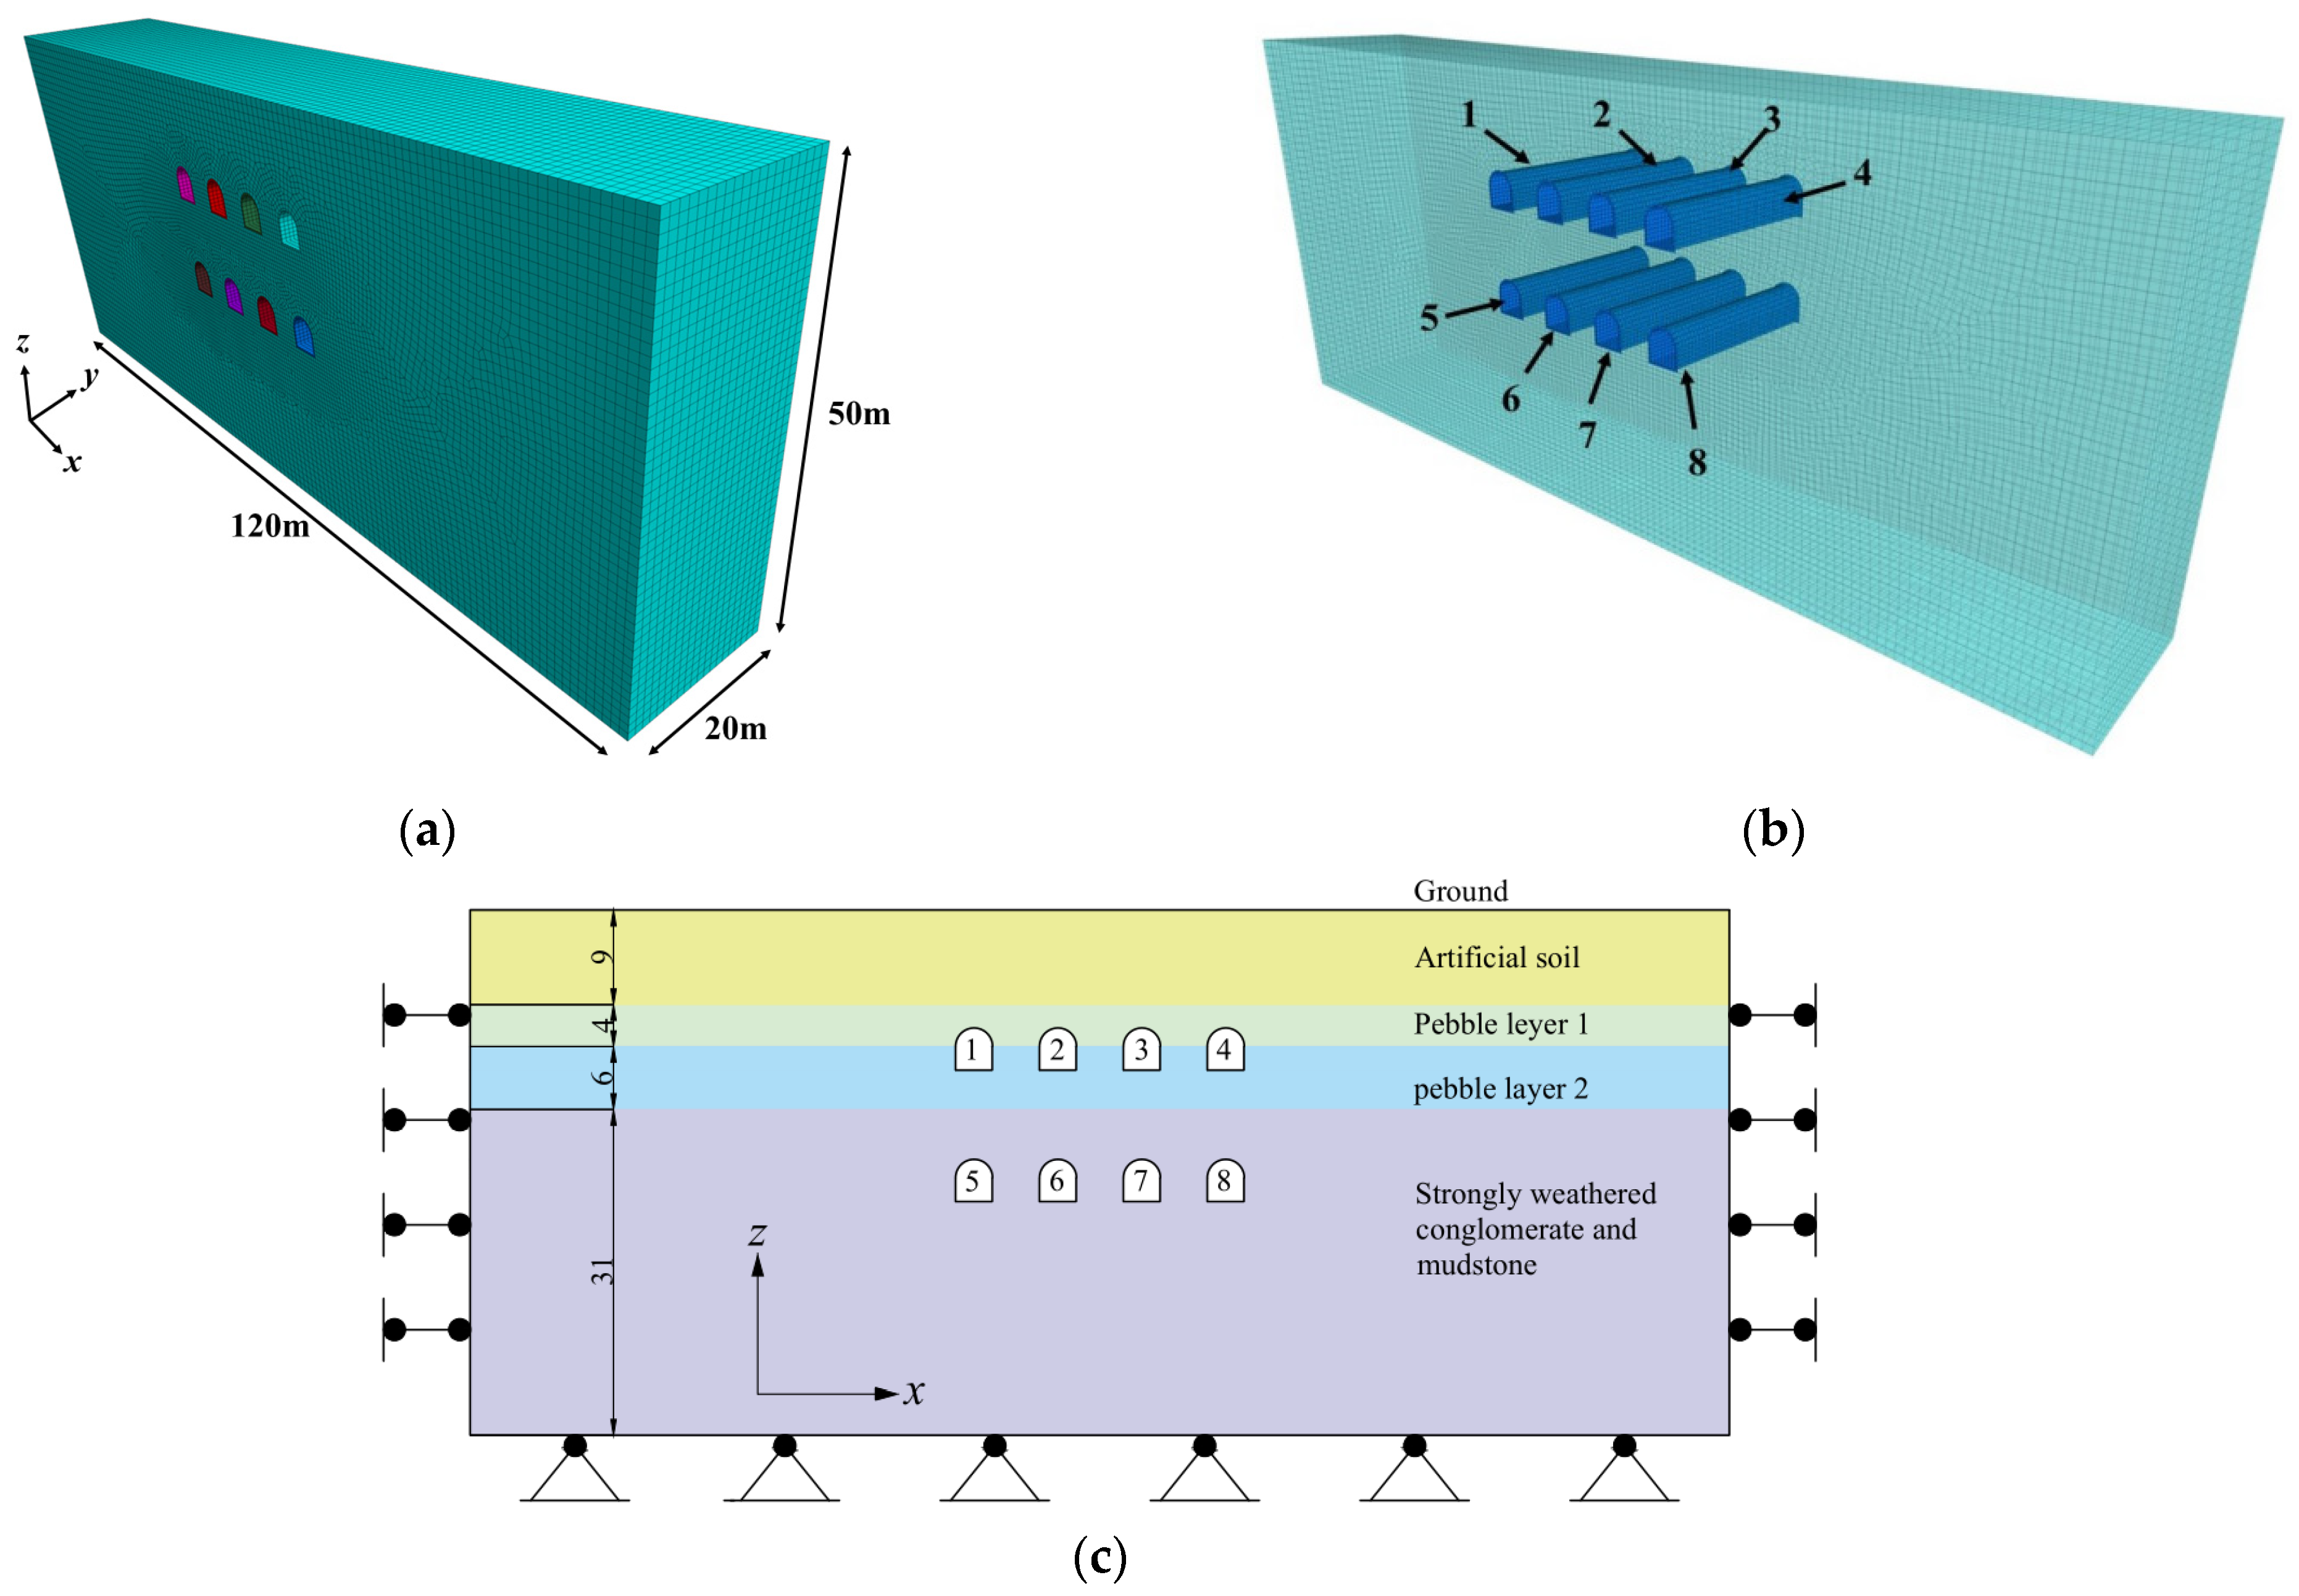
A computational model is developed using FLAC3D numerical software in accordance with the above engineering geological condition. FLAC3D Numerical calculation software was developed by Itasca, USA, which is wildly applied for geotechnical analyses of soil, rock, groundwater, constructs, and ground support. For the reduction in the boundary effect and increase in the accuracy of calculation, the model size is described as follows: length × width × height = 120 m × 20 m × 50 m (Figure 2a). The respective stratum has the thickness values of 9 m, 4 m, 6 m, and 31 m, with all horizontal strata. The respective soil layer is elastic-plastic material. The Mohr-Coulomb constitutive model is adopted in this study. The software built-in shell unit analog grille steel frame support system (Figure 2b) and linear elastic constitutive model are employed. Roller supports are employed around the model under displacement boundary conditions. Fixed supports are employed at the bottom of the model. The small pilot tunnels are numbered in order from top to bottom and left to right for the convenience of description, and Figure 2c presents the relative positions of the pilot tunnels and the strata. Table 1 lists the relevant mechanical parameters of the model involving the soil layer and the parameters of the grid steel support.

3.2. Selection of Excavation Plan

The excavation of pilot tunnels takes on a critical significance in controlling the ground settlement since multiple pilot tunnel excavation leads to stress unloading, thus resulting in the generation of surface settlement. Unlike single pilot tunnel excavation, when multiple pilot tunnel excavation is conducted, the disturbance to the stratum is superimposed by the disturbance of single pilot tunnel excavation, which will cause the so-called “group cavity effect”. Accordingly, the excavation sequence of pilot tunnels should be optimized, and a reasonable sequence of pilot tunnels should be selected for minimizing the ground settlement. Eight pilot tunnels are used in the project, and the pilot tunnels are excavated symmetrically to accelerate the project construction. The excavation plan is as follows:
Plan 1: 1&42&35&86&7
Plan 2: 2&31&46&75&8
Plan 3: 5&86&71&42&3
Plan 4: 6&75&82&31&4

3.3. Ground Surface Settlement Analysis

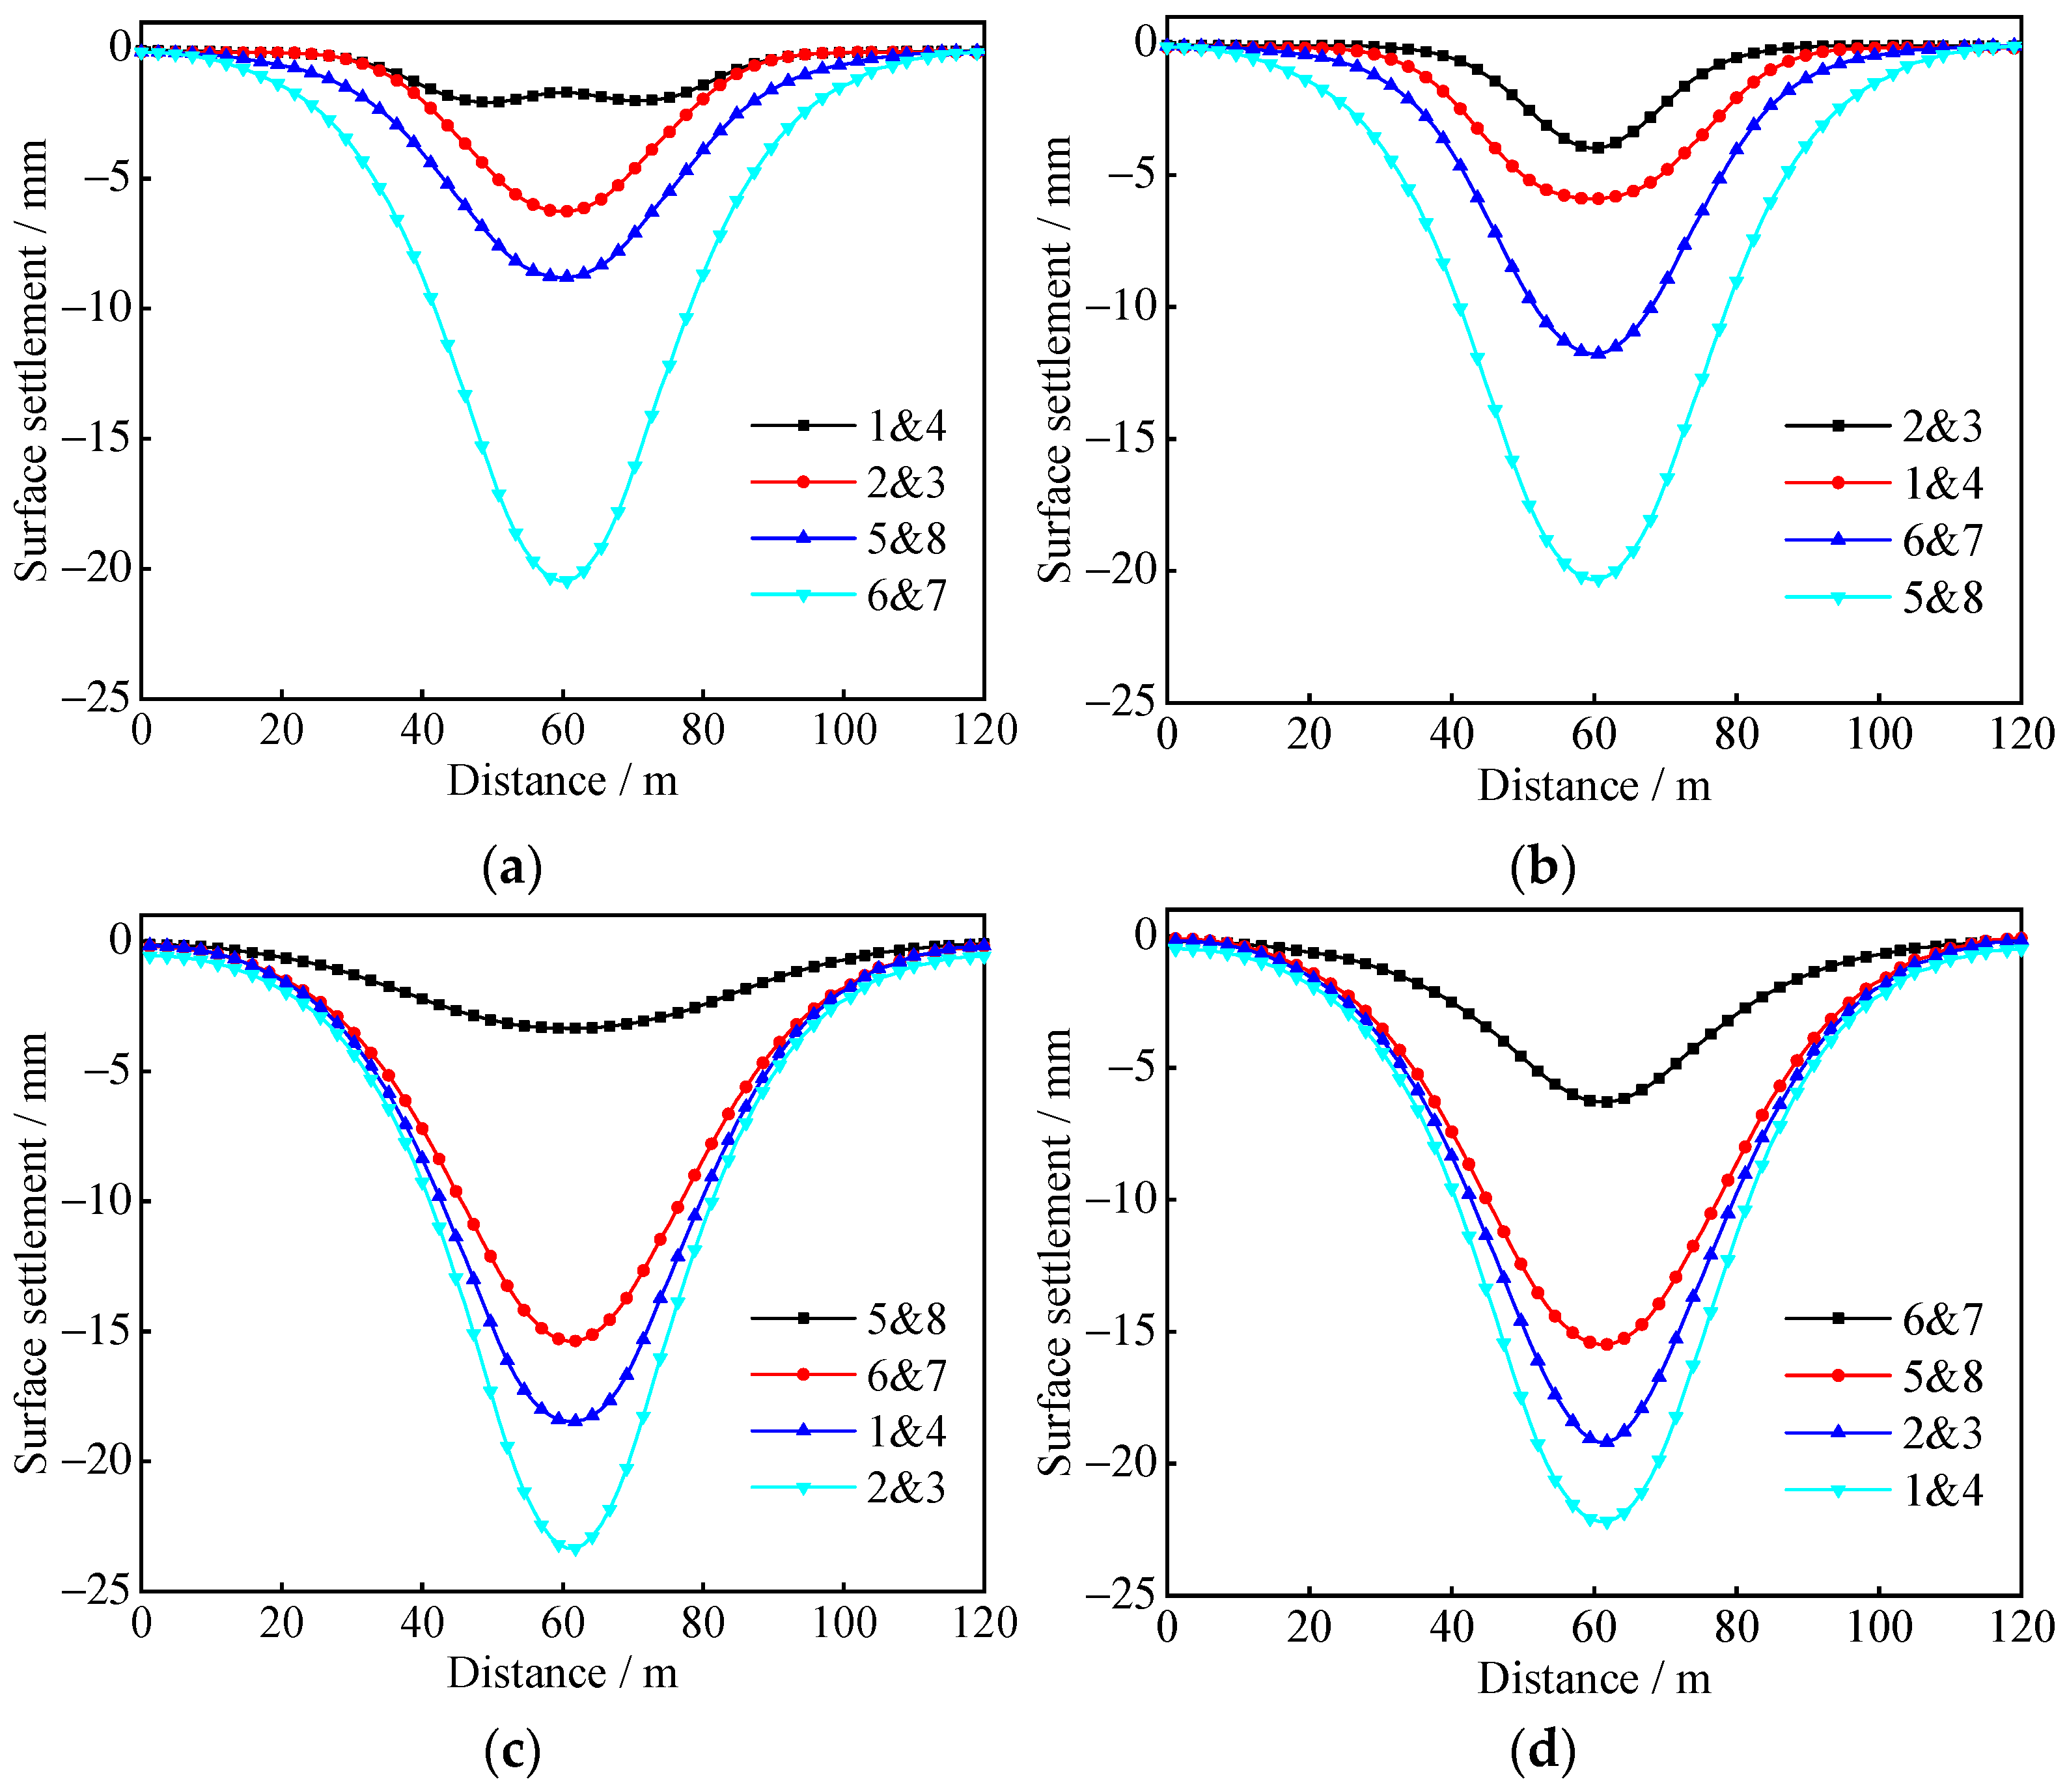
The settlement troughs will be formed on the surface after the excavation of the pilot tunnels. Select all nodes at y = 10 m and z = 50 m as the monitoring points. As depicted in Figure 3, the final settlement troughs on the surface are all single-peaked curves with a symmetric distribution. The settlement in the center of the model is the largest, and the settlement along the two sides tends to decrease. However, the surface settlement troughs are discrepant during the excavation of pilot tunnels. The comparison of the four schemes suggests that the surface settlement troughs show double-peaked curves during the excavation in terms of pilot tunnels 1&4 of plan 1 when the side pilot tunnels are excavated first. However, adopting plan 3, the surface settlement troughs show single-peak curves through the excavation of the side pilot tunnels of 5&8 first. Moreover, the surface settlement tunnels are all single peak curves in the excavation of other plans. The above analysis reveals that the excavation sequence significantly affects the development of the settlement.
The comparison of the final surface settlement of the four schemes indicates that plan 3 (23.3 mm) > plan 4 (22.2 mm) > plan 1 (20.5 mm) > plan 2 (20.3 mm). The results suggest that the excavation sequence of “the excavation of the side pilot tunnels first, then the middle pilot tunnels” leads to the generation of more surface settlement than “excavating the middle pilot tunnels first, then the side pilot tunnels”. The ranks of “plan 3 > plan 1” and “plan 4 > plan 2” also indicate that the excavation sequence of “lower pilot tunnels first and then the upper pilot tunnels” lead to the generation of more surface settlement than “upper pilot tunnels first and then the lower pilot tunnels”. As revealed by “plan 3 > plan 1” and “plan 4 > plan 2”, the excavation sequence using plan 2 generates the smallest surface settlement, so it can be employed for the optimal solution in the field construction.
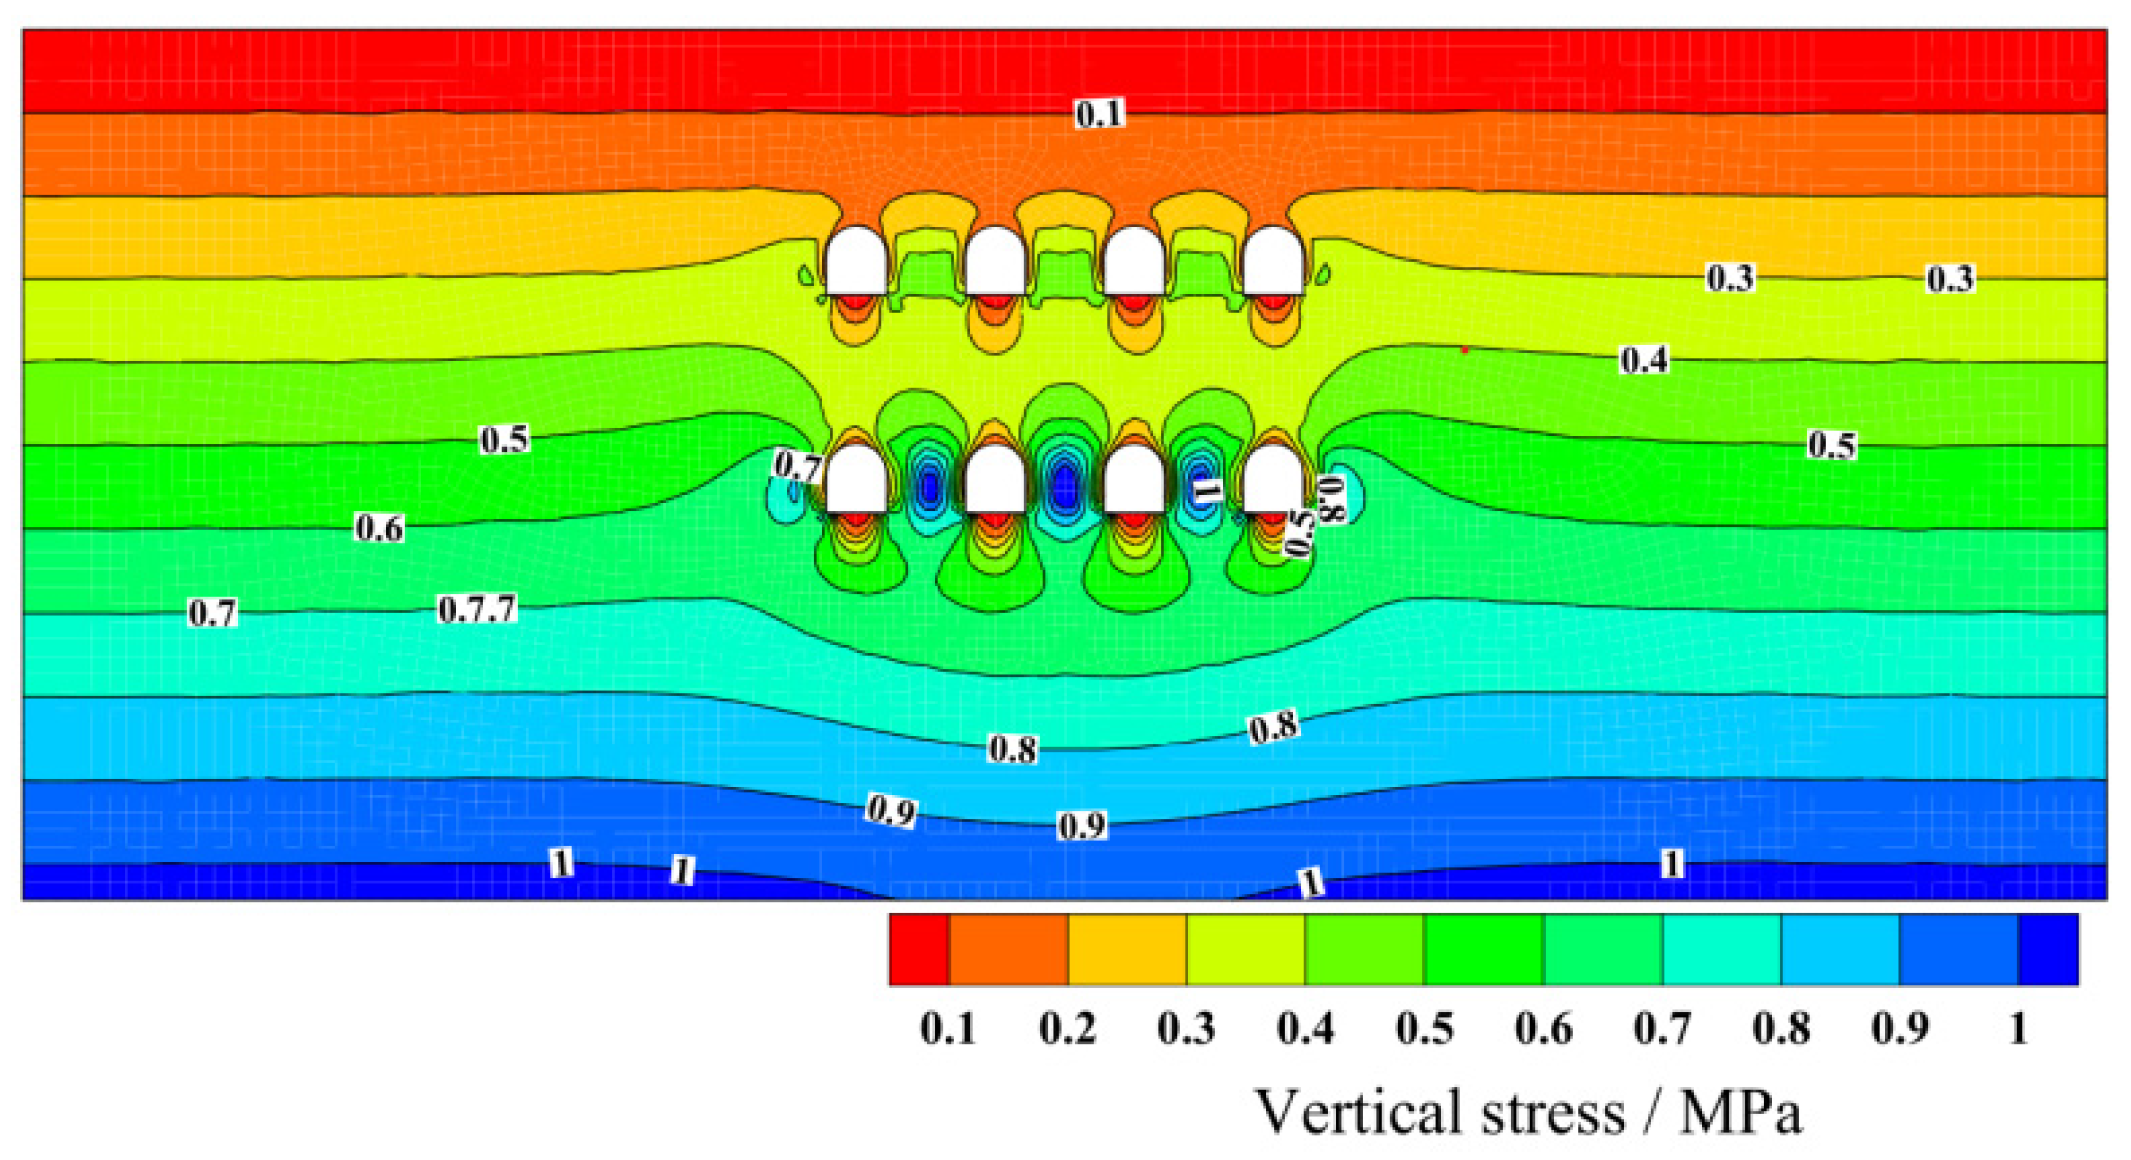
The curves of the settlement troughs formed by the four excavation options suggest that the excavation of pilot tunnels in the low layer generates more surface settlement. The surface settlement in the excavation of pilot tunnels 6&7 accounts for 57% and 52% of the total settlement, respectively, for plan 1 and plan 3. For plan 2, the excavation of pilot tunnels 5&8 and 6&7 accounts for 42% and 29% of the final ground surface settlement. Plan 2 is also consistent with the above law, accounting for 41% and 28%, respectively. The above phenomenon is achieved primarily because the burial depth of the lower pilot tunnels is large, and the excavation of the pilot tunnels will form significant stress concentrations (Figure 4) around the pilot tunnels, and the “group cavity effect” generated after multiple pilot tunnels are excavated will increase this stress concentration, thus making the lower pilot tunnels under greater stress and resulting in larger deformation. As a result, the support strength of the lower pilot tunnels can increase appropriately during the construction of the pilot tunnels to increase construction safety and reduce the ground surface settlement.

3.4. Ground Settlement Analysis

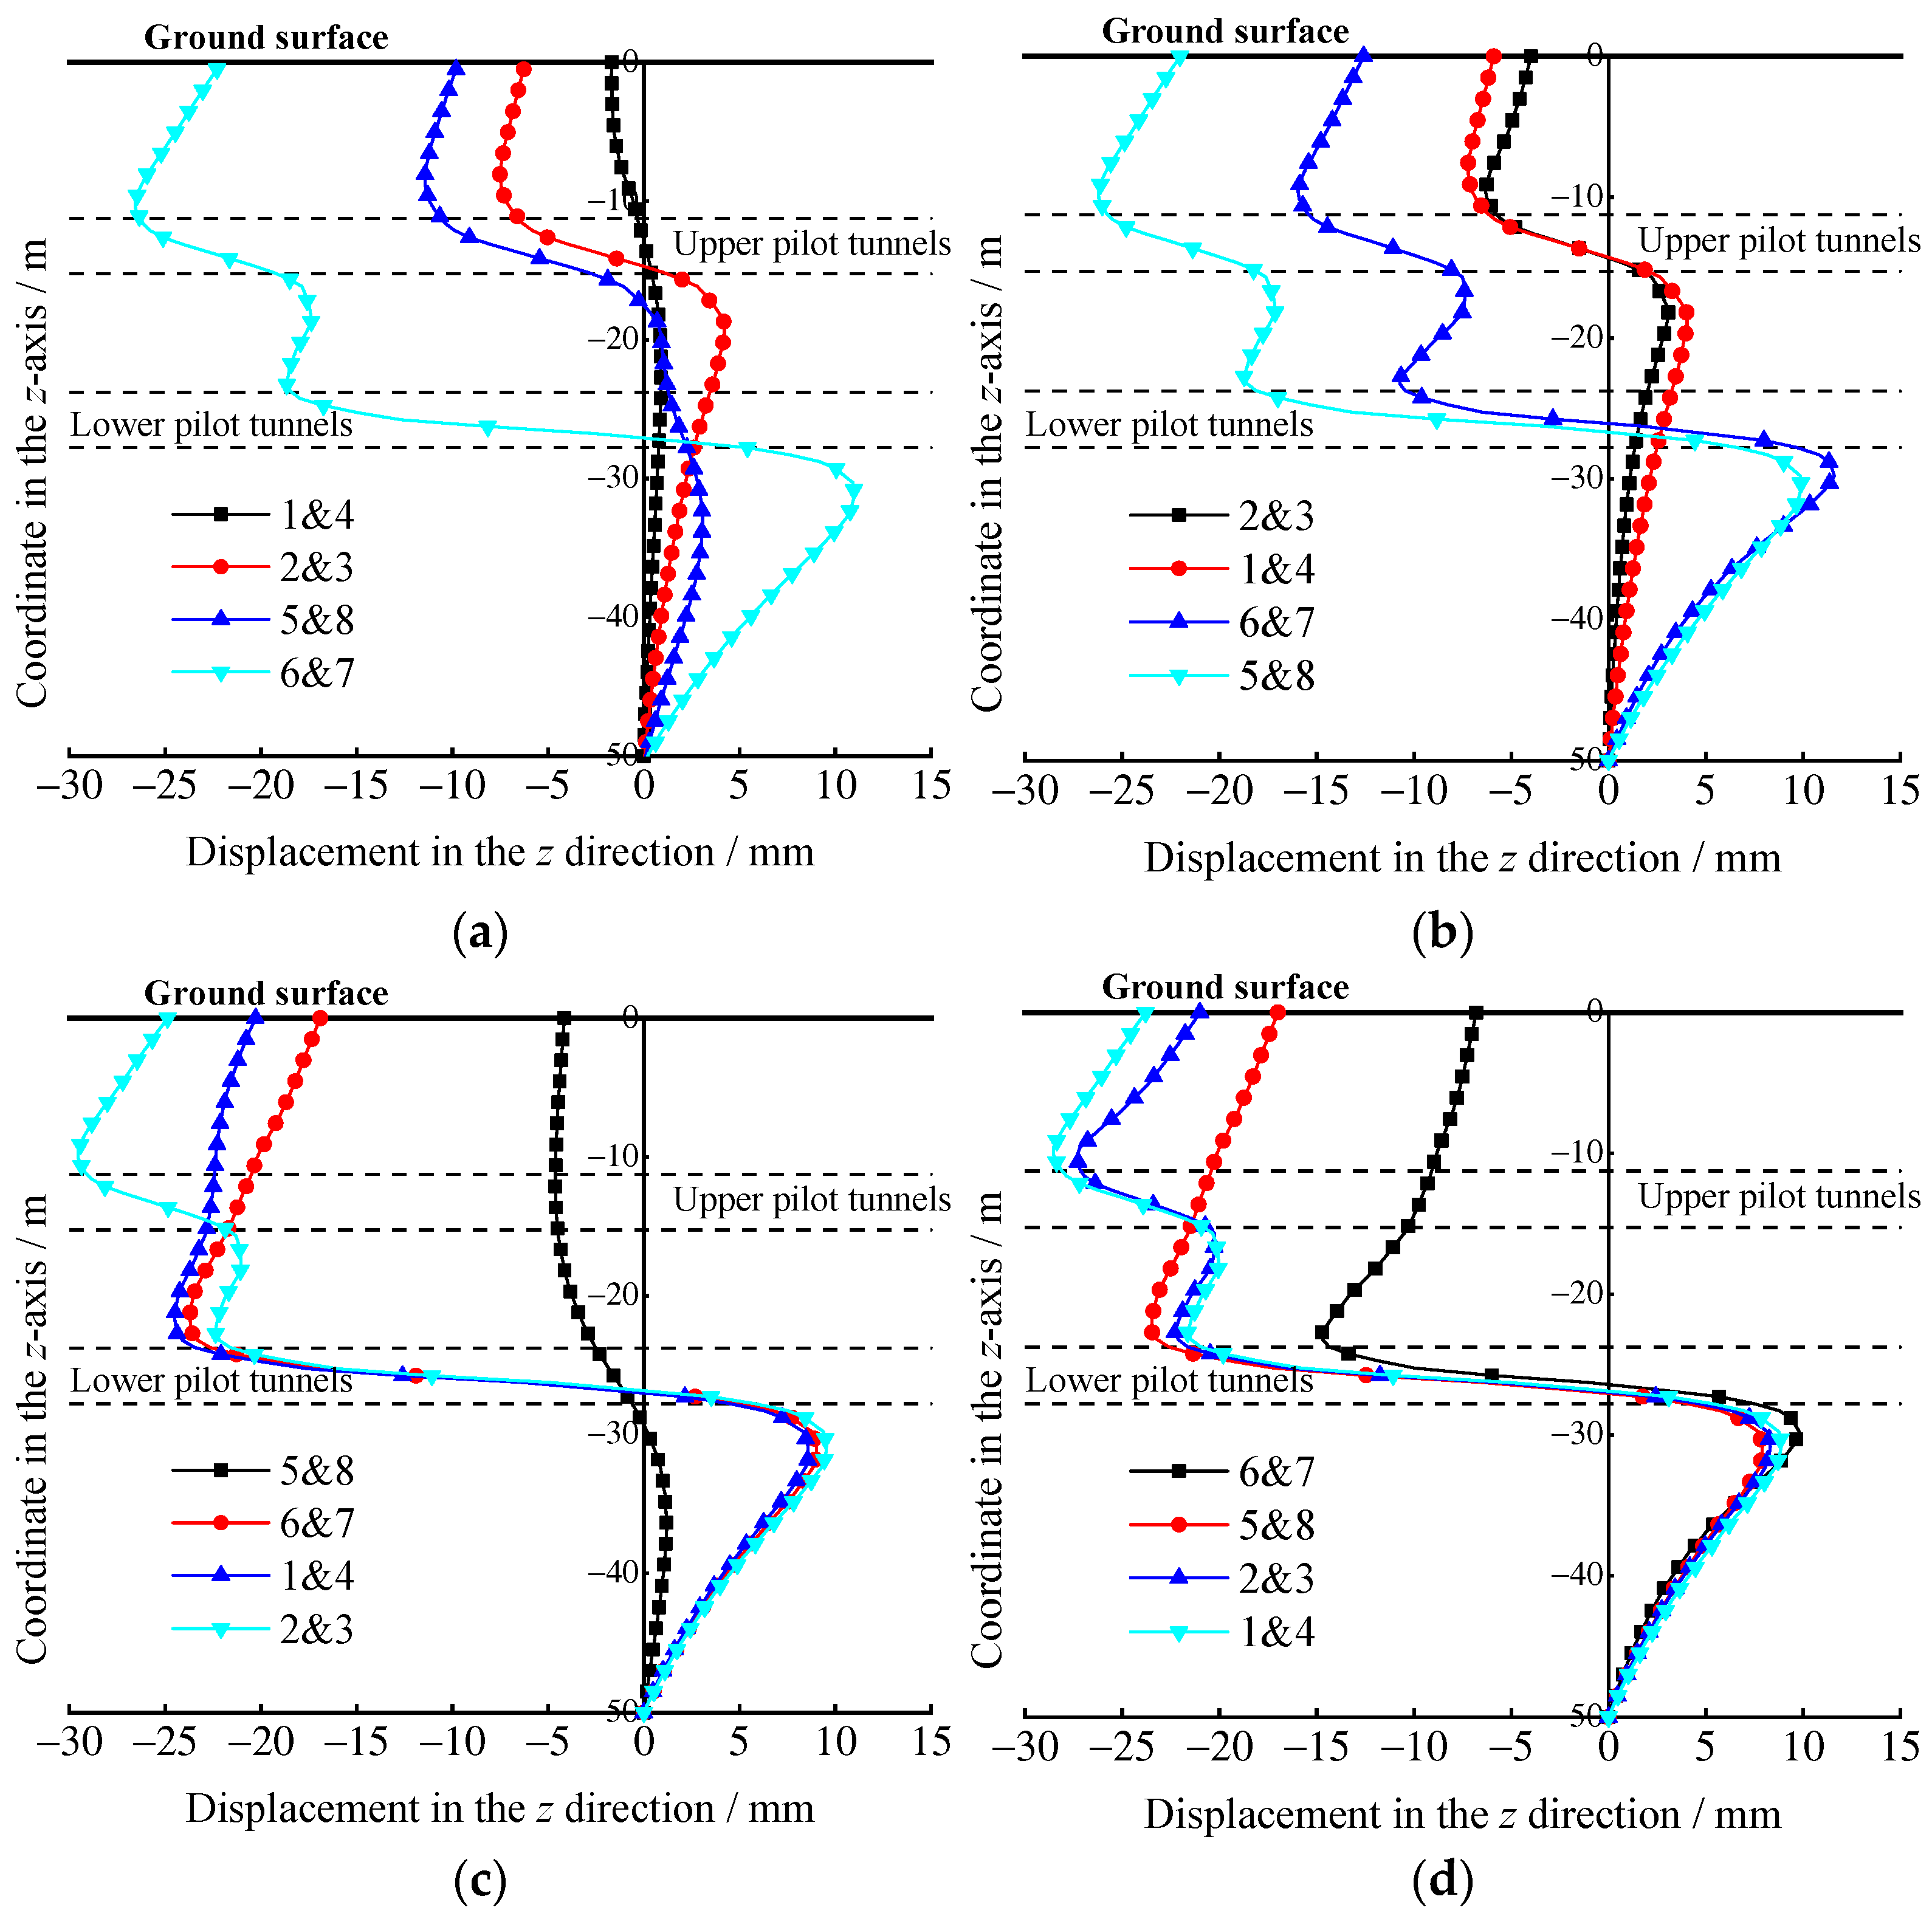
Vertical displacements of the grid points following a symmetry axis (x = 0 y = 10) of the model are plotted against the z-coordinates when the above four options are adopted to excavate the pilot tunnels, as presented in Figure 5. Settlements and uplifts are identified above and below the pilot tunnels. With the excavation of the pilot tunnels, the position of the displacement zero point (the transition point between positive values and negative values) is in a dynamic process, and the overall trend is to move into the deeper stratum. After the excavation, the maximum settlements are located close to the upper pilot tunnels, and the maximum uplifts are located close to the lower pilot tunnels.
To compare the effect of the sequence of excavating the upper and lower pilot tunnels on the settlements and uplifts, Sl-u and Su-l are adopted to denote the maximum settlements, and Ul-u and Uu-l represent the maximum uplifts after the excavation. For plan 1 and 3, Su-l (26.6 mm) < Sl-u (29.6 mm), Ul-u (9.6 mm) < Uu-l (11.0 mm); for plan 2 and 4: Su-l (26.2 mm) < Sl-u (28.5 mm), Ul-u (8.9 mm) < Uu-l (9.9 mm). The results suggest that the maximum settlements generated by excavating the upper pilot tunnels first and then the lower ones (plan 1 and plan 2) are smaller than those of plan 3 and plan 4, whereas the maximum uplifts are larger than those of excavating the lower pilot tunnels first and then the upper ones (plan 3 and plan 4), thus suggesting that the order of excavation significantly affects the ground displacement, and a reasonable choice of excavation order can significantly reduce the ground displacement.
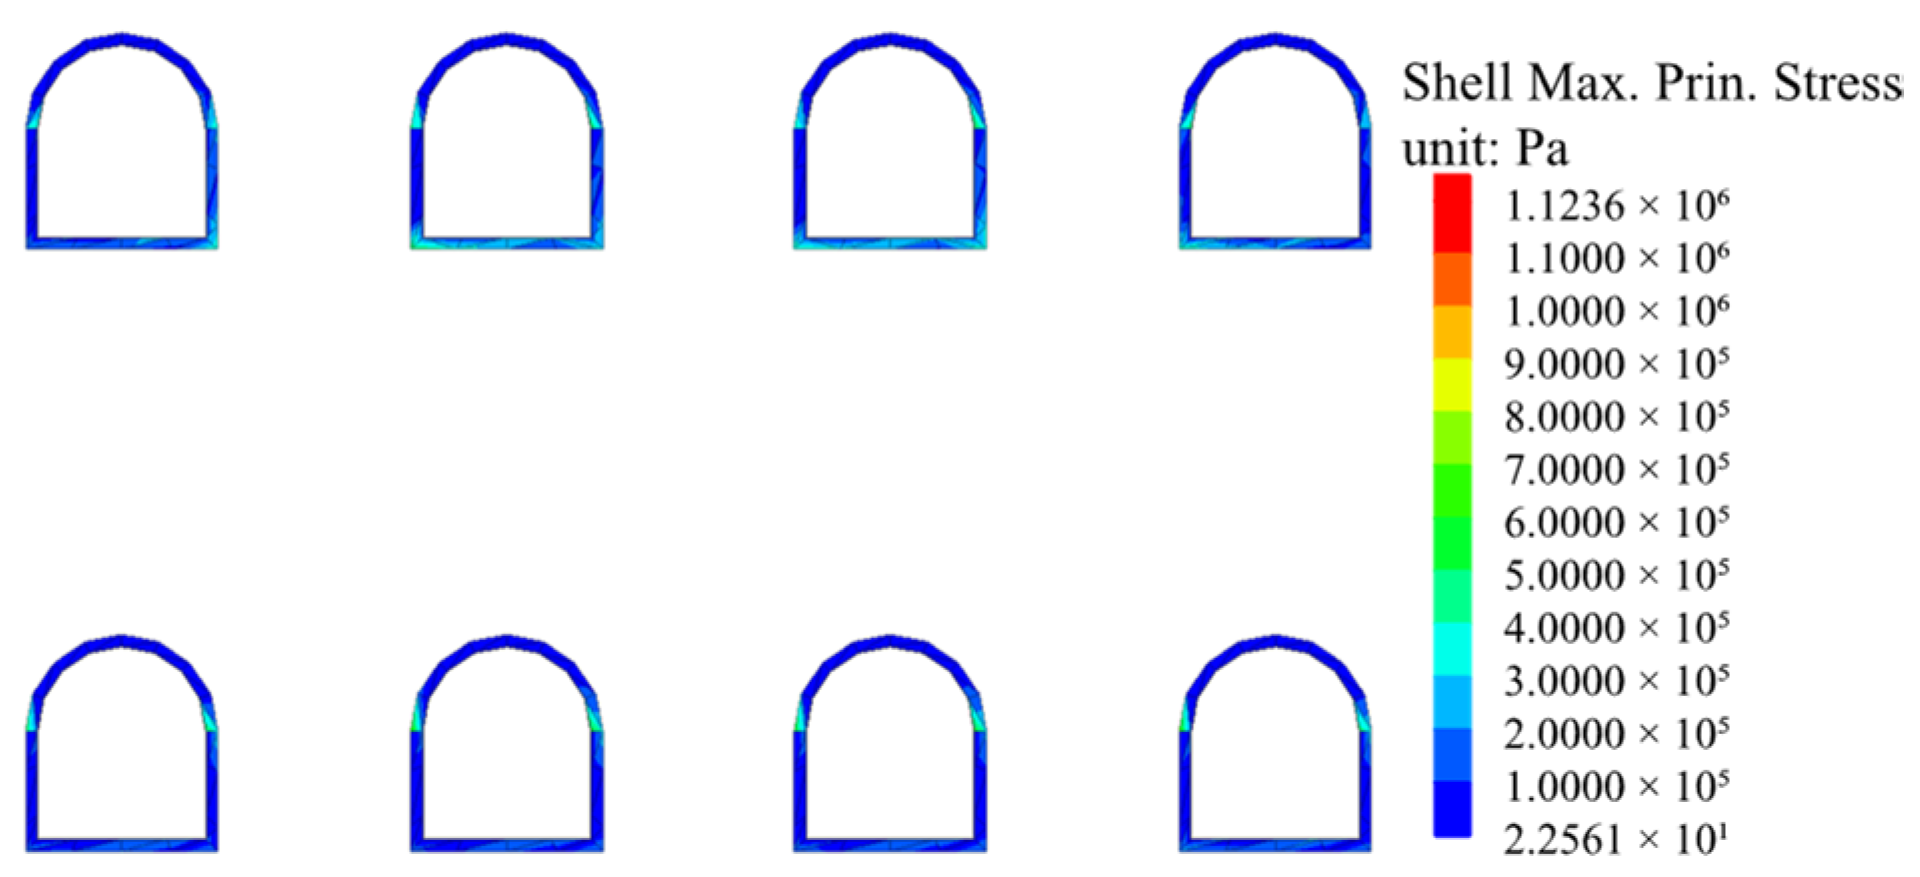
After the excavation of the pilot tunnels, the maximum principal stress distribution of the temporary support system of the pilot tunnels is shown in Figure 6. As can be seen from the figure, the maximum principal stress distribution is different for different locations of the pilot tunnels and different locations of the same pilot tunnel, and the maximum principal stress value is 1.124 MPa. For the upper pilot tunnel, the maximum principal stress is mainly concentrated at the bottom and the arch waist of the pilot tunnels, and the maximum principal stress value in the middle pilot tunnel is greater than the two sides, and it is widely distributed around the pilot tunnel, which is caused by the group tunnels effect. For the lower pilot tunnels, the maximum principal stresses are distributed equally, and the maximum principal stresses are all located at the arch waist of the pilot tunnels. From this, it can be seen that under the action of static load, the upper pilot tunnel is more affected and the structure is not uniformly stressed, so the support of the upper pilot tunnel should be strengthened during the static excavation.

3.5. Settlement Control Measures

The ground settlement happens due to the ground loss caused by the excavation of pilot tunnels. The ground settlement, the first step of the PBA construction system, accounts for a large proportion of the whole construction due to considerable pilot tunnels and low strength of support. Accordingly, measures should be taken to reduce ground settlement. First, the excavation sequence of pilot tunnels is selected reasonably, which has been elucidated from 3.1 to 3.4. Second, the soil reinforcement technology is adopted to increase the stability of the soil around the pilot tunnels; the number of pilot tunnels excavated is reduced appropriately, and the primary lining strength of lower pilot tunnels is improved. The above measures may be effective in reducing the ground settlement.

4. Dynamic Response on Group Tunnels

4.1. Establishment of the Dynamic Simulation Model

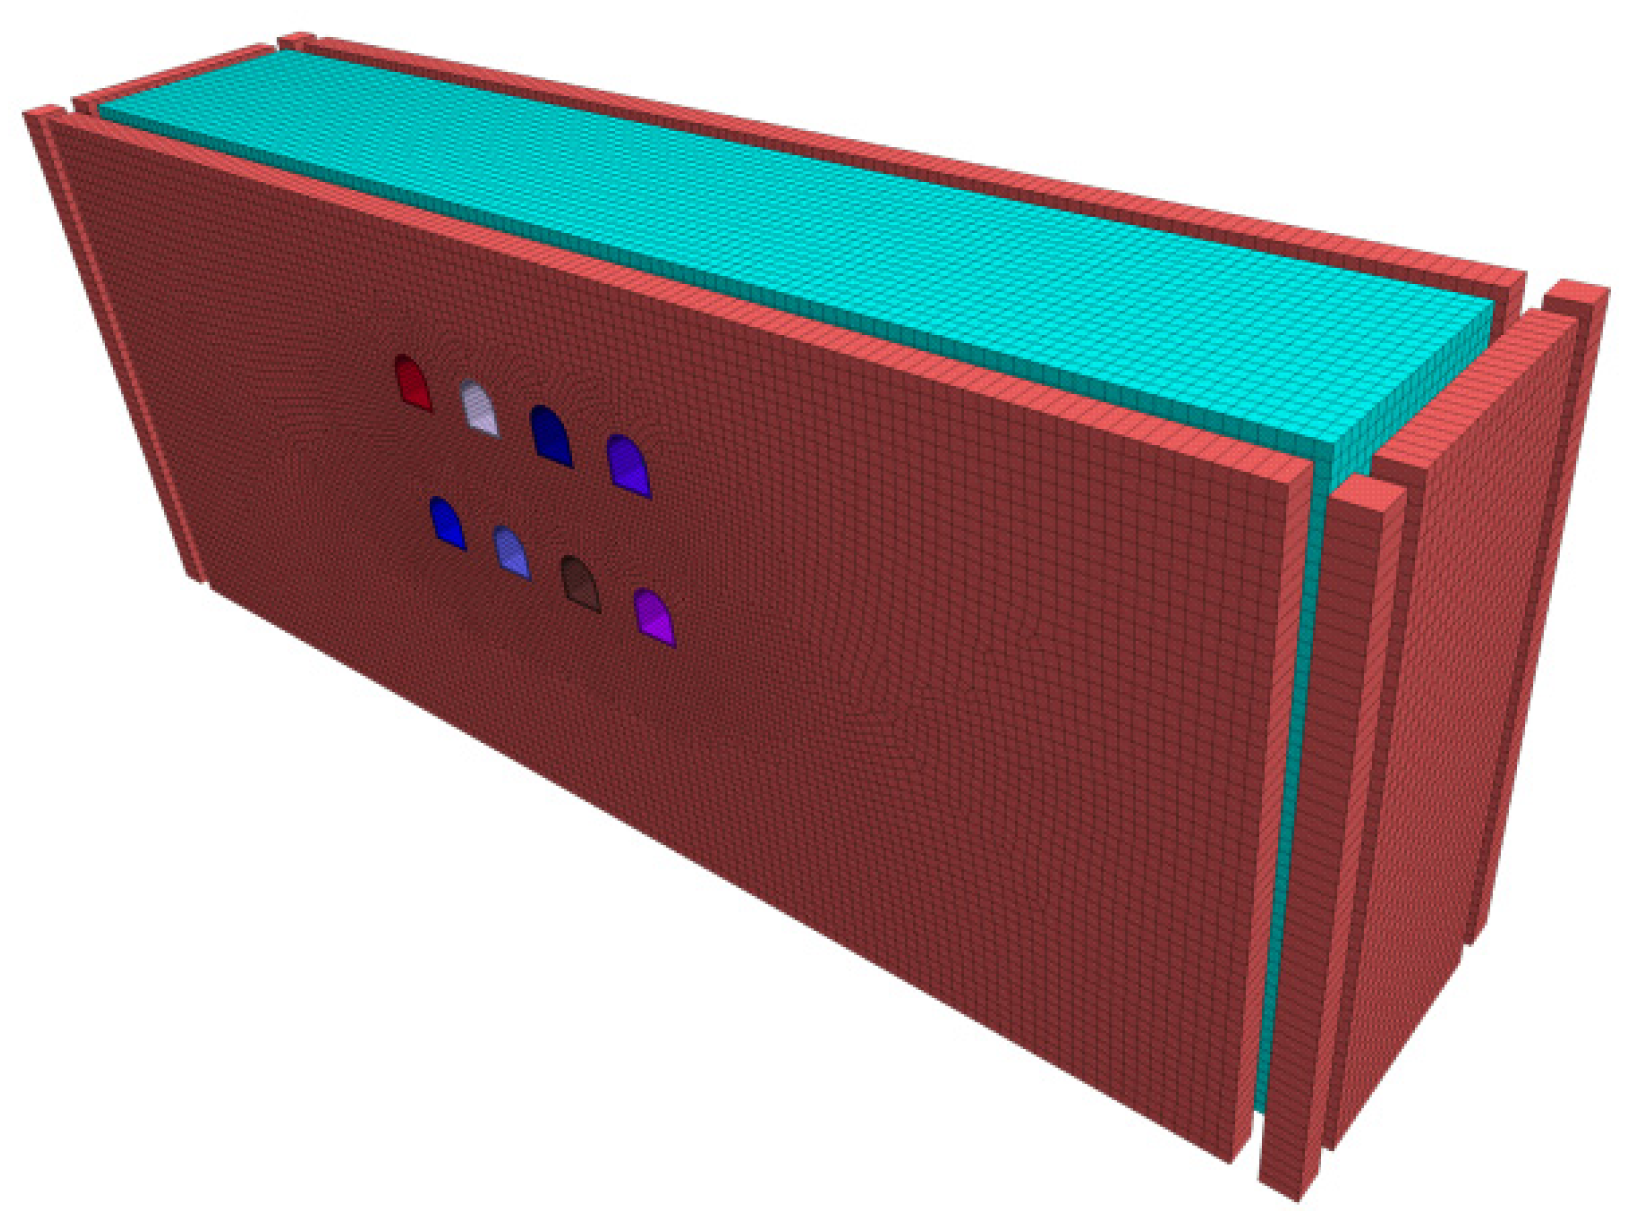
The dynamics module in FLAC3D finite element analysis software is capable of conducting nonlinear dynamics analysis, which can apply to geotechnical seismic analysis. When dynamic calculations are performed and the dynamic load is input into the soil, the wave propagation is affected by the reflection of the wave at the soil boundary. Thus, the numerical model using dynamic calculation should be modified from the original model (Figure 1). To eliminate this effect, a free field boundary is applied around the model with a static boundary at the bottom and a free boundary at the top (Figure 7). Local damping is used and the critical damping ratio is set to 5%. The model soil and structure mechanical parameters are the same as in Table 1.

4.2. Dynamic Wave Input

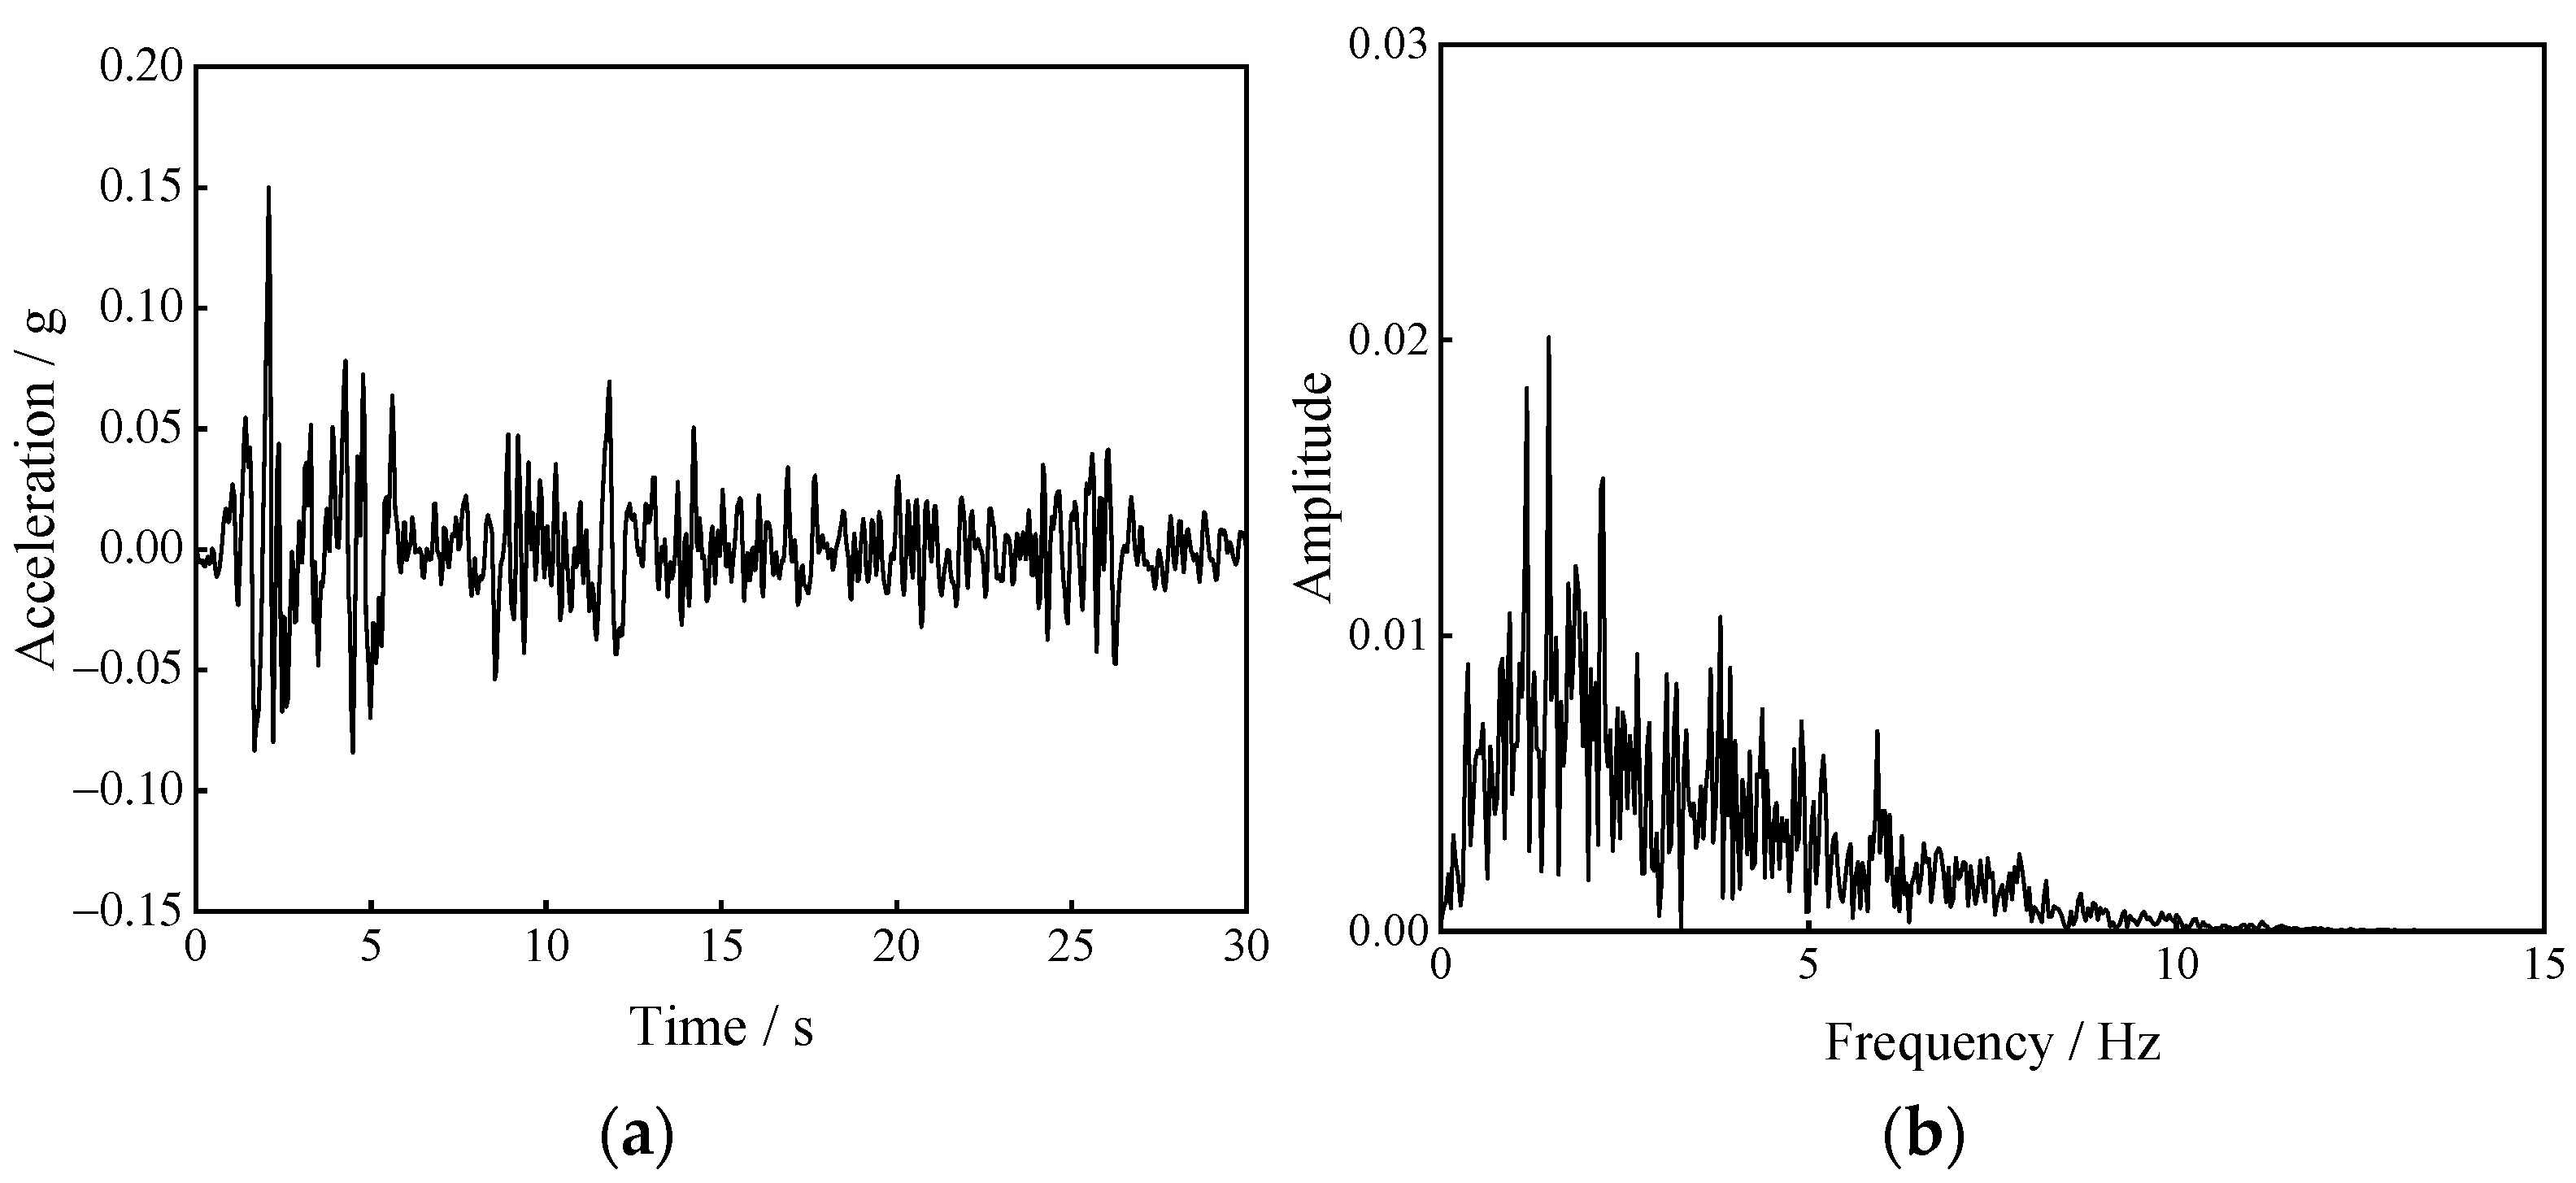
EI Centro wave is selected as the input wave for numerical calculation in this study in accordance with the Chinese standards for Code for Seismic Design of Underground Structures (GB/T51336-2018), Code for Seismic Design of Urban Rail Transit Structures (GB50909-2014), Code for Seismic Design of Building Structures (GB50011-2010) (Code for Seismic Design of Buildings (GB50011-2010) and other factors. The peak value of earthquake acceleration is 0.15 g, the duration is 30 s, and the excitation directions follows the horizontal × direction at the bottom of the model.
In the numerical analysis, the propagation of seismic waves requires a more stringent grid size of the model, where the grid density is adjusted by the input wave’s shortest wave-length, and the maximum grid size should be less than or equal to 0.1–0.125 of the minimum wave length. Accordingly, the initial seismic wave of the input should be made to filter and baseline correct, and the calculated maximum frequency should not be higher than 15 Hz. Figure 8 illustrates the acceleration time history and Fourier amplitude spectrum of EI Centro wave after processing.

4.3. Setting Monitoring Points

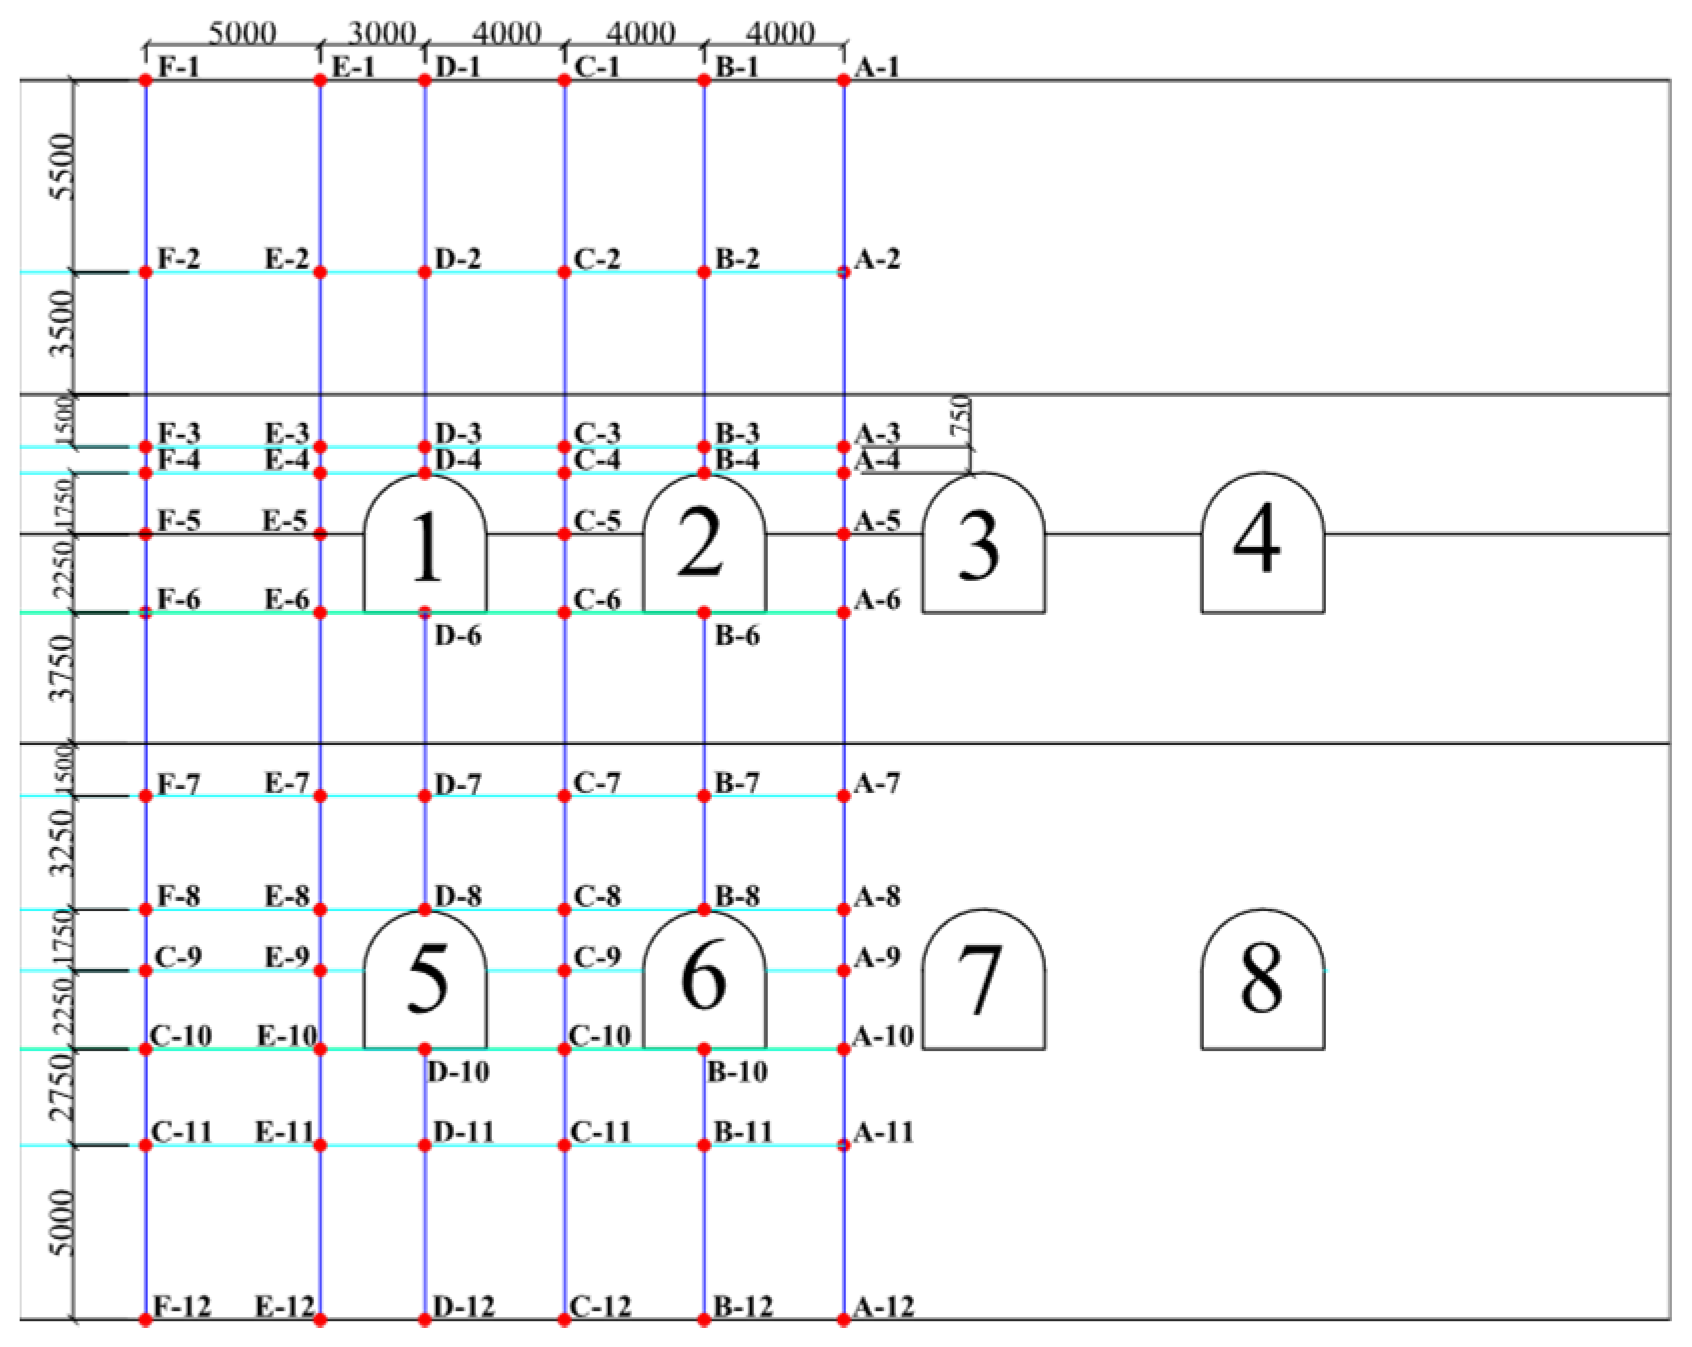
For the recording of displacement and acceleration changes at different positions in soil, monitoring points should be arranged in a numerical model (Figure 9). Due to the symmetric position of the model and the pilot tunnels, only one side of the model is set up with monitoring points numbered A~F from right to left, and the time history and Fourier amplitude spectrum of acceleration and displacement of monitoring points under dynamic response can be obtained by entering commands in the model.

4.4. Simulation Results and Analysis

4.4.1. Acceleration Response Analysis

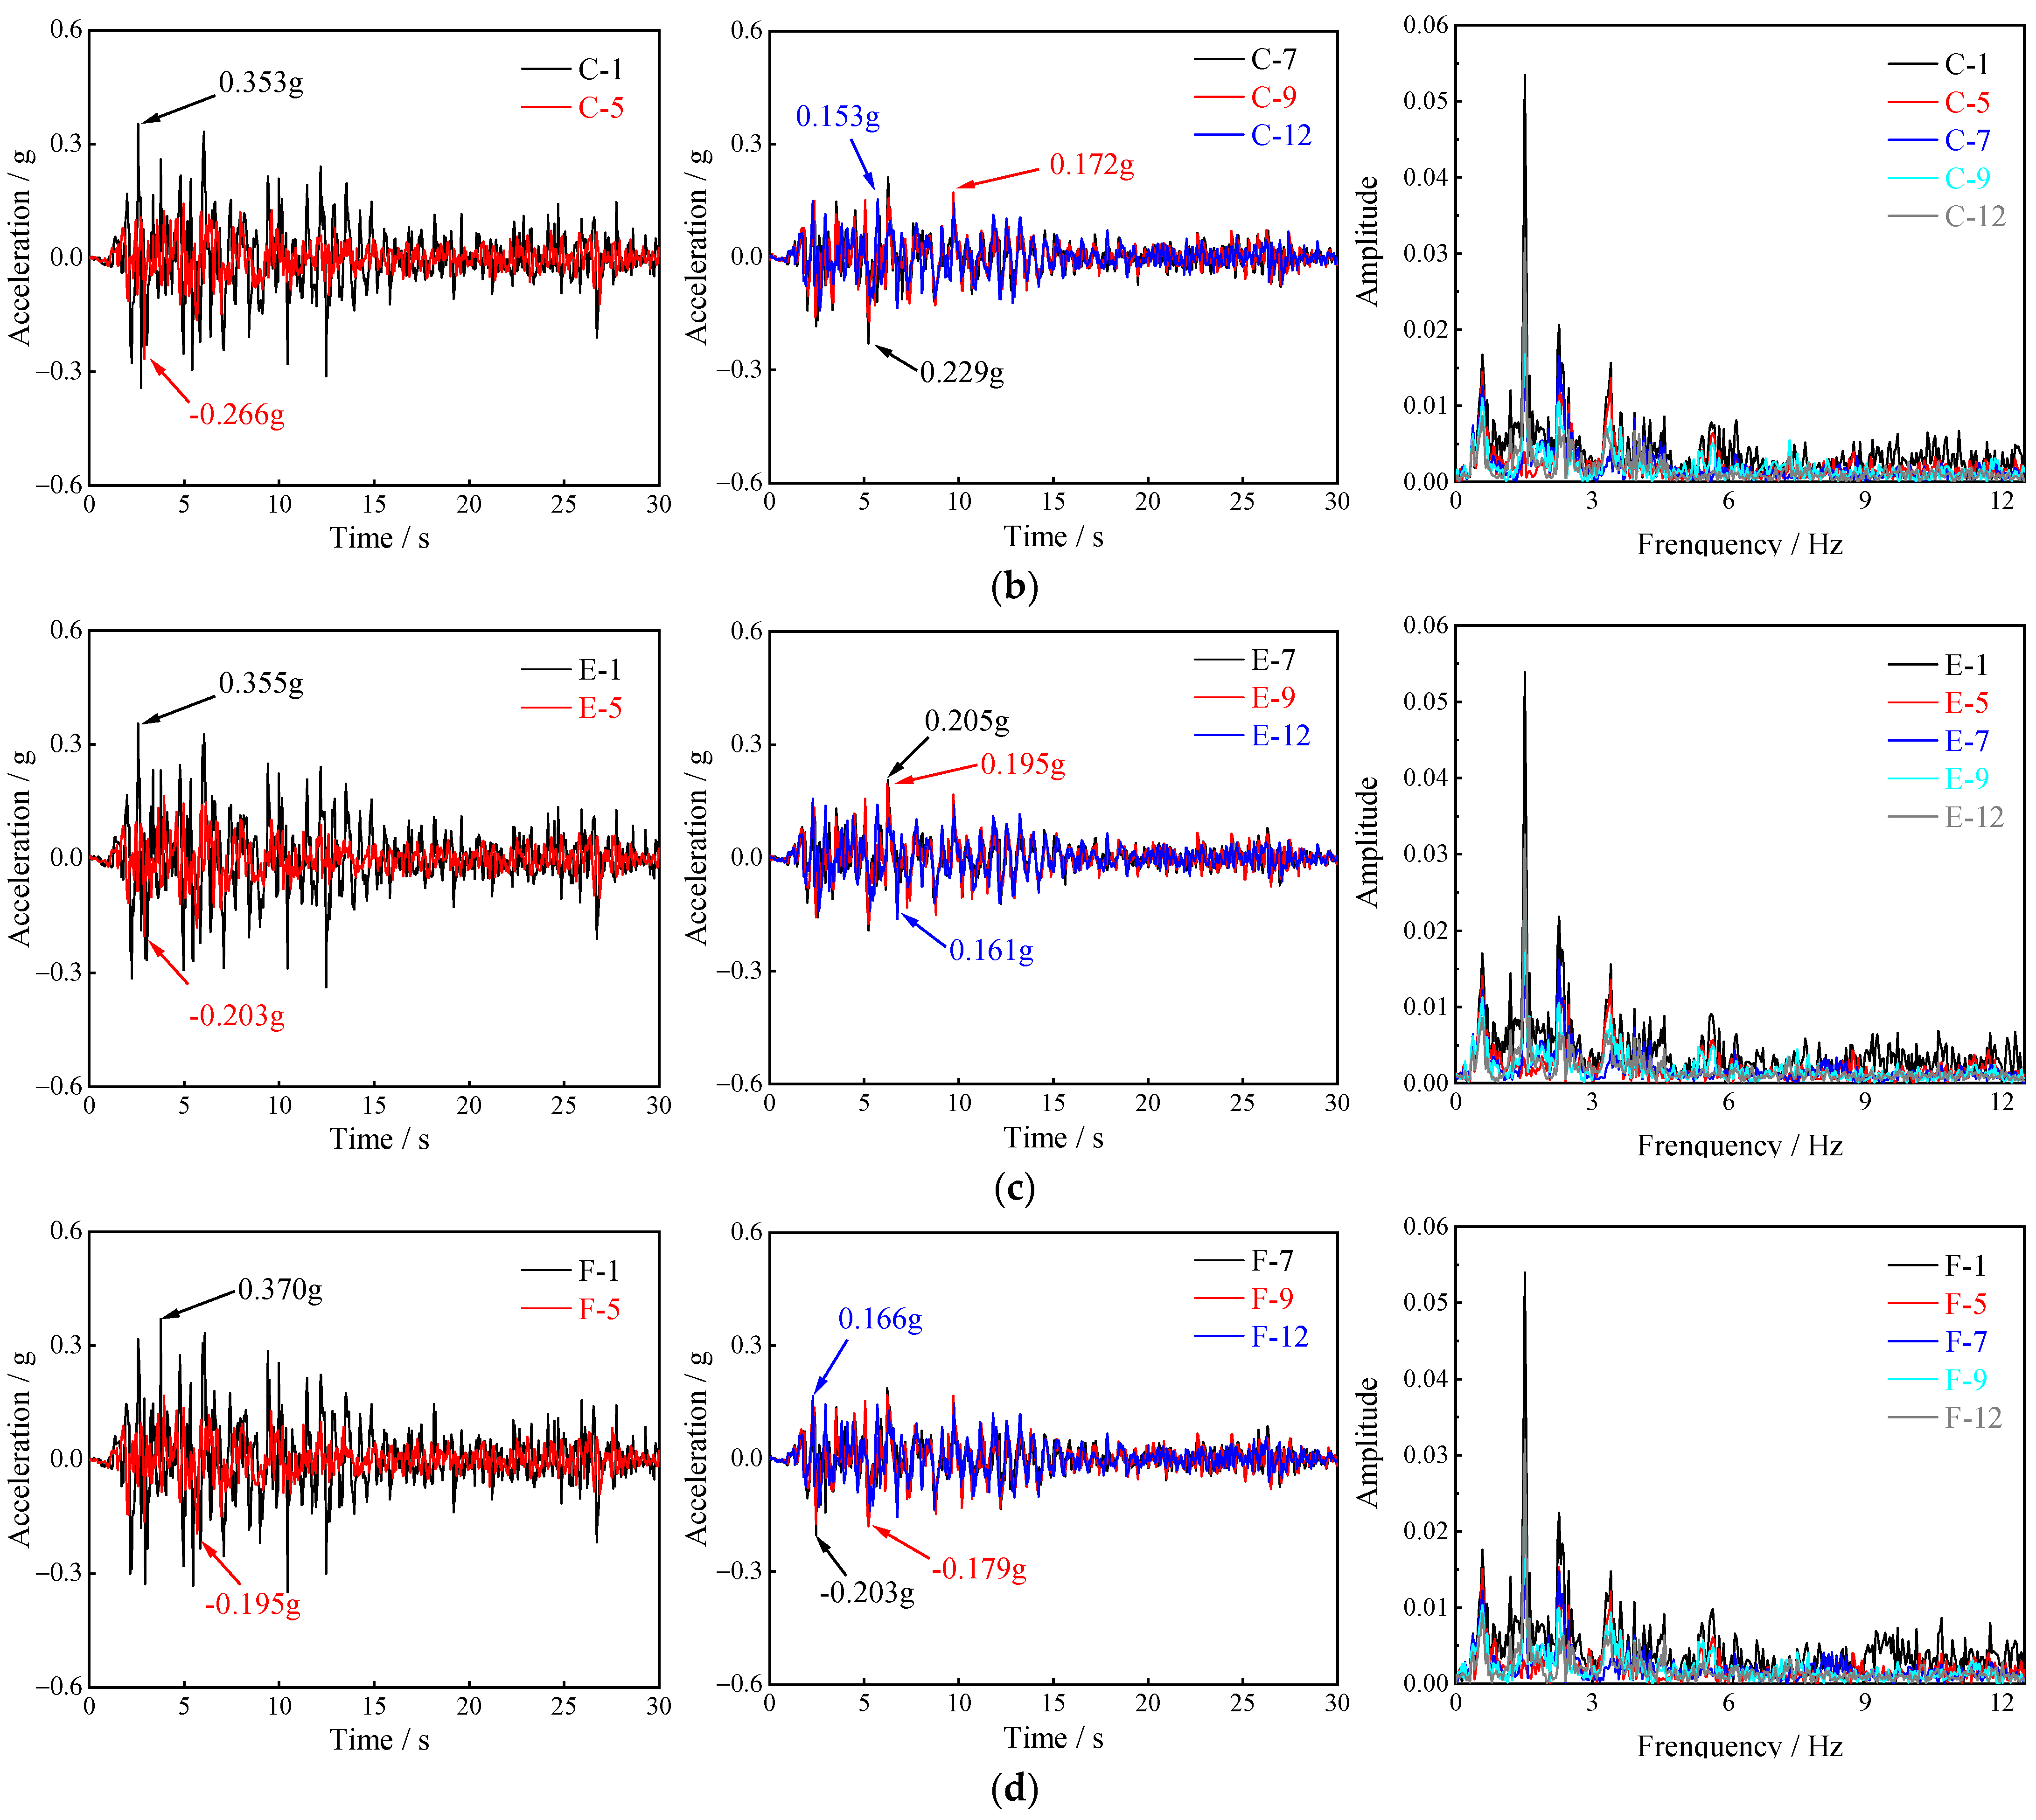
For the exploration of the dynamic response law of the surrounding rock under seis-mic action, the horizontal acceleration dynamic response characteristics of the surrounding rock under EI-Centro wave excitation is analyzed as an example. Figure 10 illustrates the time history and Fourier amplitude spectrum of horizontal acceleration of different monitoring points.
As depicted in Figure 10, the acceleration curves of the respective measurement point under the action of seismic wave of 0.15 g are nearly the same, whereas the peak and the time to reach the peak acceleration of the respective measurement point are difficult. Compared with the input seismic wave, the time to reach the peak acceleration of the respective measurement point has a certain degree of lag, suggesting that when the seismic load is small, the seismic wave in the transmission process dissipates the energy and delays the peak time of seismic waves due to the presence of damping of the surrounding rock and the supporting structure of the pilot tunnels.
The acceleration time curve of the selected measurement points suggests that the peak acceleration of the respective measurement point increases as the relative elevation increases. For A, the peak acceleration increases from 0.162 g to 0.348 g; for C, the peak acceleration increases from 0.153 g to 0.353 g; for E, the peak acceleration increases from 0.161 g to 0.355 g; for F, the peak acceleration increases from 0.166 g to 0.370 g. The above results indicate that there is an amplification effect of acceleration along the elevation. However, in the horizontal direction, the amplification effect of acceleration varies among the measurement points at the same height due to the different locations of the measurement points.
The seismic waves will have different reflection and refraction paths in the propagation process due to the existence of the pilot tunnels, so the Fourier amplitude spectrum of different locations will be different. To explore the characteristics of the seismic response spectrum of the surrounding rock, the Fourier amplitude spectrum curve of partial measurement points is also presented in Figure 9, corresponding to the acceleration time curve in the horizontal direction for some of the monitoring points given above. As depicted in the above figure, under the action of seismic wave, the components and composition of the spectrum of each measurement point remain nearly unchanged, and the dominant frequency are primarily distributed in 0~5 Hz, consistent with the input seismic wave. The distribution of Fourier amplitude spectrum appears multiple single peak features, and the monitoring points generate a significant amplification effect at a certain frequency, roughly at 1.5 Hz.
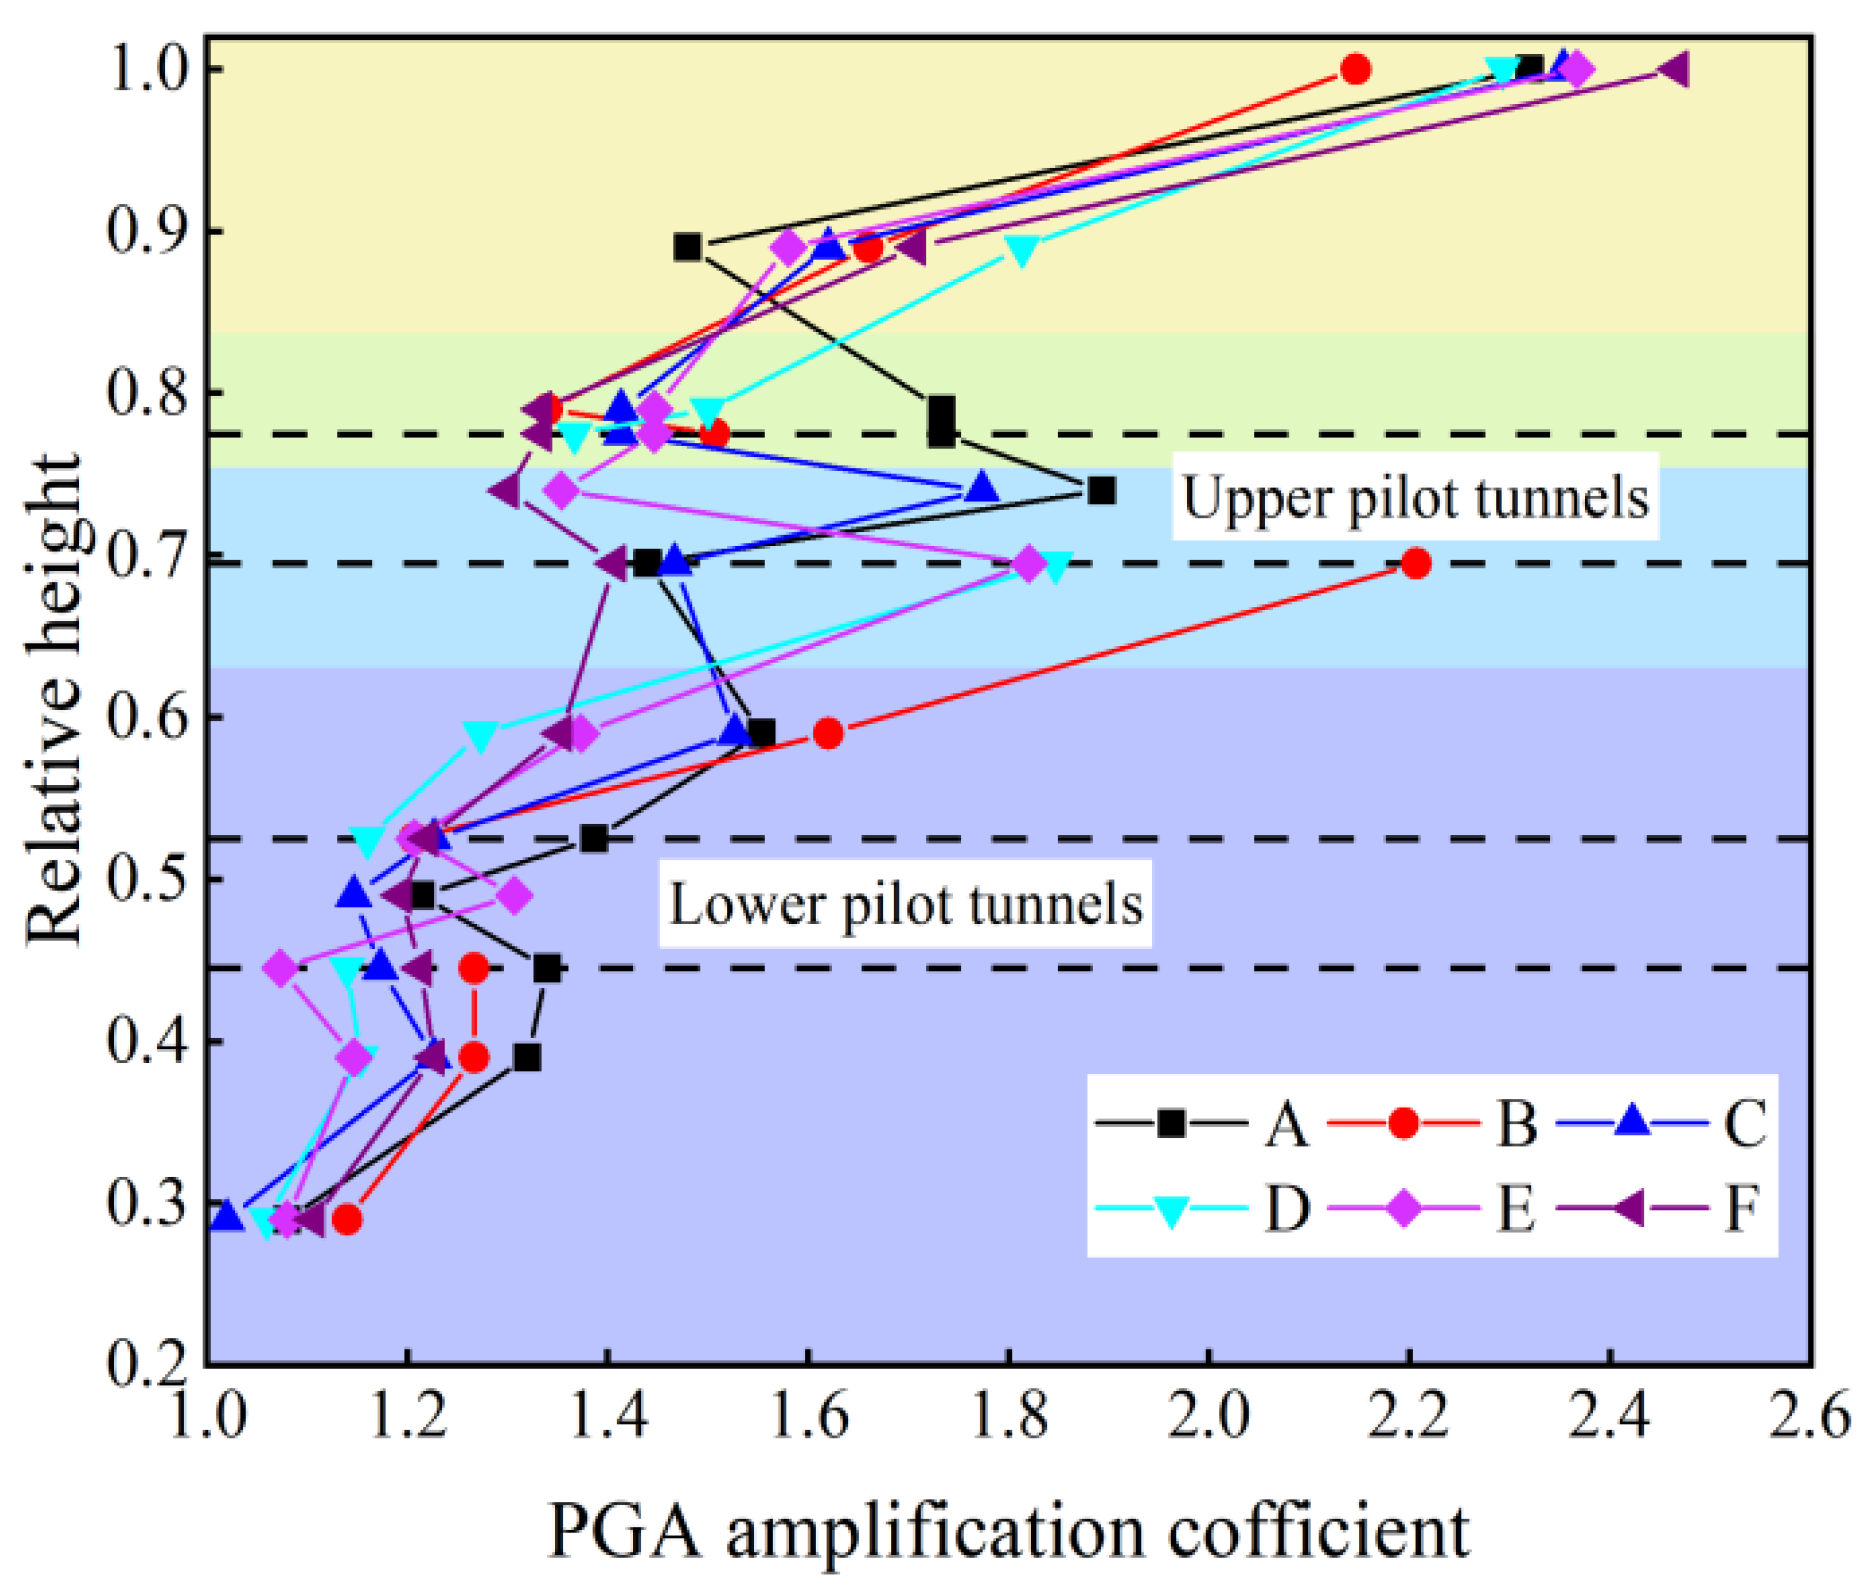
The peak horizontal accelerations of all monitoring points are identified to gain more insights into the dynamic response law of surrounding rock under seismic action. The acceleration amplification coefficients are adopted to contrastively study the acceleration response. To deepen the analysis, the dimensionless PGA (peak ground acceleration) amplification coefficient is introduced, which is defined as the ratio of the peak acceleration measured at the monitoring point to that measured at the input seismic wave excitation. Figure 11 depicts the change in the relative height along the vertical of the horizontal amplification coefficient of monitoring points.
As depicted in Figure 11, under the seismic excitation, the horizontal PGA amplification coefficient of surrounding rock increases with the increase in the elevation, which prevents significant nonlinearity. The PGA amplification coefficient is always in the increasing-decreasing cycle, whereas that maximum is significantly located on the ground surface. The PGA amplification coefficient decreases when the seismic wave propagates through upper pilot tunnels and lower pilot tunnels. Notably, the upper and lower pilot tunnels have a certain amplification effect on the seismic waves, and the amplification effect is significant in the middle of the two pilot tunnels and the upper pilot tunnels, so the acceleration response around the upper pilot tunnels is larger than that of the lower pilot tunnels. Thus, the upper pilot tunnels should be the vital object of observation in the seismic design process, suggesting that there are regional differences in acceleration response in space due to the relationship between the location of the pilot tunnels and the effect of the stratigraphic parameters.

4.4.2. Displacement Response Analysis

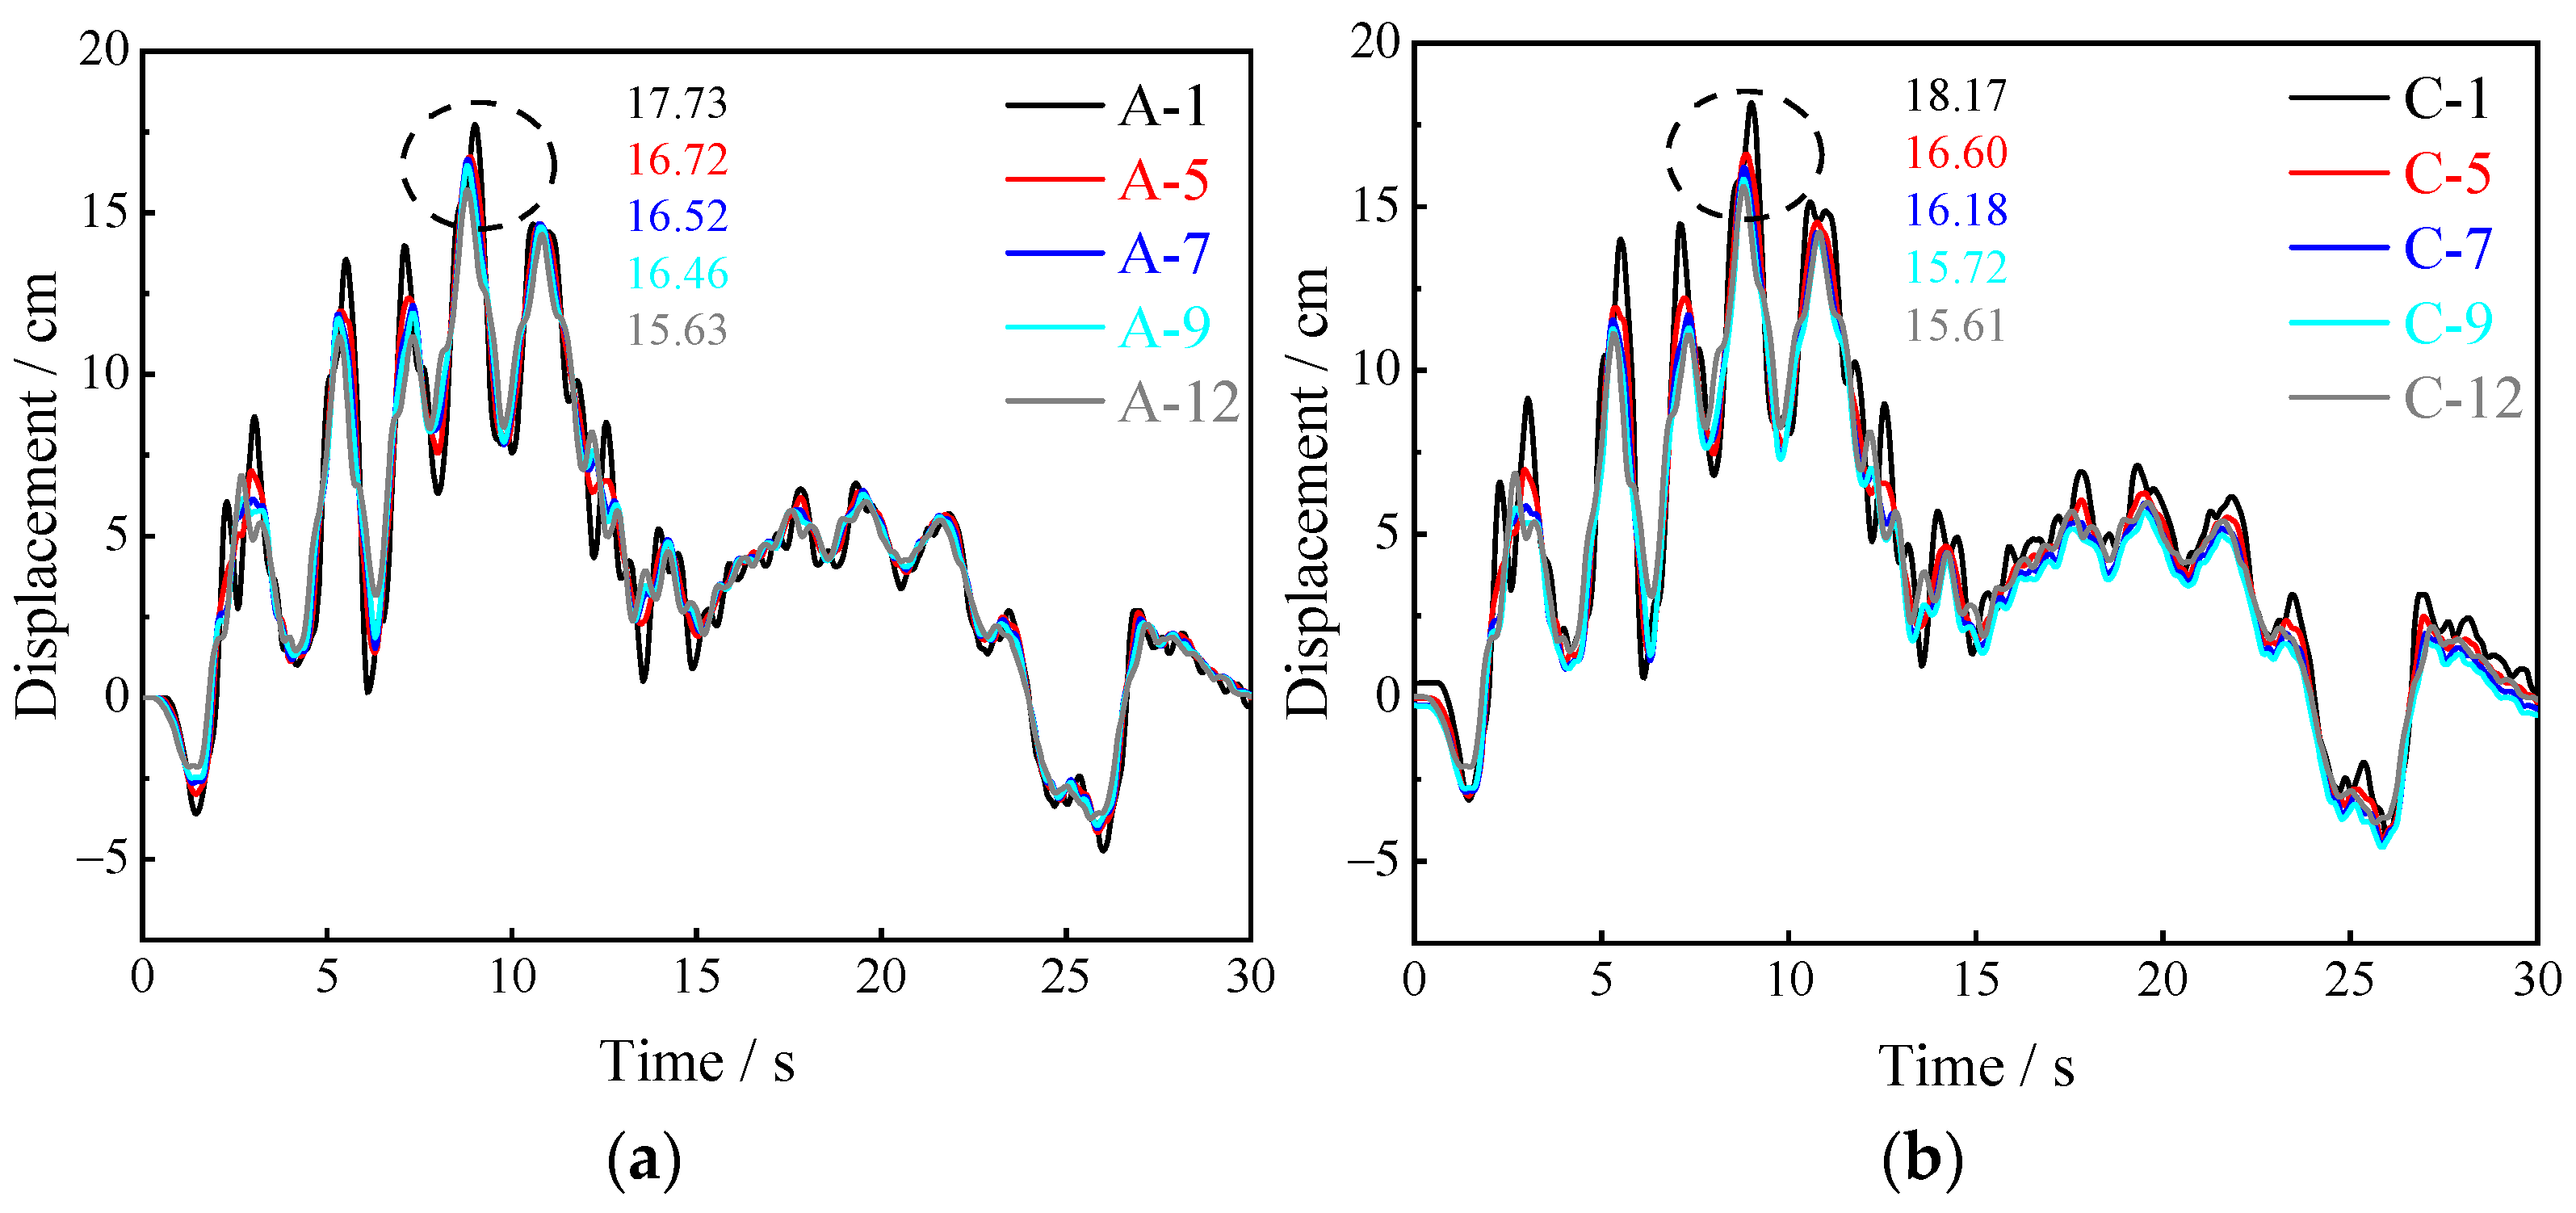
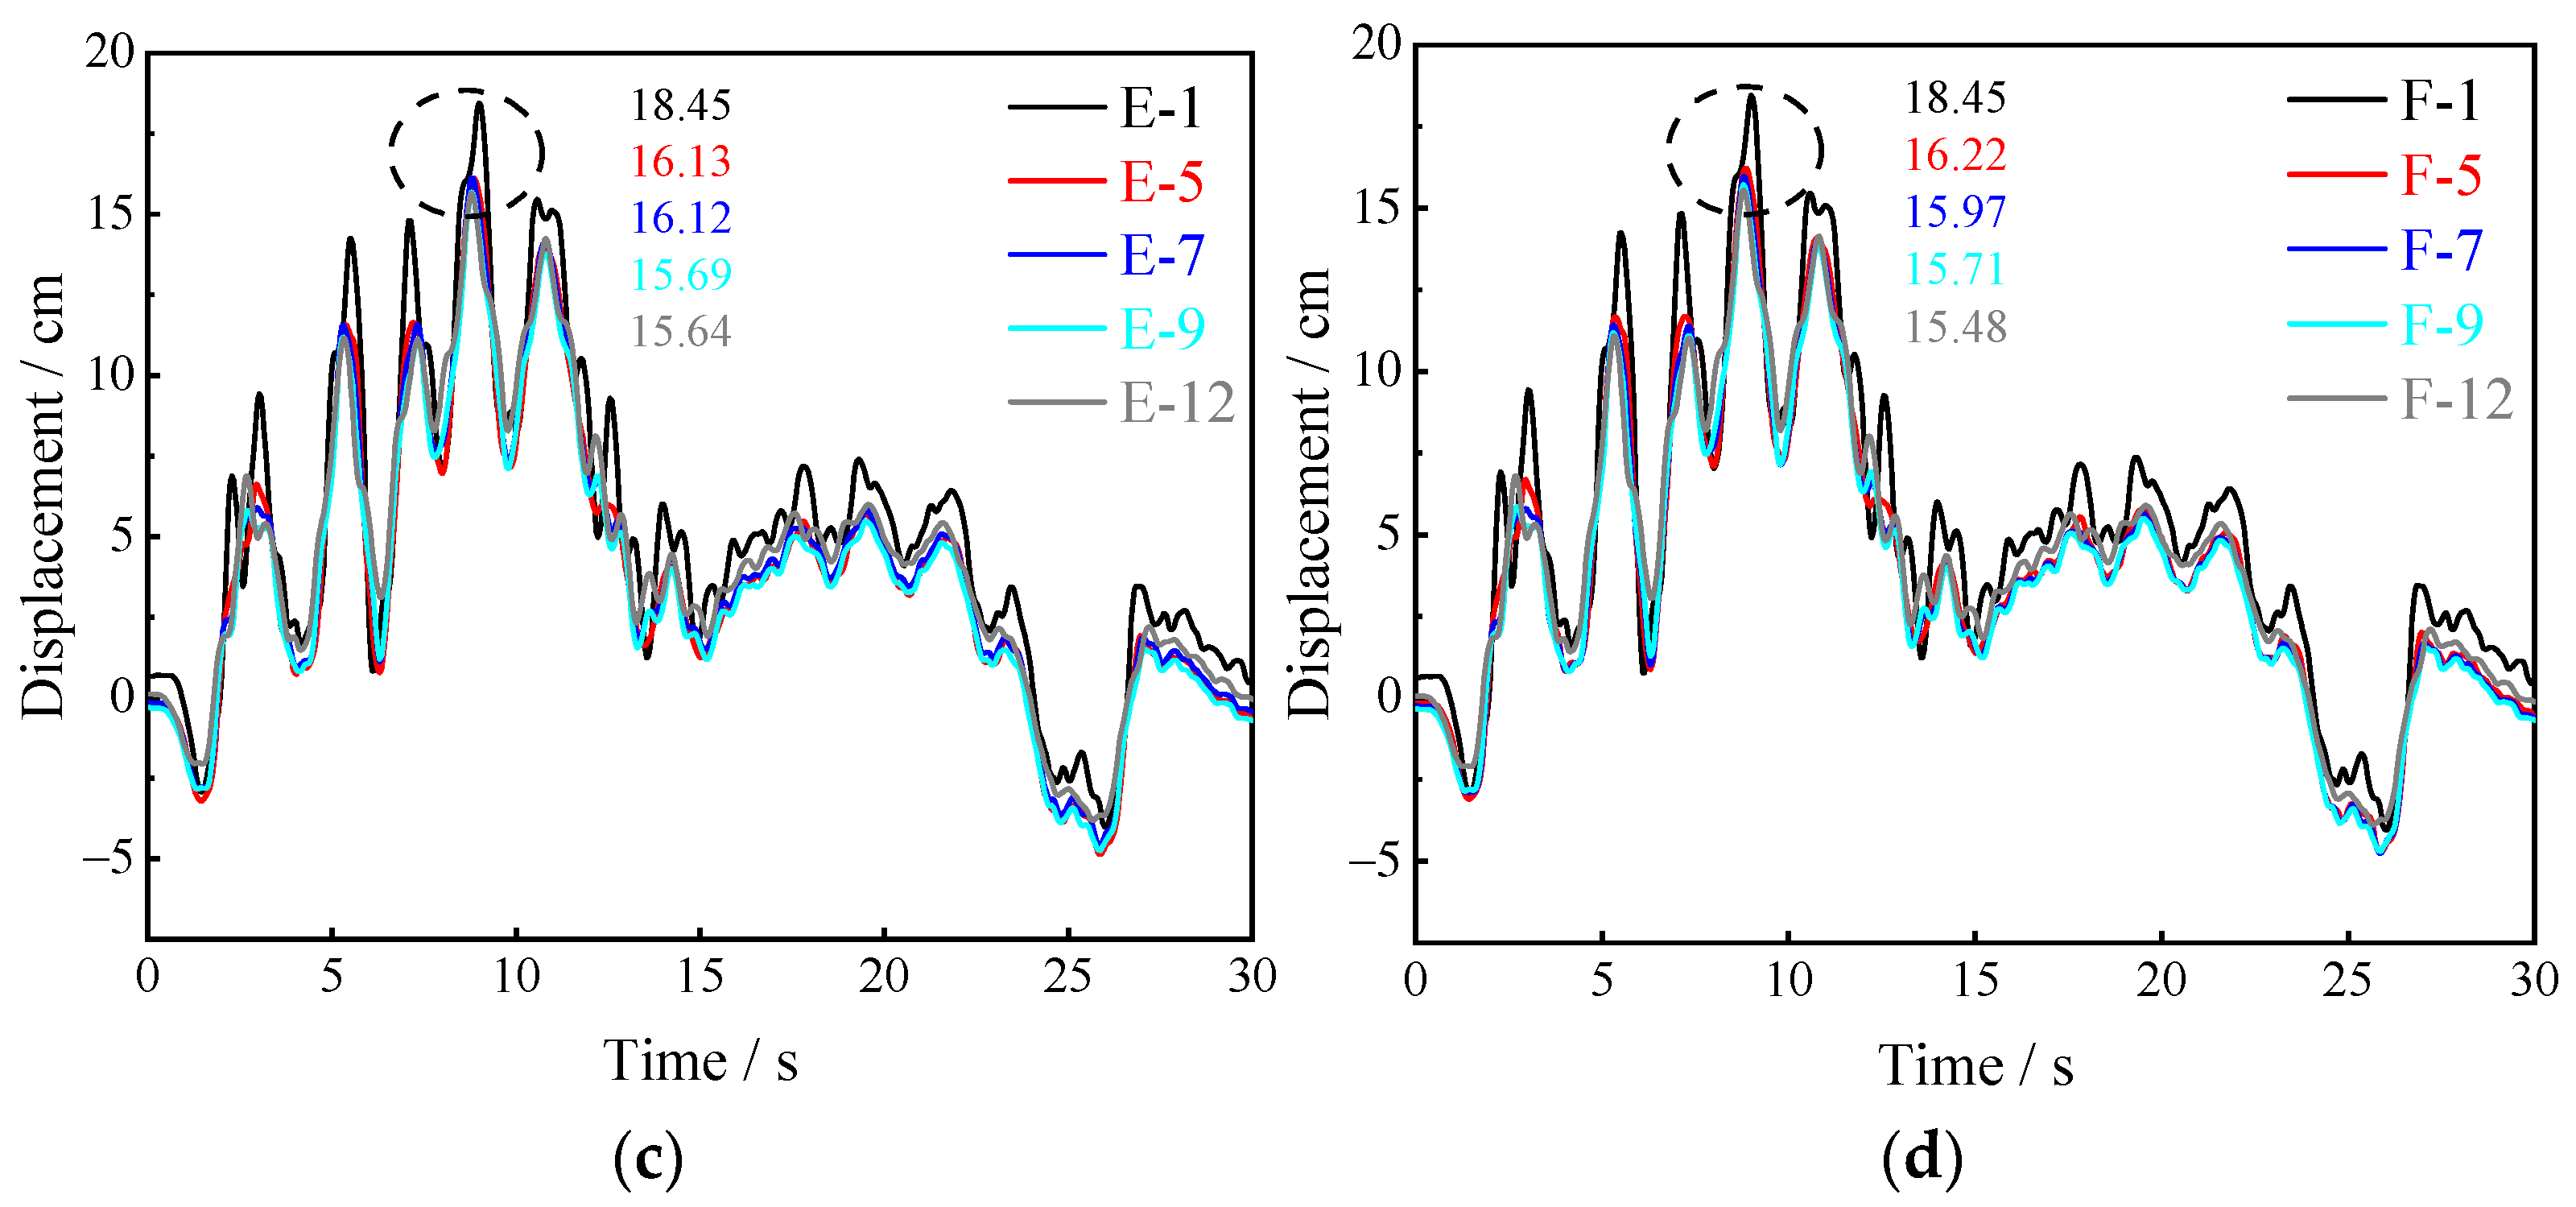
The time histories of the horizontal absolute displacements measured at the partial monitoring points are shown in Figure 12. As depicted in the above figure, although the peak horizontal absolute displacements are different, the absolute displacements at different locations are almost synchronized with time during the whole test, and the motions of the soil are very similar. This indicates that the surrounding soil constrains the motion of the pilot tunnels in the horizontal direction. Moreover, the peak displacements at different monitoring points suggest that the peak horizontal absolute displacements become gradually larger with the increase in the vertical height of the monitoring points. This finding reveals that the PGA has an amplification effect along the relative height during the seismic propagation, and the peak horizontal absolute displacements tend to be amplified increasingly.
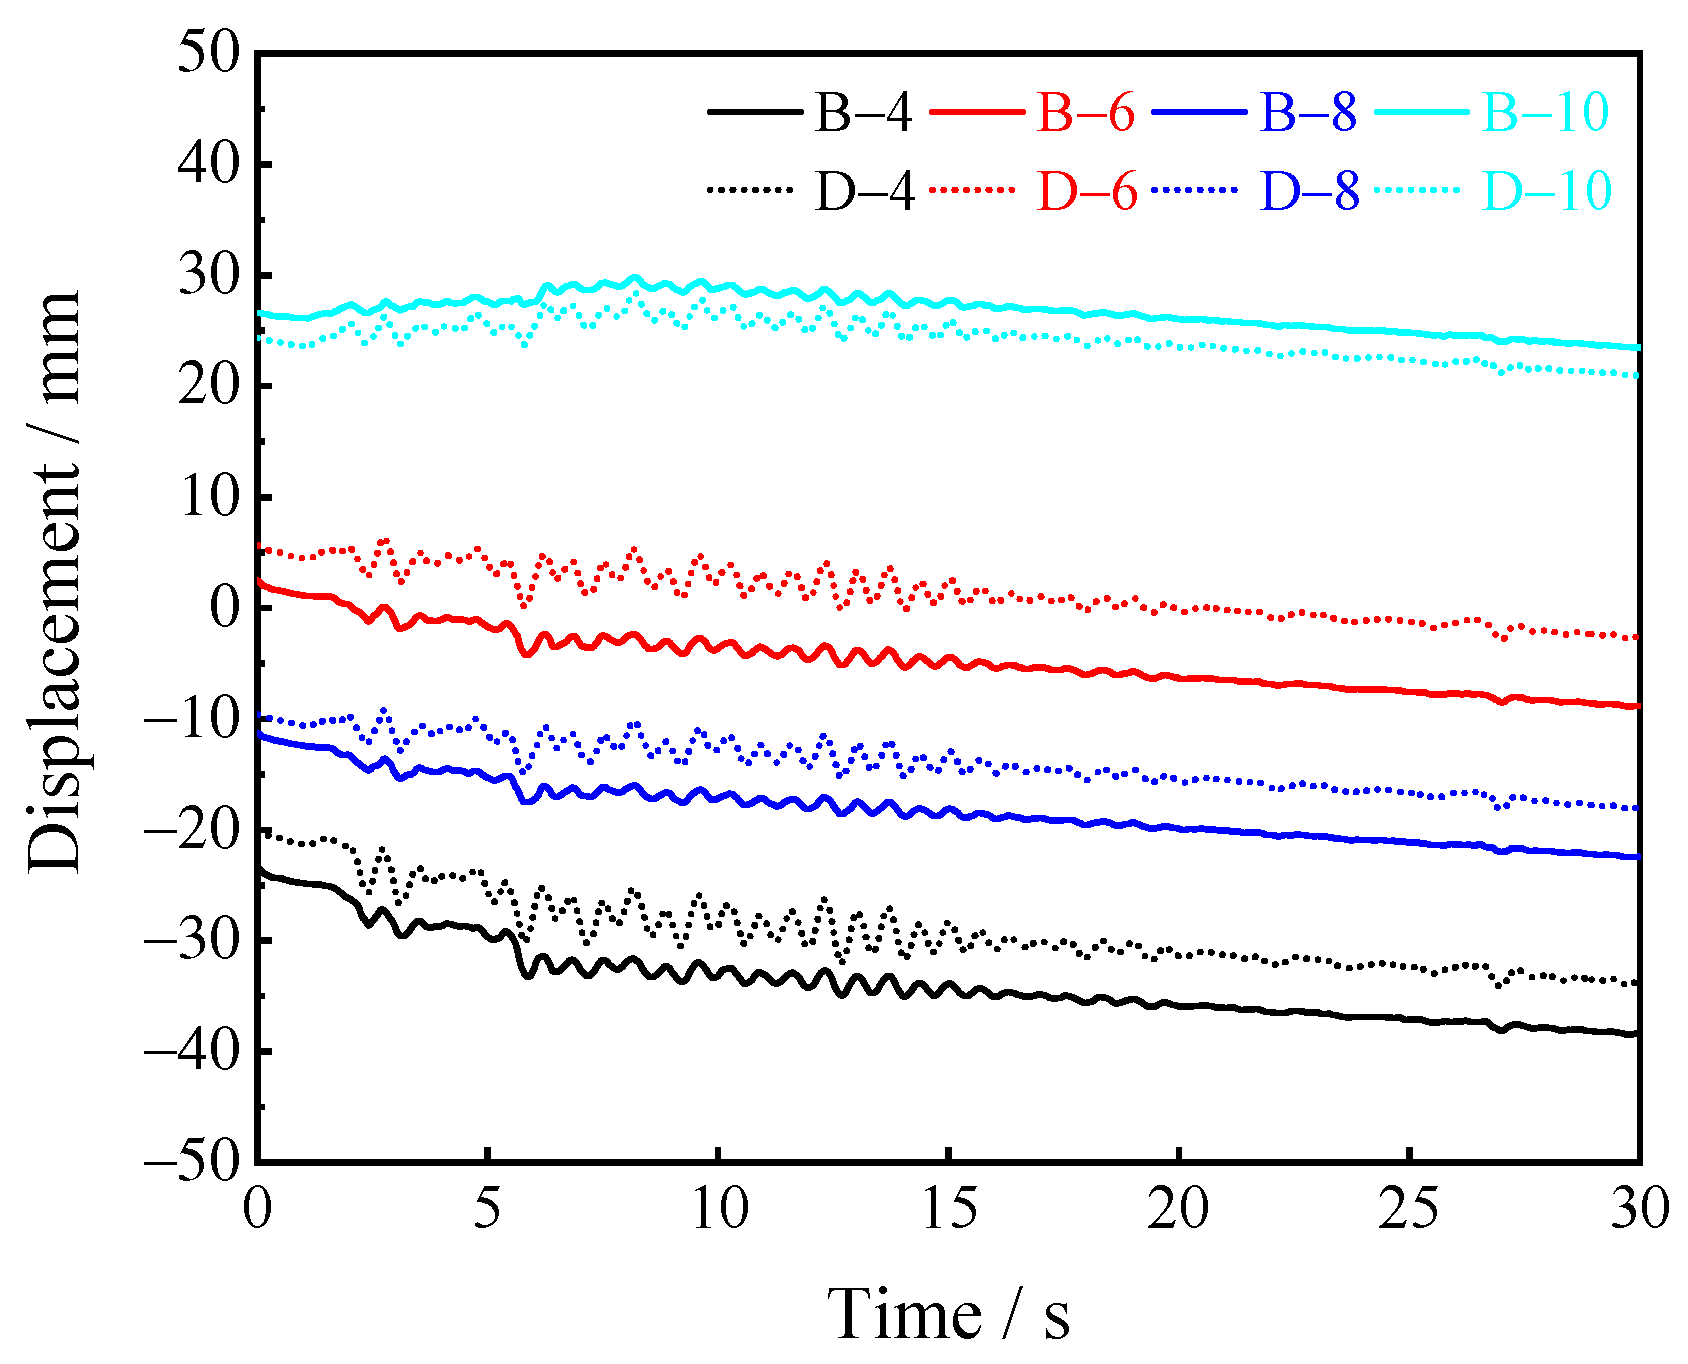
Figure 13 shows the vertical displacement of the number one, number two, number five and number six pilot tunnels’ vault and bottom with time. As depicted in the above figure, when under horizontal seismic excitation, the horizontal acceleration also produces displacement components in the vertical direction. At 0~15 s, the vertical displacement of pilot tunnels at the top and bottom fluctuates in a certain range due to the large acceleration amplitude; at 15~30 s, this fluctuation tends to disappear, and the vertical displacement changes approximately linearly with time. The displacement changes of the monitoring points at the top and bottom of pilot tunnels show that their relative displacements remain nearly unchanged, suggesting that the vertical displacement response of the pilot tunnels and the neighboring soil is nearly the same.
Due to the different load types, the ground response to static and dynamic load may also vary. The ground displacement curves under seismic excitation are shown in Figure 14. As depicted in the above figure, the surface settlement curve under seismic excitation is similar to that of the settlement trough formed by the excavation of the pilot tunnels, as shown in Figure 14a, which is approximately symmetrically distributed along the center of the model; more subsidence continues to be generated under seismic excitation. Figure 14b shows the displacement in the z direction. The displacement in the z direction near the upper pilot tunnels continues to increase under the seismic excitation, whereas the displacement in the z direction near the lower pilot tunnels tends to decrease. This result suggests that under seismic excitation, the formation will generate a greater settlement value (negative values), and the formation uplift displacement (positive values) will decrease.
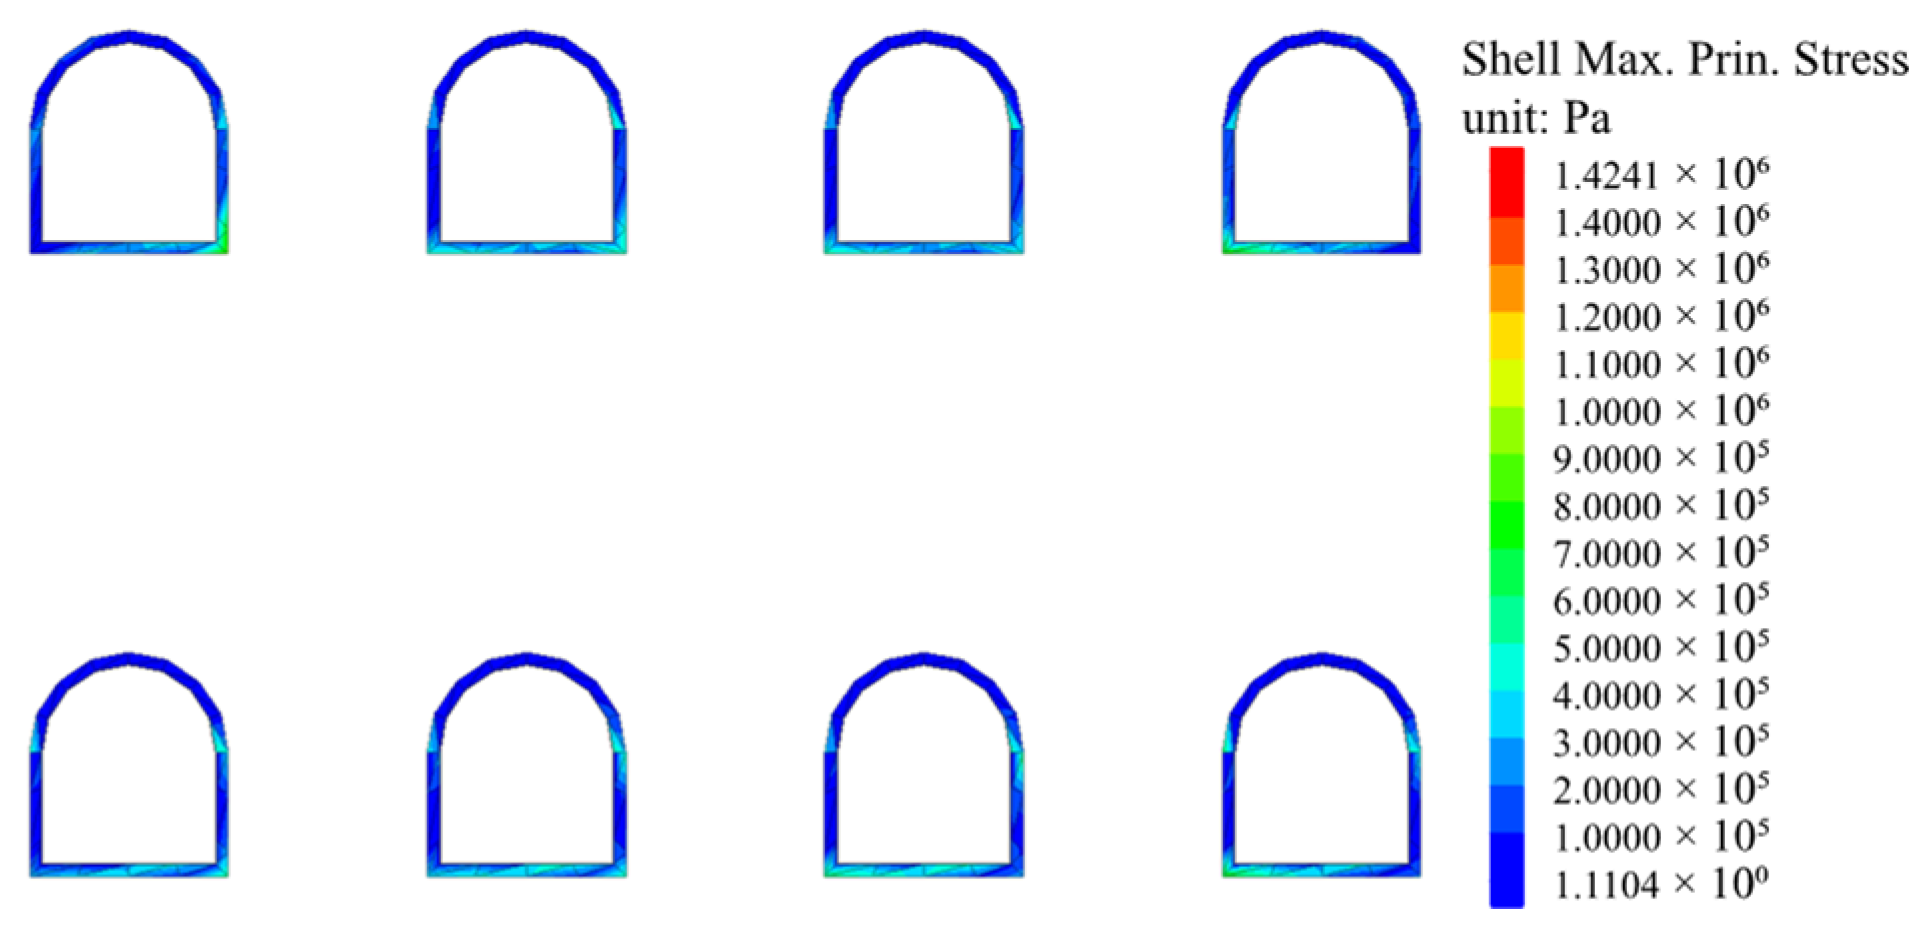
To further study the deformation and failure behavior of the pilot tunnel lining structure, Figure 15 depicts the cloud diagrams of maximum principal stress of the tunnel lining structure at the and seismic excitation under the seismic excitation, the maximum principal stress distribution becomes different again. In addition to the larger maximum principal stress at the foot of the pilot tunnel, the maximum principal stress at the bottom corner of the upper and lower pilot tunnels leads to the generation of a significant stress concentration, and the maximum principal stress value is 1.424 MPa. Accordingly, the bottom corner point of the pilot tunnels should be employed as a critical focus area in the seismic analysis.

5. Conclusions and Discussion

In this study, the excavation of small pilot tunnels in the construction of a subway station using the PBA method is taken as the study object. The changes of surface settlement and ground displacement during the excavation of the pilot tunnels are analyzed in depth through the numerical calculation. After the excavation of the pilot tunnel is completed, seismic excitation is applied to it to investigate the acceleration and displacement response of the coupling between the ground and the pilot tunnels under the dynamic action. Moreover, the deformation and damage modes of the pilot tunnels under the action of dynamic and static loads are compared and analyzed. The conclusions are drawn as follows:
(a)
During the excavation of the pilot tunnels, different excavation sequences cause different ground settlements and ground displacements. For the eight pilot tunnels in this study, the excavation sequence of 2&3→1&4→6&7→5&8 of Plan 2 results in the smallest surface settlement of 20.3 mm. For ground displacement, excavating the upper pilot tunnels first and then the lower pilot tunnels can reduce settlement, which will be larger in the lower pilot tunnels excavation. The maximum principal stress of the lining structure is primarily concentrated at the foot of the arch of the pilot tunnels after the excavation of the pilot tunnels, and the maximum principal stress value is 1.124 MPa. In the construction process, the support strength can be improved, and the soil can be reinforced to reduce the ground displacement.
(b)
After the excavation of the pilot tunnels is completed, due to the coupling effect of the complex stratum and the pilot tunnel lining structure, the horizontal PGA amplification coefficient propagated along the relative height tends to increase with significant nonlinear characteristics under the 0.15 g EI Centro wave excitation. The same phenomenon exists for the peak horizontal absolute displacements. The amplitude leads to a significant amplification effect at a certain frequency, which is nearly 1.5 Hz. The horizontal PGA amplification coefficient at the surface is the largest, and the upper pilot tunnel is significantly affected by the horizontal acceleration, which should be the vital observed object in the seismic design.
(c)
Under seismic excitation, the displacement component will be generated in the vertical direction under the horizontal seismic action, and new surface settlement will be generated continuously. Lastly, a settlement trough similar to that after the excavation will be formed. The ground displacement close to the upper pilot tunnels is even larger. In addition, the maximum principal stress is largely concentrated at the foot of the arch of the pilot tunnels and the bottom corner point of the upper and lower pilot tunnels, and the maximum principal stress value is 1.424 MPa. It is necessary to strengthen the support of the arch foot and bottom corner of the pilot tunnels in the seismic design.
Although considerable meaningful work has been conducted in this study, there are still many areas for improvement in future in-depth studies. For instance, the seismic wave imposed in this study is propagated along the x direction. In the future, seismic waves can be propagated along x, z and x-z directions, and the dynamic response of different seismic wave types, amplitudes, and excitation directions on multiconductor cavities can be studied in depth. In addition, the shaking table test has been confirmed as one of the most common methods to explore the seismic response, and the next work is to combine the numerical simulation with the shaking table test to verify the feasibility of the study. Unlike other subway stations, the PBA method comprises numerous construction processes and many connection nodes between structures, and the dynamic response remains unclear, so it is imperative to study the dynamic response of the subway station after the use of the PBA method.

Author Contributions

Conceptualization, B.H. and Y.B.; software, Y.Z. (Yu Zeng); validation, B.H., Y.Z. (Yu Zou); investigation, B.H.; data curation, B.H. and Y.Z. (Yu Zou); writing—original draft preparation, B.H.; writing—review and editing, B.H., Y.Z. (Yu Zeng); visualization, Y.Z. (Yu Zeng). All authors have read and agreed to the published version of the manuscript.

Funding

This research was funded by the Fundamental Research Funds for the Central Universities, grant No. 2022XJLJ01; by the Natural Science Research Project of Colleges and Universities in Anhui Province, grant No. KJ2018A0118; by the Scientific Research Project of Anhui Polytechnic University, grant No. Xjky110201912.

Institutional Review Board Statement

Not applicable.

Informed Consent Statement

Not applicable.

Data Availability Statement

Not applicable.

Conflicts of Interest

The authors declare no conflict of interest.

References

  1. Lv, J.; Li, X.; Li, Z.; Fu, H. Numerical simulations of construction of shield tunnel with small clearance to adjacent tunnel without and with isolation pile reinforcement. KSCE J. Civ. Eng. 2020, 24, 295–309. [Google Scholar] [CrossRef]
  2. Cao, L.; Fang, Q.; Zhang, D.; Chen, T. Subway station construction using combined shield and shallow tunnelling method: Case study of Gaojiayuan station in Beijing. Tunn. Undergr. Space Technol. 2018, 82, 627–635. [Google Scholar] [CrossRef]
  3. Liu, H.; Song, E. Seismic response of large underground structures in liquefiable soils subjected to horizontal and vertical earthquake excitations. Comput. Geotech. 2005, 32, 223–244. [Google Scholar] [CrossRef]
  4. Liu, X.; Liu, Y.; Qu, W.; Tu, Y. Internal force calculation and supporting parameters sensitivity analysis of side piles in the subway station excavated by Pile-Beam-Arch method. Tunn. Undergr. Space Technol. 2016, 56, 186–201. [Google Scholar] [CrossRef]
  5. Guan, Y.; Zhao, W.; Li, S.; Zhang, G. Key Techniques and Risk Management for the Application of the Pile-Beam-Arch (PBA) Excavation Method: A case study of Zhongjie subway station. Sci. World J. 2014, 2014, 275362. [Google Scholar] [CrossRef] [PubMed] [Green Version]
  6. Yang, X.; Wang, J. Ground movement prediction for tunnels using simplified procedure. Tunn. Undergr. Space Technol. 2011, 26, 462–471. [Google Scholar] [CrossRef]
  7. Chakeri, H.; Ozcelik, Y.; Unver, B. Effects of important factors on surface settlement prediction for metro tunnel excavated by EPB. Tunn. Undergr. Space Technol. 2013, 36, 14–23. [Google Scholar] [CrossRef]
  8. Xu, Y.; Tang, B.; Duan, Y. Research on Surface Settlement of Subway Station Construction Using Pile-Beam-Arch Approach. IOP Conf. Ser. Earth Environ. Sci. 2020, 455, 012167. [Google Scholar] [CrossRef]
  9. Kivi, A.; Sadaghiani, M.; Ahmadi, M. Numerical modeling of ground settlement control of large span underground metro station in Tehran Metro using Central Beam Column (CBC) structure. Tunn. Undergr. Space Technol. 2012, 28, 1–9. [Google Scholar] [CrossRef]
  10. Zeng, Y.; Bai, Y.; Zou, Y.; Huang, B. Numerical Study on Stratigraphic and Structural Deformation Patterns Considering Surface Load with Pile-Beam-Arch Method Construction. Symmetry 2022, 14, 1892. [Google Scholar] [CrossRef]
  11. Duenser, C.; Beer, G. Simulation of sequential excavation with the Boundary Element Method. Comput. Geotech. 2012, 44, 157–166. [Google Scholar] [CrossRef]
  12. Li, B.; Wang, Z. Numerical study on the response of ground movements to construction activities of a metro station using the pile-beam-arch method. Tunn. Undergr. Space Technol. 2019, 88, 209–220. [Google Scholar] [CrossRef]
  13. Liu, X.; Liu, Y.; Yang, Z.; He, C. Numerical analysis on the mechanical performance of supporting structures and ground settlement characteristics in construction process of subway station built by pile-beam-arch method. KSCE J. Civ. Eng. 2017, 21, 1690–1705. [Google Scholar] [CrossRef]
  14. Guo, X.; Jiang, A.; Wang, S.; Gui, Y. Study on the Applicability of an Improved Pile-Beam-Arch Method of Metro Station Construction in the Upper-Soft and Lower-Hard Stratum. Adv. Civ. Eng. 2021, 2021, 6615016. [Google Scholar] [CrossRef]
  15. Huang, B.; Du, Y.; Zeng, Y.; Cao, B.; Zou, Y.; Yu, Q. Study on Stress Field Distribution during the Construction of a Group of Tunnels Using the Pile-Beam-Arch Method. Buildings 2022, 12, 300. [Google Scholar] [CrossRef]
  16. Stepinac, M.; Skokandić, D.; Ožić, K.; Zidar, M.; Vajdić, M. Condition Assessment and Seismic Upgrading Strategy of RC Structures-A Case Study of a Public Institution in Croatia. Buildings 2022, 12, 1489. [Google Scholar] [CrossRef]
  17. Shao, Q.; Ma, J.; Zhu, S. A System Dynamics Approach for Evaluating the Synergy Degree of Social Organizations Participating in Community and Home-Based Elderly Care Services. Buildings 2022, 12, 1491. [Google Scholar] [CrossRef]
  18. Jia, H.; Song, Y.; Chen, X.; Liu, S.; Zhang, B. Seismic Performance Evaluation of a High-Rise Building with Structural Irregularities. Buildings 2022, 12, 1484. [Google Scholar] [CrossRef]
  19. Yue, Y.; Li, C.; Jia, K.; Zhang, Y.; Tian, J. Optimization of the Seismic Performance of a Steel-Concrete Wind Turbine Tower with the Tuned Mass Damper. Buildings 2022, 12, 1474. [Google Scholar] [CrossRef]
  20. Chen, P.; Wu, X. Investigations on the Dynamic Response of Adjacent Buildings Connected by Viscous Dampers. Buildings 2022, 12, 1480. [Google Scholar] [CrossRef]
  21. Wang, W.; Wang, T.; Su, J.; Lin, C.; Seng, C.; Huang, T. Assessment of damage in mountain tunnels due to the Taiwan Chi-Chi Earthquake. Tunnelling Underg. Space Technol. 2001, 16, 133–150. [Google Scholar] [CrossRef]
  22. Miao, Y.; Zhong, Y.; Ruan, B.; Cheng, K.; Wang, G. Seismic response of a subway station in soft soil considering the structure-soil-structure interaction. Tunn. Undergr. Space Technol. 2020, 106, 103629. [Google Scholar] [CrossRef]
  23. Wang, J. Distribution of earthquake damage to underground facilities during the 1976 Tang-shan earthquake. Earthq. Spectra. 1985, 1, 741–757. [Google Scholar] [CrossRef]
  24. Yoo, J.; Park, J.; Park, D.; Lee, S. Seismic Response of Circular Tunnels in Jointed Rock. KSCE J. Civ. Eng. 2018, 22, 1121–1129. [Google Scholar] [CrossRef]
  25. Abate, G.; Massimino, R. Parametric analysis of the seismic response of coupled tunnel-soil-aboveground building systems by numerical modelling. Bull. Earthq. Eng. 2017, 15, 443–467. [Google Scholar] [CrossRef]
  26. Pitilakis, K.; Tsinidis, G.; Leanza, A.; Maugeri, M. Seismic behaviour of circular tunnels accounting forabove ground structures interaction effects. Soil Dyn. Earthq. Eng. 2014, 67, 1–15. [Google Scholar] [CrossRef]
  27. Lee, T.; Park, D.; Nguyen, D.; Park, J. Damage analysis of cut-and-cover tunnel structures under seismic loading. Bull. Earthq. Eng. 2016, 14, 413–431. [Google Scholar] [CrossRef]
  28. Argyroudis, S.; Pitilakis, K. Seismic fragility curves of shallow tunnels in alluvial deposits. Soil Dyn. Earthq. Eng. 2012, 35, 1–12. [Google Scholar] [CrossRef]
  29. Bobet, A. Effect of pore water pressure on tunnel support during static and seismic loading. Tunn. Undergr. Space Technol. 2003, 18, 377–393. [Google Scholar] [CrossRef]
  30. Alzabeebee, S. Seismic response and design of buried concrete pipes subjected to soil loads. Tunn. Undergr. Space Technol. 2019, 93, 103084. [Google Scholar] [CrossRef]
  31. Michael, G. Seismic Design and Analysis of Buried Culverts and Structures. J. Pipeline Syst. Eng. Pract. 2010, 1, 111–119. [Google Scholar] [CrossRef]
  32. Abuhajar, O.; El Naggar, H.; Newson, T. Seismic soil-culvert interaction. Can. Geotech. J. 2015, 52, 1649–1667. [Google Scholar] [CrossRef] [Green Version]
  33. Abuhajar, O.; El Naggar, H.; Newson, T. Experimental and numerical investigations of the effect of buried box culverts on earthquake excitation. Soil Dyn. Earthq. Eng. 2015, 79, 130–148. [Google Scholar] [CrossRef]
  34. Chen, C.; Wang, T.; Jeng, F.; Huang, T. Mechanisms causing seismic damage of tunnels at different depths. Tunn. Underg. Space Technol. 2012, 28, 31–40. [Google Scholar] [CrossRef]
  35. Xu, Z.; Du, X.; Xu, C.; Jiang, J.; Han, R. Simplified equivalent static methods for seismic analysis of shallow buried rectangular underground structures. Soil Dyn. Earthq. Eng. 2019, 121, 1–11. [Google Scholar] [CrossRef]
  36. Cilingir, U.; Madabhushi, S. Effect of depth on seismic response of circular tunnels. Can. Geotech. J. 2010, 48, 117–127. [Google Scholar] [CrossRef]
  37. Cilingir, U.; Madabhushi, S. Effect of depth on the seismic response of square tunnels. Soils Found. 2011, 51, 449–457. [Google Scholar] [CrossRef] [Green Version]
  38. Gazetas, G.; Psarropoulos, P.; Anastasopoulos, I.; Gerolymos, N. Seismic behaviour of flexible retaining systems subjected to short-duration moderately strong excitation. Soil Dyn. Earthq. Eng. 2004, 24, 537–550. [Google Scholar] [CrossRef]
  39. Tsinidis, G. Response characteristics of rectangular tunnels in soft soil subjected to transversal ground shaking. Tunn. Undergr. Space Technol. 2017, 62, 1–22. [Google Scholar] [CrossRef]
  40. Cilingir, U.; Madabhushi, S. A model study on the effects of input motion on the seismic behaviour of tunnels. Soil Dyn. Earthq. Eng. 2011, 31, 452–462. [Google Scholar] [CrossRef]
  41. Hatzigeorgiou, G.; Beskos, D. Soil-structure interaction effects on seismic inelastic analysis of 3D tunnels. Soil Dyn. Earthq. Eng. 2010, 30, 851–861. [Google Scholar] [CrossRef]
  42. Ma, C.; Lu, D.; Du, X.; Qi, C.; Zhang, X. Structural components functionalities and failure mechanism of rectangular underground structures during earthquakes. Soil Dyn. Earthq. Eng. 2019, 119, 265–280. [Google Scholar] [CrossRef]
  43. Ma, M.; Brady, B.H. Analysis of the dynamic performance of an underground excavation in jointed rock under re-peated seismic loading. Geotech. Geol. Eng. 1999, 17, 1–20. [Google Scholar] [CrossRef]
  44. Amorosi, A.; Boldini, D. Numerical modelling of the transverse dynamic behaviour of circular tunnels in clayey soils. Soil Dyn. Earthq. Eng. 2009, 29, 1059–1072. [Google Scholar] [CrossRef]
  45. Yang, D.; Naesgaard, E.; Byrne, P.; Adalier, K.; Abdoun, T. Numerical model verification and calibration of George Massey Tunnel using centrifuge models. Can. Geotech. J. 2004, 41, 921–942. [Google Scholar] [CrossRef]
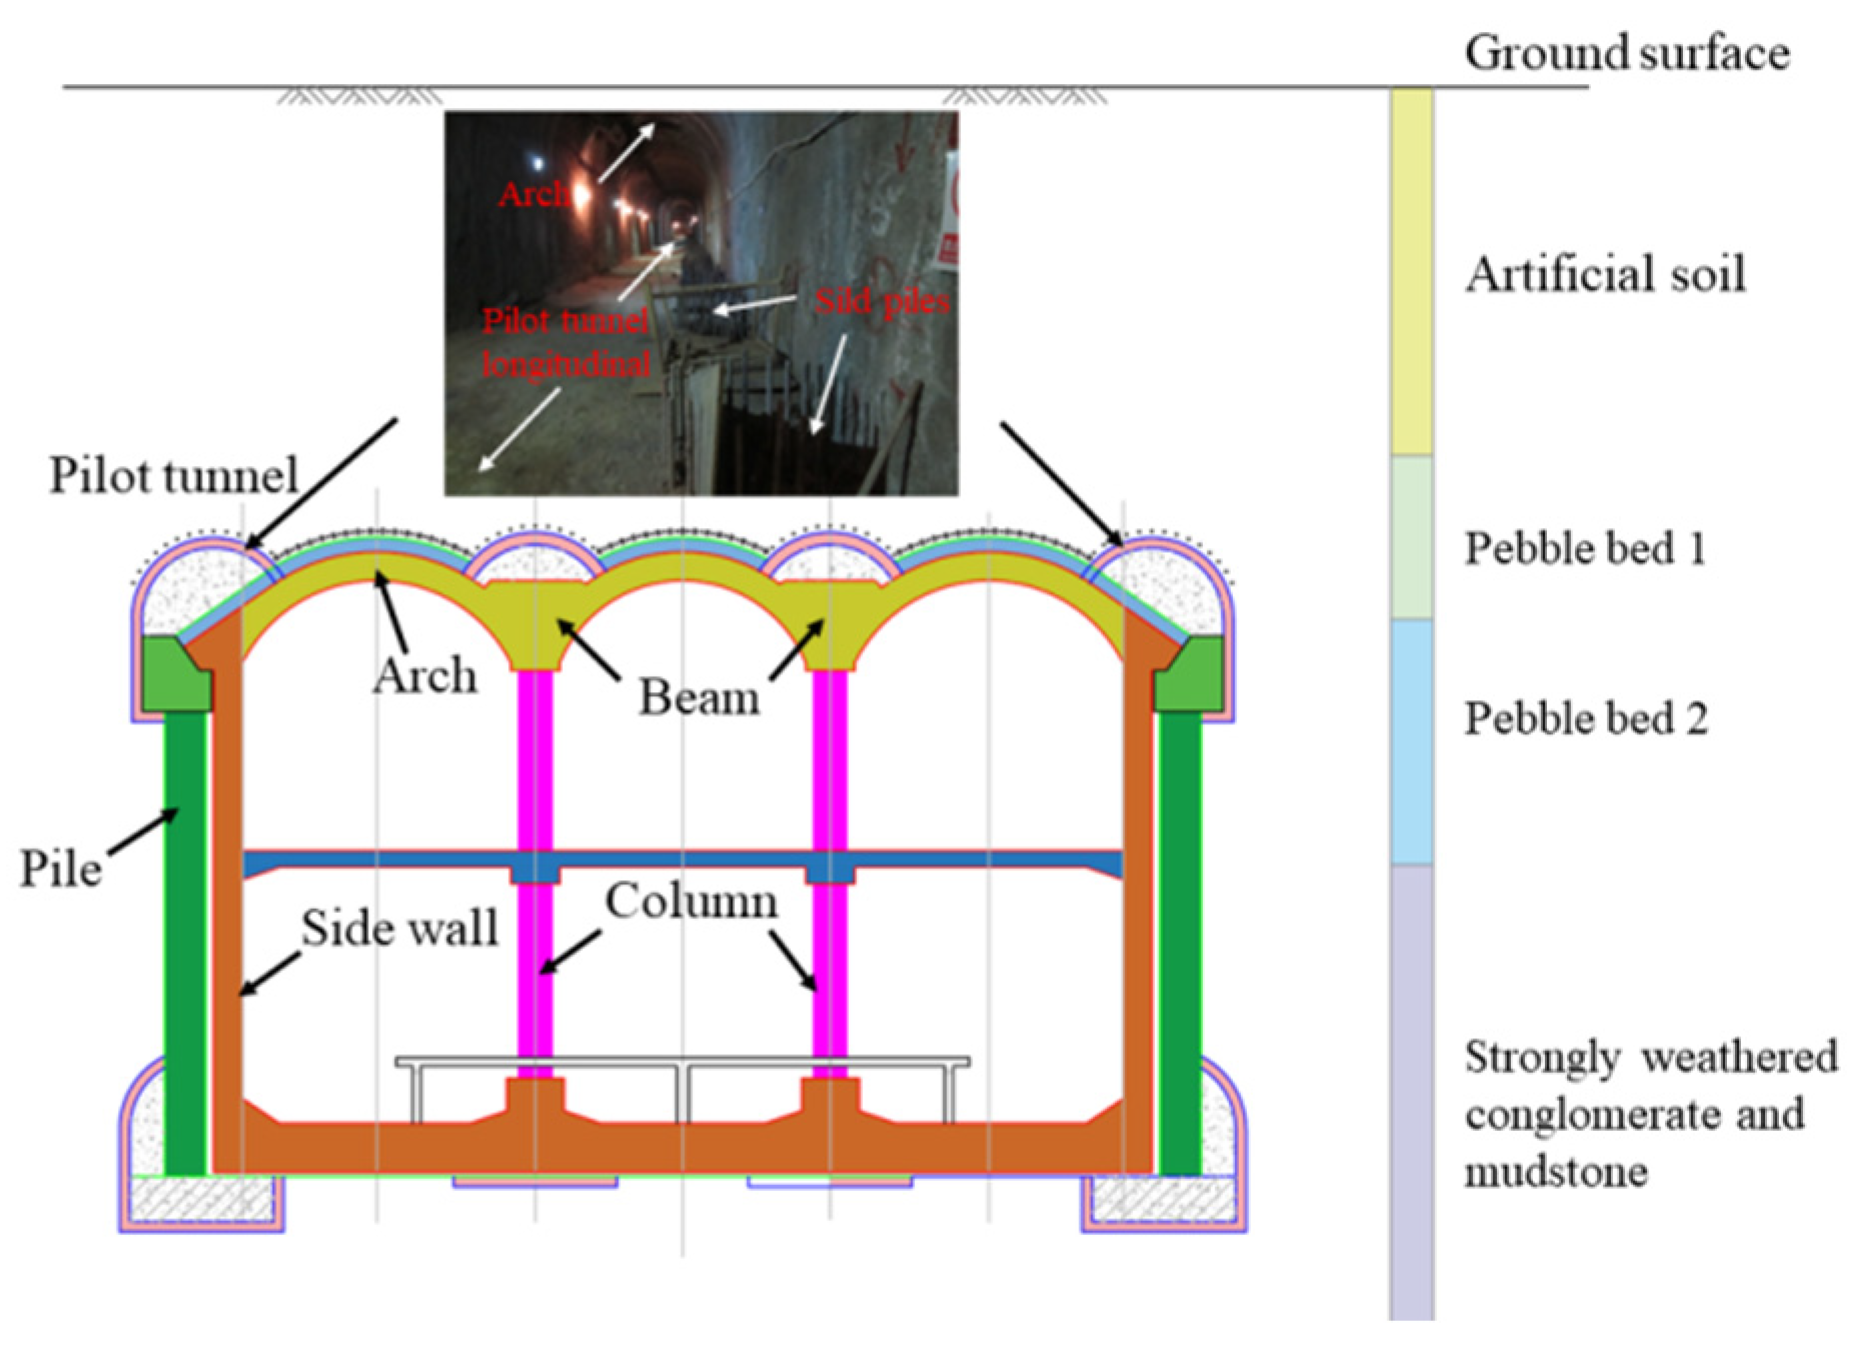
Figure 1. Structural profile of Daguanying station.
Buildings 12 01719 g001
Figure 2. Model for numerical simulation: (a) numerical model, (b) primary linings of the pilot tunnels and (c) boundary condition of the numerical model (unit: m).
Buildings 12 01719 g002
Figure 3. Ground surface settlement in the four excavation plans: (a) 1&4→2&3→5&8→6&7, (b) 2&3→1&4→6&7→5&8, (c) 5&8→6&7→1&4→2&3 and (d) 6&7→5&8→2&3→1&4.
Buildings 12 01719 g003
Figure 4. Vertical stress field distribution.
Buildings 12 01719 g004
Figure 5. Ground displacement in the four excavation plans: (a) 1&4→2&3→5&8→6&7, (b) 2&3→1&4→6&7→5&8, (c) 5&8→6&7→1&4→2&3 and (d) 6&7→5&8→2&3→1&4.
Buildings 12 01719 g005
Figure 6. Maximum principal stress distribution of pilot tunnels supporting structure under static excitation.
Buildings 12 01719 g006
Figure 7. Dynamic numerical model.
Buildings 12 01719 g007
Figure 8. Acceleration time history Fourier amplitude spectrum of EI Centro wave: (a) time history and (b) Fourier spectrum.
Buildings 12 01719 g008
Figure 9. Monitoring points layout (unit: mm).
Buildings 12 01719 g009
Figure 10. Time history and Fourier amplitude spectrum of acceleration-x at partial monitoring points: (a) monitoring point A, (b) monitoring point C, (c) monitoring point E and (d) monitoring point F.
Buildings 12 01719 g010aBuildings 12 01719 g010b
Figure 11. Variation in horizontal amplification coefficient of monitoring points along the model height.
Buildings 12 01719 g011
Figure 12. Relative horizontal displacement of monitoring points under seismic excitation: (a) monitoring point A, (b) monitoring point C, (c) monitoring point E and (d) monitoring point F.
Buildings 12 01719 g012aBuildings 12 01719 g012b
Figure 13. Relative vertical displacement of monitoring points around pilot tunnels under seismic excitation.
Buildings 12 01719 g013
Figure 14. Ground settlement caused by seismic excitation:(a) ground surface settlement (b) ground displacement in the z direction.
Buildings 12 01719 g014
Figure 15. Maximum principal stress distribution of pilot tunnels supporting structure under seismic excitation.
Buildings 12 01719 g015
Table 1. Parameters of the soil mass and primary lining.
ItemsElastic Modulus
(MPa)
Poisson’s RatioCohesion
(kPa)
Internal Friction Angle
(°)
Density
(kg·m−3)
Artificial soil230.310181950
Pebble bed 1630.250.5402070
Pebble bed 2750.230.8322000
strongly weathered conglomerate and mudstone1050.260352150
Grid steel frame25,0000.3--2300
Publisher’s Note: MDPI stays neutral with regard to jurisdictional claims in published maps and institutional affiliations.