Article

Simplified Models to Capture the Effects of Restraints in Glass Balustrades under Quasi-Static Lateral Load or Soft-Body Impact

Department of Engineering and Architecture, University of Trieste, 34127 Trieste, Italy
*
Author to whom correspondence should be addressed.
Buildings 2022, 12(10), 1664; https://doi.org/10.3390/buildings12101664
Submission received: 4 September 2022 / Revised: 22 September 2022 / Accepted: 8 October 2022 / Published: 12 October 2022
(This article belongs to the Collection Innovation in Structural Analysis and Dynamics for Constructions)

Abstract

:
Structural glass balustrades are usually composed of simple glass panels which are designed under various restraint solutions to minimize large out-of-plane deflections and prematurely high tensile/compressive stress peaks under lateral loads due to crowd. Linear supports, point-fixing systems, and others can be used to create geometrical schemes based on the repetition of simple modular units. Among others, linear restraints that are introduced at the base of glass panels are mechanically described in the form of ideal linear clamps for glass, in which the actual geometrical and mechanical details of real fixing components are reduced to rigid nodal boundaries. This means that, from a modelling point of view, strong simplifications are introduced for design. In real systems, however, these multiple components are used to ensure appropriate local flexibility and adequately minimize the risk of premature stress peaks in glass. The present study draws attention to one of these linear restraint solutions working as a clamp at the base of glass panels in bending. The accuracy and potential of simplified mechanical models in characterizing the effective translational and rotational stiffness contributions of its components are addressed, with the support of efficient and accurate Finite Element (FE) numerical models and experimental data from the literature for balustrades under double twin-tyre impact. Intrinsic limits are also emphasized based on parametric calculations in quasi-static and dynamic regimes.

1. Introduction

The use of structural glass in buildings for load-bearing components is rather common [1]. Especially for transparent barriers and balustrades, glass panels can be variably assembled and arranged with a multitude of restraint types and boundary conditions (Figure 1). While commonly associated with regular and simple (i.e., squared or rectangular) flat modular shapes, glass panels for balustrades can be characterized by the presence of holes for point-fixings and should, in any case, be verified against equivalent lateral loads [2] in terms of tensile stress peaks at the Ultimate Limit State (ULS) and deflections at the Serviceability Limit State (SLS). Careful attention is also required for the Collapse Limit State (CLS) so as to include possible partial fracture mechanisms at the design stage. Besides the intrinsic geometrical simplicity and repeatability, rather complex mechanical phenomena should be taken into account for structural design. Major issues can derive from characterization in terms of material properties (including damage constitutive models, strain rate effects, etc.), load description, or even mechanical description of the effects due to restraints and connections in use [3], especially in the framework of Finite Element (FE) numerical models. For structural performance assessment, current design standards prescribe that specific impact pendulum test configurations should be taken into account to experimentally verify the load-bearing capacity of a given balustrade (EN 12600 [4], DIN 18008-4 [5], etc.).
Several research studies of the literature, in this regard, explored various mechanical and load-bearing aspects of selected glass panel solutions of practical interest under the effect of impactors, offering support to design detailing and even FE numerical modelling.
Structurally speaking, human-induced impact loads should be properly addressed for safe design purposes and—when possible—supported by accurate but computationally efficient numerical models [6]. In this regard, traditional in-service glass windows have been experimentally and numerically explored under the effects of ball drop/hard-body impact setup in [7]. The vulnerability of historic glass facades subjected to soft-body/bird-strike impact has been numerically assessed in [8], with the support of in-field experimental characterizations and Coupled Eulerian Lagrangian (CEL) numerical models. Small-scale and full-scale glass columns have been explored in [9,10] under soft-body and hard-body impactor conditions, including the analysis of preliminary damage in glass elements. New reduced models for the analysis of glass panels under soft-body impact have been presented in [11,12] with the goal of determining the maximum principal stresses of a given glass system when subjected to the dynamic impact of double twin-tyre, based on computationally efficient numerical analysis. A simplified modelling strategy has been proposed in [13] for glass panels under both spheroconical bag impact and double twin-tyre impact. Further numerical efforts have been proposed in [14] for glass balustrades under soft-body impact.
Glass balustrades have been experimentally and numerically explored in [15,16] under both static lateral loads and impact. The experimental and numerical study reported in [17] further explored the response of glass balustrades under soft-body impact by taking into account the effects of partial glass damage. The use of non-destructive tools and methods for glass systems under dynamic loads has also been experimentally assessed, such as the use of digital image correlation and video tracking in [18] for simple monolithic glass elements under random impact or optical measurements for laminated glass (LG) balustrades presented in [19].
The present study draws attention to the mechanical characterization of glass balustrades under lateral loads and impact and to the analytical derivation of simplified mechanical models (SM1 to SM4, in the following) to support their efficient and safe structural design and verification. Attention is given to glass balustrade panels with linear base restraints. As such, detailed analytical models are used for the definition of a set of empirical equations that are presented to support the calibration of computationally efficient FE numerical models, where the contribution of various restraint components could be efficiently schematized in the form of equivalent springs. In doing so, a semi-analytical calculation approach is followed, with the major result being that the finally assembled FE models can be strongly simplified in terms of geometrical components, mechanical interactions, and, thus, computational costs. These simplified components are typically used in real balustrade systems to prevent premature stress peaks in glass, accommodate the deformations due to imposed design loads, and mitigate the glass panels regarding premature damage or even collapse.
For detailed calculation purposes, the attention of the present study is given to the geometrical and mechanical features of experimental samples discussed in [17]. As shown, the reported idealized models and simplified semi-analytical calculations often suffer from approximate mechanical descriptions of basic restraint components, which have a fundamental role in the prediction of the overall bending response of glass balustrades. Comparative results are hence discussed in Section 5 to assess the accuracy of the SM1-to-SM4 models, giving evidence of their potentials and intrinsic limits.

2. Research Study

2.1. Methodology and Goal

In design practice, linearly restrained glass balustrades are often schematized according Figure 2. A given glass panel can in fact be assumed to be fixed at the base by geometrically complex metal profiles, as in Figure 2a, and subjected to horizontal load P at the unrestrained edge of its bending span L.
While such a continuous restraint is expected to offer high rigidity against lateral loads, it is also asked to preserve a local deformation capacity for the glass panel so as to prevent premature stress peaks in glass.
In terms of glass and its resistance verification check, the typical analytical analysis follows the mechanical model representative of (i) a glass cantilever under nodal load P at the unrestrained end, with corresponding maximum tensile stress peaks at the base end of glass with the ideally rigid clamp restraint (see Figure 2b). Such a model represents the simplest approach for glass stress and deflection analysis and roughly describes the effect of real fixing systems, as well as their mechanical interaction with the glass panel in out-of-plane bending.
Alternatively, the structural analysis can be schematized based on still simplified but more articulated mechanical models, as, for example, in the approaches (ii) or (iii) in Figure 2c,d. There, as shown, equivalent springs are uniformly distributed (in the width of the balustrade) to capture—with specific attention to the restraints in use—the expected maximum stress peaks and out-of-plane lateral deflections for the glass panel in bending. To the extent that the fixing system of Figure 2a is schematized in the form of equivalent translational springs—as in Figure 2c, for example—it is assumed that, under the effects of a given lateral load P, the fixing system reacts to the glass panel in bending with a transversal reaction force Fk, which should be taken into account in terms of equivalent spring, as follows:
k t = F k δ p r o f i l e = P x δ p r o f i l e
with x being the distance defined in Figure 2c.
Similarly, the fixing system of Figure 2a can be mechanically characterized in the form of an equivalent rotational stiffness term, as in Figure 2d, where:
k ϑ = M θ = P L s i n 1 δ p r o f i l e / H p r o f i l e
and the contribution of this kind of spring is still associated with reproducing the possible out-of-plane bending response of an assembled glass balustrade with a linear base restraint. However, the simplified analytical descriptions and ideal restraints above are known to introduce approximations in real boundaries and system components. For LG components, moreover, attention should be given to the use of “composite” sections with equivalent monolithic glass thicknesses, as in the so-called EET approach [20].
As an alternative to simple analytical procedures, computationally expensive FE numerical models could be developed to account for all the primary and secondary components in this kind of assembled system. In Figure 3, an example of a full three-dimensional (3D) solid brick model for the system of Figure 2 is shown, with evidence of global assembled components and restraint details. While such a modelling approach can efficiently support the analysis of a wide set of possible configurations of technical interest, it is generally characterized by long modelling and simulation times and may also involve additional uncertainties in terms of materials characterization, mechanical interaction calibrations, and kinematic constraint definitions.
In this paper, the attention is thus focused on the development, calibration, and assessment of different simplified mechanical models for the structural analysis of typical glass modular units in use for balustrades. Parametric numerical calculations are carried out in ABAQUS [21]. The proposed investigation shows how the effect of details and their mechanical description in FE codes can affect the overall estimation of stress and deformation trends and distributions for rather simple mechanical systems and thus possibly affect the subsequent design assumptions.
To this aim, a past experimental study, recalled in Section 2.2, is taken into account for the validation of various mechanical models. In doing so, a linear elastic constitutive behaviour is taken into account for glass components, while the attention is primarily focused on the characterization of base restraint components and on the analysis of their effects on glass balustrade performance, including stress distributions and deflection trends.
Based on literature feedback, a “Refined” FE numerical model is first developed to support accurate comparisons with simplified approaches (Section 3). A set of four different simplified mechanical models are then separately developed and investigated under quasi-static lateral loads and soft-body impact conditions. First, the models SM1 and SM2 are derived and calibrated in Section 4 based on the definition of discrete/lumped equivalent springs which are introduced in the same location of real restraint components. Successively, based on the simplified SM2 concept, two additional simplified models, agreeing, respectively, with Figure 2c,d, are developed and assessed under quasi-static and dynamic loading. In this latter case, the major feature is represented by the presence of linearly distributed springs for translation (SM3) or rotation (SM4) restraints, which are introduced at the bottom of the glass panel for the analysis of the glass modular unit under the effects of conventional lateral loads. A summary of presently developed mechanical models is reported in Table 1.

2.2. Reference Glass Balustrade

The balustrade experimentally and numerically discussed in [17] is taken into account for the present study. The specimen in Figure 4a is characterized by the total dimension B = 1000 × L = 1200 mm2 and a double LG section (10/10.4 in thickness) composed of tempered glass panes (10 mm in thickness) and bonding Polyvinyl butyral (PVB®, 1.52 mm in thickness). The bottom linear connection consists of two 10 mm-thick steel plates, which are rigidly fixed to a base support via M10 class 8.8 bolts (length lb, area Ab), distributed as schematized in Figure 4. Additional setting blocks (ASB = hSB = 30 × bSB = 120 mm2 in dimensions, with tSB being their thickness) are used at the glass–steel interface to provide soft support to the glass panel in out-of-plane bending and to avoid premature stress peaks in the region of restraints. An additional supporting system consisting of two polyurethane blocks (50 mm wide, 8 mm thick) is introduced at the bottom edge of the glass panel and placed at a distance of 150 mm from the lateral edges, with the goal of preventing further stress peaks and premature glass breakage at the base edges.
The original experiments reported in [17] were carried out in accordance with EN 12600 provisions, including various impact configurations. In doing so, a conventional double twin-tyre impactor was used, while changing its drop height. As in Figure 4a, for all the impact configurations, the analysis included the measure of lateral displacements (P1, P2), glass stresses (S1, S2), and impactor acceleration (A1). A detailed FE model was also presented in [17] to explore and support the experimental findings.
The presently developed “Refined” FE model of Figure 4b–d was thus preliminary implemented in ABAQUS [21] for validation towards the experimental data from [17], as well as for further support for simplified mechanical models. Once the accuracy of the Refined model was assessed, this latter model was in fact also used to address the detailed calibration and validation of the proposed SM1-to-SM4 mechanical models summarized in Table 1.

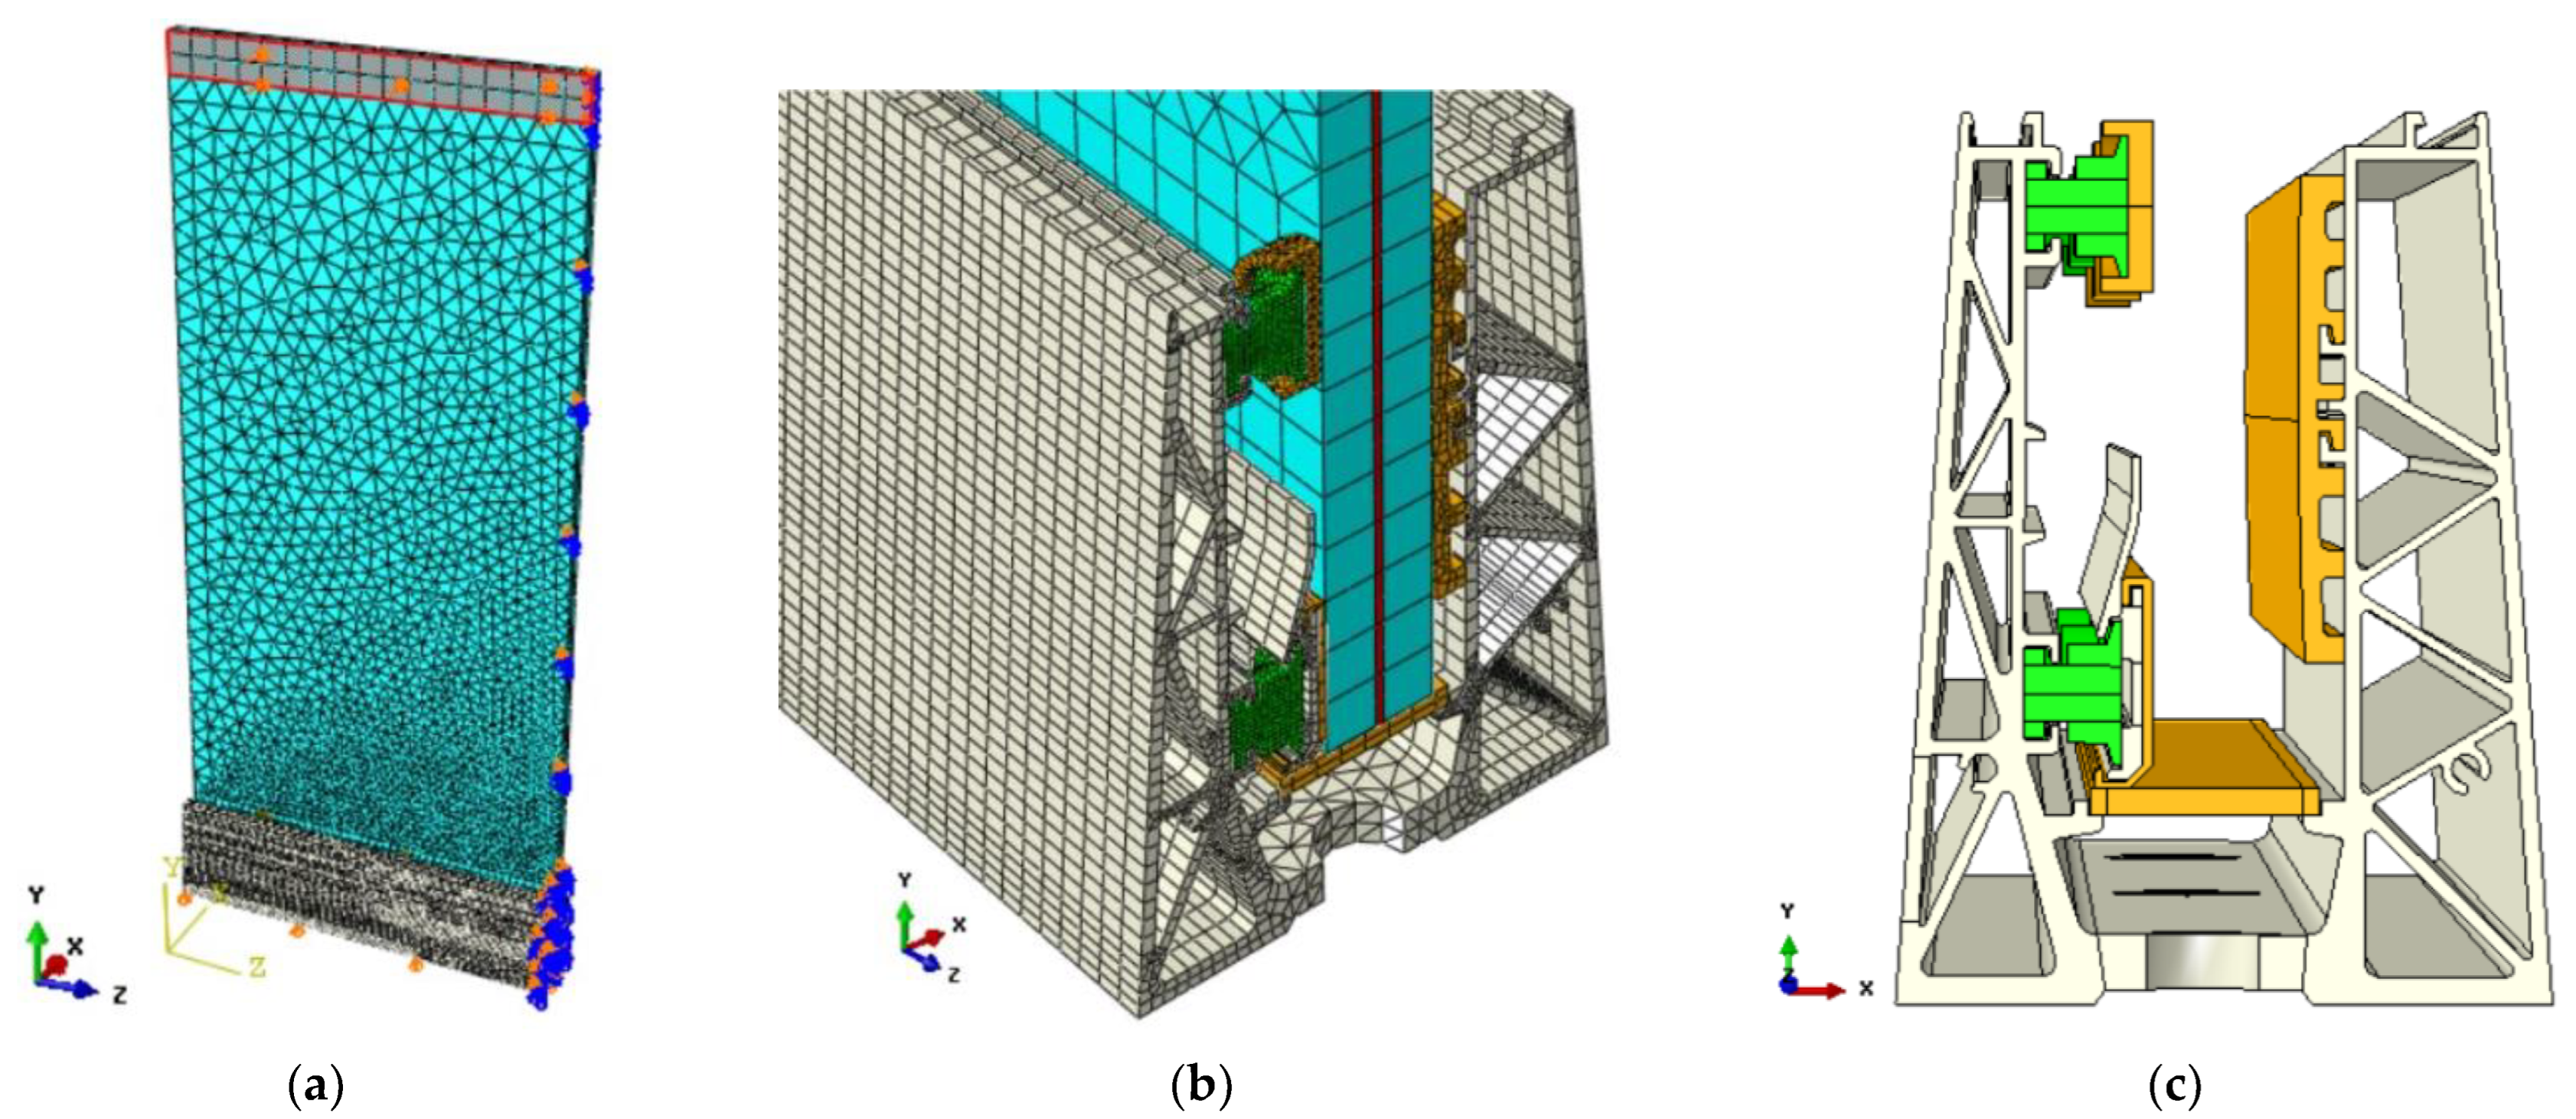
3. Full 3D Refined Numerical Model

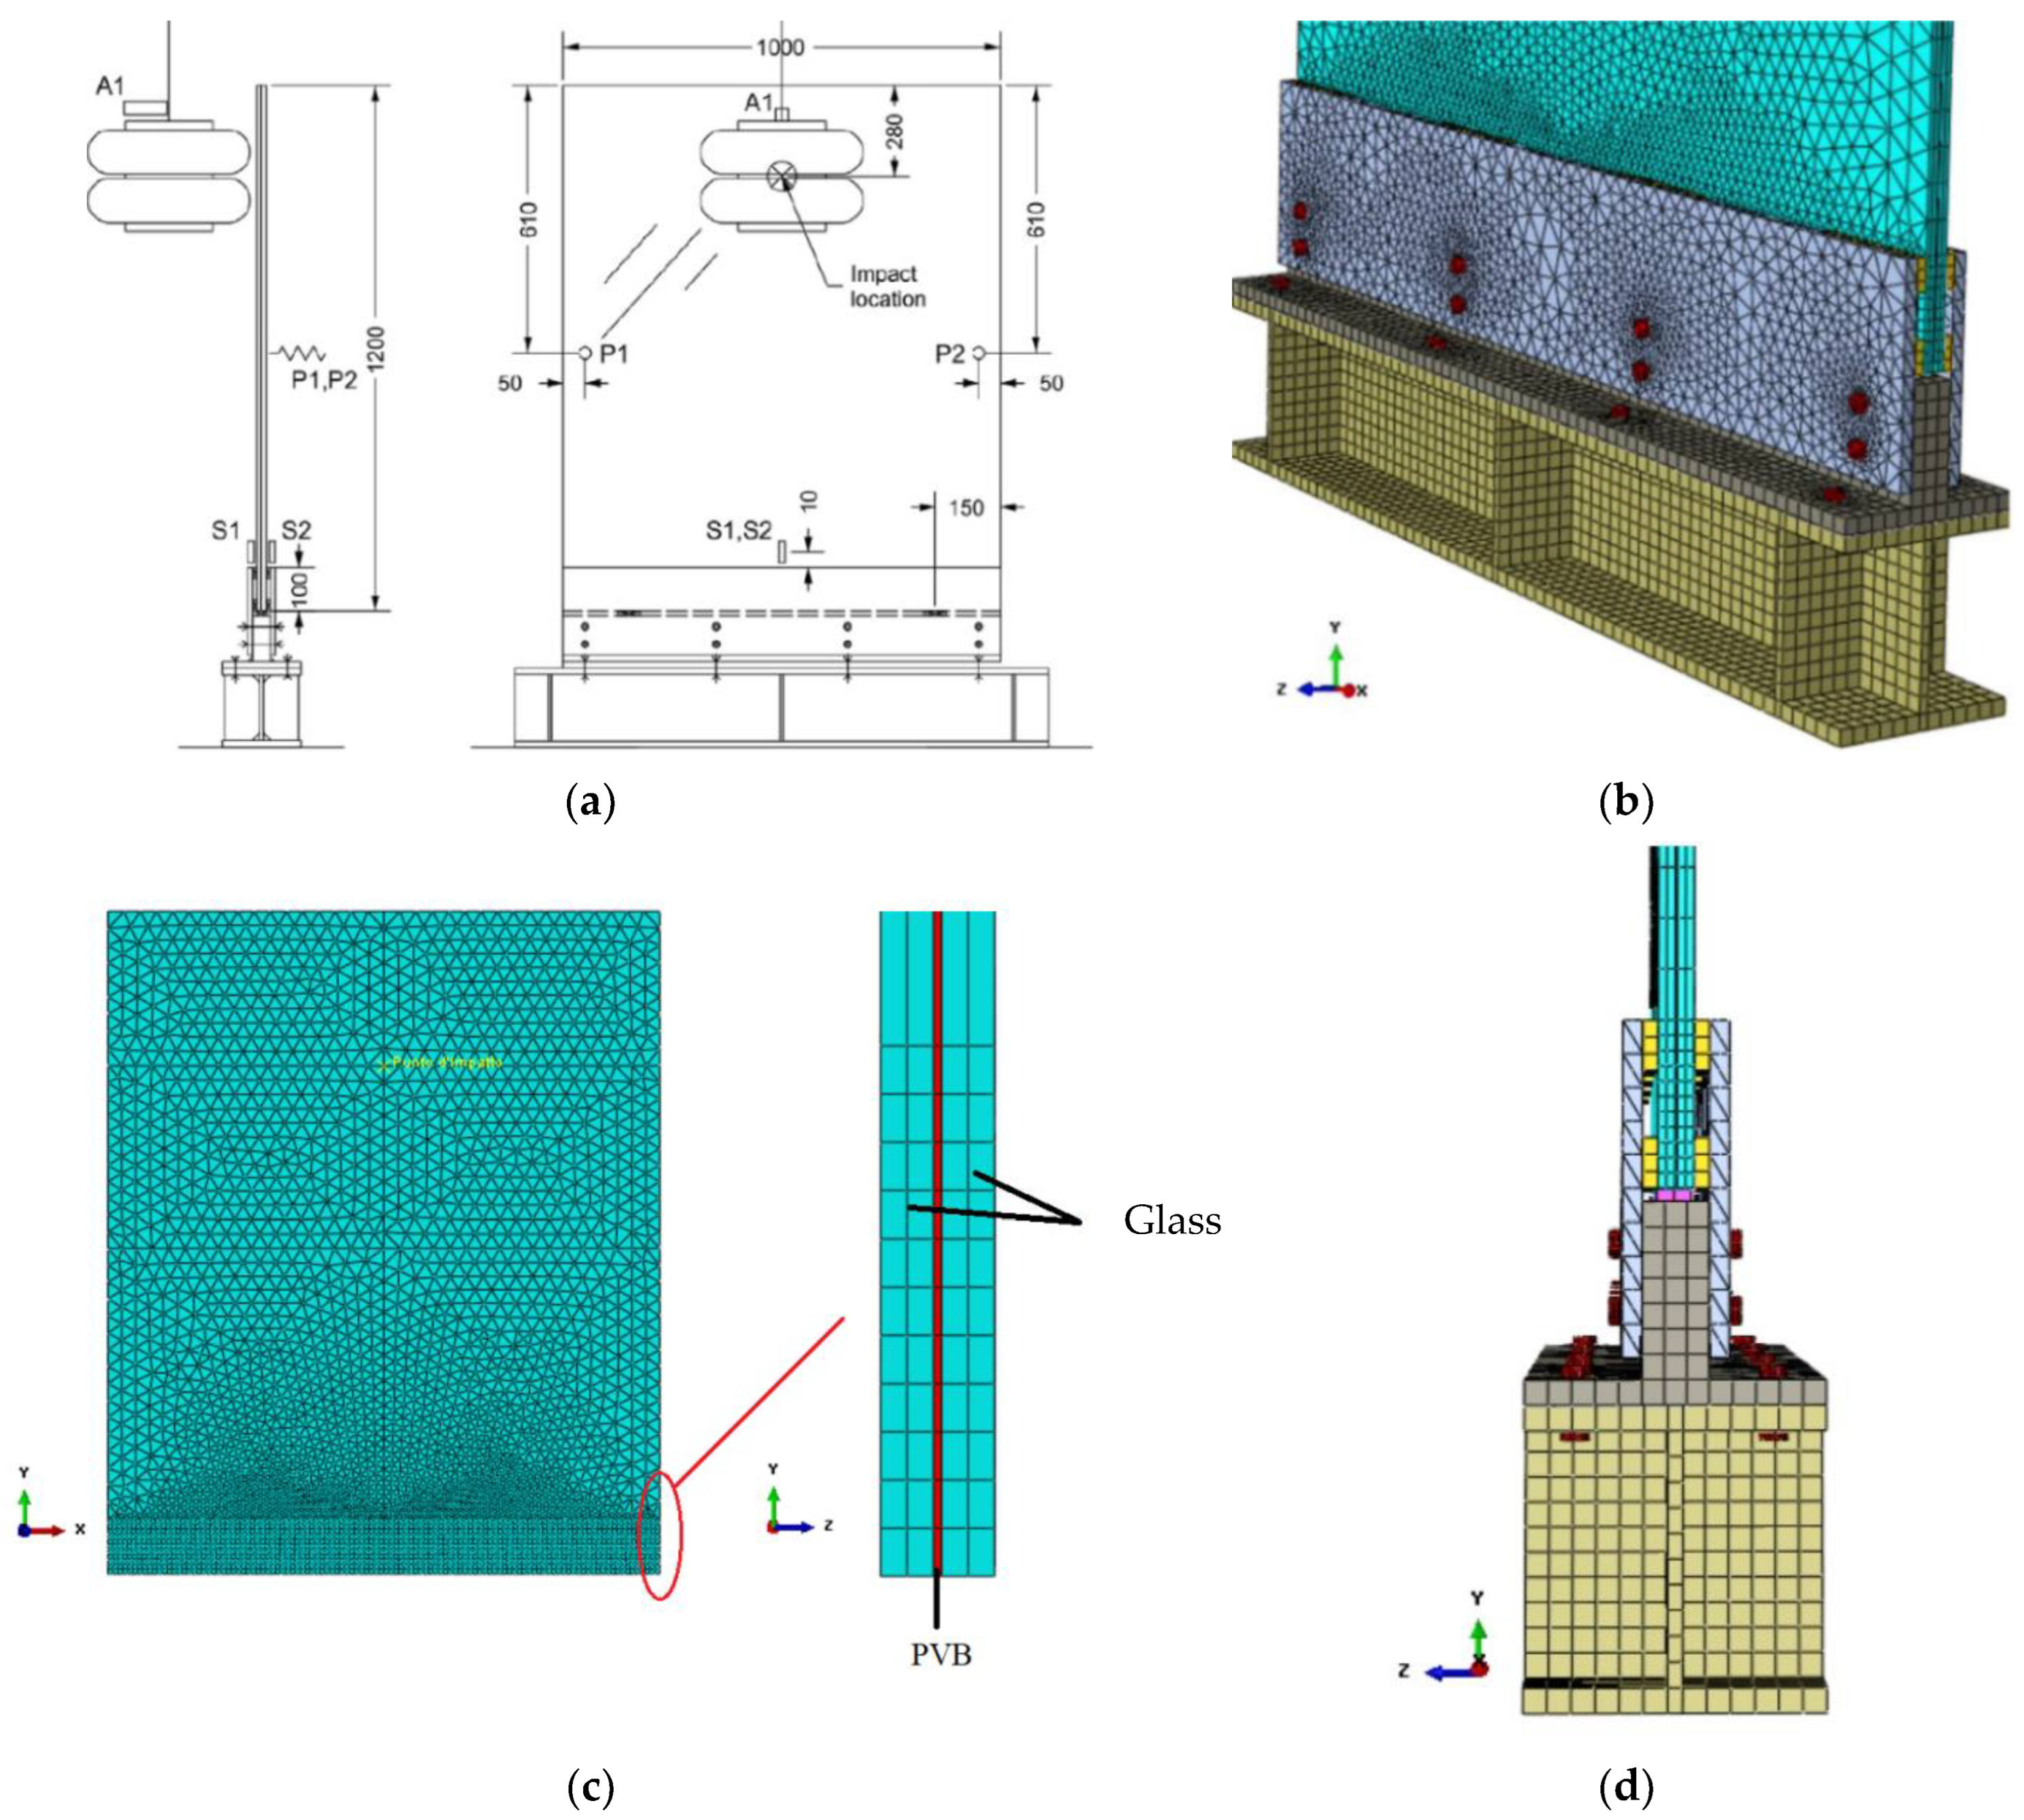
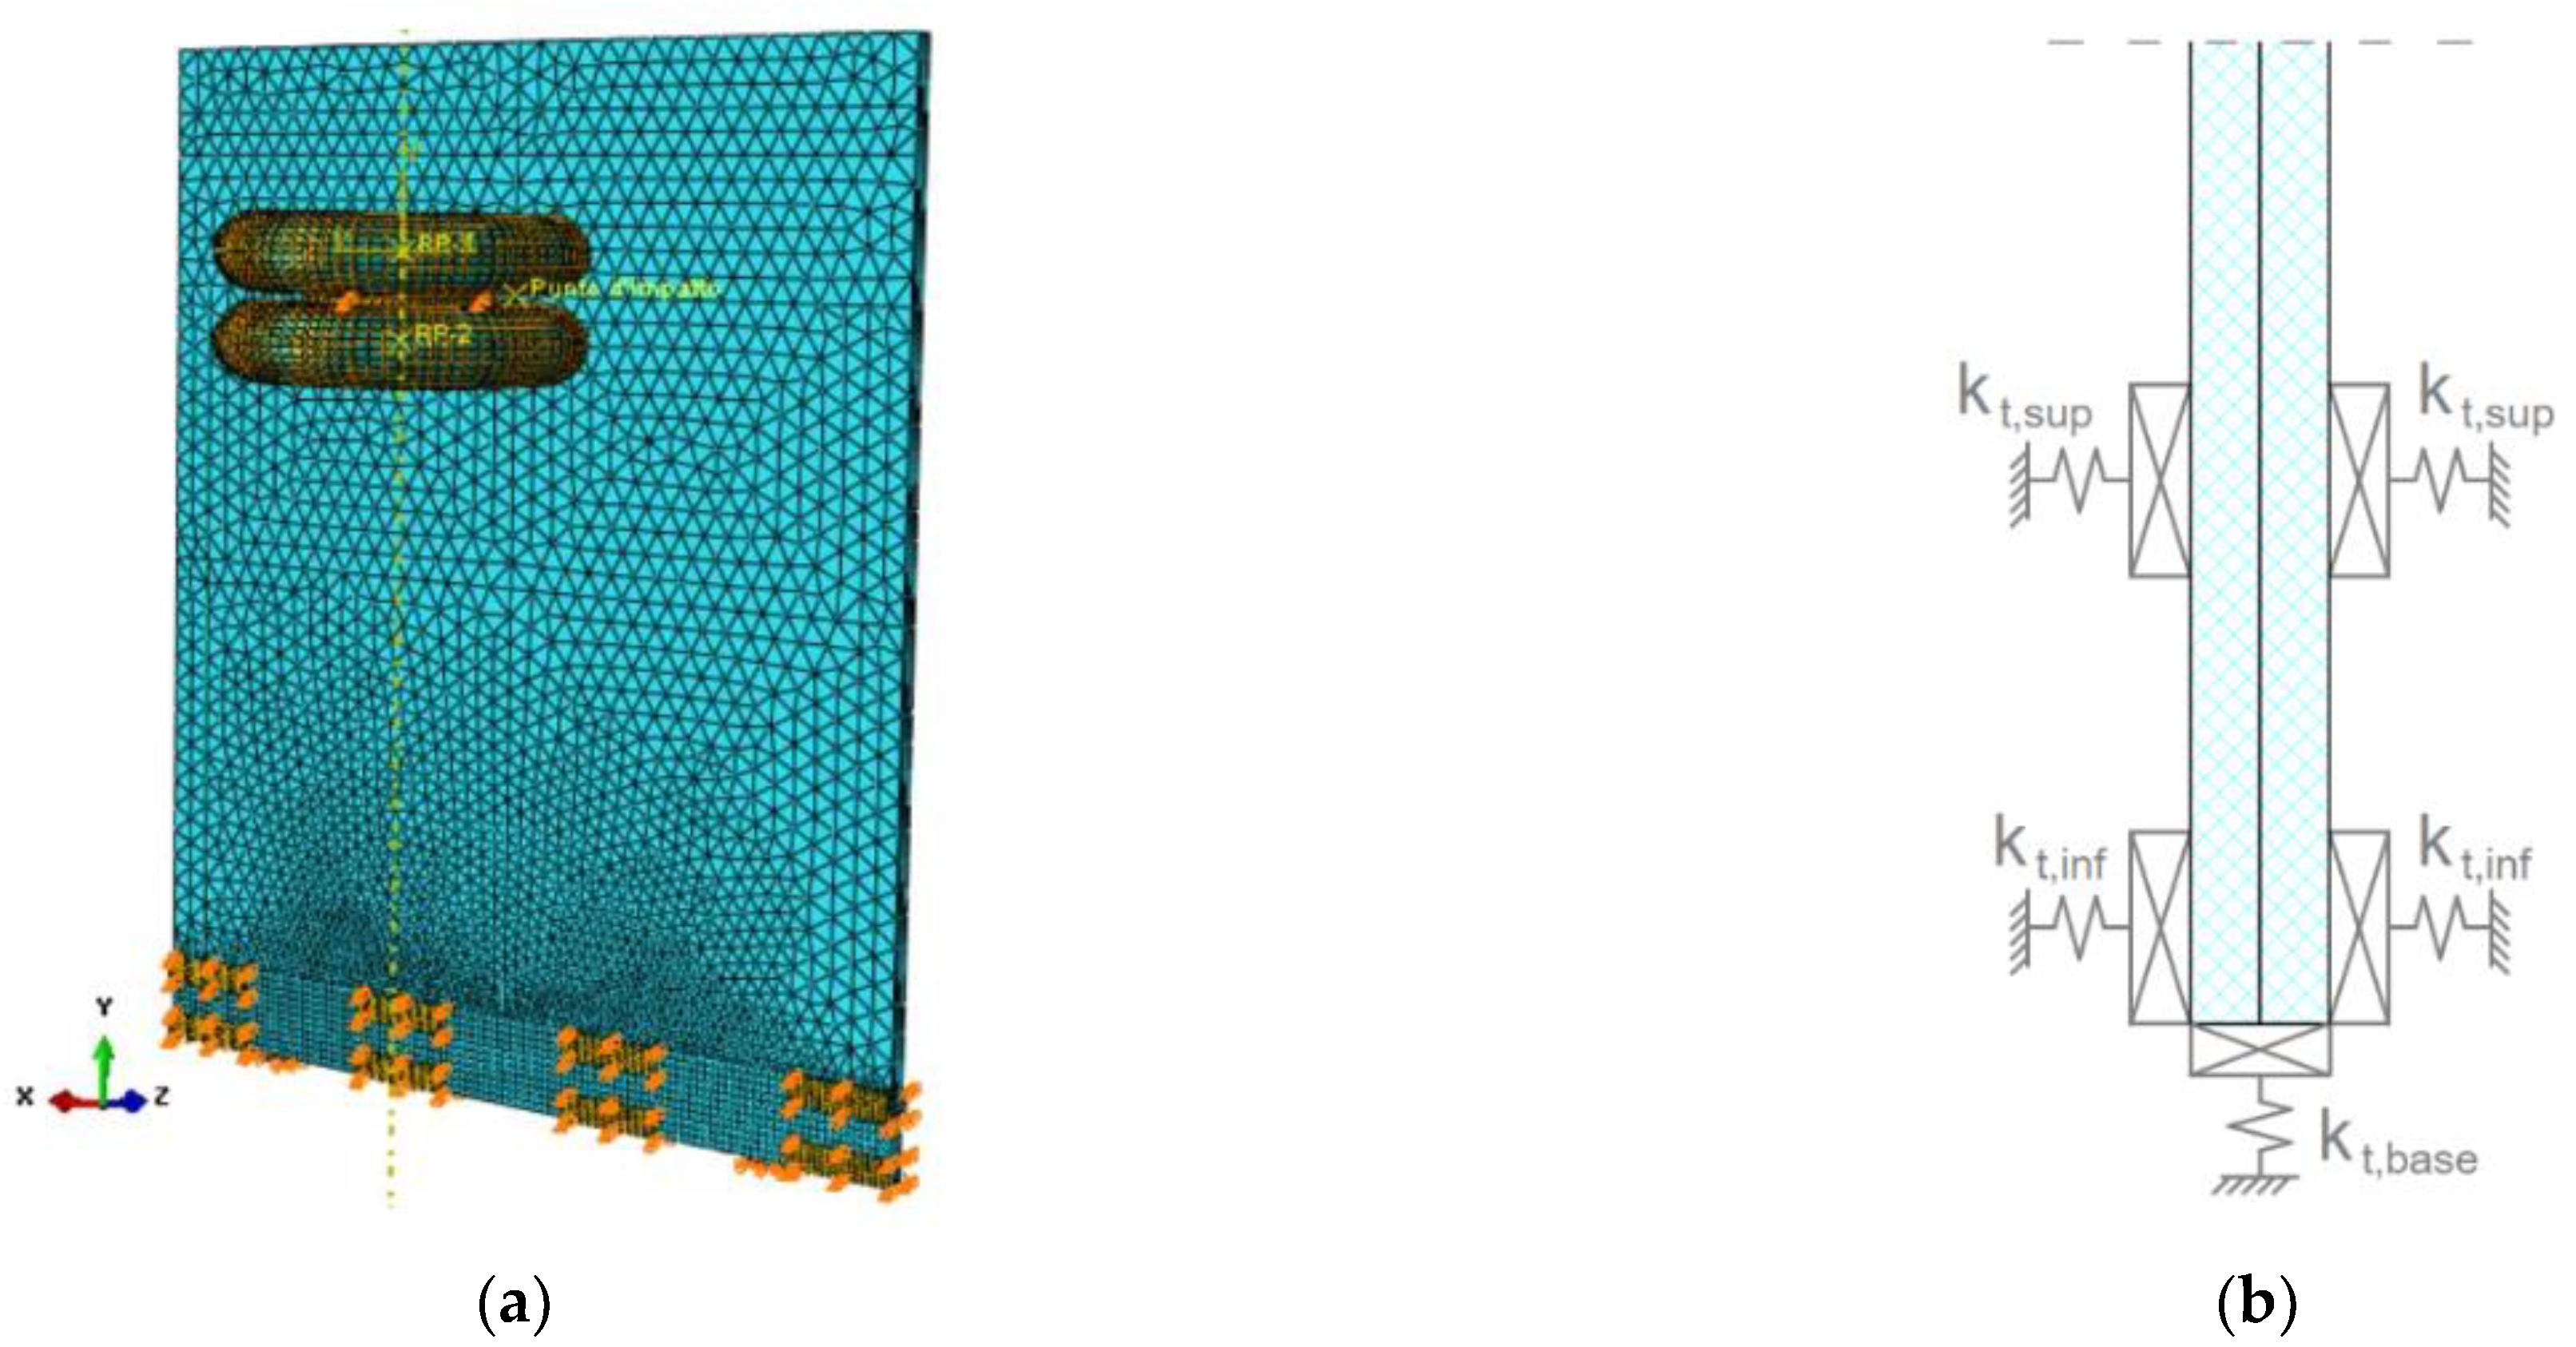
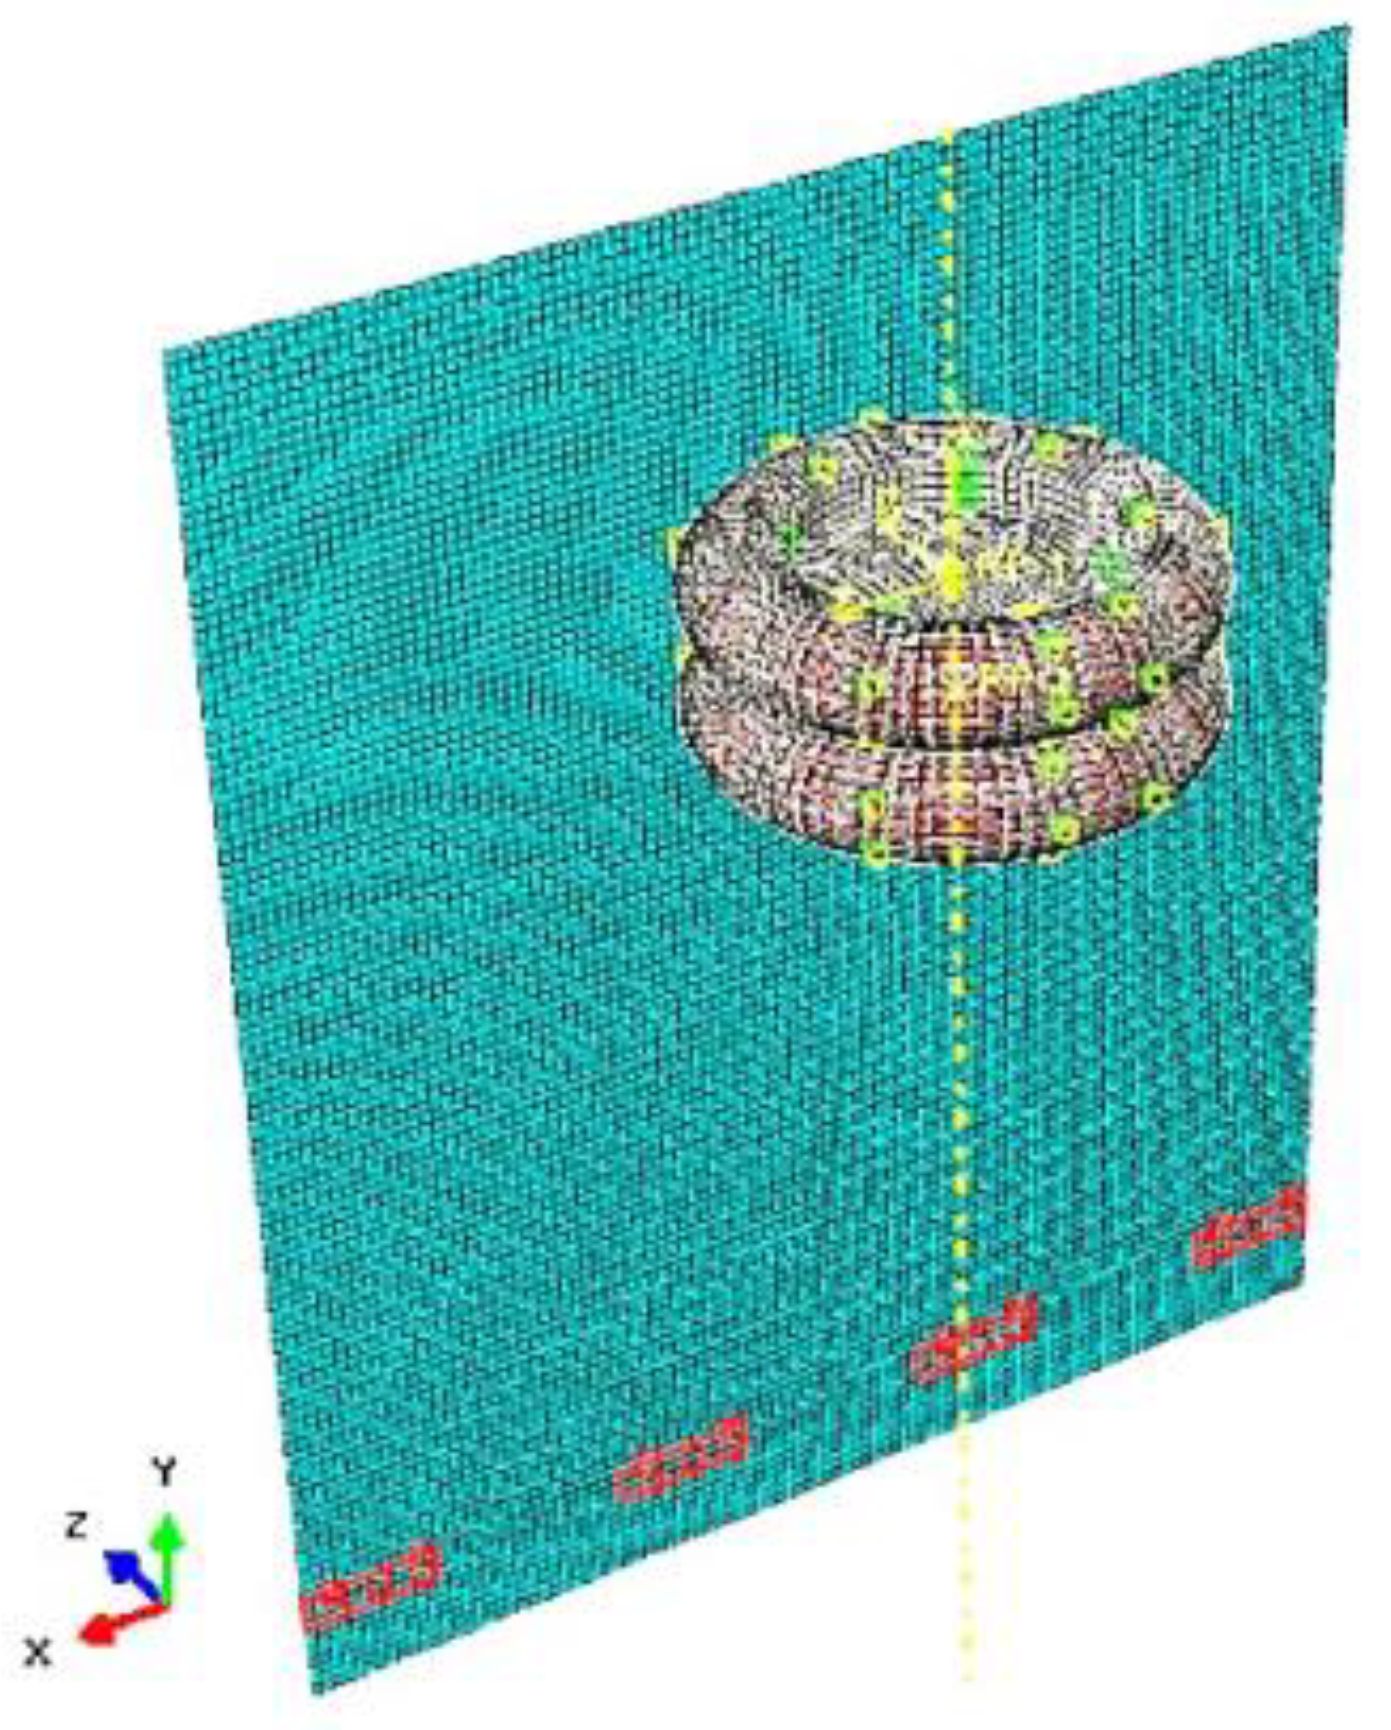
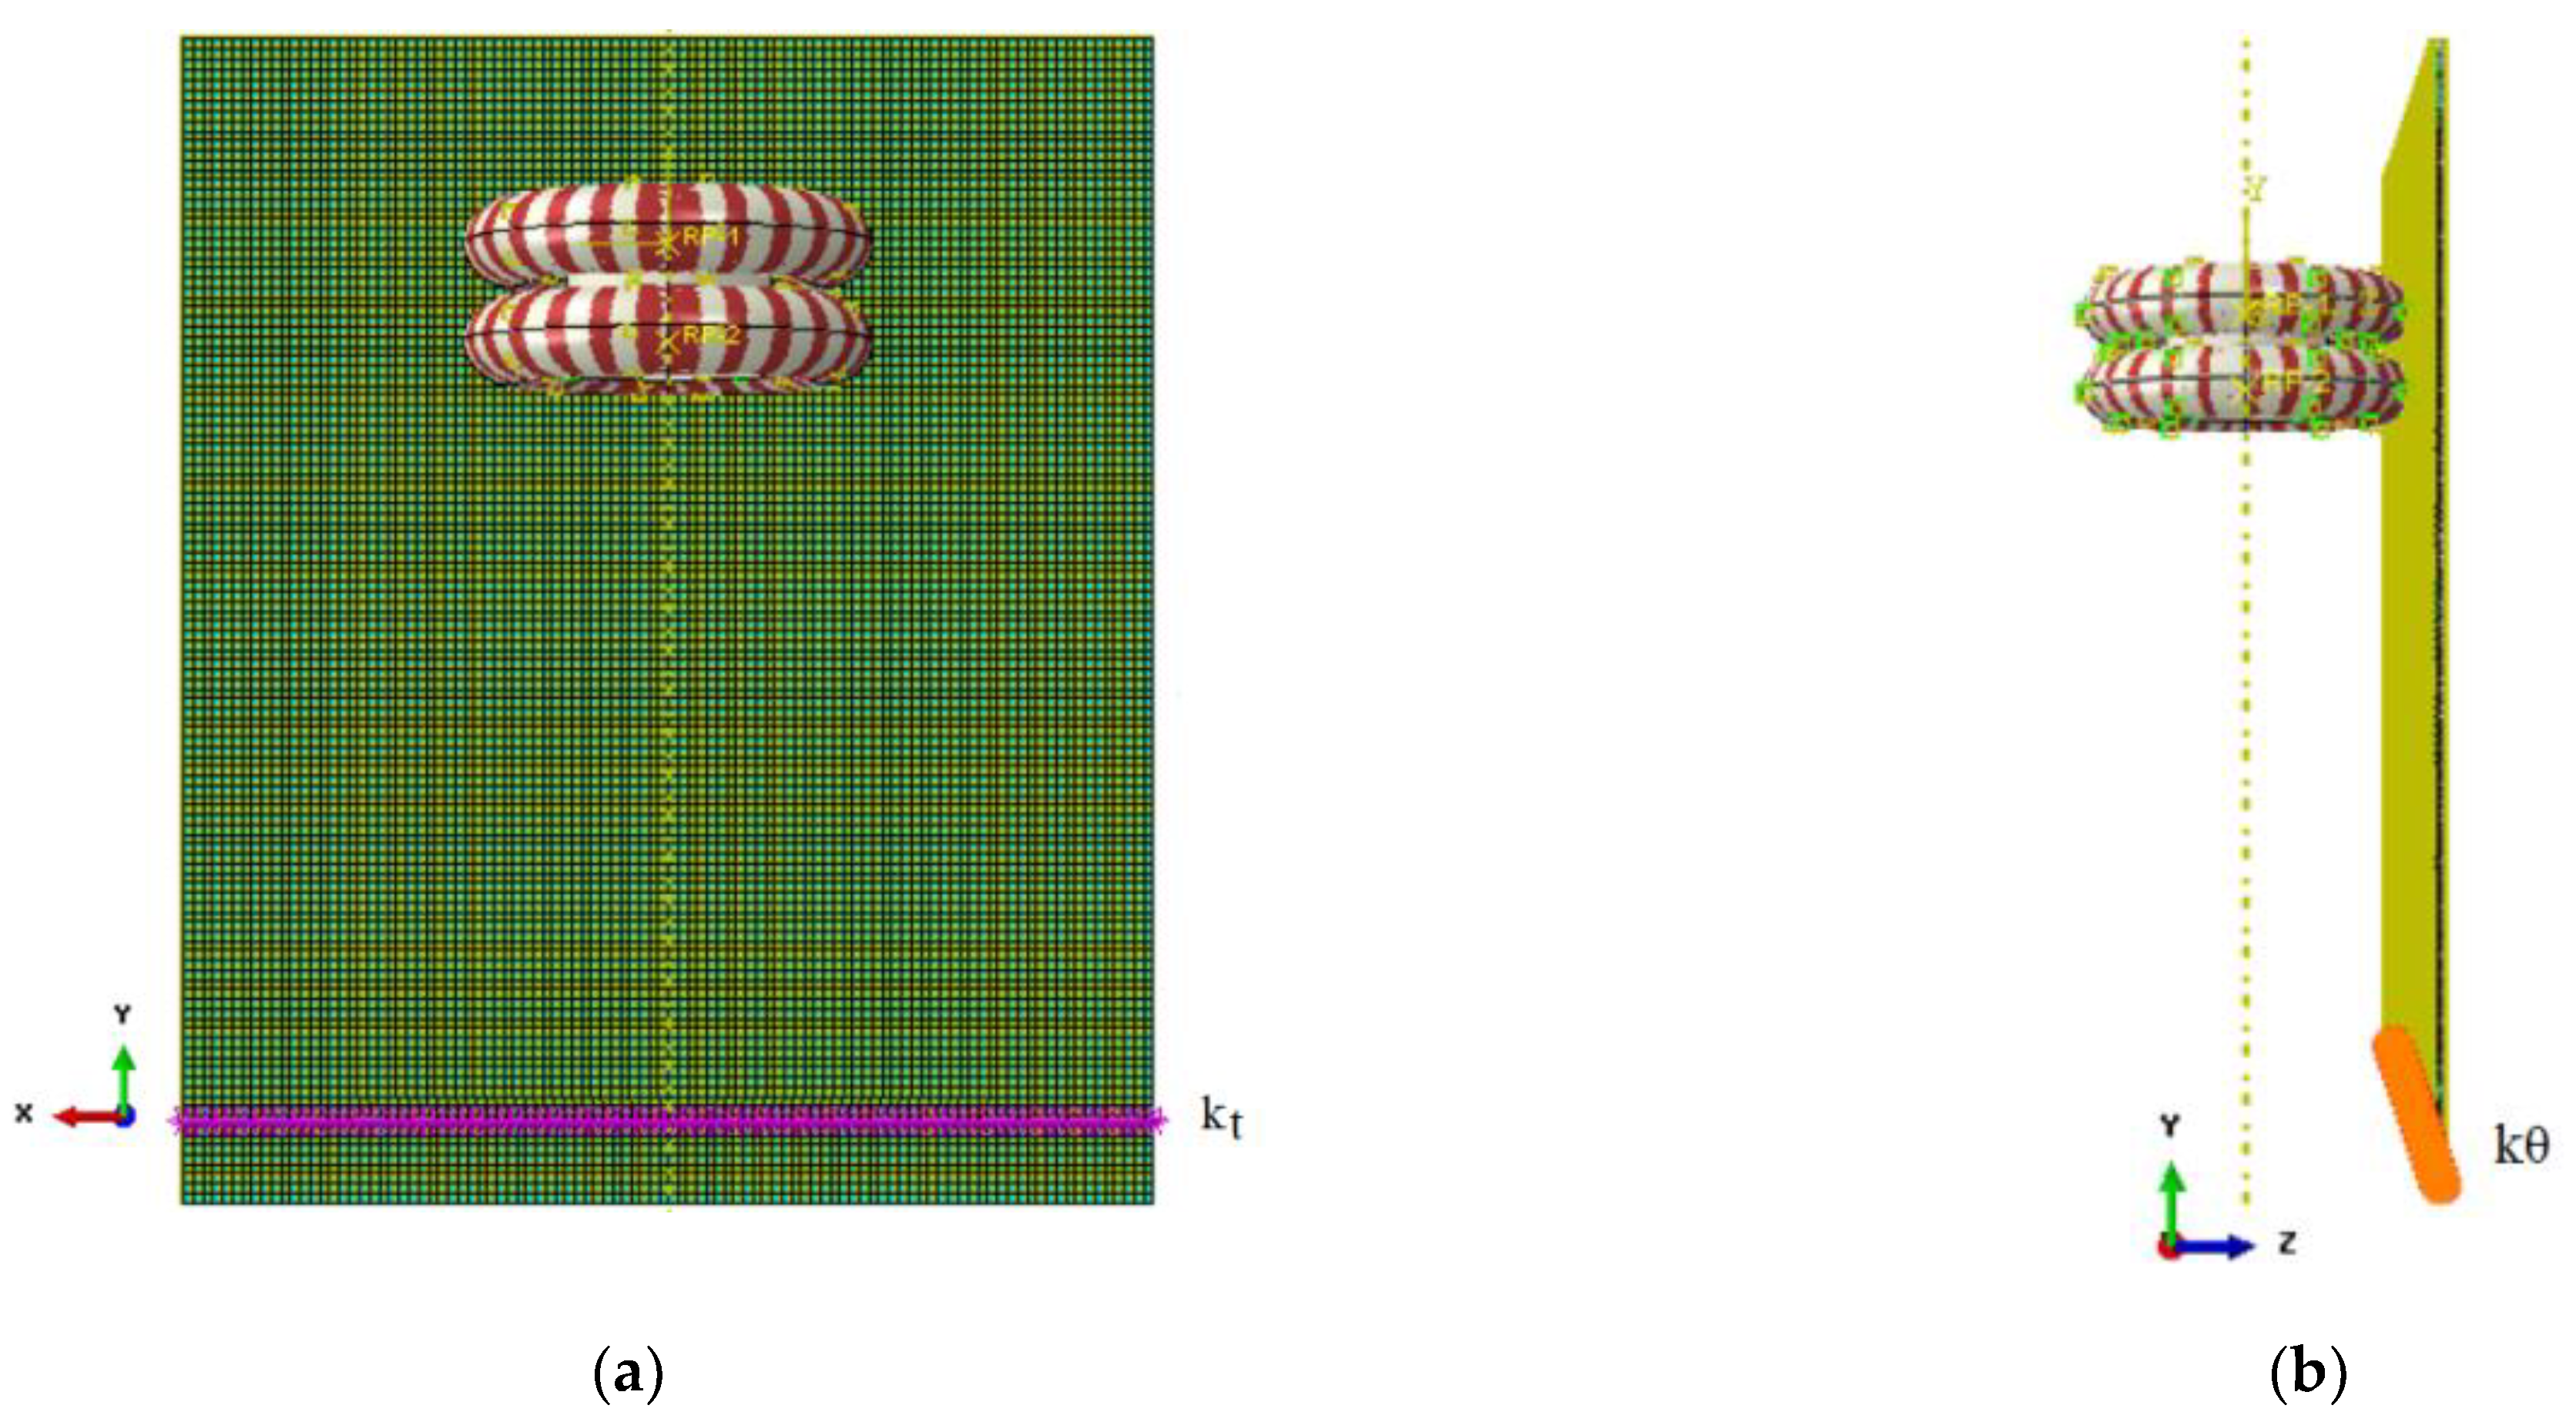
3.1. Model Description

As specified in Figure 4, the Refined numerical model was used in the present study to quantify and compare some key performance indicators for the structural analysis of the examined balustrade in terms of displacements and stress distributions in glass but also local deformations, rotations, and reaction forces in base restraint components.
In particular, the nominal geometry from Figure 4 was described in the form of a set of 8-node, 10-node, or 6-node 3D solid brick elements (C3D8R, C3D6R, or C3D10 elements from the ABAQUS library). A set of surface-to-surface contact interactions was introduced at the interface of the glass panel and fixing system for all the model regions where any kind of mechanical contact could take place during bending. Mesh refinement was privileged, especially in the region of base restraints (Figure 4b). The final balustrade assembly consisted of ≈120,000 elements and ≈505,000 Degrees of Freedom (DOFs).
Linear elastic constitutive models were used for the characterization of all the balustrade components, as also reported in [17]. Most importantly, an equivalent secant modulus was used for the PVB layer under impact loading so as to take into account its viscoelastic behaviour. The input features in use for the present simulations are summarized in Table 2.
The attention of the structural assessment was devoted to the analysis of the linearly restrained LG balustrade under the effects of:
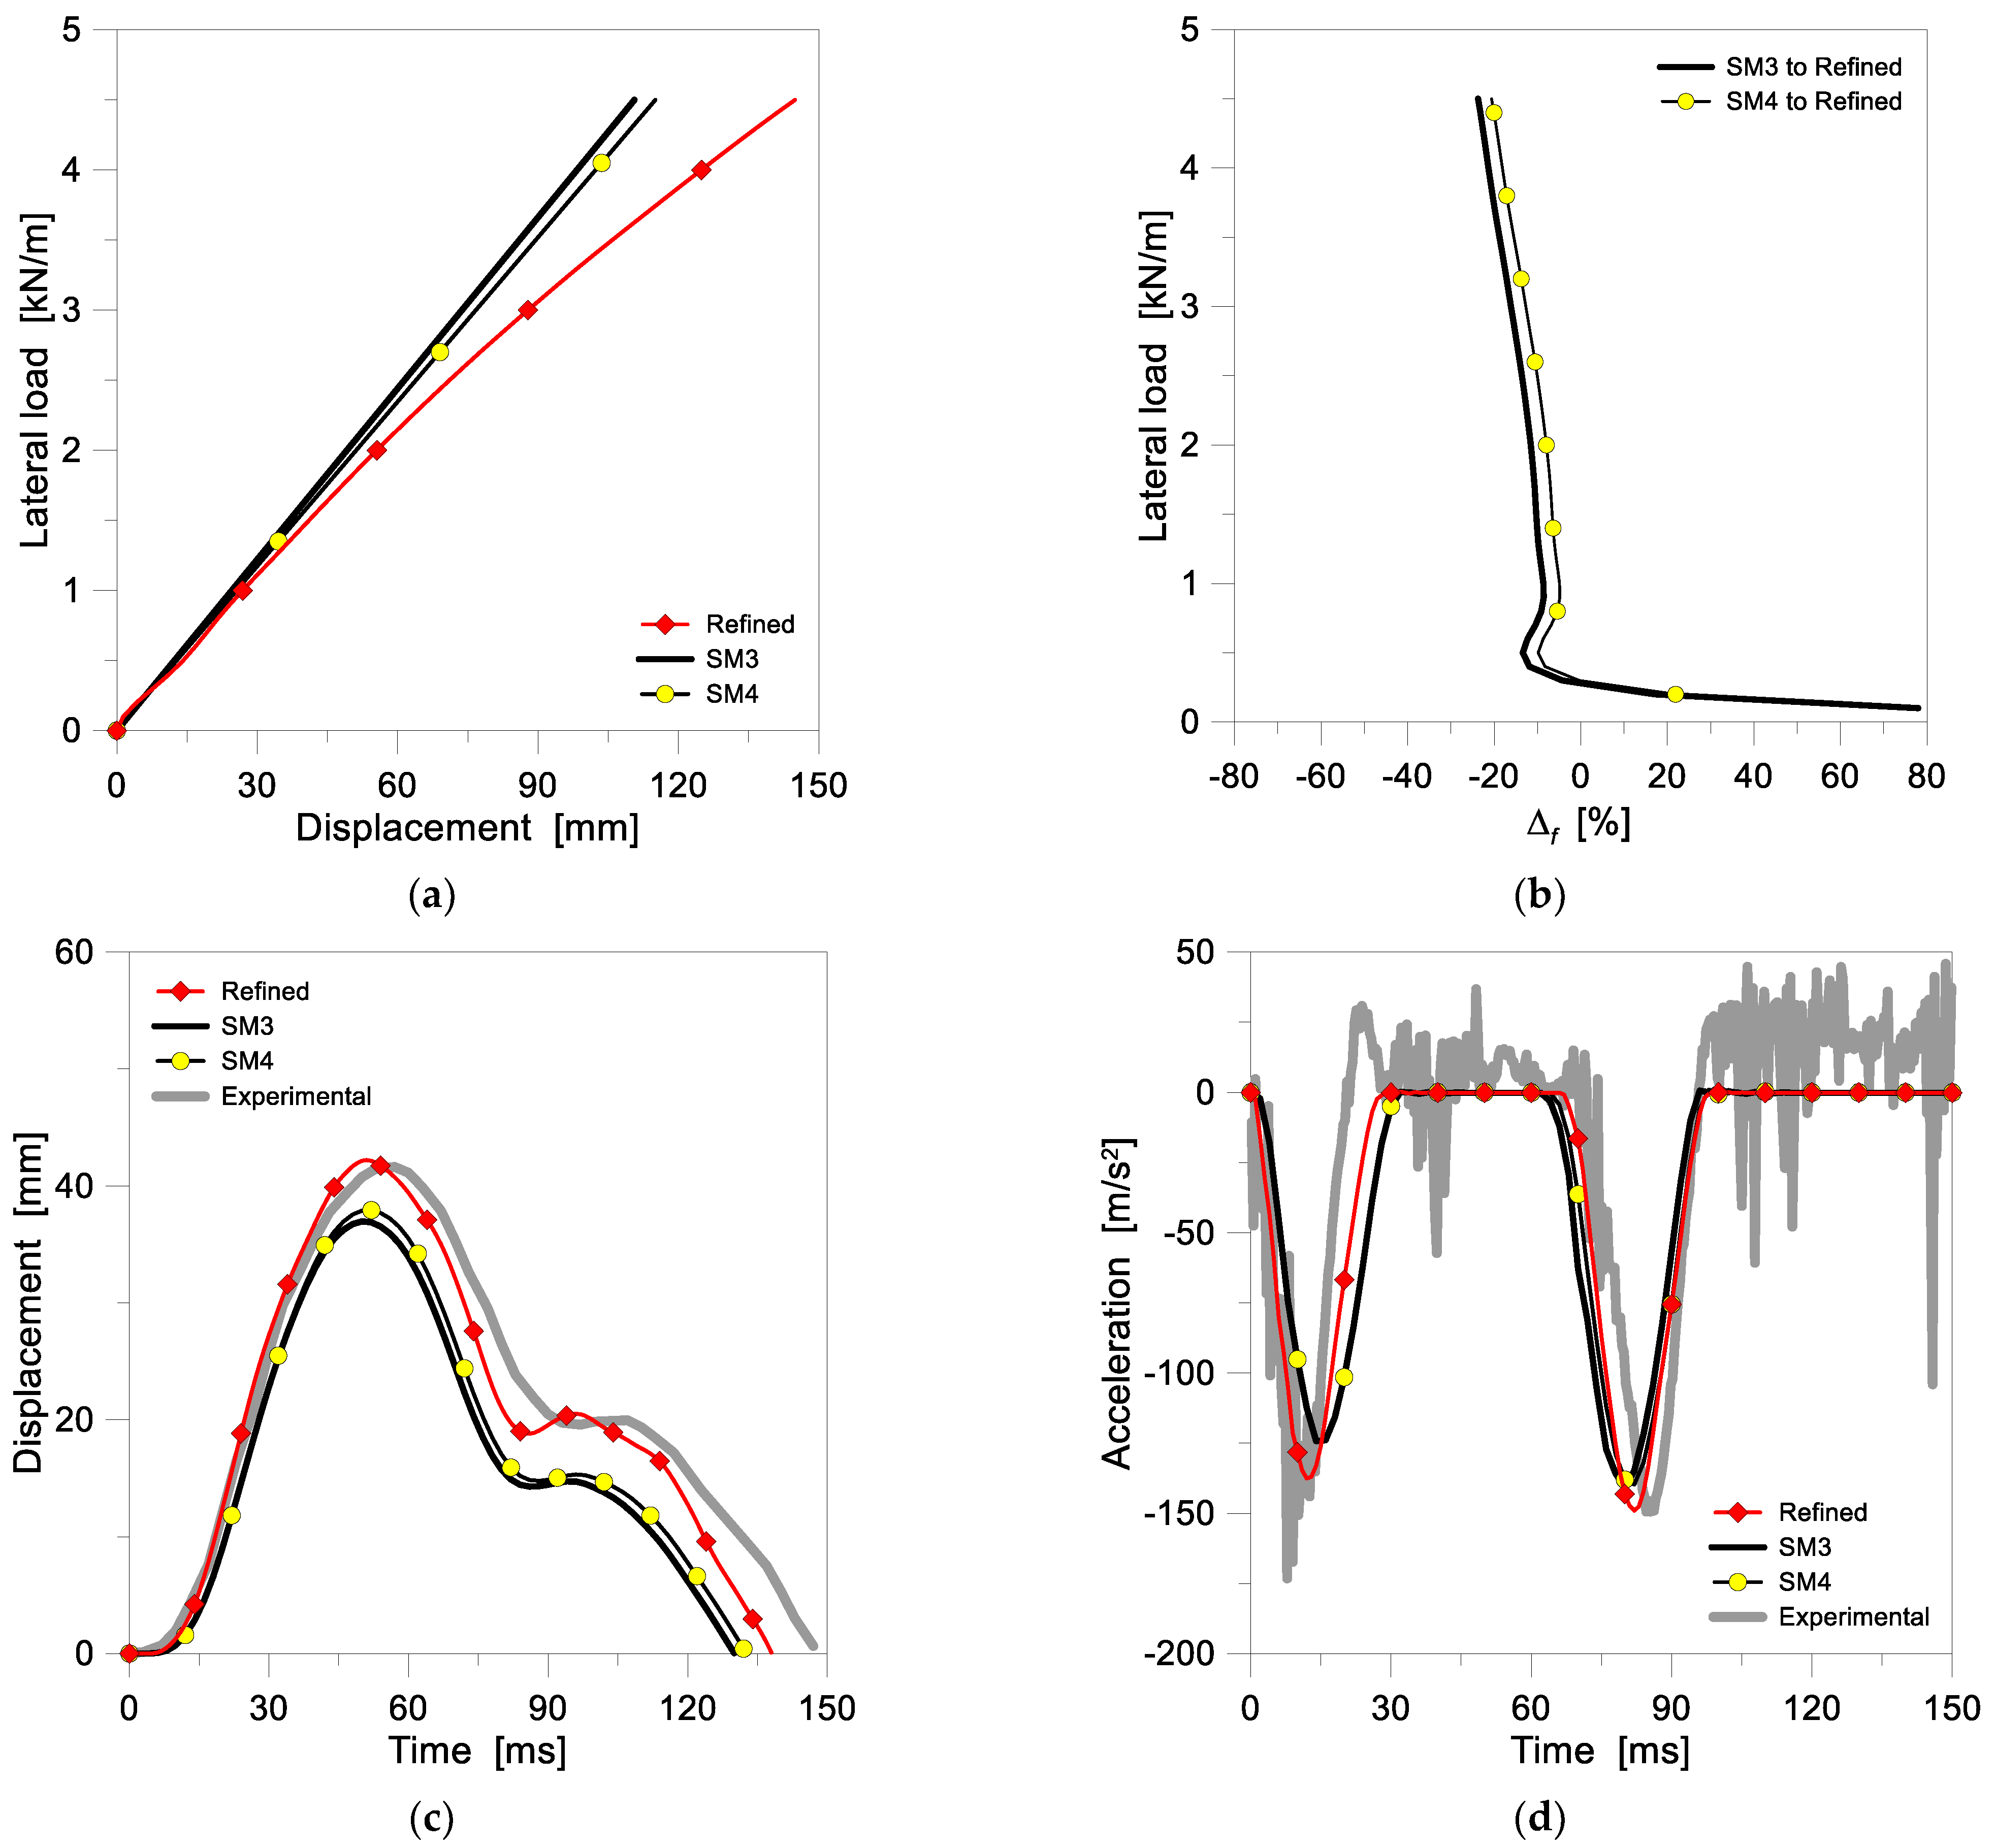
  • L1: a quasi-static, monotonically increasing lateral load at the top edge of the glass (until a maximum value P = 4.5 kN/m), and
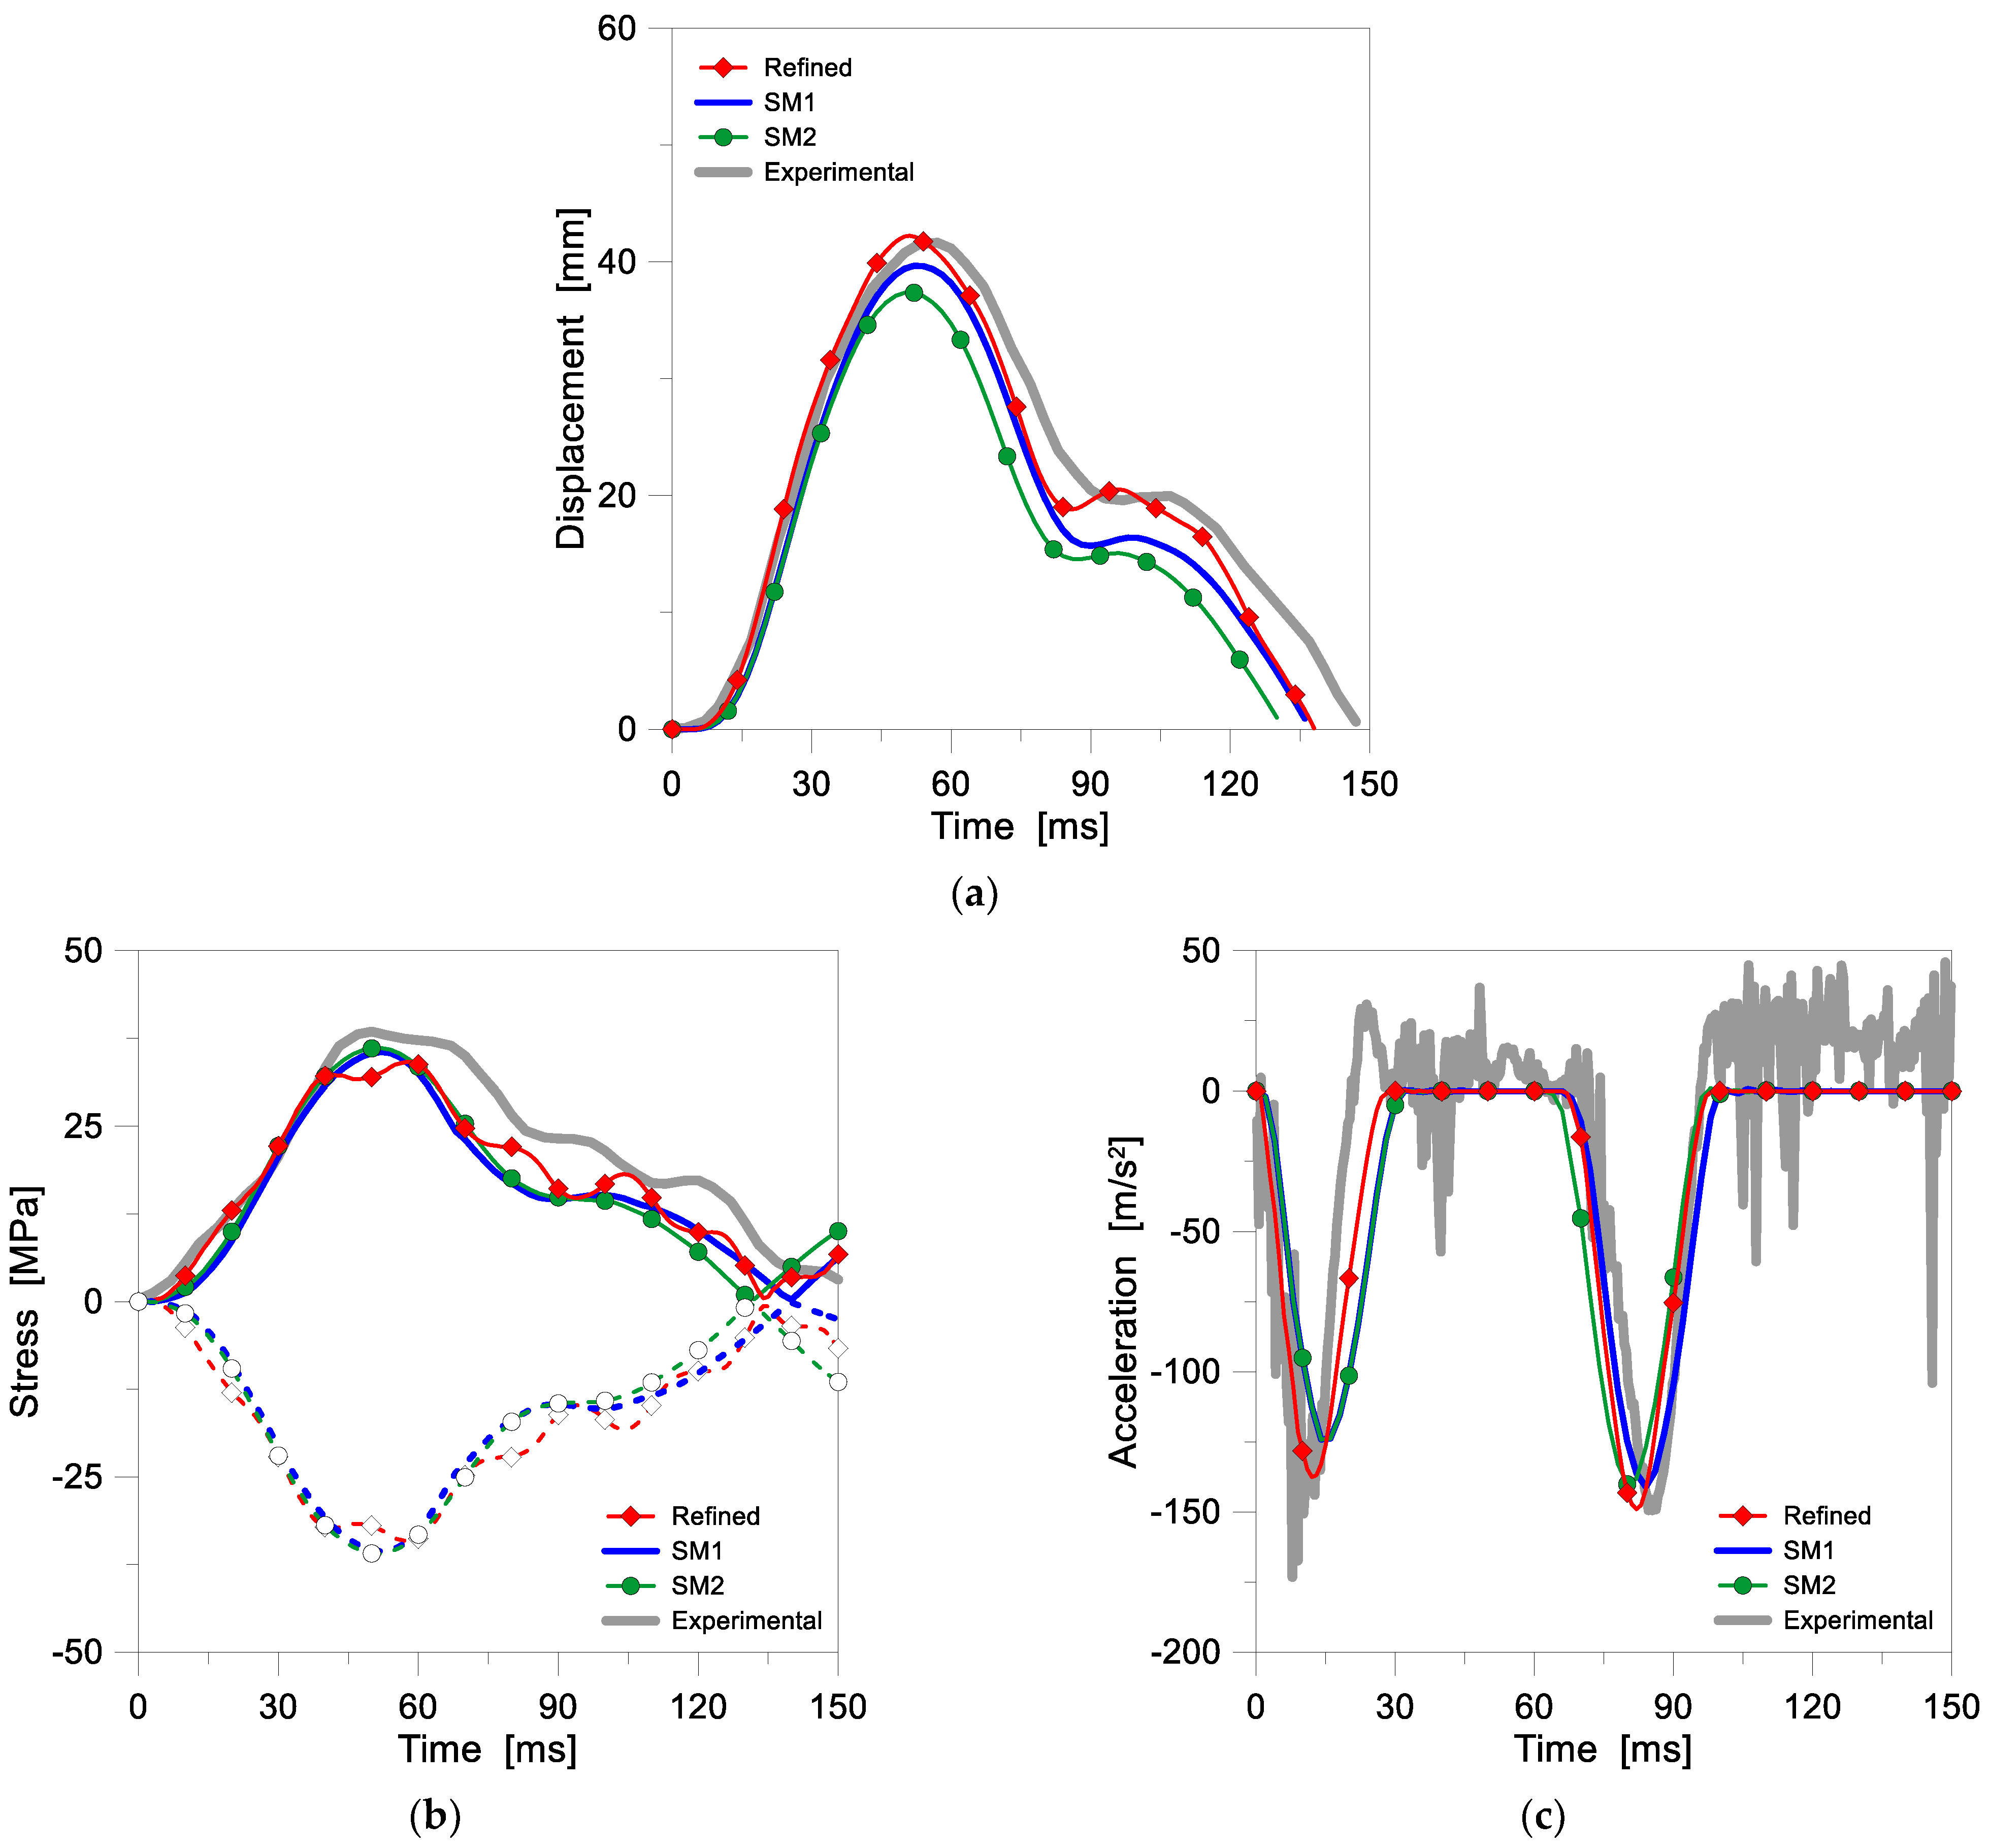
  • L2: a twin-tyre impact loading configuration which was numerically reproduced and calibrated according to the experimental setup summarized in Section 2 (with 300 mm being the drop height).
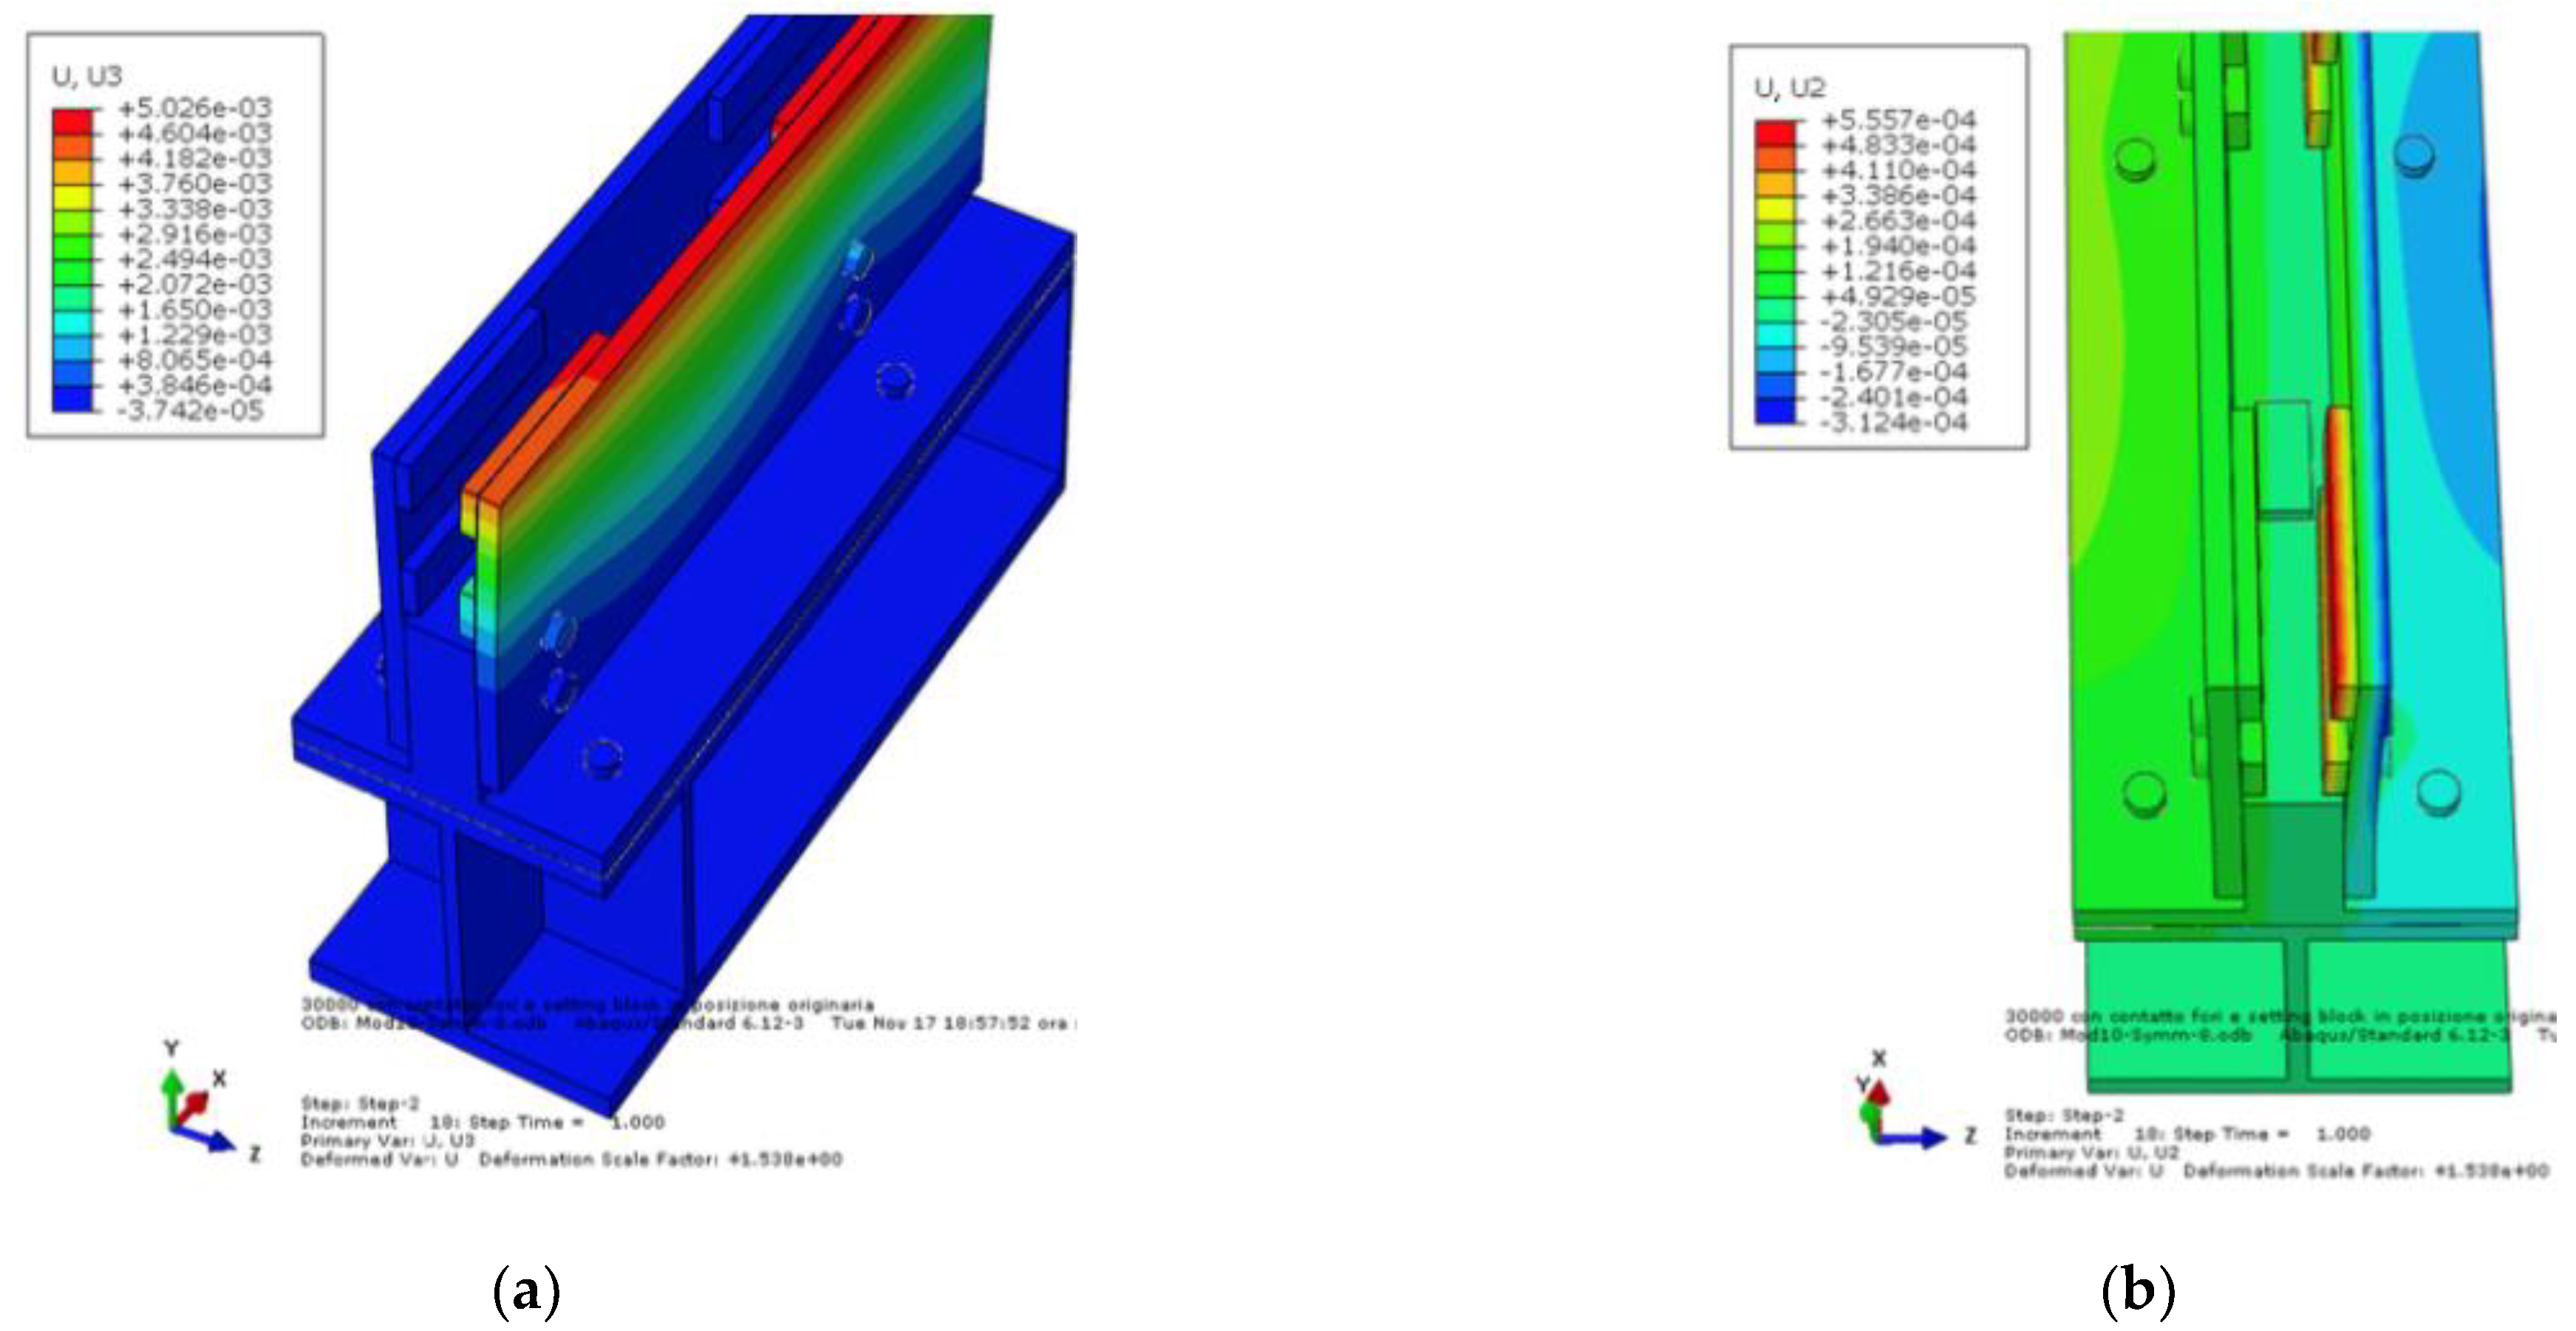
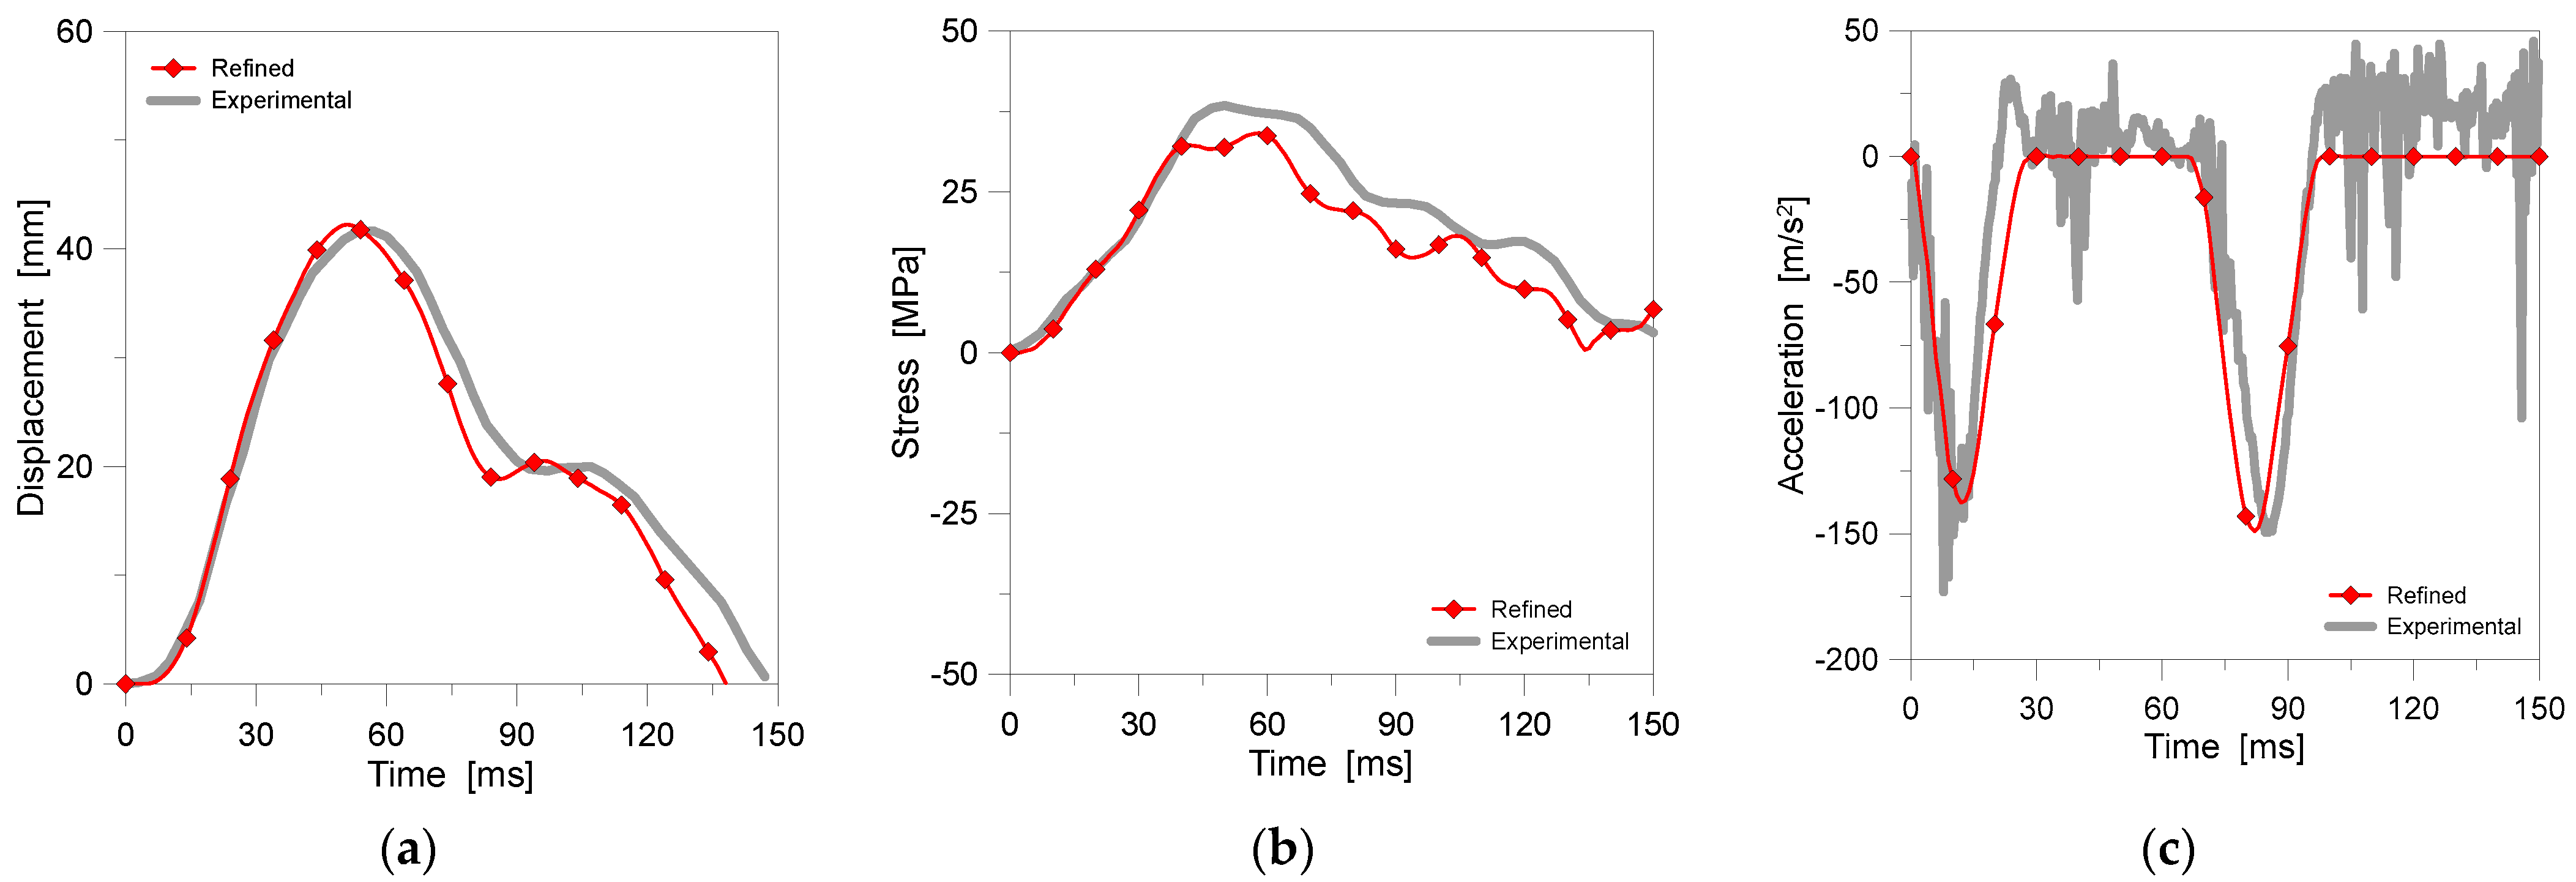
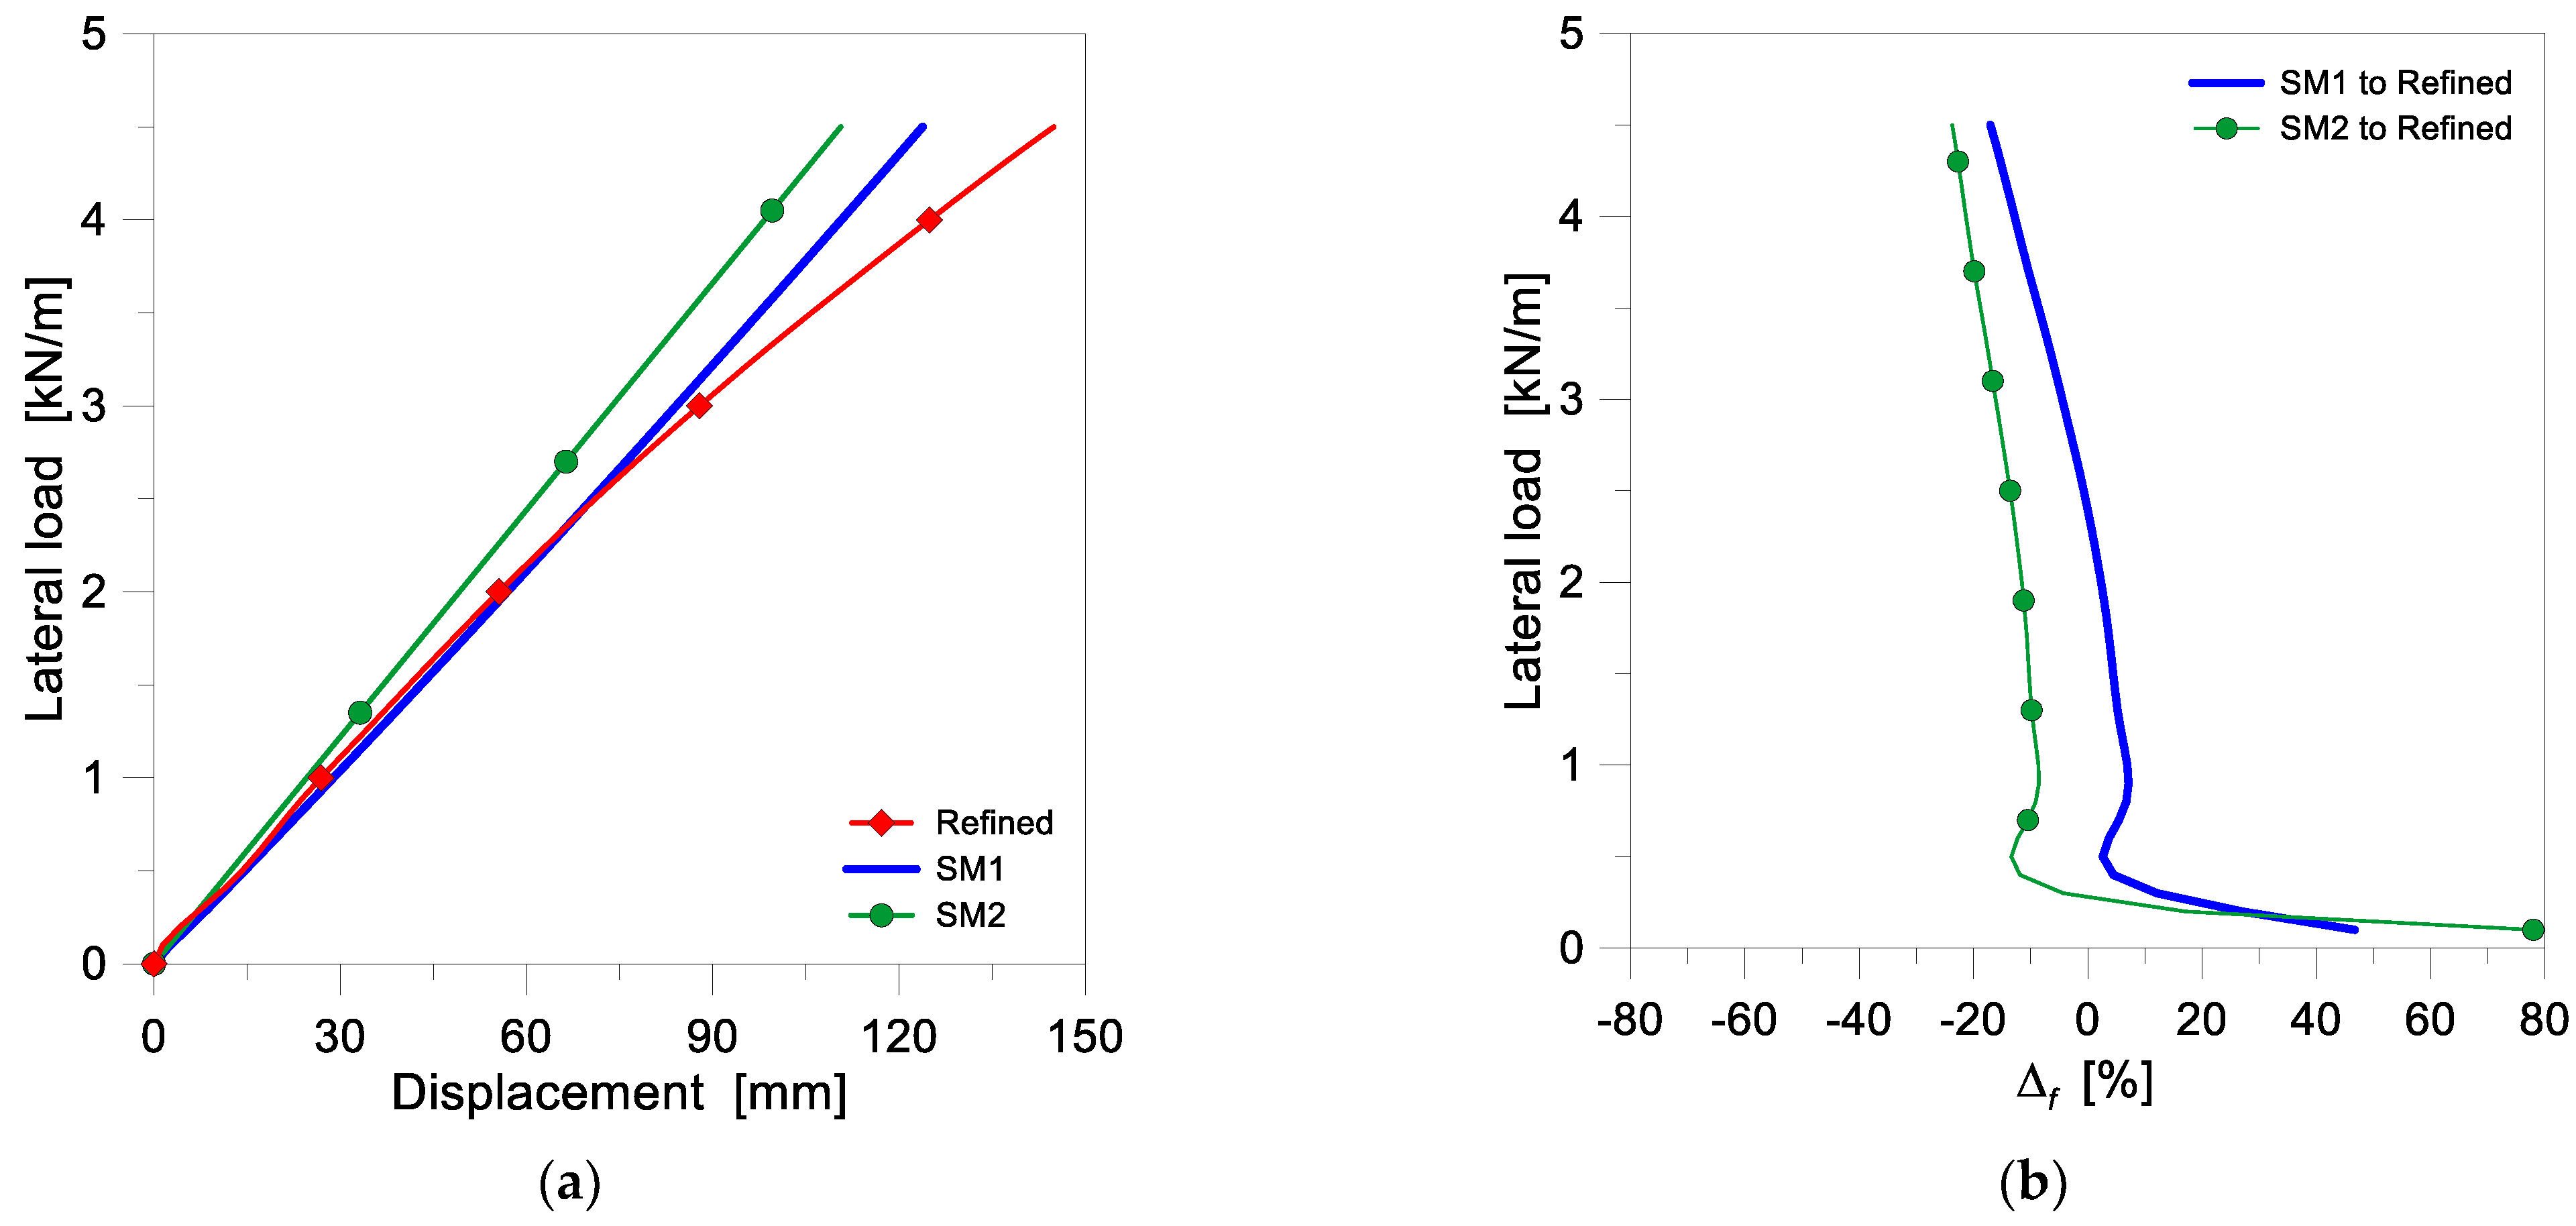
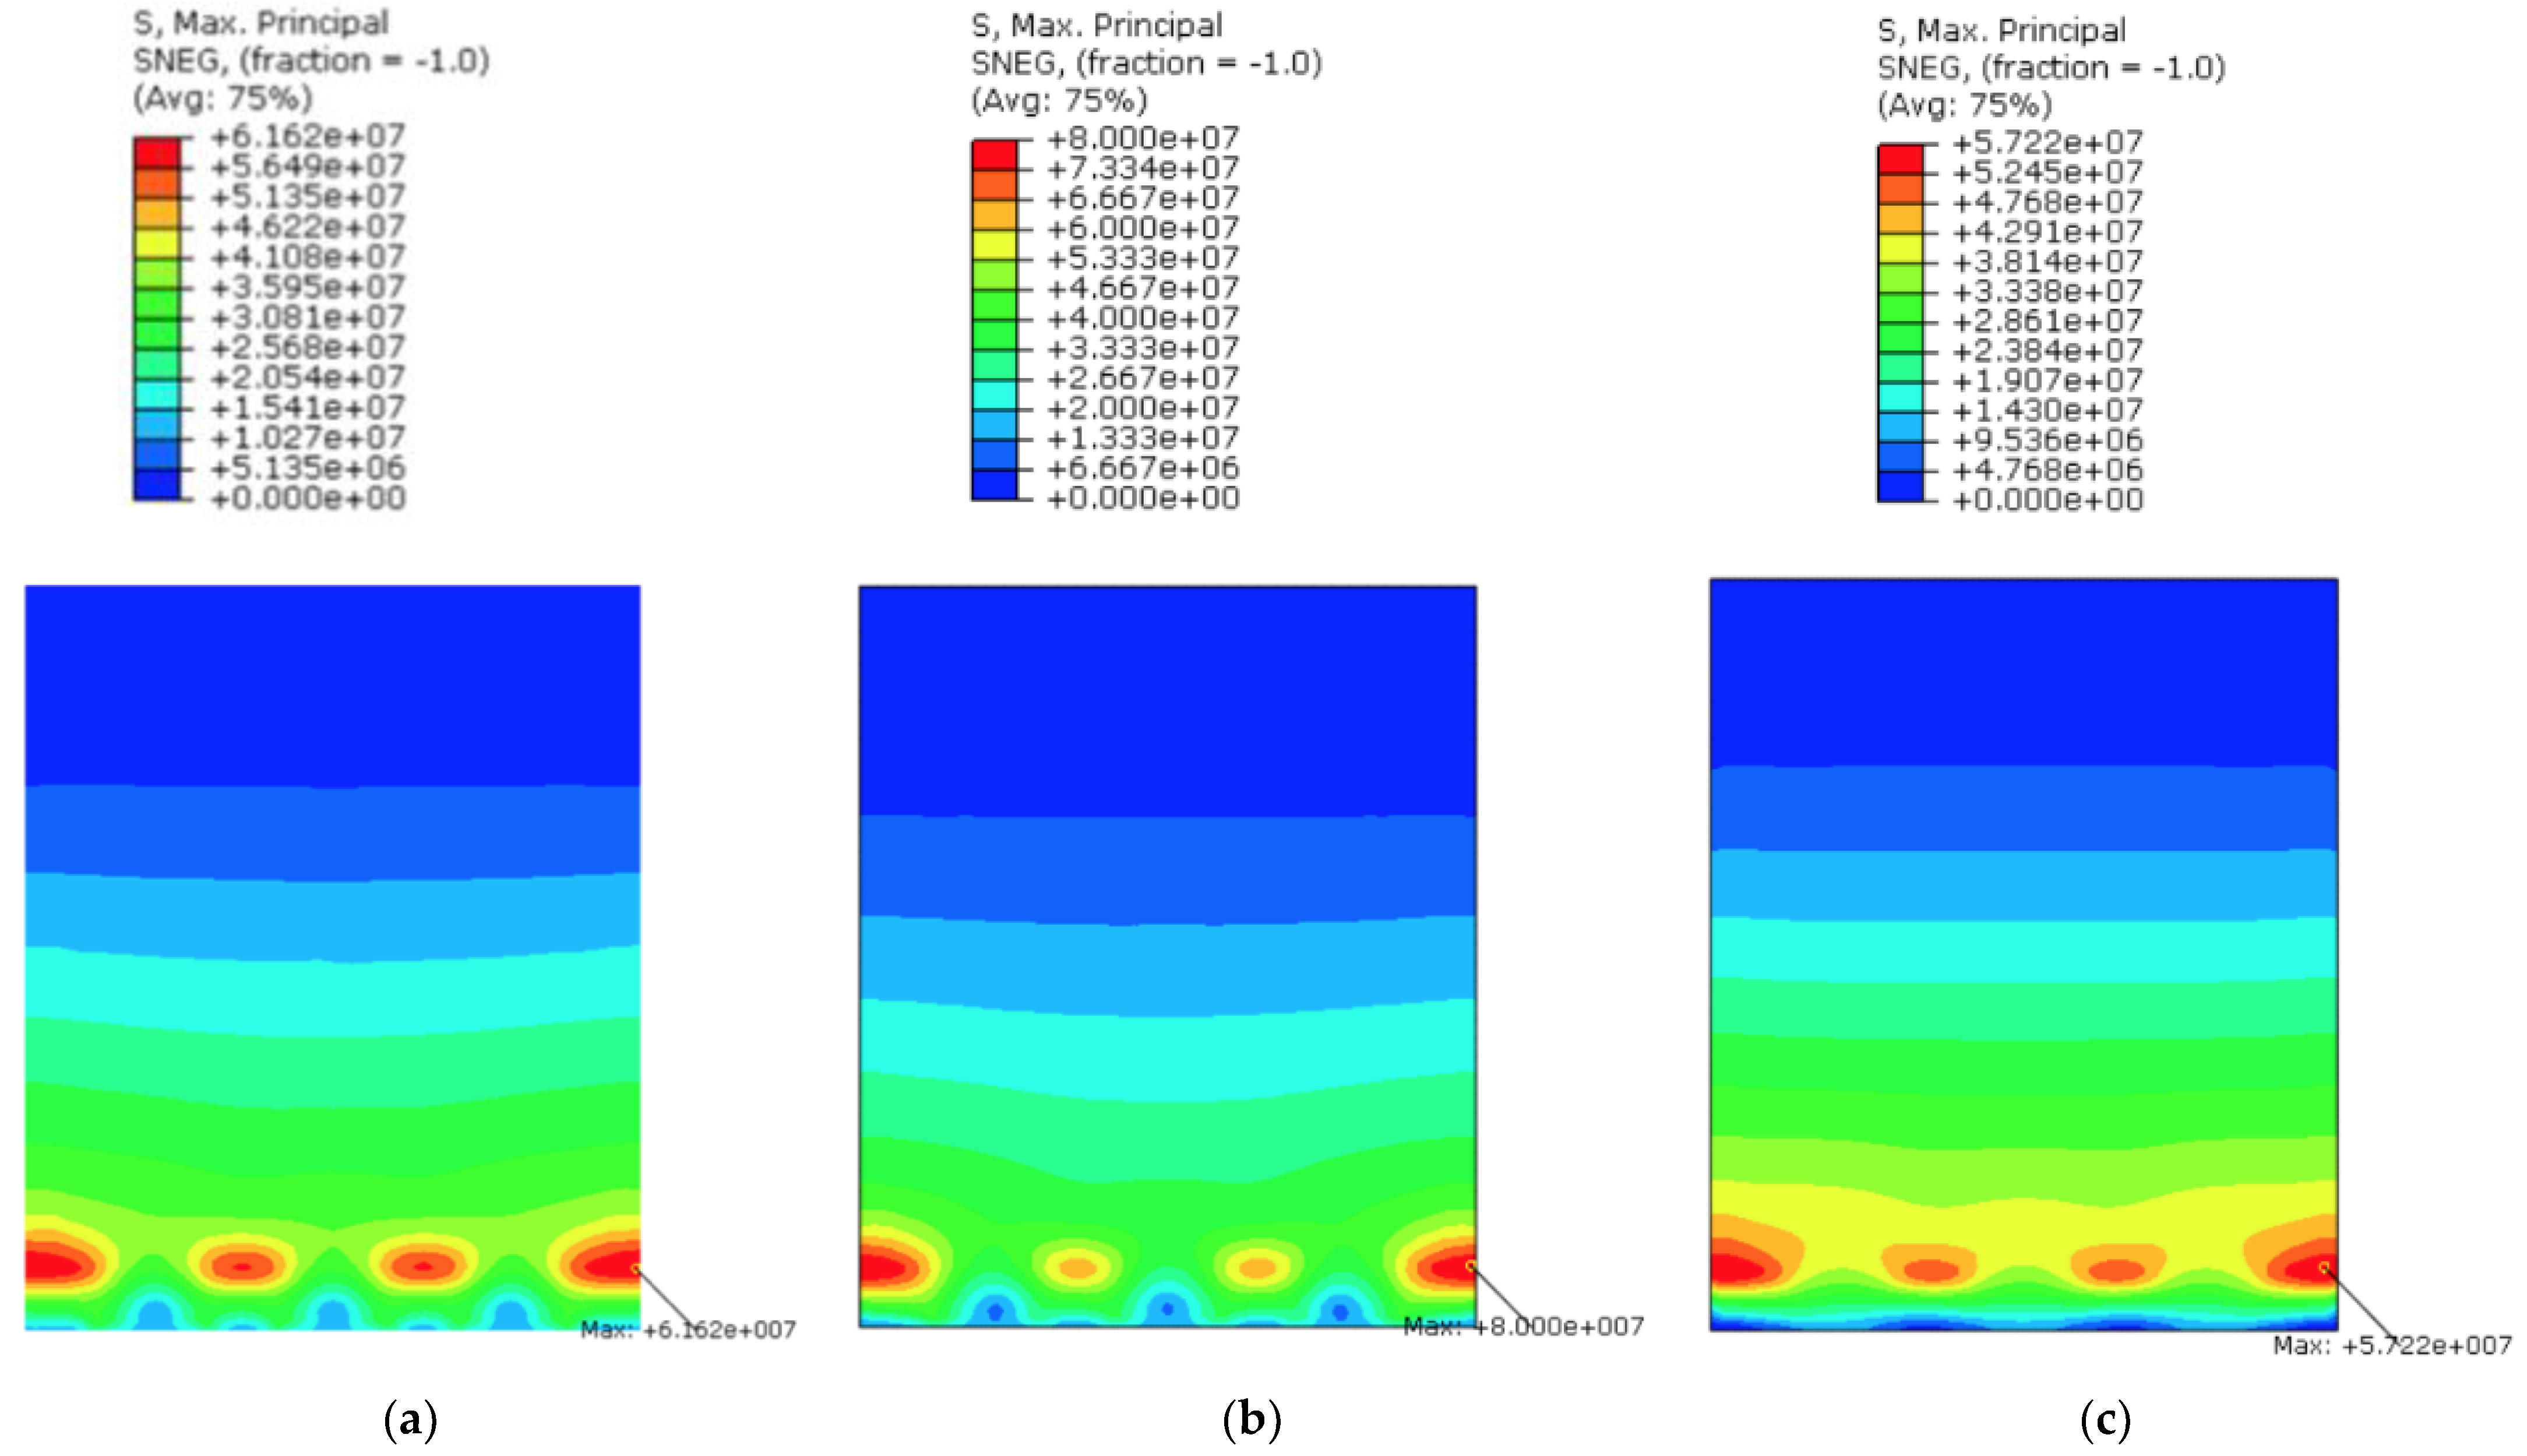
For the L1 configuration, a quasi-static lateral load P was distributed along the width of the glass balustrade, towards the top (unrestrained) edge of the LG panel (at an average height of 1.1 m). In case of the L2 dynamic configuration, a double twin-tyre impactor was numerically described in addition to the glass balustrade components so as to reproduce the desired impact configurations, as in [17], under an imposed translational velocity.
The Refined numerical model was in fact used to capture global and local phenomena in all the model components so as to facilitate the validation of simplified models. In this regard, the analysis of results was also focused on the stress and deformation trends in the components of the base restraint. Typical examples are reported in Figure 5.

3.2. Results

The typical behaviour of the Refined numerical model was first addressed regarding the double twin-tyre impact configurations that were experimentally investigated and numerically analyzed in [17]. Selected performance indicators can be seen in Figure 6 in the form of the lateral displacement time history for the LG panel, the principal stress measured in glass, and the acceleration time history. It can be noted, over the time of impact and contact for the double twin-tyre, a rather good correlation between the FE numerical predictions and the corresponding experimental measurements. Additionally, the presently developed Refined model proved to offer a close correlation with the numerical estimates reported in [17] (see Table 3).
For the 300 mm drop height configuration in Figure 6a, for example, maximum principal stresses were measured in the order of 33 MPa, which denotes a linear elastic behaviour of glass. The percentage scatter of the Refined numerical estimates compared to the experimental outcomes was quantified in the order of +2.4%. Similar trends were observed for the lateral displacement of the glass balustrade, with approximately 42 mm of maximum deformation in the control point and a scatter of +2.3% of the numerical and experimental findings. Further, the numerical analysis was carried out by varying the drop height of the impactor. In this case, the Refined numerical model generally proved to capture the past experimental outcomes, as well as the FE numerical estimates reported in [17]. In Table 3, a summary of comparisons is, for example, proposed in terms of the maximum measured acceleration for the double twin-tyre under impact conditions, as calculated from past experiments (amax,test [17]), from the FE numerical model presented in [17] (amax,model [17]), and from the presently developed FE numerical model. Moreover, the percentage scatter of the present Refined model is calculated towards past experiments (∆1) or towards past numerical simulations (∆2), respectively.

4. Derivation and Calibration of Simplified Numerical Models

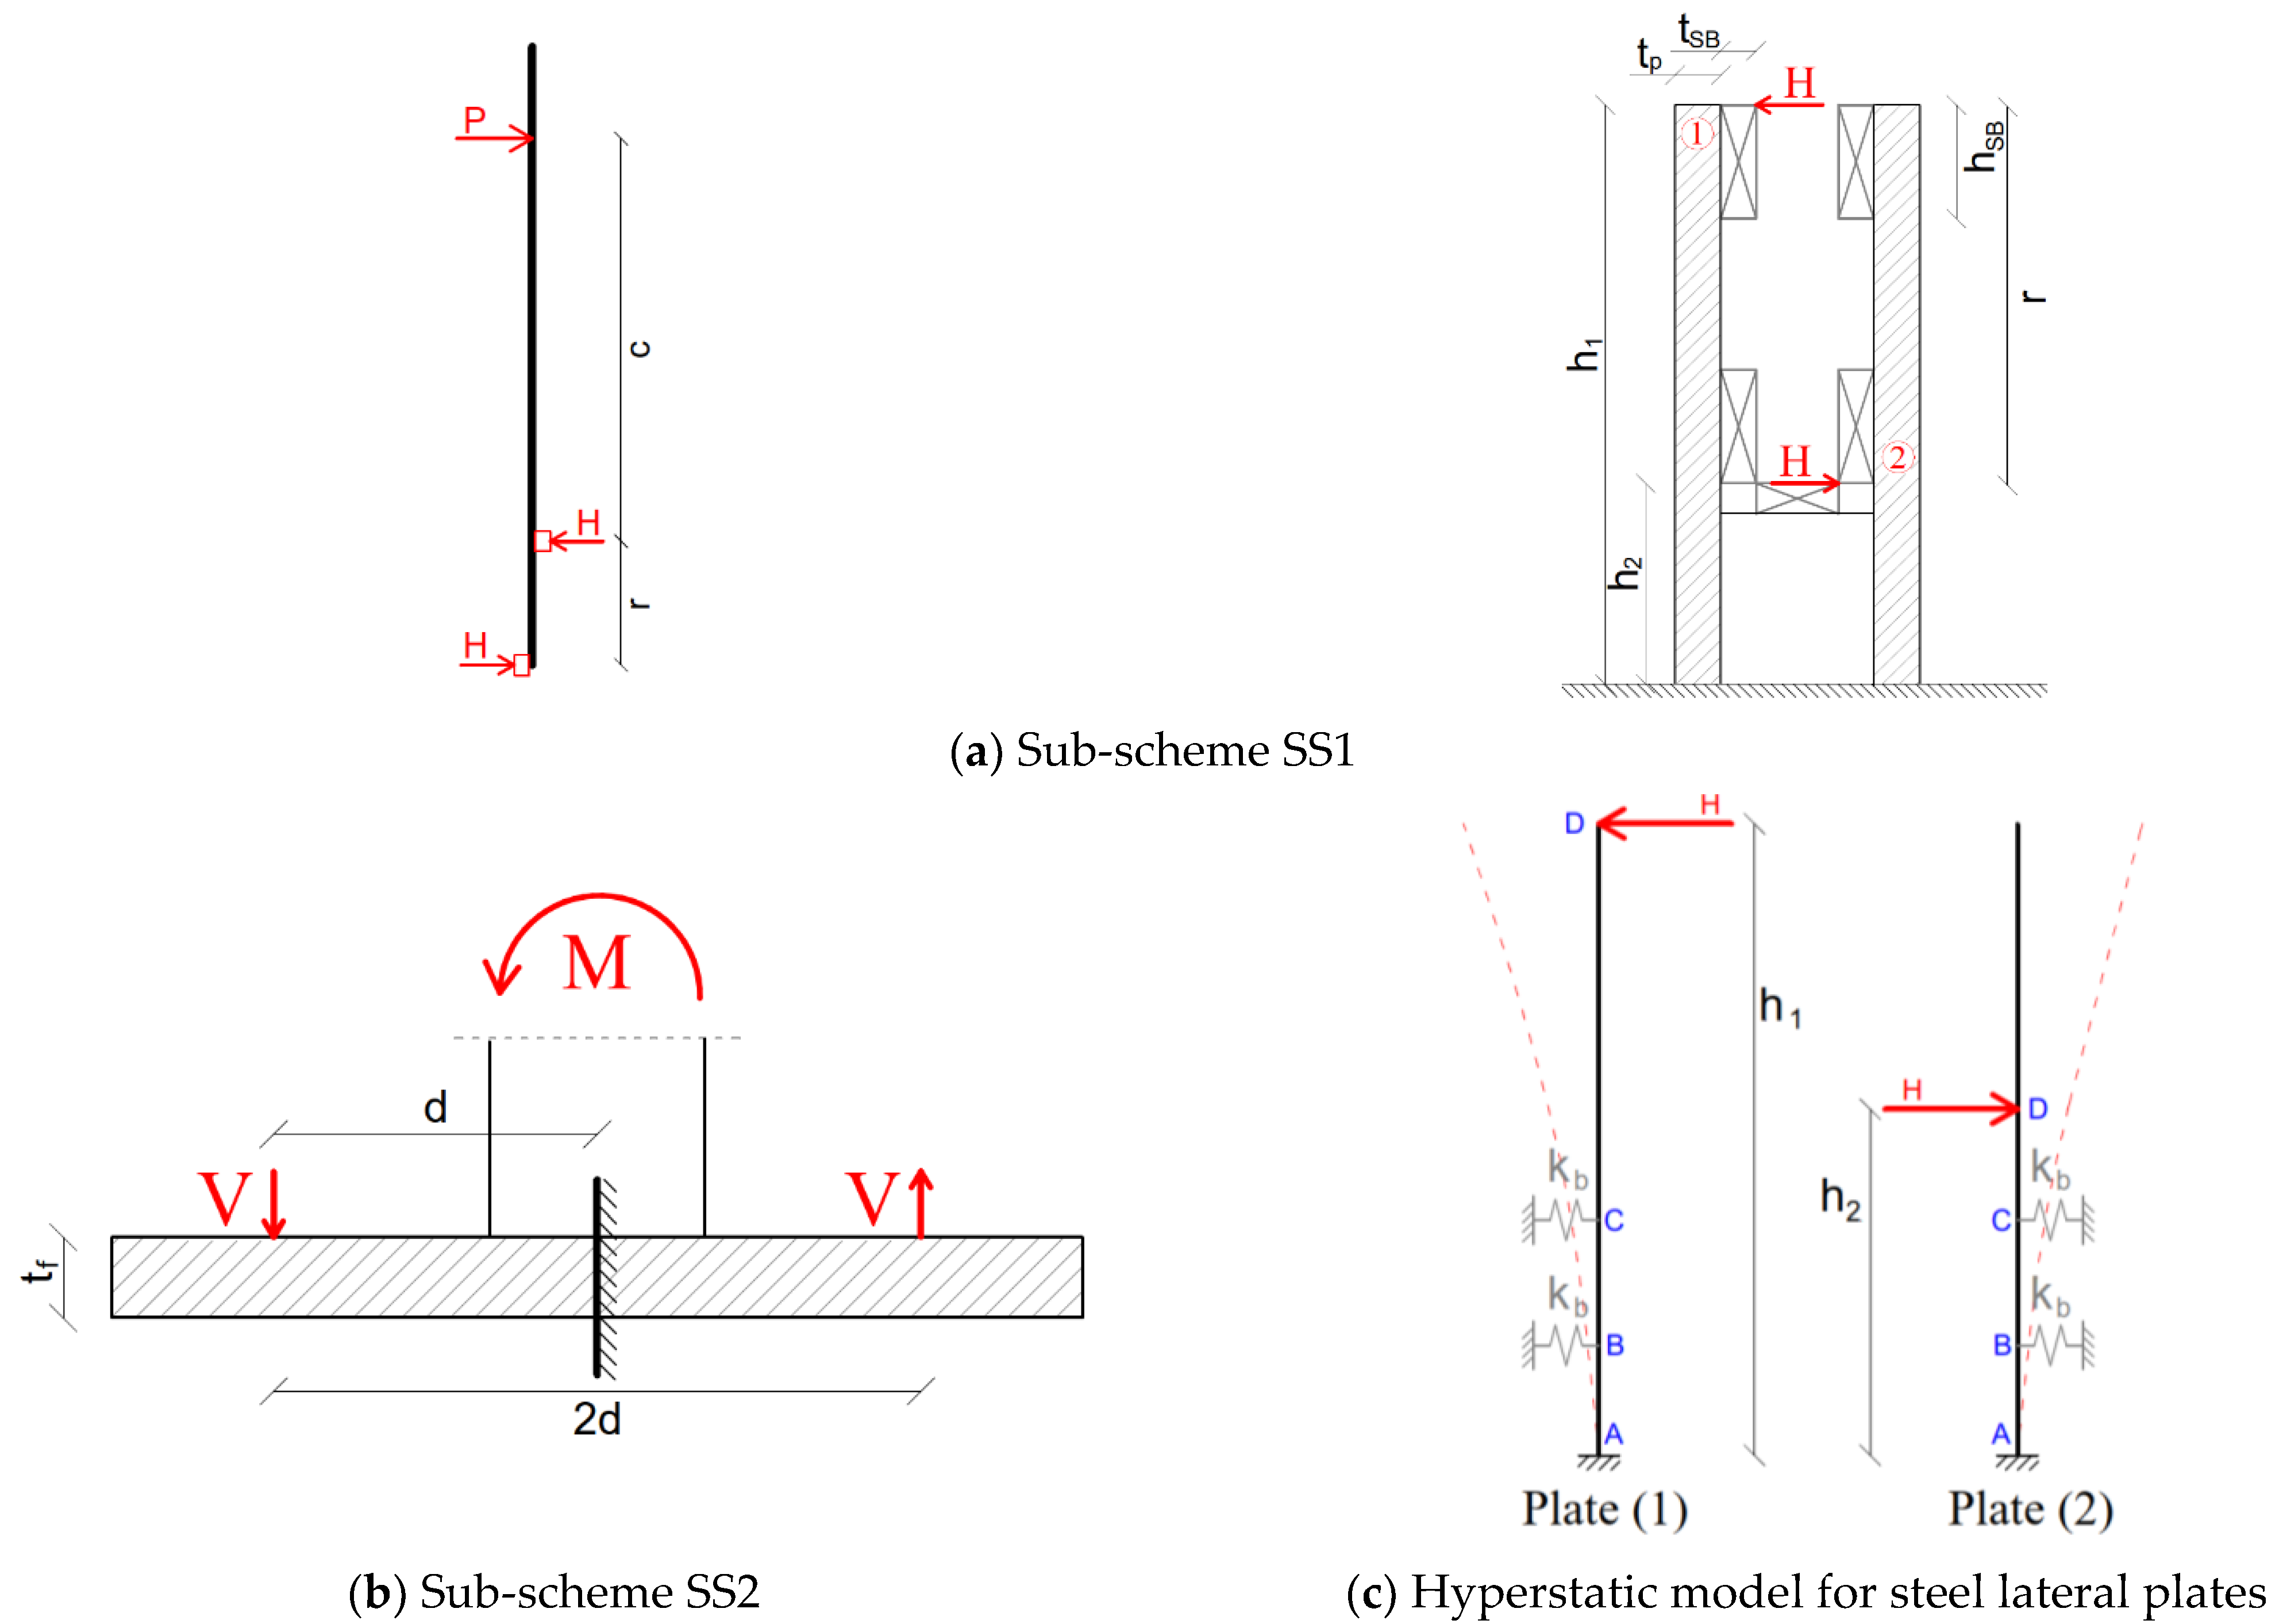
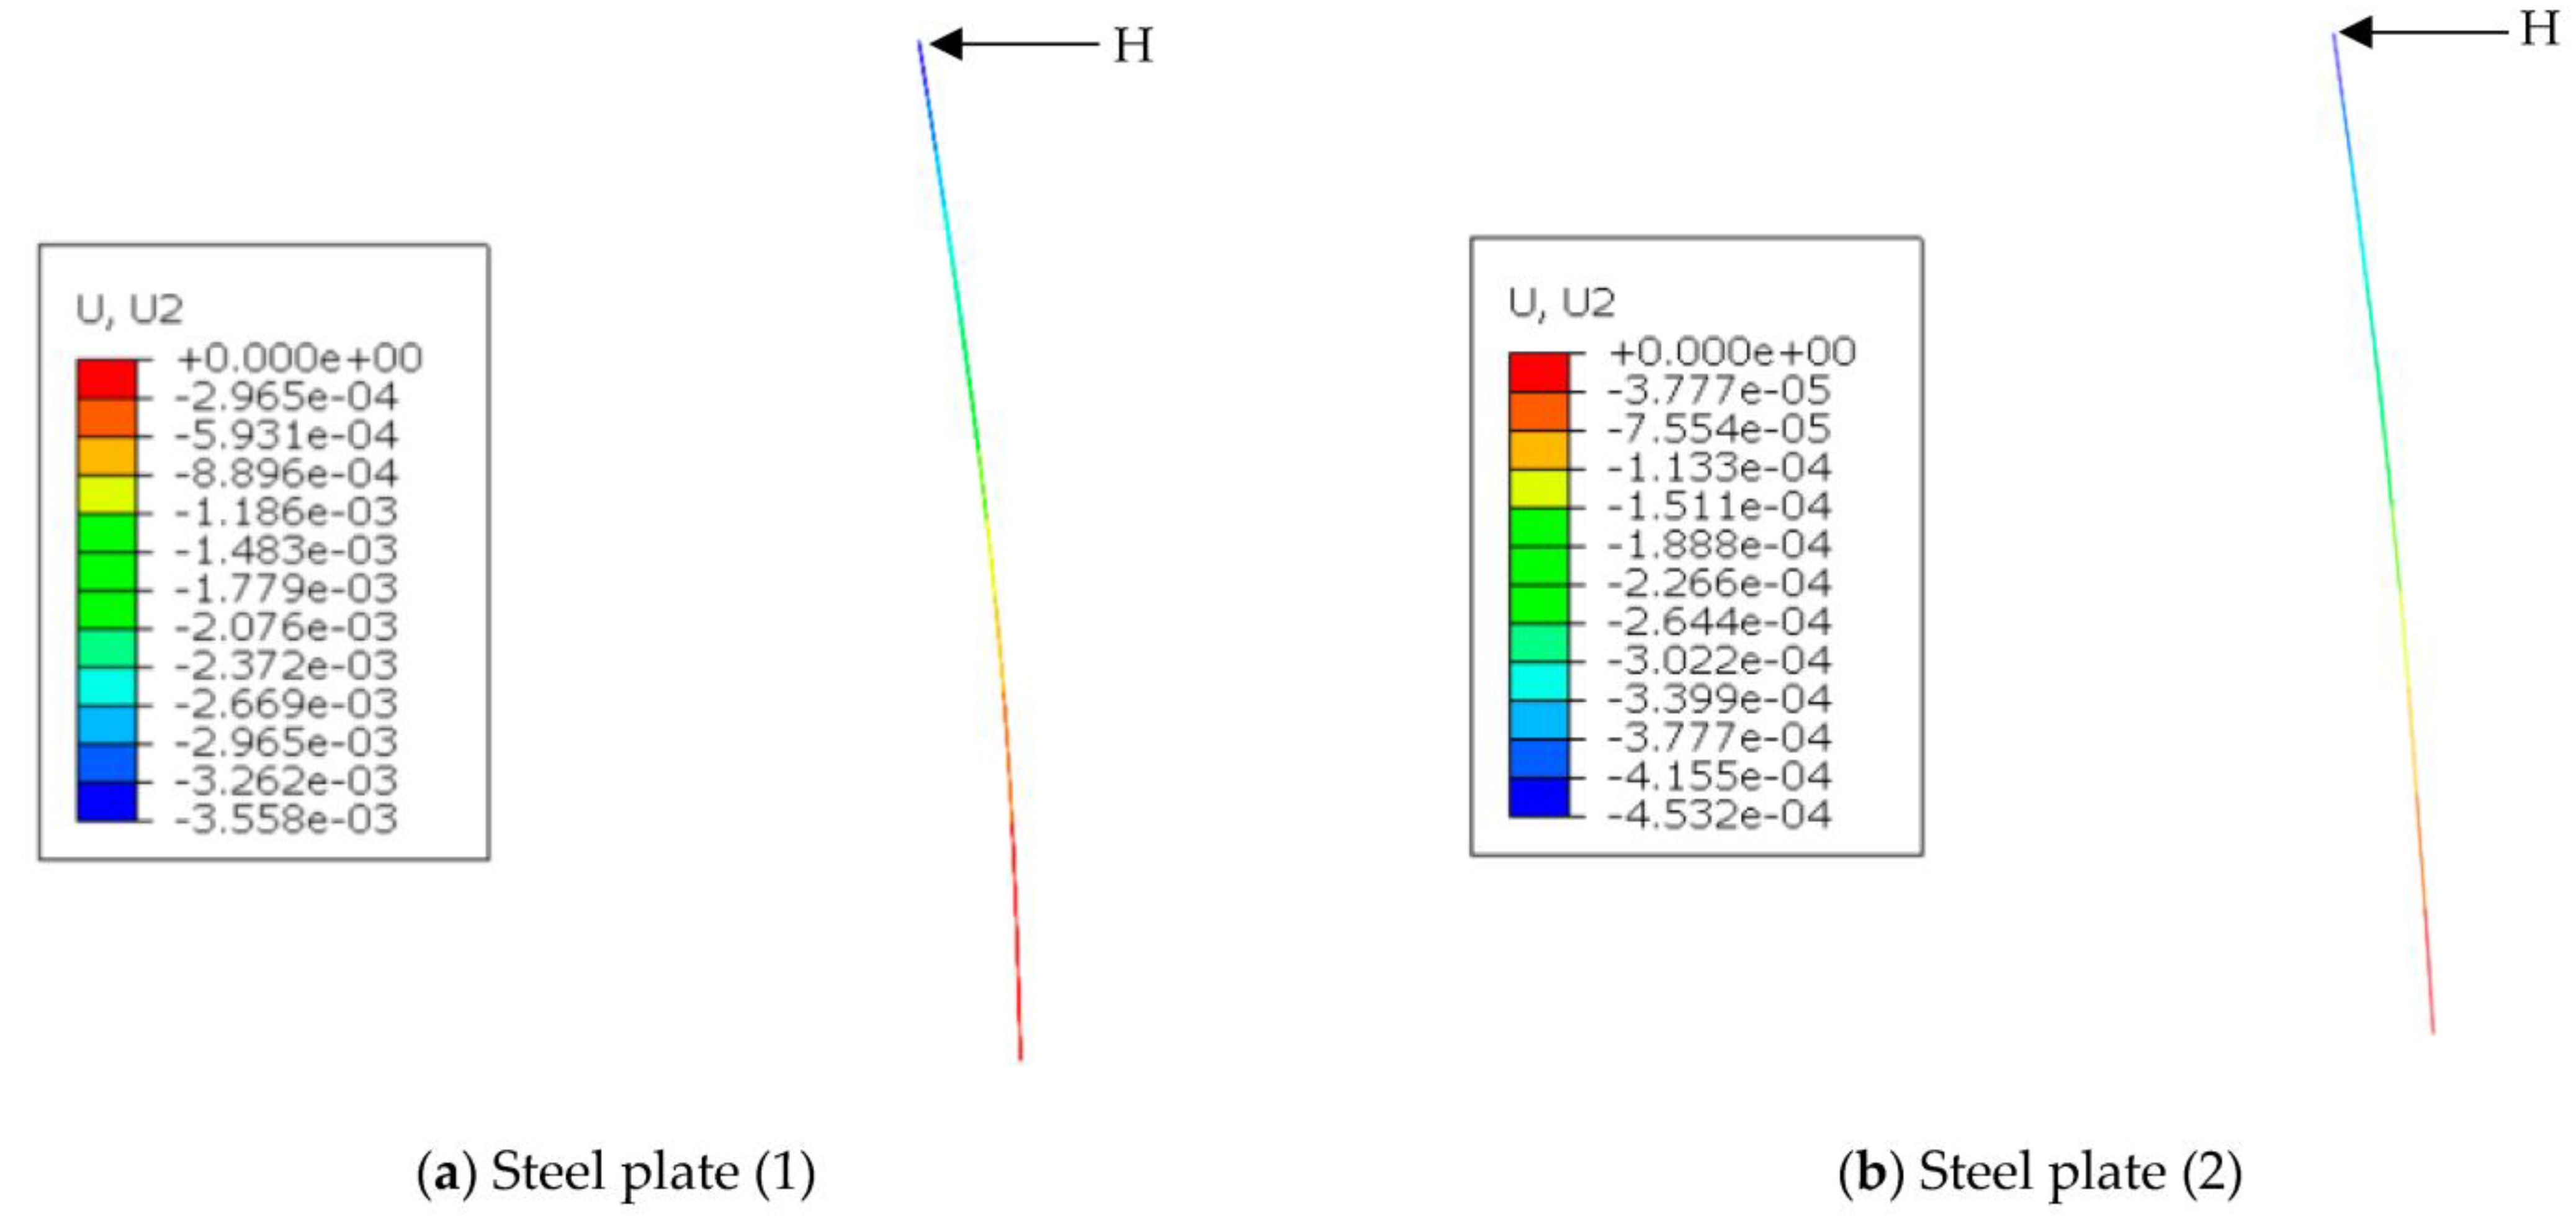
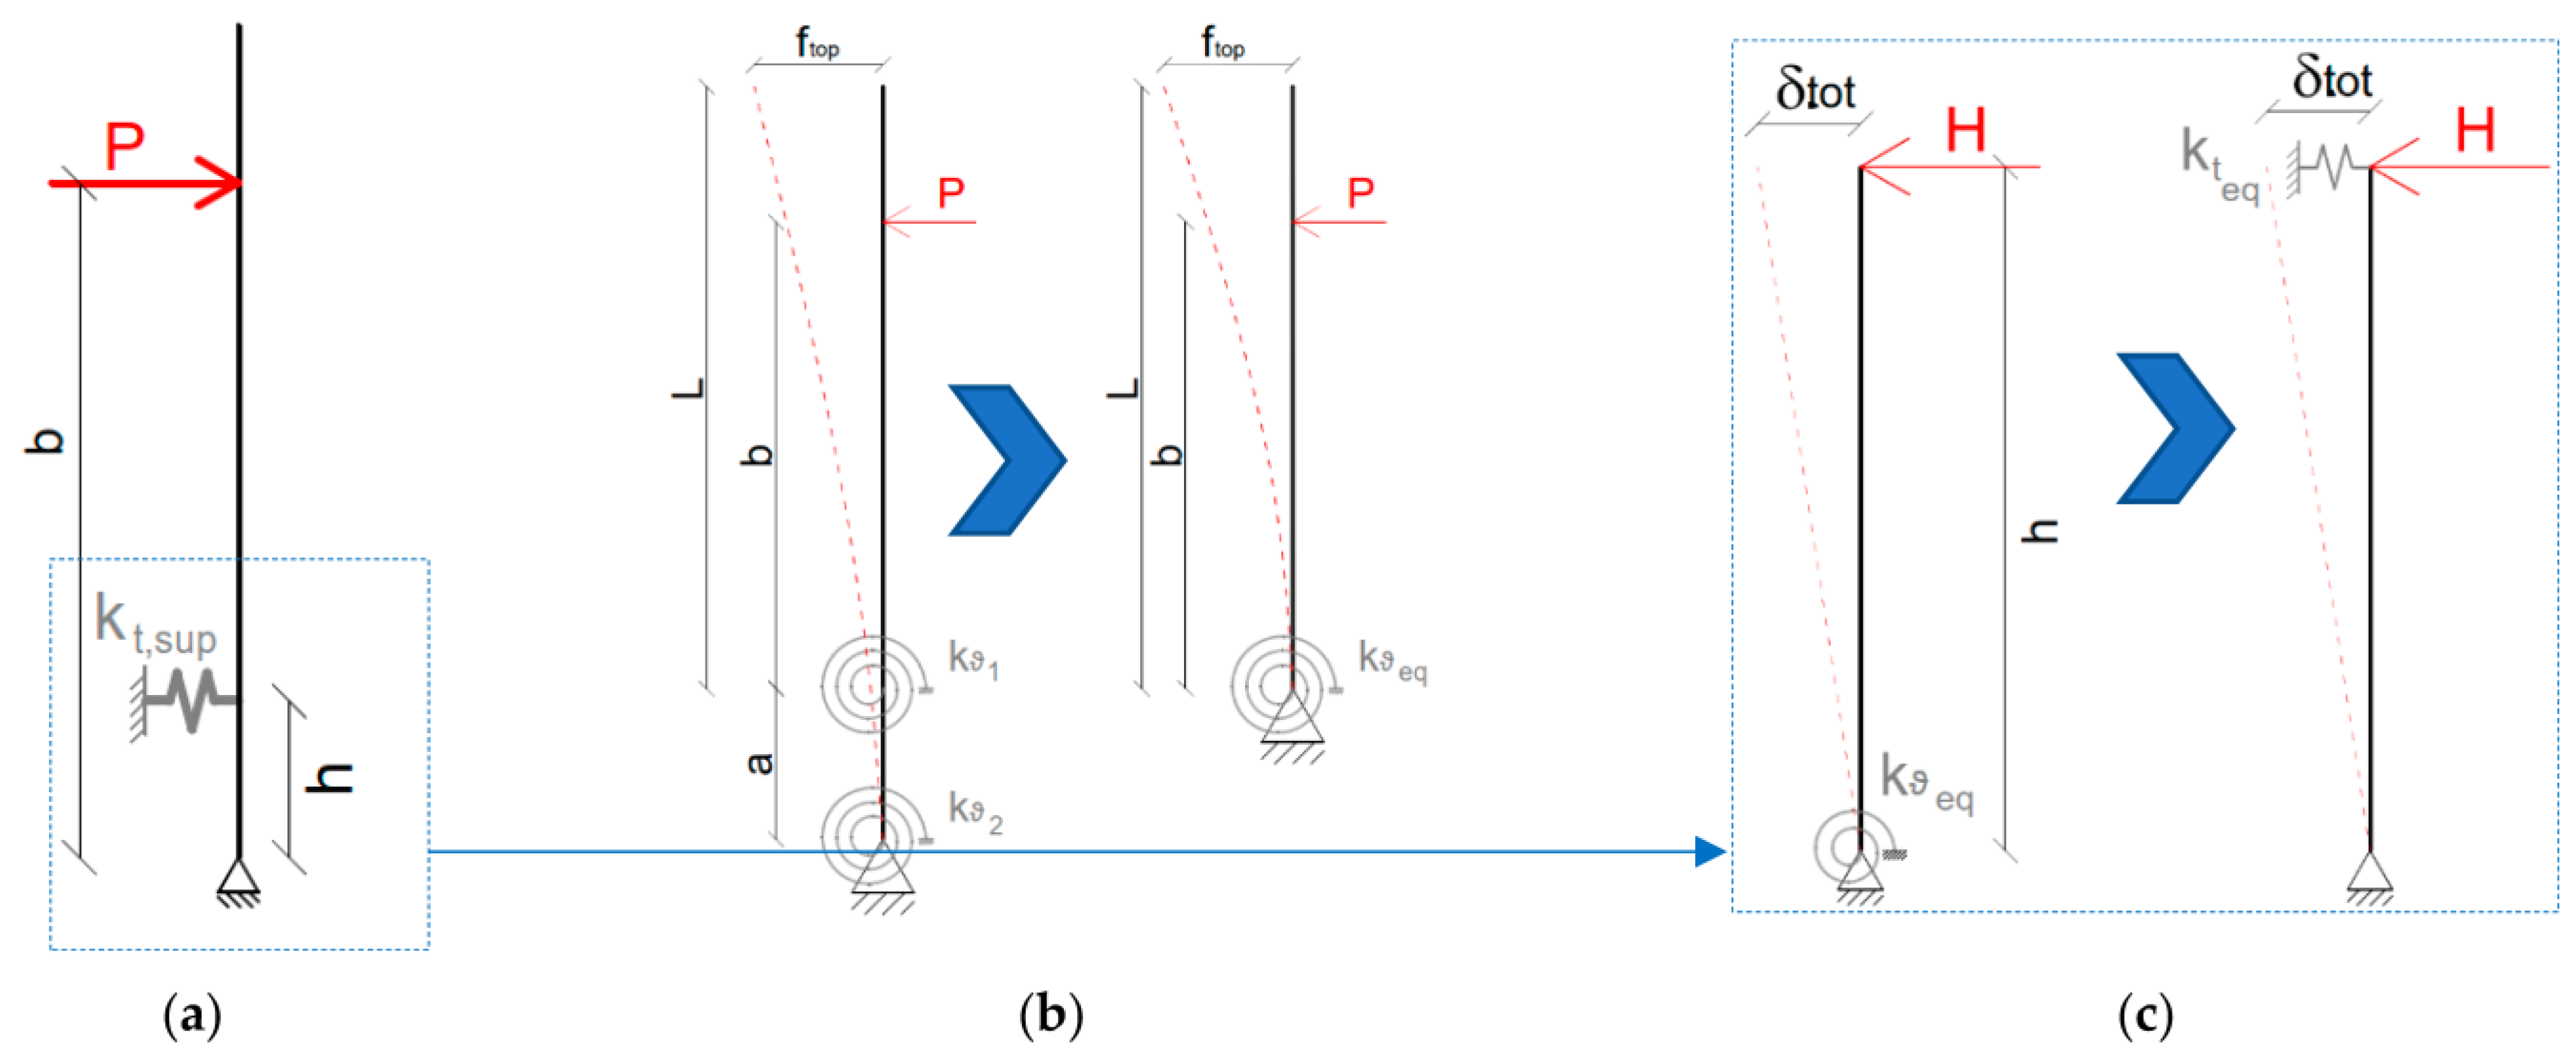
4.1. Simplified Characterization of the Base Restraint—SM1 Model

The first simplified procedure (SM1) assumes that all the steel components of the base restraint are removed from the FE model in Figure 4. In other words, only the layered LG panel and the lateral setting blocks, still reproduced by 3D solid brick elements, are kept in position (see Figure 7). From a practical point of view, such a kind of assumption means that the steel base restraint is replaced with equivalent translational springs.
These springs are properly calibrated to possibly reproduce a rather complex mechanism. According to the original layout of assembled steel components, the springs are, in fact, expected to reproduce the mechanical effects of the lateral steel plates (1) and (2) for the LG panel subjected to out-of-plane bending (i.e., Figure 8a, sub-scheme SS1), as well as the possible additional contribution due to the local deformation of the base steel flange (i.e., Figure 8b, sub-scheme SS2).
For the sub-scheme SS1 in Figure 8a, the top lateral displacement of steel plates (1) and (2) could be calculated as for two cantilevers under lateral force H, that is:
δ p i = H   h i 3 3 E s J p , with   i = 1 ,   2   plates
where:
H = P r + c r
is the horizontal reaction force for sub-scheme SS1, with r = (h1h2), from Figure 8a, and:
J p = B   t p 3 12
is the second moment of the area for each tp-thick steel plate, with B = 1 m being the extension of plates in the width of the balustrade. Such a kind of calculation, with the reference input parameters, would result in a relatively small top lateral displacement for both steel plates (1) and (2), namely, δ p 1 = 1.95 mm and δ p 2 = 0.08 mm, respectively, for the present study.
However, the so-derived displacement amplitudes are based on a roughly simplified schematization of the real system, reciprocal mechanical interactions, and, thus, a strong overestimation of bending stiffness terms compared to the Refined model parameters and the corresponding estimates. In this sense, the need for a more detailed calculation for the sub-scheme SS1 in Figure 8a could follow the hyperstatic schematic model presented in Figure 8c, in which:
k b = A b   E s l b
is the axial stiffness of base bolts, while the control points D represent the location of contact forces H at the interface of the LG panel in bending with the lateral supporting plates. The extended analytical solution of the hyperstatic scheme in Figure 8c (herein omitted) gives an improved—but still approximate—estimation for the lateral displacement in the control point D of plates (1) and (2). To further assess the accuracy of such a calculation approach, in this regard, a dedicated FE numerical analysis was developed in ABAQUS on 1D wire models, whose typical results are reported in Figure 9. For the LG balustrade under a given quasi-static top lateral load P, the solution of the hyperstatic scheme would result in lateral displacements of steel restraining plates equal to:
δp,D(1) = 3.17 mm    δp,D,FE(1) = │3.56│ mm    ∆ = −10.95%
δp,D(2) = 0.32 mm    δp,D,FE(2) = │0.45│ mm    ∆ = −28.8%
that is, in a scatter up to ≈−11% for steel plate (1) and ≈−29% for steel plate (2), respectively, compared to the 1D numerical model.
Regarding the sub-scheme SS2 of Figure 8b, it is also assumed for the base steel flange that the total rotation under top lateral loads for the LG balustrade can be considered by:
θ 2 = δ t o t d = δ f + δ b d
where:
δ f = V   d 3 3   E s   J f   is   the   deformation   of   the   base   flange ,
with Jf being its second moment of the area:
  J f = B t f 3 12
and:
δ b = V   l b E s   A b   being   the   contribution   in   deformation   for   bolts ,
with:
M = H   h 1 h 2
and
V = M 2   d
The so-defined θ 2 rotation term of the base flange under moment M manifests on the clamped lateral steel plates (1) and (2) in the form of an additional lateral displacement, which—even being relatively small—can be calculated as:
δ θ i = θ 2   d + h i ,   with   i = 1 ,   2
For the present application, the contribution of Equation (13) can be quantified in δ θ 1 = 0.45 mm and δ θ 2 = 0.24 mm, respectively, which should be added to the previously calculated SS1 displacement estimates.
In the above conditions, it is in fact possible to uniformly distribute a set of equivalent translational springs on a glass surface of total extension ASB, which corresponds to the location and size of setting blocks, namely:
k t , s u p , W i n k l e r = 2   k t , s u p 8   A S B
and
k t , i n f , W i n k l e r = 2   k t , i n f 8   A S B
where the translational stiffness terms
k t , s u p = H δ p 1 + δ θ 1
and
k t , i n f = H δ p 2 + δ θ 2
find correspondence in the original mechanical model of Figure 7.

4.2. Simplified Characterization of the Base Restraint and LG Panel—SM2 Model

Differing from the SM1 system, the SM2 model introduces additional simplifications on the side of the layered glass panel. More precisely, the 3D solid brick sandwich section for the LG panel is replaced by an equivalent thickness monolithic glass panel composed of 2D shell elements, in which the total thickness is calculated based on nominal LG features, with the support of the EET formulation [2]. More specifically, assuming the input geometrical and mechanical parameters summarized in Section 2, the EET analytical calculation results in a total thickness of glass equal to 21.3 mm.
Figure 10 shows the corresponding FE model under the double twin-tyre setup, with evidence of 8-node, S8R-type monolithic shell elements used for the description of the glass panel. The material characterization, in the framework of an EET-based analysis of LG panes, is still based on material properties according to Table 2.
Overall, the FE numerical model of Figure 10 can be schematized as in Figure 11a. Another relevant feature of the SM2 simplified model is represented by the introduction of equivalent translational stiffness terms, which are calculated for a set of springs and introduced (uniformly distributed on lumped regions, as in Figure 10) at the base of the 2D shell-based monolithic glass panel (i.e., in the region of setting blocks) so as to capture a more realistic distribution of stresses for glass in bending.
More precisely, the translational stiffness contribution required for this kind of approach is defined in Figure 11a. This input value can be rationally obtained based on some considerations of the real mechanical system and, in particular, based on two additional rotational contributions, which are first used to represent the sub-schemes SS1 and SS2 in Figure 8 (see Figure 11b) and cumulated in an equivalent rotational spring, which is introduced at the bottom edge of the glass. Successively, once this equivalent rotational stiffness term is placed, as in Figure 11c, additional mechanical considerations based on rigid-body rotation assumptions for the h-span cantilever and an equivalent translational stiffness term to reproduce the effect of original restraints is estimated.
In Figure 11, the schematic model of Figure 11c represents a detailed view of the base restraint region only, where the distance h is the same as that in Figure 11a. Most importantly, the advantage of the overall analytical procedure schematized in Figure 11 is that the resulting equivalent translational spring stiffness, kt,eq = kt,sup, can be derived from multiple considerations in the rotational stiffness form (Figure 11c), that is:
k t , e q = k t , s u p = H δ t o t = k ϑ , e q h 2
and where kθ,eq is implicitly representative of the rotational contributions of sub-schemes SS1 and SS2. From Equation (18), the translational springs can thus be distributed as in the FE numerical model of Figure 10, given that:
k t , s u p , W i n k l e r = k t , s u p 4   A S B = k t , e q 4   A S B
The SM2 procedure assumes that, for the detailed scheme in Figure 11c:
k ϑ , e q = H   h θ   and   H = k ϑ , e q   θ h
where:
θ = δ t o t h   and   δ t o t = θ   h
To this aim, basic assumptions similar to those of SM1 are taken into account for sub-schemes SS1 and SS2. It is observed that, as far as a rigid link is used to connect the two rotational springs in Figure 11b, these two contributions can be expressed as:
k ϑ 1 = H h θ 1
and
  k ϑ 2 = V d θ 2
For the rotational spring “1” of Equation (22), in particular, the deformation terms to take into account to express the expected rotation amplitude still derive from a quantification of the lateral displacements of steel plates (1) and (2) under lateral load P at the top edge of the balustrade, but they also derive from the possible crushing of lateral setting blocks which are compressed due to the progressively increasing deformation of the glass panel in out-of-plane bending. This means that, for Equation (22), it is:
θ 1 = δ p , 1 t o t h = δ p 1 + δ p 2 + δ S B 1 + δ S B 2 h
where:
δ S B 1 = δ S B 2 = H t s b E s b   A s b / 3
while θ 2 for Equation (23) is given by Equation (7).
Overall, the final value for the equivalent rotational spring to be introduced at the base of the glass panel (Figure 11b) comes from:
1 k ϑ , e q = 1 k ϑ 1 + a + b a + L b   L 1 k ϑ 2
where:
δ ϑ , e q = δ ϑ 1 + δ ϑ 2 = P b L k ϑ , e q
δ ϑ , 1 = P b L k ϑ 1
δ ϑ , 2 = P a + b   a + L k ϑ 2
and:
δ E J = P a + b 2 6   E J   3   a + L a + b
δ E J in Equation (30) represents the displacement of the glass panel under top-edge lateral load P and depends on the bending stiffness of the equivalent monolithic glass panel only (i.e., cantilever response analysis for the composite LG panel); thus, the top lateral deflection at the unrestrained edge of glass can be quantified in:
f t o p = δ E J + δ ϑ 1 + δ ϑ 2

4.3. Linearly Distributed Base Springs—SM3 and SM4 Models

In conclusion, two additional simplified mechanical models are taken into account, namely, the SM3 and SM4 models. Differing from the SM2 model, the equivalent springs are moved from the actual region of the setting blocks and are equally distributed. For SM3, this spring distribution is performed in the same height as that of the real restraints (see Figure 12a) so as to possibly capture the same translational effect of the Refined system. For the SM4 model with rotational equivalent springs, these are uniformly distributed along the bottom edge of the glass panel (see Figure 12b). In both cases, the LG panel is still described as for SM2, that is, in the form of equivalent monolithic shell elements made of glass.
The comparative results are discussed in Section 5 for the balustrade under quasi-static lateral load or double twin-tyre impactor, while Table 4 gives evidence of the computational cost of explored simplified numerical models compared to that of the Refined one.
In this regard, it is worth noting that the SM1 simplified model mostly reduces to half the number of elements and DOFs, with substantial benefits in terms of structural analysis. For the SM2 model, the number of elements is in the order of the 1/10th part compared to the Refined model. The use of monolithic shell elements for the LG panel in place of 3D solid brick elements can be quantified in computational benefits from the comparison of SM2 features with SM1 features.
On the other hand, it must be recalled that the LG panels described by the monolithic shell section made of glass are able to provide accurate results for limited loading and boundary conditions only. Finally, the SM3 and SM4 models are characterized by the same order of magnitude of elements and DOFs as in the case of the SM2 model, where minimum variations are quantified by the removal of setting blocks.

5. Discussion of Numerical Results

5.1. Simplified Models SM1 and SM2

A first comparison is presented in terms of top-lateral displacement for the examined glass balustrade under quasi-static lateral load (P = 4.5 kN). Numerical results are proposed in Figure 13 for the simplified models SM1 and SM2 in comparison to the Refined FE model, with evidence of top lateral displacement (Figure 13a) and a calculated percentage scatter of SM1 or SM2 models compared to the Refined one (Figure 13b), as a function of imposed lateral load P, where:
Δ f = 100 · f S M i f R e f i n e d f R e f i n e d with   i = 1 ,   2
Regarding SM1, it can be noted that its linear deflection trend in Figure 13a corresponds to a very large percentage scatter in Equation (32) compared to the Refined model, in which local behaviours of primary and secondary fixing components can be efficiently taken into account. Especially in the first loading stage, it is evident that the SM1 model overestimates up to ≈50% the initial deformation of the LG balustrade, while the calculated percentage scatter progressively decreases in Figure 13b as the imposed load P increases. In this regard, the major sensitivity of the calculated scatter in small amplitudes of the loading stage must be attributed to the linear mechanical characterization taken into account in the SM1 approach for the fixing system, which disregards any possible non-linear effect included by the Refined assembly. In the early loading stage, small adjustments of the LG panel within the fixing restraining system can manifest, for simplified mechanical models, in a strong overestimation of top lateral deflections, whilst the glass panel is still not subjected to relevant bending action.
Most importantly, the trend in Figure 13b depends on a combination of local and global effects, and for higher imposed lateral loads, it can also include the out-of-plane bending deformation of glass in addition to the phenomena in the base connection. In this way, the scatter values in Figure 13b for the SM1-to-Refined model comparisons have both positive (i.e., conservative, compared to Refined model estimates) and negative (i.e., unconservative) values. Compared to the computational costs summarized in Table 4, this means that reducing the number of FE elements and DOFs down to approximately −36% and −57% for the SM1 model induces a large scatter (but on the safe side) for small lateral load amplitudes (i.e., P < 0.3 kN/m in Figure 13b). For high lateral load amplitudes (i.e., P > 1.5 kN/m in Figure 13b), however, the expected top lateral deflection for the LG panel could be sensitively underestimated, with a possible risk for design applications.
When the SM2 model is taken into account (see Figure 13b), an even larger percentage scatter is achieved compared to that of the Refined model, as a major effect of the mechanical characterization of equivalent springs.
Further parametric numerical results are presented in Figure 14 for the LG balustrade under double twin-tyre impact in terms of (a) P1-P2 displacement and the corresponding (b) stress peaks in glass or (c) impactor acceleration in time.
In terms of simplified modelling under dynamic loads, it is possible to see that both the SM1 and SM2 approaches are overall characterized by a relatively higher stiffness compared to the Refined model. The percentage scatter on the maximum lateral displacements of the LG panel, moreover, was predicted as −6% for the SM1 model compared to the Refined one. An even larger scatter is observed in Figure 14a for the SM2 model (−13%), which reduces the number of FE elements and DOFs down to −90% and −85%, respectively. Overall, the SM2 model underestimates the SM1 results in the order of −5% in terms of deflections.
In terms of stress analysis in glass (double twin-tyre impact setup) and, most importantly, stress peak analysis compared to the experimental feedback in [17], a rather close correlation can be observed for the contour plot distribution trends, as it is for the selected examples reported in Figure 15. It is thus easy to note that the presented contour plots are qualitatively similar, and stress peaks can be detected in the region of setting blocks/equivalent springs. Such a finding enforces the need for specific attention for even local assembly details that could have a primary role in verification procedures for structural safety. In terms of stress values and quantitative analysis, however, it can be seen that both the SM1 and SM2 simplified models are rather approximate, given that they tend to overestimate or underestimate, respectively, the expected stress peaks in glass (+29.8% for SM1 and −7.1% for SM2, based on the maximum envelope).
Overall, the best quantitative correlation in terms of local stress analysis is found at control points S1, S2 of Figure 4a, with an average scatter of +9% for the SM1 and SM2 models (Figure 15c). Such an outcome strictly depends on the calibration of discrete equivalent springs and, thus, on the analysis of local mechanisms and phenomena which are expected from the real assembled system. Another important limitation is represented by boundary conditions for the simplified models in use, given that these equivalent springs are rigidly connected to the ground and are thus unable to follow and accommodate the relative deformations of steel plates, while setting blocks are still able to adapt to possible local deformations of the composite assembly (as for the full 3D Refined model).

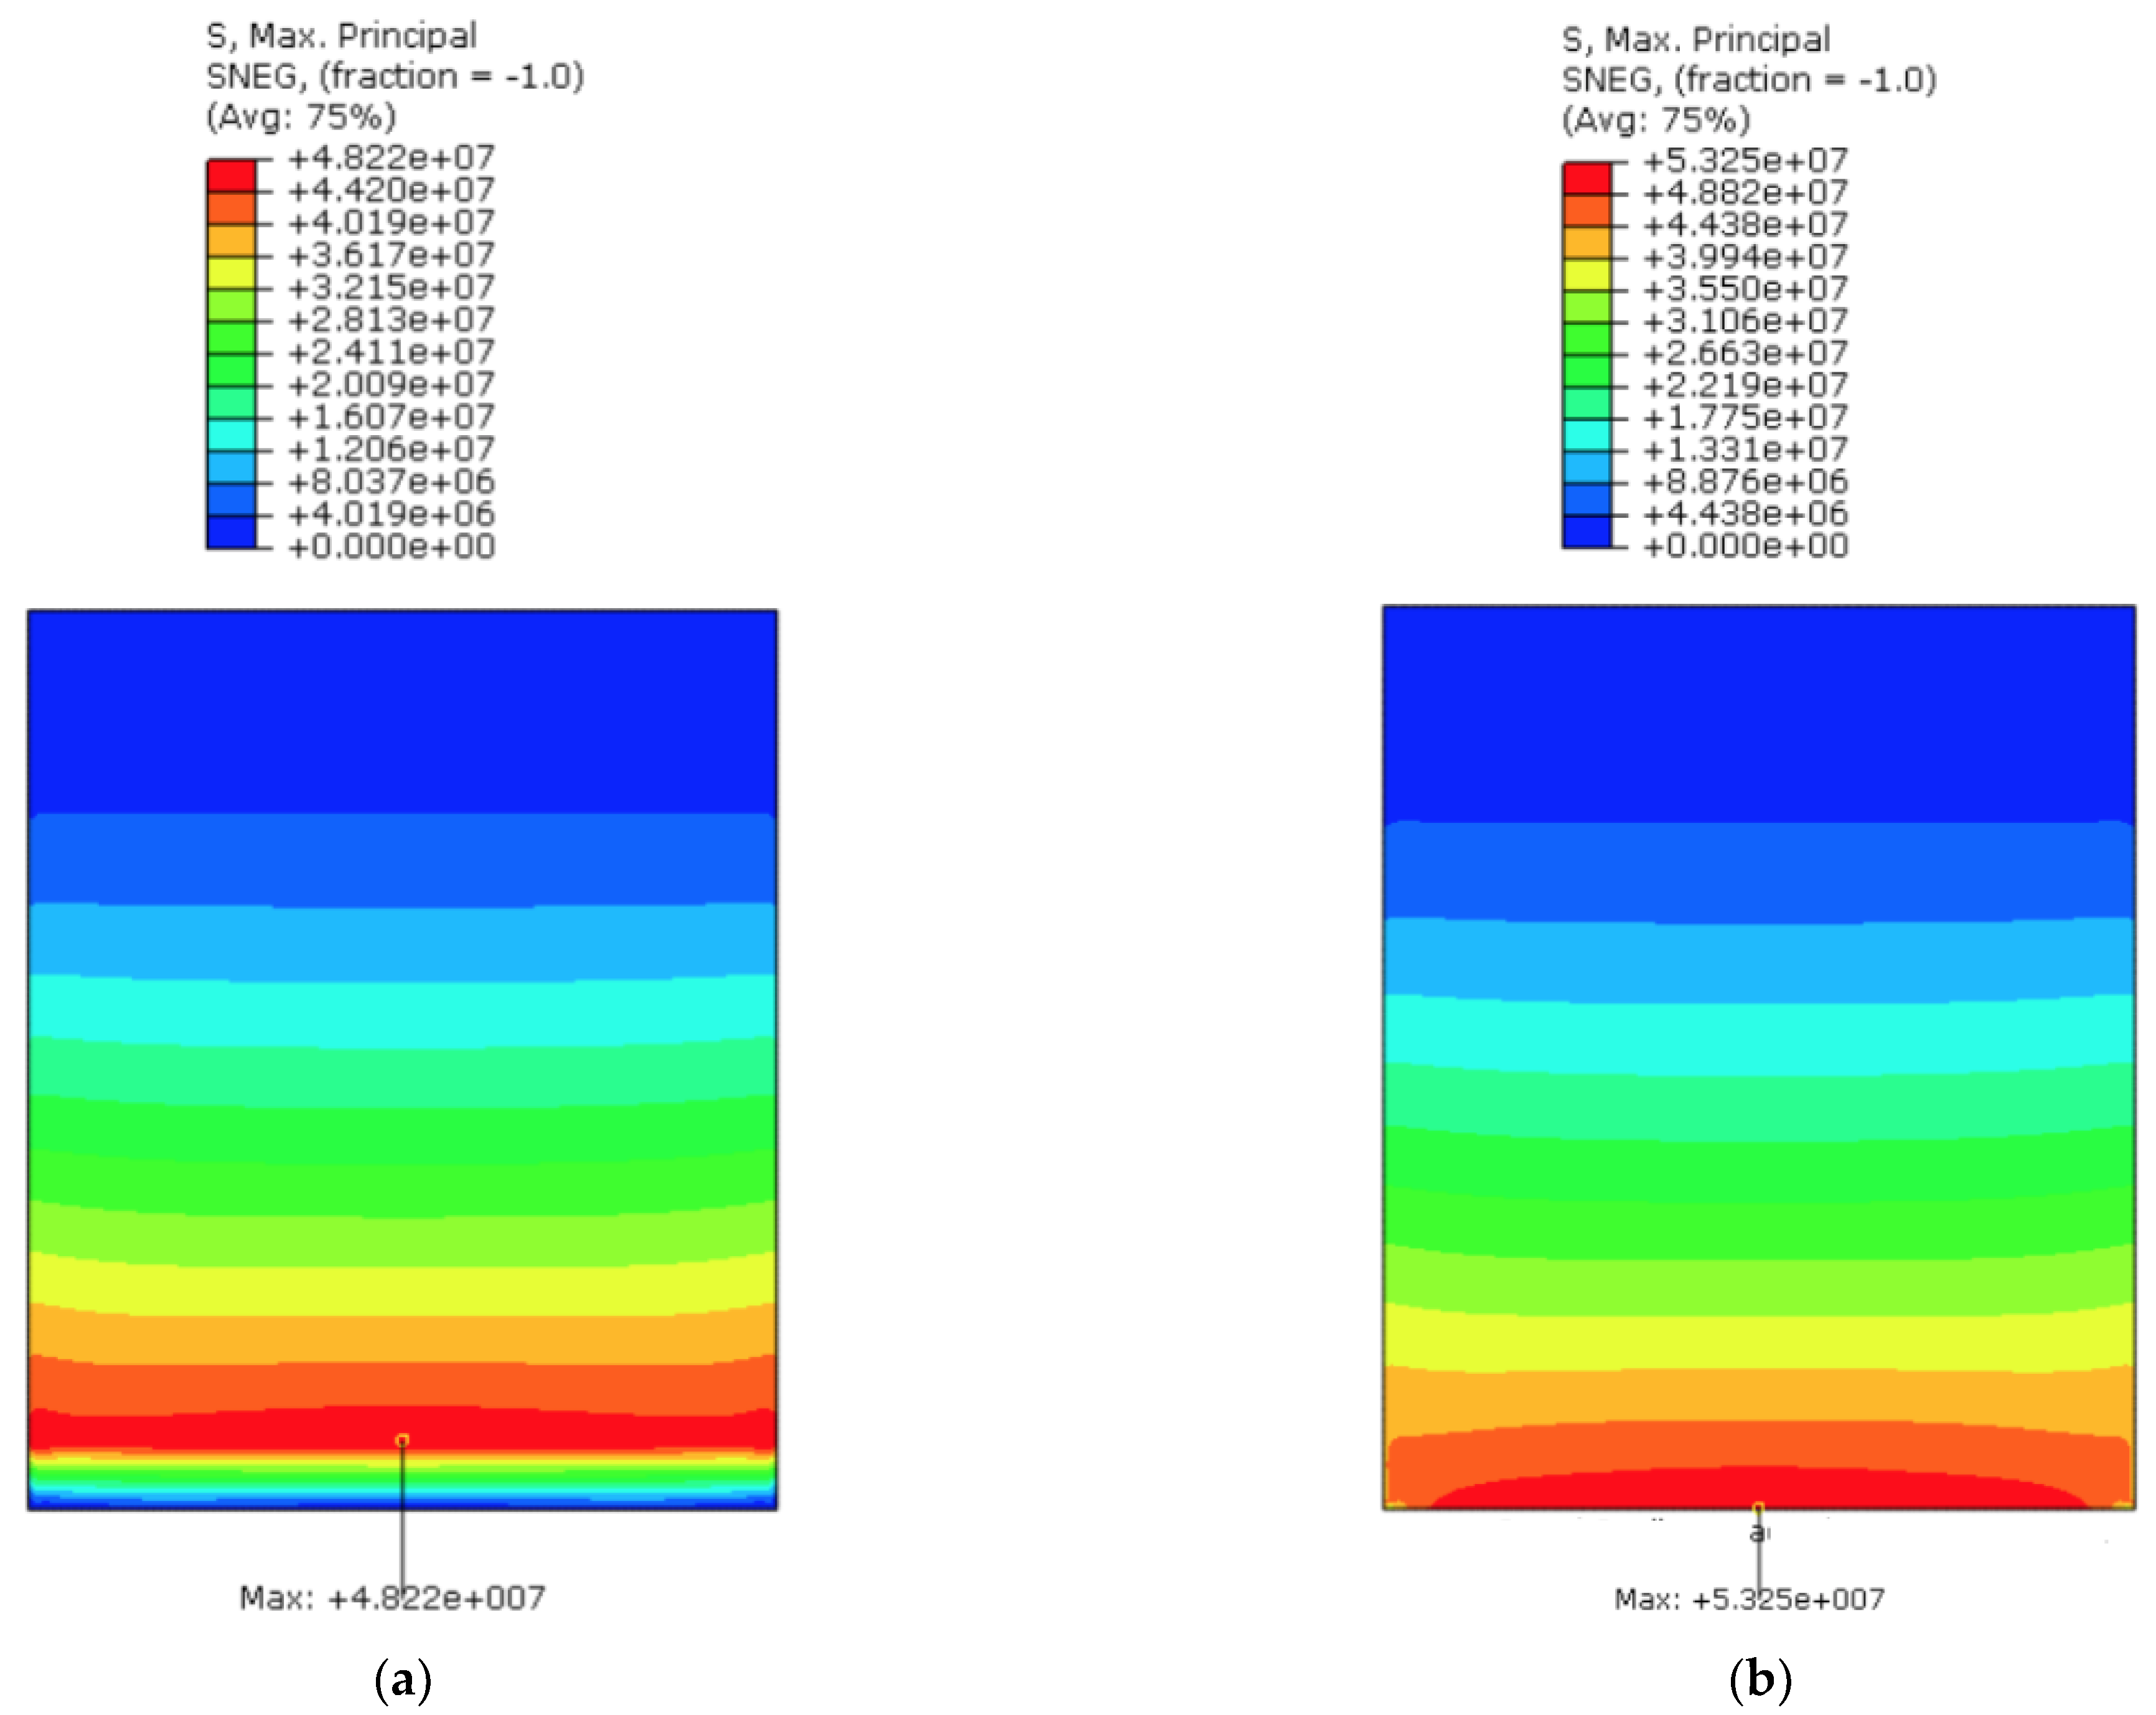
5.2. Effect of Linearly Distributed Equivalent Springs—SM3 and SM4

A conclusive assessment attempt is carried out by the derivation of linearly distributed equivalent springs in terms of translational (SM3) or rotational (SM4) terms, respectively. Such a procedure requires, from an analytical and numerical point of view, rather quick calibration steps and a rather fast computational time of analysis. From a practical point of view, this means that the SM2 simplified model (where the EET-based monolithic glass section is still taken into account for 2D shell elements) is further roughly simplified, in terms of boundaries, towards a calculation approach which agrees with Figure 2c,d. Actually, the equivalent springs of the SM2 approach are distributed in the width of the balustrade to create a bed of equivalent springs for the LG panel. Structurally speaking, the LG panel is thus analyzed in out-of-plane bending with a relatively flexible/partially rigid base restraint, but the SM3 and SM4 simplified procedures are weak in terms of precision for the localization and size of real fixing system components.
A direct effect of such a kind of modelling approach relies on the reliable analysis of intrinsic limits for these procedures, as it is clear that further major approximations are introduced to the original assembled system. Most importantly, this assumption suggests that the reference performance indicators for structural design (and, especially, the stress analysis in glass) should be examined at both the local and global levels.
In Figure 16, for example, a set of selected response parameters for the SM3 or SM4 balustrades under quasi-static load or soft-body impact is compared to the Refined model. It can be seen from Figure 16a—quasi-static load P = 4.5 kN—that both the SM3 (translational springs) and SM4 (rotational springs) models are globally characterized by high stiffness compared to the Refined model, even more than the previously investigated SM1 and SM2 models. Such a stiffening effect can be also noted in Figure 16b in terms of the percentage scatter trend calculated from Equation (32) for increasingly lateral load P amplitudes.
This observed numerical outcome suggests that the presence of discrete components and soft gaskets for typical restraints (as for most practical applications with glass) is clearly associated with local flexibility contributions and displacement accommodation capacities that hardly match with the linearized equivalent mechanical restraints. From Figure 16a,b, it is also possible to notice that the use of distributed rotational springs (SM4) is indeed less rigid than SM3 (translational springs). The two idealized SM3 and SM4 balustrade descriptions are thus not fully mechanically equivalent in terms of glass panel behaviour in out-of-plane bending.
As far as the dynamic response is analyzed, the SM3 and SM4 models with linearly distributed springs were again subjected to a double twin-tyre impact with an imposed drop height of 300 mm. Typical comparative results from the numerical analysis can be seen in Figure 16c, in terms of lateral displacements of glass, and in Figure 16d, in terms of impactor accelerations in time.
In this case, it is worth noting that a local analysis and comparison of the stress evolution in glass as a function of time (i.e., as for control points S1, S2) is not meaningful due to the strongly different loading condition for the examined systems. Such comparative evidence is clearly representative of a major intrinsic limit of both the SM3 and SM4 procedures, given that the estimated distribution of stresses in glass strongly differs from the original one. In other words, basic considerations in similar conditions could only be drawn in terms of displacement analysis, with rather weak numerical results for the stress verification of glass components.
Both the local and global stress analyses for these systems should be carefully explored, as they are representative of a key parameter for the overall design process. Evidence of these major limits of the SM3 and SM4 procedures can be noticed in Figure 17, where it is clear that the typical stress distribution is mostly different compared to that in Figure 15. Most importantly, the SM3 and SM4 stress peaks are observed to be misplaced. Additionally, they largely underestimate the stress estimates of the reference Refined model (−21.7% for SM3 and −13.6% for SM4). Further, no mechanical equivalence can be noted for the SM3 and SM4 approaches, and all these intrinsic limits may result in unsafe design choices.

6. Conclusions

The structural design of glass balustrades, as is known, requires basic knowledge on material and mechanical aspects. From a mechanical point of view, rather simple analytical considerations can be drawn, based, for example, on cantilever assumptions for rough stress analysis estimates. Most of the applications and calculations for linearly restrained glass balustrades are in fact carried out under the assumption of idealized mechanical model base-clamped glass plates subjected to the effects of a quasi-static top lateral load representative of crowd. However, compared to real restraints, the use of idealized or simplified mechanical models can result in misleading interpretations and predictions for glass verification purposes. Additionally, design protocols may also require the verification of structural capacity for these assembled systems under soft-body dynamic impact events.
In this paper, the attention was focused on a case-study system of the literature, consisting of a base-restrained laminated glass (LG) balustrade subjected to quasi-static lateral loads or double twin-tyre impact. As a reference, a full 3D solid brick “Refined” model has been developed to support the calibration and validation stages.
Four different simplified mechanical models (SM1 to SM4) have thus been developed and addressed based on the validation of past experimental data of the literature so as to assess the potential and limits in the use of equivalent discrete or distributed translational and/or rotational springs to restrain LG panels for similar load-bearing applications. The comparative numerical analysis reported in this paper, as expected, confirmed that both primary and secondary components and soft members of typical use in glass applications to create ad hoc restraints have a key role in preserving premature stress peaks and allow for the accommodation of possible local deformations under external design loads.
The use of equivalent springs to describe real restraints confirmed the high computational efficiency of simplified mechanical models compared to expensive full 3D solid brick assemblies or, even more so, compared to full-size experimental tests. In some cases, the local analysis of performance indicators gave a rather good correlation compared to a more refined numerical description of constituent components (as, for example, in the case of the SM1 and SM2 local stress peak estimates in glass and displacement predictions). On the other side, as was noted for the SM3 and SM4 simplified procedures, the use of mechanically equivalent, linearly distributed equivalent springs is not able to reproduce the effective mechanical features and behaviour of real assemblies and can thus result in misleading numerical performances and even unsafe stress estimates for glass verification, with potential risks for safety check purposes.

Author Contributions

Conceptualization, E.R., C.B. and C.A.; methodology, C.B. and C.A.; software, E.R. and C.B.; validation, E.R. and C.B.; formal analysis, E.R.; investigation, E.R. and C.B.; data curation, E.R.; writing—original draft preparation, E.R. and C.B.; supervision, C.B. and C.A.; project administration, C.B. All authors have read and agreed to the published version of the manuscript.

Funding

This research received no external funding.

Data Availability Statement

Data will be shared upon request.

Acknowledgments

M. Kozłowski (Silesian University of Technology, Poland) is acknowledged for sharing experimental data.

Conflicts of Interest

The authors declare no conflict of interest.

References

  1. Feldmann, M.; Kasper, R.; Abeln, B.; Cruz, P.; Belis, J.; Beyer, J. Guidance for European Structural Design of Glass Components—Support to the Implementation, Harmonization and Further Development of the Eurocodes; Report EUR 26439; Dimova, P., Feldmann, D., Eds.; Joint Research Centre–Institute for the Protection and Security of the Citizen: Ispra, Italy, 2014. [Google Scholar] [CrossRef]
  2. CNR-DT 210/2013; Istruzioni Per la Progettazione, L’esecuzione ed il Controllo di Costruzioni con Elementi Strutturali di Vetro. National Research Council of Italy (CNR): Roma, Italy, 2013; (In Italian–English Version Freely Available).
  3. Bedon, C.; Santarsiero, M. Transparency in Structural Glass Systems Via Mechanical, Adhesive, and Laminated Connections. Adv. Eng. Mater. 2018, 20, 1700815. [Google Scholar] [CrossRef]
  4. EN 12600:2002; Glass in Building. Pendulum Test. Impact Test Method and Classification for Flat Glass Method and Classification for Flat Glass. European Committee for Standardization: Brussels, Belgium, 2002.
  5. DIN 18008-4; Glass in Building—Design and Construction Rules—Part 4: Additional Requirements for Barrier Glazing. DIN: Berlin, Germany, 2013.
  6. Bedon, C.; Zhang, X.; Santos, F.; Honfi, D.; Kozłowski, M.; Arrigoni, M.; Figuli, L.; Lange, D. Performance of structural glass facades under extreme loads—Design methods, existing research, current issues and trends. Constr. Build. Mater. 2018, 163, 921–937. [Google Scholar] [CrossRef]
  7. Figuli, L.; Papan, D.; Papanova, Z.; Bedon, C. Experimental mechanical analysis of traditional in-service glass windows subjected to dynamic tests and hard body impact. Smart Struct. Syst. 2021, 27, 365. [Google Scholar]
  8. Bedon, C.; Santi, M.V. Vulnerability and Structural Capacity Assessment of Historic Glass Facades under Bird-Strike. Math. Probl. Eng. 2022, 2022, 6059466. [Google Scholar] [CrossRef]
  9. Kalamar, R.; Bedon, C.; Eliasova, M. Experimental investigation for the structural performance assessment of square hollow glass columns. Eng. Struct. 2016, 113, 1–15. [Google Scholar] [CrossRef]
  10. Bedon, C.; Kalamar, R.; Eliasova, M. Low velocity impact performance investigation on square hollow glass columns via full-scale experiments and Finite Element analyses. Compos. Struct. 2017, 182, 311–325. [Google Scholar] [CrossRef]
  11. Fröling, M.; Persson, K.; Austrell, P.-E. A reduced model for the design of glass structures subjected to dynamic impulse load. Eng. Struct. 2014, 80, 53–60. [Google Scholar] [CrossRef]
  12. Andersson, L.; Kozłowski, M.; Persson, P.; Austrell, P.-E.; Persson, K. Reduced order modeling of soft-body impact on glass panels. Eng. Struct. 2022, 256, 113988. [Google Scholar] [CrossRef]
  13. Bez, A.; Bedon, C.; Manara, G.; Amadio, C.; Lori, G. Calibrated Numerical Approach for the Dynamic Analysis of Glass Curtain Walls under Spheroconical Bag Impact. Buildings 2021, 11, 154. [Google Scholar] [CrossRef]
  14. Schneider, J.; Schula, S. Simulating soft body impact on glass structures. Proc. Inst. Civ. Eng. Struct. Build. 2016, 169, 416–431. [Google Scholar] [CrossRef]
  15. Baidjoe, Y.; Van Lancker, B.; Belis, J. Calculation methods of glass parapets in aluminum clamping profiles. Glass Struct. Eng. 2018, 3, 321–334. [Google Scholar] [CrossRef] [Green Version]
  16. Biolzi, L.; Bonati, A.; Cattaneo, S. Laminated Glass Cantilevered Plates under Static and Impact Loading. Adv. Civil. Eng. 2018, 2018, 7874618. [Google Scholar] [CrossRef] [Green Version]
  17. Kozłowski, M. Experimental and numerical assessment of structural behaviour of glass balustrade subjected to soft body impact. Compos. Struct. 2019, 229, 111380. [Google Scholar] [CrossRef]
  18. Bedon, C.; Fasan, M.; Amadio, C. Vibration Analysis and Dynamic Characterization of Structural Glass Elements with Different Restraints Based on Operational Modal Analysis. Buildings 2019, 9, 13. [Google Scholar] [CrossRef] [Green Version]
  19. Portal, N.W.; Flansbjer, M.; Honfi, D.; Kozłowski, M. The dynamic structural response of a laminated glass balustrade analysed with optical measurements. Ce/papers, Special Issue: Engineered Transparency 2021: Glass in Architecture and Structural Engineering. Glass Struct. Des. 2021, 4, 251–261. [Google Scholar] [CrossRef]
  20. Galuppi, L.; Royer-Carfagni, G. Effective thickness of laminated glass beams: New expression via a variational approach. Eng. Struct. 2012, 38, 53–67. [Google Scholar] [CrossRef]
  21. Simulia. ABAQUS Computer Software, Dassault Systémes: Providence, RI, USA, 2021.
Figure 1. Examples of glass balustrades characterized by various restraint conditions: (a) linear restraint at the base; (b) point-fixing at the base; (c) top-bottom point-fixings; (d) lateral point-fixing. Solutions (a,b) do not require glass drilling; (c,d) are characterized by the presence of glass holes.
Buildings 12 01664 g001
Figure 2. Schematic representation of possible mechanical models for a glass balustrade with a linear restraint at its base: (a) example of a metal restraint (cross-section); (b) cantilever mechanical model with an ideally rigid clamp restraint; or (c,d) mechanical models inclusive of equivalent springs to reproduce the real boundaries.
Buildings 12 01664 g002
Figure 3. Example of full 3D FE numerical model of a laminated glass balustrade a with linear base metal restraint (ABAQUS): (a) axonometric view of the half balustrade assembly and (b) detailed view of the base restraint region, with (c) a cross-section of the metal fixing system (glass panel and mesh pattern hidden from section view).
Buildings 12 01664 g003
Figure 4. (a) Experimental setup (based on [17]), with dimensions in mm, and (bd) detailed views of the presently developed “Refined” FE numerical model (ABAQUS).
Buildings 12 01664 g004
Figure 5. Example of deformation and parameters for the base restraints under lateral loads, as obtained from the Refined FE numerical model (ABAQUS): (a) out-of-plane and (b) vertical deformations (glass panel and mesh hidden from view, legend values in m).
Buildings 12 01664 g005
Figure 6. Numerical analysis of the Refined model (ABAQUS) under double twin-tyre impact (300 mm being the drop height), and comparison with the experimental results: (a) lateral displacement; (b) principal stress, and (c) acceleration time histories.
Buildings 12 01664 g006
Figure 7. SM1 simplified model: (a) model concept and 3D assembly (axonometric view from ABAQUS), with (b) the reference mechanical system (cross-section) and evidence of lumped equivalent springs.
Buildings 12 01664 g007
Figure 8. SM1 simplified numerical model: details of sub-schemes SS1 and SS2, and simplified local mechanical models to calculate the stiffness of steel lateral plates and the steel base flange for the LG balustrade in bending.
Buildings 12 01664 g008
Figure 9. Simplified numerical model SM1, with evidence of the local analysis of lateral deflections measured in steel plates (1) and (2). Comparative calculations for the assessment of simplified empirical formulations in use for sub-scheme SS1 (ABAQUS). Legend values in m (out-of-scale deformed shapes).
Buildings 12 01664 g009
Figure 10. Axonometric view of the SM2 simplified model under the double twin-tyre setup (ABAQUS).
Buildings 12 01664 g010
Figure 11. Derivation of equivalent stiffness parameters, as for the SM2 simplified model: (a) required translational stiffness, with (b) equivalent rotational and (c) translational terms.
Buildings 12 01664 g011
Figure 12. Front and axonometric views of (a) SM3 and (b) SM4 models under double twin-tyre impact (ABAQUS).
Buildings 12 01664 g012
Figure 13. Numerical analysis of Refined, SM1, and SM2 simplified models under quasi-static lateral load (P = 4.5 kN/m) at the top edge of glass (ABAQUS): (a) top lateral displacement and (b) calculated percentage scatter of SM to Refined models (Equation (32)).
Buildings 12 01664 g013
Figure 14. Numerical analysis of Refined, SM1, and SM2 simplified models (ABAQUS) under double twin-tyre impact (300 mm being the drop height): (a) lateral displacement; (b) maximum principal stress in glass (dashed lines for compression side), and (c) acceleration time histories.
Buildings 12 01664 g014
Figure 15. Numerical analysis of principal stress distribution and peaks in glass for the (a) Refined model, (b) SM1 simplified model, and (c) SM2 simplified model (ABAQUS) under double twin-tyre impact (300 mm being the drop height), with legend values in Pa.
Buildings 12 01664 g015
Figure 16. Numerical analysis of the Refined model, SM3 (translational springs) simplified model, and SM4 (rotational springs) simplified model (ABAQUS): (a) top lateral displacement under quasi-static load (P = 4.5 kN/m) at the top edge of glass and (b) calculated percentage scatter of SM to Refined models (Equation (32)), with (c,d) response analysis under double twin tyre impact (300 mm being the drop height).
Buildings 12 01664 g016
Figure 17. Numerical analysis of the principal stress distribution and peaks in glass for the (a) SM3 (translational springs) and (b) SM4 (rotational springs) simplified models (ABAQUS) under double twin-tyre impact (300 mm being the drop height), with legend values in Pa.
Buildings 12 01664 g017
Table 1. Summary of presently developed numerical models for the analysis of the glass balustrade system described in Figure 4.
FE Model Features
FE Numerical ModelLG Cross-Section
(mm)
LG PanelBase Restraint
Refined10 + 1.52 PVB + 10Full 3D solid brick elements
(layered section)
Full 3D solid brick elements
SM1Same as that of RefinedLumped equivalent springs
in the region of restraints
SM22D shell elements
(equivalent monolithic
glass section)
Lumped equivalent springs
in the region of restraints
SM3Same as that of SM2Linearly distributed equivalent springs (translational)
at the bottom edge of the glass
SM4Same as that of SM2Linearly distributed equivalent springs (rotational)
at the bottom edge of the glass
Table 2. Summary of the mechanical properties for materials in use in the Refined numerical model.
Material Properties
MaterialConstitutive ModelModulus of Elasticity
[N/mm2]
Poisson RatioDensity
[kg/m3]
SteelLinear elastic210,0000.37850
POMLinear elastic24130.451250
GlassLinear elastic70,0000.232500
PVBLinear elastic1800.4851250
Table 3. Summary of comparative results in terms of impactor acceleration for the present Refined numerical model and past experiments with a double twin-tyre.
Refined Model
Drop Height
[mm]
amax,test [17]
[m/s2]
amax,model [17]
[m/s2]
amax,Refined
[m/s2]
1
[%]
2
[%]
300223216216.38−2.970.18
400282272269.17−4.55−1.04
500332334345.364.023.40
Table 4. Summary of the computational cost of the Refined and SM1-to-SM4 simplified numerical models (ABAQUS) in terms of the total number of elements and DOFs required to reproduce the nominal geometry of the examined balustrade.
FE Model Features
FE Numerical ModelNumber of ElementsNumber of DOFs
Refined≈120,000≈505,000
SM1≈76,000≈214,000
SM2≈12,000≈73,000
SM3 and SM4≈12,000≈73,000
Publisher’s Note: MDPI stays neutral with regard to jurisdictional claims in published maps and institutional affiliations.

