Article

Analyzing the Time-Varying Thermal Perception of Students in Classrooms and Its Influencing Factors from a Case Study in Xi’an, China

1
School of Management, Xi’an University of Architecture and Technology, Xi’an 710055, China
2
Key Research Base of Co-Construction & Sharing for Human Settlement & Good Life in New Era, Xi’an 710055, China
3
Energy Research Centre of Green Campus, Xi’an 710055, China
4
State Key Laboratory of Green Building in Western China, Xi’an 710055, China
5
School of Building Services Science and Engineering, Xi’an University of Architecture and Technology, Xi’an 710055, China
*
Author to whom correspondence should be addressed.
Buildings 2022, 12(1), 75; https://doi.org/10.3390/buildings12010075
Submission received: 8 December 2021 / Revised: 10 January 2022 / Accepted: 11 January 2022 / Published: 13 January 2022
(This article belongs to the Special Issue Learning Environment Design and Use)

Abstract

:
Owing to movement in the spatial environment and changes in activity levels, students’ thermal perception is time varying in classrooms throughout different periods of the day. However, previous studies have rarely considered the time-varying thermal perception in different periods of the day, which may cause discomfort for students and lead to energy wastage. Therefore, a study was conducted to investigate the time-varying thermal perception of students and its influencing factors in different classes of the day. In addition, the differences in students’ adaptive behaviors in different periods were also explored. A total of 578 university students were surveyed using questionnaire surveys during the heating season in Xi’an, China. The following results can be obtained: (1) The thermal sensation vote and thermal preference vote values in the afternoon were significantly higher than those in the morning. At the start of the first class in the morning/afternoon, the thermal sensation of the students had the highest sensitivity to outdoor temperature changes. (2) The students’ thermal perception was greatly affected by the preclass activity state at the start of the first class in the morning/afternoon. However, in other periods, the above phenomenon was not obvious. (3) In the afternoon, the frequency of clothing adjustment was greater than that in the morning, and this behavior would significantly affect the students’ thermal sensation. (4) Compared with the current classroom heating strategy, the heating strategy of dynamically adjusting the indoor set temperature according to the time-varying characteristics of the students can theoretically achieve energy savings of 25.6%.

1. Introduction

Several studies have indicated that the thermal environment of the classroom has an important impact on the health and productivity of students [1]. Moreover, appropriate thermal environment design parameters can help to reduce building energy consumption [2,3]. Therefore, it is important to create a comfortable classroom thermal environment. University students frequently move between different spaces in teaching buildings to attend different classes, and usually spend less than 2 to 3 hours a day in a classroom [4]; thus, the thermal environment experienced by university students is constantly changing [5]. Therefore, the thermal perception (i.e., thermal sensation, thermal preference, and thermal comfort) of students at different periods of the day may have time-varying characteristics. Although existing standards, such as ISO 7730 [6], EN15251 [7], and ASHRAE Standard 55 [8], provide indoor thermal comfort guidelines, the different thermal comfort requirements of university students at different times of the day are ignored [5,9,10]. Thus, students’ thermal perceptions in the classroom cannot be accurately reflected in the relevant standards. Therefore, it is necessary to explore the characteristics of students’ thermal sensation changes in different periods of the day.
Identifying the factors that affect the thermal perception of students will help us to better understand the response of students to the classroom’s thermal environment. When university students enter a new classroom, their thermal perception is affected not only by the current thermal environment but also by the thermal environment they experienced last time [4,5]. Owing to the influence of course timetable, students experience different thermal environments and activity levels before class at different times of the day. Therefore, the factors that affect the thermal perception of students may change at different periods of the day. At a certain period, students will feel uncomfortable when there are more negative factors. In order to achieve a good comfort level in different periods, students often adopt adaptive behaviors. However, during class, students’ thermal adaptive behaviors are restricted to a certain extent. Previous studies have shown that personal behavior (e.g., adjusting clothing) is the most common adaptive action among students in both uncomfortably warm and cold conditions [11]. Owing to the fact that students’ thermal perception changes in different classes of the day, the probability of students’ thermal adaptive behaviors may change. Exploring the differences in the influencing factors of the thermal perception and thermal adaptation behavior of students in different periods will help to develop strategies for improving the thermal comfort level.
Owing to the extreme climate conditions and large indoor and outdoor temperature differences, the challenge of achieving thermal comfort in the classroom is intensified during the heating season in cold regions [12]. The heating season usually lasts from late autumn to early spring in northern China. The majority of heating systems in cold regions of China use coal as fuel, resulting in high building energy consumption and severe air pollution [13,14,15,16]. Because inappropriate heating temperatures will reduce occupant comfort and even increase carbon dioxide emissions [17,18,19,20], investigating the time-varying thermal perception of university students during the heating season and identifying the factors that affect the thermal perception of students may also help to reduce building energy consumption and environmental pollution.

1.1. Literature Review

In recent years, a large amount of research has been published that deals with the thermal comfort of students in classrooms based on field surveys [21,22,23]. The functional requirements of the classroom vary with student density in the classroom, indoor environment control, clothing choices, activity, and use of the Internet and communication technology [24]. Therefore, separate guidelines or standards for students of different age groups at different stages of their education are necessary [24]. Although thermal comfort field studies in university classrooms were conducted later than in primary and secondary schools, there has been an increase in studies in university classrooms in the past two decades [4]. Singh et al. [24] summarized research articles on thermal comfort in classrooms over the last 50 years. It was observed that university students were in a transient condition for about 20–30% of the class time (if a class has a duration of 1 h), and the memory of the previous environment significantly affected their thermal perception in classrooms. In the heating season, especially in cold regions, the temperature difference between indoors and outdoors is large. When students experience an outdoor–indoor transition, the thermal perception will change significantly, especially when entering a classroom with heating on from the outdoors [25,26]. Because setting a proper indoor temperature based on students’ actual thermal perception will help to save energy, Jing et al. [2] investigated the thermal comfort state of students in university classrooms during the heating season in Taiyuan, China, and found that the indoor temperature lower limit for 80% acceptability is 19 °C. If the indoor design temperature decreases from 21.85 °C (determined by the heating load duration curve) to 19 °C, 3.46% of the annual heating load can be saved. Therefore, it is important to study students’ actual thermal perception in a university classroom during the heating season.
There are many factors that affect students’ thermal perception in the classroom, including the outdoor environment, indoor environment, and personal characteristics. The existing literature primarily focuses on the thermal perception of students and their influencing factors in different climate zones and room operating modes. Zomorodian et al. [4] observed that most studies were conducted in temperate/mesothermal climates (e.g., the UK, USA, and China). Differences in students’ thermal comfort levels have been evaluated in classrooms with different heating systems [27,28,29] and ventilation strategies [30,31,32,33]. In most studies, it was proven that indoor temperature, relative humidity, air velocity, outdoor temperature, and solar radiation have significant effects on the thermal perception of students. Moreover, gender, height, weight, activity level, clothing level, and so forth also affected the thermal perception of students. For example, Song et al. [34] suggested that an increase in air velocity is an essential phenomenon in obtaining a thermal comfort environment. Song et al. [35] observed that heated clothing could serve as an effective method to improve both the local and whole-body thermal comfort of university students while sitting in cold classrooms. In addition, Jowkar et al. [11] observed significant differences in the comfort temperature of students in various classroom types in the UK. Moreover, they explored how climatic background or long-term thermal history influences individuals’ in-the-moment thermal comfort experiences [36]. Mishra et al. [5] observed that mode of travel, point of departure, prior food/beverage consumption, and medical aid are likely to have an effect on occupant thermal sensation.
The above studies mostly focused on the thermal perception of students in university classrooms in different regions. However, the thermal perception of students at different time periods has not been studied in depth. Moreover, there are few studies on the differences in thermal perception influencing factors at different times. Ning et al. [37] conducted a field survey on students’ thermal comfort from late autumn to early spring, covering the entire space heating period in Harbin, China. Cao et al. [38] conducted a field survey on students’ thermal comfort and thermal adaptability during summer and winter in Beijing. However, there are few studies on the changes in students’ thermal perception during class in a day. In universities, it is common for students to enter and leave different classrooms for different classes [39]. When entering the classroom, the memory of the previous environment will significantly affect the thermal comfort and preferences of the students [24], and student thermal perceptions change significantly as the class progresses [5]. Therefore, it is necessary to study the thermal comfort of students in university classrooms and the factors that influence it during class hours in the heating season.

1.2. Research Objectives

The thermal perception of students in the steady-state environment of university classrooms in different geographic regions has been extensively studied. However, there are few studies on the time-varying characteristics of students’ thermal perception and its influencing factors in university classrooms in the heating season. At different periods of the day, students often move in and out of different spaces, and the thermal environment they experience constantly changes. In addition, due to the influence of the course timetable, the intensity of students’ activities in a day varies from time to time. In this case, how does a student’s thermal perception change? Are there significant differences in the factors that affect students’ thermal perceptions? These questions remain to be answered.
This study aims to explore the changes in the thermal perception of students in different classes over the course of a day to provide evidence for design strategies so as to improve the indoor thermal environment. In Xi’an University of Architecture and Technology, objective measurements and subjective surveys were conducted to obtain indoor and outdoor environmental parameters, students’ personal characteristics, and thermal perception votes. The thermal perception of students in the classroom during class time and its influencing factors were analyzed based on the acquired data. The three objectives of this study are as follows:
  • Clarifying the changes in the indoor thermal environment of university classrooms and the thermal perception of students in different classes over the course of a day during the heating period;
  • Exploring the differences in the factors affecting the thermal perception of students in different classes over the course of a day;
  • Analyzing the differences in students’ adaptive behaviors to maintain a comfortable thermal state in different classes over the course of a day.
The remainder of this paper is organized as follows. Section 2 describes the related research methods. Section 3 provides the survey results with regard to demographic conditions, indoor and outdoor thermal environment conditions, students’ thermal perception development, factors influencing thermal perception, and students’ adaptive behaviors. Finally, the conclusions are presented in Section 4.

2. Methods

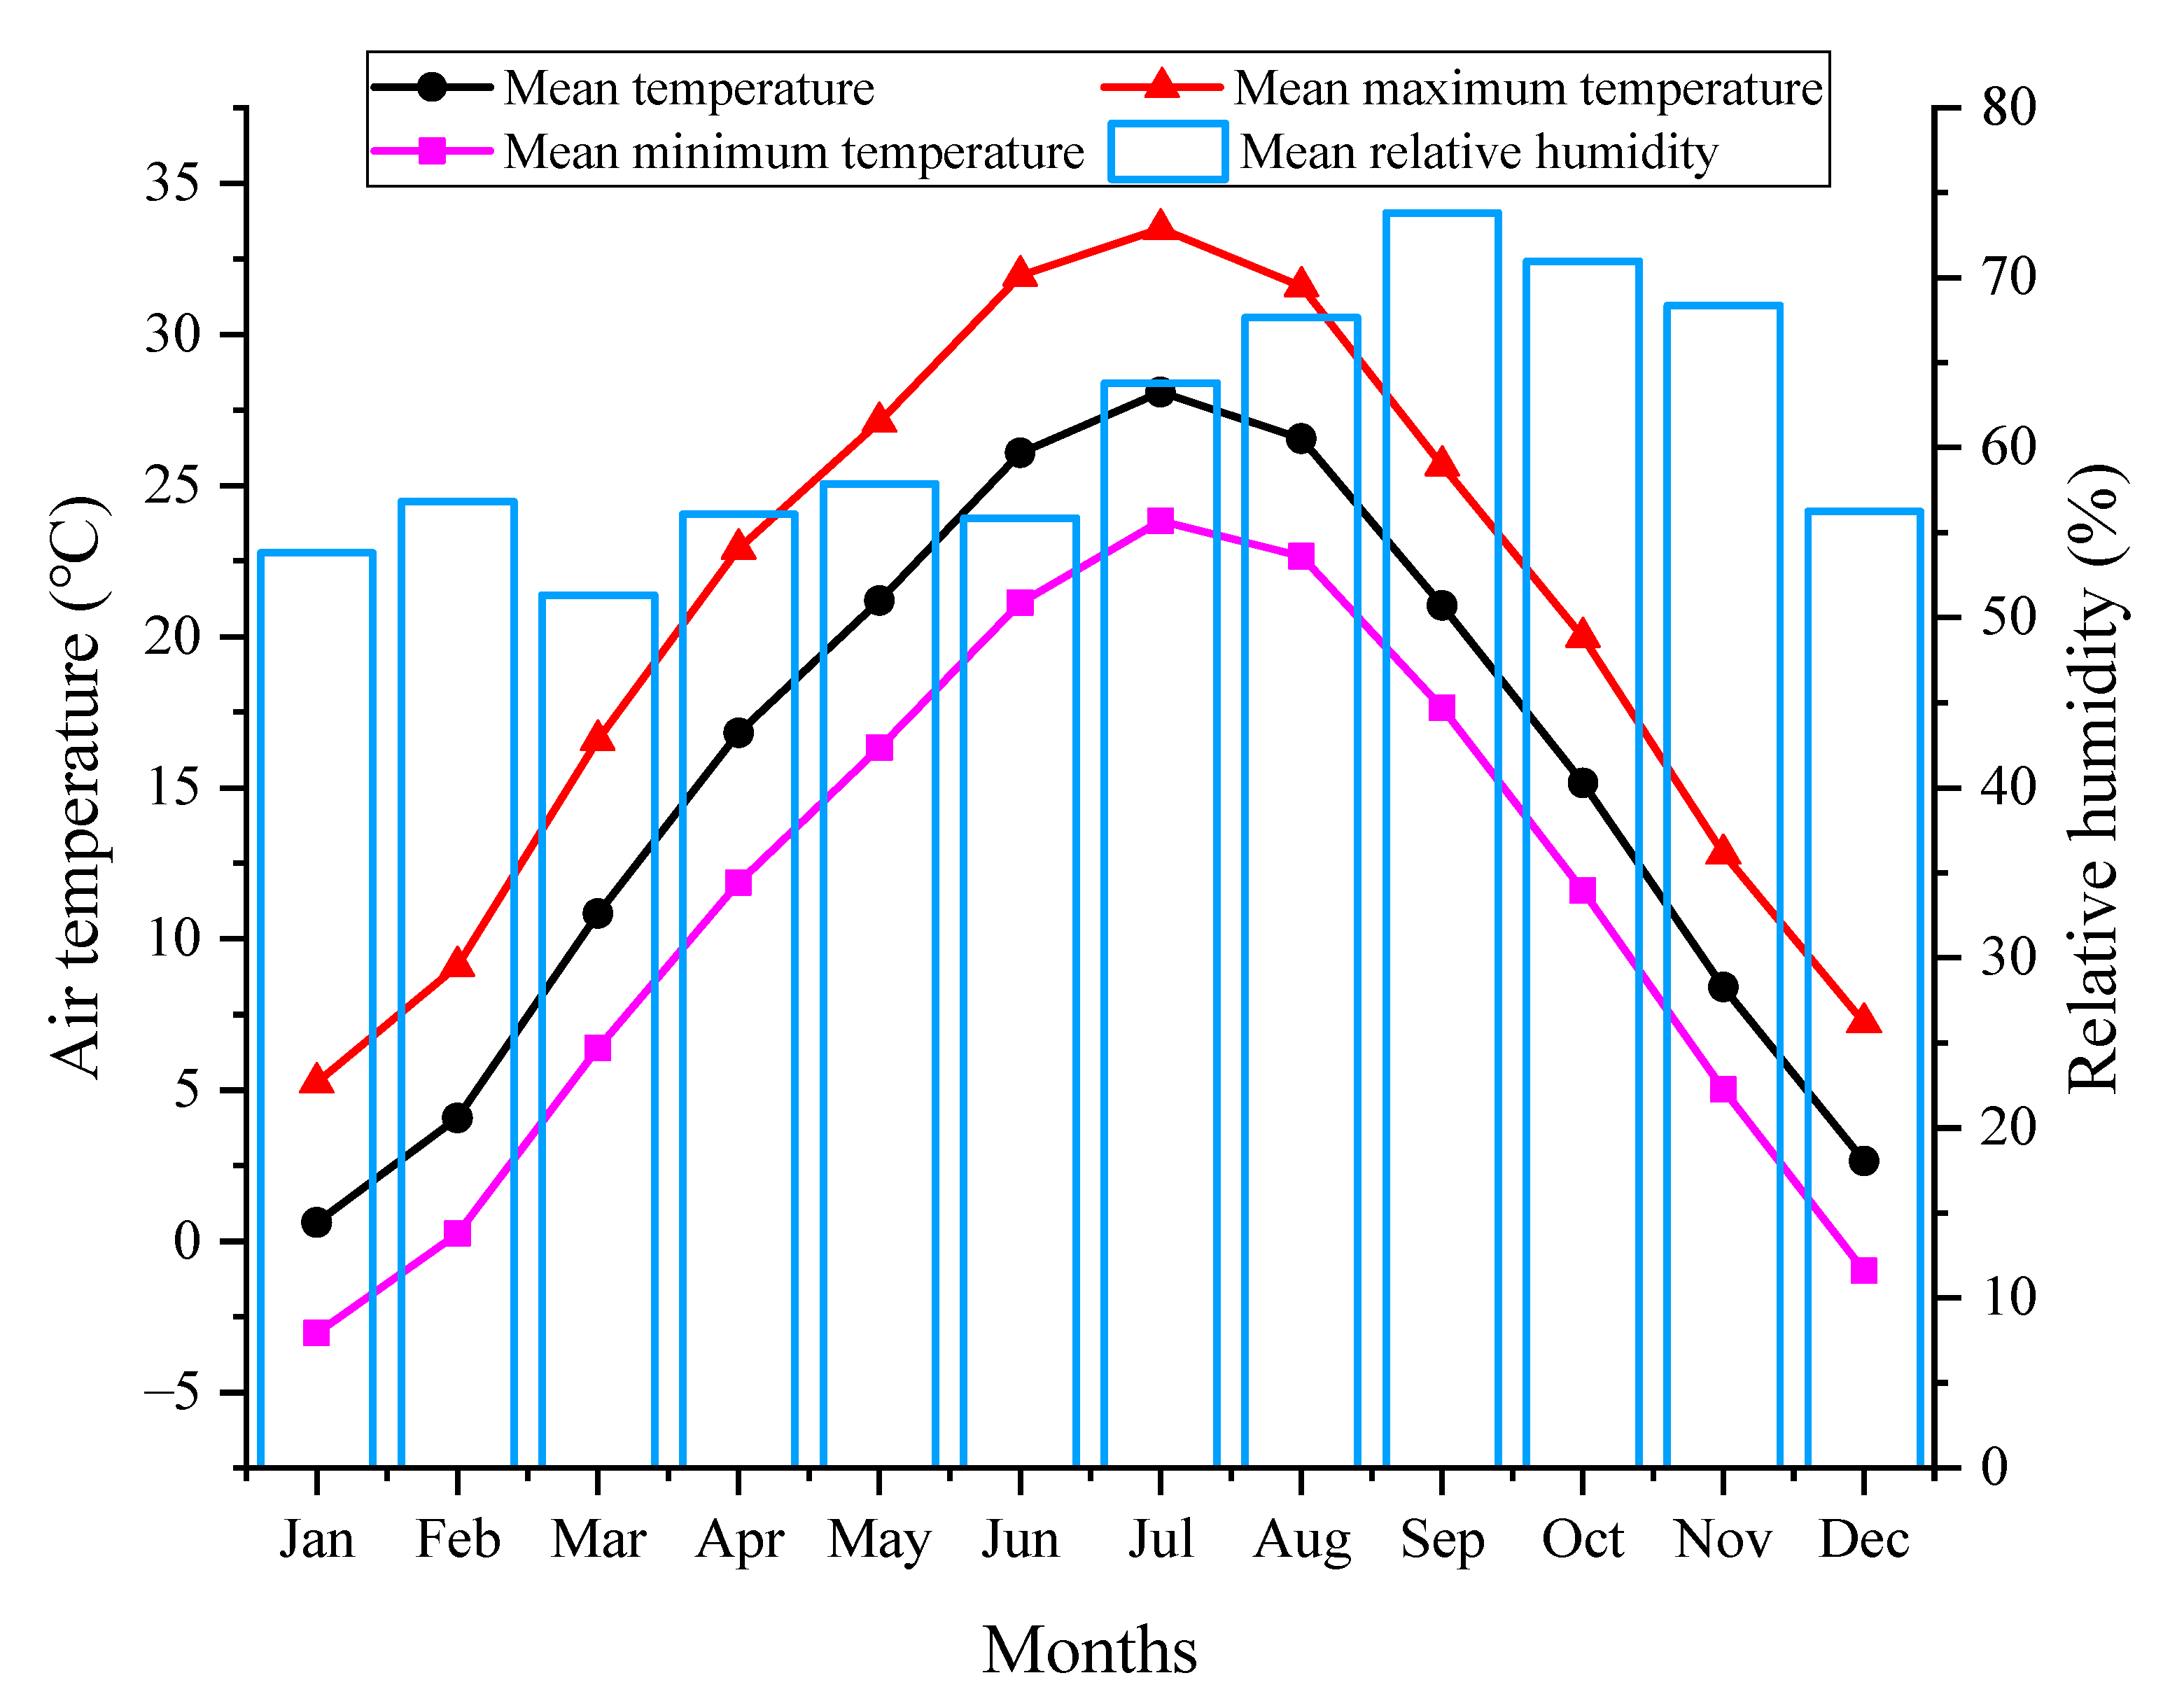
2.1. Location and Climate

Xi’an City is located in the western region of China, between 33°42′ and 34°45′ N and 107°40′ and 109°49′ E. According to the “Code for Thermal Design of Civil Buildings” (GB50176-2016), there are five climate zones in China, and Xi’an belongs to the cold climate zone [40]. The outdoor temperature in Xi’an varies from −3.0 to 33.5 °C throughout the year, with the highest monthly average temperature in July (28.1 °C) and the lowest monthly average temperature in January (0.6 °C) (Figure 1). The monthly average outdoor relative humidity ranges between 51% and 74%. The heating season of Xi’an begins in mid-November and continues until mid-March of the following year. Our survey was conducted on the Caotang campus of Xi’an University of Architecture and Technology, where the outdoor temperature in the heating season is lower than that in the urban area of Xi’an.

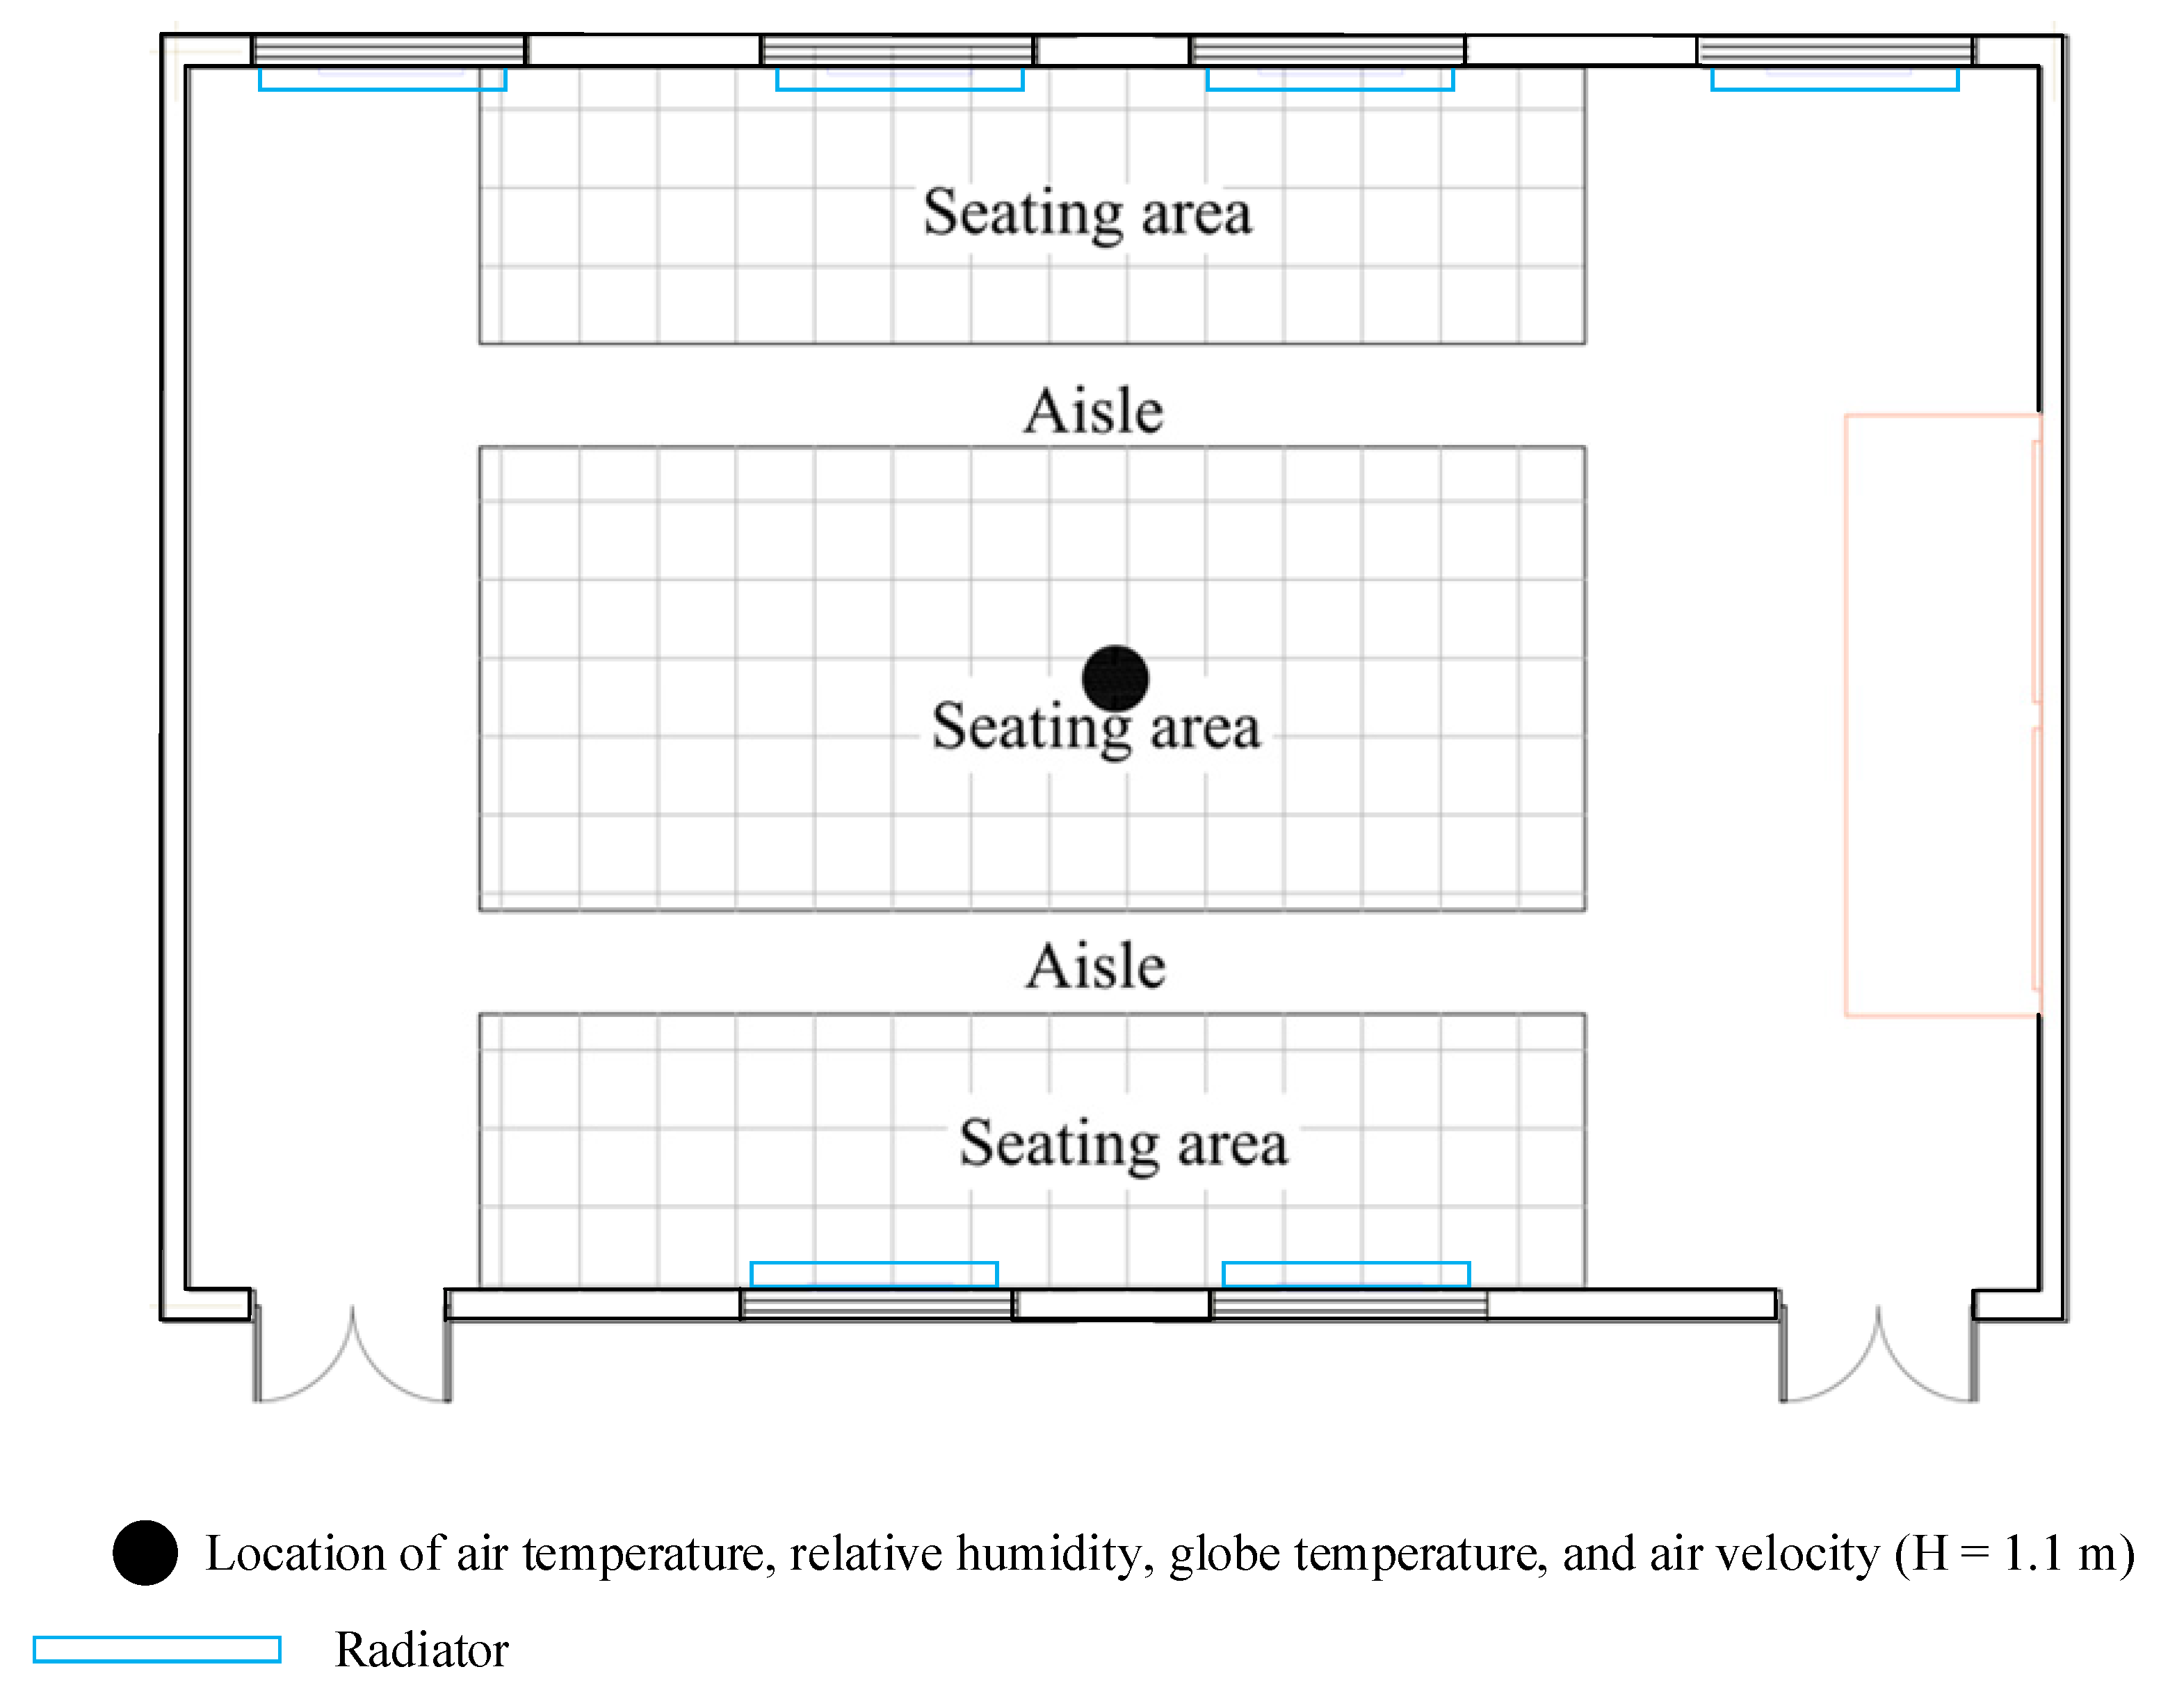
2.2. Classroom Information

In this study, one typical classroom was selected. The design and layout of the classroom in this study are similar to those of classrooms in most universities in China. The classroom (14.4 × 9.6 × 4.5 m, l × w × h) (Figure 2a) is located on the first floor of the teaching building, and the adjacent classroom has the same geometric structure as the classroom. The building thermal properties of the classroom comply with the design standard for the energy efficiency of public buildings in China, GB50189-2015 [42]. The classroom has a construction area of 138.24 m2 and can accommodate 140 students. There are six windows of the same size (2.1 × 2.6 m, l × h) in the classroom, each with a blinding curtain that students can control. Six radiators are located under the window (Figure 2b). The heating period is from mid-November to mid-March of the following year.

2.3. Physical Measurement

To measure the indoor thermal environment, temperature and humidity sensors, anemometers, black-ball thermometers, and carbon dioxide (CO2) analyzers were placed in the middle of the classroom (Figure 3) at a height of 1.1 m from the floor. The indoor environmental parameters measured in this study included air temperature (Ta, °C), relative humidity (RH, %), air velocity (Va, m/s), black bulb temperature (Tg, °C), and carbon dioxide concentration (CO2, ppm). Detailed information on the measuring equipment is shown in Table 1. Because the classroom is located on the first floor and the windows are often blocked by curtains in the heating season, it is difficult for sunlight to enter the classroom. Therefore, solar radiation was not measured in this study. Referring to Jiang et al. [1], this study used the black bulb temperature and indoor air velocity data to calculate the average radiant temperature. The parameters of the measuring equipment met the accuracy range required by the ISO 7726 standard [43]. The indoor thermal environment was measured on the day the questionnaire was issued. The measurement time was from 08:30 to 17:20 h, and the data were automatically recorded every 10 min.
The outdoor environmental parameters measured in this study included the outdoor air temperature (Tout, °C) and relative humidity (RHout, %). Referring to the study of Mishra et al. [5] and Jiang et al. [12], the temperature and humidity sensors (Table 1) were installed on the roof of the teaching building. The measurement time was from 00:00 to 23:00 h every day, and the data were automatically recorded every 10 min.

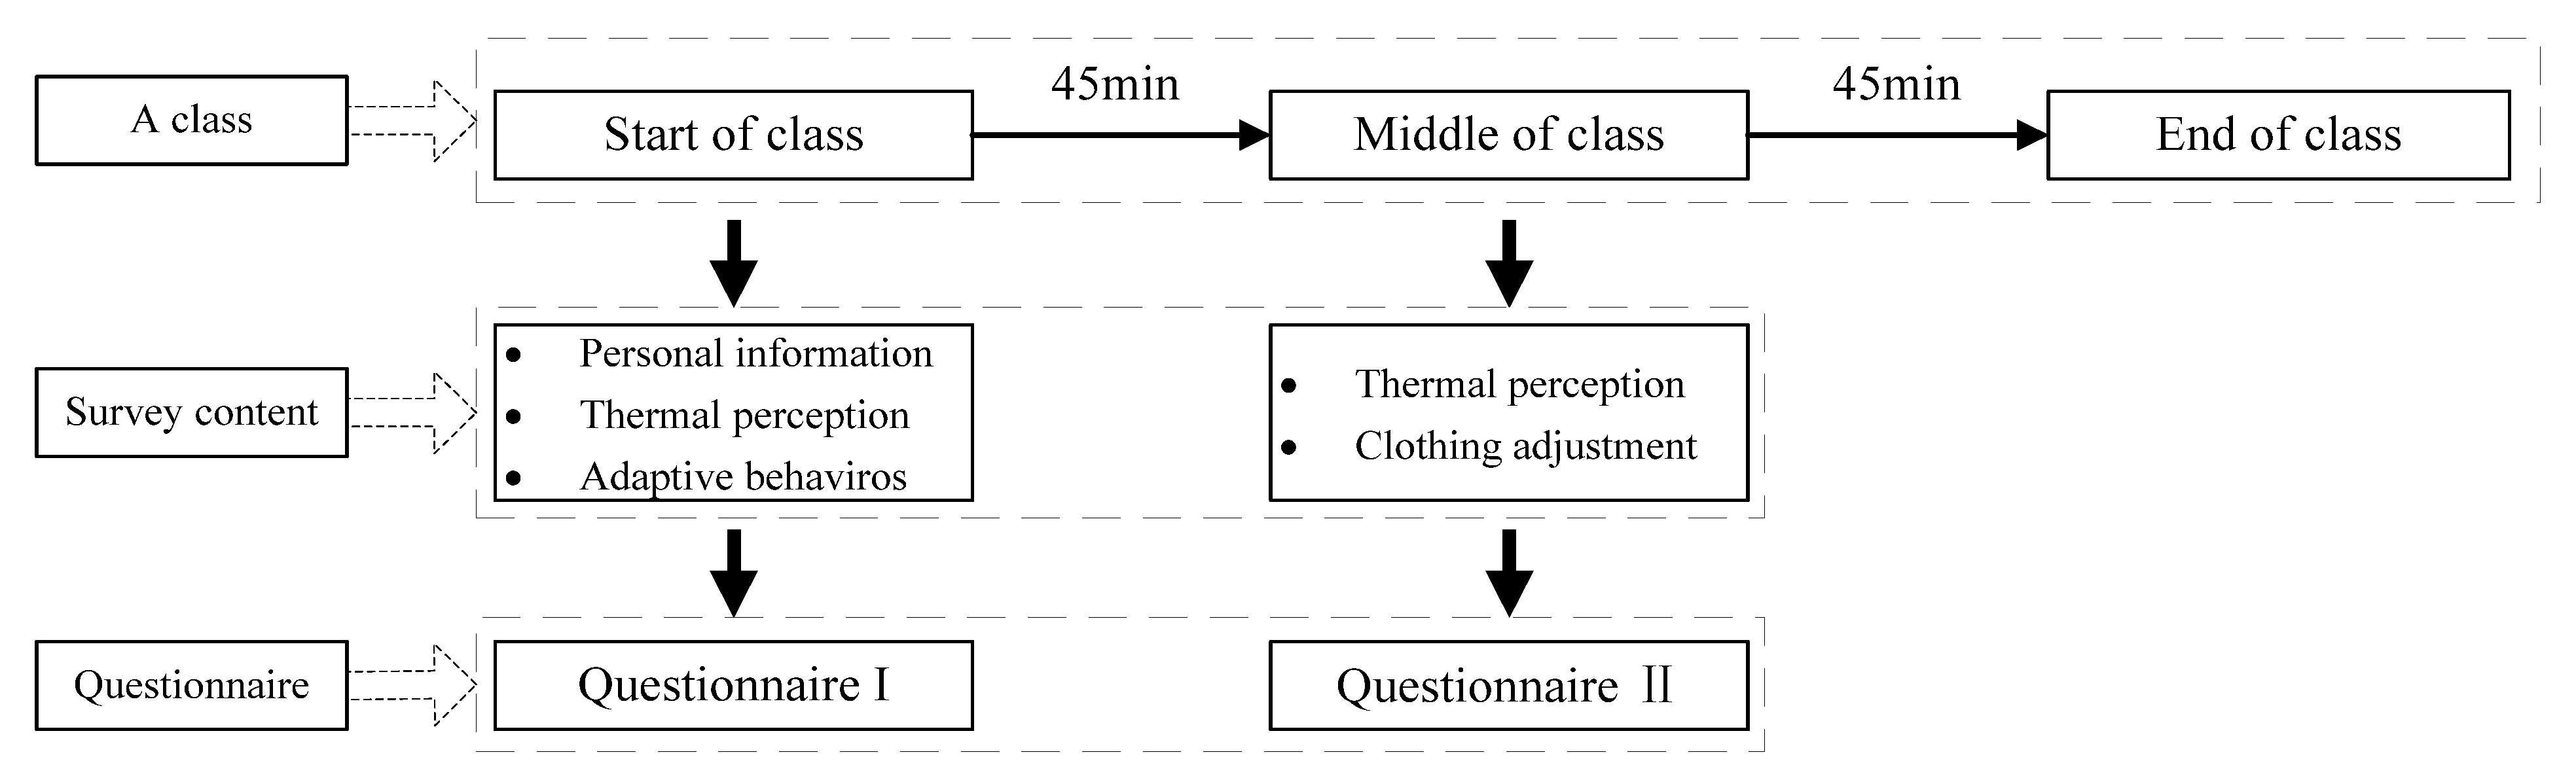
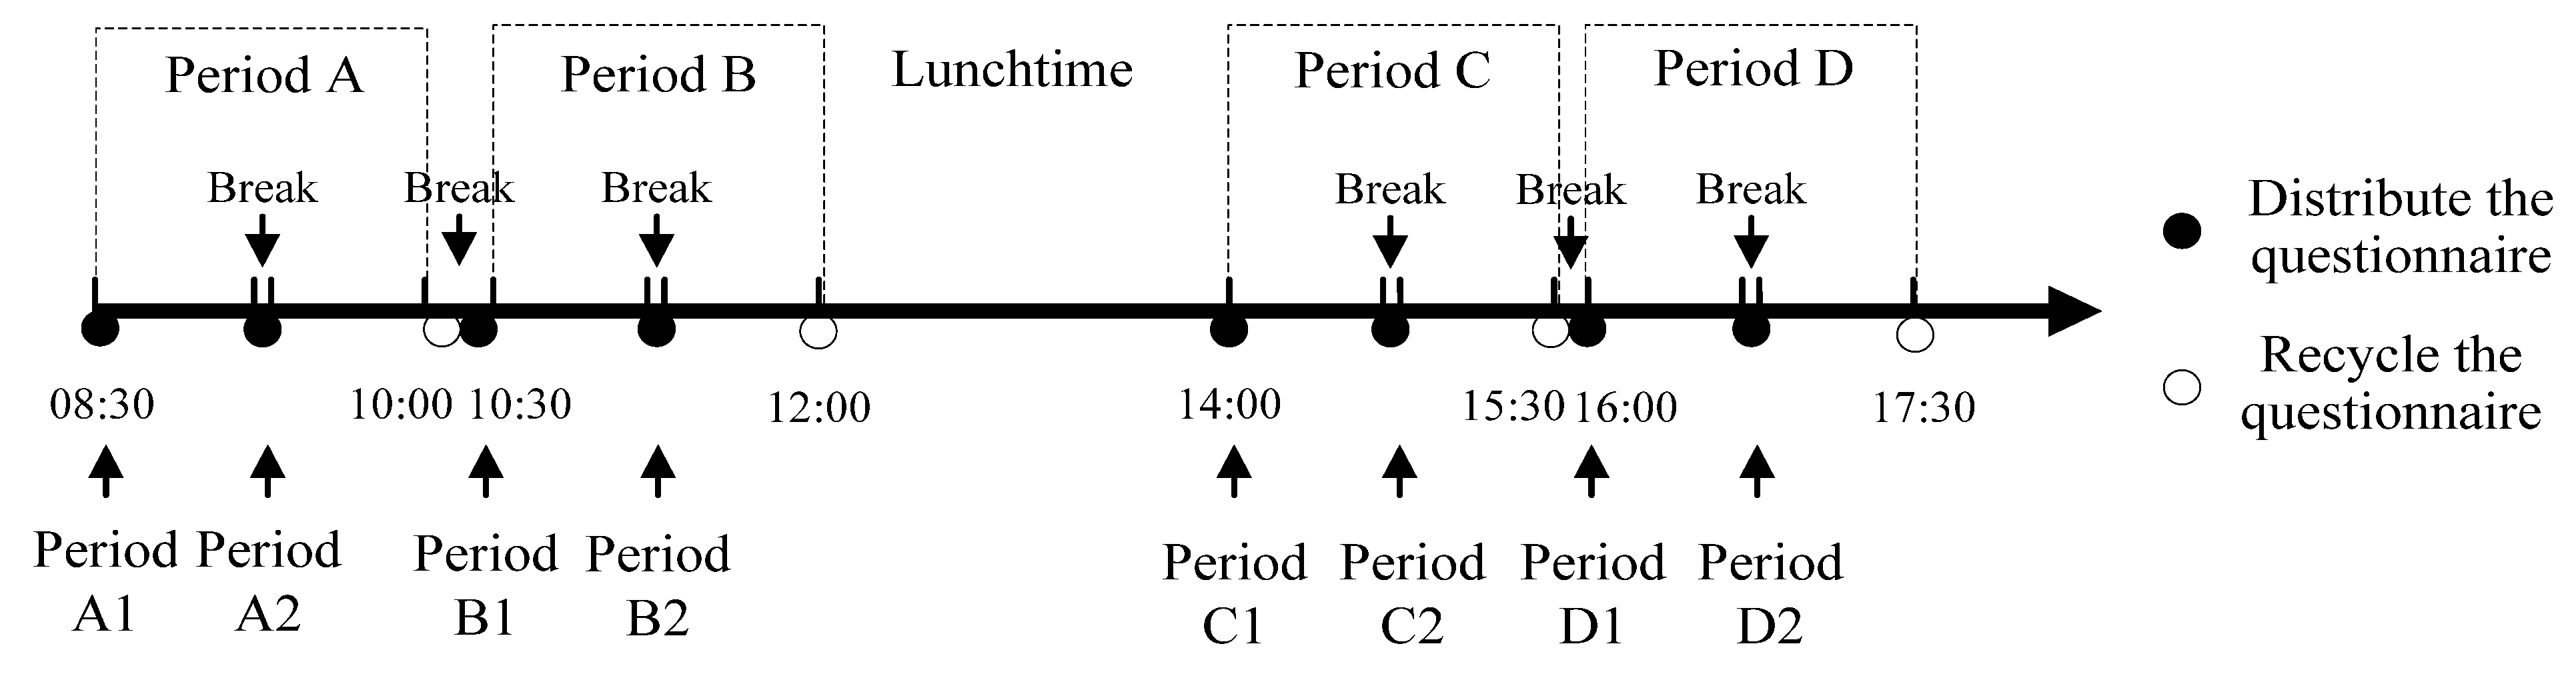
2.4. Questionnaire Survey

The duration of each class was 2 × 45 min, with a 5 min break in the middle. A classroom can have a maximum of four classes per day: 08:30–10:05 h (period A), 10:25–12:00 h (period B), 14:00–15:35 h (period C), and 15:45–17:20 h (period D). To understand the time-varying thermal perception of the students in each class of the day, two subjective questionnaires were provided at the beginning and middle of the class, namely, questionnaires I and II (Figure 4). Questionnaire I was distributed before each class, questionnaire II was distributed during the break, and all questionnaires were collected at the end of each class (Figure 5). Participants were asked to complete the questionnaire within 5 min, and the specific time of filling in the questionnaire was marked. Questionnaire I contained the following information: (1) basic information about the students, such as gender, age, height, weight, and clothing; (2) the students’ activity status before class, consumption of food and beverages, and whether he/she had a class in the previous period; (3) TSV, thermal preference voting (TPV), and thermal comfort voting (TCV), which are listed in Table 2; and (4) the adaptation behavior of the students, including thermal adaptation behavior and cold adaptation behavior. Questionnaire II contained the following information: (1) the students’ TSV, TPV, and TCV and (2) clothing adjustments. Before the questionnaire was issued, the surveyor presented a brief explanation of the questionnaire content and professional terms to the students. Student participation in the survey was completely voluntary.
Owing to the winter vocation, the heating period of university classrooms is mainly in mid-November and mid-December. Therefore, this study randomly selected 4 days for investigation in mid-November and mid-December, namely, November 14 (Day 1), November 28 (Day 2), December 4 (Day 3), and December 18 (Day 4). The sample size obtained in 4 days met the minimum required sample size [2]. On Day 1 and Day 2, period B was not scheduled for classes. On Day 3 and Day 4, all four periods were scheduled for classes. To ensure the accuracy of the analysis, returned questionnaires were screened to eliminate samples with contradictory phenomena [44], for example, students who perceived an extremely hot environment but wished for a warmer environment.

2.5. Data Analysis

In this study, IBM SPSS Statistics 26 [45] was used for statistical analysis. The sample values of TSV, TPV, and TCV in this study did not conform to the normal distribution. Therefore, the nonparametric test method was used. The purpose of this study was to determine whether there were significant differences in the distribution of different sample data. This involved the difference test of two independent sample data (e.g., thermal perception samples from any two periods or from different genders) and multiple independent sample data (e.g., thermal perception samples from different food consumptions or preclass activities). In order to achieve the study’s purpose, the Wilcoxon rank sum test was used to detect the difference between two independent samples. The Kruskal–Wallis test was used to detect the difference between multiple samples. According to the types of variables, different correlation analysis methods were selected. In this study, the mean thermal sensation vote, operating temperature, and outdoor temperature were all continuous variables. Therefore, the Pearson method was chosen to calculate the correlation coefficient between TSV and operating temperature and between TSV and outdoor temperature. The significance α level was set at 0.05. The operating temperature (Top, °C) was selected as the indoor thermal index. This was used to analyze the relationship between the indoor thermal environment and the students’ thermal perception. The calculation method of Top was based on that of Jiang et al. [1]. The parameters that needed to be considered in the Top calculation were the indoor air temperature, black bulb temperature, and air velocity. Referring to ASHRAE Standard 55-2017 [8], the clothing insulation is calculated by Equation (1).
I c l = i n I c l , i + I c l , c h a i r
where I c l represents the total clothing insulation; I c l , i represents the insulation of the i-th piece of clothing, and the specific value refers to ASHRAE Standard 55-2017 [8]; n represents the number of clothes worn by the students; and I c l , c h a i r represents the insulation of the chair. The classroom in this study has wooden chairs, so this value is 0.01.

3. Results and Discussion

3.1. Demographic Condition

In this study, one typical classroom was selected for the investigation. A total of 578 students participated in the survey. Table 3 presents the mean demographics and clothing insulation of the questionnaire respondents. Of the respondents, 323 were male and 255 were female. The ages of the respondents fell within the range of 16 to 21 years old. BMI was within the normal range. At the start of the classes during periods A, B, C, and D, the average clothing insulation values were 1.44, 1.48, 1.41, and 1.44 clo, respectively. This showed that the clothing insulation values of the students during the afternoon class were lower than those during the morning class. The clothing insulation value of females was generally 0.02–0.13 clo higher than that of males.

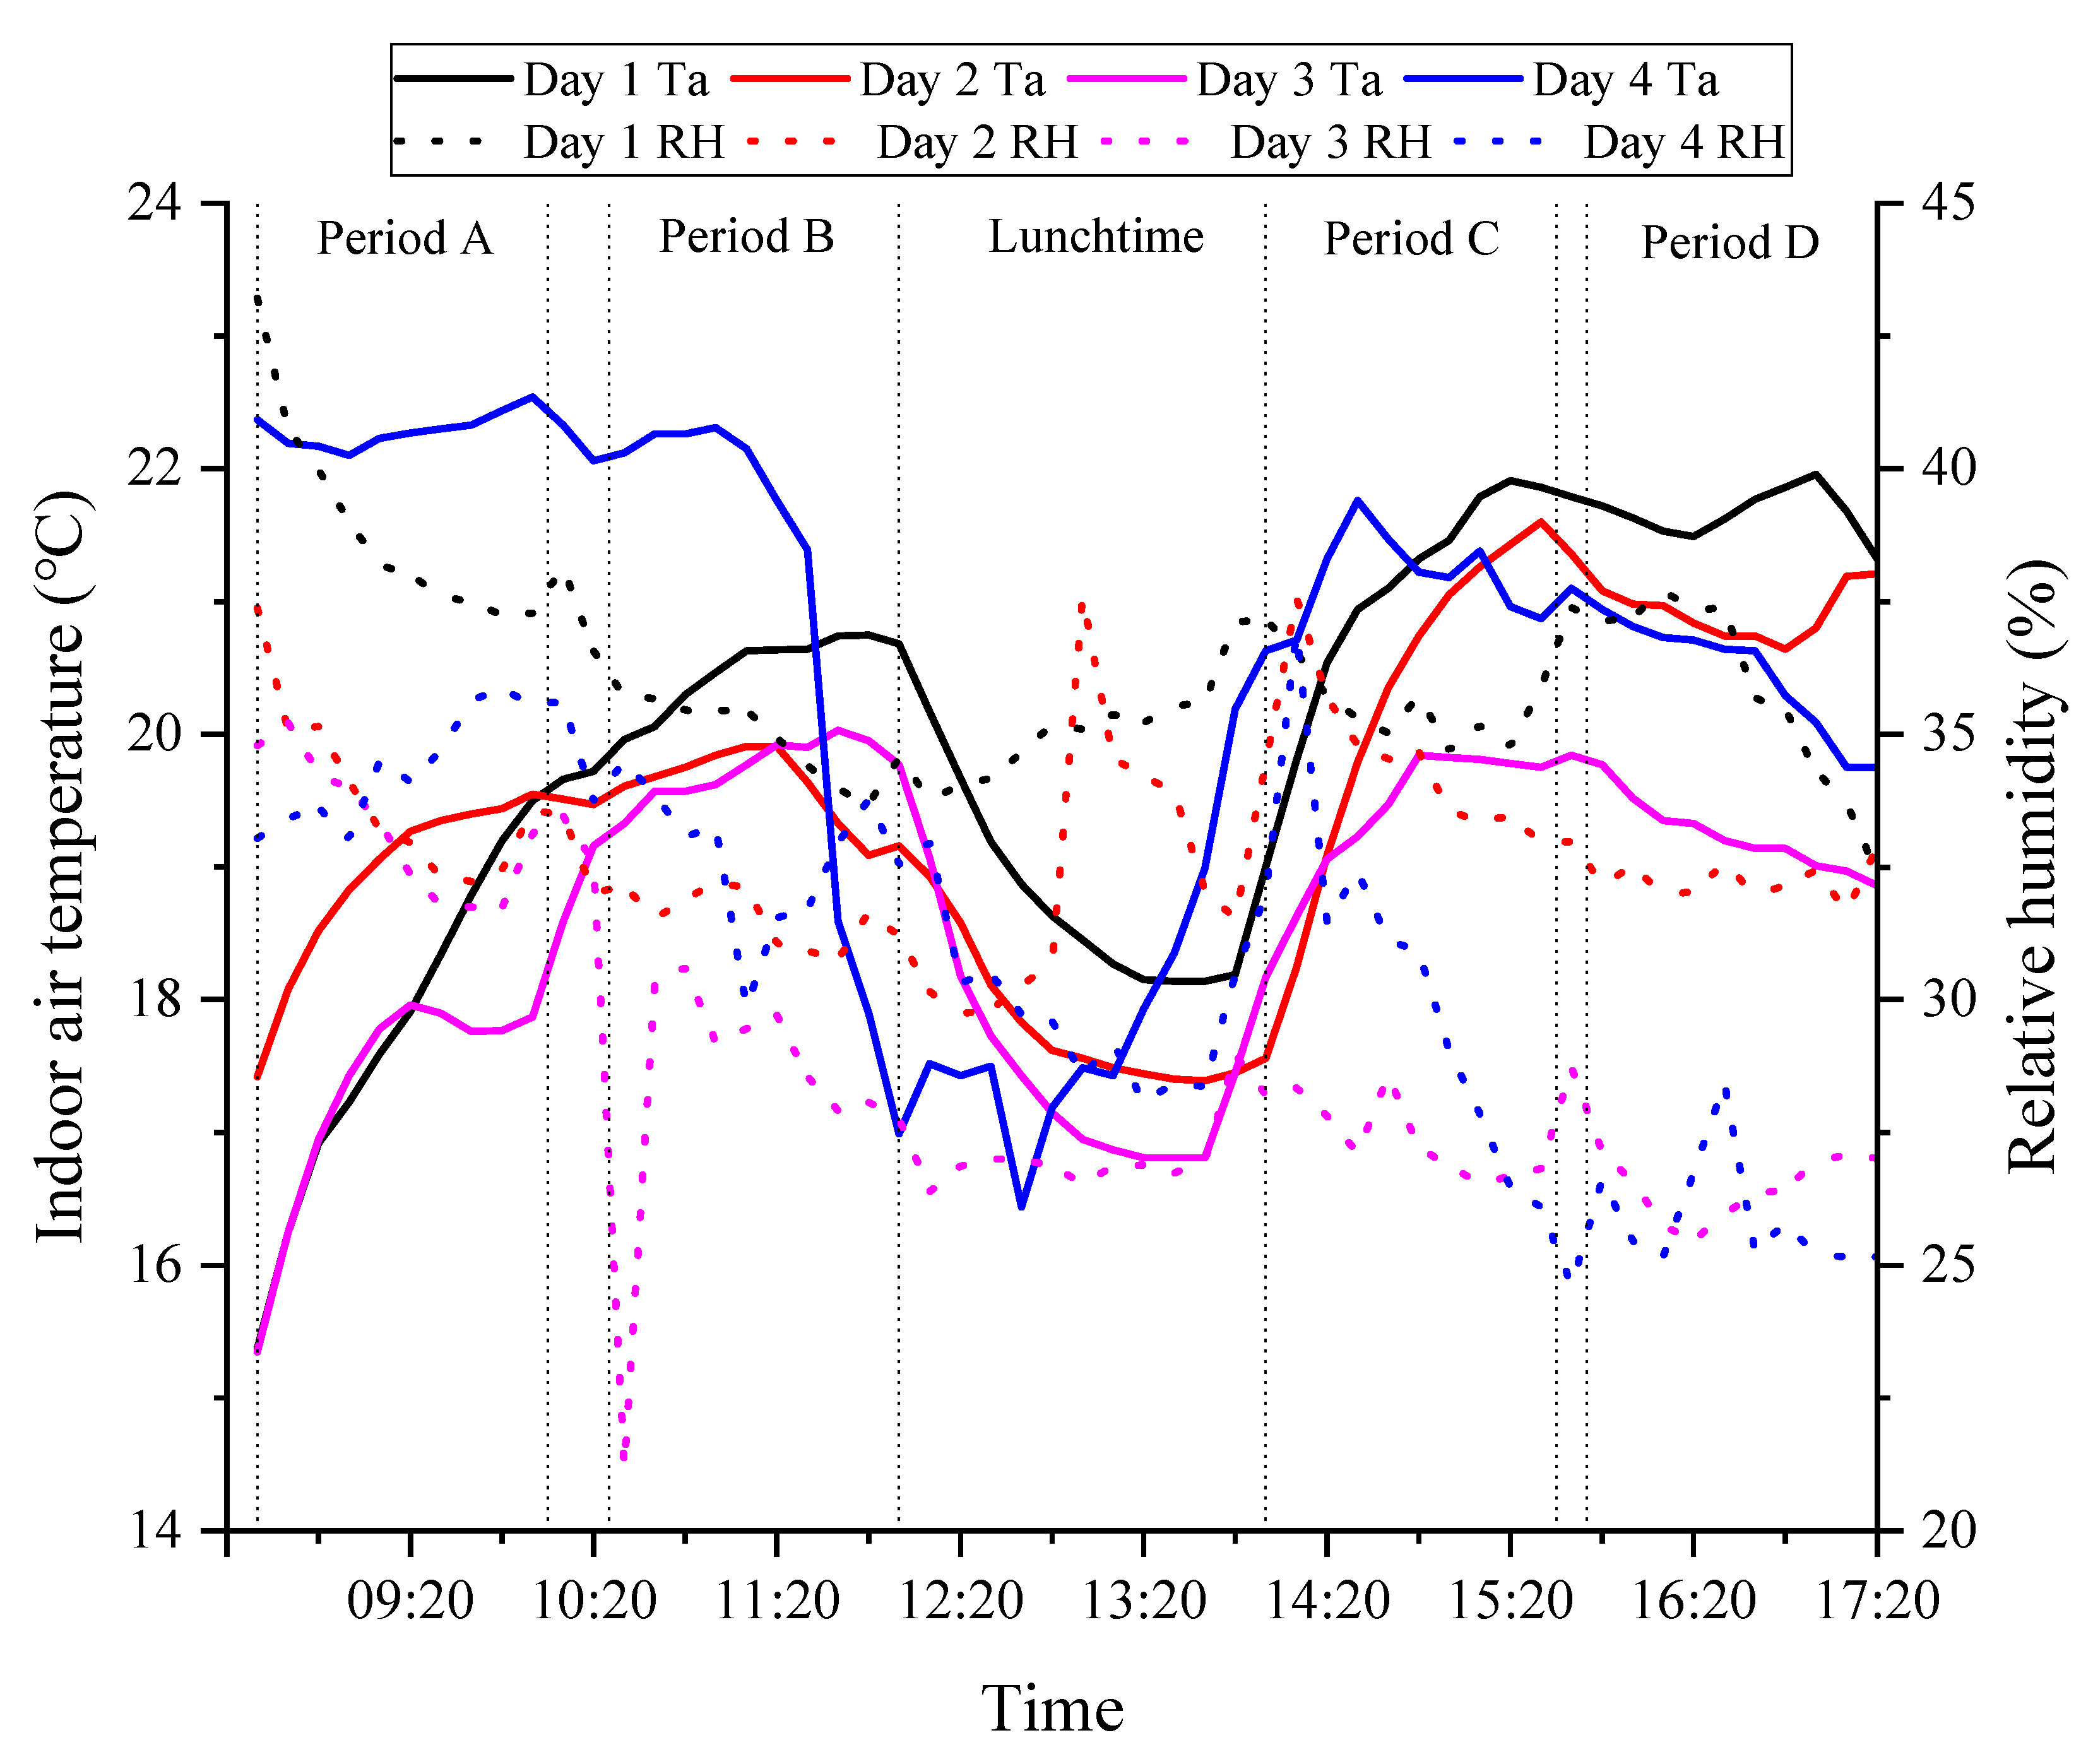
3.2. Thermal Environment Condition

3.2.1. Outdoor Thermal Environment

During Day 1, Day 2, Day 3, and Day 4 of classes (08:30–12:00 and 14:00–17:20), the average outdoor temperature was 12.8 (SD = 1.8 °C), 4.0 (SD = 1.2 °C), 1.5 (SD = 0.8 °C), and 1.9 °C (SD = 2.1 °C), respectively, and the average relative humidity was 61.1% (SD = 6.7%), 68.5% (SD = 6.7%), 72.7% (SD = 4.9%), and 52.7% (SD = 8.6%), respectively (Figure 6). During the heating season, the average outdoor temperature gradually decreased. The average outdoor temperature on Day 1 (initial heating period) was significantly higher than that on Day 2, Day 3, and Day 4. During classes, both the lowest average outdoor temperature and the highest average outdoor relative humidity occurred in period A, and the highest average outdoor temperature and the lowest average outdoor relative humidity occurred in period C (Table 4). The average outdoor temperature in the afternoon was significantly higher than that in the morning.

3.2.2. Indoor Thermal Environment

The indoor thermal environment of the investigated classroom during different periods was analyzed as follows. On Day 1, Day 2, Day 3, and Day 4, the indoor air temperature was significantly higher than the outdoor air temperature (temperature difference ranged from 5.9 to 23.3 °C), and the indoor relative humidity was significantly lower than the outdoor relative humidity, especially during class (Table 4). On Day 2, Day 3, and Day 4, the temperature difference between indoors and outdoors (∆T) was above 15 °C. In addition, the temperature difference between indoors and outdoors in the morning was greater than in the afternoon. The main reasons for this were radiator heating and human heat release. At the beginning of the first class in the morning (period A1), the indoor temperature was the lowest, but Day 4 was an exception. This is because there was a class meeting in the classroom before class on Day 4. There was no significant difference between the indoor temperatures during periods B, C, and D (Figure 7). During Day 1, Day 2, Day 3, and Day 4 of classes (08:30–12:00 and 14:00–17:20), the average indoor air temperature was 20.2 (SD = 4.5 °C), 19.9 (SD = 4.3 °C), 18.9 (SD = 4.1 °C), and 21.2 °C (SD = 4.5 °C), respectively, and the average relative humidity was 36.4% (SD = 7.9%), 33.0% (SD = 7.2%), 29.0% (SD = 6.4%), and 30.9% (SD = 7.2%), respectively. The survey found that when the classroom was occupied, the windows and doors were often closed, the air velocity was kept below 0.2 m/s, and the CO2 concentration was high, in the range of 578–947 ppm (Table 4).

3.3. Student Thermal Perception Development

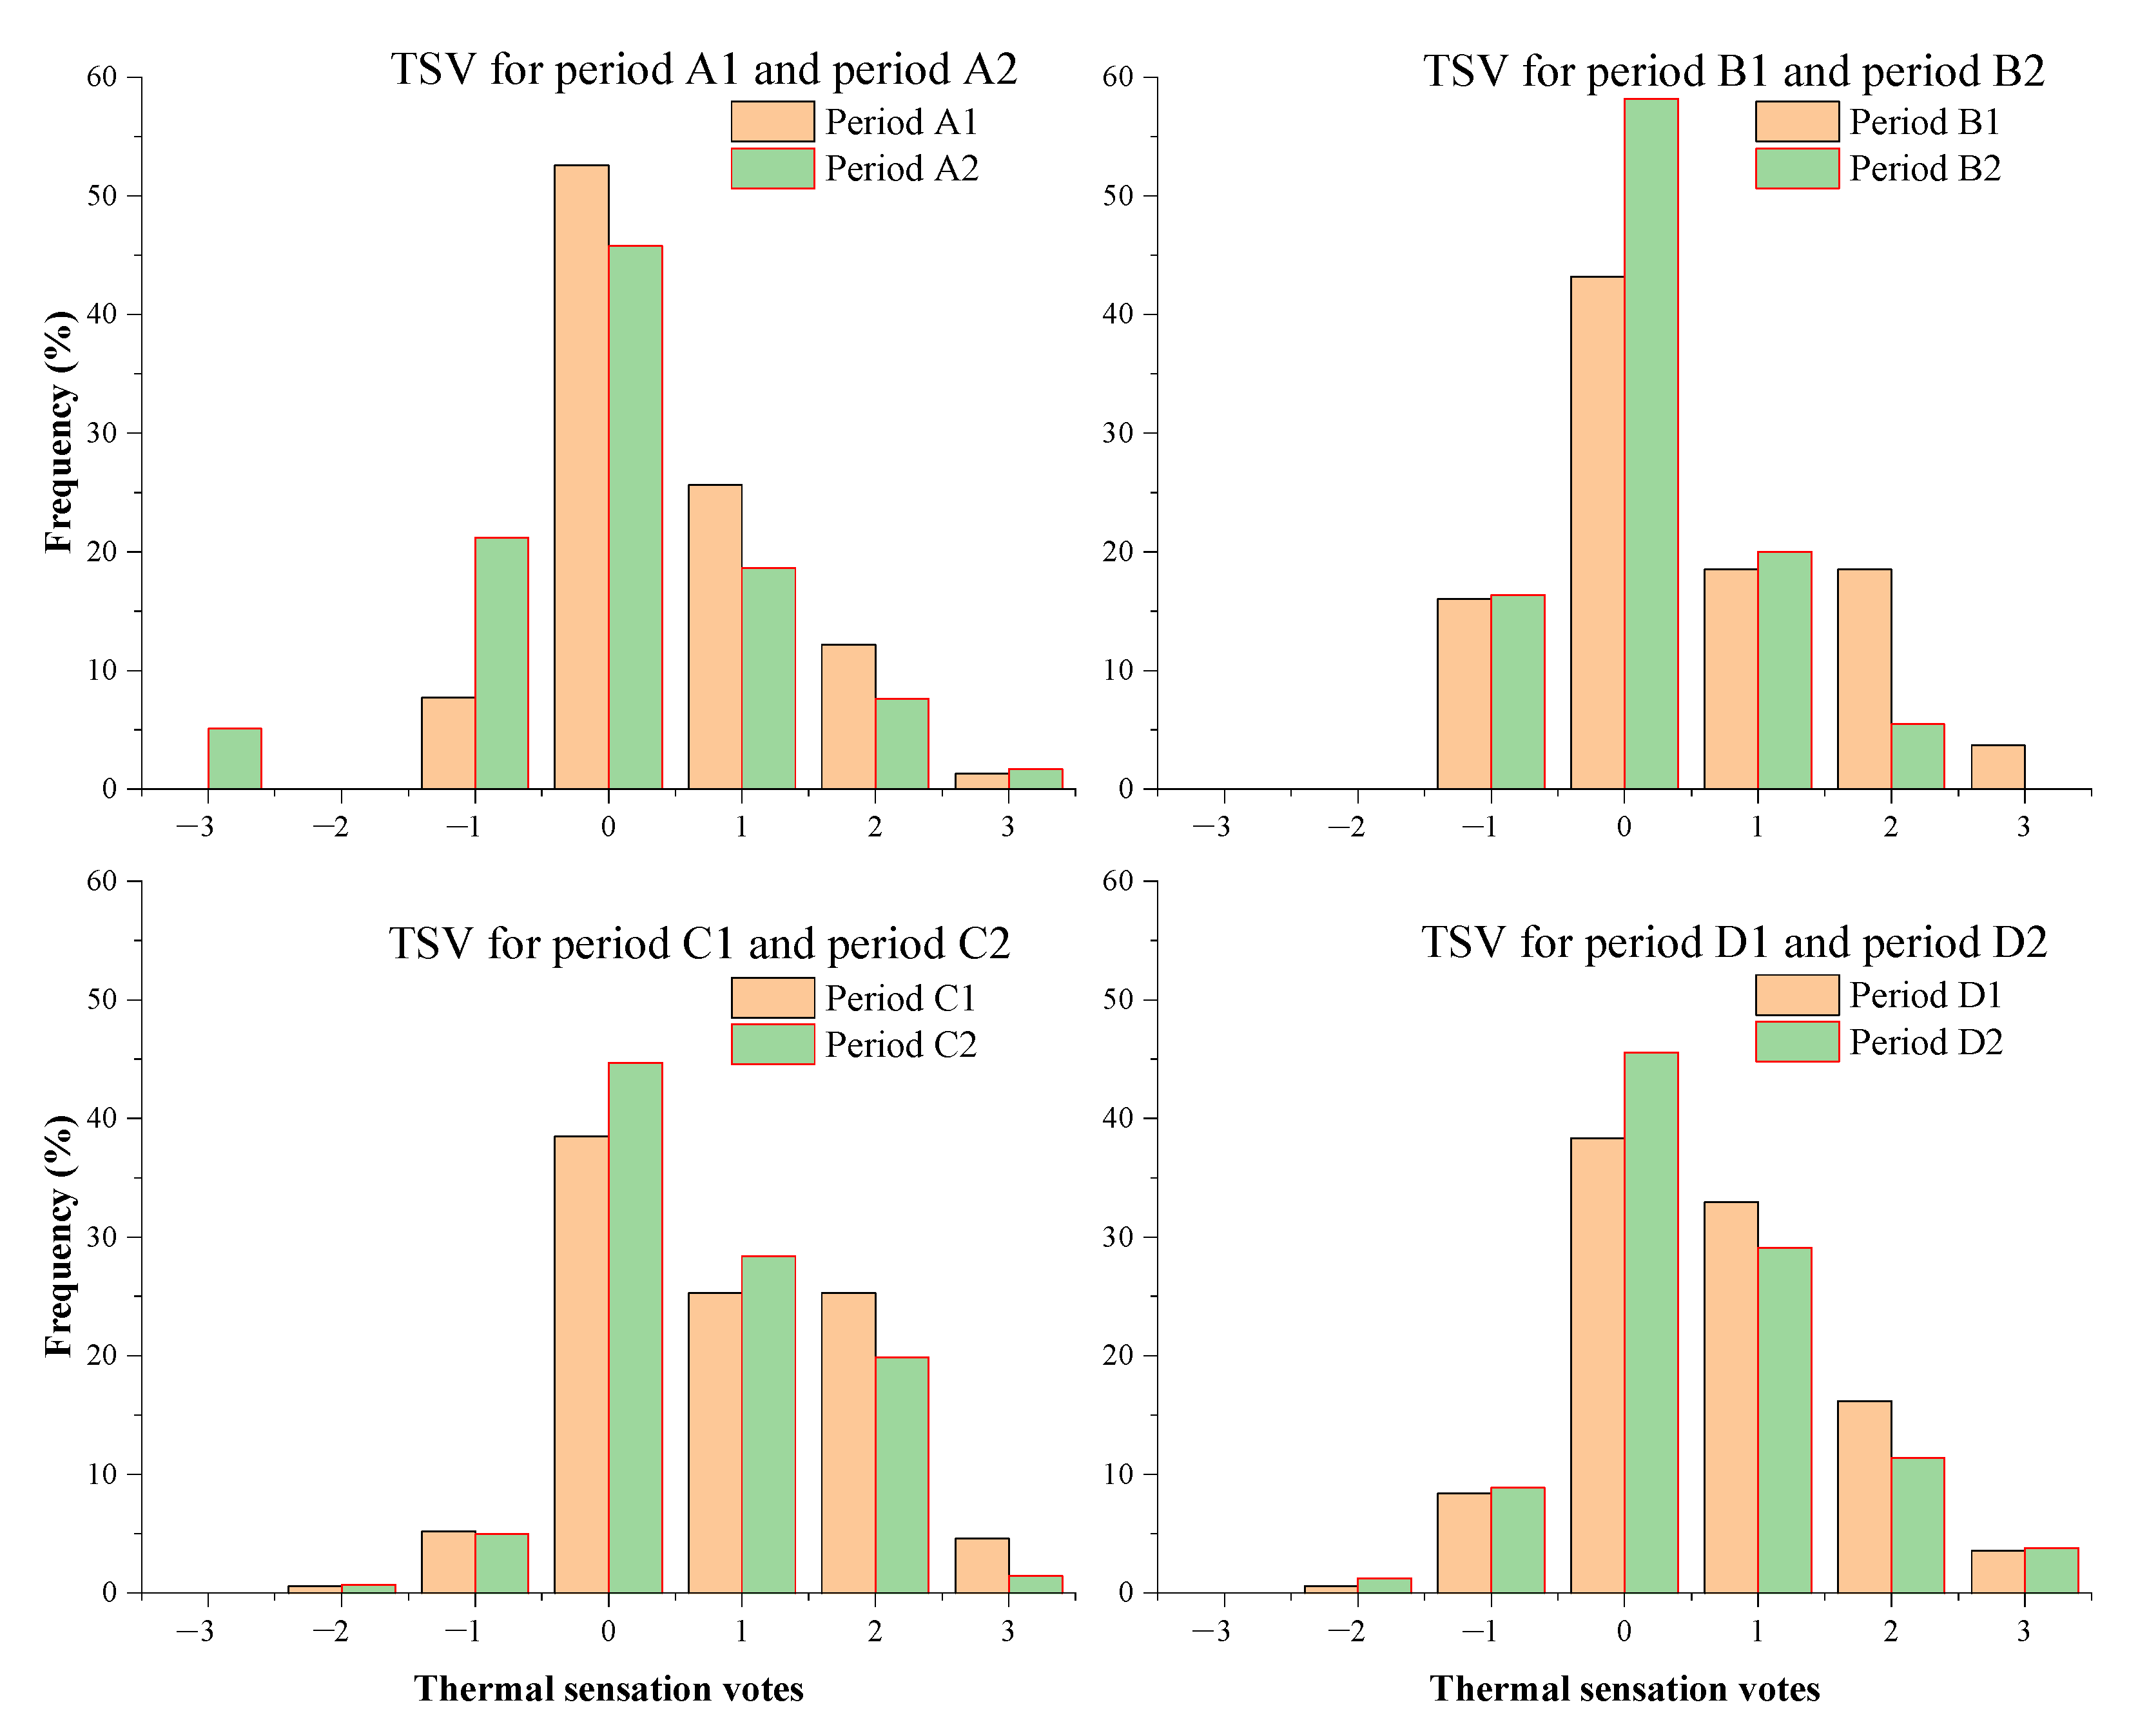
3.3.1. Thermal Sensation Votes

According to the survey results, the TSV showed significant differences at the beginning and in middle of the class (TSVA1, B1, C1, D1 vs. TSVA2, B2, C2, D2: p < 0.001). Table 5 shows that in the morning and afternoon, the TSV differed significantly. No significant differences were found in the TSV values between periods A and B in the morning. The TSV did not differ significantly between periods C and D in the afternoon either.
The mean values of the TSV of periods A1, A2, B1, B2, C1, C2, D1, and D2 were 0.47 (SD = 0.89), 0.03 (SD = 1.15), 0.65 (SD = 1.08), 0.15 (SD = 0.75), 0.89 (SD = 1.07), 0.66 (SD = 0.92), 0.66 (SD = 0.98), and 0.52 (SD = 0.98), respectively. In each period, the students’ thermal sensation tended to be between neutral and slightly warm. The TSV value at the start of the class was significantly higher than that during the middle period of the class. As the class progressed, the students’ thermal sensations gradually changed from slightly warm to neutral (except for period A2, during which the students’ thermal sensations became slightly cool) (Figure 8). The TSV value in the morning class (periods A and B) was significantly lower than that in the afternoon class (periods C and D); that is, in the afternoon, the students’ thermal sensations were closer to slightly warm. Compared with periods A1, B1, C1, and D1, the TSV value showed a trend of rising first and falling later. The TSV value of period C1 was the highest, and that of period A1 was the lowest. Compared with periods A2, B2, C2, and D2, the TSV value showed a “decline–up–decline” trend. The TSV value was the highest during the first class in the afternoon. This phenomenon was observed on Day 1, Day 2, Day 3, and Day 4 (Table 6).

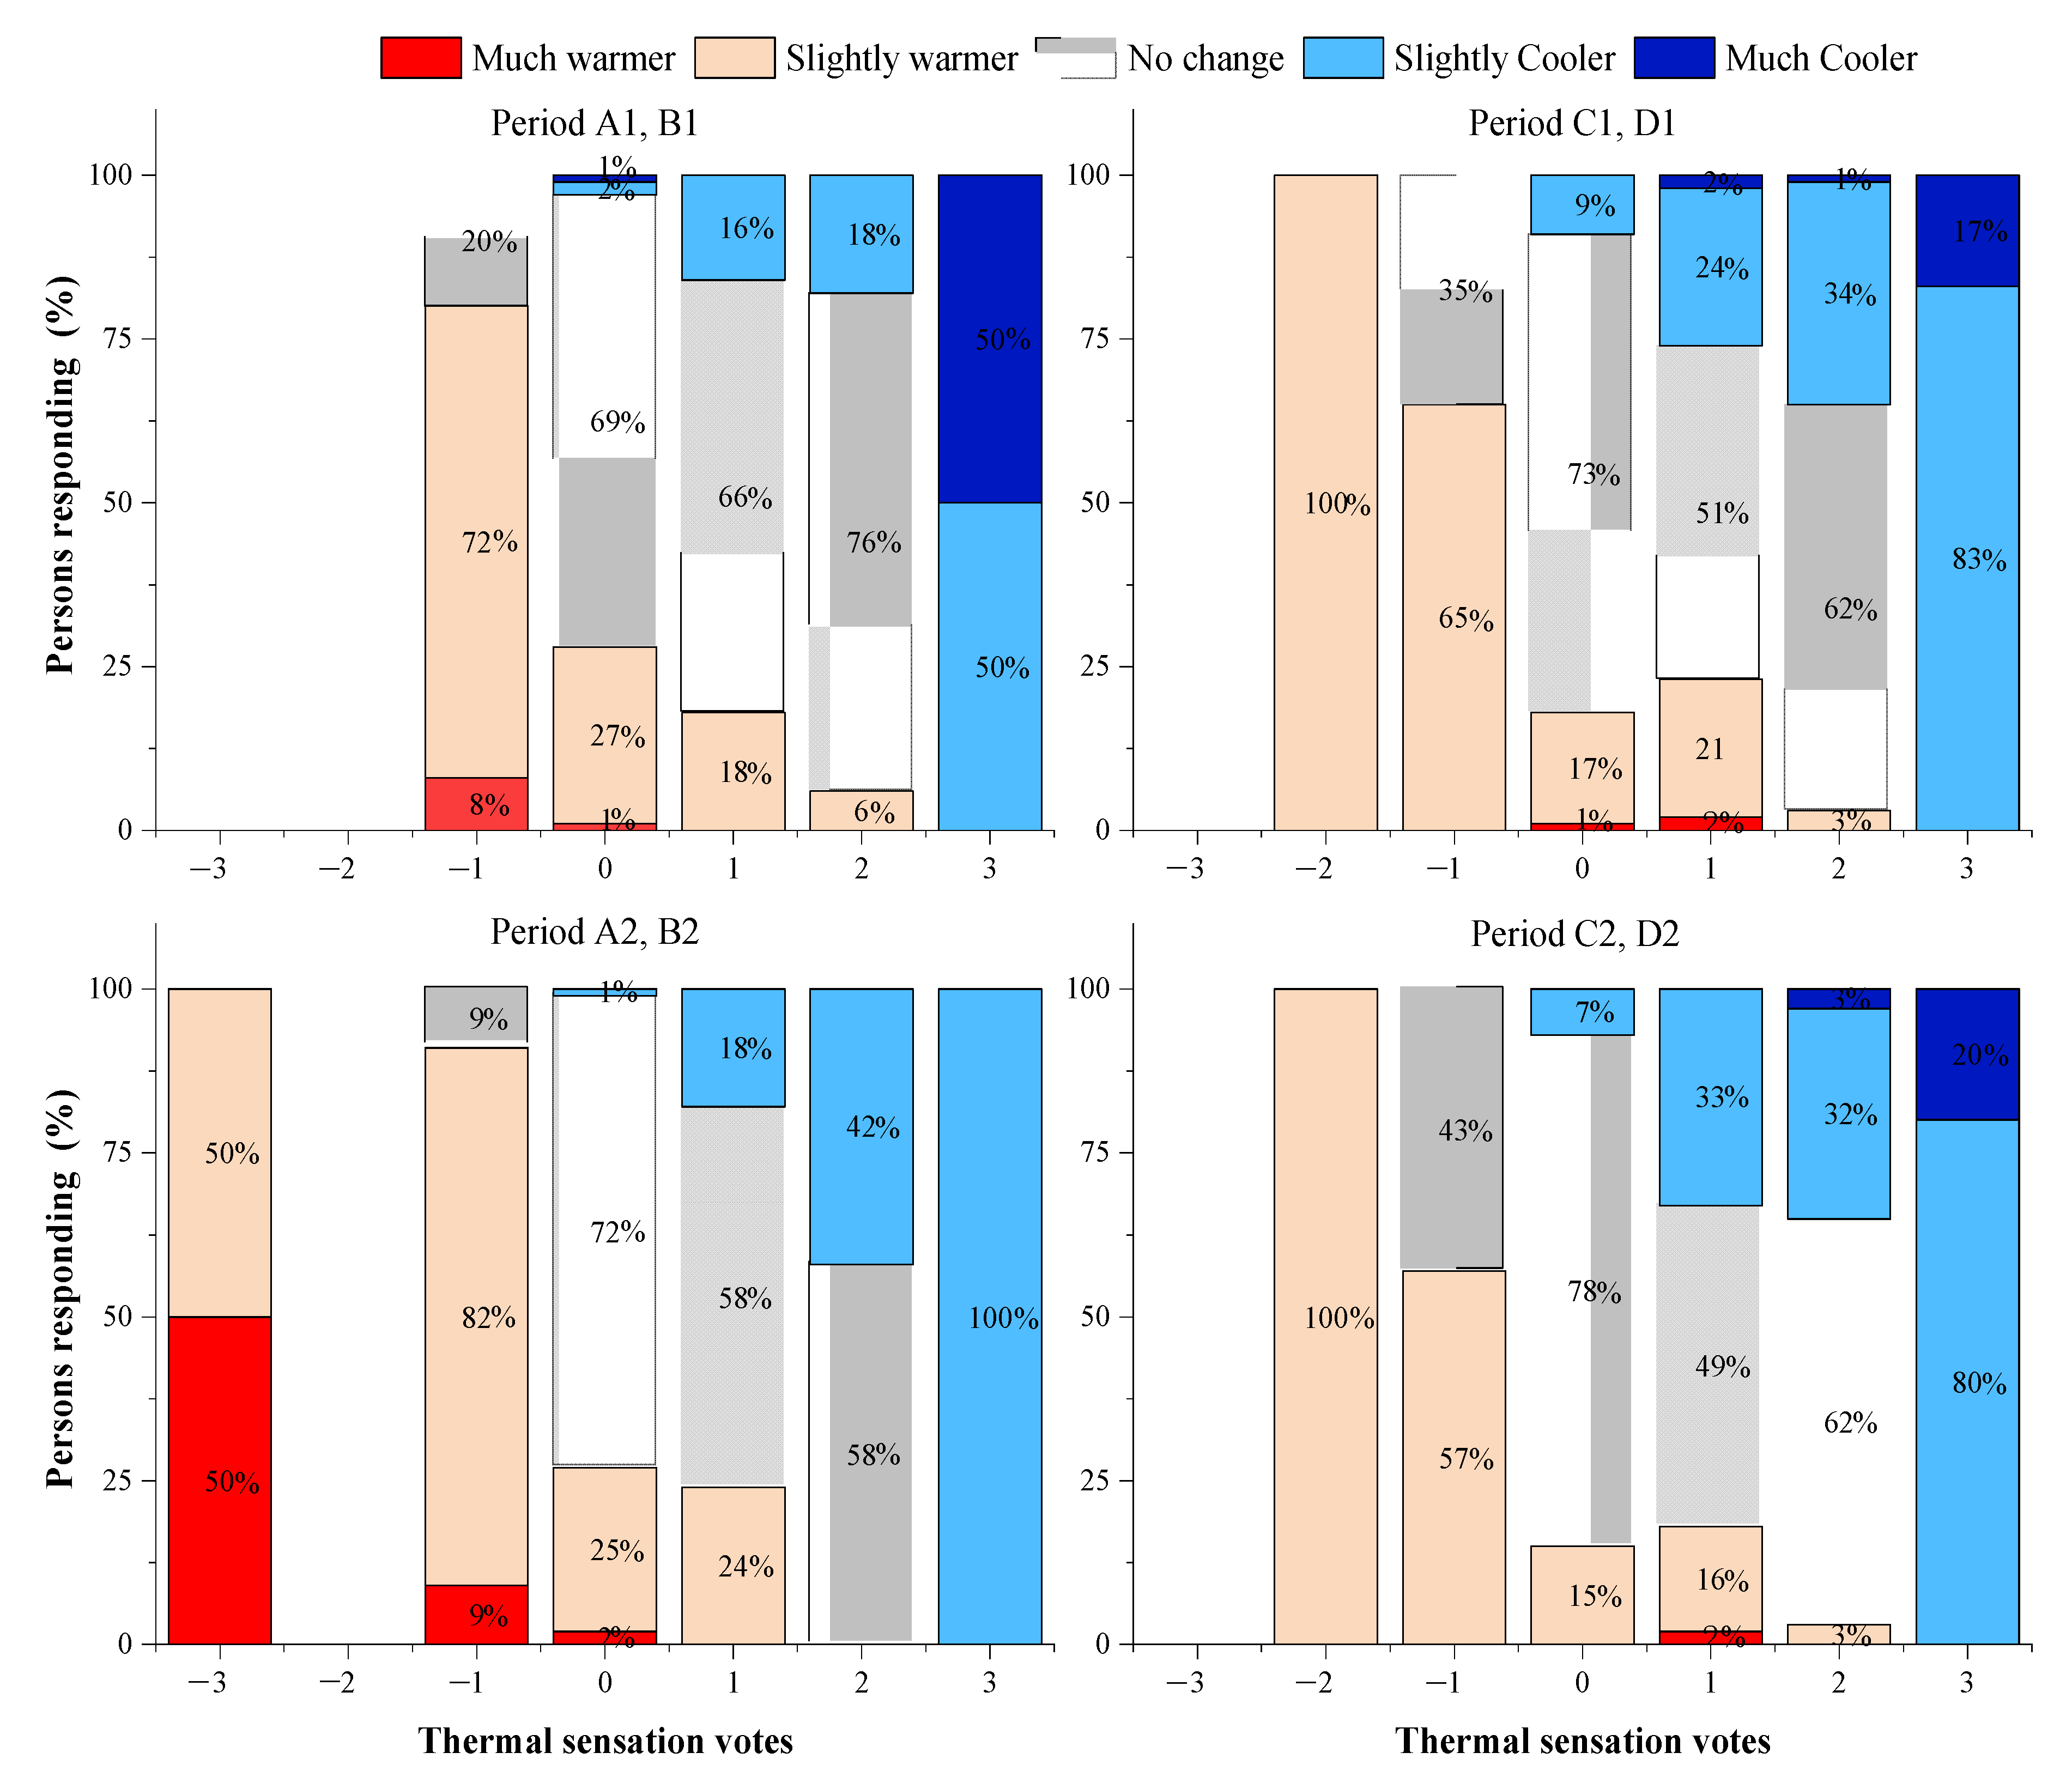
3.3.2. Thermal Preference Votes

Table 7 presents the test results of the difference in the TPV values in different periods. Table 7 shows that in the morning and afternoon, the TPV values differed significantly. No significant differences were found in the TPV values between periods A and B in the morning. The TPV also did not differ significantly between periods C and D in the afternoon. No significant differences were found in the TPV values between the beginning and the middle of the class.
The mean value of the TPV of periods A1, A2, B1, B2, C1, C2, D1, and D2 were −0.23 (SD = 0.62), −0.33 (SD = 0.77), −0.10 (SD = 0.68), −0.27 (SD = 0.59), 0.08 (SD = 0.69), 0.07 (SD = 0.65), −0.04 (SD = 0.73), and −0.01 (SD = 0.63), respectively. Except for periods C1 and C2, the students preferred a higher indoor temperature. The TPV value in the morning class (periods A and B) was significantly lower than that in the afternoon class (periods C and D); that is, the students’ willingness to prefer a higher indoor temperature during the morning class was stronger. This phenomenon was observed on Day 1, Day 3, and Day 4 (Table 6).
Figure 9 presents a cross-tabulated summary of the TSV compared with the TPV. Figure 9 shows that at any time, when the TSV values were −1 and −2, the ratio of the TPV as “Slightly warmer” was significantly higher than that of “No change”. When the TSV values were 1 and 2, the ratio of the TPV as “No change” was significantly higher than that of “Slightly cooler”. The above results indicate that the students were sensitive to the cooler environment and had a greater tolerance of the warmer environment. Therefore, because the indoor and outdoor temperatures were lower in the morning compared with those in the afternoon, the students had a stronger desire for higher indoor temperatures in the morning.

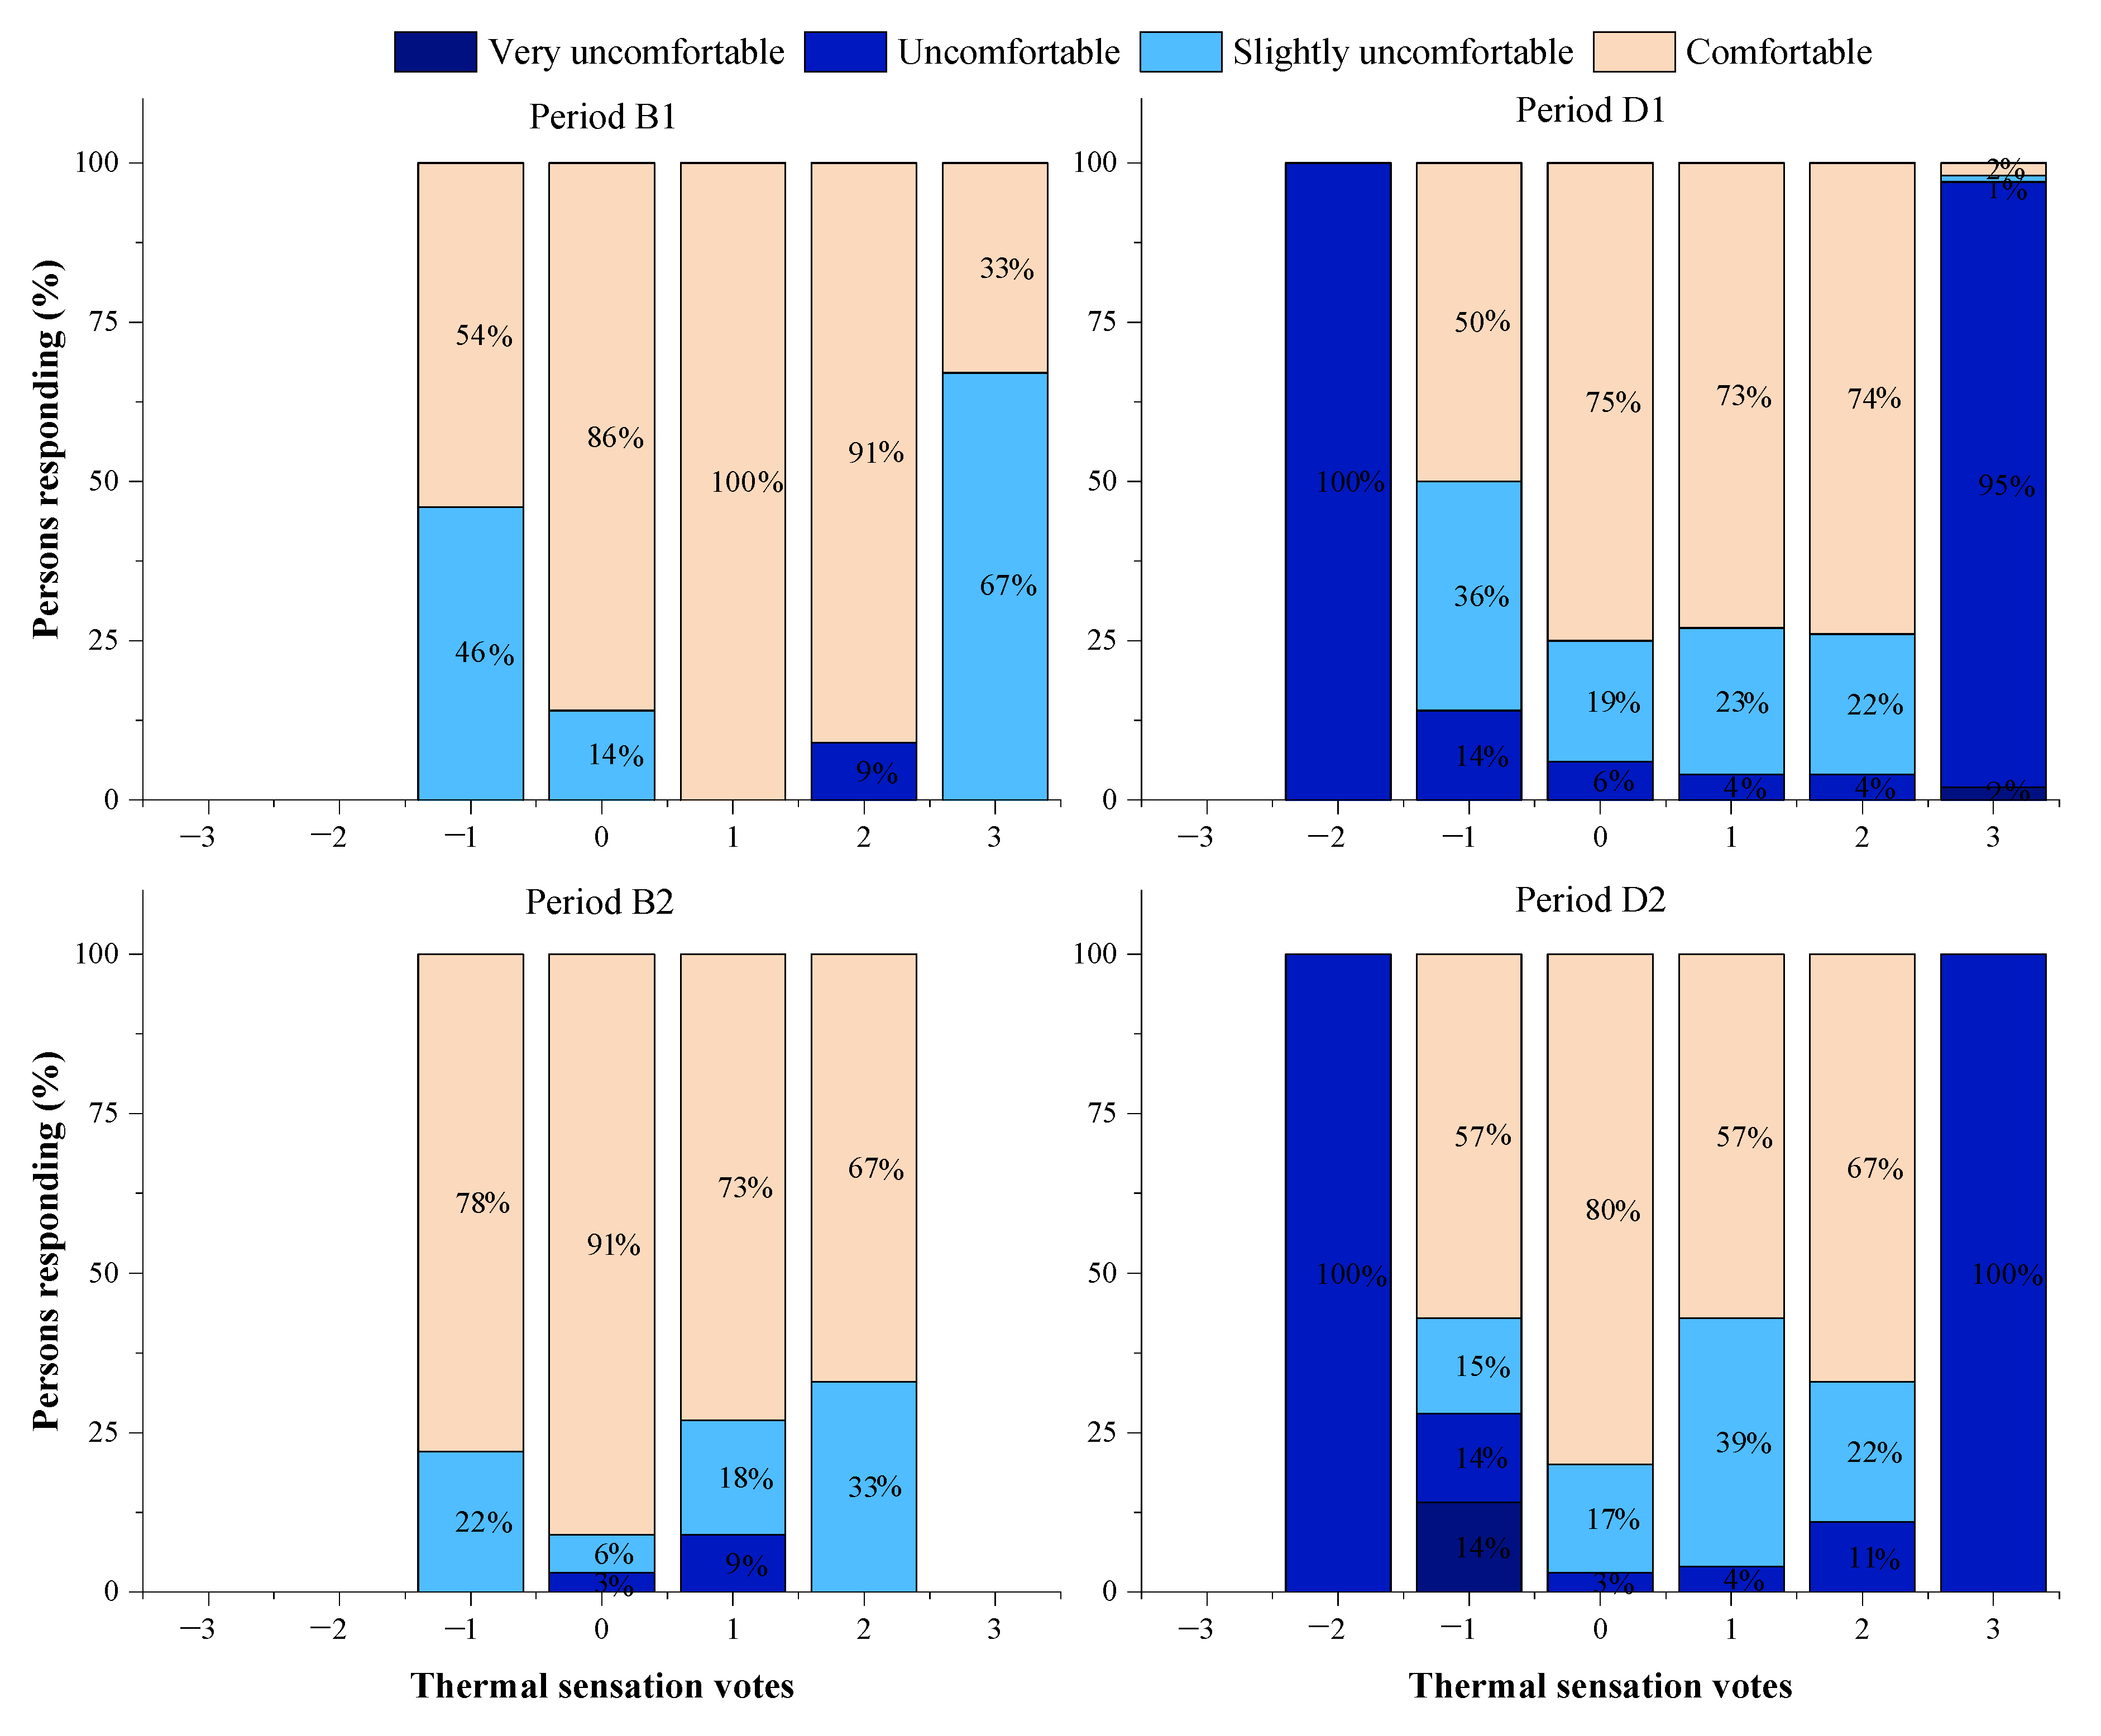
3.3.3. Thermal Comfort Votes

Table 8 presents the test results of the differences in the TCV values in different periods. Table 8 shows that the differences in TCV values were significant in periods B and D. No significant differences were found in the TCV values between periods A and B in the morning. The TCV also did not differ significantly between periods C and D in the afternoon. No significant differences were found in the TCV values between the start and the middle of the class.
The mean values of the TCV of periods A1, A2, B1, B2, C1, C2, D1, and D2 were 0.19 (SD = 0.41), 0.31 (SD = 0.54), 0.18 (SD = 0.42), 0.19 (SD = 0.47), 0.29 (SD = 0.53), 0.33 (SD = 0.59), 0.39 (SD = 0.66), and 0.43 (SD = 0.71), respectively. At any time, the comfort level of the students decreased slightly as the class progressed. Compared with periods A1, B1, C1, and D1, the TCV value showed an upward trend. Compared with periods A2, B2, C2, and D2, the TCV value showed a trend of falling first and rising later. The comfort level of the students in periods D1 and D2 was lower than that in periods B1 and B2. Although in periods D1 and D2, the indoor temperature reached the expected range of the students, the indoor RH was low, and the indoor CO2 concentration reached the highest level during the day (Table 4), the students felt that the indoor air was increasingly stuffy. Therefore, administrators must not only create a good indoor thermal environment, but also ensure good air quality [46].
Figure 10 presents a cross-tabulated summary of the TSV compared with the TCV in periods B1, B2, D1, and D2. It can also be seen from Figure 10 that in periods B1 and B2, the students generally felt comfortable or slightly uncomfortable, while in periods D1 and D2, the proportion of the students who felt uncomfortable was high. Therefore, the thermal environment during period D must be improved. In addition, as seen in the figure, when the TSV values were 0, 1, and 2 during periods B1, B2, D1, and D2, most students felt comfortable. However, when the TSV values were −2, −1, and 3 during periods B1, D1, and D2, most students felt uncomfortable. It can be concluded that the comfort level of the students in a warm environment was higher than that in a cold environment. As the students were used to warm rooms with space heating in the heating season, their adaptability to the cold indoor environment weakened; thus, they were sensitive to the cold indoor environment in the heating season [38]. When a respondent entered a cold room, he/she could not easily adapt to the low indoor temperature and therefore felt uncomfortable. Therefore, to improve the comfort level of the students, a neutral or warm indoor environment should be created during class.

3.4. Factors Influencing Thermal Perception

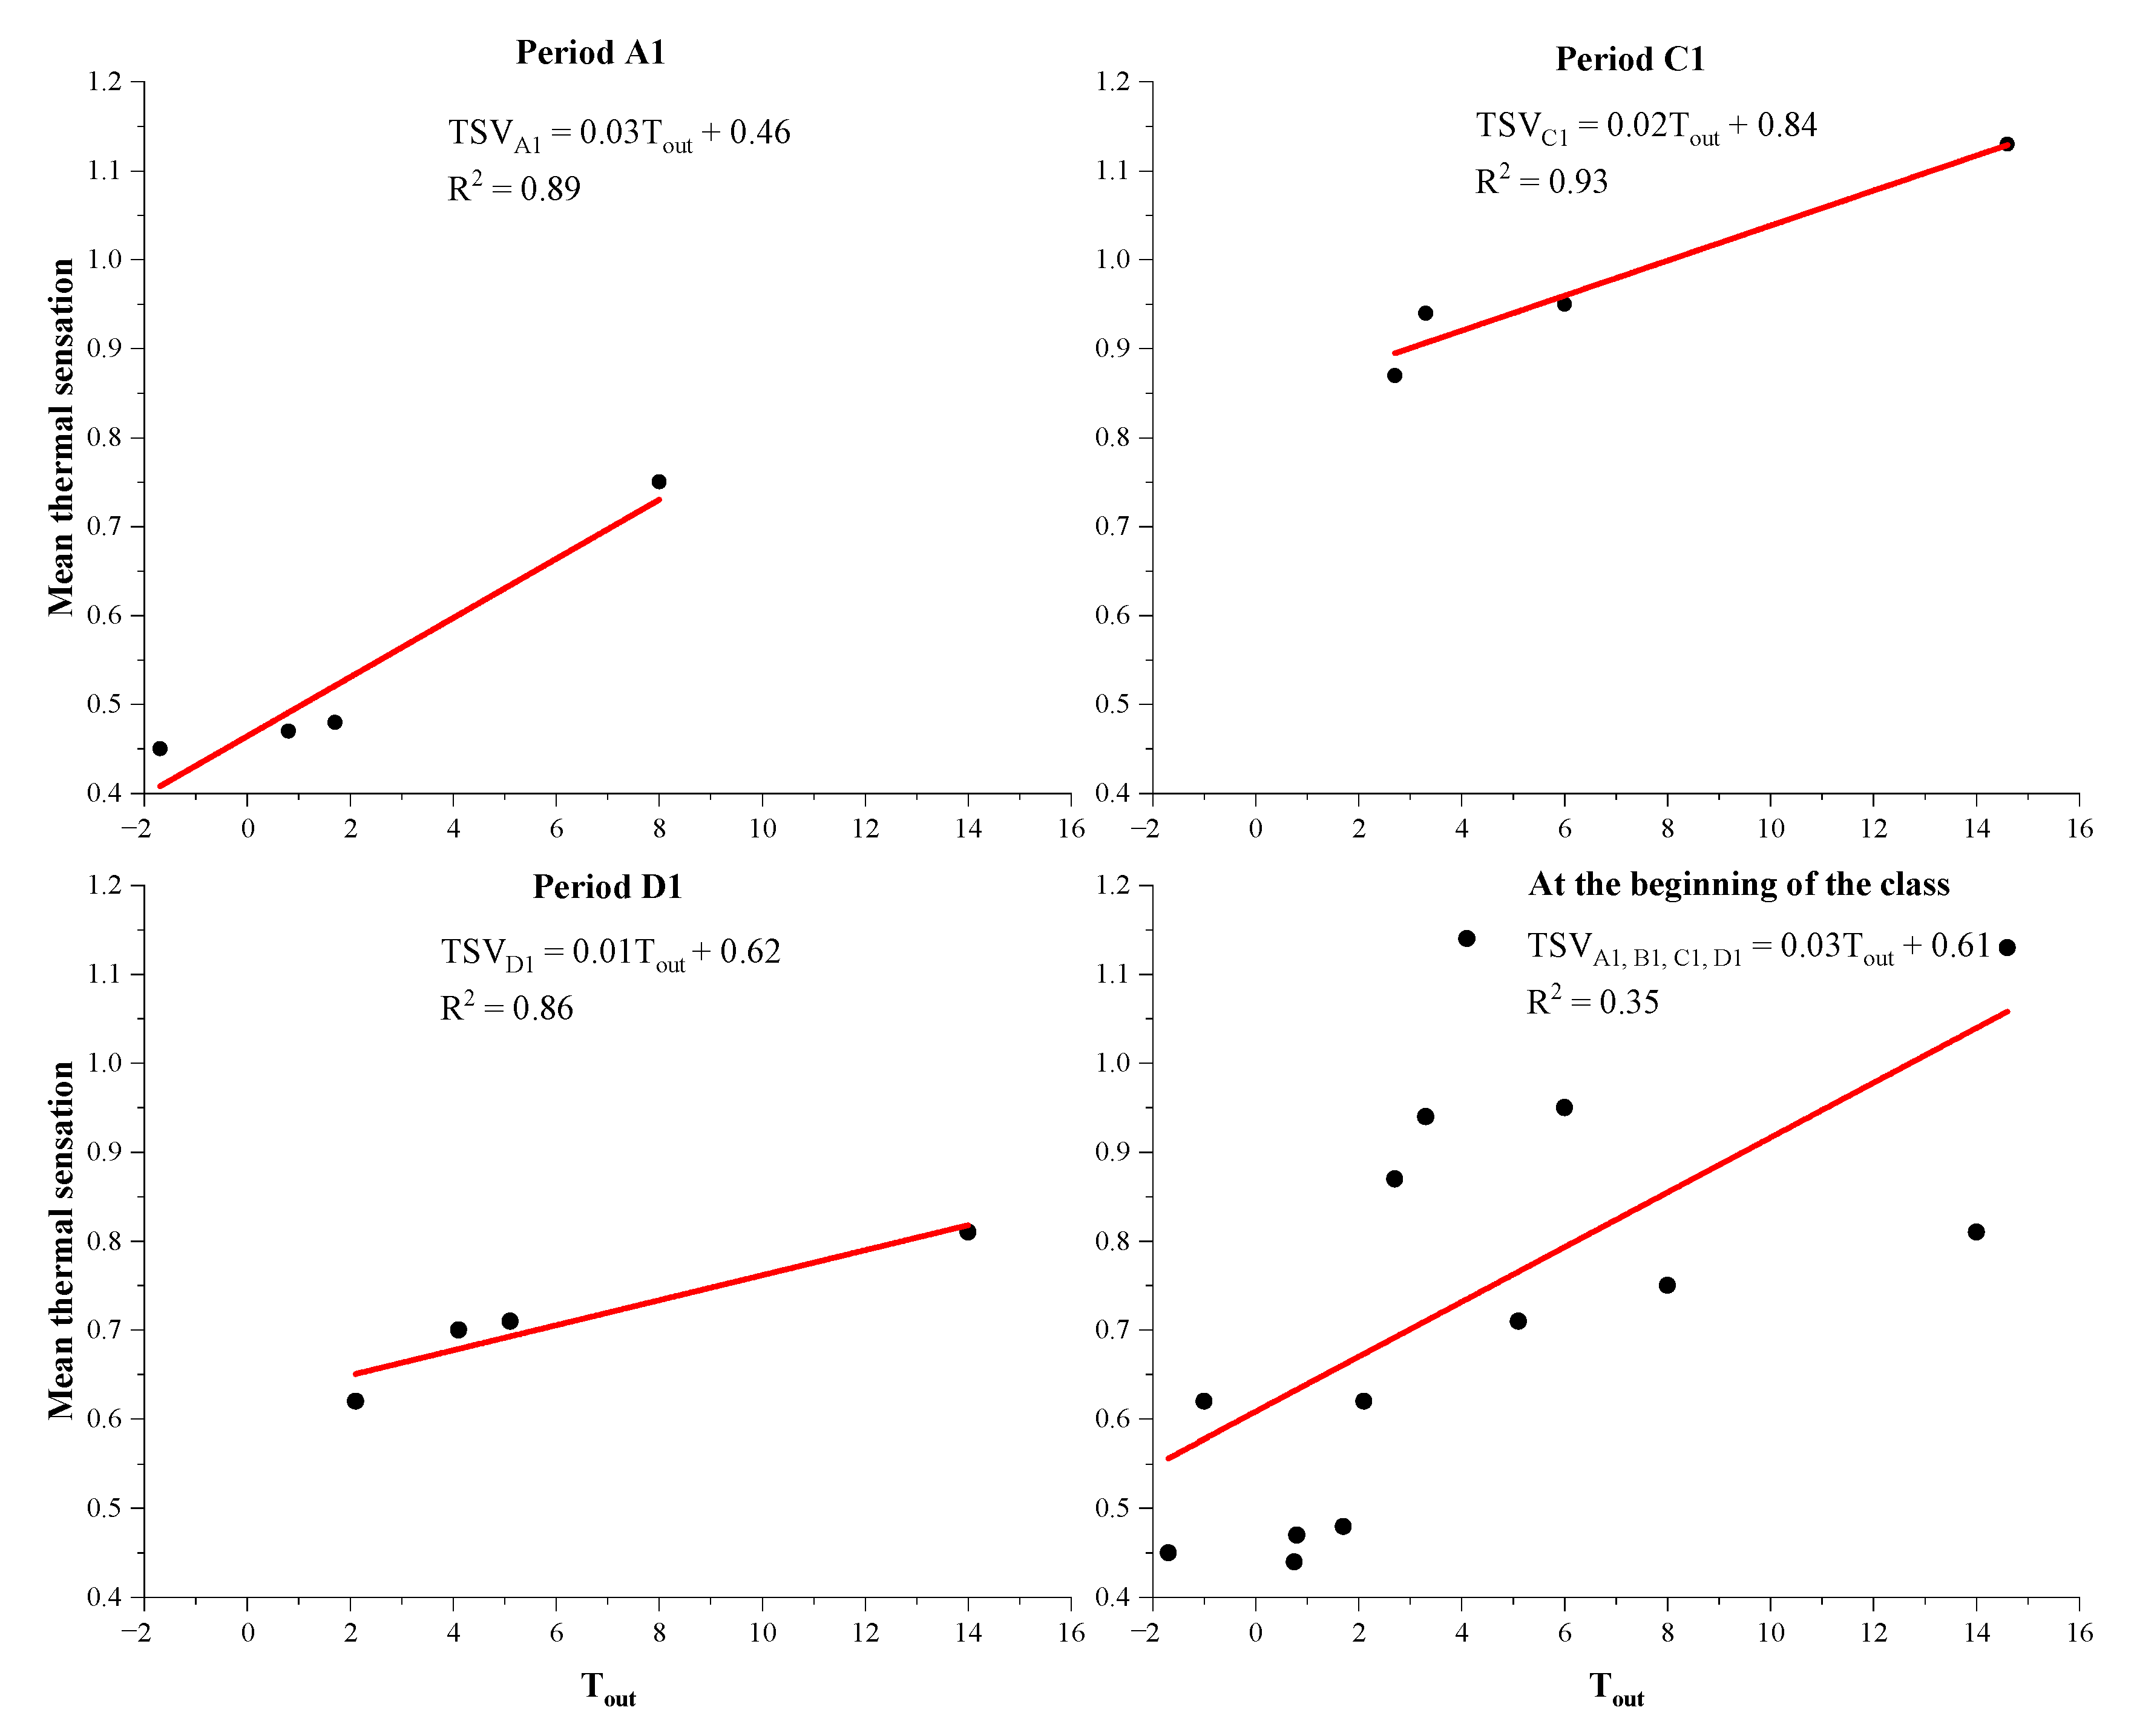
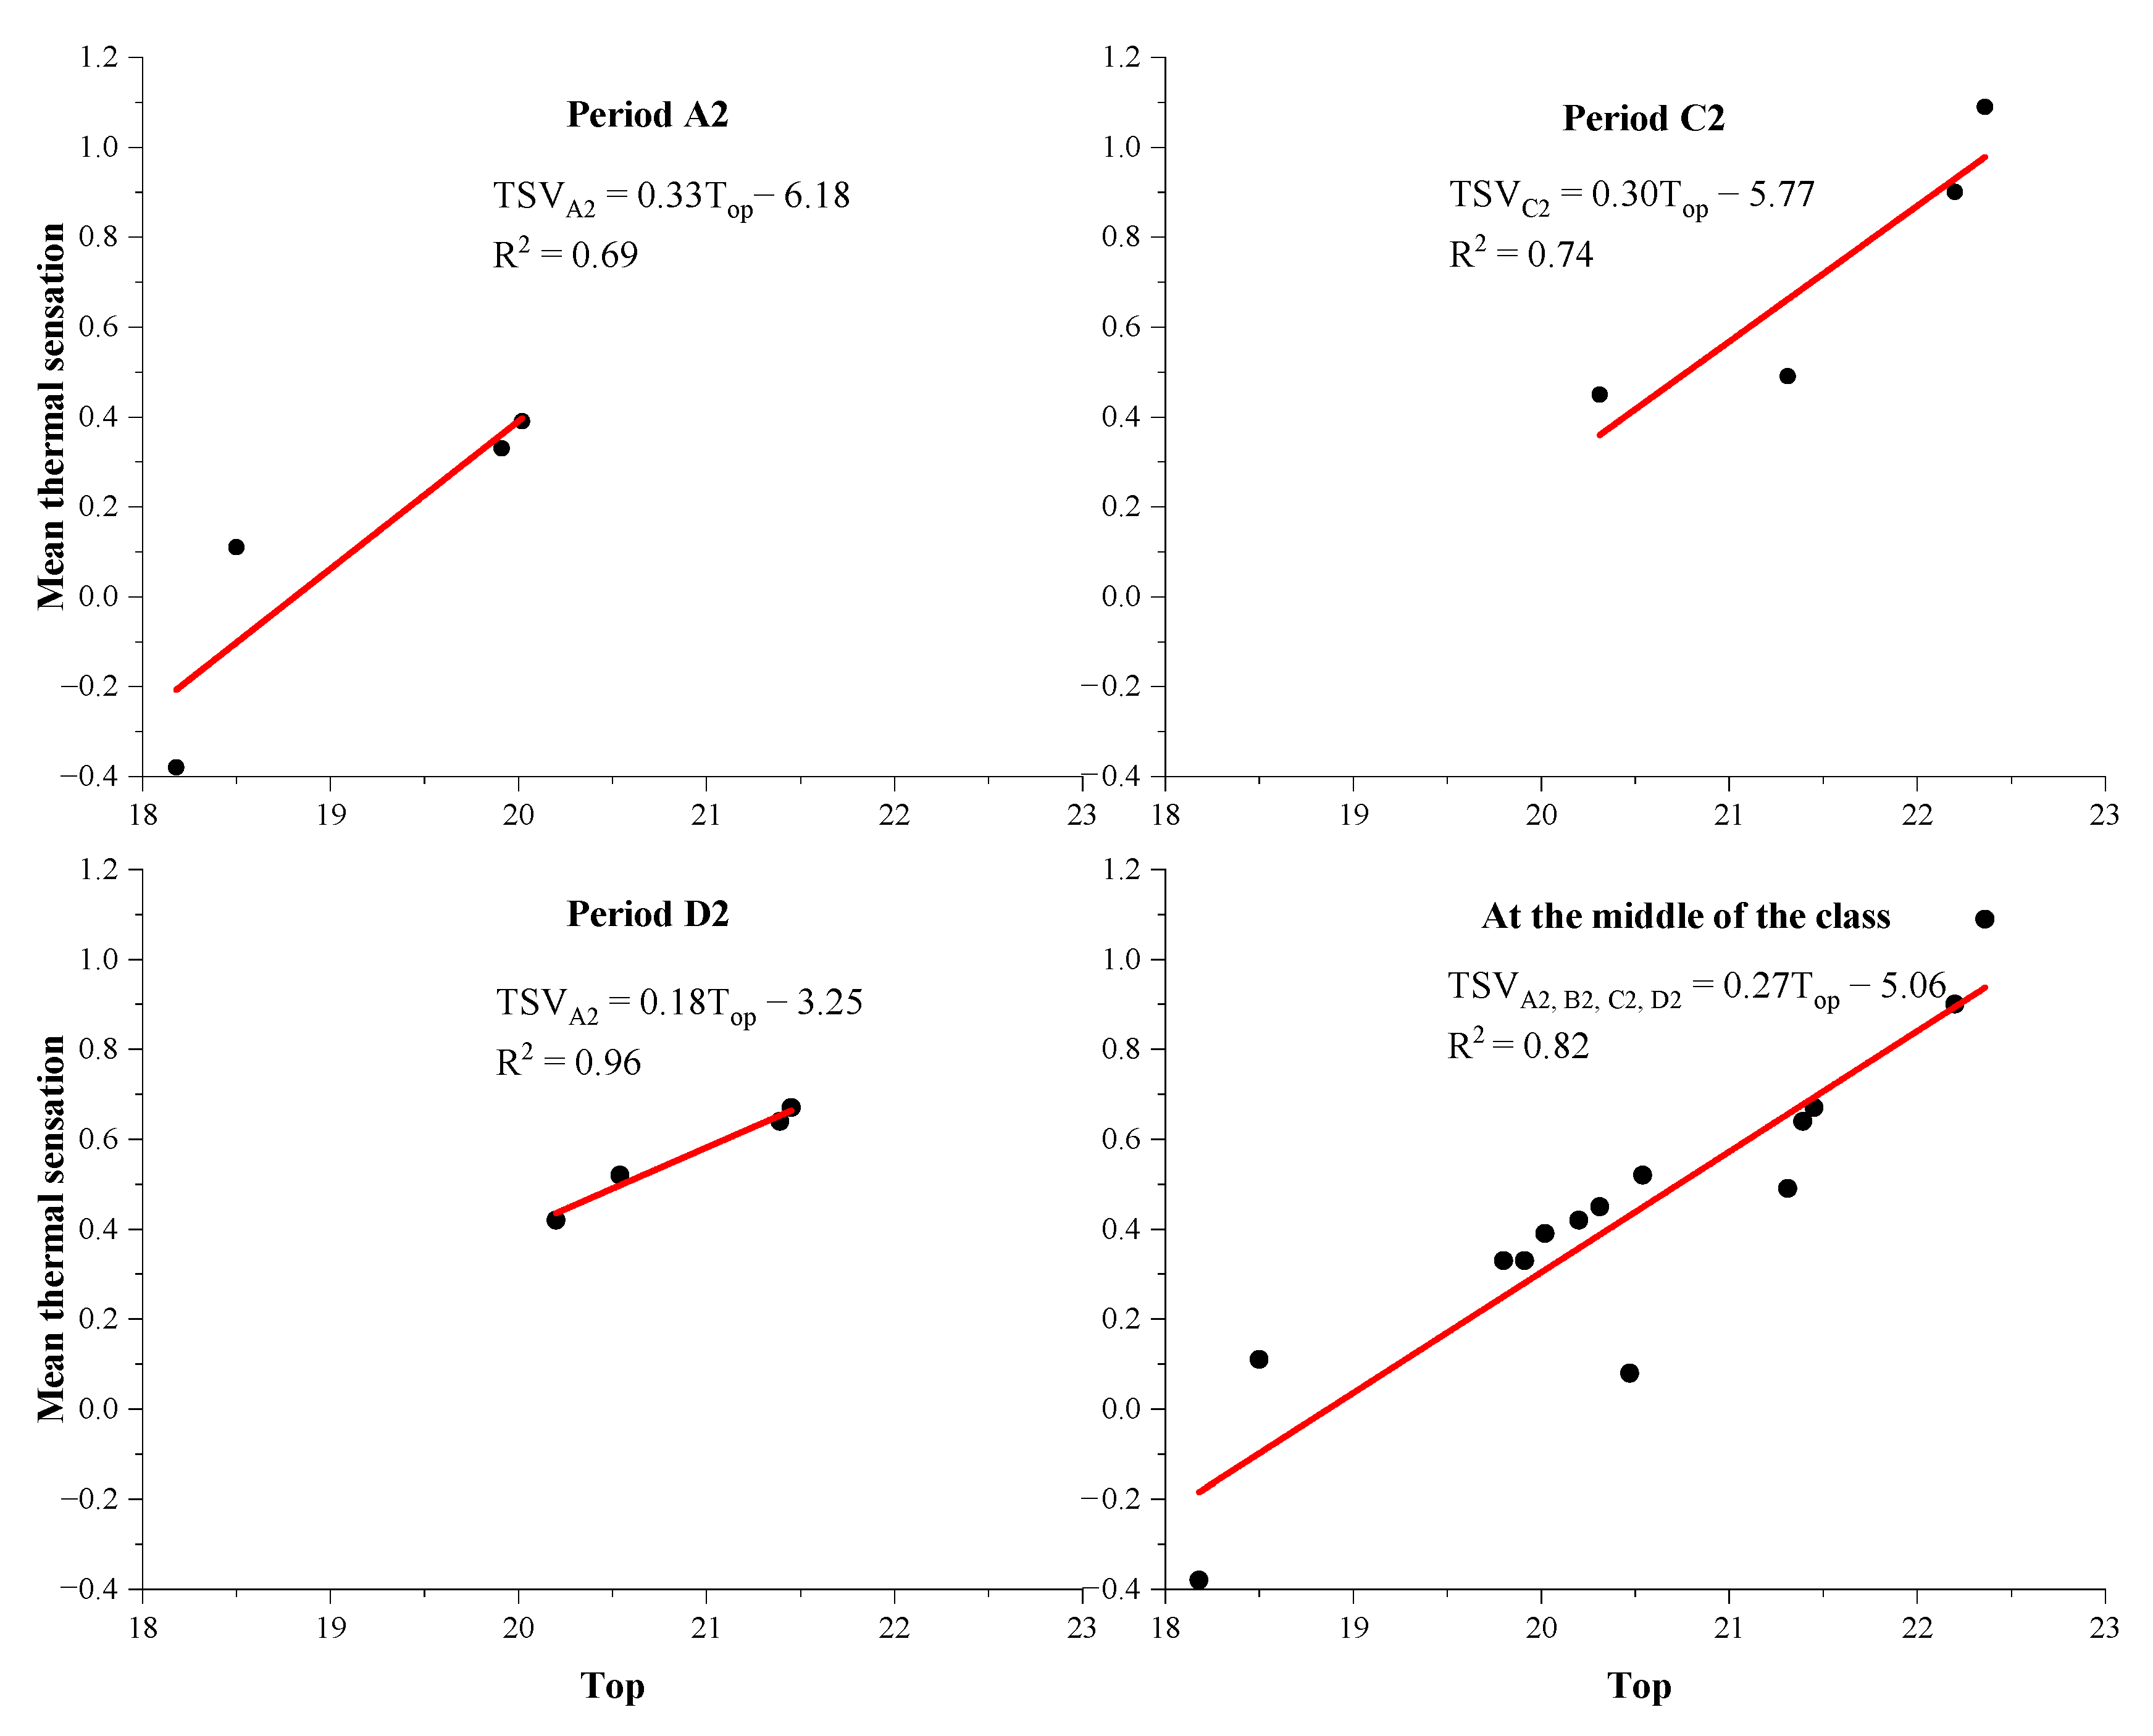
3.4.1. Outdoor Temperature and Indoor Operating Temperature

At the start of the class, there was a significant positive correlation between TSV and Tout (Table 9). In the middle of the class, the correlation between TSV and Tout became weak. Figure 11 presents the relationship between TSV and Tout during periods A1, C1, and D1. Figure 11 shows that the slope of the regression curve is very small—that is, although there was a positive correlation between TSV and Tout, the sensitivity of the students’ thermal sensation to outdoor temperature was poor. Compared with period D1, the students were more sensitive to changes in outdoor temperature in periods A1 and C1. In period D1, most students moved between different rooms in the same building, but in periods A1 and C1, most students transitioned from outdoors to indoors. Therefore, in periods A1 and C1, the thermal sensation of the students was more sensitive to outdoor temperature changes. In addition, the large temperature difference between indoors and outdoors in the morning also significantly affected the students’ thermal sensation. Studies have shown that a temperature difference of more than 12 °C can cause thermal shock to the human body. On Day 2, Day 3, and Day 4, the temperature difference between indoors and outdoors was above 15 °C. Therefore, the transition from outdoors to indoors had a strong impact on the thermal sensation of the students.
At the beginning of the class, there was no significant correlation between TSV and Top. As the class progressed, the correlation between TSV and Top gradually became apparent (Table 9). Figure 12 presents the relationship between TSV and Top during periods A2, C2, and D2. During periods A2, C2, and D2, the student’s thermal neutral temperatures were 18.7, 19.2, and 18.1 °C, respectively. The student’s mean thermal neutral temperature during class was 18.74 °C. In general, at any time of the day, when the students entered the classroom, the outdoor temperature affected the students’ thermal sensation. If the students had been in the classroom for a while, the influence of outdoor temperature on the students’ thermal sensation weakened. At the same time, the indoor operating temperature gradually affected the students’ thermal sensation.
In order to improve the thermal comfort of the students, the thermal environment of the classroom should be dynamically adjusted. For example, the indoor temperature should be increased gradually as the class progresses. In addition, the flow of indoor air should be strengthened to make the temperature of each area in the room more uniform. At the beginning of the class, in order to enable the students to adapt to the indoor thermal environment more quickly, a few minutes should be reserved for the students to adopt adaptive behaviors.

3.4.2. The Gender Influence

Owing to the physiological differences between males and females, gender may have an impact on individual thermal sensation [47,48,49]. At the beginning of the class, there was no significant difference in the thermal sensation between males and females (TSVA1: p = 0.20, TSVB1: p = 0.81, TSVC1: p = 0.51, TSVD1: p = 0.05). At the beginning of the class, the mean TSVs of males and females were 0.69 (SD = 1.04) and 0.56 (SD = 0.97), respectively. In periods A2, B2, C2, and D2, there was a significant difference between the thermal sensation of males and females (TSVA2: p = 0.04, TSVB2: p = 0.05, TSVC2: p = 0.05, TSVD2: p < 0.01,), and the mean TSV value of females was lower than that of males. In the afternoon class, the difference in TSV between males and females was more obvious.
These results indicate that the influence of gender on the students’ thermal sensation gradually appeared as the class progressed. This was likely because of the influence of preclass activities, as there was no significant difference in the metabolic rate between males and females at the start of the class. Thus, the effect of gender on TSV was not obvious. In the middle of the class, the students could be regarded as being in a steady-state environment. Therefore, as the class progressed, owing to the physiological differences between males and females, gender differences had a significant impact on the respondents’ TSV.

3.4.3. Food Consumption

In periods A1 and C1, the proportion of the students who had eaten food within 20 min before class was higher; in periods B1 and D1, more than 50% of the students had not eaten food within 20 min before class (Table 10). Food consumption did not significantly affect the students’ thermal sensation (Table 11). However, at the beginning of the class, food consumption significantly affected the students’ thermal preferences (p = 0.01). The students who did not consume food expected a greater degree of indoor warming than those who consumed food. As the class progressed, food consumption did not significantly affect the students’ thermal preferences. In order to ensure the robustness of the results, this study retested the influencing factors of food consumption in the same dataset of preclass activities, and the results obtained do not show any difference from the above results.
In periods A1, B1, and D1, food consumption significantly affected the students’ thermal preferences (TPVA1: p = 0.01, TPVB1: p = 0.04, TPVD1: p = 0.04). Compared with periods B1 and D1, in period A1, there was a greater difference between the TSV values of the students who did not consume food and those of the students who consumed food. However, this phenomenon was not observed in period C1 (TPVC1: p = 0.43), because in period C1, all the students had eaten. Before the classes in periods A1 and C1, it was breakfast and lunchtime, respectively. However, in period A1, more than 20% of the students did not eat before class because of waking up late. Therefore, in period A1, most students reflected that the comfort level was low and had a stronger desire for higher indoor temperatures. In order to improve the thermal comfort level of the students in period A1, incentive measures should be taken to urge the students to get up early.

3.4.4. Preclass Activities

To investigate whether there was a significant difference in TSV between the group of students with and without a class in the previous period, during periods B1 and D1, the students were asked to answer whether they had a class in the previous period. In periods B1 and D1, 75.64% and 78.92% of the participants answered “Yes”, respectively (Table 10). In period B1, there was a significant difference in the TSV values between the student groups with and without a class in the previous period (p = 0.01). This may be due to the difference in the degree of thermal environmental change caused by the outdoor–indoor and indoor–indoor transitions; therefore, the thermal sensations of the students may be different. The TSV value of the student group without a class from the previous period was significantly higher than that of the student group with a class from the previous period. The above phenomenon could also be observed in period D1; however, the difference was small. The possible reason for this was that compared with period B1, the temperature difference between indoor and outdoor was smaller in period D1.
To understand the impact of the students’ activities in the 20 min before the class on the students’ thermal sensation, the students were asked to answer whether their main activity status in the 20 min before class was rest, work, or sports during periods A1, B1, C1, and D1. For the students who had a class in the previous period, their activity status was considered as work. At any time, the main activity state before class had no significant effect on the students’ thermal sensation (TSVA1: p = 0.98, TSVB1: p = 0.82, TSVC1: p = 0.77, TSVD1: p = 0.81). Combining the data of periods A1, B1, C1, and D1, it was observed that the main activity state before class had a significant impact on the students’ thermal preferences (p = 0.04, TPVresting vs. TPVworking: p = 0.02, TPVresting vs. TPVsporting: p = 0.03, TPVworking vs. TPVsporting: p = 0.88). At the start of the class, the students whose preclass activity status was resting had a stronger desire to increase the indoor temperature than those whose status was work or sports. In periods A1 and C1, the main activity state before class had a significant impact on the students’ thermal comfort level (p = 0.04, TCVresting vs. TCVworking: p = 0.20, TCVresting vs. TCVsporting: p = 0.02, TCVworking vs. TCVsporting: p = 0.59). The students whose preclass activity status was resting had a lower level of comfort than those whose activity status was sports. This phenomenon was not observed in periods B1 and D1. This may be because in periods B1 and D1, the number of people whose preclass activity status was rest and sports were small.
In summary, preclass activity levels have a significant impact on students’ thermal preference and thermal comfort in the classroom. Activity levels that are too high or too low can cause discomfort for students. For example, before the first class in the morning, some students’ activity state was rest, and they did not eat breakfast, which can cause a low metabolic rate. Therefore, at the beginning of the first class in the morning, some students felt that the room was cold. However, when students have strenuous activities before class (e.g., running, playing basketball), they can feel that the room is hot. Because each student has a different preclass activity level, it is difficult to create a thermal environment that everyone is satisfied with. Therefore, managers should guide students to carry out appropriate preclass activities.
Research by Mishra et al. showed that air temperature decreases as one gets farther from the radiator [5]. Therefore, it is possible to meet the thermal preferences of different students by arranging the seats of the students reasonably. For example, it is recommended that students whose preclass activity state is resting sit close to the radiator. In addition, considering the activity status of students before class, the room temperature should dynamically be adjusted at the start of the class. If most students were in a resting state in the previous period (e.g., lunch break), the indoor temperature of the classroom that the students move to in the next period should be increased in advance.

3.5. Adaptive Behaviors

Extensive research has shown that adaptive behavior can significantly affect the thermal comfort of occupants [50,51,52]. The thermal adaptive behaviors of university students are less restricted than those of primary and secondary school students [53,54]. In this study, the participants were asked to answer which adaptation behaviors they would take when they felt uncomfortable. The results show that during class, fewer students used energy-consuming equipment (e.g., radiators and fans) to obtain greater comfort, and most of them adopted non-energy-consuming behaviors (e.g., opening/closing windows or doors and adding/reducing clothing) to improve the surrounding thermal environment (Table 12). This can be partly attributed to the fact that the adjusted buttons of the radiators and fans were close to the window, and therefore, they were generally controlled by the students in the seat near the window, and the chances of the other students being able to control the adjusted buttons were lower. Therefore, to attain a good indoor thermal environment during class, there is an urgent requirement for equipment managers to manage indoor energy-consuming equipment uniformly and intelligently.
In the classroom, students can improve their comfort level by adopting thermal adaptive behaviors. However, taking actions (e.g., using fans, increasing the temperature of the radiator) to improve the surrounding thermal environment can also increase the energy consumption of the building. In the survey, it was also found that students sometimes have inappropriate thermal adaptive behaviors. For example, some students often take off their thick coats while increasing the temperature of the radiator. In addition, owing to the differences in the thermal perception of each occupant, in public places (e.g., classroom), occupants changing the indoor environment may cause thermal discomfort for others. Therefore, classroom managers should uniformly set the temperature of the radiator in the classroom based on the thermal comfort range of most students. At the same time, students should be guided to adopt appropriate thermal adaptation behaviors.
In the heating season, the students’ clothing insulation value was high (above 1.30 clo), and the clothing insulation value in the morning was slightly higher than that in the afternoon (except on Day 2) (Figure 13). At the start of the class, TSV did not significantly correlate with the clothing value (TSVA1: p = 0.19, TSVB1: p = 0.23, TSVC1: p = 0.71, TSVD1: p = 0.09). The possible reason for this phenomenon is that students have almost the same level of insulation value. Table 12 shows that adding or reducing clothes was one of the main adaptive behaviors of university students. In questionnaire II, the participants were asked to answer whether they adjusted their clothes to improve their thermal comfort. The results show that the proportion of unadjusted clothes (84.26%) was relatively large, while the proportion of added clothes (13.77%) or reduced clothes (1.97%) was relatively small. The main reason for this was that the students usually wore thick cotton jackets in the heating season, and taking off their jacket would significantly reduce their comfort. Therefore, when the students felt hot, most chose to unbutton or unzip their clothes. During class, the students usually did not bring more clothes, so when they felt cold, the behavior of adding clothes did not appear obvious. In periods A2, B2, C2, and D2, the total frequency of adding and reducing clothes gradually increased (Figure 14). In the morning class, TSV did not differ significantly between the students who did and did not adjust (namely, add or reduce) their clothing (TSVA2: p = 0.23, TSVB2: p = 0.23). However, in the afternoon class, the behavior of adjusting clothes significantly affected the students’ thermal sensation (TSVC2: p = 0.03, TSVD2: p = 0.04). Moreover, in the middle of the class, the thermal comfort of the students who adjusted their clothes was significantly improved compared with that at the start of the class. The students who did not adjust their clothes had lower comfort levels (TCVA2, B2, C2, and D2 = 0.30), and the main reason for discomfort was cold hands and feet. Therefore, in order to encourage students to improve their comfort by adjusting clothes, hangers should be added in the classroom to facilitate the placement of students’ surplus clothes. In addition, in order to improve local thermal comfort, students should be given the ability to control the local thermal environment, such as by installing electric heating equipment at each seat.

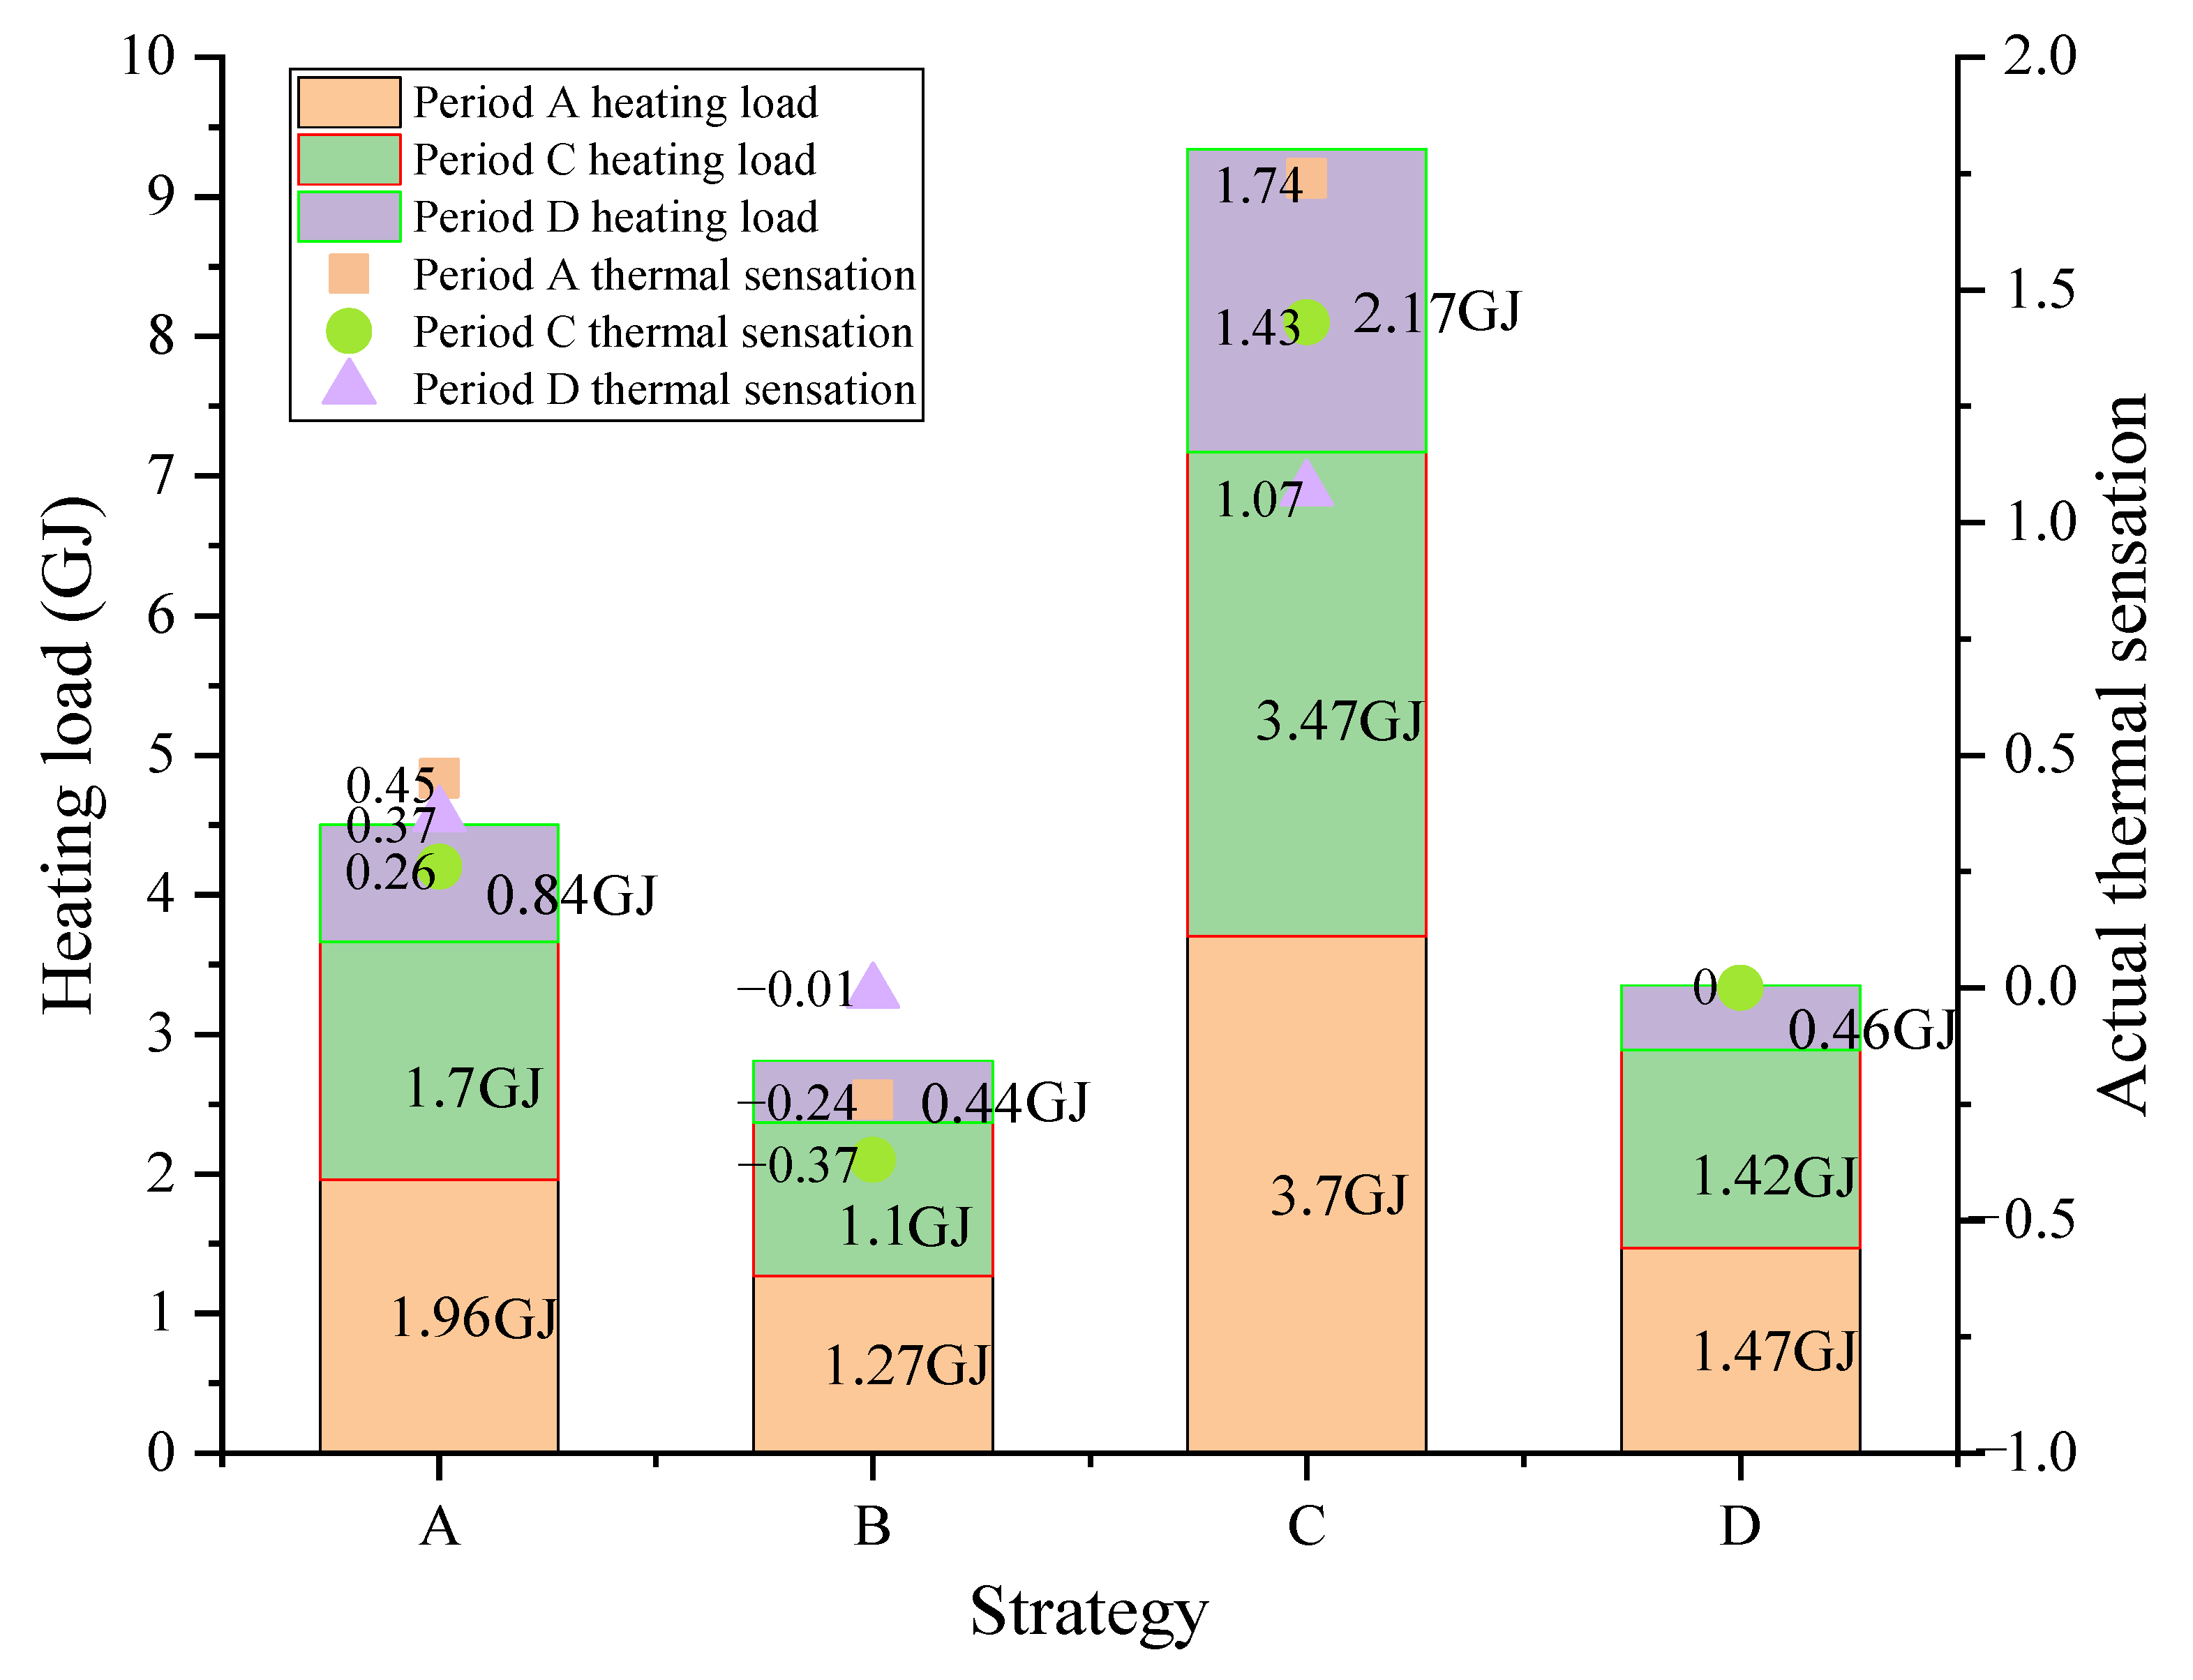
3.6. Energy-Saving Potential

The time-varying characteristics of students’ thermal sensation should be carefully considered to determine the energy-saving potential of teaching buildings. To analyze the energy-saving potential of the classroom in this case, the following four strategies were generated.
Strategy A: an actual average indoor temperature of 20.1 °C in the classroom in the heating season was used as the indoor design temperature during class. Strategy B: The lower limit of the indoor comfortable temperature (i.e., 18 °C) in the heating season in cold areas specified in the Design Code for Heating Ventilation and Air Conditioning of Civil Buildings in China was used as the indoor design temperature during class. Strategy C: The upper limit of the indoor comfortable temperature (i.e., 24 °C) in the heating season in cold areas specified in the Design Code for Heating Ventilation and Air Conditioning of Civil Buildings in China was used as the indoor design temperature during class. Strategy D: The thermal neutral temperatures of periods A, C, and D (i.e., 18.7, 19.2, and 18.1 °C) were used as the indoor design temperature during class.
It was assumed that the classroom was only heated in periods A, B, C, and D. EnergyPlus [55] was used to calculate the total heating load for the four strategies in November and December. According to Figure 12, the actual thermal sensation of students under different strategies can be calculated. The results are shown in Figure 15. Compared with strategies A and C, strategy D achieved 25.6% and 64.1% energy savings, respectively. In strategy D, the students’ real thermal sensation was neutral, while in strategies A and C, the students’ real thermal sensation was slimly warm. Although strategy B had the lowest heating load, it was found that the actual thermal sensation of the students in strategy B was slightly cool—that is, strategy B cannot guarantee the thermal comfort of the students.
In addition, referring to the previously published study conducted by the authors [56], the energy savings of teaching buildings can be further achieved by course timetable optimization. The implementation process was divided into the following four steps: Step A: according to the time-varying characteristics of students’ thermal sensation, the thermal neutral temperature of students in different classes over the course of a day is calculated. Step B: the energy consumption calculation model is established in EnergyPlus [55], in which the thermal neutral temperature of students in different classes over the course of a day is used as the set temperature of the classroom to calculate the heating load of the teaching building. Step C: the course timetable optimization model is established in Matlab [57] and solved by a genetic algorithm. Step D: the cosimulation model is established and the building controls’ virtual test bed platform [58] is used to couple EnergyPlus and Matlab. An energy consumption calculation model, course timetable optimization model, and cosimulation model can be found in the authors’ previous study [56]. If the time-varying characteristics of students’ thermal sensations can be taken into account when optimizing the course timetable, the courses would be intensively arranged in periods when students’ thermal neutral temperature is low. Thus, the total heating load of the teaching building can be reduced.

3.7. Comparison with Previous Study

A large number of studies [5,24,59] demonstrated that students’ thermal perception changed significantly throughout the duration of a class. The same conclusion was also obtained in this study. In addition, this study found that the students’ thermal perception also had significant differences in different classes over the course of the day. The spatial transition from outdoor to indoor is one of the reasons for the changes in the students’ thermal perception [5]. Previous studies [5,24,60] have shown that at the beginning of the class, perception varies primarily depending on the outdoor environment (such as outdoor temperature). This study demonstrated that at the start of the first class in the morning and afternoon, the thermal sensation of the students had the highest sensitivity to outdoor temperature changes. As the class progressed, the students gradually adapted to their classroom environment, and thus, their thermal perception changed [5].
Differences in previous activities (e.g., food consumption and activity status) also have an important impact on changes in students’ thermal perception [24]. A study by Jowkar et al. [11] showed that food consumption significantly affected students’ thermal sensation. However, Mishra et al. [5] obtained the opposite conclusion. This study found that, at the beginning of the class, food consumption significantly affected the students’ thermal preferences rather than thermal sensation. A study by Aparicio-Ruiz et al. [61] showed that, owing to the influence of outdoor temperature, there would be significant differences in the activity levels of students in the morning and afternoon. This study found that there were significant differences in the activity levels of students before different classes. This may be caused by the schedule of the course. The correlation between preclass activity status and TSV was not found in this study. A study by Mishra et al. [5] supported this view. In addition, this study confirmed that the main activity state before class had a significant impact on the students’ thermal preferences and comfort level.
In order to achieve a good comfort level in different periods, students often adopt adaptive behaviors. Studies [11,38,59] showed that individual adaptive behaviors, such as adjusting clothes, were common adaptive behaviors among university students in classrooms. However, this study found that owing to the inconvenience of adjusting clothes, the proportion of students who adjusted their clothes during the class was relatively low. Studies by Talukdar et al. [30] and Gou et al. [62] showed that the value of the student’s clothes decreases as the operating temperature rises. In this study, the temperature in the afternoon was higher than that in the morning, the clothing value of the students in the afternoon was slightly lower, and the probability of reducing clothes in the afternoon was greater than that in the morning. In addition, the behavior of adjusting clothes in the afternoon had a more significant impact on the students’ thermal sensation.
The adaptability of students to the local climate contributes to building energy conservation [2,59,60]. The relevant standards in China consider the adaptability of the occupant and provide the range of design temperatures in the classroom during the heating season. However, they do not explain how one should choose the optimal design temperature under different environmental conditions. This study obtained the optimal design temperature of classrooms in the Xi’an area located at the foot of the Qinling Mountains through a field survey. In addition, this study confirmed that the optimal design temperature of classrooms is different in different periods. Compared with the current classroom heating strategy, the heating strategy that takes into account the optimal indoor design temperature in different periods can achieve energy savings of 25.6%.

4. Conclusions

The purpose of this study was to explore the time-varying thermal perceptions of university students in the heating season and their influencing factors. A 4-day on-site monitoring and subjective questionnaire survey was conducted at Xi’an University of Architecture and Technology. A total of 578 students participated in the survey. The following conclusions can be drawn from the statistical and data analysis.
  • The TSV value at the start of the class was significantly higher than that in the middle period of the class (the students’ thermal sensation gradually changed from slightly warm to neutral). The TSV and TPV values in the morning class were significantly lower than those in the afternoon class. The comfort level of the students decreased slightly as the class progressed. Moreover, the comfort level of the students in a warm environment was higher than that in a cool environment.
  • At the start of the first class in the morning and afternoon, the thermal sensation of the students had the highest sensitivity to outdoor temperature changes. As the class progressed, the correlation between TSV and Top gradually became apparent. During periods A2, C2, and D2, the students’ thermal neutral temperatures were 18.7, 19.2, and 18.1 °C, respectively.
  • At the start of the first class in the morning, food consumption had the greatest impact on the students’ thermal preference. At the start of the first class in the morning and afternoon, the students whose preclass activity status was resting had a lower level of comfort than those whose activity status was sports. This phenomenon was not observed in other periods.
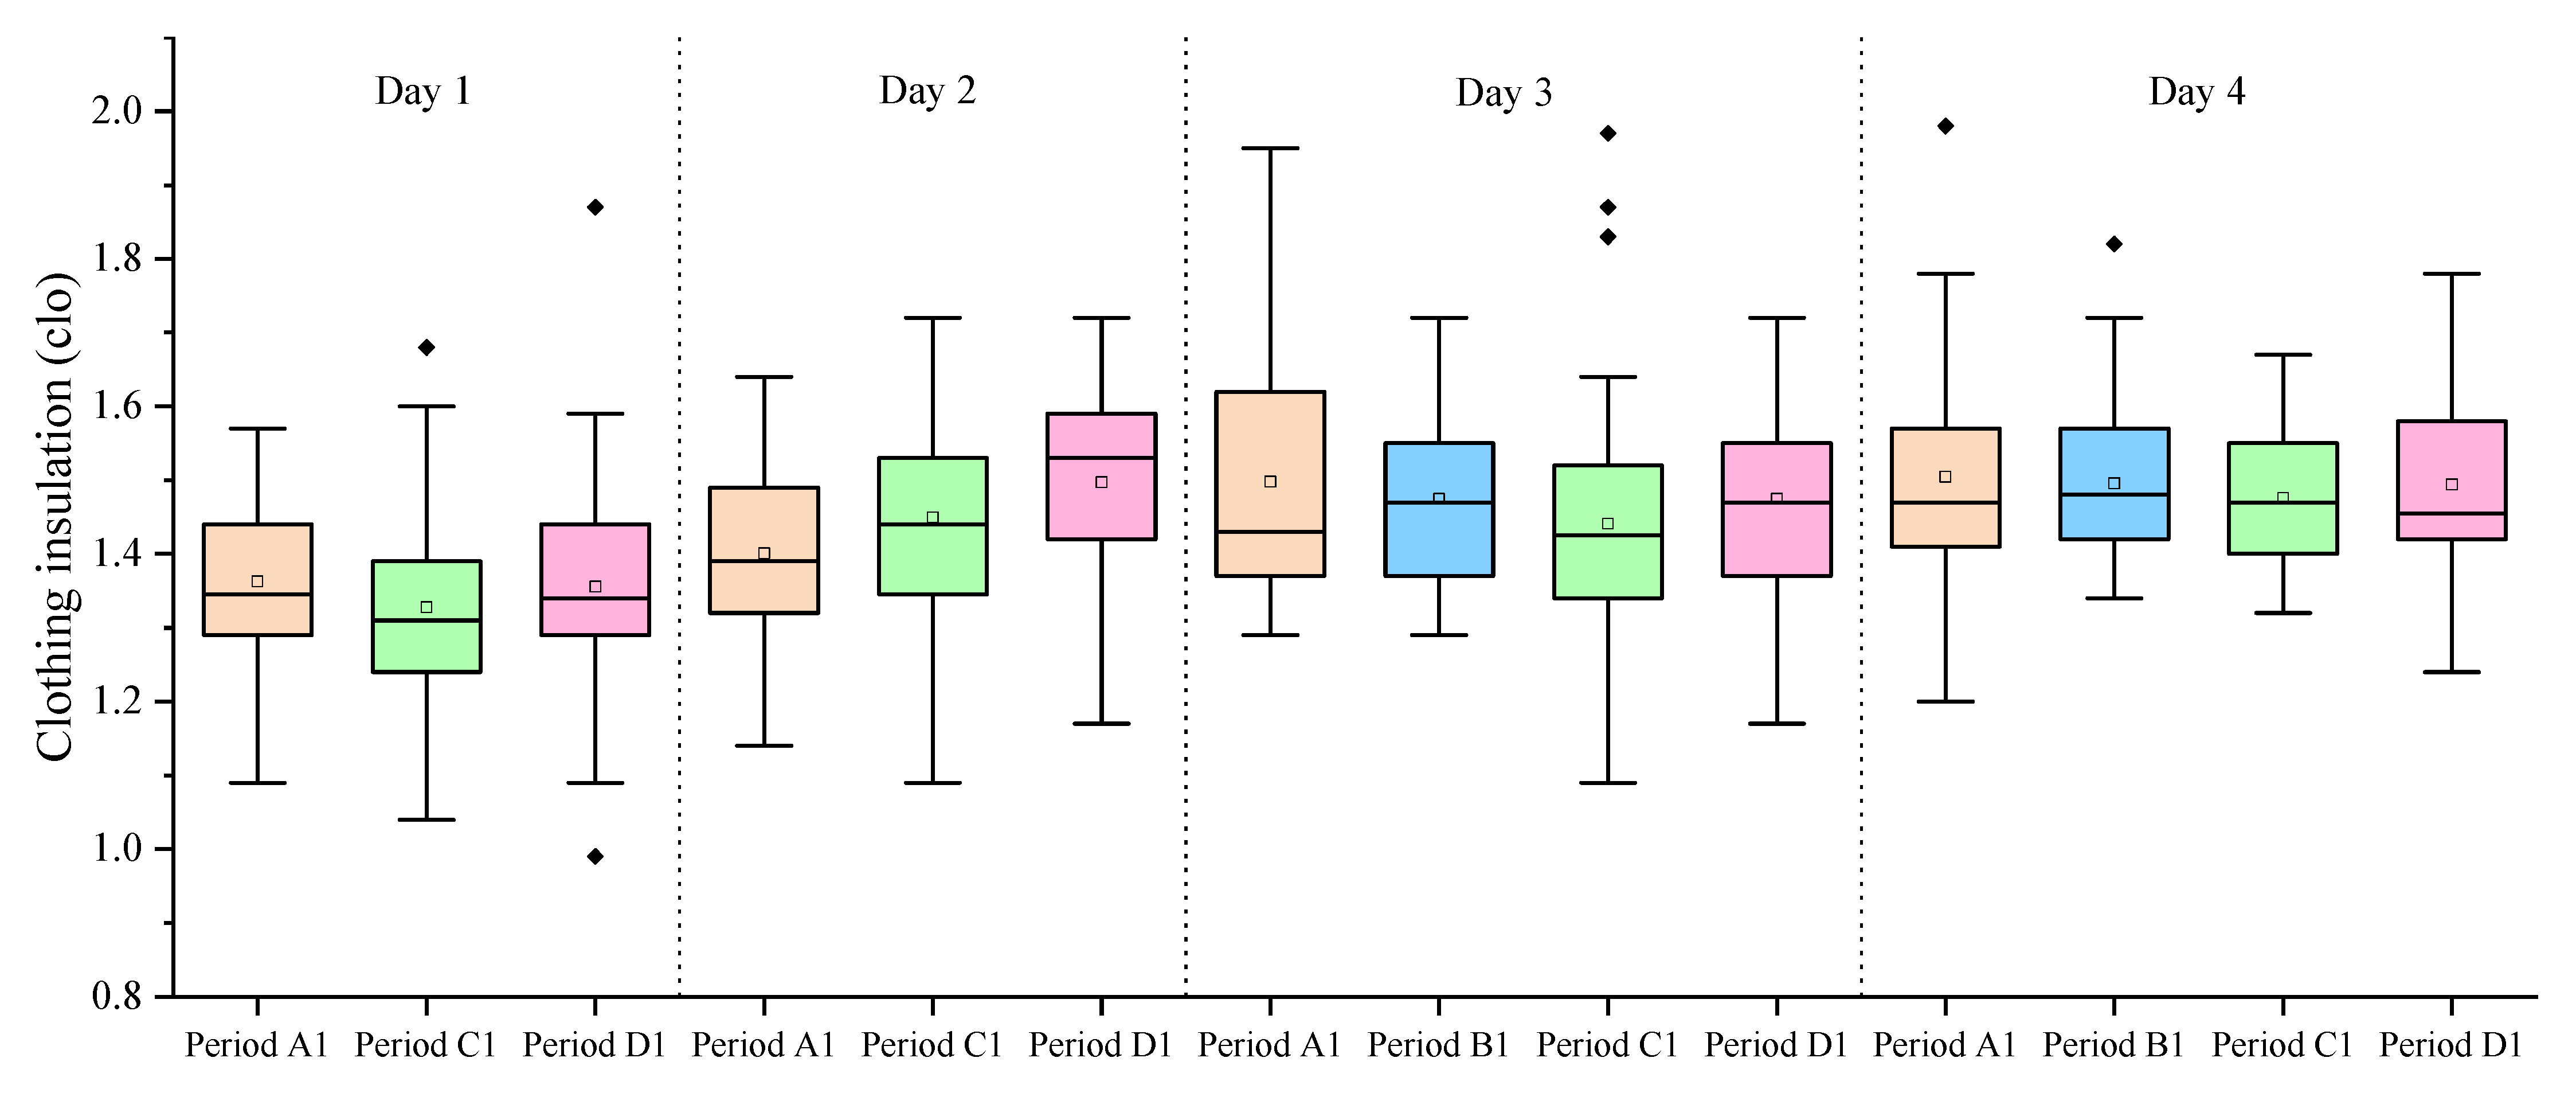
  • The frequency of adjusting clothes in the afternoon was greater than that in the morning. At the start of each class of the day, TSV did not significantly correlate with clothing value. In the morning class, TSV did not differ significantly between the students who did and did not adjust their clothing. However, in the afternoon class, the behavior of adjusting clothes significantly affected the students’ thermal sensation.
  • Compared with the current classroom heating strategy, the heating strategy of dynamically adjusting the indoor set temperature according to the time-varying characteristics of the students can theoretically achieve energy savings of 25.6%.
The results of this study have a reference value for the design of classroom heating systems. First, the indoor temperature should be raised in advance before the classroom is occupied for the first time in a day. The indoor temperature should increase gradually as the class progresses. Second, considering the activity status of students before class, the room temperature should be adjusted at the start of the class. If most students were resting in the previous period (e.g., lunch break), the indoor temperature of the classroom that the students move to in the next period should be increased in advance. In addition, according to the thermal comfort temperature range of most students in different class periods, the temperature of the radiator should be set uniformly and dynamically adjusted.
A study on how to optimize the course timetable to achieve both the energy conservation of teaching buildings and the thermal comfort of university students should be carried out in the future. The limitation of this study is that the number of indoor environmental monitoring points was limited, and the parameters (temperature, flow rate) of the radiator were not monitored, which may cause the monitored value to be lower than the actual value. In addition, the potential energy savings of 25.6% obtained by the simulation in this study are only informative, and were not confirmed by measurement. In a future work, more sensors will be added to monitor the thermal environment in different areas of the classroom. In addition, the findings of this study will be applied to the design of the classroom heating strategy, and the actual energy savings of the teaching building will be obtained through monitoring.

Author Contributions

All authors contributed significantly to this study. Conceptualization, Y.S. and X.L.; methodology, Y.S.; software, Y.S.; validation, H.M.; formal analysis, Y.S.; investigation, Y.S. and H.M.; resources, X.L.; data curation, Y.S.; writing—original draft preparation, Y.S.; writing—review and editing, X.L.; visualization, Y.S.; supervision, X.L.; project administration, X.L.; funding acquisition, X.L. All authors have read and agreed to the published version of the manuscript.

Funding

This research was funded by the National Natural Science Foundation of China, grant number 52008328; Ministry of Science and Technology of the People’s Republic of China, grant number 2018YFD1100202; and Science and Technology Department of Shaanxi Province, China, grant number 2020SF-393, 2018ZDCXL-SF-03-04.

Institutional Review Board Statement

Not applicable.

Informed Consent Statement

Informed consent was obtained from all subjects involved in the study.

Data Availability Statement

All data generated or appearing in this study are available upon request from the corresponding author.

Conflicts of Interest

The authors declare no conflict of interest.

References

  1. Jiang, J.; Wang, D.J.; Liu, Y.F.; Xu, Y.C.; Liu, J.P. A study on pupils’ learning performance and thermal comfort of primary schools in China. Build. Environ. 2018, 134, 102–113. [Google Scholar] [CrossRef]
  2. Jing, S.L.; Lei, Y.G.; Wang, H.J.; Song, C.F.; Yan, X.F. Thermal comfort and energy-saving potential in university classrooms during the heating season. Energy Build. 2019, 202, 109390. [Google Scholar] [CrossRef]
  3. Luo, X.; Liu, Y.F.; Liu, J.P.; Liu, X.J. Optimal design and cost allocation of a distributed energy resource (DER) system with district energy networks: A case study of an isolated island in the South China Sea. Sustain. Cities Soc. 2019, 51, 101726. [Google Scholar] [CrossRef]
  4. Zomorodian, Z.S.; Tahsildoost, M.; Hafezi, M. Thermal comfort in educational buildings: A review article. Renew. Sustain. Energy Rev. 2016, 59, 895–906. [Google Scholar] [CrossRef]
  5. Mishra, A.K.; Derks, M.T.H.; Kooi, L.; Loomans, M.G.L.C.; Kort, H.S.M. Analysing thermal comfort perception of students through the class hour, during heating season, in a university classroom. Build. Environ. 2017, 125, 464–474. [Google Scholar] [CrossRef]
  6. BS EN ISO 7730-2013; Ergonomics of the Thermal Environment (Analytical Determination and Interpretation of Thermal Comfort Using Calculation of the PMV and PPD Indices and Local Thermal Comfort Criteria). International Organization for Standardization: Geneva, Switzerland, 2013.
  7. Bs En 15251-2007; Indoor Environmental Input Parameters for Design and Indoor Air Quality, Thermal Environment, Lighting and Acoustics. British Standards Institution: London, UK, 2007; pp. 1–52.
  8. ANSI/ASHRAE Standard 55-2017; Thermal Environment Conditions for Human Occupancy. American Society of Heating, Refrigerating and Air-Conditioning Engineers: Atlanta, GA, USA, 2017.
  9. Cheung, T.; Schiavon, S.; Parkinson, T.; Li, P.X.; Brager, G. Analysis of the accuracy on PMV—PPD model using the ASHRAE Global Thermal Comfort Database II. Build. Environ. 2019, 153, 205–217. [Google Scholar] [CrossRef] [Green Version]
  10. Jowkar, M.; Rijal, H.B.; Montazami, A.; Brusey, J.; Temeljotov-Salaj, A. The influence of acclimatization, age and gender-related differences on thermal perception in university buildings: Case studies in Scotland and England. Build. Environ. 2020, 179, 106933. [Google Scholar] [CrossRef]
  11. Jowkar, M.; Rijal, H.B.; Brusey, J.; Montazami, A.; Carlucci, S.; Lansdown, T.C. Comfort temperature and preferred adaptive behaviour in various classroom types in the UK higher learning environments. Energy Build. 2020, 211, 109814. [Google Scholar] [CrossRef]
  12. Jiang, J.; Wang, D.J.; Liu, Y.F.; Di, Y.H.; Liu, J.P. A field study of adaptive thermal comfort in primary and secondary school classrooms during winter season in Northwest China. Build. Environ. 2020, 175, 106802. [Google Scholar] [CrossRef]
  13. Ma, S.N.; Guo, S.Y.; Zheng, D.Q.; Chang, S.Y.; Zhang, X.L. Roadmap towards clean and low carbon heating to 2035: A provincial analysis in northern China. Energy 2021, 225, 120164. [Google Scholar] [CrossRef]
  14. Liu, Y.F.; Wang, Y.X.; Luo, X. Design and Operation Optimization of Distributed Solar Energy System Based on Dynamic Operation Strategy. Energies 2021, 14, 69. [Google Scholar] [CrossRef]
  15. Luo, X.; Liu, J.P.; Liu, Y.F.; Liu, X.J. Bi-level optimization of design, operation, and subsidies for standalone solar/diesel multi-generation energy systems. Build. Environ. 2019, 48, 101592. [Google Scholar] [CrossRef]
  16. Luo, X.; Xia, J.W.; Liu, Y.F. Extraction of dynamic operation strategy for standalone solar-based multi-energy systems: A method based on decision tree algorithm. Sustain. Cities Soc. 2021, 70, 102917. [Google Scholar] [CrossRef]
  17. Raj, U.; Li, Z.Q.; Wang, F.M.; Yang, B. A study of thermal comfort enhancement using three energy-efficient personalized heating strategies at two low indoor temperatures. Build. Environ. 2018, 143, 1–14. [Google Scholar] [CrossRef]
  18. Liu, Y.; Zhou, W.H.; Luo, X.; Wang, D.J.; Hu, X.X.; Hu, L. Design and operation optimization of multi-source complementary heating system based on air source heat pump in Tibetan area of Western Sichuan, China. Energy Build. 2021, 242, 110979. [Google Scholar] [CrossRef]
  19. Luo, X.; Liu, Y.F. A multiple-coalition-based energy trading scheme of hierarchical integrated energy systems. Sustain. Cities Soc. 2021, 64, 102518. [Google Scholar] [CrossRef]
  20. Luo, X.; Liu, Y.F.; Feng, P.A.; Gao, Y.; Guo, Z.X. Optimization of a solar-based integrated energy system considering interaction between generation, network, and demand side. Appl. Energy 2021, 294, 116931. [Google Scholar] [CrossRef]
  21. Noda, L.; Lima, A.V.P.; Souza, J.F.; Leder, S.; Quirino, L.M. Thermal and visual comfort of schoolchildren in air-conditioned classrooms in hot and humid climates. Build. Environ. 2020, 182, 107156. [Google Scholar] [CrossRef]
  22. Buonocore, C.; de Vecchi, R.; Scalco, V.; Lamberts, R. Thermal preference and comfort assessment in air-conditioned and naturally-ventilated university classrooms under hot and humid conditions in Brazil. Energy Build. 2020, 211, 109783. [Google Scholar] [CrossRef]
  23. Liu, J.L.; Yang, X.; Jiang, Q.W.; Qiu, J.Y.; Liu, Y.H. Occupants’ thermal comfort and perceived air quality in natural ventilated classrooms during cold days. Build. Environ. 2019, 158, 73–82. [Google Scholar] [CrossRef]
  24. Singh, M.K.; Ooka, R.; Rijal, H.B.; Kumar, S.; Kumar, A.; Mahapatra, S. Progress in thermal comfort studies in classrooms over last 50 years and way forward. Energy Build. 2019, 188, 149–174. [Google Scholar] [CrossRef]
  25. Allab, Y.; Pellegrino, M.; Guo, X.F.; Nefzaoui, E.; Kindinis, A. Energy and comfort assessment in educational building: Case study in a French university campus. Energy Build. 2017, 143, 202–219. [Google Scholar] [CrossRef]
  26. Dahlan, N.D.; Gital, Y.Y.; Hussein, M.K. Determination of thermal sensation on transient conditions, ALAM CIPTA. Int. J. Sustain. Trop. Des. Res. Pract. 2015, 8, 3–9. [Google Scholar]
  27. Zeiler, W.; Boxem, G. Effects of thermal activated building systems in schools on thermal comfort in winter. Build. Environ. 2009, 44, 2308–2317. [Google Scholar] [CrossRef]
  28. Luo, X.; Liu, Y.F.; Liu, J.P.; Liu, X.J. Energy scheduling for a three-level integrated energy system based on energy hub models: A hierarchical Stackelberg game approach. Sustain. Cities Soc. 2020, 52, 101814. [Google Scholar] [CrossRef]
  29. Luo, X.; Liu, Y.F.; Liu, X.J. Bi-level multi-objective optimization of design and subsidies for standalone hybrid renewable energy systems: A novel approach based on artificial neural network. J. Build. Eng. 2021, 41, 102744. [Google Scholar] [CrossRef]
  30. Talukdar, M.S.J.; Talukdar, T.H.; Singh, M.K.; Baten, M.A.; Hossen, M.S. Status of thermal comfort in naturally ventilated university classrooms of Bangladesh in hot and humid summer season. J. Build. Eng. 2020, 32, 101700. [Google Scholar] [CrossRef]
  31. Fong, M.L.; Hanby, V.; Greenough, R.; Lin, Z.; Cheng, Y. Acceptance of thermal conditions and energy use of three ventilation strategies with six exhaust configurations for the classroom. Build. Environ. 2015, 94, 606–619. [Google Scholar] [CrossRef]
  32. Lau, S.S.Y.; Zhang, J.; Tan, Y.Q. A comparative study of thermal comfort in learning spaces using three different ventilation strategies on a tropical university campus. Build. Environ. 2019, 148, 579–599. [Google Scholar] [CrossRef]
  33. Raj, U.; Li, Z.; Ke, Y.; Wang, F.; Yang, B. Personal cooling strategies to improve thermal comfort in warm indoor environments: Comparison of a conventional desk fan and air ventilation clothing. Energy Build. 2018, 174, 439–451. [Google Scholar] [CrossRef]
  34. Song, C.; Duan, G.N.; Wang, D.J.; Liu, Y.F.; Du, H.; Chen, G.X. Study on the influence of air velocity on human thermal comfort under non-uniform thermal environment. Build. Environ. 2021, 196, 107808. [Google Scholar] [CrossRef]
  35. Song, W.F.; Wang, F.M.; Zhang, C.J.; Lai, D.D. On the improvement of thermal comfort of university students by using electrically and chemically heated clothing in a cold classroom environment. Build. Environ. 2015, 94, 704–713. [Google Scholar] [CrossRef]
  36. Jowkar, M.; de Dear, R.; Brusey, J. Influence of long-term thermal history on thermal comfort and preference. Energy Build. 2020, 210, 109685. [Google Scholar] [CrossRef]
  37. Ning, H.R.; Wang, Z.J.; Zhang, X.X.; Ji, Y.C. Adaptive thermal comfort in university dormitories in the severe cold area of China. Build. Environ. 2016, 99, 161–169. [Google Scholar] [CrossRef]
  38. Cao, B.; Zhu, Y.X.; Qin, O.Y.; Zhou, X.; Huang, L. Field study of human thermal comfort and thermal adaptability during the summer and winter in Beijing. Energy Build. 2011, 43, 1051–1056. [Google Scholar] [CrossRef]
  39. Guevara, G.; Soriano, G.; Mino-Rodriguez, I. Thermal comfort in university classrooms: An experimental study in the tropics. Build. Environ. 2021, 187, 107430. [Google Scholar] [CrossRef]
  40. Liu, X.J.; Liu, X.D.; Luo, X.; Wang, M.M.; Wang, B.J. Analysis of the influencing mechanism of command-and-control instruments on adopting energy consumption monitoring technology in public buildings. Int. J. Low-Carbon Technol. 2020, 15, 210–223. [Google Scholar] [CrossRef]
  41. China Meteorological Science Data Center. Hour-by-Hour Observation Data of China’s Ground Meteorological Stations. Available online: http://data.cma.cn (accessed on 1 January 2021).
  42. GB 50189-2015; Design Standard for Energy Efficiency of Public Buildings. Ministry of Housing and Urban-Rural Development of the People’s Republic of China: Beijing, China, 2015.
  43. BS EN ISO 7726-2001; Ergonomics of the Thermal Environment—Instruments for Measuring Physical Quantities. British Standards Institution: London, UK, 2001.
  44. Corgnati, S.P.; Ansaldi, R.; Filippi, M. Thermal comfort in Italian classrooms under free running conditions during mid seasons: Assessment through objective and subjective approaches. Build. Environ. 2009, 44, 785–792. [Google Scholar] [CrossRef]
  45. IBM SPSS Statistics 26. Available online: https://www.ibm.com/products/spss-statistics (accessed on 1 May 2019).
  46. Turanjanin, V.; Vuclcevic, B.; Jovanovic, M.; Mirkov, N.; Lazovic, I. Indoor CO2 measurements in Serbian schools and ventilation rate calculation. Energy 2014, 77, 290–296. [Google Scholar] [CrossRef]
  47. Wang, Z.; de Dear, R.; Luo, M.H.; Lin, B.R.; He, Y.D.; Ghahramani, A.; Zhu, Y.X. Individual difference in thermal comfort: A literature review. Build. Environ. 2018, 138, 181–193. [Google Scholar] [CrossRef]
  48. Jin, H.; Liu, S.Q.; Kang, J. Gender differences in thermal comfort on pedestrian streets in cold and transitional seasons in severe cold regions in China. Build. Environ. 2020, 168, 106488. [Google Scholar] [CrossRef]
  49. Chaudhuri, T.; Zhai, D.Q.; Soh, Y.C.; Li, H.; Xie, L.H. Random forest based thermal comfort prediction from gender-specific physiological parameters using wearable sensing technology. Energy Build. 2018, 166, 391–406. [Google Scholar] [CrossRef]
  50. Korsavi, S.S.; Montazami, A. Children’s thermal comfort and adaptive behaviours; UK primary schools during non-heating and heating seasons. Energy Build. 2020, 214, 109857. [Google Scholar] [CrossRef]
  51. Xu, C.C.; Li, S.H.; Zhang, X.S.; Shao, S.L. Thermal comfort and thermal adaptive behaviours in traditional dwellings: A case study in Nanjing, China. Build. Environ. 2018, 142, 153–170. [Google Scholar] [CrossRef]
  52. Kim, J.; de Dear, R. Thermal comfort expectations and adaptive behavioural characteristics of primary and secondary school students. Build. Environ. 2018, 127, 13–22. [Google Scholar] [CrossRef]
  53. Abdallah, A.S.H.; Hussein, S.W.; Nayel, M. The impact of outdoor shading strategies on student thermal comfort in open spaces between education building. Sustain. Cities Soc. 2020, 58, 102124. [Google Scholar] [CrossRef]
  54. Huang, Z.F.; Cheng, B.; Gou, Z.H.; Zhang, F. Outdoor thermal comfort and adaptive behaviors in a university campus in China’s hot summer-cold winter climate region. Build. Environ. 2019, 165, 106414. [Google Scholar] [CrossRef]
  55. EnergyPlus. Available online: www.github.com/NREL/EnergyPlus (accessed on 23 September 2021).
  56. Sun, Y.K.; Luo, X.; Liu, X.J. Optimization of a university timetable considering building energy efficiency: An approach based on the building controls virtual test bed platform using a genetic algorithm. J. Build. Eng. 2021, 35, 102095. [Google Scholar] [CrossRef]
  57. MATLAB. Available online: www.mathworks.cn/products/matlab (accessed on 6 December 2018).
  58. BCVTB. Available online: http://simulationresearch.lbl.gov/bcvtb (accessed on 13 February 2018).
  59. Wang, Z.; Li, A.; Ren, J.; He, Y. Thermal adaptation and thermal environment in university classrooms and offices in Harbin. Energy Build. 2014, 77, 192–196. [Google Scholar] [CrossRef]
  60. Wang, Z.; Ning, H.; Zhang, X.; Ji, Y. Human thermal adaptation based on university students in China’s severe cold area, Sci. Technol. Built. Environ. 2016, 23, 413–420. [Google Scholar] [CrossRef]
  61. Aparicio-Ruiz, P.; Barbadilla-Matin, E.; Guadix, J.; Munuzuri, J. A field study on adaptive thermal comfort in Spanish primary classrooms during summer season. Build. Environ. 2021, 203, 108089. [Google Scholar] [CrossRef]
  62. Gou, Z.; Gamage, W.; Lau, S.S.-Y.; Lau, S.S.-Y. An investigation of thermal comfort and adaptive behaviors in naturally ventilated residential buildings in tropical climates: A pilot study. Buildings 2018, 8, 5. [Google Scholar] [CrossRef] [Green Version]
Figure 1. The monthly variation of temperature and relative humidity in Xi’an (2010–2019) [41].
Buildings 12 00075 g001
Figure 2. The studied classroom: (a) interior view of the classroom, (b) heating radiator.
Buildings 12 00075 g002
Figure 3. The classroom layout with sensor locations marked.
Buildings 12 00075 g003
Figure 4. Subjective survey design.
Buildings 12 00075 g004
Figure 5. Timeline of the questionnaire survey.
Buildings 12 00075 g005
Figure 6. Outdoor air temperature and relative humidity.
Buildings 12 00075 g006
Figure 7. Indoor air temperature and relative humidity.
Buildings 12 00075 g007
Figure 8. Thermal sensation votes.
Buildings 12 00075 g008
Figure 9. Cross tabulation of thermal preference votes on thermal sensation scale. Note: Since there was no significant difference in the TPV values of the two classes in the morning/afternoon, the data of the two classes in the morning/afternoon were combined.
Buildings 12 00075 g009
Figure 10. Cross tabulation of thermal comfort votes on the thermal sensation scale.
Buildings 12 00075 g010
Figure 11. Relationship between TSV and outdoor temperature. Note: Owing to the insufficient sample size of periods B1 and B2, the data of the two periods were not analyzed.
Buildings 12 00075 g011
Figure 12. Relationship between TSV and operative temperature. Note: Owing to the insufficient sample size of periods B1 and B2, the data of the two periods were not analyzed.
Buildings 12 00075 g012
Figure 13. Clothing insulation value in different periods.
Buildings 12 00075 g013
Figure 14. Total frequency of adding and reducing in different periods.
Buildings 12 00075 g014
Figure 15. Heating load of sample building in November and December and students’ actual thermal sensation under different strategies.
Buildings 12 00075 g015
Table 1. Information of the measuring equipment and parameters.
ParametersEquipmentModelRangeAccuracy
Air temperature and relative humidityTemperature and humidity sensorTR-72uiTa: −20–60 °C; RH: 0–95%Ta: ±0.5 °C; RH: ±3%
Air velocityAnemometerZRQF-F300.05–60 m/s±(0.04 U ± 0.05)
Globe temperatureBlack-ball thermometerTR102S−100–400 °C±0.3 °C
CO2 concentrationCO2 analyzerTES-13700–2000 ppm±1 ppm
Table 2. Thermal perception responses.
ScaleTSVTPVTCV
3Hot Very uncomfortable
2WarmMuch CoolerUncomfortable
1Slightly warmSlightly CoolerSlightly uncomfortable
0NeutralNo changeComfortable
−1Slightly coolSlightly warmer
−2CoolMuch warmer
−3Cold
Table 3. Mean demographics and clothing insulation of questionnaire respondents.
SampleMaleFemaleAge (Year)Weight (kg)Height (m)BMI (kg/m2)Clothing Insulation (clo)
MaleFemale
Period A1561124419 (0.89)63.02 (12.04)1.73 (0.07)21.05 (3.33)1.40 (0.14)1.53 (0.15)
Period B81334819 (0.56)58.60 (11.60)1.70 (0.09)20.10 (2.48)1.47 (0.12)1.49 (0.12)
Period C174997519 (0.75)61.35 (11.92)1.71 (0.09)20.99 (3.27)1.38 (0.14)1.46 (0.16)
Period D167798819 (0.81)60.55 (10.89)1.70 (0.09)20.84 (2.87)1.39 (0.13)1.48 (0.15)
Note: Values in brackets denote one standard deviation around the mean.
Table 4. Mean values of climatic parameters.
Tout (°C)RHout (%)Ta (°C)Tg (°C)Top (°C)∆T (°C)RH (%)CO2 (ppm)
Day 1Period A10.3 (1.1)70.7 (5.6)17.7 (1.3)18.8 (0.9)18.7 (0.9)8.438.9 (1.8)778 (142)
Period B12.0 (0.8)62.9 (2.5)20.5 (0.3)20.4 (0.2)20.4 (0.2)8.434.9 (0.7)736 (87)
Period C15.0 (0.5)53.4 (1.3)21.0 (0.3)21.4 (0.2)21.4 (0.5)6.035.6 (0.7)880 (87)
Period D13.7 (0.6)58.0 (2.7)21.7 (0.2)21.7 (0.5)21.7 (0.5)8.035.8 (1.8)947 (246)
Day 2Period A2.2 (0.4)78.6 (1.4)18.9 (0.7)19.8 (0.2)19.8 (0.2)17.633.9 (1.5)738 (68)
Period B3.5 (0.2)70.0 (3.1)19.6 (0.3)19.9 (0.4)19.9 (0.4)16.431.6 (0.5)697 (73)
Period C5.3 (0.7)60.9 (1.7)20.1 (0.3)20.8 (0.4)20.8 (1.3)15.534.5 (0.5)944 (73)
Period D4.9 (0.5)63.3 (1.5)20.9 (0.2)20.6 (0.2)20.7 (0.2)15.832.2 (0.3)725 (52)
Day 3Period A0.4 (0.3)80.5 (1.7)17.3 (0.8)17.8 (0.5)17.7 (0.5)17.333.2 (1.2)661 (54)
Period B1.4 (0.5)72.5 (2.3)19.7 (0.2)19.8 (0.5)19.8 (0.4)18.428.3 (2.5)643 (34)
Period C2.2 (0.2)67.5 (1.1)19.4 (0.2)20.0 (0.5)20.0 (0.4)17.827.4 (2.5)596 (34)
Period D2.0 (0.1)69.7 (0.8)19.2 (0.3)19.6 (0.2)19.6 (0.2)17.626.5 (0.6)717 (55)
Day 4Period A−1.1 (0.4)64.2 (1.5)22.3 (0.1)23.6 (0.2)23.6 (0.2)24.734.4 (1.0)543 (60)
Period B1.4 (1.1)56.6 (4.4)20.8 (2.0)21.9 (2.2)21.9 (2.2)20.532.7 (1.3)693 (150)
Period C3.8 (0.7)44.5 (2.0)21.2 (2.0)22.3 (2.2)22.3 (0.5)18.530.4 (1.3)723 (150)
Period D3.9 (0.4)44.4 (1.6)20.4 (0.4)21.4 (0.5)21.4 (0.5)17.525.9 (1.0)978 (56)
Note: Values in brackets denote one standard deviation around the mean.
Table 5. Differences of TSV in different periods.
p p
TSVA1 vs. TSVA20.001TSVB1 vs. TSVD10.158
TSVB1 vs. TSVB20.047TSVC1 vs. TSVD10.174
TSVC1 vs. TSVC20.170TSVA2 vs. TSVB20.555
TSVD1 vs. TSVD20.041TSVA2 vs. TSVC2<0.001
TSVA1 vs. TSVB10.965TSVA2 vs. TSVD20.002
TSVA1 vs. TSVC10.001TSVB2 vs. TSVC2<0.001
TSVA1 vs. TSVD10.032TSVB2 vs. TSVD20.020
TSVB1 vs. TSVC10.018TSVC2 vs. TSVD20.261
Table 6. Mean values of subjective votes.
Day 1Day 2Day 3Day 4
TSVTPVTCVTSVTPVTCVTSVTPVTCVTSVTPVTCV
Period A10.75
(0.75)
−0.46
(0.64)
0.20
(0.40)
0.48
(0.93)
0.03
(0.52)
0.12
(0.33)
0.47
(0.96)
−0.15
(0.68)
0.22
(0.41)
0.62
(0.93)
−0.25
(0.43)
0.22
(0.48)
Period A2−0.38
(1.22)
−0.65
(0.83)
0.31
(0.62)
0.33
(1.21)
0.04
(0.68)
0.29
(0.45)
0.30
(1.01)
−0.18
(0.66)
0.36
(0.55)
0.33
(0.57)
−0.22
(0.53)
0.22
(0.42)
Period B1------0.70
(1.15)
−0.21
(0.66)
0.15
(0.41)
0.45
(0.93)
0.10
(0.66)
0.24
(0.43)
Period B2------0.08
(0.79)
−0.33
(0.61)
0.18
(0.44)
0.11
(0.60)
−0.13
(0.50)
0.20
(0.54)
Period C11.13
(0.92)
0.02
(0.61)
0.26
(0.48)
0.95
(1.17)
0.08
(0.79)
0.20
(0.40)
0.87
(1.01)
0.09
(0.75)
0.35
(0.63)
0.94
(1.11)
0.19
(0.59)
0.39
(0.55)
Period C20.49
(0.71)
0.15
(0.62)
0.32
(0.59)
0.90
(0.80)
0.00
(0.45)
0.34
(0.54)
0.45
(0.98)
−0.07
(0.74)
0.31
(0.60)
1.09
(1.10)
0.30
(0.69)
0.35
(0.63)
Period D10.75
(0.89)
−0.13
(0.77)
0.37
(0.62)
0.71
(0.97)
−0.02
(0.52)
0.29
(0.51)
0.62
(1.07)
−0.11
(0.80)
0.54
(0.83)
0.81
(0.97)
0.36
(0.64)
0.22
(0.71)
Period D20.42
(1.04)
−0.03
(0.65)
0.58
(0.75)
0.52
(0.90)
−0.12
(0.43)
0.24
(0.51)
0.64
(1.04)
0.21
(0.77)
0.57
(0.90)
0.67
(0.82)
0.00
(0.67)
0.36
(0.42)
Note: Values in brackets denote one standard deviation around the mean.
Table 7. Differences in the TPV in different periods.
p p
TPVA1 vs. TPVA20.157TPVB1 vs. TPVD10.448
TPVB1 vs. TPVB20.164TPVC1 vs. TPVD10.106
TPVC1 vs. TPVC20.899TPVA2 vs. TPVB20.435
TPVD1 vs. TPVD20.785TPVA2 vs. TPVC2<0.001
TPVA1 vs. TPVB10.163TPVA2 vs. TPVD20.002
TPVA1 vs. TPVC1<0.001TPVB2 vs. TPVC20.001
TPVA1 vs. TPVD10.012TPVB2 vs. TPVD20.024
TPVB1 vs. TPVC10.025TPVC2 vs. TPVD20.329
Table 8. Differences of TCV in different periods.
p p
TCVA1 vs. TCVA20.083TCVB1 vs. TCVD10.023
TCVB1 vs. TCVB20.723TCVC1 vs. TCVD10.324
TCVC1 vs. TCVC20.761TCVA2 vs. TCVB20.084
TCVD1 vs. TCVD20.724TCVA2 vs. TCVC20.886
TCVA1 vs. TCVB10.823TCVA2 vs. TCVD20.336
TCVA1 vs. TCVC10.080TCVB2 vs. TCVC20.064
TCVA1 vs. TCVD10.009TCVB2 vs. TCVD20.023
TCVB1 vs. TCVC10.107TCVC2 vs. TCVD20.389
Table 9. Correlation between outdoor temperature, operating temperature, and TSV.
Period A1Period A2Period B1Period B2Period C1Period C2Period D1Period D2
Outdoor temperature vs. TSVr = 0.964r = −0.854--r = 0.975r = −0.399r = 0.951r = −0.880
p = 0.036p = 0.146--p = 0.025p = 0.601p = 0.049p = 0.120
Operating temperature vs. TSVr = −0.463r = 0.891--r = 0.156r = 0.909r = 0.628r = −0.988
p = 0.537p = 0.109--p = 0.844p = 0.041p = 0.372p = 0.012
Note: Owing to the insufficient sample size of periods B1 and B2, the data of the two periods were not analyzed.
Table 10. Student information before class.
Period A1 (%)Period B1 (%)Period C1 (%)Period D1 (%)
Food consumption
Hot66.6738.2767.8236.75
Cold4.4911.1132.187.23
Hot and cold5.77002.41
Nothing23.0850.62053.61
There is a class
Yes-75.64-78.92
No-24.36-21.08
Active status
Resting24.182.4738.513.60
Working49.6790.1239.0889.82
Sporting26.147.4122.416.59
Note: Period A was the first class of the day. There was a long interval between periods B and C. Therefore, in periods A1 and C1, the participants were not surveyed as to whether there was a class in the previous period.
Table 11. Difference of TSV based on food consumption.
Period A1Period A2Period B1Period B2Period C1Period C2Period D1Period D2
Hot/cold/nothingp = 0.12p = 0.64p = 0.24p = 0.88p = 0.39p = 0.91p = 0.73p = 0.91
Something/nothingp = 0.48p = 0.90p = 0.37p = 0.90p = 0.43p = 0.79
Note: (1) “Something” includes the following situations: consumption of cold food, consumption of hot food, and consumption of cold and hot food. (2) Before the classes in periods C1 and C2, all the participants consumed food, so the p-value of “Something/nothing” in periods C1 and C2 could not be calculated.
Table 12. Adaptive behaviors.
Thermal Adaptation BehaviorFrequency (%)Cold Adaptation BehaviorFrequency (%)
Use an electric fan2.26Turn up the heating9.50
Use a fan1.97Close the door18.01
Open the door18.19Close the window20.57
Open the window35.68Add clothes26.38
Draw the curtains2.26Drink cold beverage17.16
Reduce clothes33.85Use hand warmer8.37
Drink hot beverage5.78
Publisher’s Note: MDPI stays neutral with regard to jurisdictional claims in published maps and institutional affiliations.

