Abstract
In New Zealand, housing is typically low density, with light timber framing being the dominant form of construction with more than 90% of the market. From 2020, as a result of the global pandemic, there was a shortage of timber in New Zealand, resulting in increased popularity for light steel framing, the main alternative to timber for housing. At the same time, the New Zealand government is committed to sustainability practises through legislation and frameworks, such as the reduction of whole-of-life carbon emissions for the building industry. New Zealand recently announced reducing its net greenhouse gas emissions by 50% within 2030. Life cycle assessment (LCA) is a technique for assessing the environmental aspects associated with a product over its life cycle. Despite the popularity of LCA in the construction industry of New Zealand, prior research results seem varied. There is no unified NZ context database to perform an LCA for buildings. Therefore, in this paper, a comprehensive study using LCA was conducted to quantify and compare the quantity of carbon emissions from two commonly designed houses in the Auckland region, one built from light timber and the other from light steel, both designed for a lifespan of 90 years. The cradle-to-cradle system boundary was used for the LCA. From the results of this study, it was found that the light steel house had 12.3% more carbon in total (including embodied and operational carbons) when compared to the light timber house, of which the manufacturing of two houses had a difference of 50.4% in terms of carbon emissions. However, when the end-of-life (EOL) analysis was included, it was found that the extra carbon could be offset due to the steel’s recyclability, reducing the amount of embodied carbon in the manufacturing process. Therefore, there was no significant difference in carbon emissions between the light steel and the light timber building, with the difference being only 12.3%.
1. Introduction
As the population increases globally, the demand for housing will also naturally increase [1]. Current housing development predominantly relies on non-environment-friendly building technologies [2]. Furthermore, building construction generally produces a large amount of carbon, which is the leading cause of climate change [3]. Nevertheless, the consequences of global climate change caused by carbon emissions include global warming, sea-level rises, the disruption of ecosystems, and consequences to human health [4]. The global construction industry accounts for about 40% of primary energy use and one-third of global carbon emissions [5].
In New Zealand, the building and construction sector contributes 20% of the nation’s total carbon emissions [6]. In addition, the national gross carbon emissions increased by 26.4% between 1990 and 2019 (17,188.6 to 82,317.9 kt CO2 eq), which accounts for an annual growth of 0.8% of carbon emissions [7]. The New Zealand government set its carbon reduction target to reach net-zero carbon by 2050 through the Climate Change Response (Zero-Carbon) Amendment Act 2019, contributing to the international commitment under the Paris Agreement [8,9]. Accordingly, in 2020, the Ministry of Business, Innovation and Employment (MBIE) published the Whole-of-Life Embodied Carbon Emissions Reductions for Buildings framework, which contains a systematic guideline for responding to the reduction target in the building industry [6]. In addition, looking at national building practice, timber became the most used material for constructing a house [10], and it is a preferable material with a sustainable approach [11]. However, the nation is currently experiencing a material shortage due to the pandemic. The COVID-19 pandemic is affecting the nation’s supply chain, and 53% of construction enterprises have reported shortages of materials and supplies [12]. The timber shortage is also caused by the lack of national investment in the manufacturing capacity of timber products and unbalances in supply and demand in the market [13]. Therefore, alternative materials for buildings are expected, for example, cold-formed steel (CFS), but they also must consider the sustainability aspect. CFS has been gaining popularity in the construction sector in recent years due to its superior strength-to-weight ratio, and ease of formability, when compared to hot-rolled steel (HRS) [14,15,16,17,18,19]. CFS members can be rolled into different cross-sectional shapes and optimizing these shapes can further improve their load-bearing capacities, resulting in a more economical and efficient building solution. These CFS members (especially channels) are often used in beams [20,21,22,23], columns [24,25,26,27,28,29,30,31,32], shear walls [33], and cladding systems [34]. Conversely, the high thermal conductivity of steel can lead to thermal bridges, which can significantly reduce the building’s thermal performance and energy efficiency. Hence, it is also essential to consider the energy performance of the CFS structures.
The life cycle assessment (LCA) is a well-known methodology to measure and analyse the potential environmental impacts of products’ life cycles, including building products [35,36,37,38]. When utilising LCA for buildings, two main focuses are usually considered by the practice: analysing the carbon emissions from the overall performance of the structure and evaluating some building elements [39]. Using this method, some studies have contrasted the building materials to select the preferred materials based on environmental performance [40,41]. Despite the challenges of applying LCA to building products, it is still widely used in the building industry as an essential evaluation method for analysing and proposing solutions to environmental issues arising from building practises [42,43]. Case studies have produced a variety of results due to the diverse concepts of goal, scope, and limitations [44]. Therefore, the complexities are to be considered while applying LCA in the construction industry [45].
Alhazmi et al. conducted an LCA to analyse the environmental impacts of a typical residential building during the whole life cycle (50-year building lifetime) in Saudi Arabia with a cradle-to-grave system boundary. They found that the operational phase had the most significant influence on the global warming potential (GWP) (93%) over the 50 years of the product’s life cycle [46]. The result was similar to another study by Petrovic et al., which assessed a single-family timber house with a 100-year lifespan and used a cradle-to-grave system boundary. The building’s use phase contributed the most total carbon emissions (64%), while the production stages contributed 30% [47]. Chastas et al. conducted a review of the embodied carbon of residential buildings based on 95 case studies. They revealed that the range of embodied carbon of residential buildings in a 50-year building lifespan ranges between 179 and 1050 kg CO2 eq/m2, while the operational carbon varies between 156 and 4049.9 kg CO2 eq/m2 [48].
Several studies have performed comparative LCAs to compare the effects of carbon emissions due to different types of building materials. Vitale et al. compared two different building material types (cold-formed steel and reinforced concrete) in residential buildings with a cradle-to-grave system boundary and a building lifespan of 50 years. The study concluded that cold-formed steel (CFS) structures outperform concrete in terms of environmental performance (24% GWP) [49]. Hawkins et al. contrasted the embodied carbon of concrete, steel, and timber building structures. They found that when using a fixed time horizon metric with a cradle-to-cradle system boundary, the timber materials had a lowest result (130 kg CO2 eq/m2) compared to steel (269 kg CO2 eq/m2) and concrete (348 kg CO2 eq/m2) when the sustainably managed forest was assumed to be applied [50]. Johnston et al. contrasted the CFS and hot-rolled steel (HRS) as the portal frames using a cradle-to-gate system boundary. The study revealed that using CFS as the primary framing material resulted in better embodied carbon (up to 30%) than using HRS for the 18 m and 24 m spans [51]. In addition, Ortiz-Rodríguez et al. conducted a comparative whole LCA study in the context of different geographical conditions. They showed that Colombian houses release fewer carbon emissions (65%) than the Mediterranean house, caused by differences in bioclimatic and electricity consumption behaviours in each location [35].
Looking at the LCA of buildings in New Zealand, Moradibistouni et al. examined carbon emissions from a residential building that used polymers. The study revealed that carbon emissions from the house were 20 kg CO2 eq/m2/year [52]. Chandrakumar et al. analysed the whole carbon emissions from a house in New Zealand with a 90-year building lifetime. The research found the carbon emitted from the house was 16 kg CO2 eq/m2/year. They compared the result with other nations’ residential building climate impacts, which ranged between 10 and 90 kg CO2 eq/m2/year [53].
Despite the popularity of LCA in construction industry, prior research results seem varied. There is no unified NZ context database to perform an LCA for buildings. Many factors are analysed which influence the various buildings’ carbon emissions data, such as the system boundary, geographical horizon, time horizon, methodology or tool, and materials used. In New Zealand, between 2010 and 2019, timber framing became the most popular material (90% of market share) compared with steel and concrete [10]. The use of each of these materials will also result in a different process or work method. Hence, the energy use and carbon emissions will differ. In addition, when analysing the carbon emissions from a building, the availability of an Environmental Product Declaration (EPD) is crucial. The EPD is used as the basis of carbon emission calculations from materials based on the product manufacturing processes to the EOL scenarios. However, the published EPDs across many countries seem to have varied values, which results in variations of total carbon emissions when they are compared. Rasmussen et al. conducted a comprehensive review of the EPDs of structural woods in which they analysed 81 EPDs across several countries. They found that the investigated EPDs had varied values (up to 90% uncertainty for GWP), which were caused by different specificities such as manufacturer, facility, co-production, time of data representation, and supply chain [54]. Janjua et al. investigated the effect of service life on a building’s environmental performance. They discovered that the service life of a building and its components had a direct link with the environmental performance, namely the replacement intervals, and that it was recognised as the third major contributing factor to the overall environmental effects after use and pre-use [55]. Referring to previous building LCA studies [46,47,48,49,50,51,52,53], it seemed that the lifespan of buildings has ranged between 50 and 100 years, resulting in varied assessment outcomes. The condition leads to a knowledge gap in implementing environmental assessment of building products and results in varied assessment results, primarily caused by the various scopes of assessment and the unidentical design of the buildings. Therefore, the total carbon emissions from residential buildings cannot be generalised and applied to all types of houses.
Hence, with a range of previous LCA results for building products, this study examined a house in New Zealand using the local embodied carbon data and the national electricity consumption scenario to determine the carbon emissions from NZ houses in the current condition. The assessment was conducted in the design phase, which was specific to the technical design, where the carbon footprints of the building were quantified based on the designed structure and generic material data. The main objective of this research was to compare the carbon emissions of two types of houses, one built from light timber and the other from light steel. The comparison between the two houses was based on the carbon produced during the whole-building life cycle and the potential carbon offset from materials used in the buildings.
2. Methodology
An LCA was performed to investigate the environmental impact in terms of carbon emissions from two New Zealand residential buildings, one made from light timber and the other from CFS. The design of the two houses is the most common design used in New Zealand. The carbon emissions were computed at each step of the life cycle of the materials (including production to the EOL stage), and a comparison of the carbon emissions from the two buildings was calculated. The analysis included both the embodied and operational carbon emissions, and considered the carbon offset from the materials used in the buildings. The LCA was performed using the NZ-based LCA tool LCAQuick V3.4.4 [56], which was developed by BRANZ.
Figure 1 illustrates the methodology used in this study. The method for performing the LCA followed the LCA framework stated in the ISO 14040 series [57]. According to ISO 14040:2006, there are four steps in conducting LCA: (1) goal and scope definition, (2) inventory analysis (LCI), (3) impact assessment (LCIA), and (4) interpretation of the results. In the first step, the goal and scope were identified to achieve the purpose of the study. Some elements were included in the scope of the study, such as system boundary and functional units, which are crucial in the LCA. The second step was to set up the LCI, where the data were collected. The primary data required for this LCA was the quantity of the building materials. Afterward, the LCIA was performed, in which the impact category and assessment tool were selected, and the LCA calculation was performed. Finally, the interpretation of the results was undertaken to present the difference between the carbon emissions from the two investigated houses, one made from CFS and the other from light timber. In order to check the validity of the results, they were compared with previous studies.
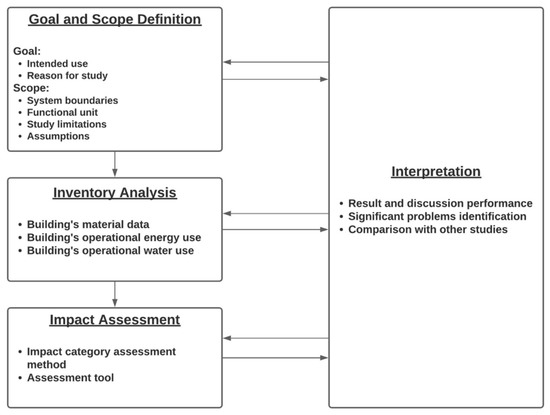
Figure 1.
Life cycle analysis framework for the research.
2.1. Goal of the LCA
As mentioned previously in the introduction section, this LCA aimed to study the impact of carbon emissions from light timber and light steel houses. The need for buildings’ LCA has been reflected in the past, which was assessed herein. The comparison of carbon emissions from the selected two houses can provide some basic understanding of decision-making at the governmental level.
2.2. Scope of the LCA
2.2.1. System Boundaries
The system boundary used in this LCA was cradle-to-cradle. Therefore, the study examined the carbon produced by the houses from the material production stage to the EOL stage and considered the potential carbon offset. Figure 2 shows the building life stages used in the LCA study, which adopted the standard building life cycle [58,59].
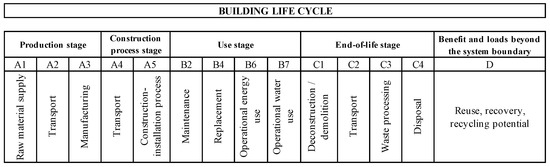
Figure 2.
Different life stages of timber and steel materials used in the LCA.
Furthermore, the selected geographical boundary in this study was the Auckland region, New Zealand. Based on the BRANZ database for building service life in NZ [59], 90 years of building lifetime was applied in this study.
2.2.2. Functional Unit
The functional unit in this LCA study was the annual carbon emissions per gross floor area (GFA), kg CO2 eq/m2/year. Therefore, by calculating the carbon emission results per GFA, it was possible to compare the impact of light timber and light steel construction in terms of their carbon emissions.
2.2.3. Assumptions
Several assumptions were made in the LCA study. Due to the unavailability of the data for staircase material quantities, they were excluded from the LCA. The quantity of floor coverings (e.g., floor tiles or carpet) and paint were not included in this study because they were assumed to be identical and did not result in any significant changes in terms of impacts [49]. Both houses’ annual electricity consumption and water demand scenarios were assumed to be steady over their lifetimes. Therefore, the values were not changed.
2.2.4. Limitations
This study was New Zealand-specific, where the local carbon coefficient and energy consumption were applied. The result of the study cannot be applied directly to other buildings outside the scope of the study because the result is highly dependent on the geographical regions, time horizon, and building material types. However, this study can provide an understanding of the potential building materials available in the NZ’s housing market when choosing the most environmentally friendly material. It also shows the relationship between the material volume or weight of the two houses (light timber and light steel houses) and the carbon emissions from the production stages of the materials to their EOL stages, which can be useful in the planning phase of future housing projects to use more sustainable materials for building houses in New Zealand.
3. Life Cycle Inventory and Impact Assessment of Case Study Buildings
3.1. Housings Material Data
The material quantities and architectural drawings of the two investigated buildings were collected from the local contractors and manufacturers of the building materials. The light timber house plan (House A) is illustrated in Figure 3, while the light steel house plan (House B) is shown in Figure 4.
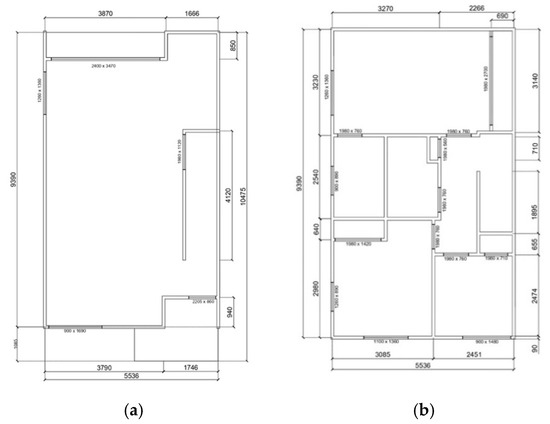
Figure 3.
House A—light timber house plan (a) ground floor; (b) upper floor (all measurements are in millimetres and scaled at 1:100).
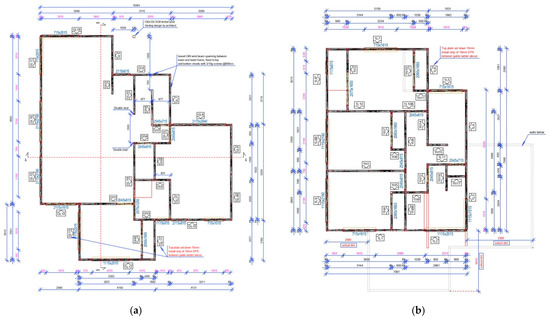
Figure 4.
House B—light steel house plan (a) ground floor; (b) upper floor (all measurements are in millimetres and scaled at 1:100).
According to the floor plans, both houses were two-story buildings with different floor areas on each level. Table 1 shows the gross floor area (GFA) of the two investigated buildings.

Table 1.
Area of the buildings.
Furthermore, when conducting the LCA, the material quantities were input in the LCAQuick software [56]. The type of material and volume were calculated from the data sources (i.e., architectural plan and elevation drawings and material take-off sheets). Table 2 shows the material quantities obtained from both the buildings studied herein.
Table 2.
Material take-off data of two investigated houses.
3.2. Operational Energy Data
The operational energy consumptions in both houses were calculated using the recommendations in the LCAQuick database [56] and the guidelines in the 2018 Electricity New Zealand report. House A was assumed to be occupied by three people, while House B had five occupants. The annual electricity consumption for House A was found to be 7000 kWh/year, and this value was calculated based on the per capita electricity demand in New Zealand [60]. For House B, the annual electricity demand was 9618 kWh/year, referring to the BRANZ datasheet available in the LCAQuick [56] for five occupants. The annual electricity consumption for both houses is illustrated in Table 3. Plug loads consumed the most extensive electricity for two houses, with approximately 50% of the total electricity consumption of the houses.
Table 3.
Operational energy consumption.
In this study, the operational water demand referred to the annual water consumption as per the recommendations given in LCAQuick [56], which is 67.60 kL/person/year. Therefore, due to the different numbers of occupants in two houses, the houses had different water demands. Table 4 shows the annual water demand for both houses during the entire lifespan of the buildings.
Table 4.
Operational water demand.
3.3. Impact Assessment
The LCIA can be classified into two methods: midpoints and endpoints (damaged-oriented) [61,62]. Midpoints are known to be ties in the cause-effect chain (an environmental mechanism) of the impact group (e.g., GWP and acidification) [63]. In contrast, endpoints consider the end of the cause-effect chain, such as human health and the ecosystem [64]. Therefore, this study used the midpoints approach to analyse a single environmental problem directly influenced by carbon emissions, namely the GWP. The calculation of the carbon emissions was performed using the NZ-based LCA tool called LCAQuick V3.4.4 [56], which enables the midpoints analysis and contains the local emission database.
4. Results and Discussions of the Case Study
4.1. Assessment of Results
House A produced 13.72 kg CO2 eq/m2/year for the whole building’s life cycle, in which the benefits of recycling, recovery, and reuse of materials were considered. By adding Module D in the LCA process, the materials used in House A received a carbon offset of −0.74 kg CO2 eq/m2/year. Furthermore, House B produced 15.41 kg CO2 eq/m2/year in total during its whole life cycle. The materials used in House B had −1.53 kg CO2 eq/m2/year of carbon offsets after being processed in the EOL stage. Hence, House A produced fewer carbon emissions than House B. Table 5 shows the LCA results of the two investigated houses.
Table 5.
LCA results of the two investigated houses.
4.2. Comparison of the Results Obtained from the Two Houses
The comparison of carbon emissions between the two investigated houses having different materials showed that the selected materials massively contributed to the carbon emissions from the two houses. Figure 5 illustrates the comparative LCA results of two houses in the context of the GWP per building during their life cycles.
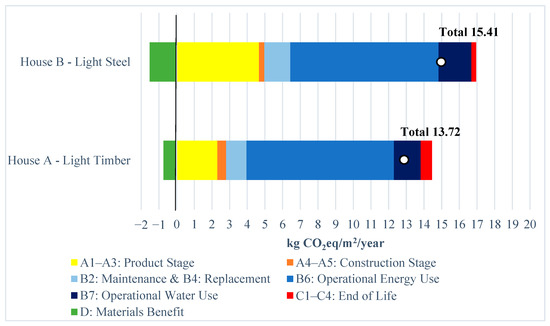
Figure 5.
The comparative results of the GWP from the two houses.
From Figure 5, it can be seen that the difference of carbon emissions obtained from the two houses was 1.69 kg CO2 eq/m2/year. House B emitted 12.32% higher carbon than House A. In comparing the carbon emissions obtained from both buildings, during the production stages of the building materials, it was found that House A emitted around 50.43% fewer carbon when compared to the carbon emissions of House B. Cole and Kernan [65] found that timber frames’ extraction and manufacturing processes have fewer energy usage when compared to other building materials such as concrete and steel. A comparative study between a mid-rise mass timber building and a steel building also indicated that the timber building produced between 28.99% and 34.08% of fewer embodied carbon (A1–A5) than the steel building [66], which confirms that the results obtained in this study are in line with the literature findings. In addition, carbon emissions from the two buildings during their remaining life stages were shown to be similar. The difference in carbon emissions obtained from the construction stages (A4–A5) of both the houses was 0.18 kg CO2 eq/m2/year, where House B released 37% fewer carbon than House A. This difference may be attributed to the fewer waste materials generated from light steel than light timber during their construction processes.
The maintenance (B2) and replacement (B4) stages of House B produced more carbon emissions than House A, with 27% higher carbon emissions, while the operational energy usage (B6) of both houses was found to be very similar, with the difference being only 1%. The operational water usage (B7) of House A was 17% fewer than that of House B. This is because of the different numbers of occupants present in the two evaluated houses: House A had only three occupants, while House B had five occupants. House B released 42% fewer carbon than House A during its EOL stage (C1–C4).
The light steel house had almost double the carbon offset when compared with the light timber house. This was because of the higher recyclability of light steel than light timber at their EOL stages. According to the BRANZ EOL module [59] (which is specific to New Zealand applications), the recyclability of steel sheet is around 65% higher than that of timber. Hence, the GWP of two investigated houses was highly affected by the choice of material and the quantity of those materials assigned to the investigated buildings.
4.3. Life Cycle Analysis of the Two Houses
From the results of the LCA, it was found that different stages of the buildings’ life cycle had different impacts in terms of carbon emissions. Figure 6 shows the buildings’ life stages and its corresponding carbon emissions for both House A and House B.
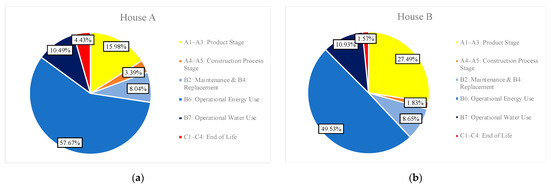
Figure 6.
Carbon emissions from the buildings during their life stages: (a) light timber house (House A); (b) light steel house (House B).
From Figure 6, both houses emitted a significant amount of embodied and operational carbon. The operational energy usage (B6 module) was the most significant carbon contributor during the whole building’s life cycle. The B6 module of House A had a 57.67% carbon contribution, whereas for House B, this contribution was 49.53%. The production stages (A1–A3) contributed the second largest carbon emissions, with 15.98% of carbon for House A and 27.49% for House B.
In addition, it was identified that the time horizon of the building’s life stages could influence the amount of carbon produced. By having a 90-year service life for the two houses, the operational stage was the primary contributor to the total carbon emissions when compared to the other stages. The early phases of the building (production to construction) had less completion time, while the operational stage of the building was dependent on the building’s life span. Hence, the operational stage in this study contributed to the majority of the carbon emissions for both houses. This finding was also in line with Petrovic et al. (2019), who conducted an LCA of a wooden single-family house. With a 100-year lifespan, the operational stage of the building had an enormous carbon contribution, with about 64% of the total carbon emissions coming from the operation phase of the building [47].
4.4. A Comparative Analysis of Carbon Emissions Obtained from Different Building Materials
House A used timber as the main building material for structural elements (e.g., wall framing and roof trusses), whereas House B used CFS. Both buildings also had other materials such as concrete, aluminium, and fibre cement used in other primary and secondary structural and non-structural members. Therefore, Figure 7 and Figure 8 show the amount of carbon emissions obtained from seven different building materials that were installed in both houses.
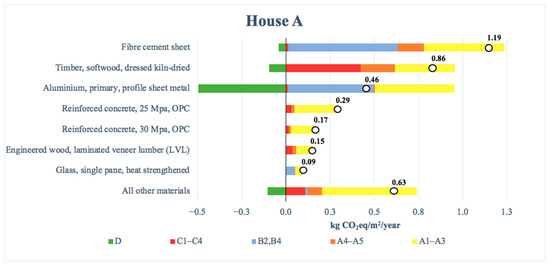
Figure 7.
The amount of carbon emissions obtained from 7 different building materials for House A.
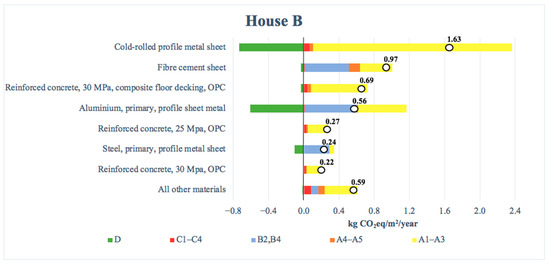
Figure 8.
The amount of carbon emissions obtained from 7 different building materials for House B.
Figure 7 shows the amount of carbon emissions from the building materials used in House A. Fibre cement sheet was the highest contributor to the total carbon emissions of the house, with 1.19 kg CO2 eq/m2/year, or 30.88% of the total carbon emissions. The maintenance and replacement of fibre cement seemed to have the biggest carbon emissions among the other life stages. It was caused by the service life of fibre cement sheets, which need to be replaced after 50 years [59]. As a result, with the buildings’ service life of 90 years, the fibre cement sheets needed to be replaced at least once for House A. Consequently, additional carbon was released from House A during the production and construction processes of the new fibre cement sheets. The second biggest carbon contributor was timber softwood, with 0.86 kg CO2 eq/m2/year, or 22.24% of the total carbon emissions coming from the softwood. The timber material absorbed a significant amount of CO2 throughout the growth of the trees from where the timber was cut [67]. In addition, all timber used in this study was assumed to come from non-sustainable forest management practices. Sustainable forest management practises are defined as forestry activities that involve the planting of trees to replace those that have been cut down for exploitation [68]. Hence, using timber with non-sustainable practises increased the amount of carbon emissions produced by House A.
Furthermore, Figure 8 shows the amount of carbon emissions from the building materials used in House B. CFS had the most significant carbon footprint, with 1.63 kg CO2 eq/m2/year, or 31.50% of the total carbon emissions. According to the Environmental Product Declaration (EPD) published by the Steel Recycling Institute [69], the CFS production processes consist of several activities, such as the manufacturing of hot-dip galvanised steel, which produce a significant amount of carbon. Therefore, the large quantity of CFS used in House B resulted in the considerable contribution of this material to the total result. However, this study found that CFS had the highest carbon offset after the EOL stage. The high carbon offset was due to the very high recovery rates of steel material for recycling [67]. Afterward, the fibre cement sheet was the second highest carbon contributor, with 0.97 kg CO2 eq/m2/year, or 18.77% of the total carbon emissions.
4.5. Comparison of LCA Results Obtained from the Current Study with Other Studies Available in the Literature
A comparison between the results of this study and the previous studies reported in the literature was conducted to check the validity of the LCA results. This study identified that House A released 13.72 kg CO2 eq/m2/year and House B released 15.41 kg CO2 eq/m2/year of total carbon emissions for the whole life cycle of the buildings. In order to check the validity of the LCA results, the findings of Chandrakumar et al. [53] were used. Their research found that the investigated house emitted 16 kg CO2 eq/m2/year of embodied and operational carbon, and their results were acceptable to the climate impact of residential buildings from around the world, where the total carbon emissions range between 10–90 kg CO2 eq/m2/year [53]. By referring to this previous research, which had an identical geographical condition to the houses studied in the current paper, it could be seen that the results of this study have a close match with the previously reported results in terms of total carbon emissions.
However, the LCA performed on different buildings showed a wide range of results. This variation can be justified by the fact that the design for each of these buildings is unique [45]. Other studies also revealed that errors in the data collection and quality, as well as the geographical location, can impact the findings [70]. The scope and methodology or LCA tool, while performing an LCA of any building, can highly influence the outcomes. Therefore, these factors should not be used to compare the results of other buildings outside the defined scope.
5. Recommendations
Some suggestions based on the outcome of this research that can improve the energy efficiency of houses to be built in the future are listed below:
- The operational stages of the investigated houses contributed the maximum amount of carbon from both buildings. Accordingly, the electricity consumption of houses needs to be minimised, i.e., by controlling the use of plug loads and hot water electricity use, as these can lead to significant energy consumption in houses.
- New Zealand’s electricity comes mainly from renewable sources, while 17.5% of the total electricity supply in 2019 was from burning fossil fuels [7]. More houses should incorporate photovoltaic (PV) panels to reduce carbon emissions from burning fossil fuels.
- A strategy to reduce carbon emissions from the production stages is needed due to their significance as being the second largest contributor of carbon emissions. The material selection process also plays a crucial role in achieving better energy efficiency of the houses. Hence, selecting more sustainable materials is suggested in the design phase to reduce the total carbon emissions from the houses.
6. Conclusions
Carbon emissions from buildings cannot be generalised due to many factors that influence the values, such as the material types, geographical horizon, and time horizon. This study used the LCA to evaluate and compare two different two-story houses (one built from light timber and the other one was constructed from light steel) in Auckland, New Zealand. In this LCA, cradle-to-cradle system boundaries were used. From the results of this study, the following conclusions were drawn:
- The LCA results confirmed that the light timber house emitted 13.72 kg CO2 eq/m2/year, while the light steel house emitted 15.41 kg CO2 eq/m2/year of total carbon. The two houses had comparable carbon emissions, which the light steel house had around 12% higher total carbon emissions (embodied and operational, including carbon offset) than the light timber house. Therefore, there was no significant difference in carbon emissions between those two houses, considering the carbon offset from the building materials after their EOL stages.
- The study identified a large difference in carbon emissions in the production stages between the two investigated houses. The light timber house had around 50% fewer carbon emissions than the light steel house during its material production stages. However, the carbon offset from the light steel house was twice as high as the light timber house. The higher carbon offset was caused by the higher recyclability of steel than timber. The recyclability of steel used in House B was around 65% higher than the recyclability of the timber house (House A).
- The operational energy emissions of the two houses became the most significant carbon contributors (49.5–57.6%) during the whole building’s life cycle, followed by the production stages (A1–A3). The reason behind such high operational carbon emissions from both houses is that the design life of the houses was 90 years, requiring operational energy for such a prolonged lifespan when compared with the other stages of the building’s life cycle. Therefore, controlling human behaviour in terms of electricity consumption and promoting the use of renewable energy can decrease the amount of carbon emissions from the operational stages of houses.
According to the research outcomes, the LCA was a useful approach for assessing the carbon emissions from the buildings and deriving a reliable comparison of the options based on their environmental performance. Using this LCA approach, the study can conclude that light steel can substitute light timber as the housing material to address the current national timber shortage of New Zealand due to the slight difference in carbon emissions produced by these materials.
Author Contributions
Conceptualization, A.A.D., K.R. and J.B.P.L.; methodology, A.A.D. and K.R.; software, A.A.D.; formal analysis, A.A.D.; investigation, A.A.D.; resources, A.A.D. and K.R.; writing—original draft preparation, A.A.D., K.R., R.M. and Z.F.; writing—review and editing, A.A.D., K.R., Z.F. and J.B.P.L.; visualization, A.A.D.; supervision, K.R. and J.B.P.L.; project administration, K.R. All authors have read and agreed to the published version of the manuscript.
Funding
This research received no external funding.
Institutional Review Board Statement
Not applicable.
Informed Consent Statement
Not applicable.
Data Availability Statement
Not applicable.
Acknowledgments
The authors would like to thank the PT Construction Ltd. and SteelHaus Ltd. for sharing the drawings of the two houses and for the material quantities provided for both houses.
Conflicts of Interest
The authors declare no conflict of interest.
References
- UN-Habitat. The Role of Land in Achieving Adequate and Affordable Housing. Retrieved from Nairobi, Kenya. 2021. Available online: https://unhabitat.org/sites/default/files/2021/09/the_role_of_land_in_adequate_housing_final.pdf (accessed on 20 November 2021).
- Pan, W.; Dainty, A.R.J.; Gibb, A.G.F. Establishing and Weighting Decision Criteria for Building System Selection in Housing Construction. J. Constr. Eng. Manag. 2012, 138, 1239–1250. [Google Scholar] [CrossRef] [Green Version]
- Ministry of Business, Innovation & Employment. Building for Climate Change: Transforming the Building and Construction Sector to Reduce Emissions and Improve Climate Resilience; MBIE: Wellington, New Zealand, 2020; p. 10. Available online: https://www.mbie.govt.nz/dmsdocument/11522-building-for-climate-change (accessed on 25 November 2021).
- Watkiss, P.; Downing, T.; Handley, C.; Butterfield, R. The Impacts and Costs of Climate Change; European Commission DG Environment: Brussels, Belgium, 2005. [Google Scholar]
- UNEP. Buildings and Climate Change: Summary for Decision Makers; United Nations Environment Programme: Paris, France, 2009. [Google Scholar]
- Ministry of Business, Innovation & Employment. Whole-of-Life Embodied Carbon Emissions Reduction Framework; MBIE: Wellington, New Zealand, 2020; p. 24. Available online: https://www.mbie.govt.nz/dmsdocument/11794-whole-of-life-embodied-carbon-emissions-reduction-framework (accessed on 16 November 2021).
- Ministry for the Environment. New Zealand’s Greenhouse Gas Inventory 1990–2019; Ministry for the Environment: Wellington, New Zealand, 2021. Available online: https://environment.govt.nz/assets/Publications/New-Zealands-Greenhouse-Gas-Inventory-1990-2019-Volume-1-Chapters-1-15.pdf (accessed on 5 October 2021).
- Parliamentary Counsel Office. (13 November 2019). In Climate Change Response (Zero Carbon) Amendment Act 2019 No 61, Public Act Contents—New Zealand Legislation; New Zealand Legislation: Wellington, New Zealand, 2019. Available online: https://www.legislation.govt.nz/act/public/2019/0061/latest/LMS183736.html (accessed on 12 August 2021).
- BRANZ. A Carbon Budget for New Zealand Houses. BRANZ Research Now: Zero-Carbon Built Environment; BRANZ: Porirua, New Zealand, 2020; p. 4. [Google Scholar]
- BRANZ. Research Now Physical Characteristics of New Buildings #1; BRANZ: Porirua, New Zealand, 2020; p. 6. [Google Scholar]
- Collins, M.; Barnard, T.; Bayne, K.; Duignan, A.; Shayer, S. Building Green in New Zealand: Wood—A sustainable Construction Choice; Forest Research: Rotorua, New Zealand, 2003. [Google Scholar]
- Sachdeva, S. Years More Supply Chain Pain for Construction; Newsroom: Wellington, New Zealand, 2021; Available online: https://www.newsroom.co.nz/years-more-supply-chain-pain-for-construction (accessed on 28 November 2021).
- Leys, J. We Can’t See the Wood for the Trees: Understanding New Zealand’s Wood Supply Crisis; Stuff: Wellington, New Zealand, 2021; Available online: https://www.stuff.co.nz/business/industries/300271061/we-cant-see-the-wood-for-the-trees-understanding-new-zealands-wood-supply-crisis (accessed on 28 November 2021).
- Mathison, C.; Roy, K.; Clifton, G.C.; Ahmadi, A.; Masood, R.; Lim, J.B.P. Novel pin jointed moment connection for cold-formed steel trusses. Steel Compos. Struct. 2019, 31, 453–467. [Google Scholar] [CrossRef]
- Mathieson, C.; Roy, K.; Charles Clifton, G.; Ahmadi, A.; Lim, J.B.P. Failure mechanism and bearing capacity of cold-formed steel trusses with HRC connectors. Eng. Struct. 2019, 201, 109741. [Google Scholar] [CrossRef]
- Dar, M.A.; Subramanian, N.; Rather, A.I.; Dar, A.R.; Lim, J.B.P.; Anbarasu, M.; Roy, K. Effect of angle stiffeners on the flexural strength and stiffness of cold-formed steel beams. Steel Compos. Struct. 2019, 33, 225–243. [Google Scholar] [CrossRef]
- Liang, H.; Roy, K.; Fang, Z.; Lim, J.B.P. A Critical Review on Optimization of Cold-Formed Steel Members for Better Structural and Thermal Performances. Buildings 2022, 12, 34. [Google Scholar] [CrossRef]
- Roy, K.; Lim, J.B.P.; Lau, H.H.; Yong, P.M.; Clifton, G.C.; Wrzesien, A.; Mei, C.C. Collapse behavior of a fire engineering designed single-storey cold-formed steel building in severe fires. Thin-Walled Struct. 2019, 142, 340–357. [Google Scholar] [CrossRef]
- Fang, Z.; Roy, K.; Liang, H.; Poologanathan, K.; Ghosh, K.; Mohamed, A.M.; Lim, J.B.P. Numerical Simulation and Design Recommendations for Web Crippling Strength of Cold-Formed Steel Channels with Web Holes under Interior-One-Flange Loading at Elevated Temperatures. Buildings 2021, 11, 666. [Google Scholar] [CrossRef]
- Roy, K.; Lau, H.H.; Ting, T.C.H.; Chen, B.; Lim, J.B.P. Flexural capacity of gapped built-up cold-formed steel channel sections including web stiffeners. J. Constr. Steel Res. 2020, 172, 106154. [Google Scholar] [CrossRef]
- Chen, B.S.; Roy, K.; Fang, Z.Y.; Uzzaman, A.; Raftery, G.; Lim, J.B.P. Moment capacity of back-to-back cold-formed steel channels with edge-stiffened holes, un-stiffened holes, and plain webs. Eng. Struct. 2021, 235, 112042. [Google Scholar] [CrossRef]
- Chen, B.S.; Roy, K.; Fang, Z.Y.; Uzzaman, A.; Chi, Y.H.; Lim, J.B.P. Web crippling capacity of fastened cold-formed steel channels with edge-stiffened web holes, un-stiffened web holes and plain webs under two-flange loading. Thin-Walled Struct. 2021, 163, 107666. [Google Scholar] [CrossRef]
- Roy, K.; Ting, T.C.H.; Lau, H.H.; Lim, J.B.P. Experimental Investigation into the Behavior of Back-to-Back Gapped Built-up Cold-Formed Steel Channel Sections under Compression. Int. Spec. Conf. Cold-Form. Steel Struct. 2018, 3, 283–297. [Google Scholar]
- Beulah Gnana Ananthi, G.; Roy, K.; Lim, J.B.P. Experimental and numerical investigations on axial strength of back-to-back built-up cold-formed steel angle columns. Steel Compos. Struct. 2019, 31, 601–615. [Google Scholar]
- Schafer, B.W. Local, distortional, and euler buckling of thin-walled columns. J. Struct. Eng. 2002, 128, 289–299. [Google Scholar] [CrossRef]
- Chi, Y.H.; Roy, K.; Chen, B.S.; Fang, Z.Y.; Uzzaman, A.; Beulah Gnana Ananthi, G.; Lim, J.B.P. Effect of web hole spacing on axial capacity of back-to-back cold-formed steel channels with edge-stiffened holes. Steel Compos. Struct. 2021, 40, 287–305. [Google Scholar]
- Fang, Z.Y.; Roy, K.; Chen, B.S.; Sham, C.-W.; Hajirasouliha, I.; Lim, J.B.P. Deep learning-based procedure for structural design of cold-formed steel channel sections with edge-stiffened and un-stiffened holes under axial compression. Thin-Walled Struct. 2021, 166, 108076. [Google Scholar] [CrossRef]
- Fang, Z.Y.; Roy, K.; Mares, J.; Sham, C.-W.; Chen, B.S.; Lim, J.B.P. Deep learning-based axial capacity prediction for cold-formed steel channel sections using Deep Belief Network. Structures 2021, 33, 2792–2802. [Google Scholar] [CrossRef]
- Chen, B.S.; Roy, K.; Fang, Z.Y.; Uzzaman, A.; Pham, C.H.; Raftery, G.; Lim, J.B.P. Shear behavior and design cold-formed steel channels with edge-stiffened hole, un-stiffened hole, and plain web. ASCE J. Struct. Eng. 2021, 04021268. [Google Scholar]
- Nie, S.; Zhou, T.; Liao, F.; Yang, D. Study on axial compressive behavior of quadruple C-channel built-up cold-formed steel columns. Struct. Eng. Mech. 2019, 70, 499–511. [Google Scholar]
- Chen, B.; Roy, K.; Uzzaman, A.; Raftery, G.; Lim, J.B.P. Axial strength of back-to-back cold-formed steel channels with edge-stiffened holes, un-stiffened holes and plain webs. J. Constr. Steel Res. 2020, 174, 106313. [Google Scholar] [CrossRef]
- Ananthi, G.B.G.; Roy, K.; Chen, B.; Lim, J.B.P. Testing, simulation and design of back-to-back built-up cold-formed steel unequal angle sections under axial compression. Steel Compos. Struct. 2019, 33, 595–614. [Google Scholar]
- Borzoo, S.; Ghaderi, S.R.M.; Mohebi, S.; Rahimzadeh, A. Nonlinear finite element modeling of steel-sheathed cold-formed steel shear walls. Steel Compos. Struct. 2016, 22, 79–89. [Google Scholar] [CrossRef]
- Rosario-Galanes, O.; Godoy, L.A. Modeling of wind-induced fatigue of cold-formed steel sheet panels. Struct. Eng. Mech. 2014, 49, 237–259. [Google Scholar] [CrossRef]
- Ortiz-Rodríguez, O.; Castells, F.; Sonnemann, G. Life cycle assessment of two dwellings: One in Spain, a developed country, and one in Colombia, a country under development. Sci. Total Environ. 2010, 408, 2435–2443. [Google Scholar] [CrossRef] [PubMed]
- Rebitzer, G.; Ekvall, T.; Frischknecht, R.; Hunkeler, D.; Norris, G.; Rydberg, T.; Schmidt, W.-P.; Suh, S.; Weidema, B.P.; Pennington, D.W. Life cycle assessment: Part 1: Framework, goal and scope definition, inventory analysis, and applications. Environ. Int. 2004, 30, 701–720. [Google Scholar] [CrossRef] [PubMed]
- Olsen, S.I.; Christensen, F.M.; Hauschild, H.; Pedersen, F.; Larsen, H.F.; Torslov, J. Life cycle impact assessment and risk assessment of chemicals in a methodological comparison. Environ. Impact Assess. Rev. 2001, 21, 385–404. [Google Scholar] [CrossRef]
- Vilches, A.; Martinez, A.; Montanes, B. Life cycle assessment (LCA) of building refurbishment: A literature review. Energy Build. 2017, 135, 286–301. [Google Scholar] [CrossRef]
- Giordano, R.; Gallina, F.; Quaglio, B. Analysis and Assessment of the Building Life Cycle. Indicators and Tools for the Early Design Stage. Sustainability 2021, 13, 6467. [Google Scholar] [CrossRef]
- Emami, N.; Heinonen, J.; Marteinsson, B.; Säynäjoki, A.; Junnonen, J.-M.; Laine, J.; Junnila, S. A Life Cycle Assessment of Two Residential Buildings Using Two Different LCA Database-Software Combinations: Recognizing Uniformities and Inconsistencies. Buildings 2019, 9, 20. [Google Scholar] [CrossRef] [Green Version]
- Cabeza, L.F.; Rincón, L.; Vilariño, V.; Pérez, G.; Castell, A. Life cycle assessment (LCA) and life cycle energy analysis (LCEA) of buildings and the building sector: A review. Renew. Sustain. Energy Rev. 2014, 29, 394–416. [Google Scholar] [CrossRef]
- Säynäjoki, A.; Heinonen, J.; Junnila, S.; Horvath, A. Can life-cycle assessment produce reliable policy guidelines in the building sector? Environ. Res. Lett. 2017, 12, 013001. [Google Scholar] [CrossRef] [Green Version]
- Xue, Z.; Liu, H.; Zhang, Q.; Wang, J.; Fan, J.; Zhou, X. The Impact Assessment of Campus Buildings Based on a Life Cycle Assessment–Life Cycle Cost Integrated Model. Sustainability 2019, 12, 294. [Google Scholar] [CrossRef] [Green Version]
- Rashid, A.F.A.; Yusoff, S. A review of life cycle assessment method for building industry. Renew. Sustain. Energy Rev. 2015, 45, 244–248. [Google Scholar] [CrossRef] [Green Version]
- Khasreen, M.M.; Banfill, P.F.G.; Menzies, G.F. Life-Cycle Assessment and the Environmental Impact of Buildings: A Review. Sustainability 2009, 1, 674–701. [Google Scholar] [CrossRef]
- Alhazmi, H.; Alduwais, A.; Tabbakh, T.; Aljamlani, S.; Alkahlan, B.; Kurdi, A. Environmental Performance of Residential Buildings: A Life Cycle Assessment Study in Saudi Arabia. Sustainability 2021, 13, 3542. [Google Scholar] [CrossRef]
- Petrovic, B.; Myhren, J.A.; Zhang, X.; Wallhagen, M.; Eriksson, O. Life cycle assessment of a wooden single-family house in Sweden. Appl. Energy 2019, 251, 113253. [Google Scholar] [CrossRef]
- Chastas, P.; Theodosiou, T.; Kontoleon, K.J.; Bikas, D. Normalising and assessing carbon emissions in the building sector: A review on the embodied CO2 emissions of residential buildings. Build. Environ. 2018, 130, 212–226. [Google Scholar] [CrossRef]
- Vitale, P.; Spagnuolo, A.; Lubritto, C.; Arena, U. Environmental performances of residential buildings with a structure in cold formed steel or reinforced concrete. J. Clean. Prod. 2018, 189, 839–852. [Google Scholar] [CrossRef]
- Hawkins, W.; Cooper, S.; Allen, S.; Roynon, J.; Ibell, T. Embodied carbon assessment using a dynamic climate model: Case-study comparison of a concrete, steel and timber building structure. Structures 2021, 33, 90–98. [Google Scholar] [CrossRef]
- Johnston, R.P.; McGrath, T.; Nanukuttan, S.; Lim, J.B.; Soutsos, M.; Chiang, M.C.; Masood, R.; Rahman, M.A. Sustainability of Cold-formed Steel Portal Frames in Developing Countries in the Context of Life Cycle Assessment and Life Cycle Costs. Structures 2018, 13, 79–87. [Google Scholar] [CrossRef]
- Moradibistouni, M.; Vale, B.; Isaacs, N. Evaluating the use of polymers in residential buildings: Case study of a single storey detached house in New Zealand. J. Build. Eng. 2020, 32, 101517. [Google Scholar] [CrossRef]
- Chandrakumar, C.; McLaren, S.J.; Dowdell, D.; Jaques, R. A science-based approach to setting climate targets for buildings: The case of a New Zealand detached house. Build. Environ. 2020, 169, 106560. [Google Scholar] [CrossRef]
- Rasmussen, F.N.; Andersen, C.E.; Wittchen, A.; Hansen, R.N.; Birgisdóttir, H. Environmental Product Declarations of Structural Wood: A Review of Impacts and Potential Pitfalls for Practice. Buildings 2021, 11, 362. [Google Scholar] [CrossRef]
- Janjua, S.Y.; Sarker, P.K.; Biswas, W.K. Impact of Service Life on the Environmental Performance of Buildings. Buildings 2019, 9, 9. [Google Scholar] [CrossRef] [Green Version]
- BRANZ. LCAQuick, Version 3.4.3. Computer Software. BRANZ: New Zealand, UK,, 1970. Available online: https://www.branz.co.nz/environment-zero-carbon-research/framework/lcaquick/(accessed on 27 July 2021).
- ISO Standard No. 14040:2006; Environmental Management—Life Cycle Assessment—Principles and Framework. ISO: Geneva, Switzerland. 2006. Available online: https://www.iso.org/standard/37456.html (accessed on 15 September 2021).
- BS EN 15978:2011; Sustainability of Construction Works. Assessment of Performance of Buildings. Calculation Method. European Standards: Pilsen, Czech Republic, 2011. Available online: https://www.en-standard.eu/bs-en-15978-2011-sustainability-of-construction-works-assessment-of-environmental-performance-of-buildings-calculation-method/ (accessed on 15 September 2021).
- BRANZ. (n.d.). Data. Retrieved. 27 July 2021. Available online: https://www.branz.co.nz/environment-zero-carbon-research/framework/data/ (accessed on 27 July 2021).
- Electricity Authority. Electricity in New Zealand. Electricity Authority. 2018. Available online: https://www.ea.govt.nz/assets/dms-assets/20/20410Electricity-in-NZ-2018.pdf (accessed on 14 October 2021).
- Wang, Z.; Liu, F. Chapter 7—Environmental assessment tools. In Industrial Ventilation Design Guidebook, 2nd ed.; Goodfellow, H.D., Wang, Y., Eds.; Academic Press: Cambridge, MA, USA, 2021; pp. 435–448. [Google Scholar] [CrossRef]
- Jolliet, O.; Müller-Wenk, R.; Bare, J.; Brent, A.; Goedkoop, M.; Heijungs, R.; Itsubo, N.; Peña, C.; Pennington, D.; Potting, J.; et al. The LCIA midpoint-damage framework of the UNEP/SETAC life cycle initiative. Int. J. Life Cycle Assess. 2004, 9, 394. [Google Scholar] [CrossRef] [Green Version]
- Bare, J.C.; Hofstetter, P.; Pennington, D.W.; De Haes, H.A.U. Midpoints versus endpoints: The sacrifices and benefits. Int. J. Life Cycle Assess. 2000, 5, 319. [Google Scholar] [CrossRef] [Green Version]
- Saber, M.; Eğilmez, G.; Gedik, R.; Park, Y. A Comparative Time-Series Investigation of China and U.S. Manufacturing Industries’ Global Supply-Chain-Linked Economic, Mid and End-Point Environmental Impacts. Sustainability 2021, 13, 5819. [Google Scholar] [CrossRef]
- Cole, R.J.; Kernan, P.C. Life-cycle energy use in office buildings. Build. Environ. 1996, 31, 307–317. [Google Scholar] [CrossRef]
- Allan, K.; Phillips, A.R. Comparative Cradle-to-Grave Life Cycle Assessment of Low and Mid-Rise Mass Timber Buildings with Equivalent Structural Steel Alternatives. Sustainability 2021, 13, 3401. [Google Scholar] [CrossRef]
- Kaethner, S.C.; Yang, F. Environmental impacts of structural materials—Finding a rational approach to default values for software. Struct. Eng. 2011, 89, 7. [Google Scholar]
- BRANZ. BRANZ CO2nstruct Database; BRANZ: Porirua, New Zealand, 2019; Available online: https://www.branz.co.nz/environment-zero-carbon-research/framework/branz-co2nstruct/ (accessed on 18 October 2021).
- Steel Recycling Institute. Environmental Product Declaration: Cold-Formed Steel Studs and Track; Steel Recycling Institute: Pittsburgh, PA, USA, 2016; Available online: https://cdn.scscertified.com/products/cert_pdfs/SCS-EPD-03838_SRI_CFS-Stud-Track_011916_web.pdf?r=1 (accessed on 16 August 2021).
- Rashid, A.F.A.; Idris, J.; Yusoff, S. Environmental Impact Analysis on Residential Building in Malaysia Using Life Cycle Assessment. Sustainability 2017, 9, 329. [Google Scholar] [CrossRef] [Green Version]
Publisher’s Note: MDPI stays neutral with regard to jurisdictional claims in published maps and institutional affiliations. |
© 2022 by the authors. Licensee MDPI, Basel, Switzerland. This article is an open access article distributed under the terms and conditions of the Creative Commons Attribution (CC BY) license (https://creativecommons.org/licenses/by/4.0/).