Article

Effect of Silica Fume and Polyvinyl Alcohol Fiber on Mechanical Properties and Frost Resistance of Concrete

College of Civil Engineering, Architecture and Environment, Hubei University of Technology, Wuhan 430068, China
*
Author to whom correspondence should be addressed.
Buildings 2022, 12(1), 47; https://doi.org/10.3390/buildings12010047
Submission received: 5 December 2021 / Revised: 29 December 2021 / Accepted: 1 January 2022 / Published: 5 January 2022

Abstract

:
To improve the mechanical properties and frost resistance of concrete, silica fume, and polyvinyl alcohol fiber compounded in concrete. The mechanical and frost resistance of concrete were comprehensively analyzed and evaluated for strength change, mass loss, and relative dynamic elastic modulus change by compressive strength test, flexural strength test, and rapid freeze-thaw test. The results showed that with the incorporation of silica fume and polyvinyl alcohol fiber, the compressive and flexural strengths of concrete were improved, and the decrease in mass loss rate and relative dynamic elastic modulus of concrete after freeze-thaw cycles were significantly reduced, which indicated that the compounding of silica fume and polyvinyl alcohol fiber improved the frost resistance of concrete. When the content of silica fume was 10% and the volume content of polyvinyl alcohol fiber was 1%, the comprehensive mechanical performance and frost resistance of concrete is the best. The compressive strength increased by 26.6% and flexural strength increased by 29.17% compared to ordinary concrete. Based on the test data, to study the macroscopic damage evolution of concrete compound silica fume and polyvinyl alcohol fiber under repeated freeze-thaw conditions. The Weibull distribution probability model and GM (1, 1) model were established. The average relative errors between the predicted and actual data of the two models are small and very close. It is shown that both models can reflect well the development of concrete damage under a freeze-thaw environment. This provides an important reference value and theoretical basis for the durability evaluation and life prediction of compound silica fume and polyvinyl alcohol fiber concrete in cold regions.

1. Introduction

In the cold areas of northern China, freeze-thaw damage is the main factor leading to durability damage of concrete structures [1]. The alternating positive and negative changes in temperature will have a direct impact on the concrete exposed to the natural environment and shallow range, causing the water present in the concrete pores to freeze as well as melt, thus causing an increase in internal pores and cracks in the material [2,3,4]. In the long run, eventually causing the concrete to fail and destroy in durability.
Silica fume is the industrial waste produced by ferroalloy plants. Incorporating silica fume into concrete can reduce the amount of cement and save mineral resources, and its reuse has the environmental significance of improving the environment and reducing secondary pollution. Silica fume, as a type of admixture, is now widely used in the configuration of high-strength concrete in China, which not only reduces the use of cement clinker, saves energy, and reduces emissions, it also turns waste into a valuable resource. Additionally, and more importantly, silica fume has a strong activity and can play a role in volcanic ash activity and microaggregate filling reaction in concrete, which improves the mechanical properties and durability of concrete and has very broad application prospects [5,6,7]. Pi, Z.Y. et al. [8] found that after concrete was incorporated with silica fume, the microstructure of the concrete was denser, and the interfacial bonding ability was stronger by backscattered electron image analysis. Rba B. et al. [9] found that the mechanical properties of concrete prepared from silica fume were better than those of concrete prepared from other mineral materials. E. Negahban et al. [10] found that the incorporation of silica fume led to a gradual decrease in the internal pore volume and pore distribution of concrete. W. Lei et al. [11] found that the incorporation of silica fume into concrete improved the pore structure of concrete. Ghasemzadeh Mousavinejad, S.H., and Sammak, M. [12] found that the incorporation of silica fume improved the mechanical properties and durability of concrete. Barbuta M. et al. [13,14] found that silica fume incorporated polymers enhanced the compressive properties of concrete. Liu Y.W. et al. [15] improved the mechanical and fracture properties of concrete by increasing the silica fume content. Ali B. et al. [16] found that the incorporation of silica fume enhanced the flexural toughness of the concrete and effectively improved the strength of concrete. Wu, Z.M. et al. [17] studied the effect of silica fume admixture on the mechanical properties of concrete and concluded that a certain amount of silica fume admixture enhanced the flexural and tensile strength of concrete. Lu, Z. et al. [18] concluded by scanning electron microscopy and pressure pump porosity tests that incorporation of an appropriate amount of silica fume enhanced the frost resistance of concrete. Zhang, P. and Li, Q.F. [19] found through their study that the incorporation of silica fume enhanced the frost resistance of concrete and improved the relative dynamic modulus of elasticity of concrete. Luo G.B. et al. [20] found through experiments that the durability of concrete was increased with increasing silica fume content through experiments.
Polyvinyl alcohol fiber, referred to as PVA fiber, is a synthetic fiber with acid and alkali resistance, high strength, high modulus, and good impact resistance and dispersion. Its advantages as a reinforcing fiber to form building materials with high deformation capacity, self-healing, multijoint cracking, and superior tensile and fracture properties have been recognized by the material science and engineering communities [21,22,23]. H.R. Pakravan. and M. Jamshidi [24] found that the incorporation of polyvinyl alcohol fibers enhanced the ductility and strain hardening properties of gelled composites. Yew, M.K. et al. [25] found that polyvinyl alcohol fibers enhanced the compressive strength, flexural strength, and modulus of elasticity of concrete. Yao, X.P. et al. [26] found that polyvinyl alcohol fibers led to an increase in the tensile strength of gelled composites by increasing the chemical bonding energy at the matrix interface. Lei, W. et al. [27] found by analyzing the microstructure of concrete that the incorporation of polyvinyl alcohol fibers improved the internal structure of concrete. Zhang, R.B. et al. [28] concluded that the incorporation of polyvinyl alcohol fibers effectively enhanced the deformation capacity of concrete and improved the overall performance of concrete by studying the stress-strain relationship of concrete. Malik, M.A. et al. [29] found through experiments that the incorporation of polyvinyl alcohol fiber makes a good fiber bridging structure in the internal structure of concrete, which improves the mechanical properties and durability of concrete. Rikabi, F. et al. [30] found that polyvinyl alcohol fibers enhanced the freeze-thaw resistance of concrete and that the flexural strength and dynamic elastic modulus of concrete were enhanced in general. Wang, J.Q. et al. [31] found that polyvinyl alcohol fibers improved the durability and ductility of concrete by increasing the elongation and fracture energy. Zhang, P. et al. [32] incorporated different volume contents of polyvinyl alcohol fibers in concrete to improve the frost resistance of concrete, and the test results showed that the frost resistance of concrete was improved with the increase in polyvinyl alcohol fibers. It is worth noting that the content of polyvinyl alcohol fibers in this test was small. Nam, J. et al. [33] analyzed the frost resistance mechanism of polyvinyl alcohol fiber-enhanced concrete and incorporated polyvinyl alcohol fiber in the concrete. The analysis was carried out from the internal structure of concrete through a series of experiments and microscopic electron microscopy techniques. The analysis showed that adhesion between the concrete internal cementitious matrix and polyvinyl alcohol fibers occurs due to the addition of polyvinyl alcohol fibers. This presence hindered the concrete cracking and made the concrete frost resistant. Zhong, J. et al. [34] focused on the failure process of high ductility polyvinyl alcohol fiber concrete (ECC) under freeze-thaw conditions and developed a corresponding three-stage model. The model can be used to more specifically show the strength of the freezing resistance of ECC materials.
Silica fume can react with CH crystals in the interfacial layer to produce C-S-H gels with a large consumption of CH crystals. This leads to a significant increase in the interfacial bond strength of polyvinyl alcohol fibers and improves the network structure sparsity problem existing at this interface. The different characteristics of various materials make it so that satisfactory results cannot be obtained when a single material is used to strengthen the cement matrix. Compounding is the main way to achieve high performance of the cement matrix. Therefore, combining the respective advantages of silica fume and polyvinyl alcohol fiber, the purpose of this paper is to study the synergistic effect of silica fume and polyvinyl alcohol fiber on the mechanical properties and frost resistance of concrete.

2. Materials and Methods

2.1. Material

Table 1 explains the specific characteristics of the raw materials used in making concrete specimens.

2.2. Mix Proportion Design of Concrete

The concrete strength is C40, and the test block sizes are of 100 mm × 100 mm × 100 mm for the cubic test block and 100 mm × 100 mm × 400 mm for the prismatic test block. The ratio of water to cementitious material is 0.43. Silica fume is mixed into concrete at 0, 5%, 10%, and 15% of the total cement replacement rate. Polyvinyl alcohol fiber at 0.5%, 1%, and 1.5% volume rate mixed into concrete. The mix proportion designs are shown in Table 2.

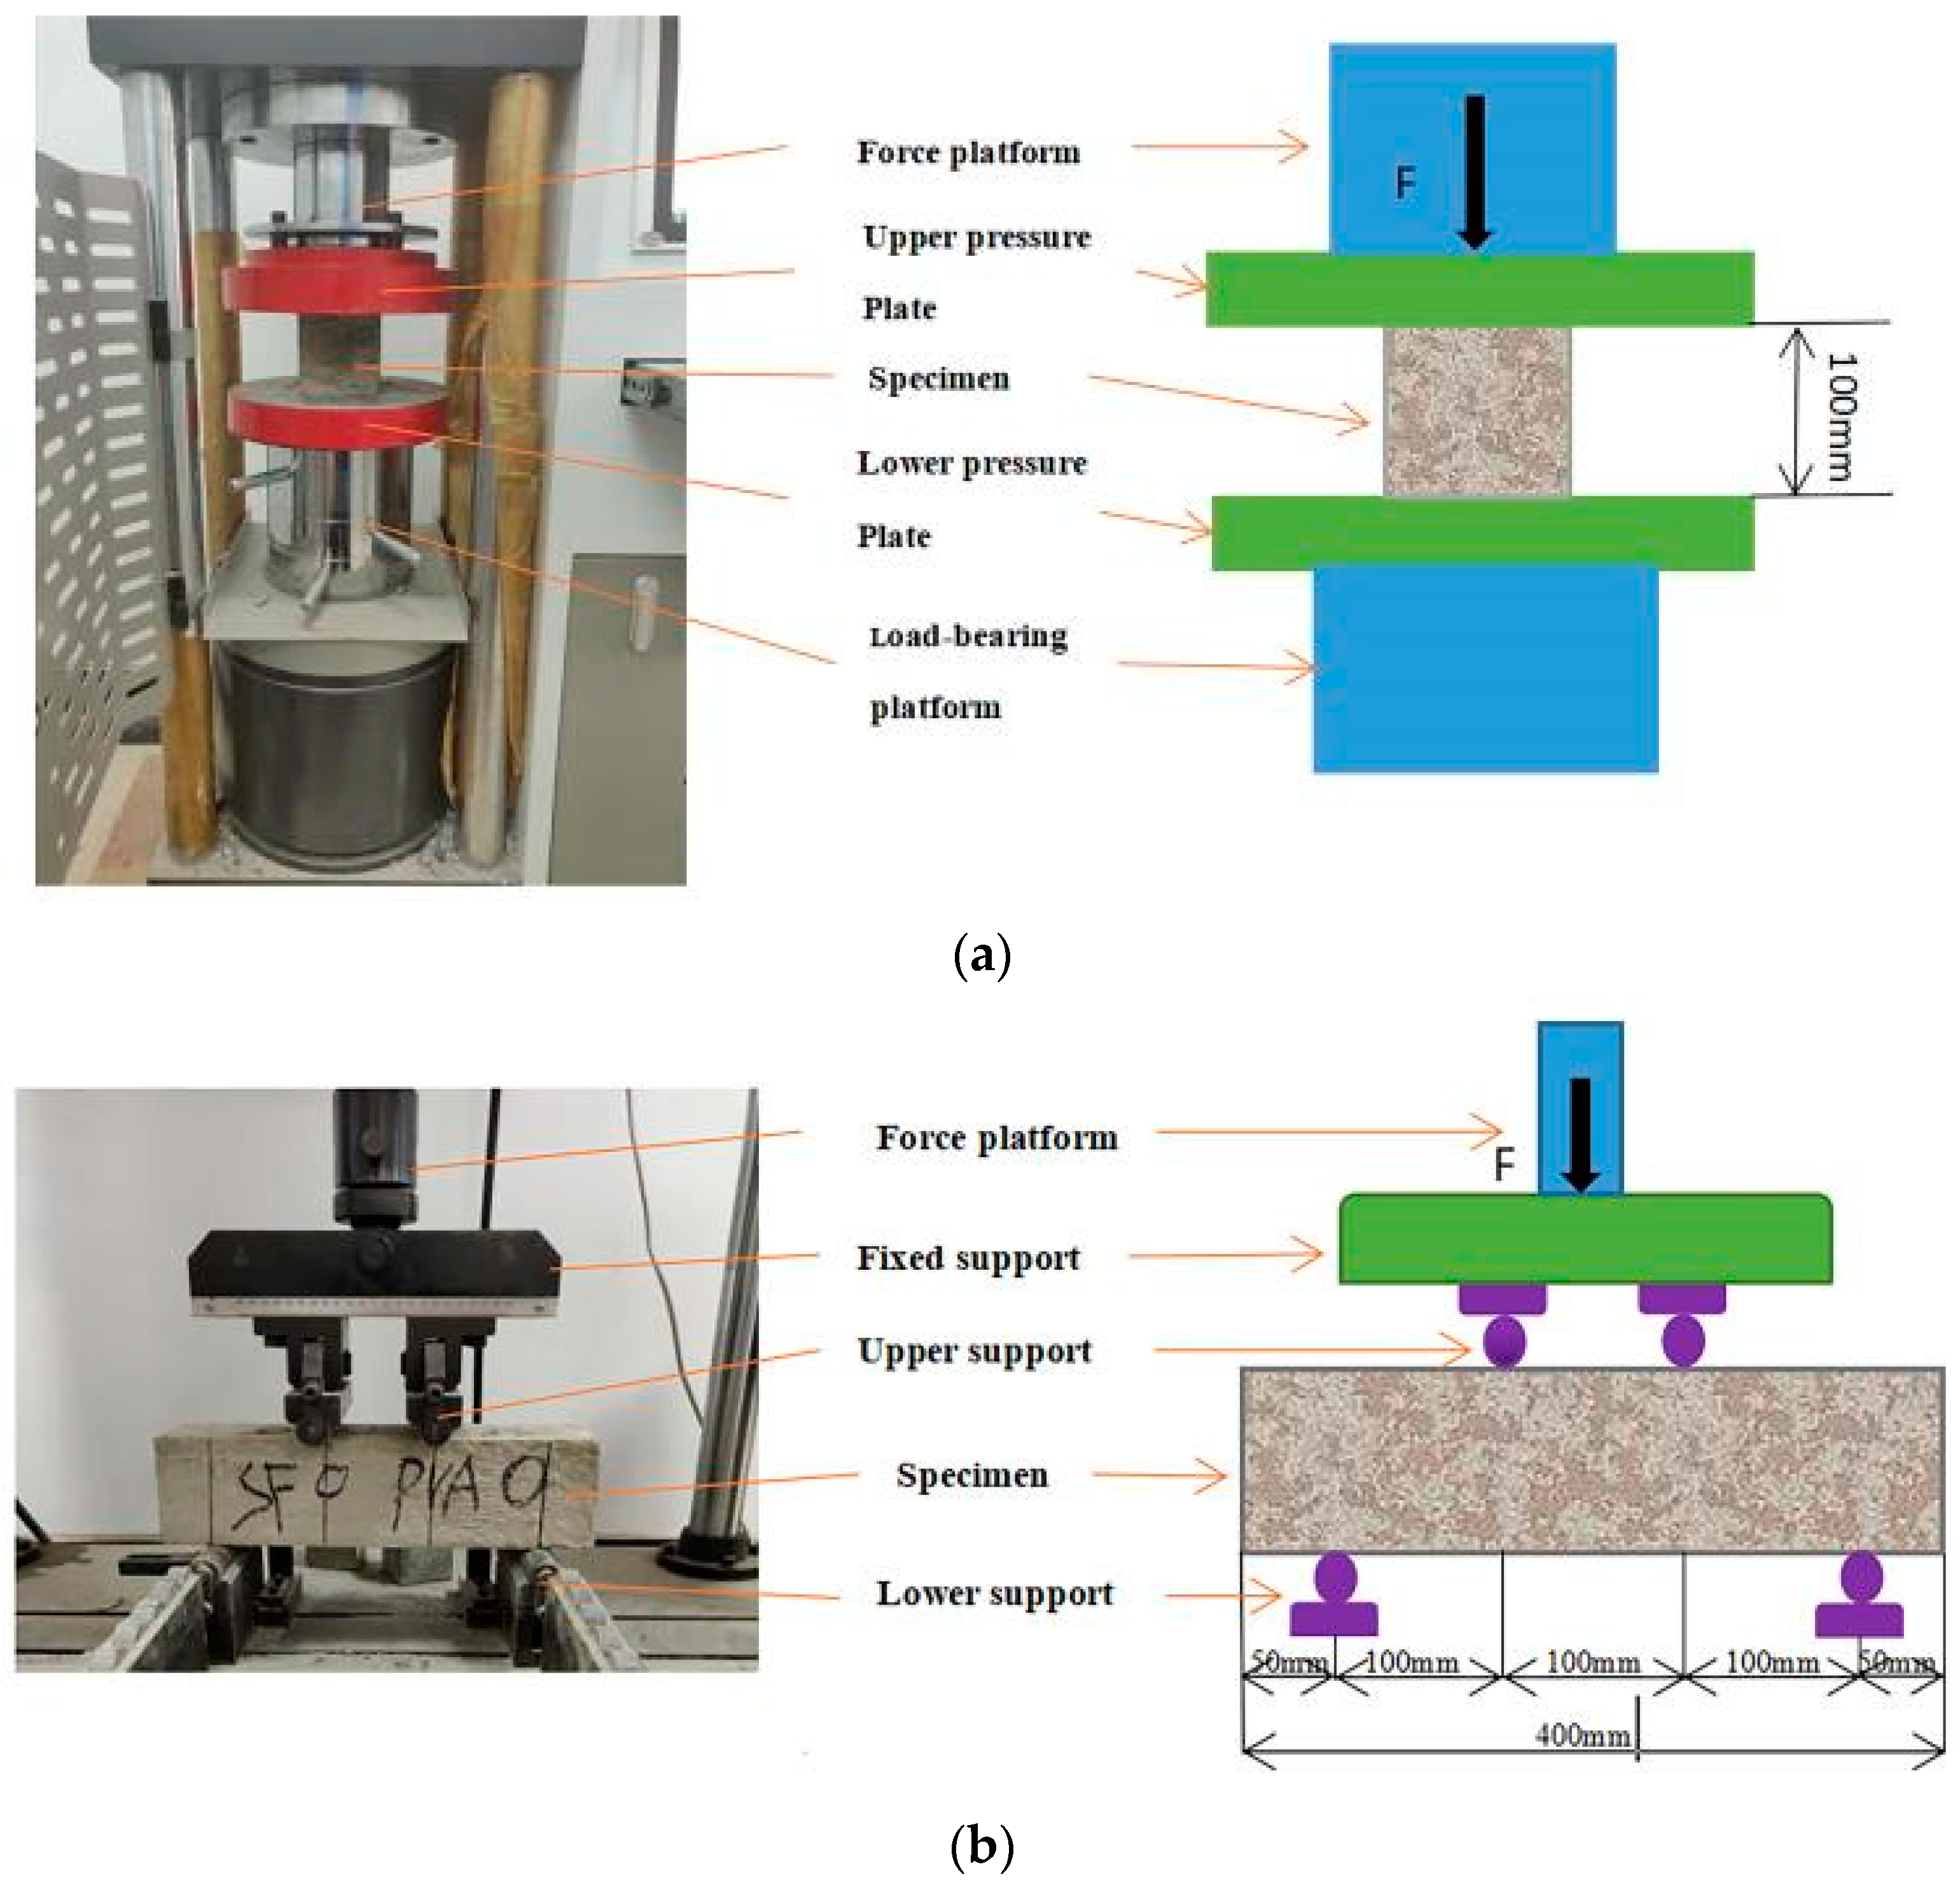
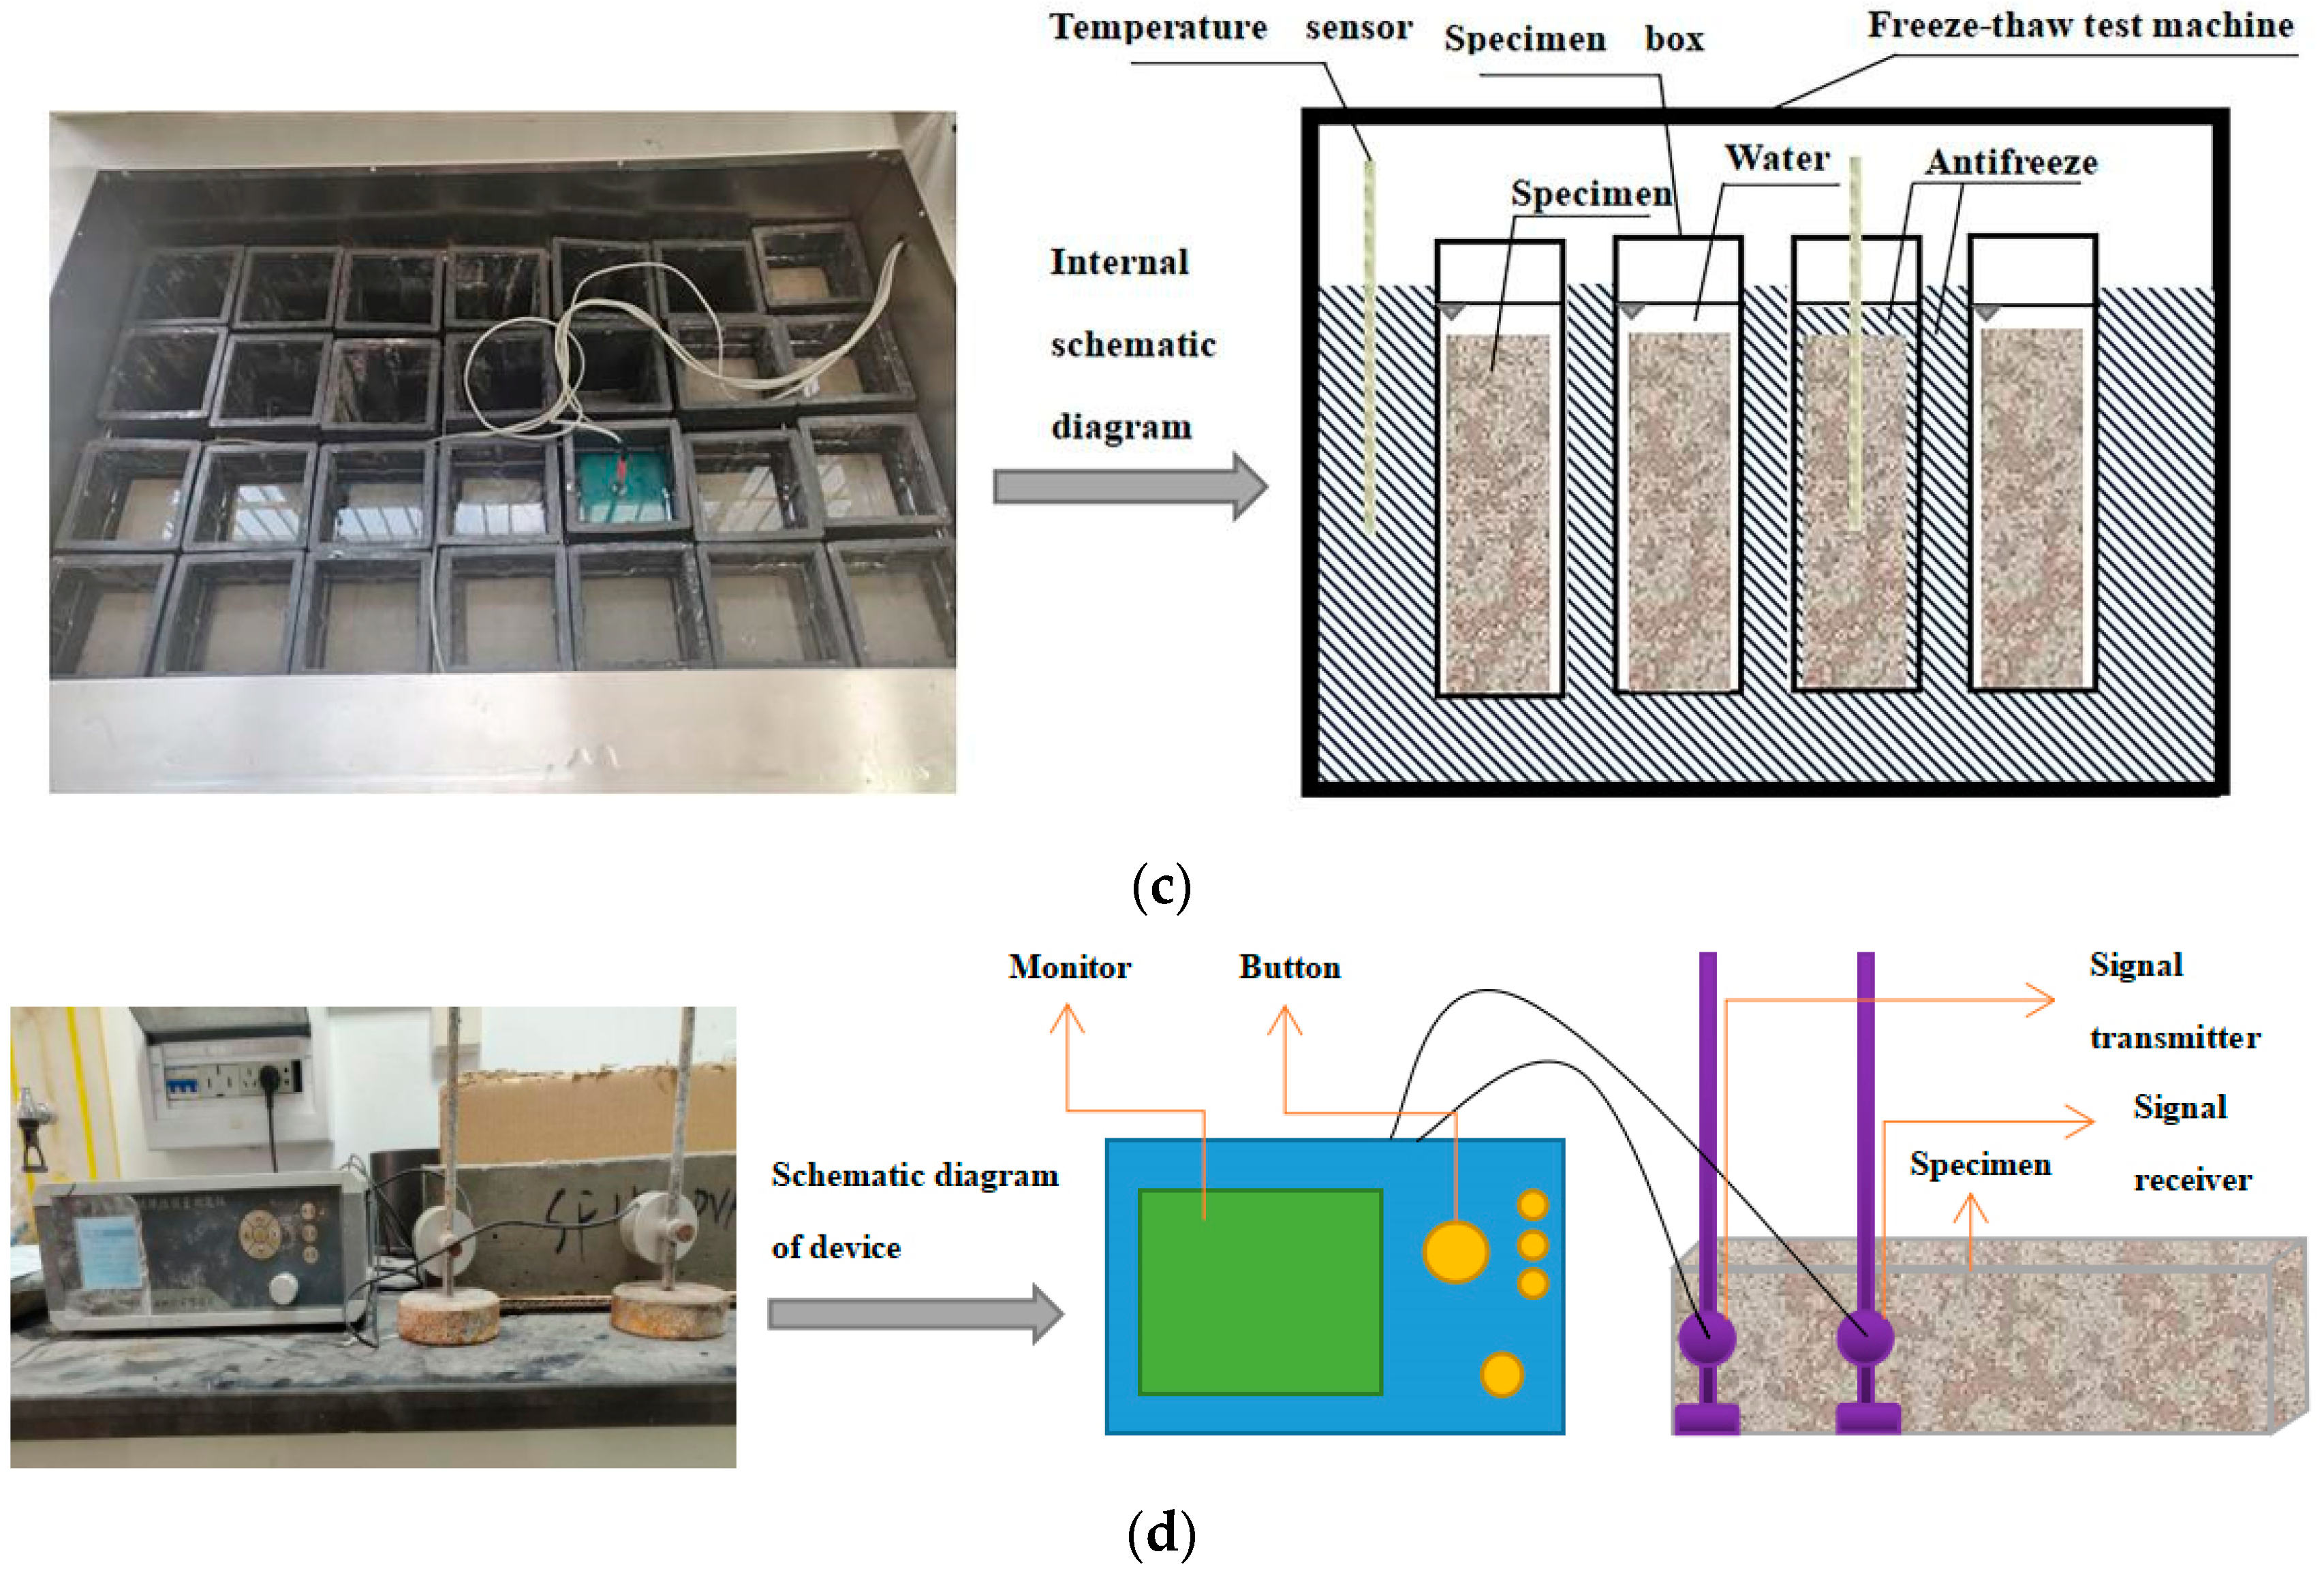
2.3. Specimen Preparation and Test Methods

An HJS-60 double-horizontal-shaft concrete test mixer (Manufactured by Zhongke Beigong Testing Instrument Co., Ltd., Cangzhou, China) was used for concrete mixing. Considering the property that polyvinyl alcohol fiber easily agglomerates, the polyvinyl alcohol fiber was dispersed before it was added to the mixer. To avoid uneven distribution of polyvinyl alcohol fiber in concrete, the mixing time is appropriately extended. In the mixing process, stone and sand were first added and mixed for 1 min, and then cement was added, followed by fly ash, and then the silica fume was added and mixed for 1 min. The treated polyvinyl alcohol fiber was added evenly into the mixer after dry stirring for 1 min. Finally, water and water reducing agents were added and mixed for 2 min. After mixing, the mixture was poured into the mold for full pounding. After pounding, the test block was placed in a cool place for 24 h to demold and then put into the standard curing room for curing treatment.
The test uses DYE-2000S microcomputer servo pressure tester (Manufactured by Zhulong Engineering Instrument Co., Ltd., Cangzhou, China) for compressive test, see Figure 1a. According to the Standard for Mechanical Properties Test Methods of General Concrete, a cube test block with a test block size of 100 mm × 100 mm × 100 mm was used for the compressive strength test. The test loading speed was 0.5 MPa/s, and the correction factor of compressive strength was taken as 0.95. Before the test, the upper and lower platens of the press were checked to be flat and that the test piece was placed in the center. After checking was completed and confirmed to be correct, the testing machine was checked for a compressive strength test. After the test block was damaged, the machine was stopped and the value recorded. There were three test blocks for each group of mix ratio, and the arithmetic mean of the three test results were taken as the compressive strength. If any value differed from the arithmetic mean by more than 15%, the value was discarded and the remaining two sets of values were averaged. If two of the values differed from the arithmetic mean by more than 15%, the test result was distorted and a new test block needed to be made.
The test used the MTS microcomputer-controlled electronic pressure tester (Manufactured by MTS SYSTEMS(CHINA) Co., Ltd., Shenzhen, China) to test the flexural strength of prismatic test blocks, as shown in Figure 1b. According to the Standard for Test Methods of Concrete Physical and Mechanical Properties GB/T 50081-2019 [35], prismatic specimens with the test block size of 100 mm × 100 mm × 400 mm were used for flexural strength test. The test loading speed was 0.08 MPa/s and the correction factor of flexural strength was taken as 0.85. Before the test, the position of the support was adjusted to align the test block position. After checking it was adjusted correctly, the tester for flexural strength test was opened. After the test block was damaged, the machine was stopped and the value recorded. There were three test blocks for each group of mix ratio, and the method of taking values was the same as that of compressive strength.
The test uses a fully automatic concrete freeze-thaw instrument to conduct a rapid freeze-thaw test (Manufactured by Tianjian Engineering Instrument Co., Ltd., Cangzhou, China); see Figure 1c. According to the Standard for Test Methods of Long-term Performance and Durability of ordinary Concrete GB/T 50082-2009 [36], a prismatic block with a test block size of 100 mm × 100 mm × 400 mm was used for the freeze-thaw cycle test. The specimens were removed from the standard curing room for 24 days and placed in (20 ± 2) °C water for 4 days. After 4 days, the initial mass of the specimens was weighed by wiping off the surface water with a wet cloth, and the dynamic elastic modulus of concrete was recorded by a concrete dynamic elastic modulus instrument (Manufactured by Wanxiang Instrument Co., Ltd., Cangzhou, China), see Figure 1d. The specimens were placed in the automatic concrete freeze-thaw tester. The mass and dynamic modulus of elasticity of the test block were recorded for a total of 150 cycles, 25 cycles each. There were three test blocks for each group of mix ratio, and the method of taking values was the same as that of compressive strength. The above measurements were to be completed as soon as possible, and then the specimen used for freeze-thawing was put back into the automatic concrete freeze-thaw tester; the test can be stopped when any of the following conditions are met: (1) 150 cycles of freeze-thawing are reached, (2) the relative dynamic elastic modulus of the specimen drops to 60%, or (3) the mass loss rate of the specimen reaches 5%.

3. Results and Discussion

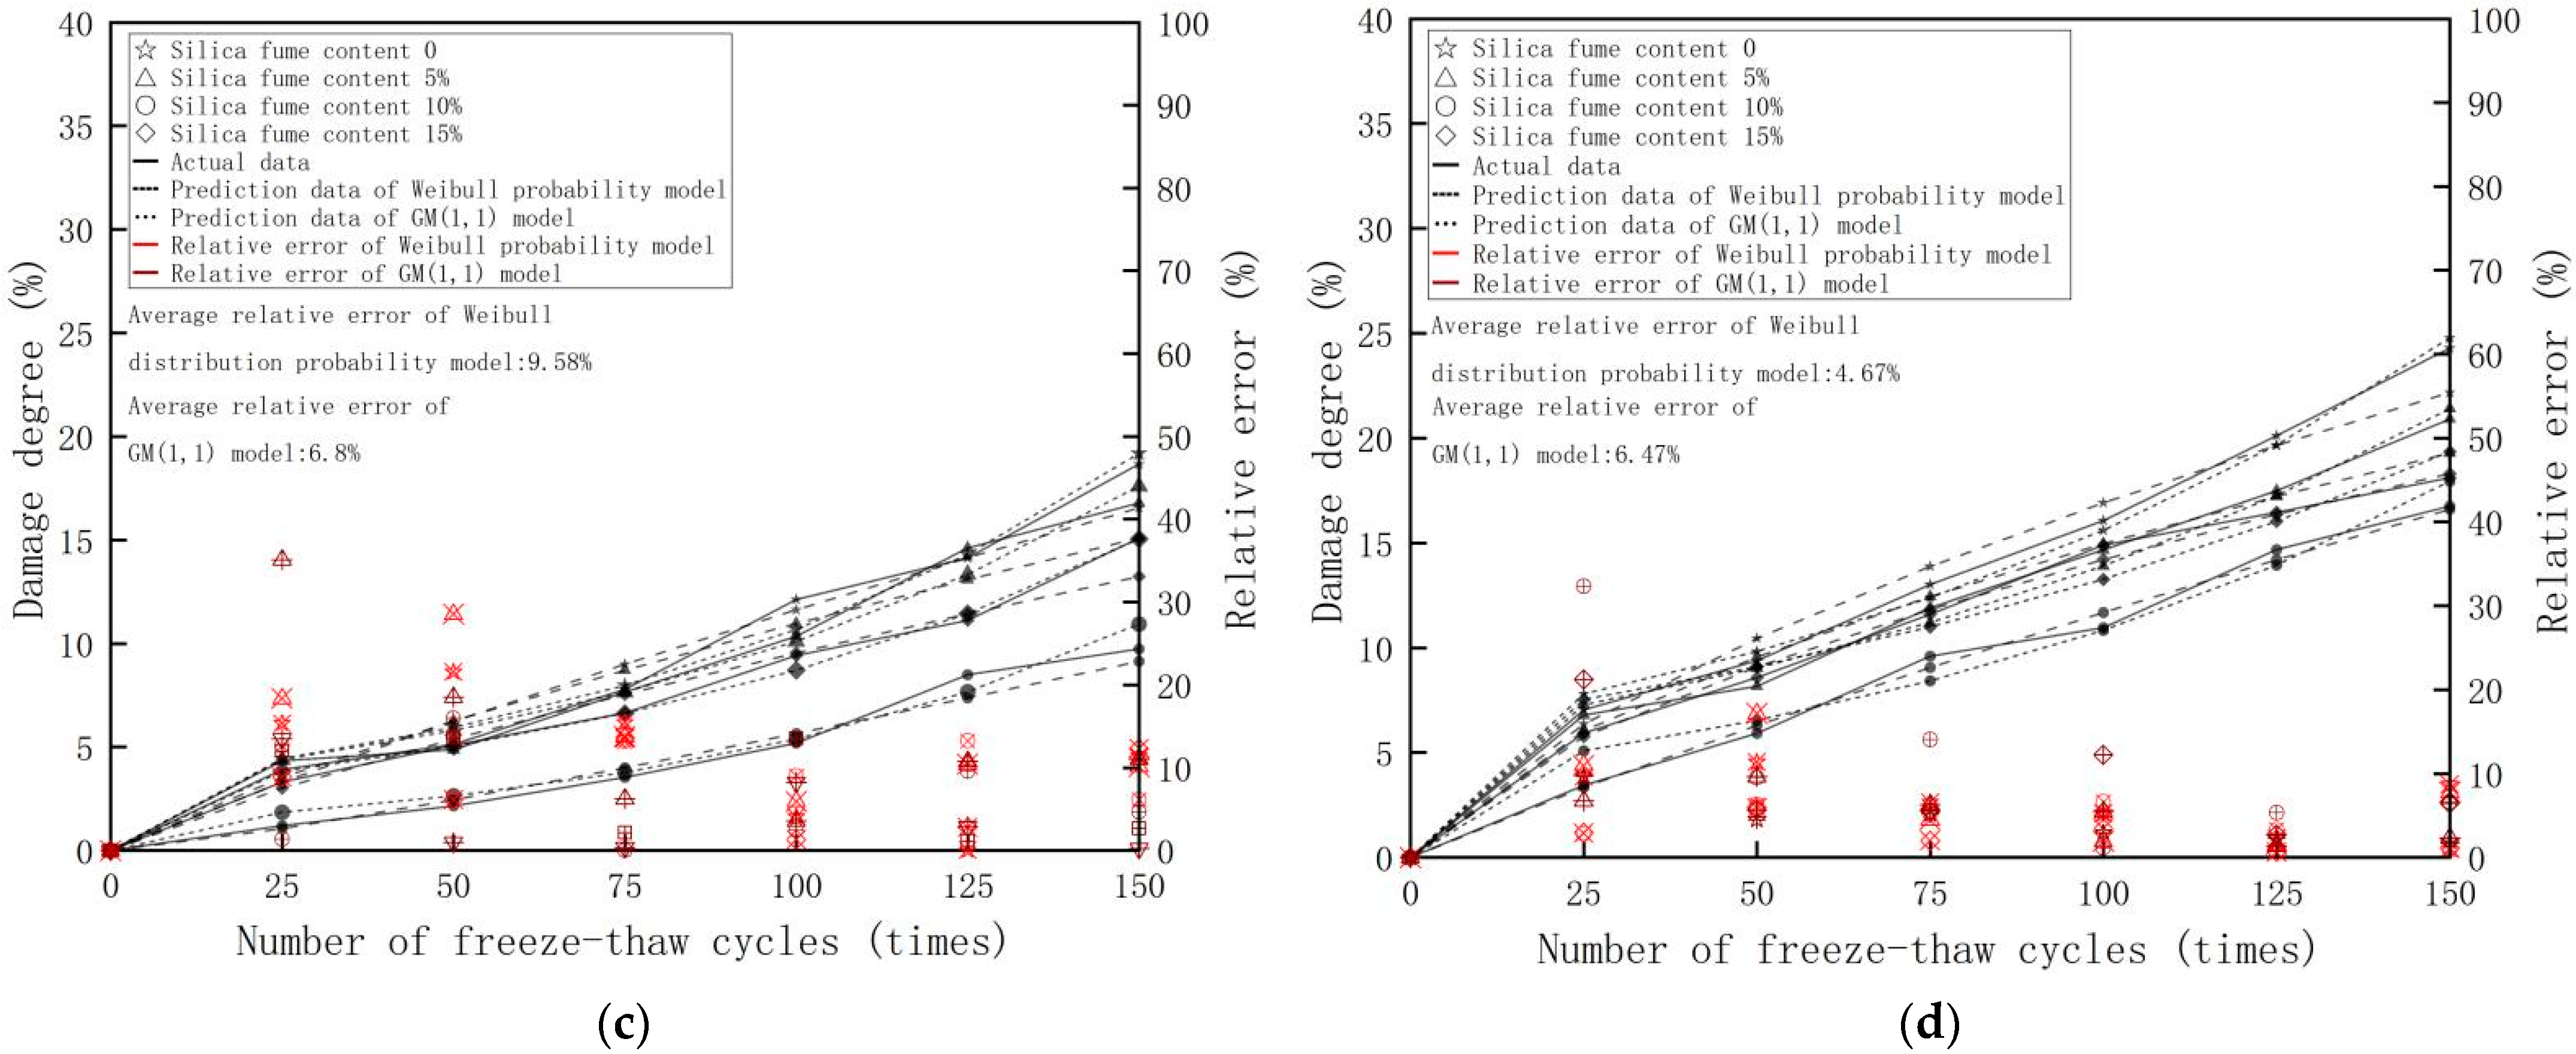
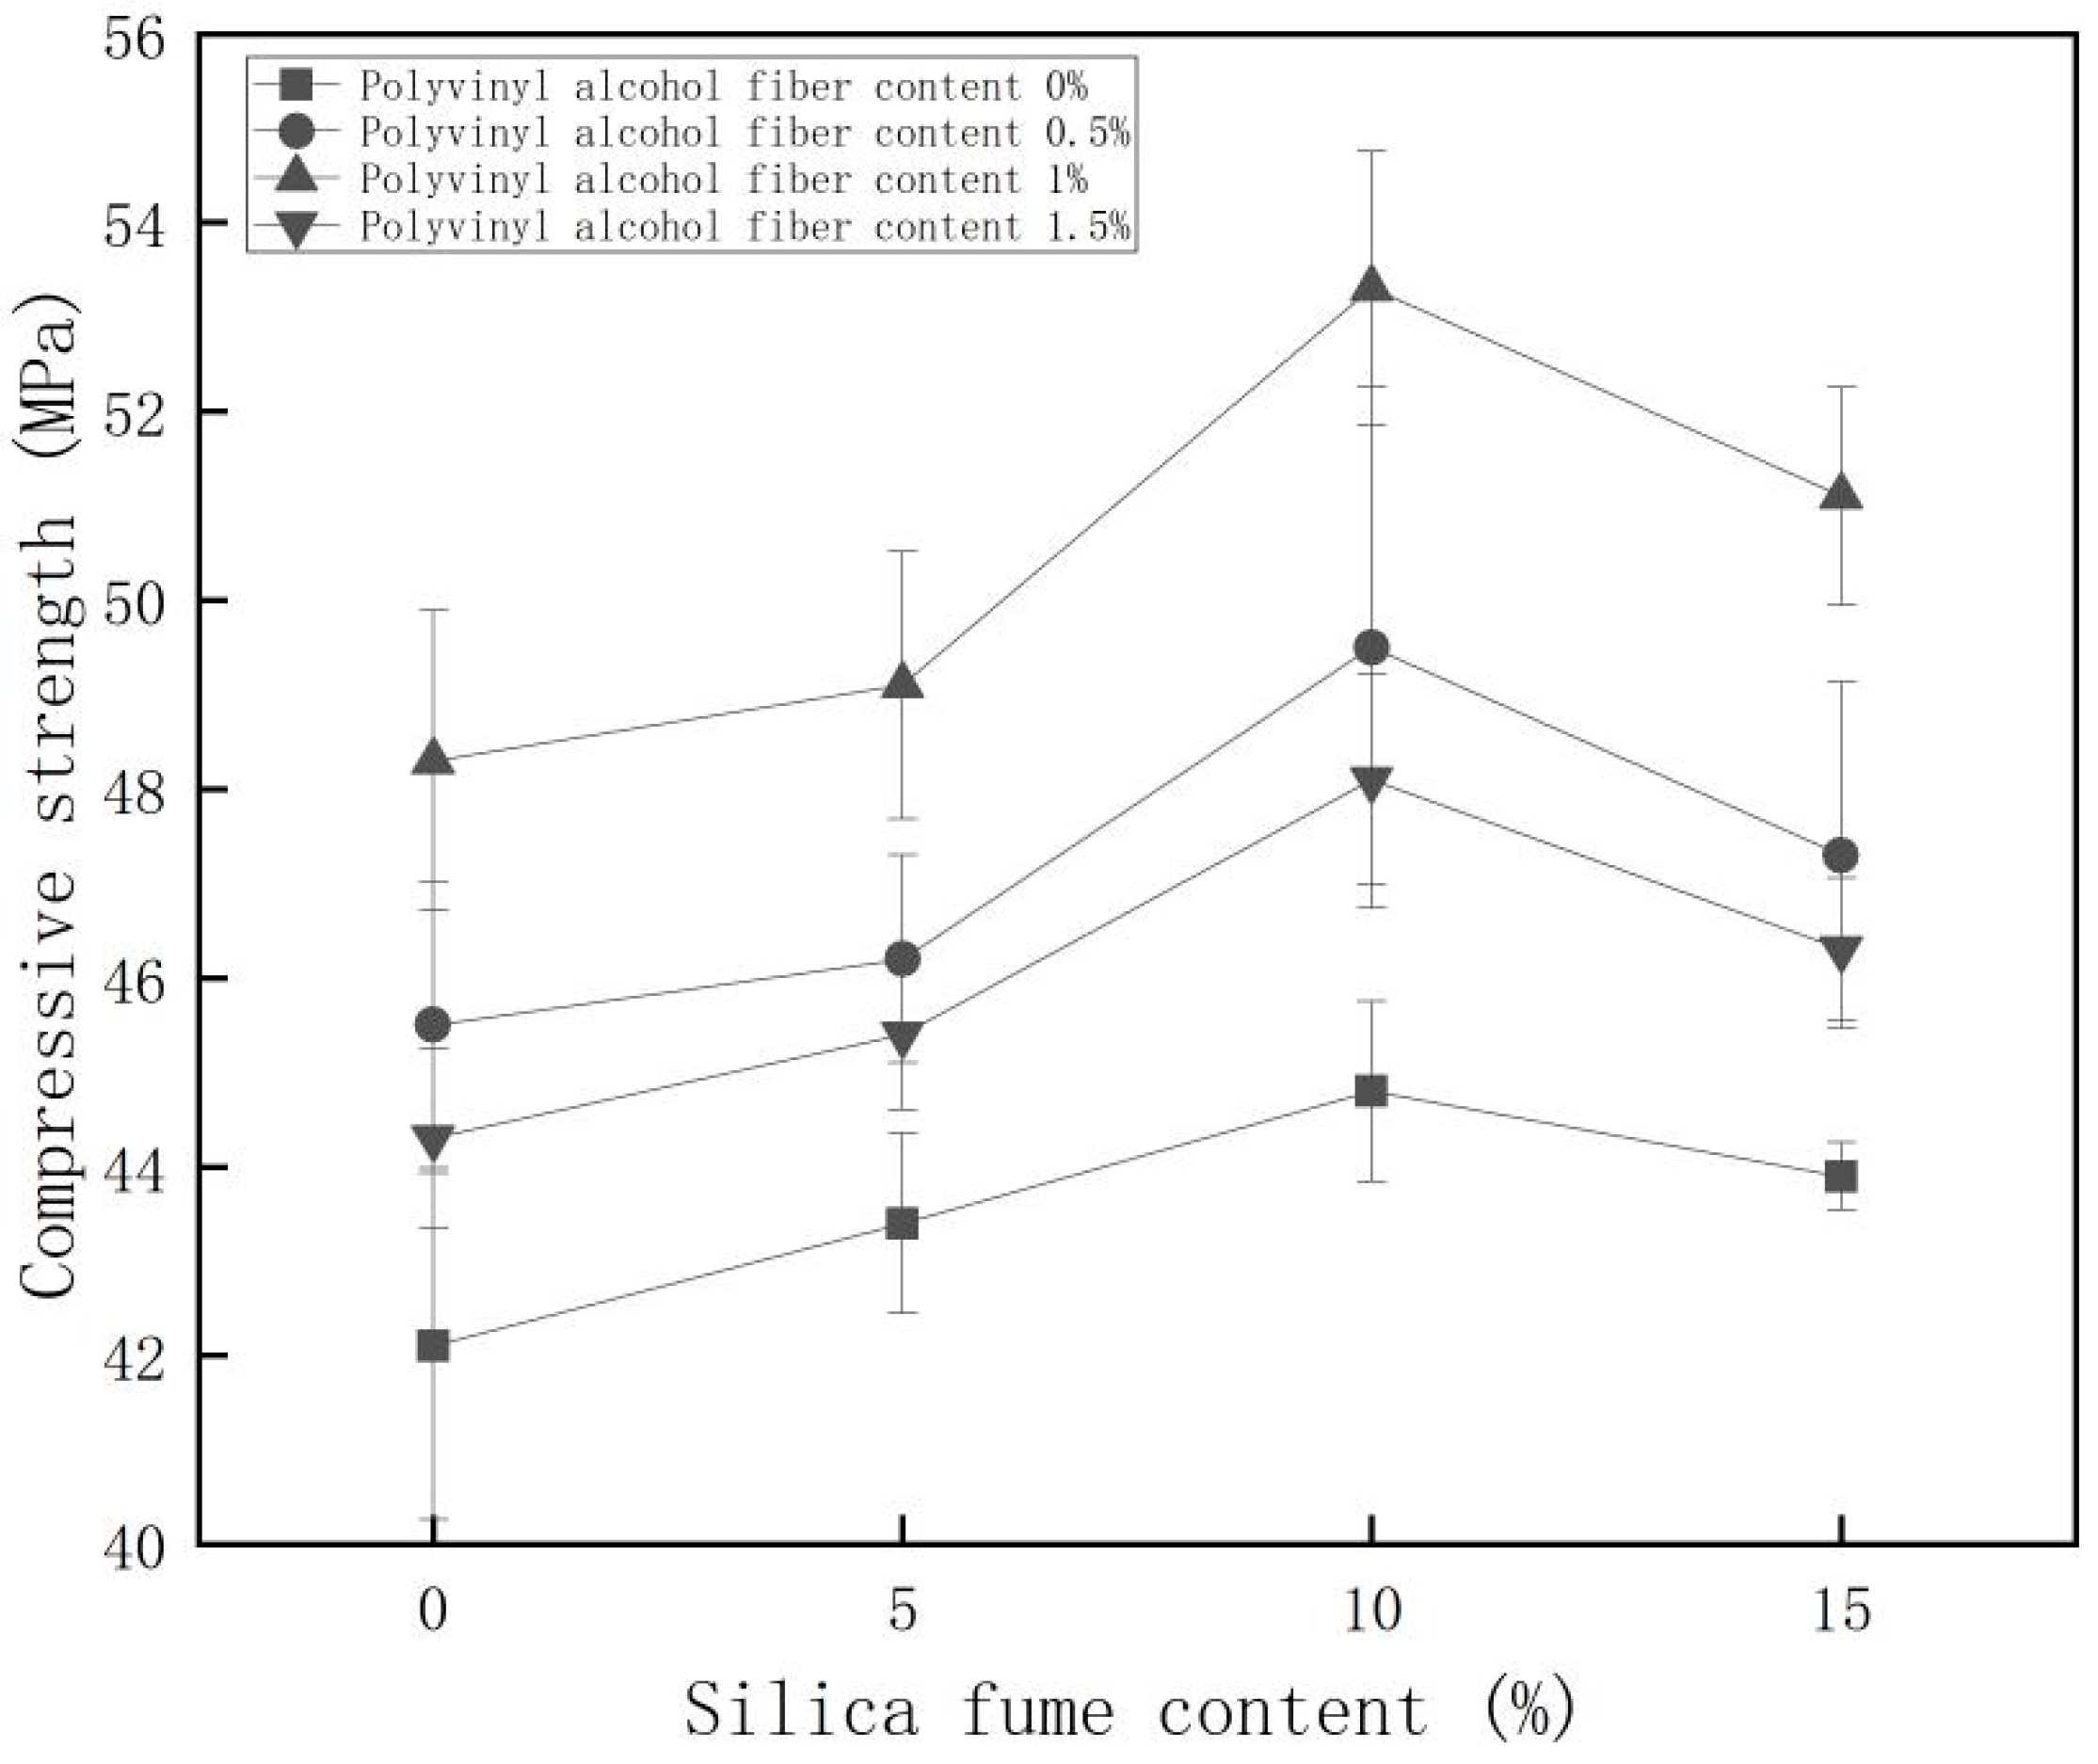
3.1. Compressive Strength

The variation in compressive strength is shown in Figure 2. Figure 2 showed that the compressive strength generally increased with the content of silica fume under the condition of constant polyvinyl alcohol fiber content. The compressive strength reached its maximum value when the silica fume content reached 10%, and the highest growth rate of compressive strength reached 10.35%. When the content of silica fume remained unchanged, the compressive strength increased and then decreased with increasing polyvinyl alcohol fiber content. When the fiber content increased from 0 to 1%, the compressive strength increased significantly, and the highest growth rate of compressive strength reached 18.97%. Then, the compressive strength started to decrease with increasing fiber content. When the content of silica fume was 10% and the content of polyvinyl alcohol fiber was 1%, the compressive strength of concrete was highest, and the compressive strength of concrete was increased by 26.6% compared with that of ordinary concrete.
We used contour plots to analyze the effect of interaction between silica fume and polyvinyl alcohol fibers on compressive strength. The contour plot of compressive strength is shown in Figure 3. From Figure 3, it could be seen that the color changed from blue to red gradually with the increase of material content in the contour map, which indicated that the compressive strength was generally improved with the compounding of silica fume and polyvinyl alcohol fiber, and the density of contour lines in the horizontal coordinate was greater than the density of contour lines in the vertical coordinate in the contour plot. This indicated that the effect of polyvinyl alcohol fiber content on compressive strength was greater than that of silica fume.

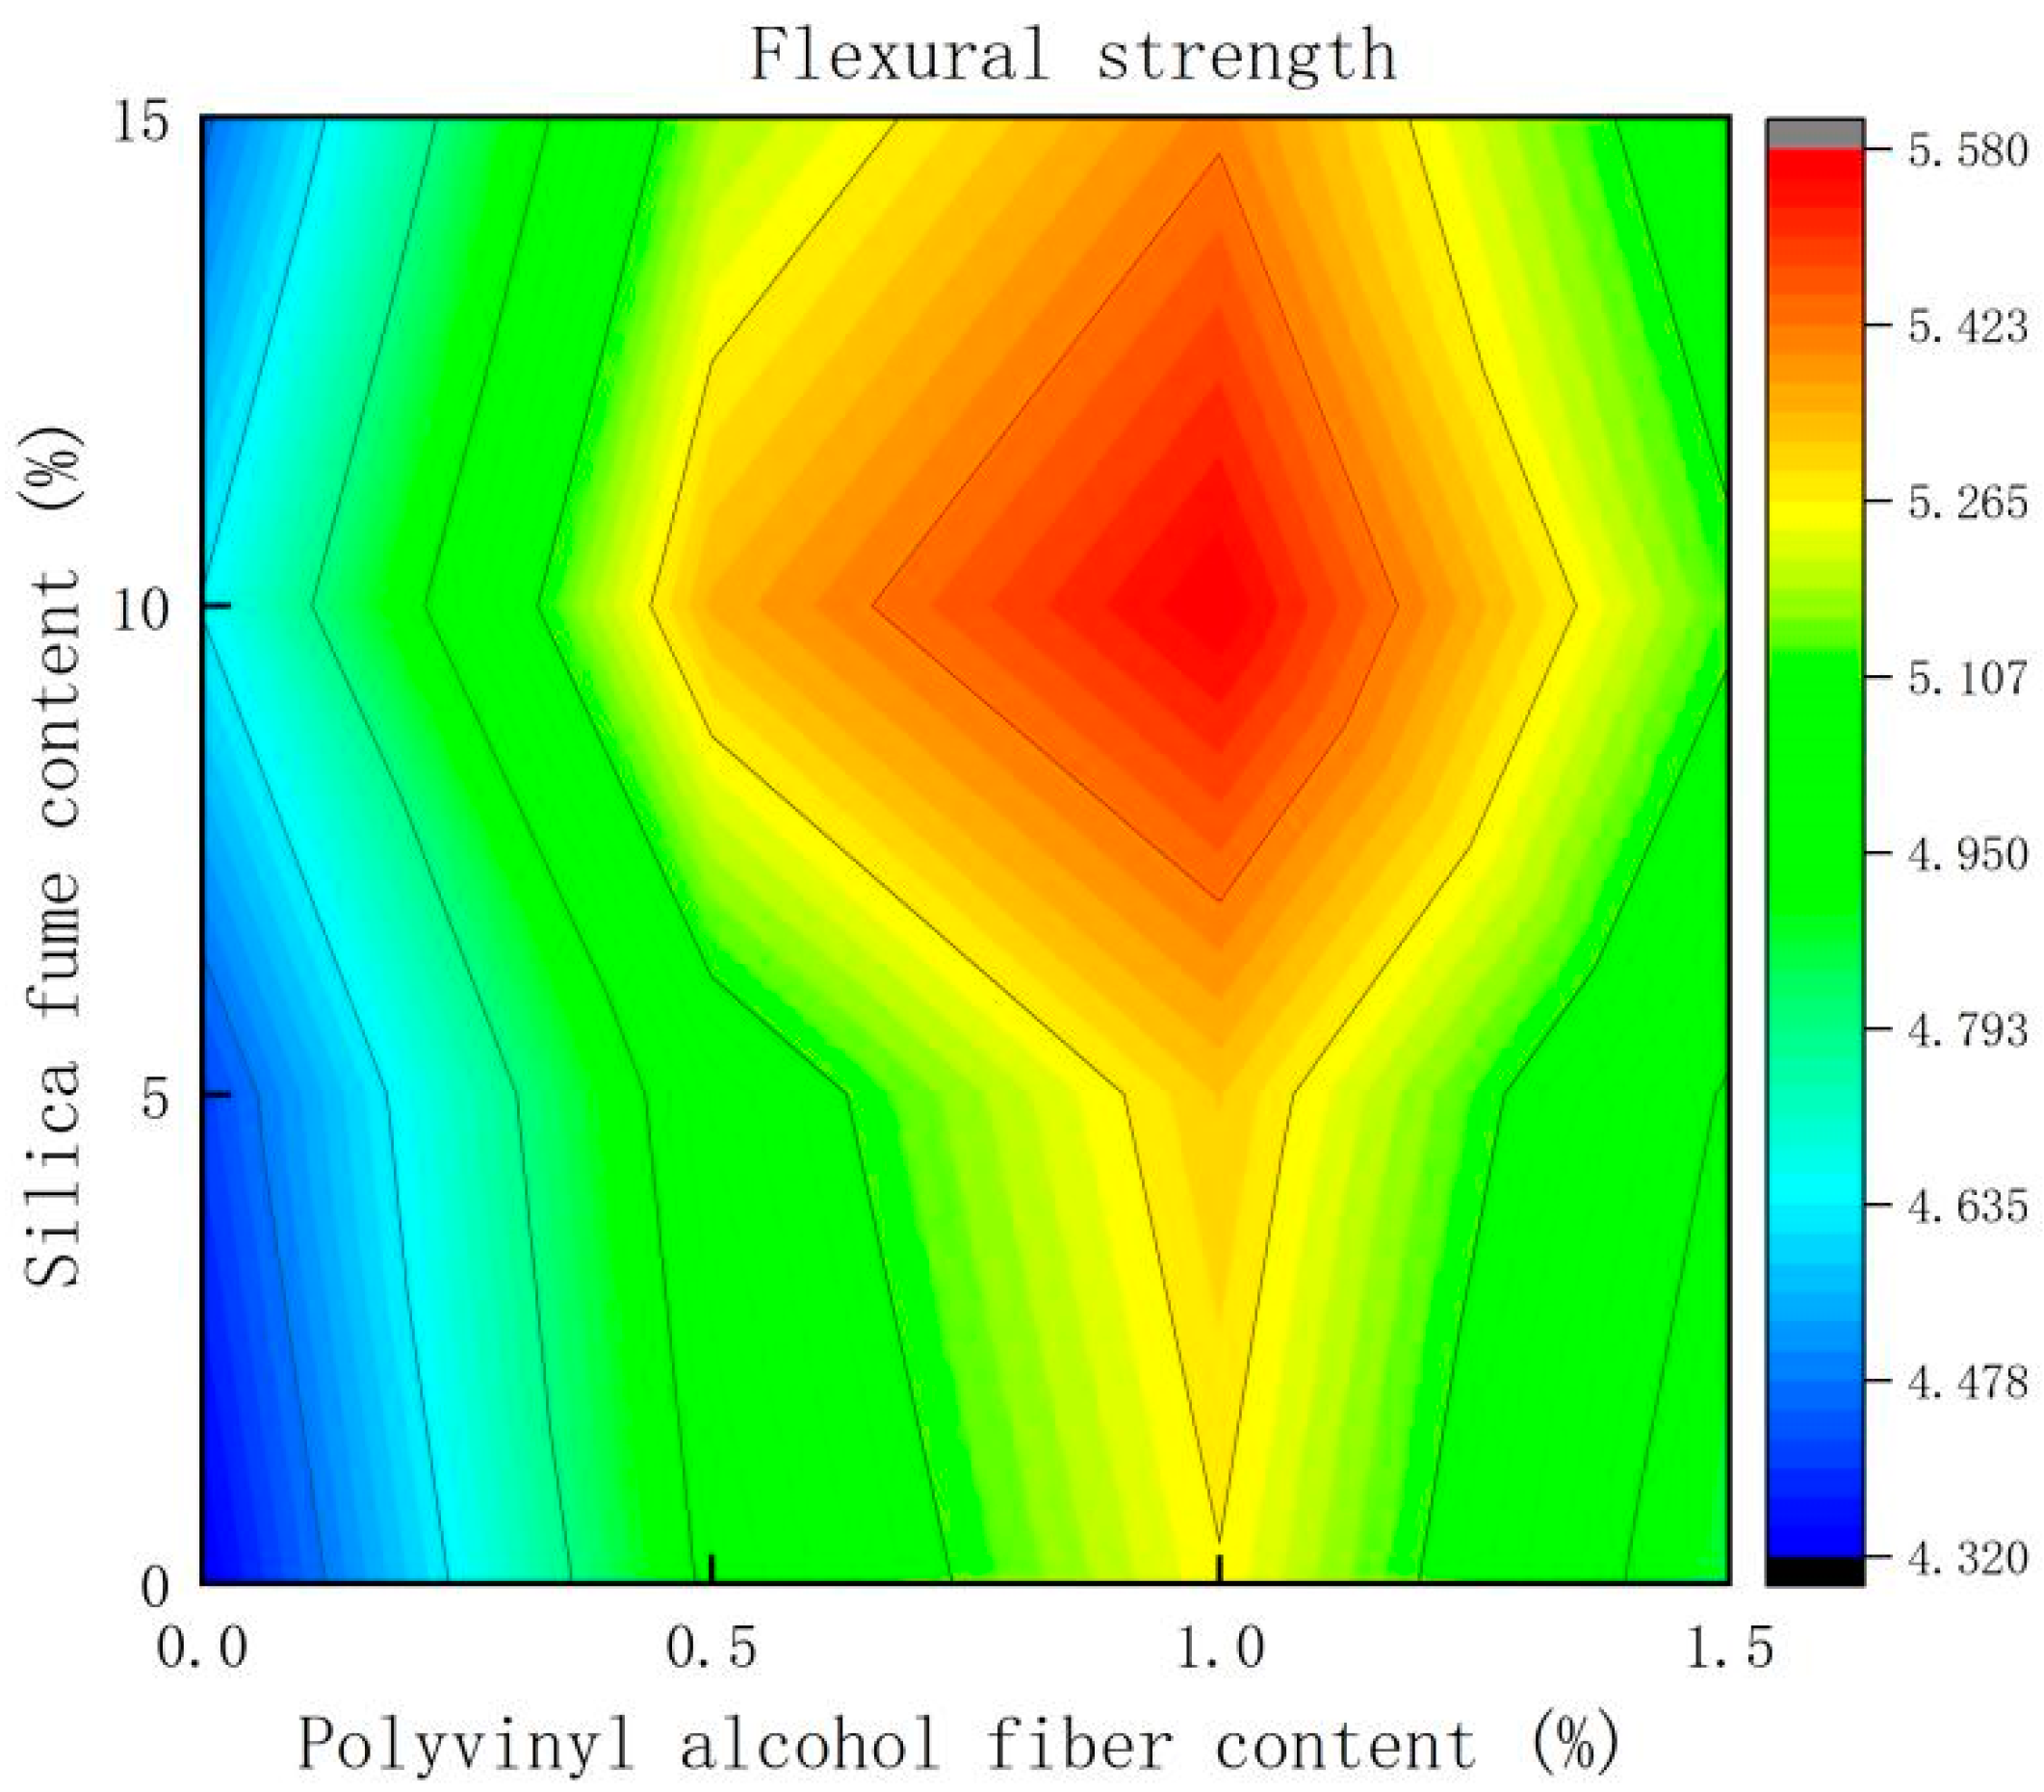
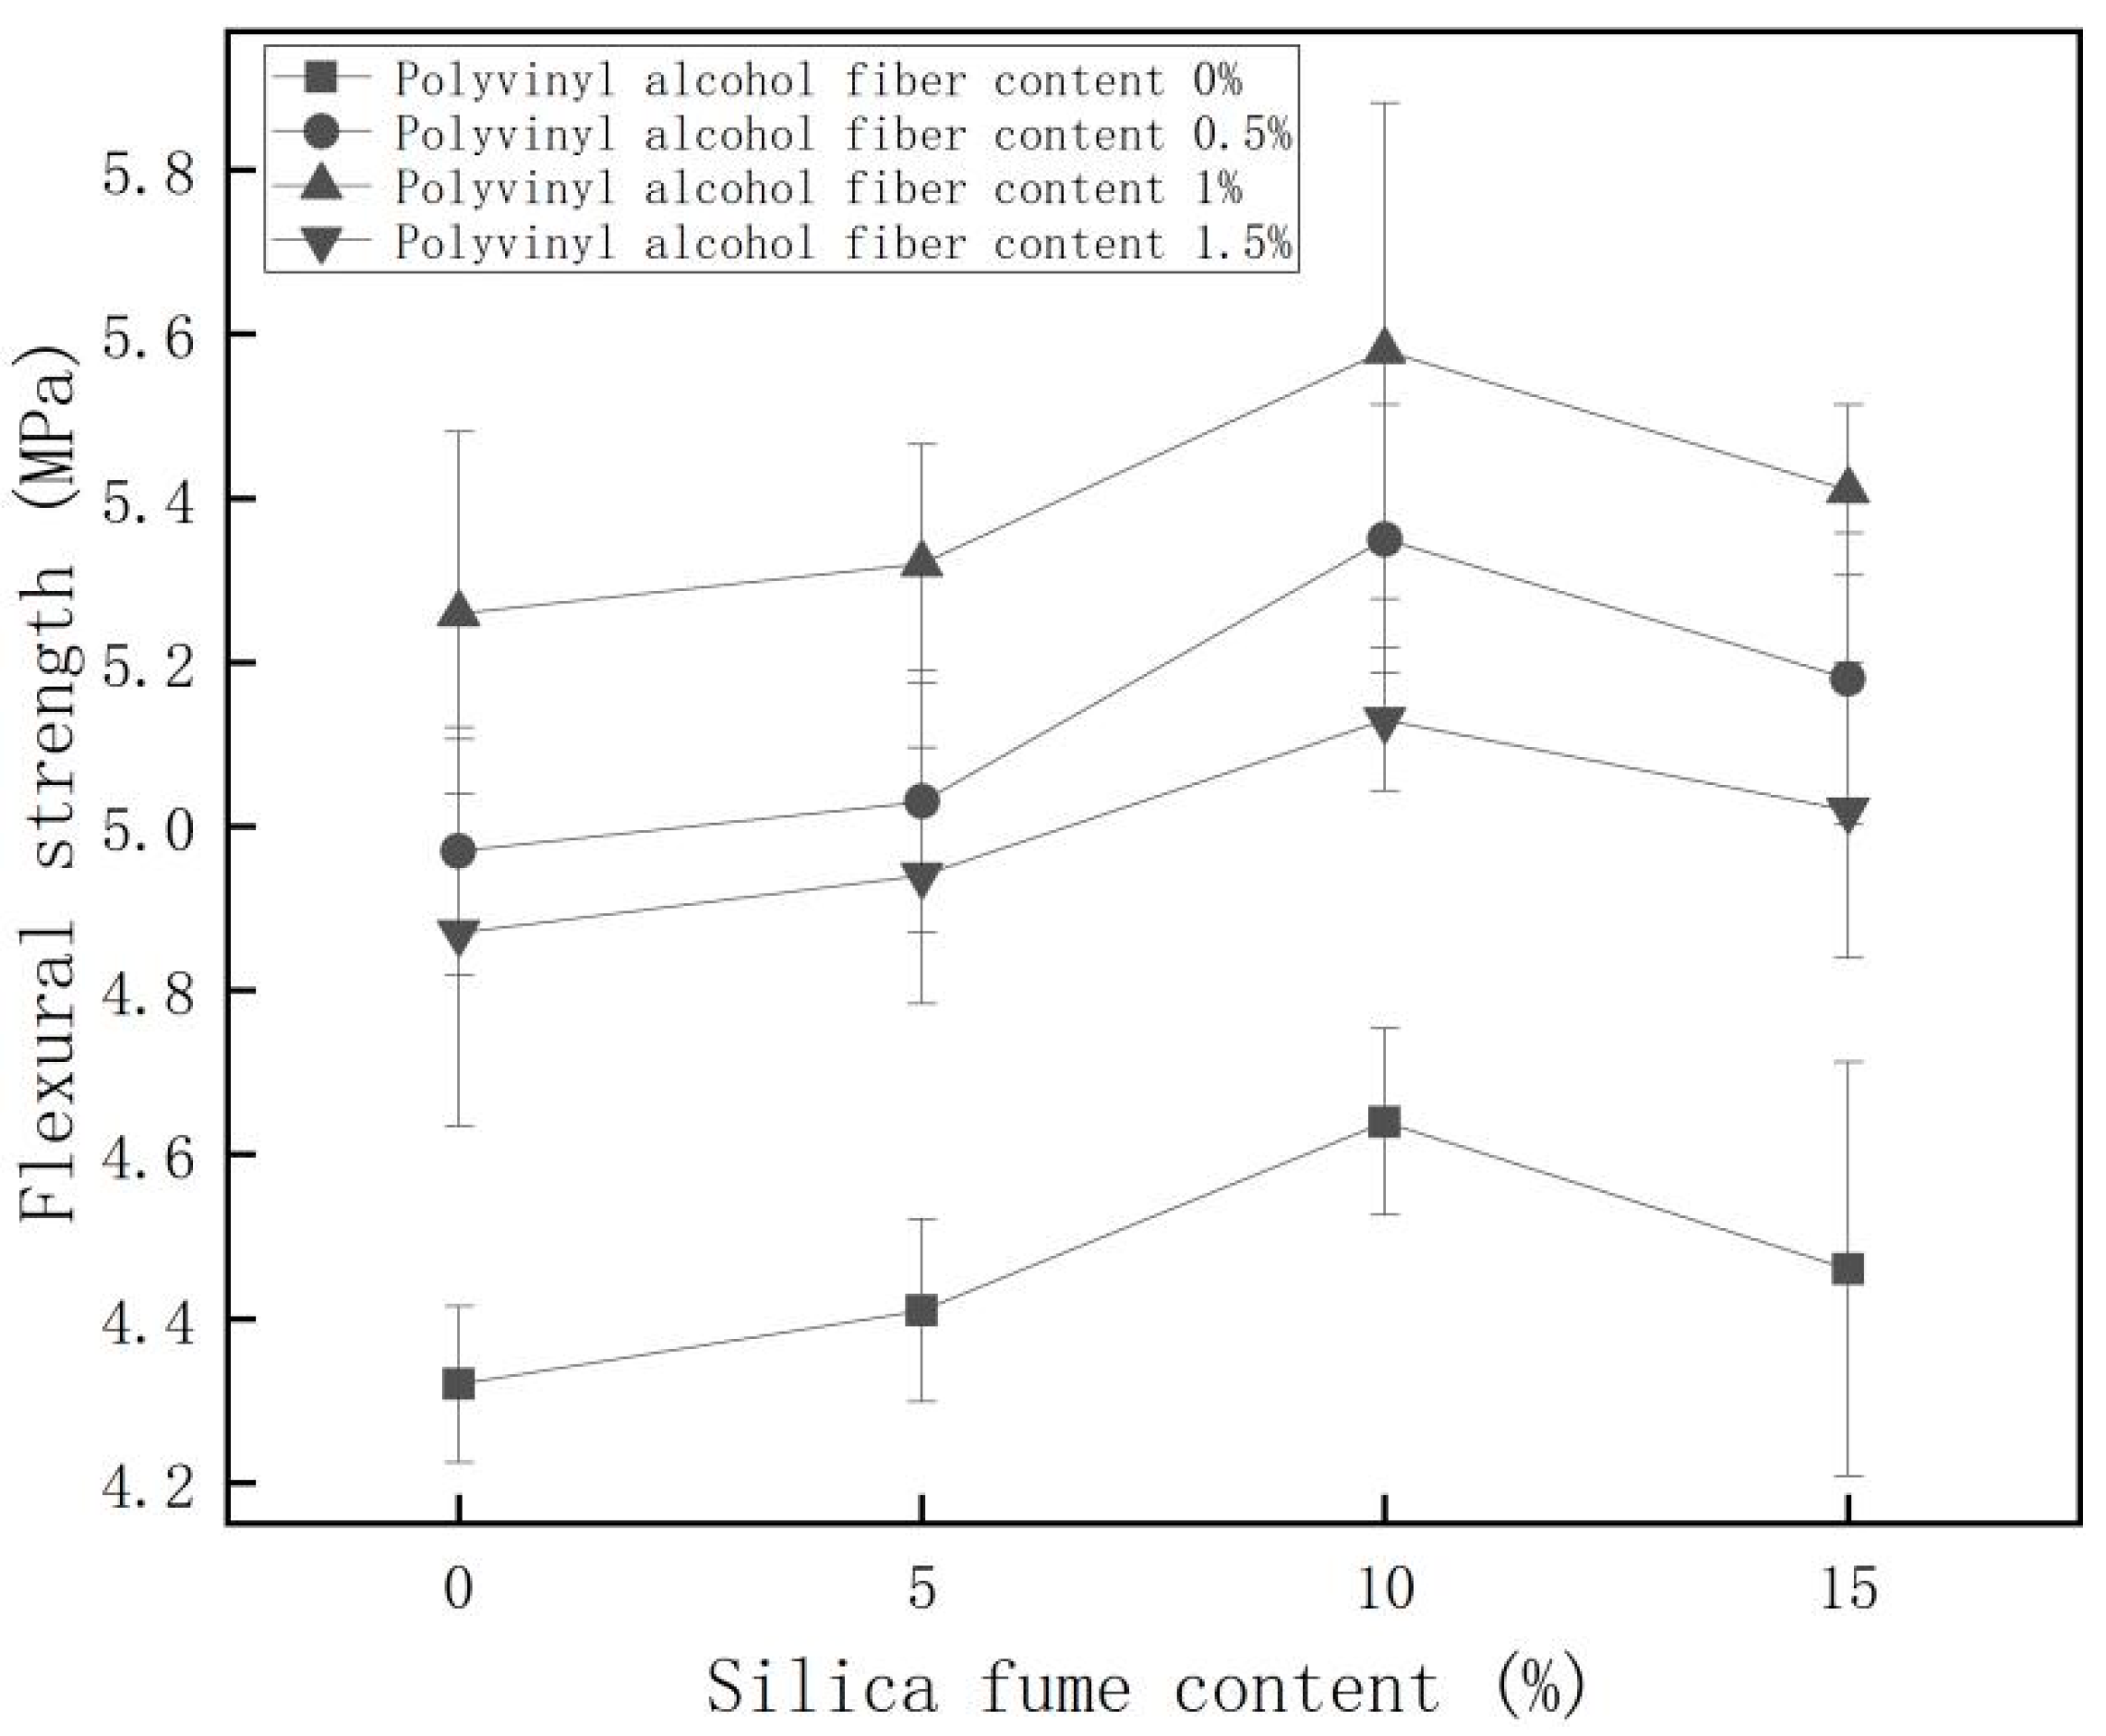
3.2. Flexural Strength

The variation of flexural strength is shown in Figure 4. Figure 4 showed that the flexural strength of concrete generally increased with increasing silica fume content under the condition of constant polyvinyl alcohol fiber content. When the content of silica fume is increased from 0 to 5%, the increase of flexural strength is very low. When the content of silica fume continued to increase to 10%, the flexural strength of concrete was improved, and the improvement was relatively high. However, the flexural strength starts to decrease when the content of silica fume is increased from 10% to 15%. This is due to the hydration activity of silica fume being higher than that of cement, so with the increase of silica fume content, the water requirement of concrete also became larger. The content of water in the mix ratio was constant. This can lead to a part of the silica fume that is not involved in hydration, or it can lead to negative effects. However, with the incorporation of silica fume, the growth rate of concrete can reach 7.64%. Under the condition of constant silica fume content, the flexural strength showed a trend of increasing and then decreasing with the increase of polyvinyl alcohol fiber. When the fiber content increased from 0 to 1%, the flexural strength increased significantly, with the highest growth rate of flexural strength of concrete reaching 21.75%. The flexural strength started to decrease with increased fiber content. When the content of polyvinyl alcohol fiber was too high, the cementing material could not adequately coat the fiber and could easily agglomerate inside the concrete, resulting in stress defects inside the concrete. This would lead to a looser internal network structure of concrete, where the internal forces were not uniform, resulting in a reduction in the flexural strength of concrete. When the content of silica fume was 10% and the content of polyvinyl alcohol fiber was 1%, the flexural strength of concrete was the highest, which was 29.17% higher than that of ordinary concrete. As the silica fume content increased, the water requirement of the concrete became larger. The water content in the mix ratio was constant. This may have resulted in some of the silica fume not participating in hydration and could cause negative effects to occur. When the content of polyvinyl alcohol fiber was too high, the cementing material could not fully wrap the fiber, as it was easy to clump inside the concrete, resulting in stress defects inside the concrete. These factors resulted in the compressive strength of the concrete increasing and then decreasing with the content of silica fume and polyvinyl alcohol fibers.
We used contour plots to analyze the effect of interaction between silica fume and polyvinyl alcohol fibers on flexural strength. The contour plot of flexural strength is shown in Figure 5. From Figure 5, it could be seen that the color changed from blue to red gradually with the increase of material content in the contour map, which indicated that the flexural strength was generally improved with the compounding of silica fume and polyvinyl alcohol fiber. Additionally, the density of contour lines in the horizontal coordinate was greater than the density of contour lines in the vertical coordinate in the contour map, which indicated that the effect of polyvinyl alcohol content on flexural strength was greater than that of silica fume.

3.3. Freeze-Thaw Damage of Concrete

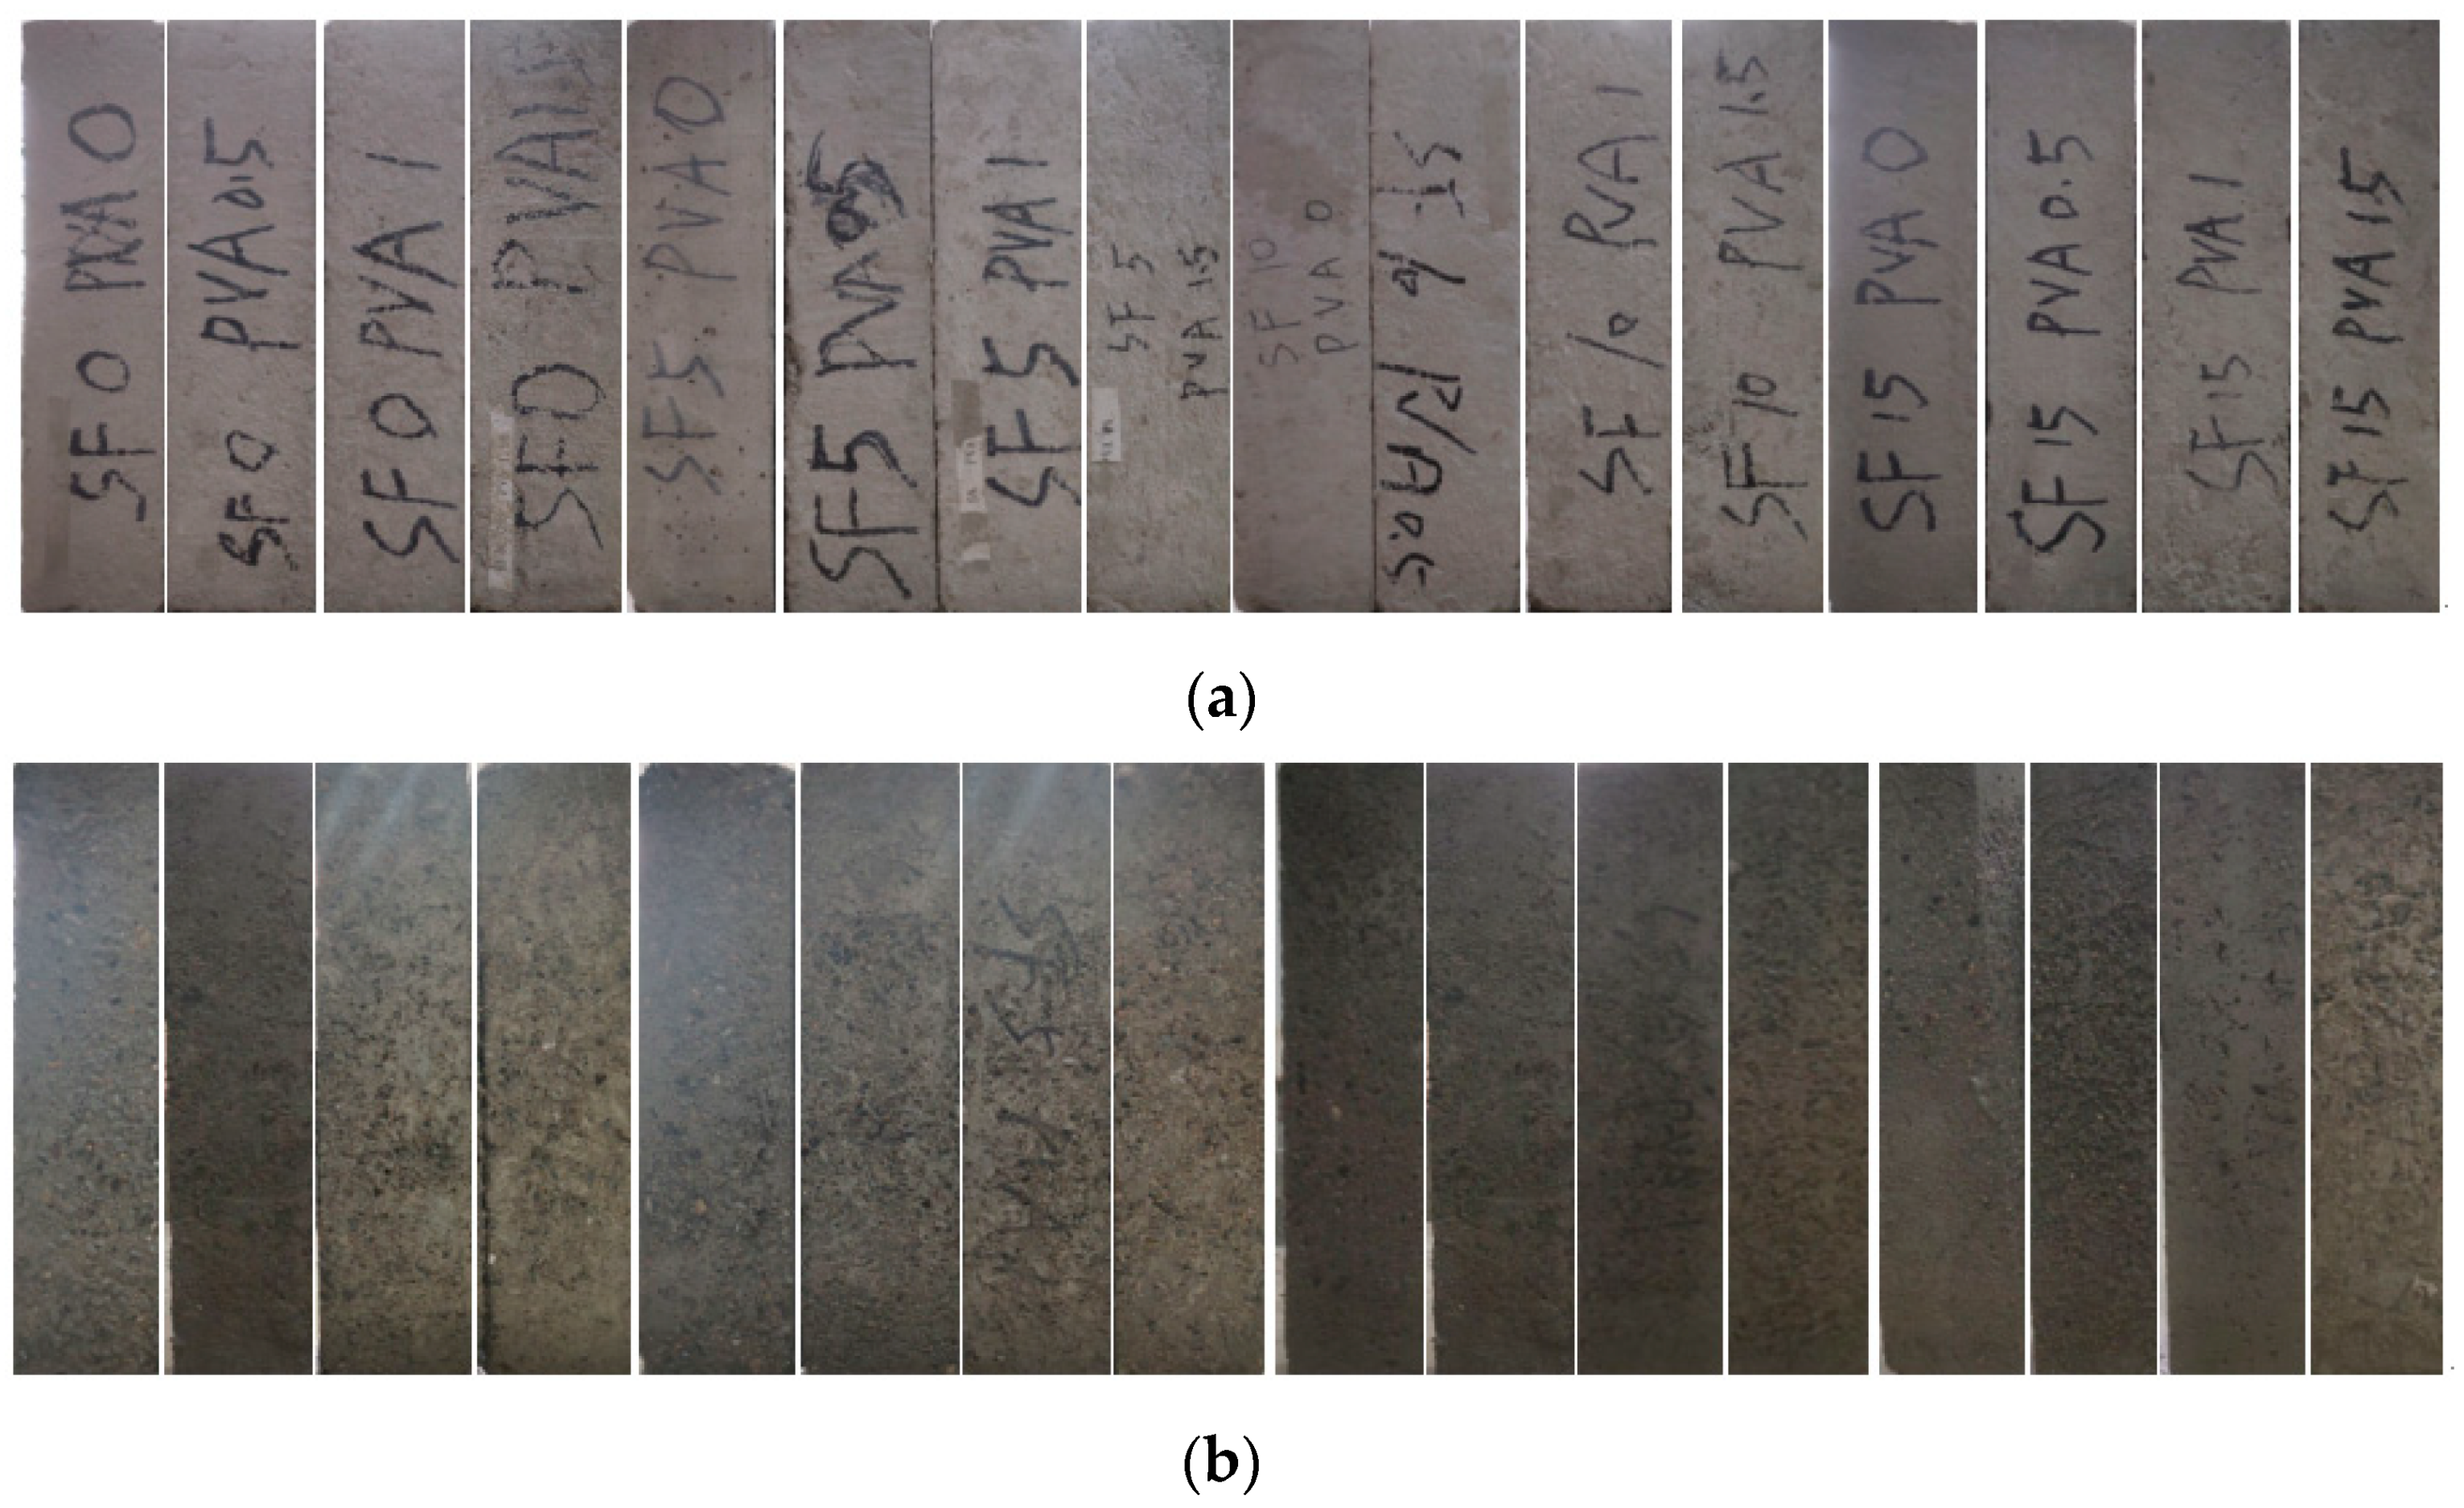
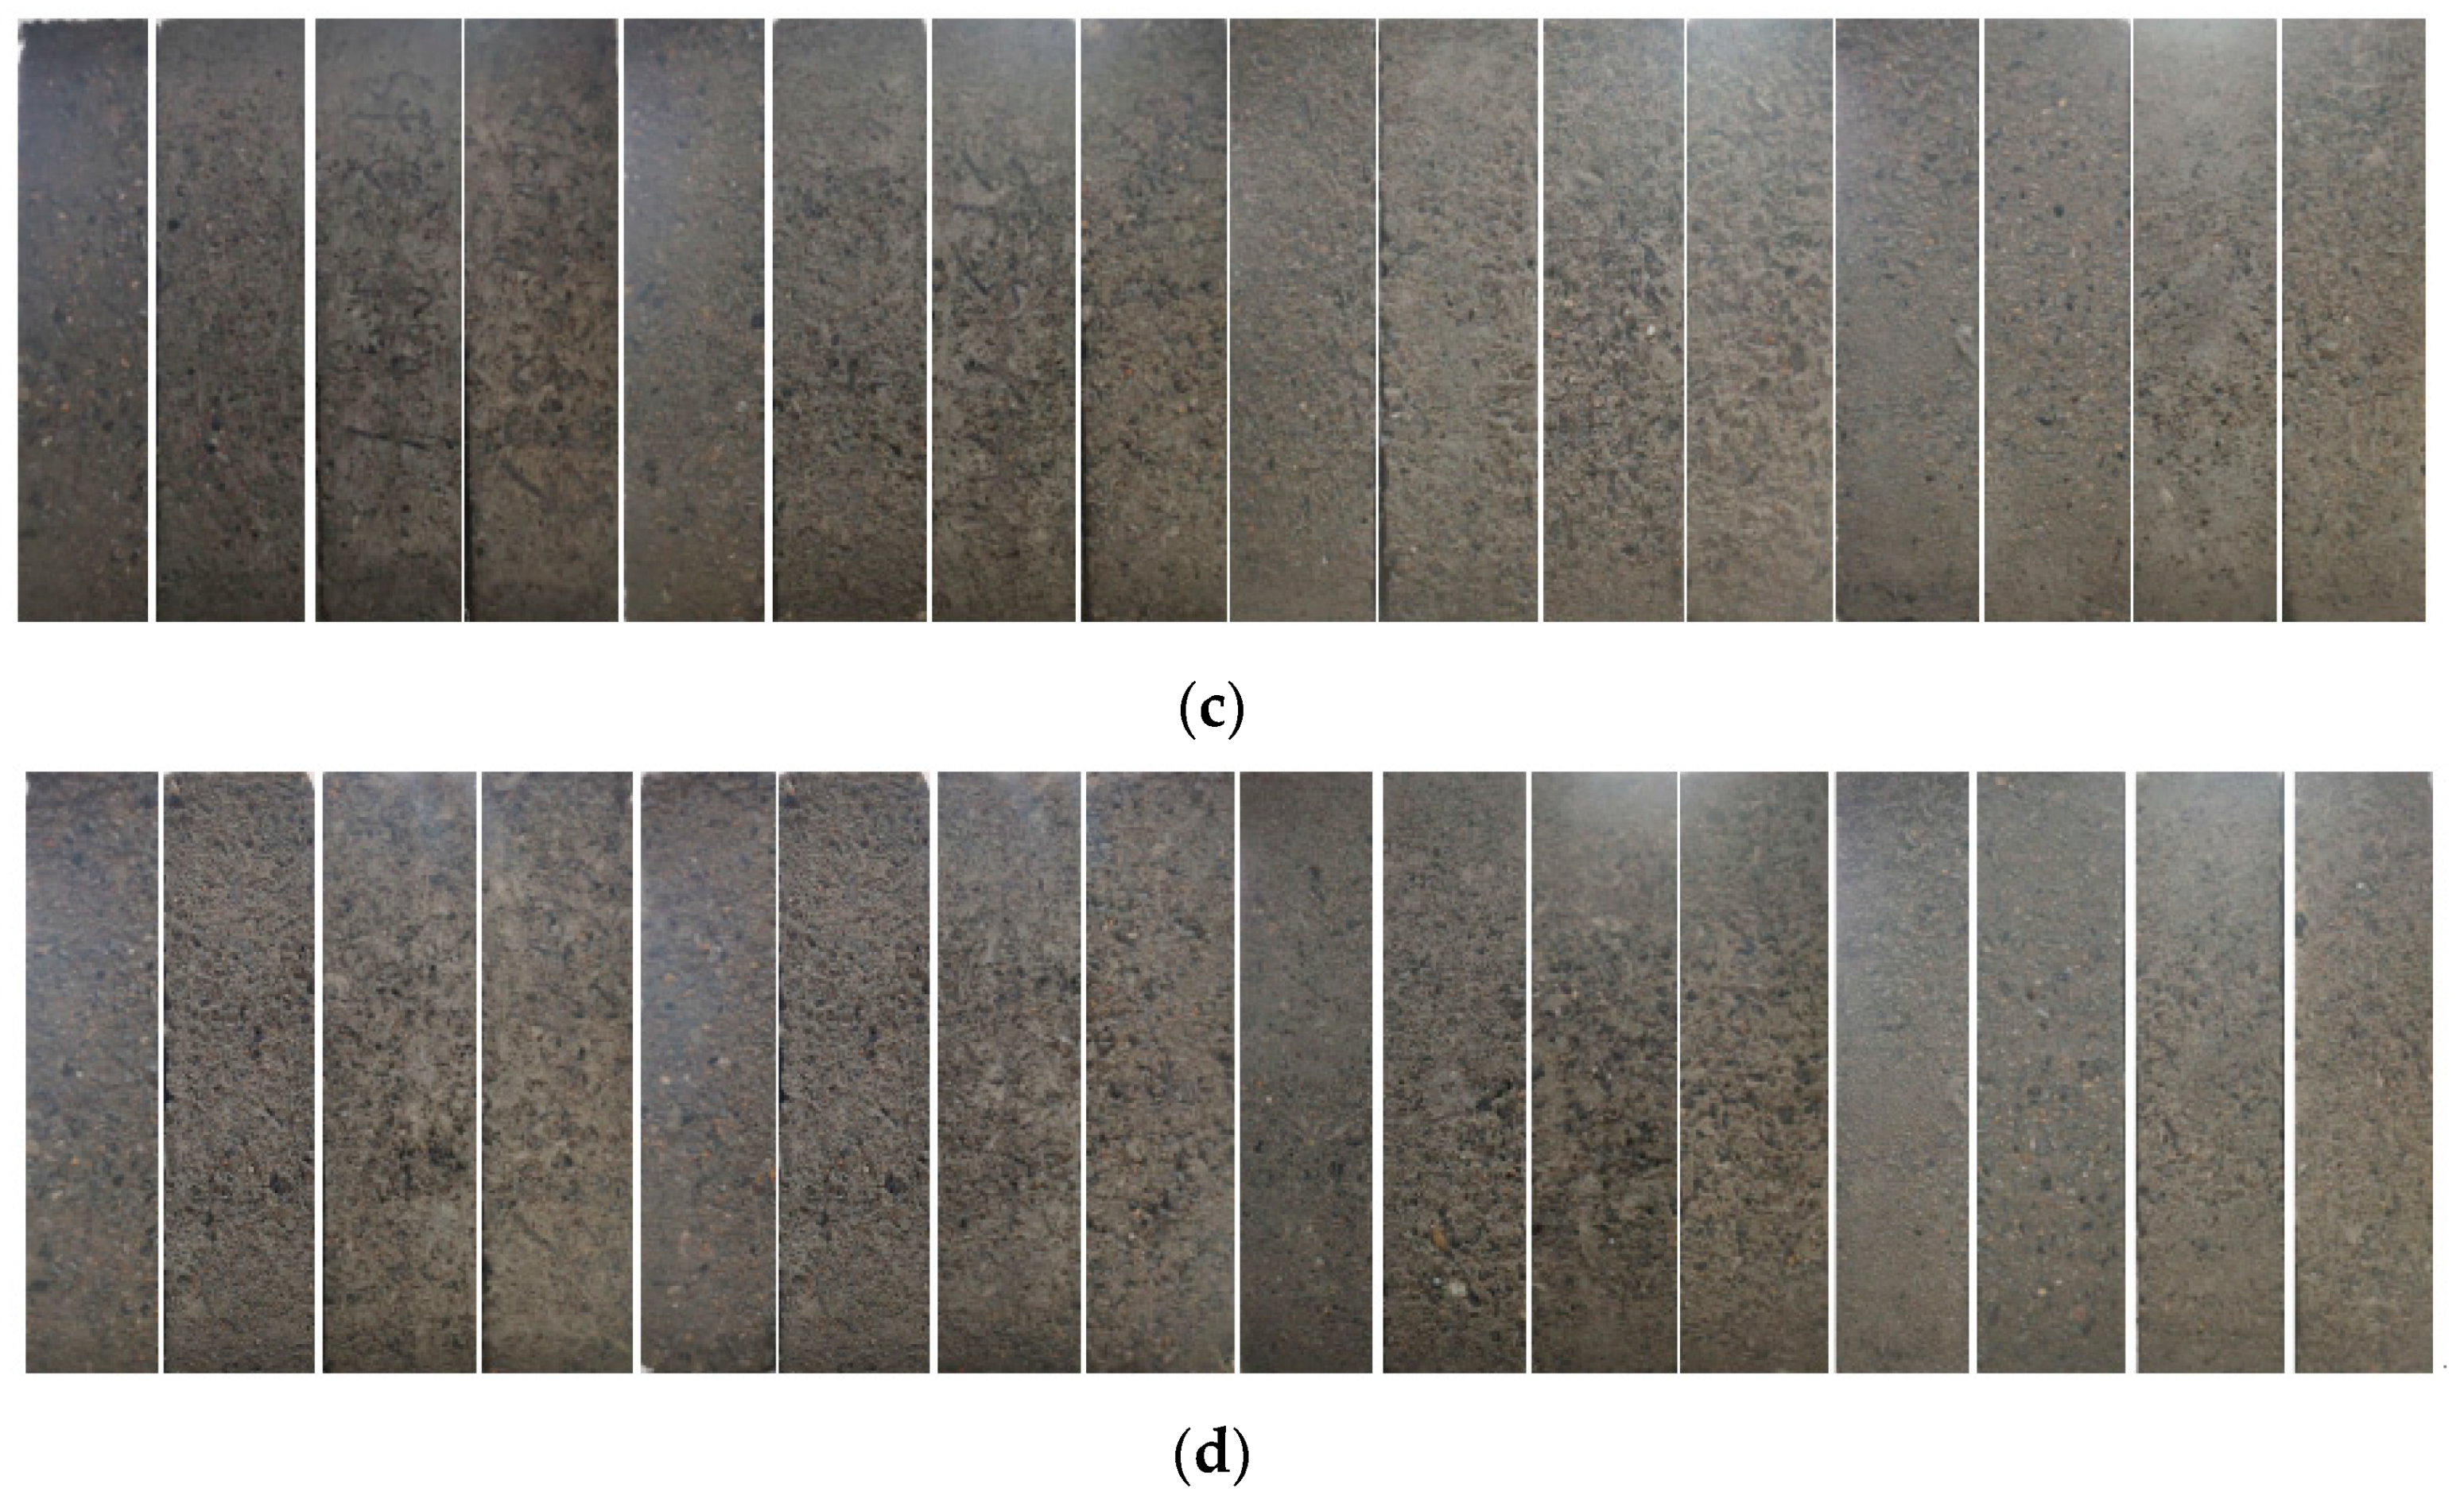
3.3.1. Apparent Changes of Concrete under Freeze-Thaw Damage

The change in appearance of the specimen and test block after four stages of freeze-thaw cycles is shown in Figure 6. Test blocks that have not been subjected to freeze-thaw cycles appeared to have an intact surface. After 50 freeze-thaw cycles, the surface of the test block started to become rough, and as the surface mortar fell off, a small amount of exposed coarse aggregate could be seen, and the skin of the test block was still intact at this time. After 100 freeze-thaw cycles, these changes became increasingly obvious, with more exposed coarse aggregates and even the phenomenon of coarse aggregate shedding. After 150 freeze-thaw cycles, the test block skin mortar was massively dislodged, a large amount of coarse aggregate was exposed, and the degree of coarse aggregate dislodgement was intensified.

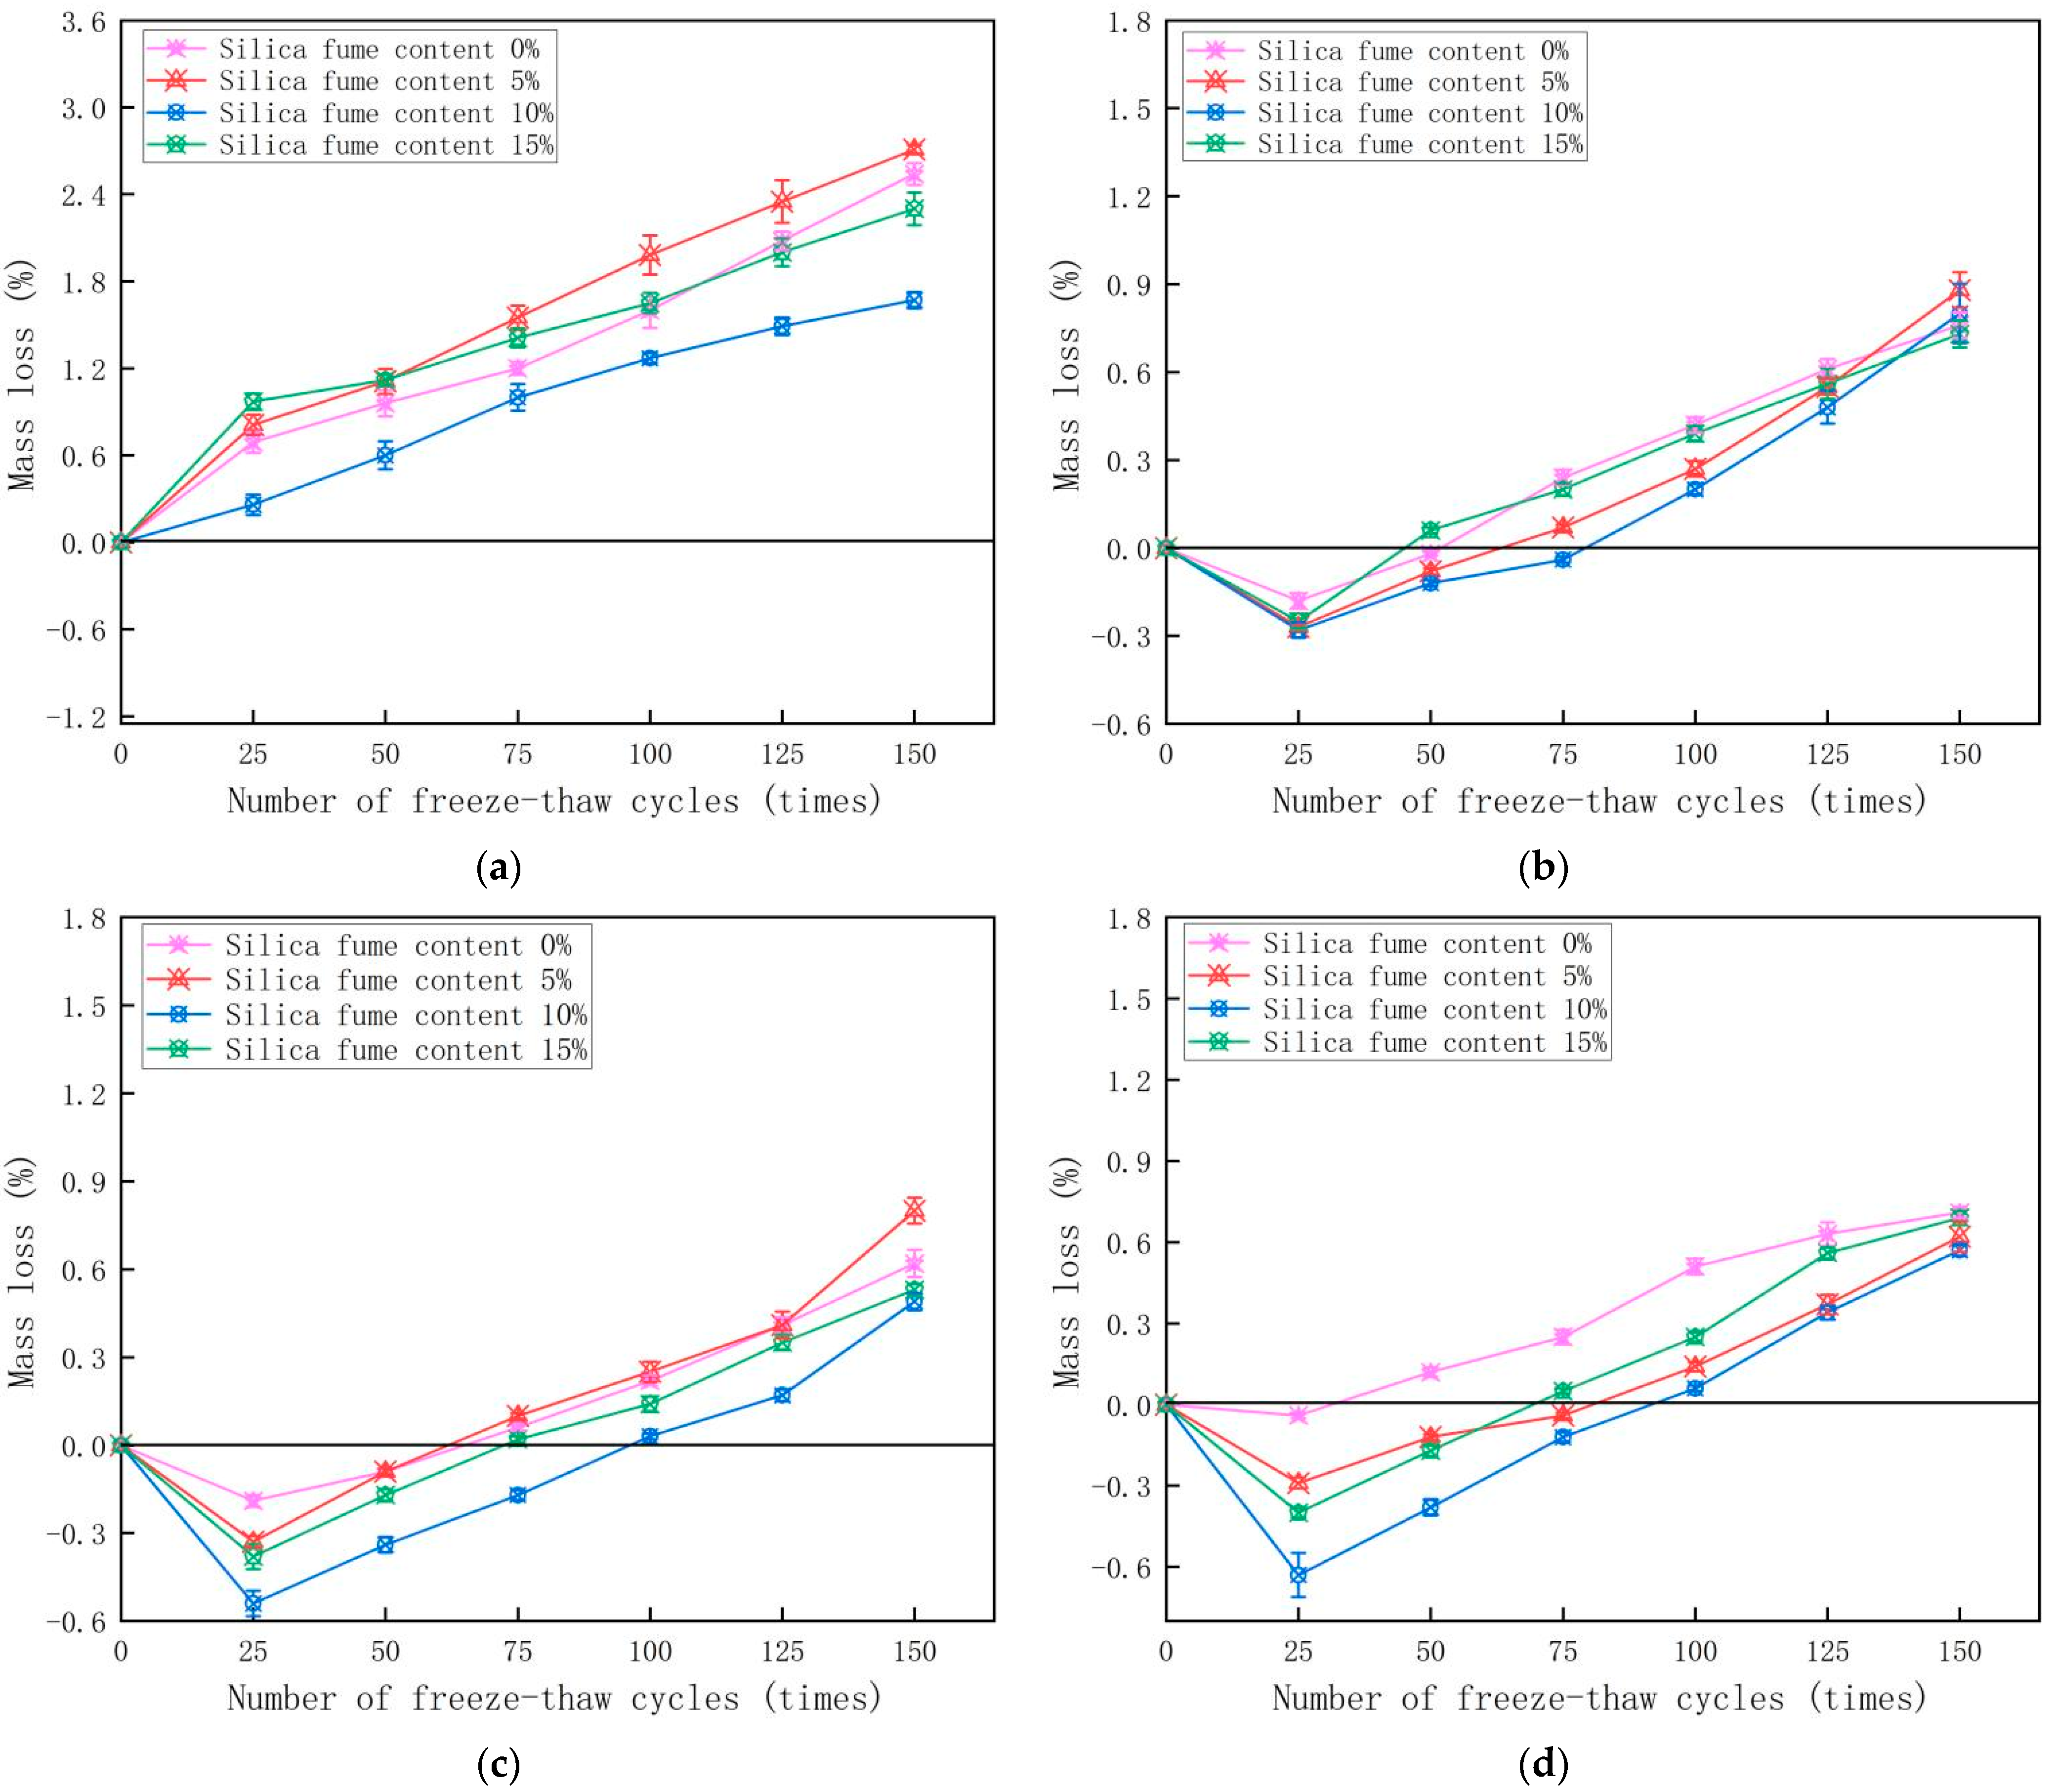
3.3.2. Variation in the Mass Loss Rate under Freeze-Thaw Damage of Concrete

The mass loss rate reflects the spalling of the concrete surface under freeze-thaw cycling conditions. The test block mass loss rate is shown in Figure 7. Figure 7 showed that the mass damage of the polyvinyl alcohol fiber incorporated group first decreased and then increased. This indicated that in the early stage of freeze-thaw cycles, the increased mass of water absorption inside the concrete was greater than the mass of concrete aggregate shedding, which led to a decrease in the mass loss rate. However, as the number of freeze-thaw cycles increased, the degree of aggregate shedding in the test block intensified, and its mass loss rate gradually increased. Polyvinyl alcohol fiber with elasticity was beneficial to alleviate the freezing and swelling stress of concrete due to the freeze-thaw cycles and to mitigate freeze-thaw damage, thus improving aggregate shedding of concrete. Under the same polyvinyl alcohol fiber content conditions, when the silica fume content was increased to 10%, the lowest mass loss rate improvement was observed. This was due to the silica fume particles being incredibly fine, so there was a micro-aggregate filling effect that caused the concrete to be denser inside. Silica fume generated C-S-H gels in the cement hydration generation reaction and simultaneously reacted with large grains enriched in the transition zone in a volcanic ash reaction. This resulted in an improved microstructure in the transition zone at the inter-aggregate interface.

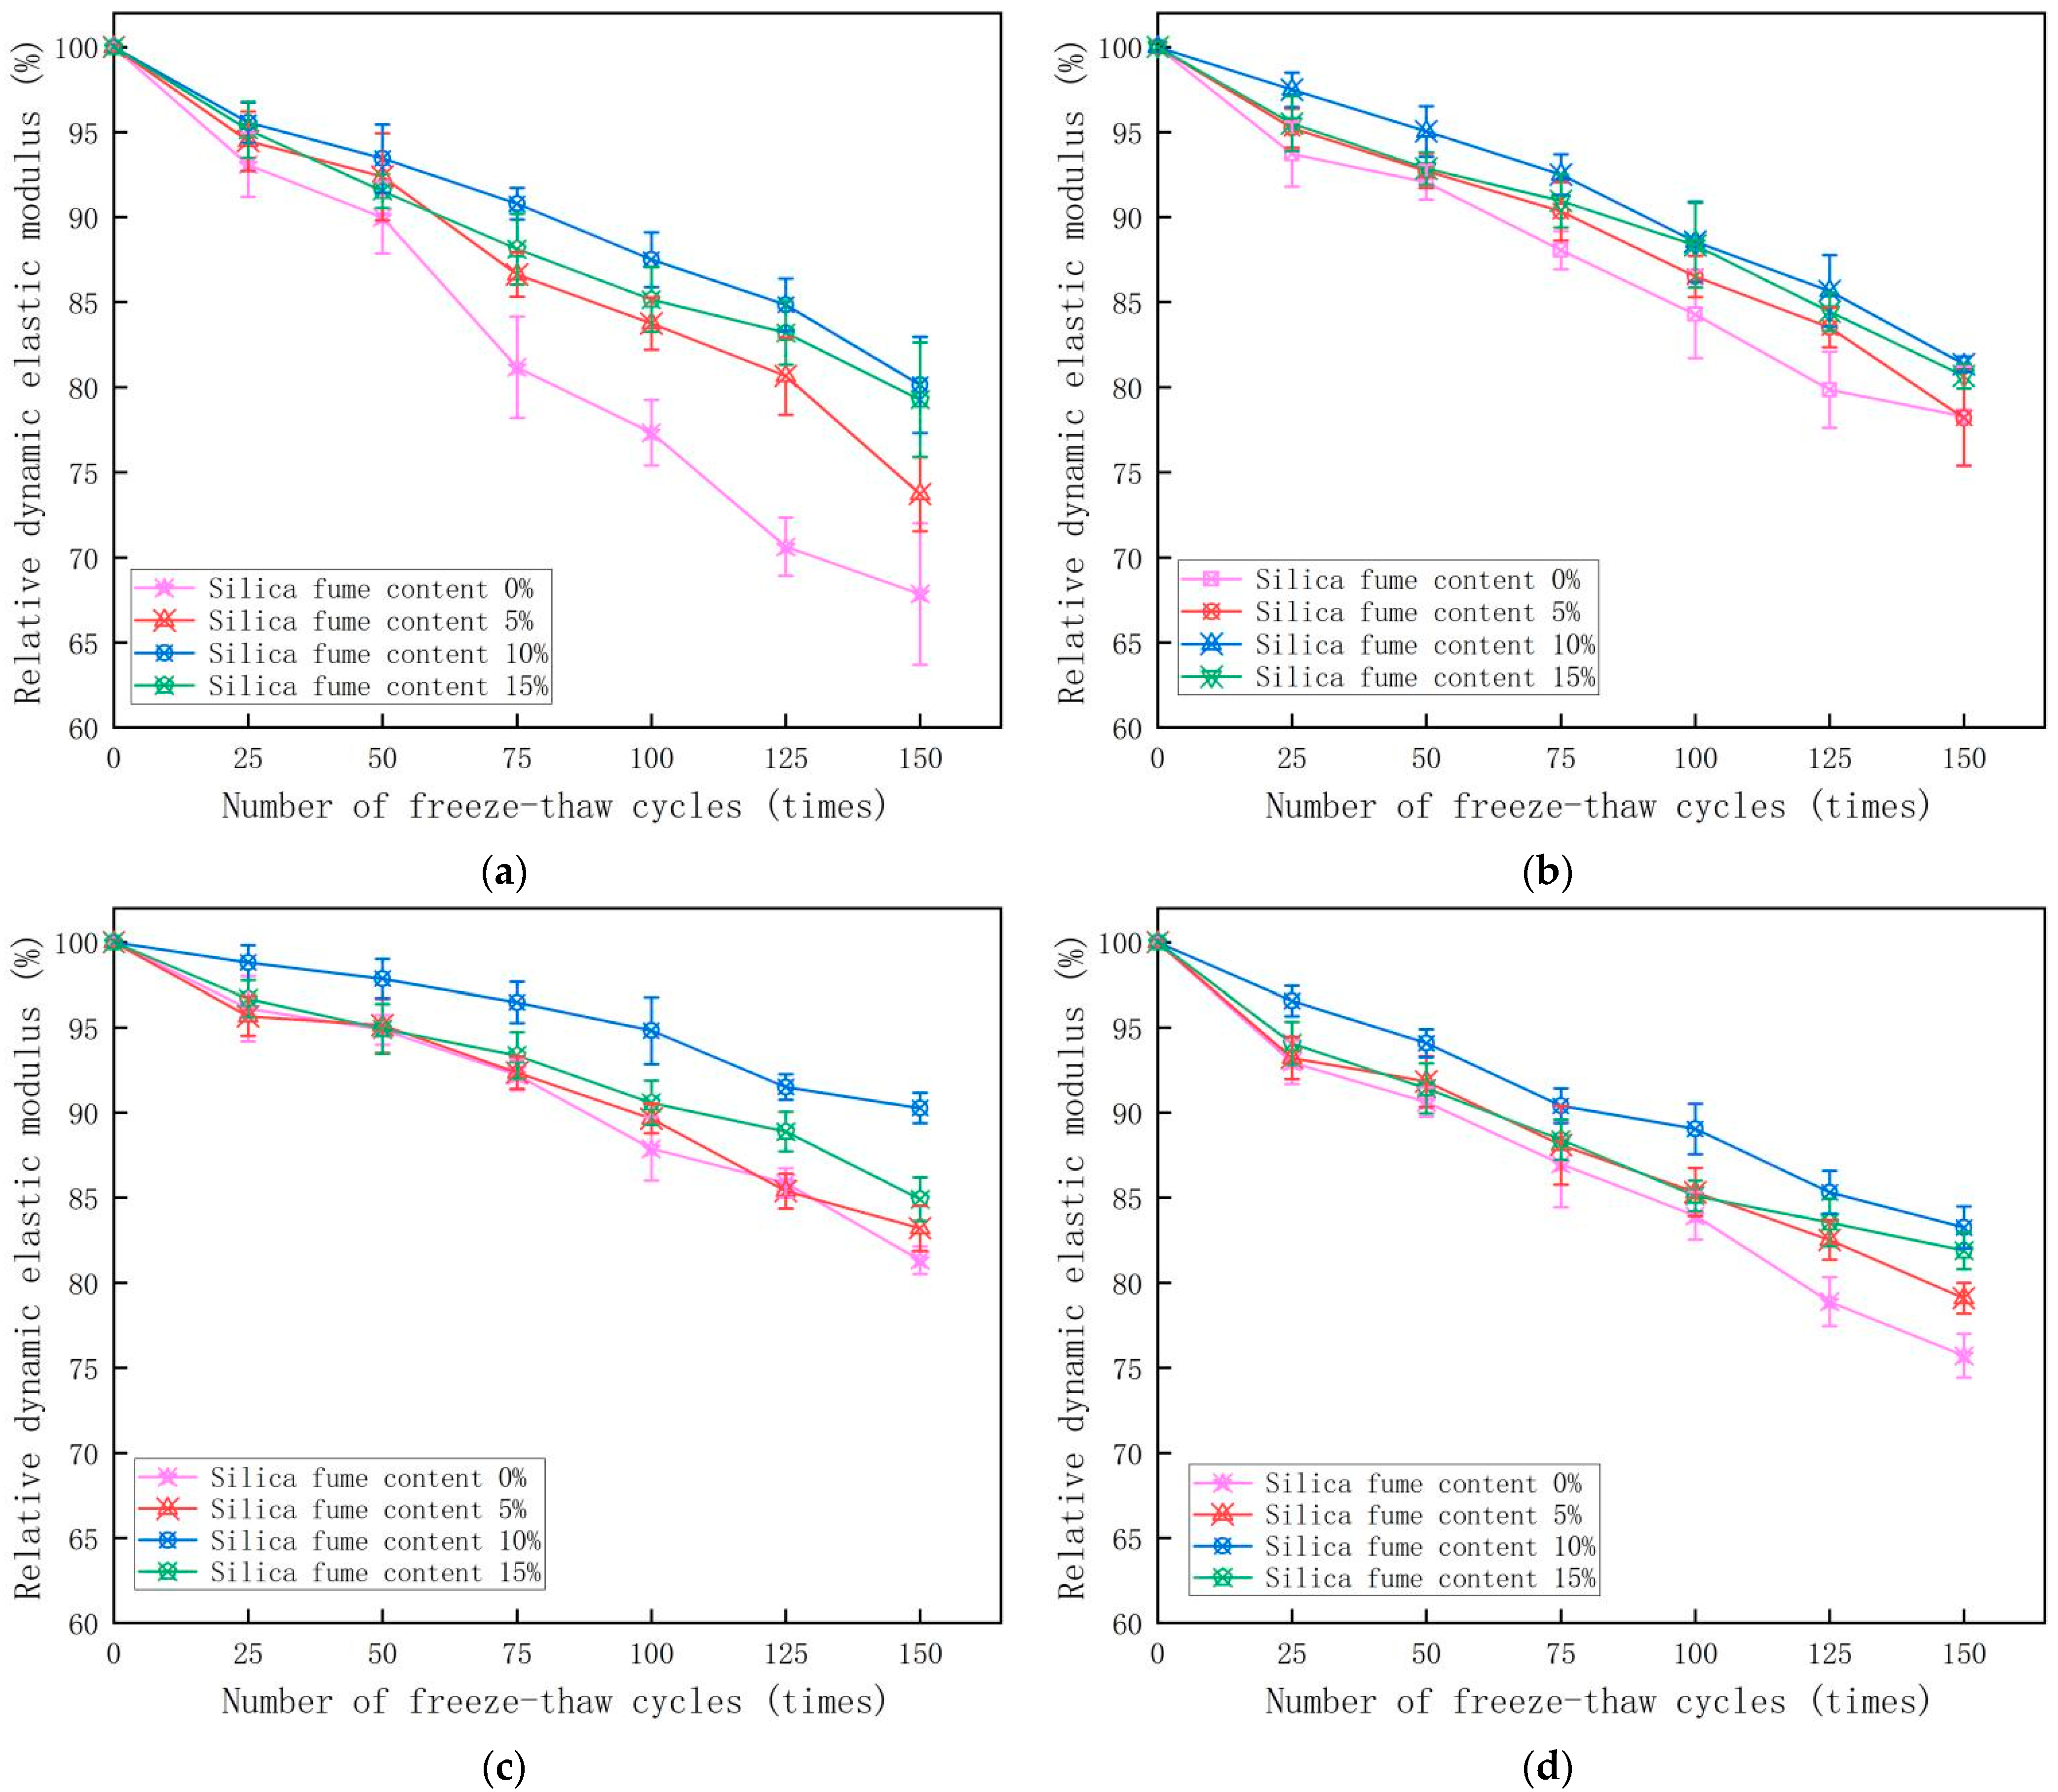
3.3.3. Change in Relative Dynamic Elastic Modulus of Concrete Freeze-Thaw Damage

The relative dynamic modulus of elasticity reflects the change in freeze-thaw damage within the concrete. The smaller the value is, the greater the freeze-thaw damage. The change in the relative dynamic elastic modulus of the test block is shown in Figure 8. It can be seen from Figure 8 that the relative dynamic modulus of elasticity of the specimens compounded with silica fume and polyvinyl alcohol fiber were not lower than 60% and were higher than the relative dynamic modulus of elasticity of the reference group after freeze-thaw cycles, which indicated that the compounding of the two materials improved the frost resistance of concrete. The incorporation of polyvinyl alcohol fibers resulted in a reduced decrease in the relative dynamic modulus of elasticity of the concrete. when the content of polyvinyl alcohol fiber was constant, and the silica fume content reached 10%, the value of relative dynamic elastic modulus of concrete was maximum. This indicated that the concrete frost resistance was better when the silica fume content was 10%.

3.4. Freeze-Thaw Contribution Rate of Concrete Compounded with Silica Fume and Polyvinyl Alcohol Fiber

To more intuitively analyze the effect of compound silica fume and polyvinyl alcohol fiber on the freeze-thaw resistance of concrete, the contribution rate was introduced to quantitatively express the degree of influence, and the larger the value was, the stronger the resistance to freeze-thaw damage. The contribution ratio referred to the contribution of the composite materials incorporated in the concrete to the improvement of the frost resistance of the concrete. The calculation formula is shown in Equation (1).
Q = E n E 0
where Q is the contribution rate, E n is the relative dynamic modulus of elasticity of concrete after (0, 25, 50, 75, 100, 125, and 150) freeze-thaw cycles, and E 0 is the relative dynamic modulus of elasticity of the concrete when it is not undergoing freeze-thaw cycles. The relationship between different material contents and their contribution rates to concrete after 0, 25, 50, 75, 100, 125, and 150 freeze-thaw cycles were fitted. The contribution rate of each group of test blocks under different numbers of freeze-thaw cycles was linearly fitted, and the steeper the regression line was, the higher the overall contribution, and thus the best frost resistance was indicated. From Table 3, it was shown that the goodness of fit R2 was greater than 0.95, indicating that the regression straight line was a good fit to the observed values, and the regression straight line was steepest when the silica fume content was 10% and the polyvinyl alcohol fiber content was 1%, indicating that the concrete had the best frost resistance at this material content.

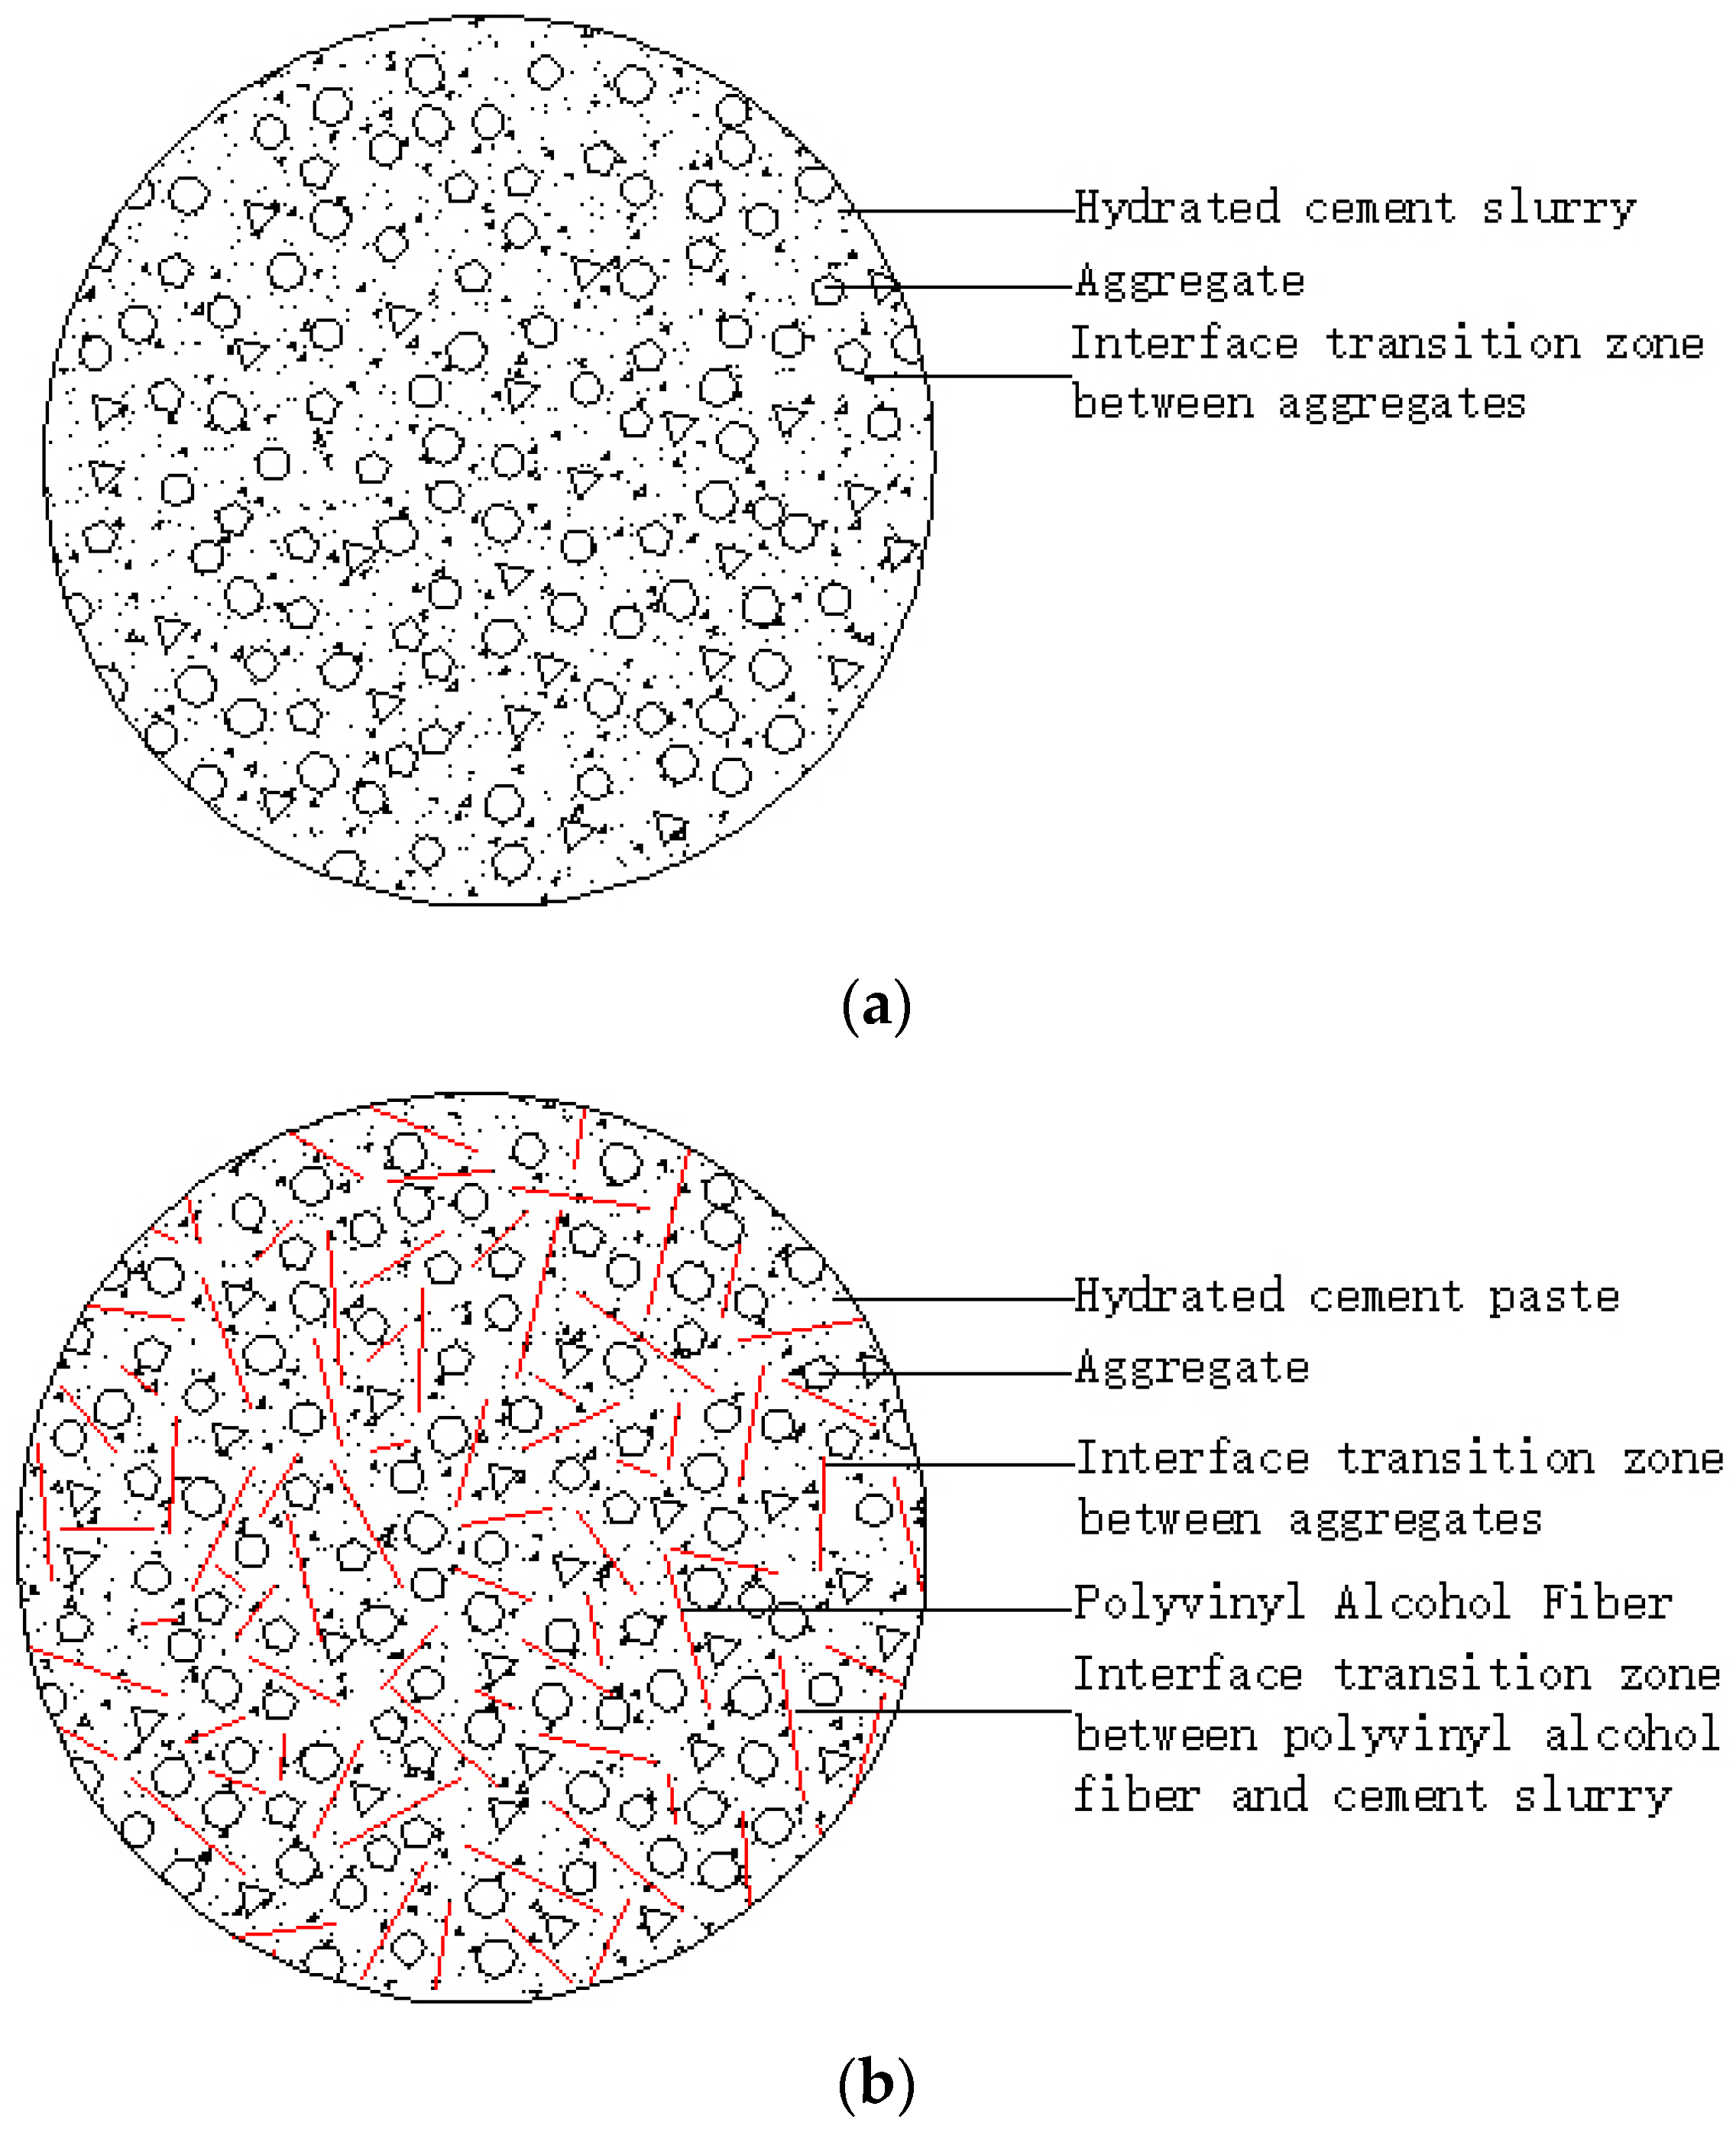
3.5. Internal Structure Analysis of Concrete Compounded with Silica Fume and Polyvinyl Alcohol Fiber

As shown in Figure 9a, the interior of plain concrete was mainly composed of hydrated cement slurry, coarse and fine aggregates, and the interfacial transition zone between aggregates. Among them, the cement hydration slurry was an important part of the external load, while there were still many pores inside the concrete, coarse and fine aggregates were part of the filler role of these pores, as well as part of the overall concrete to bear a portion of the load. The interface transition zone between the aggregates was often the weakest portion of the concrete. The main reason was that this part of the porosity was relatively high, and the interface transition zone calcium hydroxide (CH) crystal content was generally higher than 20% to 40% of the base material body. Thus, the interface layer was the CH crystal enrichment area, which would increase the porosity of the interface, which leads to the interface transition zone network structure being laxer.
The internal structure of concrete after the addition of polyvinyl alcohol fiber was shown in Figure 9b, which increased the transition zone of the interface between polyvinyl alcohol fiber and cement paste when compared with the previous internal composition of ordinary concrete. With the addition of fibers, the internal structure of the concrete was able to withstand more loads due to the addition of polyvinyl alcohol fibers. This was since when ordinary concrete was loaded, it tended to produce a concentrated stress at the crack tip, which caused the crack to expand rapidly, resulting in the formation of more cracks. However, when fibers were added a reverse stress field was created at the fiber tip, which prevented crack generation. The fiber bridging role allowed the fiber and the surrounding cementitious materials to form a composite force system, and in the cementitious composites, the fiber and the cement matrix was through the interface between the material interaction. The formation of this force system could greatly enhance the concrete after bearing the load resistance which was directly reflected in the concrete strength and durability of the improvement.
With the increase of silica fume content, the silica fume hydration activity was higher than that of cement, which made the concrete better able to form the cement hydration slurry inside. Silica fume particles were very fine, which led to the existence of the microaggregate filling effect of silica fume. It can fill the pores in the transition zone of the interface between aggregates well since silica fume has volcanic ash activity. The hydration of silica fume with cement produces a Ca(OH)2 reaction to generate C-S-H gel, while simultaneously it can have a volcanic ash reaction with large crystal Ca(OH)2 particles enriched in the transition zone. The microstructure of the transition zone at the interface between aggregates was significantly improved. From Figure 9b, it was shown that the interfacial transition zone between polyvinyl alcohol fiber and cement slurry, due to the presence of silica fume, could react with the interfacial layer CH crystals and generate C-S-H gel with a large consumption of CH crystals. This could greatly improve the interfacial bond strength of polyvinyl alcohol fiber as well as improve the problem of network structure looseness existing at this interface of polyvinyl alcohol fiber and silica fume compounding, thus producing a good synergistic effect on concrete strength improvement.

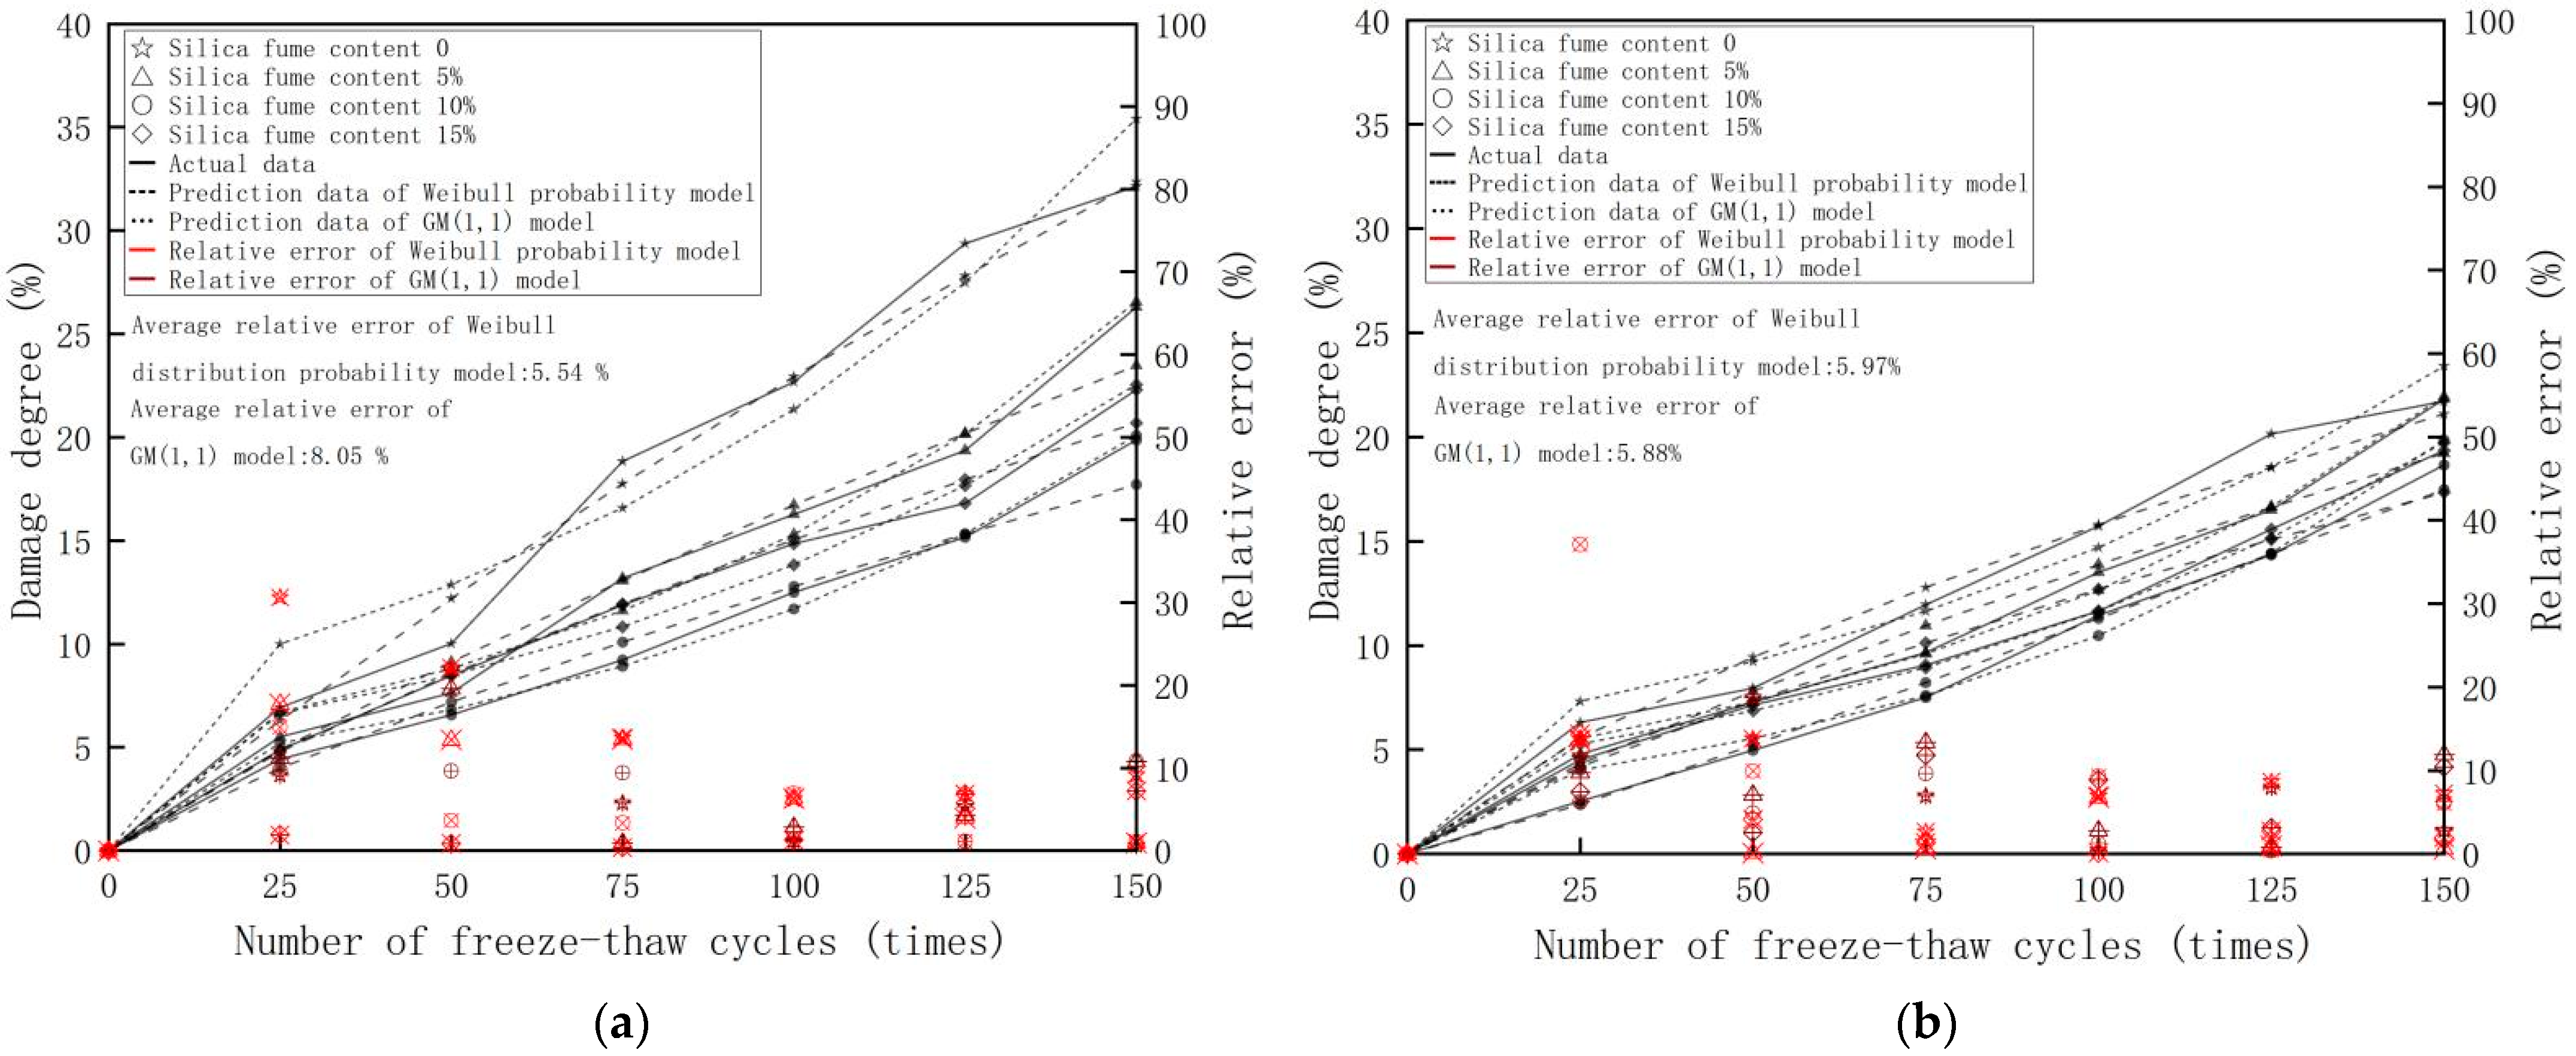
3.6. Two-Parameter Weibull Freeze-Thaw Damage Evolution Model

Due to the material complexity and discrete type, many irregular microcracks, micropores, and other defects exist inside the concrete. Under repeated freeze-thaw conditions, these original micro-cracks and micro-pores began to expand and generated new defects, resulting in concrete damage deterioration. This damage deterioration could be divided into four stages: emergence, development, continuous development, and destruction under different numbers of freeze-thaw cycles. Damage deterioration at different stages of freeze-thaw made the mechanical properties of concrete materials deteriorate continuously. To investigate the macroscopic damage evolution of compound silica fume and polyvinyl alcohol fiber under repeated freeze-thaw conditions, a concrete freeze-thaw damage model was established with the change of relative dynamic elastic modulus.
As mentioned previously, due to the existence of many irregular microcracks, micropores, and other defects inside the concrete, making the concrete under the action of repeated freeze-thaw cycles generated by the damage has great randomness. Freeze-thaw damage can be thought of as a type of randomly distributed variable that will necessarily conform to some type of statistical law. The two-parameter Weibull distribution model [37,38] has been used extensively as a life prediction model for failure assessment of brittle materials. As such, the Weibull distribution model was chosen to investigate the macroscopic damage evolution of concrete after repeated freeze-thawing.
According to the two-parameter Weibull distribution model, assuming that f ( N ) is the probability density function of freeze-thaw cycle life N , then
f ( N ) = β η ( N η ) β 1 exp ( ( N η ) β )
where η is the scale factor, and β is the Weber shape factor.
The corresponding probability distribution function is obtained by integrating:
F ( N ) = 1 exp ( ( N η ) β )
When n 1 freeze-thaw cycles have been experienced, the probability of failure of the concrete is:
P f ( n 1 ) = 1 exp ( ( n 1 η ) β )
The failure probability function of the Weibull distribution increases gradually with the number of freeze-thaw cycles, and it is an increasing function. From the concrete freeze-thaw, the damage deterioration process can be seen, including the degree of concrete freeze-thaw damage with the increasing number of freeze-thaw cycles deepening. Next, the freeze-thaw damage can be seen as a superposition of each freeze-thaw cycle on the concrete damage, where concrete freeze-thaw damage is a growing process. It can be assumed that the damage degree and failure probability of concrete had accumulated simultaneously during the freeze-thaw cycles that were performed. The damage degree D can be expressed as follows:
D = 1 E n E 0
where D is the damage degree, E n is the relative dynamic modulus of elasticity after n freeze-thaw cycles, and E 0 is the relative dynamic modulus of elasticity without freeze-thaw cycles.
The probability of failure of concrete after n 1 freeze-thaw cycles acting on concrete is P f ( n 1 ) , and the degree of damage produced is D ( n 1 ) ; when concrete fails to damage after N freeze-thaw cycles, concrete failure probability P f ( N ) = 1 and damage degree D ( N ) = 1. It follows that the concrete failure probability and damage degree can be equated, i.e., P f ( n ) = D ( n ) .
In summary, the concrete freeze-thaw random damage model based on the two-parameter Weibull probability distribution can be written as:
D ( n ) = 1 exp ( ( n η ) β )
Both ends of Equation (6) are identically deformed to obtain:
1 1 D = exp ( n η ) β
Taking the natural logarithm of both sides yields:
ln ( ln 1 1 D ) = β ln 1 η + β ln ( n )
Let Y = ln ( ln 1 1 D ) , X = ln ( n ) , and then the above equation can be rewritten as:
Y = a + b X
According to the damage degree and the freeze-thaw damage model, the parameter estimation was combined with the experimental data to obtain the material parameters a and b of concrete under different material admixtures, and the results are shown in Table 4.
The Weibull distribution parameters were subjected to linear regression. The damage evolution equation of concrete under the action of freeze-thaw cycles based on the Weibull probability distribution was obtained, as shown in Table 5.

3.7. GM (1, 1) Concrete Freeze-Thaw Resistance Prediction Model

Gray theory is widely used in scientific research as an analytical tool. “White” in cybernetics means high data integrity, sufficient data, and clear information, i.e., a white system. “Black” indicates low completeness of information, non-exhaustive information, and blurred information, i.e., a black system. “Gray” indicates that the information part is clear, and the data portion is complete between “white” and “black”, i.e., the gray system.
Since many factors in the concrete freeze-thaw damage prediction model study could have different degrees of influence on concrete freeze-thaw damage, it was difficult to discuss and analyze all the influencing factors together in the research process, so the concrete freeze-thaw damage prediction model study presented the system characteristics of incomplete information and uncertainty with the typical “gray” quality. By extracting valuable information, generating and developing known information, strengthening the degree of influence of known factors and weakening unknown factors, gray system theory could achieve the correct description of the evolutionary law of uncertain systems and then complete the quantitative prediction of future changes in the system.
The GM (1, 1) model in gray system theory [39] has the outstanding features of a simple modeling process, concise model expression, and wide application, as well as it is the basic model of a gray system. The GM (1, 1) model of the gray system is cited in this paper to establish the GM (1, 1) concrete frost resistance prediction model based on the measured damage degree of concrete with compound silica fume and polyvinyl alcohol fiber under different numbers of freeze-thaw cycles to quantitatively study the change in the damage degree of concrete under different numbers of freeze-thaw cycles.
Let the original damage degree sequence be:
X ( 0 ) = ( x 1 0 , x 2 0 , , x n 0 )
One accumulation of X ( 0 ) generates a sequence as:
X ( 1 ) = ( x 1 ( 1 ) , x 2 ( 1 ) , , x n ( 1 ) )
among, x k ( 1 ) = i = 1 k x k ( 0 ) , x k ( 0 ) 0 , k = 1 , 2 , , n .
Definition Z ( 1 ) = ( z 2 ( 1 ) , z 3 ( 1 ) , , z n ( 1 ) ) , among z k ( 1 ) = 1 2 ( x k ( 1 ) + x k 1 ( 1 ) ) , k = 2 , 3 , n called:
x k ( 0 ) + a z k ( 1 ) = u
Call Equation (10) the GM (1, 1) model. Called:
d x ( 1 ) d t + a x ( 1 ) = u
is the whitening differential equation for the GM (1, 1) model.
where parameter a is the development coefficient and b is the amount of gray action, The values of a and b depend on the form of construction of the original series and background values.
Parameter vector a = [ a , u ] T using the least squares method to determine
a = [ B T B ] 1 B T Y
Among:
Y = [ x 2 ( 0 ) x 3 ( 0 ) x n ( 0 ) ] ,   B = [ z 2 ( 1 ) z 3 ( 1 ) z 4 ( 1 ) 1 1 1 ]
Solving Equation (11) yields the time response equation of the GM (1, 1) model as:
x k + 1 ( 1 ) = [ x 1 ( 0 ) u a ] e a k + u a ,   k = 0 , 1 , , n 1
After a cumulative inverse operation to obtain the original series X ( 0 ) predicted value:
x k + 1 ( 0 ) = x k + 1 ( 1 ) x k ( 1 ) ,   k = 0 , 1 , , n 1
X ( 0 ) = [ x 1 ( 0 ) , x 2 ( 0 ) , x n ( 0 ) ]
Experimental measured values through the Equations (10)–(15) can be obtained from the model parameters a , u , and freeze-thaw damage under the concrete damage prediction model, (see Table 6). According to the damage degree prediction model, in order to obtain the predicted value of the damage degree under different number of freeze-thaw cycles, the previous concrete freeze-thaw damage equation by the Weibull probability distribution could develop the damage degree under different number of freeze-thaw cycles with different material admixture. The Weibull probability distribution model and GM (1, 1) model under different a number of freeze-thaw cycles damage degree and test measured data for comparison, as shown in Figure 10. Comparing the actual values of freeze-thaw damage with the predicted damage values of the two models, we can see that both the GM (1, 1) model and the freeze-thaw damage evolution equation based on the probability function of the Weibull distribution were in good agreement with the experimental results. The average relative error between the Weibull probability distribution model and the actual data was 6.43%, and the average relative error between the GM (1, 1) model and the actual data was 6.80%. From Figure 10, the relative errors of both models were high in the early stage when the number of freeze-thaw cycles were small, while the relative errors between the predicted and actual data of both models decreased as the number of freeze-thaw cycles increased. The large relative error of the two models in the early stage of the concrete freeze-thaw cycle was due to the water absorption and freezing swelling in the early stage of the concrete freeze-thaw cycle, considering that the freeze-thaw cycle was a long-term iterative process. With the gradual decline of the concrete performance, the impact of this phenomenon of freezing and swelling gradually decreased, so with the increasing number of freeze-thaw cycles, the relative error between the predicted and actual values of the two models decreased smaller and smaller. Both models met the boundary condition that the damage degree was 0 when the number of freeze-thaw cycles was 0. They could then predict the failure probability and damage degree of the material better.

4. Conclusions

We studied the effect of different contents of silica fume and polyvinyl alcohol fiber on the mechanical strength and frost resistance of concrete. We conducted a series of tests on compressive strength, flexural strength, freeze-thaw cycles, etc. The following conclusions can be drawn from the test results:
(1)
The compressive and flexural strength of concrete tends to increase and then decrease with the increase of silica fume and polyvinyl alcohol fiber content. The effect of polyvinyl alcohol fiber on the compressive and flexural strength of concrete is greater than that of silica fume. The highest compressive and flexural strength of concrete is achieved when silica fume content is 10% and polyvinyl alcohol fiber volume content is 1%.
(2)
The frost resistance of concrete was improved with the incorporation of silica fume and polyvinyl alcohol fiber. With the increase in silica fume and polyvinyl alcohol fiber incorporation, the mass loss rate of concrete after freeze-thaw cycles was gradually reduced and the aggregate spalling was improved. Similarly, the decrease in the relative dynamic elastic modulus of concrete after freeze-thaw cycles decreases as the content of silica fume and polyvinyl alcohol fiber increases. By comparing the contribution of materials to the frost resistance of concrete, it was concluded that the best frost resistance of concrete was obtained when the silica fume content was 10% and the polyvinyl alcohol fiber volume content was 1%.
(3)
With the incorporation of silica fume and polyvinyl alcohol fiber, the free content Ca(OH)2 inside the concrete decreases, and the pore space is reduced. The mesh structure in the interface transition zone is more compact, and the mechanical properties and frost resistance of concrete are improved.
(4)
A two-parameter Weibull probability distribution model and GM (1, 1) model were established to study the variation in the damage degree under different numbers of freeze-thaw cycles of concrete. With the increase in the number of freeze-thaw cycles, the relative errors between the predicted values of the two models and the experimental data decrease, and the average relative errors of the two models are close to each other, which indicates that both models can predict the freezing resistance of concrete well, and the research results can provide references for promotion and application in practical engineering.

Author Contributions

Conceptualization: Y.T., Z.X., Z.L. and J.J.; methodology: Y.T., Z.X., Z.L. and J.J.; software: Y.T., Z.X. and Z.L.; validation: Y.T., Z.X., Z.L. and J.J.; formal analysis: Y.T. and Z.X.; investigation: Y.T. and Z.X.; resources: Y.T., Z.X. and J.J.; data curation: Y.T., Z.X. and J.J.; writing—original draft preparation: Y.T., Z.X. and J.J.; writing—review and editing: Y.T., Z.X. and J.J.; visualization: Y.T., Z.X. and J.J.; supervision: Y.T., Z.X. and J.J.; project administration: Y.T., Z.X. and J.J.; funding acquisition: Y.T., Z.X. and J.J. All authors have read and agreed to the published version of the manuscript.

Funding

This research received no external funding.

Institutional Review Board Statement

Not applicable.

Informed Consent Statement

Not applicable.

Data Availability Statement

The data used to support the findings of this study are available from the corresponding author upon request.

Conflicts of Interest

The authors declare no conflict of interest.

References

  1. Jiang, F.-X.; Wittmann, F.; Zhao, T.-J. Influence of Mechanically Induced Damage on Durability and Service Life of Reinforced Concrete Structures. Restor. Build. Monum. 2011, 17, 25–32. [Google Scholar] [CrossRef]
  2. Wang, L.; Li, G.; Li, X.; Guo, F.; Tang, S.; Lu, X.; Hanif, A. Influence of reactivity and dosage of MgO expansive agent on shrinkage and crack resistance of face slab concrete. Cem. Concr. Compos. 2021, 126, 104333. [Google Scholar] [CrossRef]
  3. Huang, J.; Li, W.; Huang, D.; Wang, L.; Chen, E.; Wu, C.; Wang, B.; Deng, H.; Tang, S.; Shi, Y.; et al. Fractal Analysis on Pore Structure and Hydration of Magnesium Oxysulfate Cements by First Principle, Thermodynamic and Microstructure-Based Methods. Fractal Fract. 2021, 5, 164. [Google Scholar] [CrossRef]
  4. Wang, L.; Zeng, X.; Yang, H.; Lv, X.; Guo, F.; Shi, Y.; Hanif, A. Investigation and Application of Fractal Theory in Cement-Based Materials: A Review. Fractal Fract. 2021, 5, 247. [Google Scholar] [CrossRef]
  5. Alaloul, W.S.; Musarat, M.A.; Haruna, S.; Law, K.; Tayeh, B.A.; Rafiq, W.; Ayub, S. Mechanical Properties of Silica Fume Modified High-Volume Fly Ash Rubberized Self-Compacting Concrete. Sustainability 2021, 13, 5571. [Google Scholar] [CrossRef]
  6. Ren, J.; Hu, L.; Dong, Z.; Tang, L.; Xing, F.; Liu, J. Effect of silica fume on the mechanical property and hydration characteristic of alkali-activated municipal solid waste incinerator (MSWI) fly ash. J. Clean. Prod. 2021, 295, 126317. [Google Scholar] [CrossRef]
  7. Wang, L.; Luo, R.Y.; Zhang, W.; Jin, M.M.; Tang, S.W. Effects of Fineness and Content of Phosphorus Slag on Cement Hydration, Permeability, Pore Structure and Fractal Dimension of Concrete. Fractals 2021, 29, 2140004. [Google Scholar] [CrossRef]
  8. Pi, Z.; Xiao, H.; Liu, R.; Li, H. Combination usage of nano-SiO2-coated steel fiber and silica fume and its improvement effect on SFRCC. Compos. Part B Eng. 2021, 221, 109022. [Google Scholar] [CrossRef]
  9. Berenguer, R.; Lima, N.; Pinto, L.; Monteiro, E.; Povoas, Y.; Oliveira, R. Cement-based materials: Pozzolanic activities of mineral additions are compromised by the presence of reactive oxides. J. Build. Eng. 2021, 41, 102358. [Google Scholar] [CrossRef]
  10. Negahban, E.; Bagheri, A.; Sanjayan, J. Pore gradation effect on Portland cement and geopolymer concretes. Cem. Concr. Compos. 2021, 122, 104141. [Google Scholar] [CrossRef]
  11. Wang, L.; Jin, M.M.; Guo, F.X.; Wang, Y.; Tang, S.W. Pore Structural and Fractal Analysis of the Influence of FLY ASH and Silica Fume on the Mechanical Property and Abrasion Resistance of Concrete. Fractals 2021, 29, 2140003. [Google Scholar] [CrossRef]
  12. Mousavinejad, S.H.G.; Sammak, M. Strength and chloride ion penetration resistance of ultra-high-performance fiber reinforced geopolymer concrete. Structures 2021, 32, 1420–1427. [Google Scholar] [CrossRef]
  13. Barbuta, M.; Harja, M.; Baran, I. Comparison of Mechanical Properties for Polymer Concrete with Different Types of Filler. J. Mater. Civ. Eng. 2010, 22, 696–701. [Google Scholar] [CrossRef]
  14. Wang, D.; Zhao, Q.; Yang, C.; Chi, Y.; Qi, W.; Teng, Z. Study on frost resistance and vegetation performance of seashell waste pervious concrete in cold area. Constr. Build. Mater. 2020, 265, 120758. [Google Scholar] [CrossRef]
  15. Liu, Y.; Shi, C.; Zhang, Z.; Li, N.; Shi, D. Mechanical and fracture properties of ultra-high performance geopolymer concrete: Effects of steel fiber and silica fume. Cem. Concr. Compos. 2020, 112, 103665. [Google Scholar] [CrossRef]
  16. Ali, B.; Ahmed, H.; Qureshi, L.A.; Kurda, R.; Hafez, H.; Mohammed, H.; Raza, A. Enhancing the Hardened Properties of Recycled Concrete (RC) through Synergistic Incorporation of Fiber Reinforcement and Silica Fume. Materials 2020, 13, 4112. [Google Scholar] [CrossRef]
  17. Wu, Z.; Khayat, K.H.; Shi, C. Changes in rheology and mechanical properties of ultra-high performance concrete with silica fume content. Cem. Concr. Res. 2019, 123, 105786. [Google Scholar] [CrossRef]
  18. Lu, Z.; Feng, Z.-G.; Yao, D.; Li, X.; Ji, H. Freeze-thaw resistance of Ultra-High performance concrete: Dependence on concrete composition. Constr. Build. Mater. 2021, 293, 123523. [Google Scholar] [CrossRef]
  19. Zhang, P.; Li, Q. Effect of silica fume on durability of concrete composites containing fly ash. Sci. Eng. Compos. Mater. 2013, 20, 57–65. [Google Scholar] [CrossRef]
  20. Luo, G.; Zhao, P.; Zhang, Y.; Xie, Z. Performance Evaluation of Waste Crumb Rubber/Silica Fume Composite Modified Pervious Concrete in Seasonal Frozen Regions. Adv. Mater. Sci. Eng. 2021, 2021, 1–10. [Google Scholar] [CrossRef]
  21. Park, J.-J.; Yoo, D.-Y.; Kim, S.; Kim, S.-W. Benefits of synthetic fibers on the residual mechanical performance of UHPFRC after exposure to ISO standard fire. Cem. Concr. Compos. 2019, 104, 103401. [Google Scholar] [CrossRef]
  22. Yu, J.; Chen, Y.; Leung, C.K. Mechanical performance of Strain-Hardening Cementitious Composites (SHCC) with hybrid polyvinyl alcohol and steel fibers. Compos. Struct. 2019, 226, 111198. [Google Scholar] [CrossRef]
  23. Wang, T.; Zhao, Y.; Ma, B.; Zeng, C. Durability Study on High-Performance Fiber-Reinforced Mortar under Simulated Wastewater Pipeline Environment. Materials 2021, 14, 3781. [Google Scholar] [CrossRef]
  24. Pakravan, H.R.; Jamshidi, M. Tensile properties of strain-hardening cementitious composites containing polyvinyl-alcohol fibers hybridized with polypropylene fibers. J. Cent. South Univ. 2018, 25, 51–59. [Google Scholar] [CrossRef]
  25. Yew, M.K.; Bin Mahmud, H.; Ang, B.C. Effects of Low Volume Fraction of Polyvinyl Alcohol Fibers on the Mechanical Properties of Oil Palm Shell Lightweight Concrete. Adv. Mater. Sci. Eng. 2015, 2015, 1–11. [Google Scholar] [CrossRef] [Green Version]
  26. Yao, X.; Shamsaei, E.; Chen, S.; Zhang, Q.H.; de Souza, F.B.; Sagoe-Crentsil, K.; Duan, W. Graphene oxide-coated Poly(vinyl alcohol) fibers for enhanced fiber-reinforced cementitious composites. Compos. Part B Eng. 2019, 174, 107010. [Google Scholar] [CrossRef]
  27. Wang, L.; Guo, F.X.; Yang, H.M.; Wang, Y.; Tang, S.W. Comparison of FLY ASH, PVA Fiber, MgO and Shrinkage-reducing Admixture on the Frost Resistance of Face Slab Concrete via Pore Structural and Fractal Analysis. Fractals 2021, 29, 2140002. [Google Scholar] [CrossRef]
  28. Zhang, R.; Jin, L.; Tian, Y.; Dou, G.; Du, X. Static and dynamic mechanical properties of eco-friendly polyvinyl alcohol fiber-reinforced ultra-high-strength concrete. Struct. Concr. 2019, 20, 1051–1063. [Google Scholar] [CrossRef]
  29. Malik, M.A.; Sarkar, M.; Xu, S.; Li, Q. Effect of PVA/SiO2 NPs Additive on the Structural, Durability, and Fire Resistance Properties of Geopolymers. Appl. Sci. 2019, 9, 1953. [Google Scholar] [CrossRef] [Green Version]
  30. Al Rikabi, F.T.; Sargand, S.M.; Khoury, I.; Hussein, H.H. Material Properties of Synthetic Fiber–Reinforced Concrete under Freeze-Thaw Conditions. J. Mater. Civ. Eng. 2018, 30, 04018090. [Google Scholar] [CrossRef]
  31. Wang, J.; Dai, Q.; Si, R.; Guo, S. Investigation of properties and performances of Polyvinyl Alcohol (PVA) fiber-reinforced rubber concrete. Constr. Build. Mater. 2018, 193, 631–642. [Google Scholar] [CrossRef]
  32. Zhang, P.; Fu, S.; Zhang, K.; Zhang, T. Mechanical Properties of Polyvinyl Alcohol Fiber-Reinforced Concrete Composite Containing Fly Ash and Nano-SiO2. Sci. Adv. Mater. 2018, 10, 769–778. [Google Scholar] [CrossRef]
  33. Nam, J.; Kim, G.; Lee, B.; Hasegawa, R.; Hama, Y. Frost resistance of polyvinyl alcohol fiber and polypropylene fiber reinforced cementitious composites under freeze thaw cycling. Compos. Part B Eng. 2016, 90, 241–250. [Google Scholar] [CrossRef]
  34. Zhong, J.; Shi, J.; Shen, J.; Zhou, G.; Wang, Z. Investigation on the Failure Behavior of Engineered Cementitious Composites under Freeze-Thaw Cycles. Materials 2019, 12, 1808. [Google Scholar] [CrossRef] [Green Version]
  35. GB/T 50081-2019. Standard for Test Methods of Concrete Physical and Mechanical Properties; Ministry of Housing and Urban-Rural Development of the People’s Republic of China: Beijing, China, 2019.
  36. GB/T 50082-2009. Standard for Test Methods of Long-Term Performance and Durability of Ordinary Concrete; Ministry of Housing and Urban-Rural Development of the People’s Republic of China: Beijing, China, 2009.
  37. Li, J.; Qiao, H.; Zhu, F. Reliability Analysis of Fiber Concrete Freeze-Thaw Damage Based on Weibull Method. Emerg. Mater. Res. 2020, 9, 1–9. [Google Scholar] [CrossRef]
  38. Hanif, A.; Kim, Y.; Park, C. Numerical Validation of Two-Parameter Weibull Model for Assessing Failure Fatigue Lives of Laminated Cementitious Composites—Comparative Assessment of Modeling Approaches. Materials 2018, 12, 110. [Google Scholar] [CrossRef] [Green Version]
  39. Zhang, J.; Li, S.; Zhai, J. Grey Prediction Model for Drying Shrinkage of Cement Concrete Made from Recycled Coarse Aggregate Containing Superabsorbent Polymers. Math. Probl. Eng. 2021, 2021, 1–9. [Google Scholar] [CrossRef]
Figure 1. Testing device: (a) Compression test, (b) Flexural strength test, (c) Freeze-thaw cycle test, (d) Determination of dynamic elastic modulus.
Buildings 12 00047 g001aBuildings 12 00047 g001b
Figure 2. Change in compressive strength.
Buildings 12 00047 g002
Figure 3. Contour map of compressive strength.
Buildings 12 00047 g003
Figure 4. Change in flexural strength.
Buildings 12 00047 g004
Figure 5. Contour map of flexural strength.
Buildings 12 00047 g005
Figure 6. Apparent changes in freeze-thaw cycles: (a) Freeze-thaw cycle 0 times, (b) Freeze-thaw cycle 50 times, (c) Freeze-thaw cycle 100 times, and (d) Freeze-thaw cycle 150 times.
Buildings 12 00047 g006aBuildings 12 00047 g006b
Figure 7. Mass loss rate: (a) Polyvinyl alcohol fiber content 0%, (b) Polyvinyl alcohol fiber content 0.5%, (c) Polyvinyl alcohol fiber content 1%, and (d) Polyvinyl alcohol fiber content 1.5%.
Buildings 12 00047 g007
Figure 8. Relative dynamic modulus of elasticity: (a) Polyvinyl alcohol fiber content 0%, (b) Polyvinyl alcohol fiber content 0.5%, (c) Polyvinyl alcohol fiber content 1%, and (d) Polyvinyl alcohol fiber content 1.5%.
Buildings 12 00047 g008
Figure 9. Concrete internal structure:(a) Ordinary concrete, (b) Silica fume—polyvinyl alcohol fiber concrete.
Buildings 12 00047 g009
Figure 10. Freeze-thaw random damage evolution equation calculation results compared with the test curve: (a) Polyvinyl alcohol fiber content 0%, (b) Polyvinyl alcohol fiber content 0.5%, (c) Polyvinyl alcohol fiber content 1%, and (d) Polyvinyl alcohol fiber content 1.5%.
Buildings 12 00047 g010aBuildings 12 00047 g010b
Table 1. Materials for test.
MaterialInformation
CementP. O 42.5 grade ordinary silicate cement produced by Wuhan Xinhua Company
StoneOrdinary graded gravel with particle size of 5–25 mm
SandGrade-II medium sand, continuous gradation, fineness modulus 2.83
Fly AshHenan Hengyuan New Materials Co. Ltd., produces Class-I fly ash with a density of 2.55 g/cm3
Silica FumeThe silica fume produced by Henan Yixiang New Materials Co. Ltd., has a percentage SiO2 content of 98.1% and a specific surface area of 21 m2/g
Polyvinyl Alcohol FiberPolyvinyl alcohol fiber produced by Kuraray Japan, has a length of 9 mm and a density of 1.3 g/cm3
Water Reducing AgentPolycarboxylic acid high-performance water reducing agent (powder)
WaterOrdinary tap water
Table 2. Mix proportion design of concrete.
No. PVA Volume Ratio/%Amount of Material/(kg·m−3)
Silica FumeCementStoneSandFly AshWaterWater Reducing Agent
PVA0SF00%03301061837611701
PVA0SF516.5313.51061837611701
PVA0SF10332971061837611701
PVA0SF1549.5280.51061837611701
PVA0.5SF00.5%03301061837611701
PVA0.5SF516.5313.51061837611701
PVA0.5SF10332971061837611701
PVA0.5SF1549.5280.51061837611701
PVA1SF01%03301061837611701
PVA1SF516.5313.51061837611701
PVA1SF10332971061837611701
PVA1SF1549.5280.51061837611701
PVA1.5SF01.5%03301061837611701
PVA1.5SF516.5313.51061837611701
PVA1.5SF10332971061837611701
PVA1.5SF1549.5280.51061837611701
Table 3. Contribution rate regression model.
PVA0SF0PVA0SF5PVA0SF10PVA0SF15
y = −0.21997x + 99.35929y = −0.16457x + 99.74286y = −0.12426x + 99.64643y = −0.13877x + 99.09786
PVA0.5SF0PVA0.5SF5PVA0.5SF10PVA0.5SF15
y = −0.14371x + 98.81y = −0.13581x + 99.68321y = −0.12294x + 100.7321y = −0.1224x + 99.42714
PVA1SF0PVA1SF5PVA1SF10PVA1SF15
y = −0.11926x + 100.12286y = −0.10916x + 99.81536y = −0.06686x + 100.6886y = −0.09319x + 99.75179
PVA1.5SF0PVA1.5SF5PVA1.5SF10PVA1.5SF15
y = −0.15099x + 98.48107y = −0.12949x + 98.29286y = −0.1111x + 99.56821y = −0.11671x + 97.95292
Table 4. Weibull distribution linear regression parameters.
No. abR2No. abR2
PVA0SF0−5.955071.001040.96547PVA1SF0−6.421450.940210.93195
PVA0SF5−6.004770.935090.95561PVA1SF5−6.049310.845680.88492
PVA0SF10−6.011520.873570.96666PVA1SF10−8.515951.231580.96869
PVA0SF15−5.809070.867690.99007PVA1SF15−6.241610.856020.96131
PVA0.5SF0−5.414430.793160.94489PVA1.5SF0−5.12790.747210.9574
PVA0.5SF5−5.951540.879670.96097PVA1.5SF5−4.995340.689330.93931
PVA0.5SF10−7.476181.162860.99115PVA1.5SF10−6.388660.934620.99056
PVA0.5SF15−5.84250.834960.96413PVA1.5SF15−5.03250.685290.99056
Table 5. Freeze-thaw damage evolution equation.
PVA0SF0PVA0SF5PVA0SF10PVA0SF15
D ( n ) = 1 exp ( ( n 383.325 ) 1.001 ) D ( n ) = 1 exp ( ( n 614.984 ) 0.935 ) D ( n ) = 1 exp ( ( n 974.14 ) 0.874 ) D ( n ) = 1 exp ( ( n 808.247 ) 0.868 )
PVA0.5SF0PVA0.5SF5PVA0.5SF10PVA0.5SF15
D ( n ) = 1 exp ( ( n 921.869 ) 0.793 ) D ( n ) = 1 exp ( ( n 867.531 ) 0.88 ) D ( n ) = 1 exp ( ( n 619.636 ) 1.163 ) D ( n ) = 1 exp ( ( n 1093.721 ) 0.835 )
PVA1SF0PVA1SF5PVA1SF10PVA1SF15
D ( n ) = 1 exp ( ( n 925.009 ) 0.940 ) D ( n ) = 1 exp ( ( n 1278.177 ) 0.845 ) D ( n ) = 1 exp ( ( n 1006.923 ) 1.232 ) D ( n ) = 1 exp ( ( n 1467.668 ) 0.856 )
PVA1.5SF0PVA1.5SF5PVA1.5SF10PVA1.5SF15
D ( n ) = 1 exp ( ( n 955.973 ) 0.747 ) D ( n ) = 1 exp ( ( n 1403.409 ) 0.689 ) D ( n ) = 1 exp ( ( n 930.358 ) 0.935 ) D ( n ) = 1 exp ( ( n 1546.279 ) 0.685 )
Table 6. Freeze-thaw damage evolution equation.
No.PVA0SF0PVA0SF5PVA0SF10PVA0SF15
GM (1, 1) model y = 34.705 e 0.253 k 34.705 y = 21.051 e 0.2758 k 21.051 y = 16.734 e 0.2704 k 16.734 y = 23.955 e 0.2446 k 23.955
a −0.253−0.2758−0.2704−0.2446
u 8.78035.8064.52495.8593
No. PVA0.5SF0PVA0.5SF5PVA0.5SF10PVA0.5SF15
GM (1, 1) model y = 27.878 e 0.2328 k 27.878 y = 17.455 e 0.2754 k 17.455 y = 17.403 e 0.2643 k 17.403 y = 13.017 e 0.293 k 13.017
a −0.2328−0.2754−0.3201−0.2643
u 6.49014.80713.39934.5995
No. PVA1SF0PVA1SF5PVA1SF10PVA1SF15
GM (1, 1) model y = 13.017 e 0.293 k 13.017 y = 13.708 e 0.2778 k 13.708 y = 4.322 e 0.3555 k 4.322 y = 12.136 e 0.274 k 12.136
a −0.293−0.2778−0.3555−0.274
u 3.8143.8081.54023.3253
No. PVA1.5SF0PVA1.5SF5PVA1.5SF10PVA1.5SF15
GM (1, 1) model y = 29.952 e 0.2313 k 29.952 y = 30.24 0.2157 k 30.24 y = 17.735 e 0.2521 k 17.735 y = 36.241 e 0.1888 k 36.241
a −0.2313−0.2157−0.2521−0.1888
u 6.92786.52284.4716.8423
Publisher’s Note: MDPI stays neutral with regard to jurisdictional claims in published maps and institutional affiliations.

