Article

Stochastic Dynamic Analysis of Cultural Heritage Towers up to Collapse

by
Emmanouil-Georgios S. Kouris
1,
Leonidas-Alexandros S. Kouris
1,*,
Avraam A. Konstantinidis
1,
Stavros K. Kourkoulis
2,
Chris G. Karayannis
3 and
Elias C. Aifantis
1,4
1
Laboratory of Engineering Mechanics, School of Civil Engineering, Aristotle University of Thessaloniki (AUTh), GR-54124 Thessaloniki, Greece
2
Laboratory of Testing and Materials, Department of Mechanics, National Technical University of Athens (NTUA), GR-15773 Athens, Greece
3
School of Civil Engineering, Democritus University of Thrace, GR-67100 Xanthi, Greece
4
Mercator Fellow, Friedrich-Alexander University (FAU), Erlangen-Nuremberg, 90762 Fürth, Germany
*
Author to whom correspondence should be addressed.
Buildings 2021, 11(7), 296; https://doi.org/10.3390/buildings11070296
Submission received: 17 May 2021 / Revised: 30 June 2021 / Accepted: 1 July 2021 / Published: 7 July 2021

Abstract

:
This paper deals with the seismic vulnerability of monumental unreinforced masonry (URM) towers, the fragility of which has not yet been sufficiently studied. Thus, the present paper fills this gap by developing models to investigate the seismic response of URM towers up to collapse. On mount Athos, Greece, there exist more than a hundred medieval towers, having served mainly as campaniles or fortifications. Eight representative towers were selected for a thorough investigation to estimate their seismic response characteristics. Their history and architectural features are initially discussed and a two-step analysis follows: (i) limit analysis is performed to estimate the collapse mechanism and the locations of critical cracks, (ii) non-linear explicit dynamic analyses are then carried out, developing finite element (FE) simulations, with cracks modelled as interfacial surfaces to derive the capacity curves. A meaningful definition of the damage states is proposed based on the characteristics of their capacity curves, with the ultimate limit state related to collapse. The onset of slight damage-state is characterised by the formation and development of cracks responsible for the collapse mechanism of the structure. Apart from these two, another two additional limit states are also specified: the moderate damage-state and the extensive one. Fragility and vulnerability curves are finally generated which can help the assessment and preservation of cultural heritage URM towers.

1. Introduction

Unreinforced masonry (URM) towers constitute an important element of architectural heritage. Their high seismic vulnerability was witnessed during recent earthquakes in Italy which resulted in many of them collapsing [1,2,3,4,5,6]. Apart from the very low tensile capacity of URM, a number of additional critical features of these structures increase dramatically their vulnerability: increased slenderness, high weight/strength ratio, insufficient connection with timber diaphragms, inhomogeneous nature of materials, complex constructive stages, lack of rigid diaphragms, presence of vaulted systems, and progressive material degradation due to high compressive stresses, ageing, and environmental effects.
URM towers subjected to ground shaking usually collapse due to overturning of their most critical part, as a consequence of the insufficient connection between perpendicular walls and critical adjacent structural members [6,7,8]. For instance, the disintegration of the belfry when the uppermost part hosts bells, owing to the overturn of the piers, can cause the collapse of the whole structure [9]. Other possible collapse mechanisms relate to diagonal cracks or, occasionally, vertical ones [10]. The formation of cracks occurs mainly in zones with high principle tensile stresses which force the construction to be split in parts. When a structure is cracked and there is no other link between the adjacent members, its dynamic response resembles rocking oscillation. This type of vibration is very frequent in URM towers and drives out-of-plane collapse [11,12]. The development of such cracks and the initiation of a collapse mechanism may occur even for very low loadings and may be difficult to notice.
Vulnerability analysis of historical towers subjected to dynamic loads is a challenging task for two main reasons: (i) masonry’s non-linear (NL) behaviour is hard to rigorously model due to its complexity, and (ii) accurate material idealisation is not straightforward due to variation in the mechanical properties of the structure. Hence, a number of approaches have been proposed to yield reliable numerical tools capable of precisely representing the seismic behaviour such as micro-models, e.g. [13], discrete models, e.g. [14], and macro-elements together with homogenisation approaches, e.g. [15,16,17]. Traditional masonry buildings are not generally able to show sufficient seismic resistance due to ageing of materials and intrinsic inadequacies including: poor tensile strength of masonry, high weight/strength ratio, insufficient connection with timber diaphragms, and the inhomogeneous nature of materials. Evidence, in some cases, of constructions with an intention to resist seismic activity in areas of high seismicity by incorporation of timber and steel elements in the walls can be found only locally [18,19,20,21,22,23], but, even in these cases, not following a rational design. Sophisticated techniques involving dynamic monitoring allow an estimation of the actual state of masonry buildings and towers [24,25,26,27,28].
To prioritise the needs of structural strengthening for preserving architectural heritage, their vulnerability should be assessed [29] and, along with risk scenarios, possible losses should be evaluated. In this framework, our aim is a statistical treatment of the vulnerability by generating fragility curves as a fast tool for assessing the seismic capacity of masonry towers. To this end, we studied the towers’ population and selected a representative group of towers to estimate their average response characteristics in terms of expected damage. The basic features of the selected case-study towers are presented in Section 2. Limit analyses were carried out to define, firstly, the collapse mechanism. Section 3 presents the theoretical framework of limit analysis as well as the collapse mechanisms considered. Once the critical mechanism was identified, finite element (FE) simulations and analyses were carried out to investigate the seismic performance of the cracked structure with a gradually increasing intensity up to collapse of several time-histories. In each step the maximum displacement at the top is measured. In Section 5 the considered time-histories are presented and a parametric analysis for the material properties is performed. Then, in Section 6, NL explicit dynamic analyses for the case-study towers are presented and the displacement capacities are estimated. Using the properties of the collapse mode at hand, we converted these displacements into spectral quantities. Proposing a new definition of the damage thresholds for rocking structures, we generated a set of fragility curves to describe damage and out-of-plane collapse expressed in terms of spectral displacement.

2. Properties of the Case-Study Towers

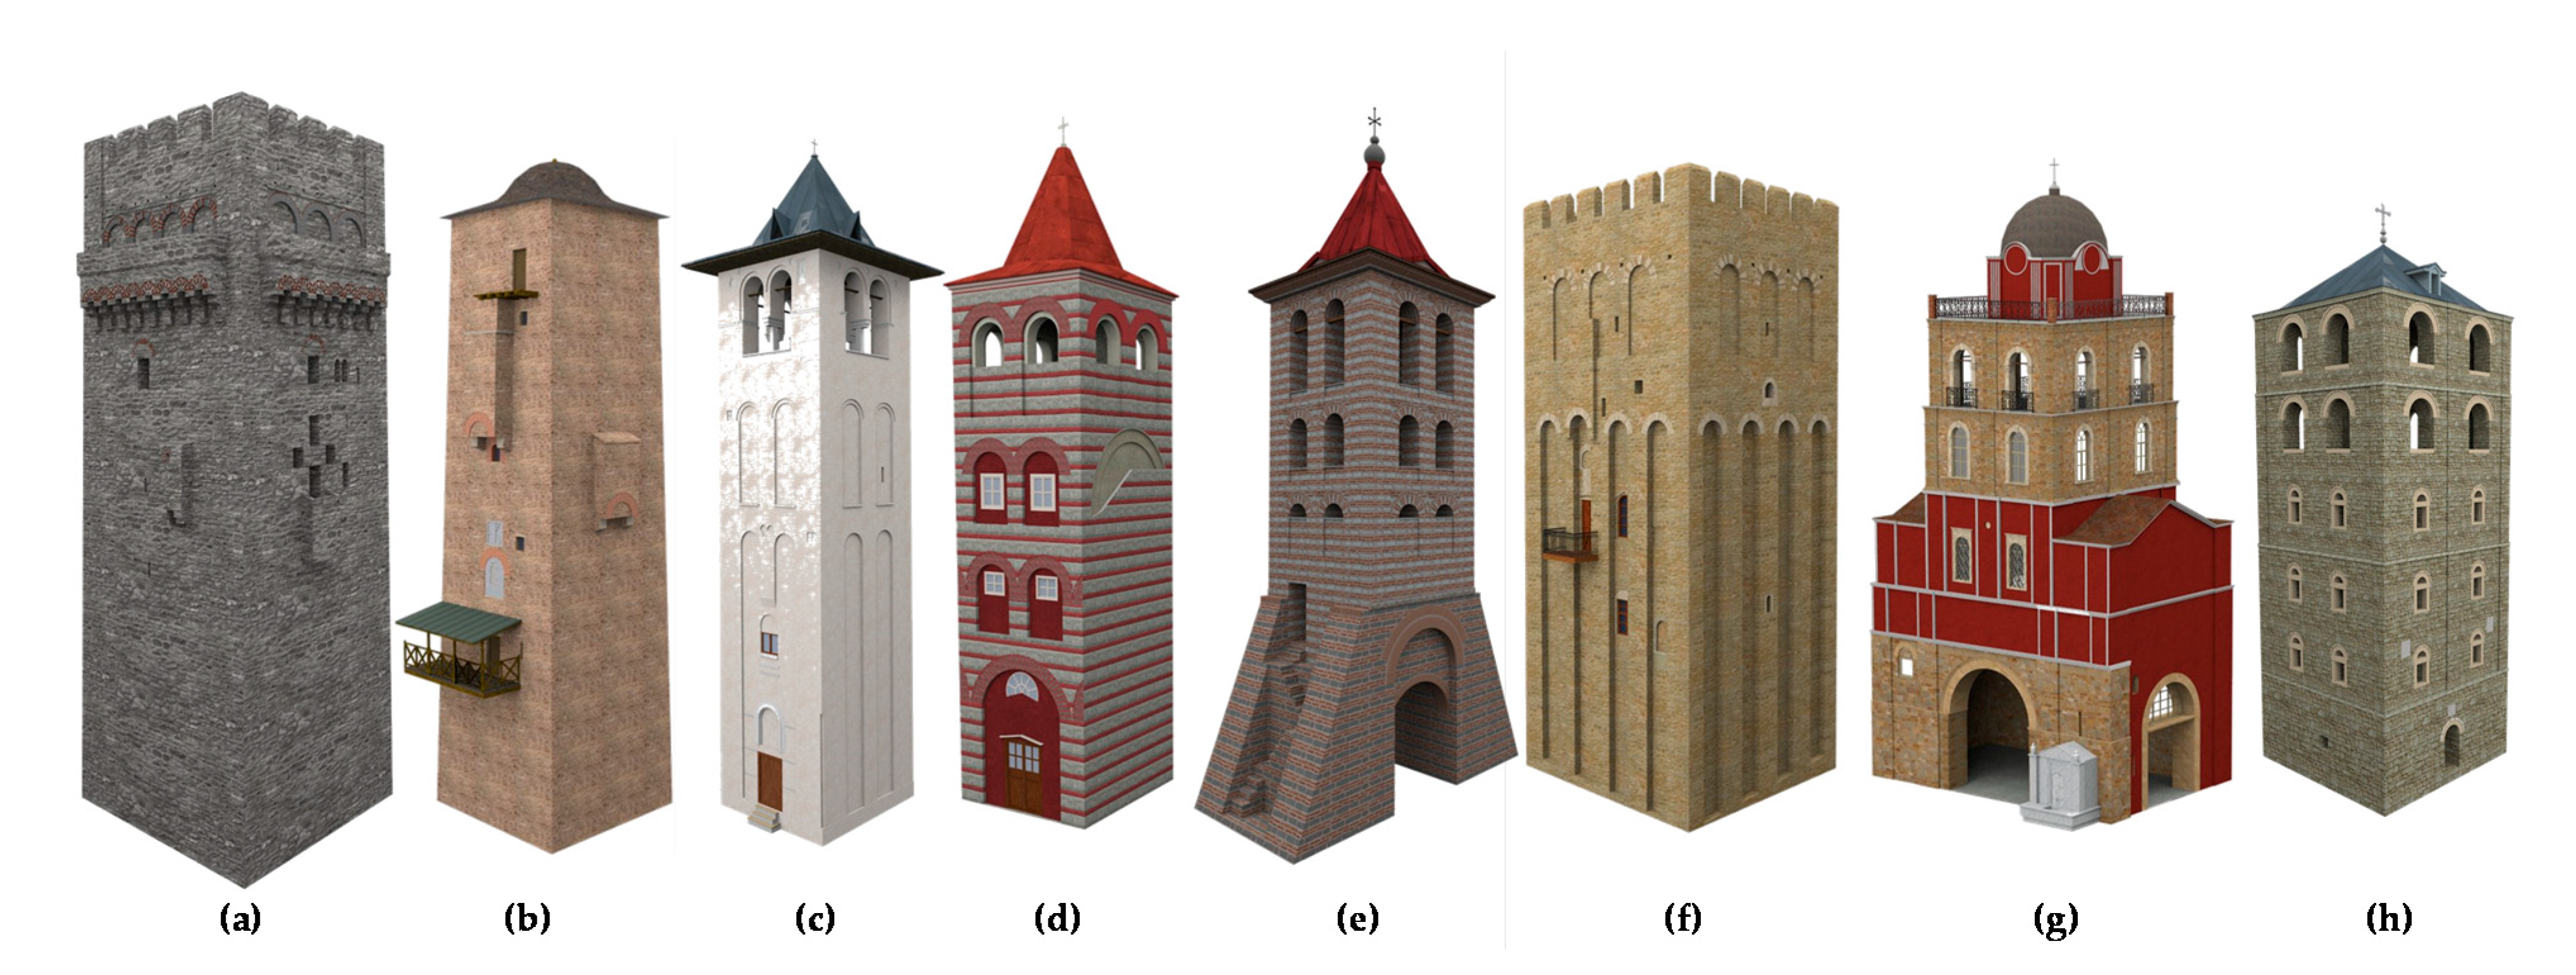
2.1. Selection of Case-Study Towers

Mount Athos, in Greece, has enjoyed self-administrative rights for more than one millennium. It was formally established in the territory of the Byzantine Empire in 972 A.D. Owing to its uniqueness and its abundance in monumental structures covering several centuries, it has been declared a world heritage site by UNESCO [30]. The monastic compounds are composed of—apart from the churches—fortification walls, buildings with various uses (e.g., living, storage, etc.), and towers. These towers were erected as early as the 10th century A.D., mainly as part of the defence system or to host bells [31]. Today, there exist more than a hundred towers and eight of them were selected for a thorough study as representatives.
The case-study towers include three defence towers and five campaniles (Figure 1) whose basic characteristics are listed in Table 1. The defence walls follow a standard style and the selection was based on their height and their slenderness ratio. The bell-towers’ architecture varies more and, for better representation, five of them were selected.
The tallest tower under investigation is that of Caracallou Monastery, being 27.75 m tall with a slenderness ratio of 3.08. Caracallou Monastery was established in the beginning of the 11th century A.D. The investigated tower (Figure 1a) was erected in the mid-15th century and is equipped with embrasures (meurtrières) and loopholes while the openings along the height of the structure are very small, forming a robust structure. The horizontal cross section of the tower is square with sides 9.0 m long.
The second tallest tower of the study group is that of the Koutloumousiou Monastery (Figure 1b) dating back to the 14th century. Its height is 26.90 m, while its almost square base has sides equal to 5.24 m. The square section of the tower decreases with height presenting an inclination of 10‰ towards the centre of the square. The wall thickness is 1.25 m.
A slenderer tower is the campanile of Vatopaidion Monastery with a slenderness ratio of approximately 5.7 and height 25.55 m (Figure 1c). It dates back to 1427 A.D. The height of the masonry structure without the roof is 21.0 m. The footprint of the tower is approximately square with sides 4.5 m long.
The bell tower of Philotheou Monastery (Figure 1d) is among the oldest towers studied herein, built in the 11th century A.D. It has suffered several incidents and, as a consequence, has undergone interventions and partial reconstructions over the centuries. It is 24.90 m tall and its width measures 5.5 m. Hence, its slenderness ratio is 4.5, lower than that of the Vatopaidion tower. The stone masonry was carefully constructed with mortar joints as thick as 7 cm locally. The walls are approximately 1.15 m thick at the base, decreasing only slightly (by around 10 cm) at the top. The belfry is 4.5 m high but the openings are quite small, resulting in a robust structure.
Protaton tower (Figure 1e) is one of two towers with the smallest horizontal area (20.25 m2) amongst the case-study towers and was first erected in 1534 A.D. A characteristic of this tower is the presence of a bi-part foundation structure forming an arch and serving as an entrance gate.
The third defence tower under investigation is Dionysiou tower (Figure 1f), most probably also erected during the 14th century. It is shorter than the previous two with a height of 23.16 m. The tower geometry is dominated by strict symmetry with a footprint of 49 m2 and very few openings.
Xenophontos Monastery was established in 998 A.D. but the campanile construction started around 1820–1830 and was completed on 1 March 1864. It is a more complex structure than the others with a square footprint of 81 m2 and a height of 19.50 m. The walls are made of stone masonry. Internal levels are made of timber beams and planks forming five storeys (Figure 1g). Tie rods exist at the upper two levels which host the bells. The hip roof is also wooden.
The campanile of Iveron Monastery (Figure 1h) was destroyed several times due to invasions or natural catastrophes such as fires, etc. The last restoration took place around the end of the 19th century and the beginning of the 20th. Its height is 20.52 m.
The main architectural characteristics of the case-study towers are summarised in Table 1.

2.2. Material Properties of the Towers

The construction date of the case-study towers varies substantially from as early as the 14th century to the 19th century. Despite the large time span, masonry materials for the towers were extracted from common quarries due to the abundance of sources in the area and, as a result, common material properties are shared [32]. The inspection of masonry also revealed similar construction techniques among them. It is noted, though, that despite similar construction techniques, a different response to similar loading conditions should be expected; this is due to the fact that each towers’ mechanical characteristics are largely affected by a number of factors; geometry of blocks and bonding, type of mortars, history of each tower, humidity, etc., to name a few.
A detailed elastic analysis should account for the inhomogeneous nature of masonry, normally assumed to be an orthotropic material. However, for large structures with very thick walls, the assumption of a homogeneous material can often be sufficient, with an elastic modulus Ε = 2.5 GPa, a Poisson ratio v = 0.15, and a specific weight γ = 23 kN/m2 being realistic assumptions [23,32,33,34].
A parametric analysis was carried out to investigate the influence of the material properties (Section 5.1).

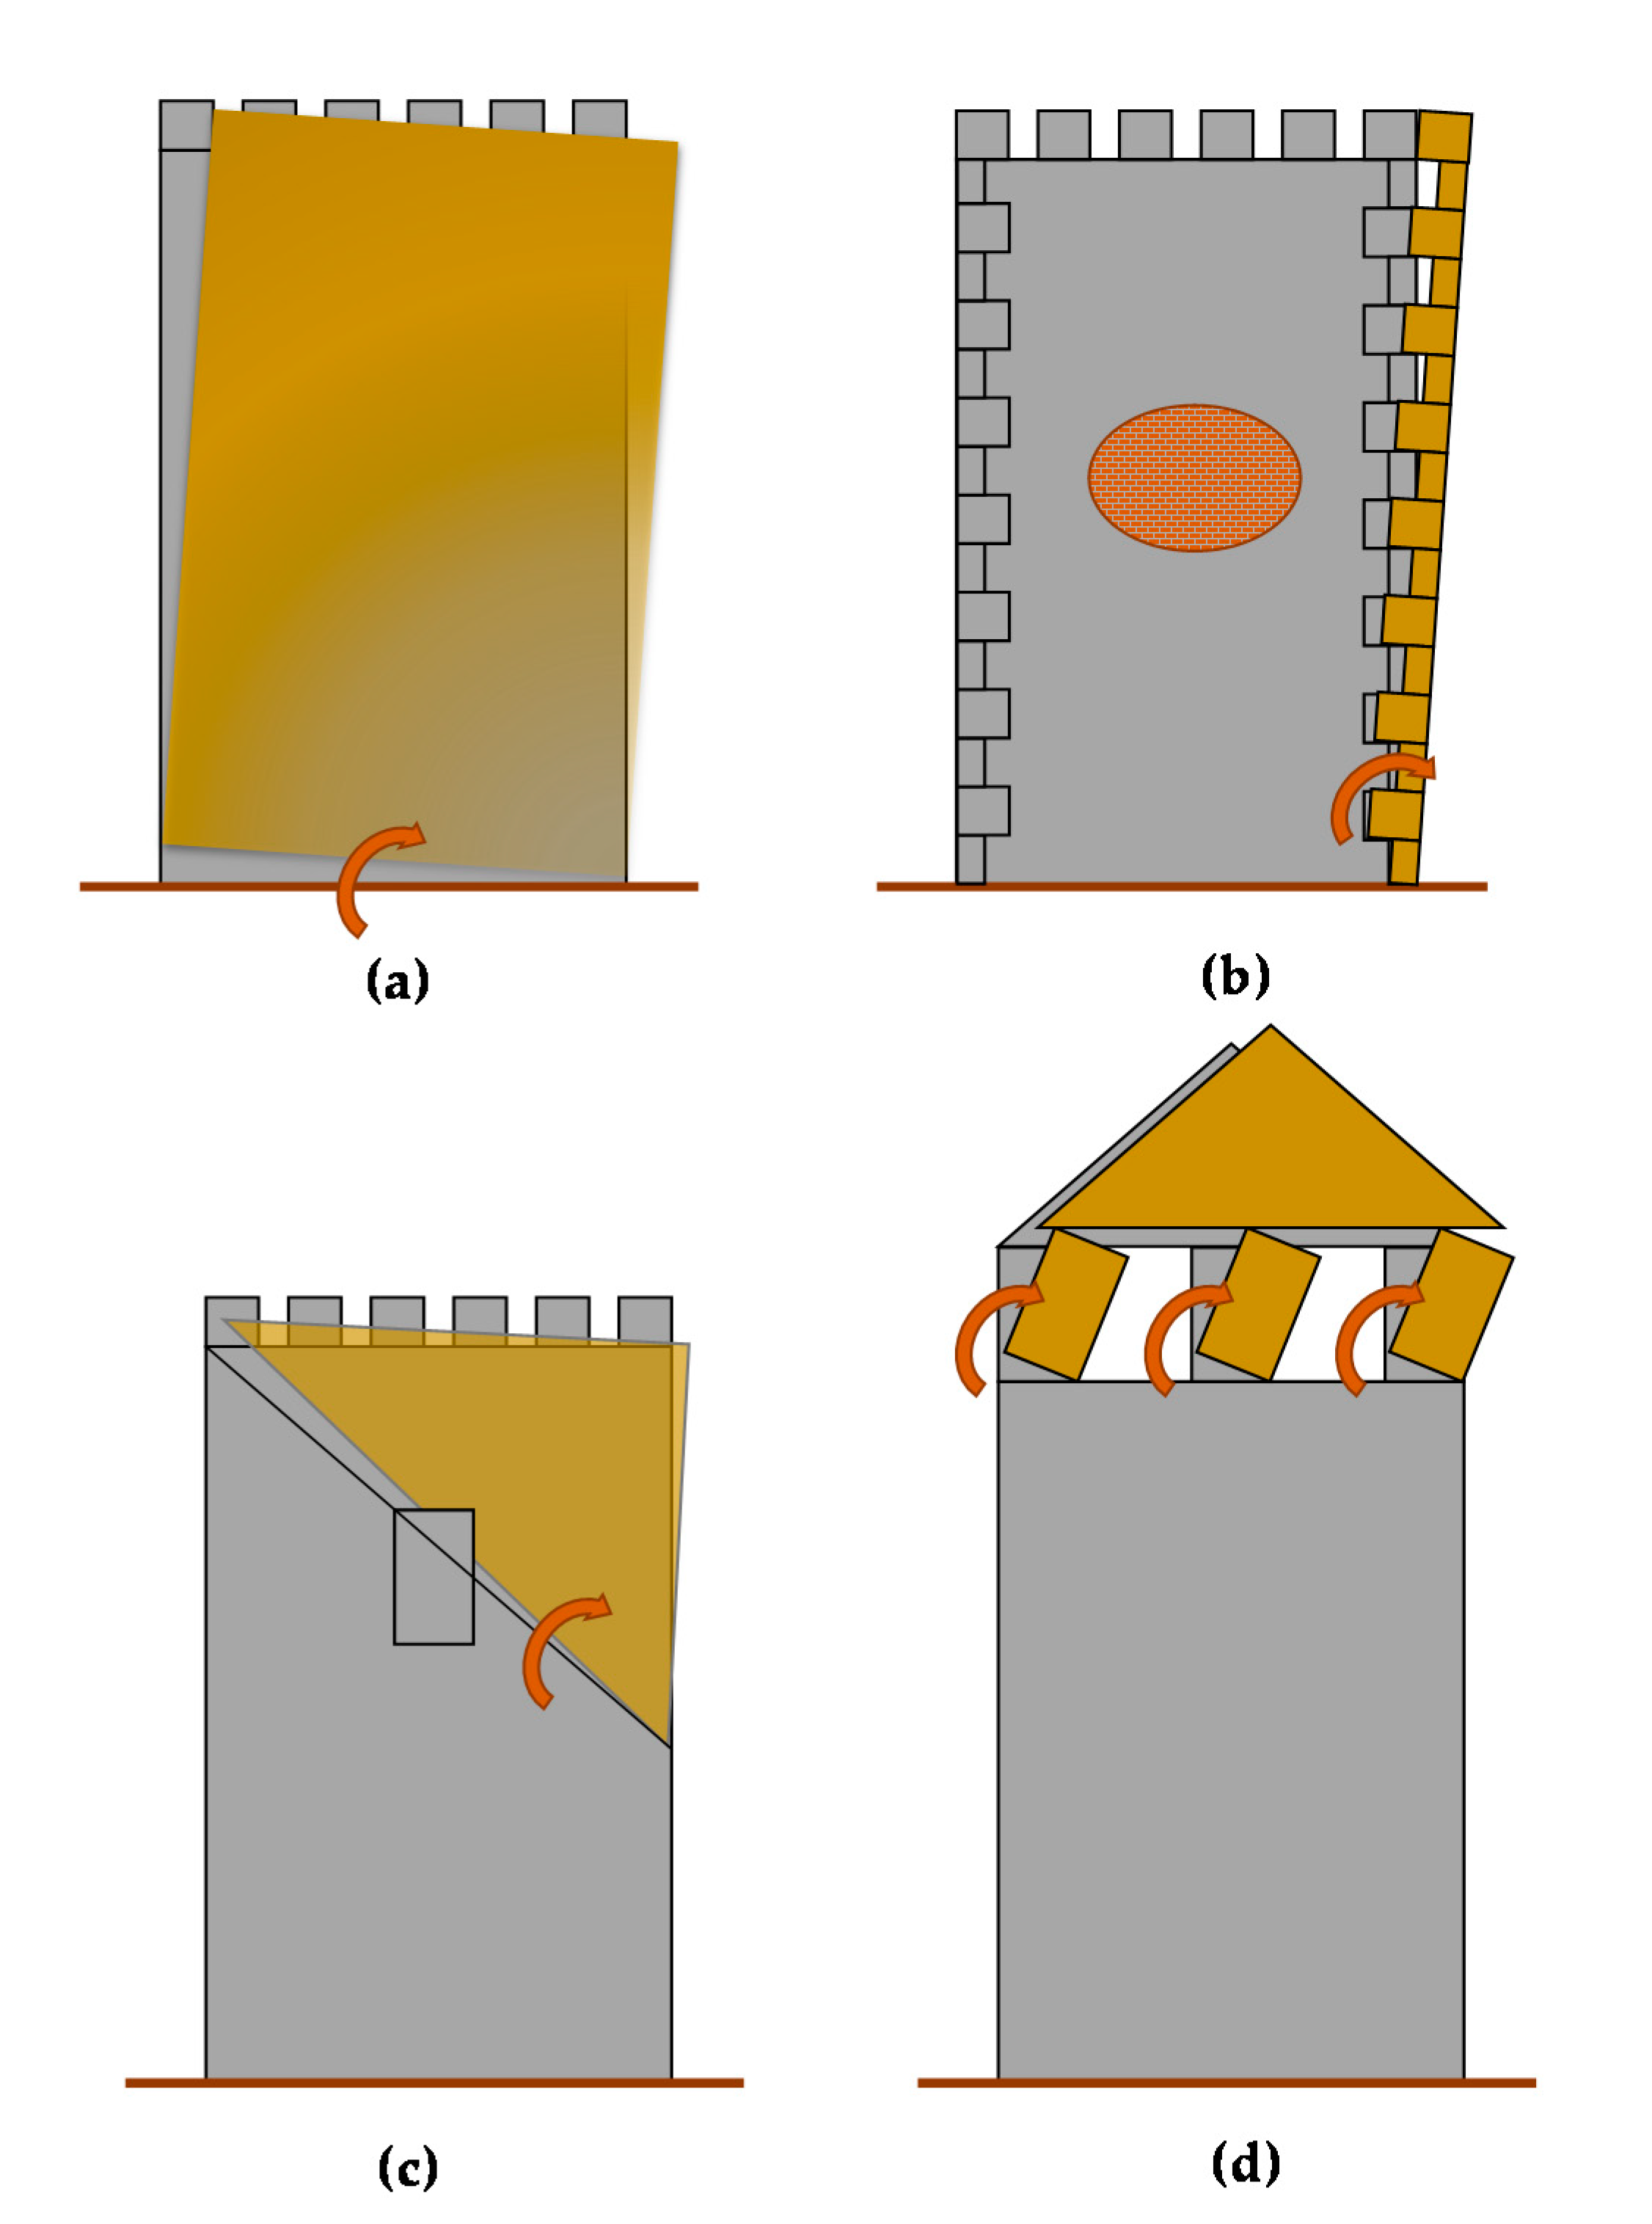
3. Failure Mechanisms
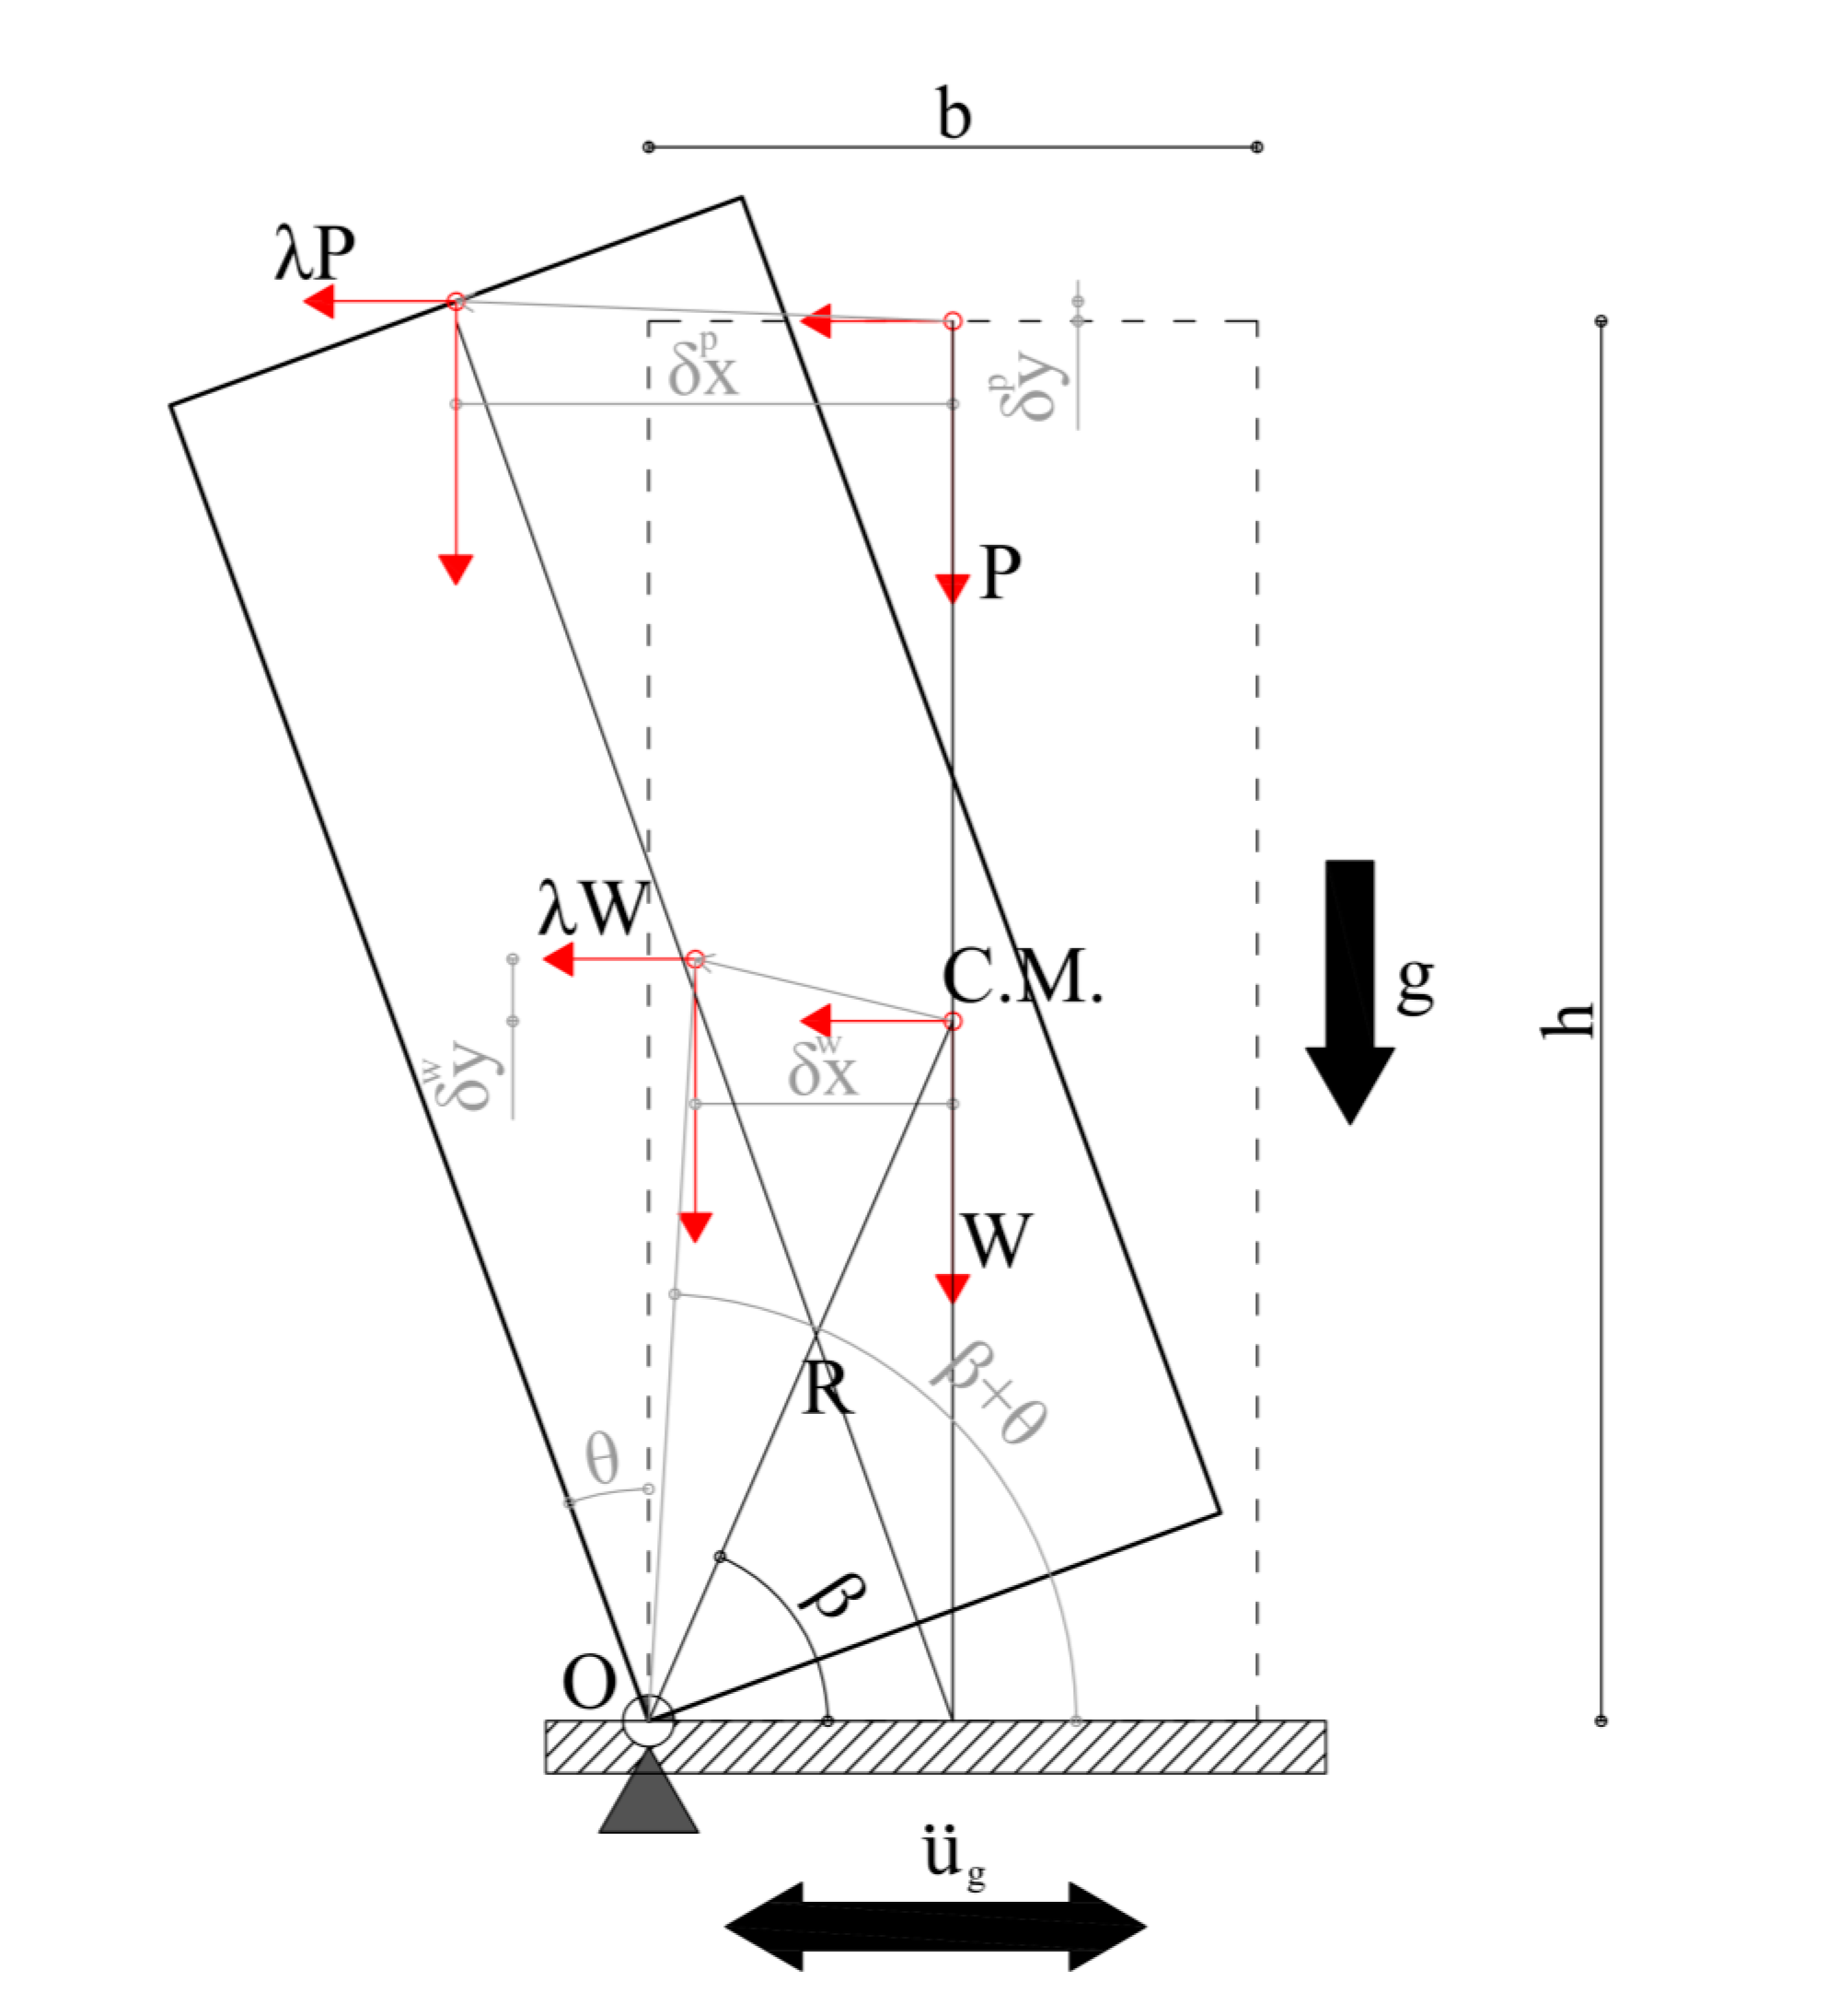
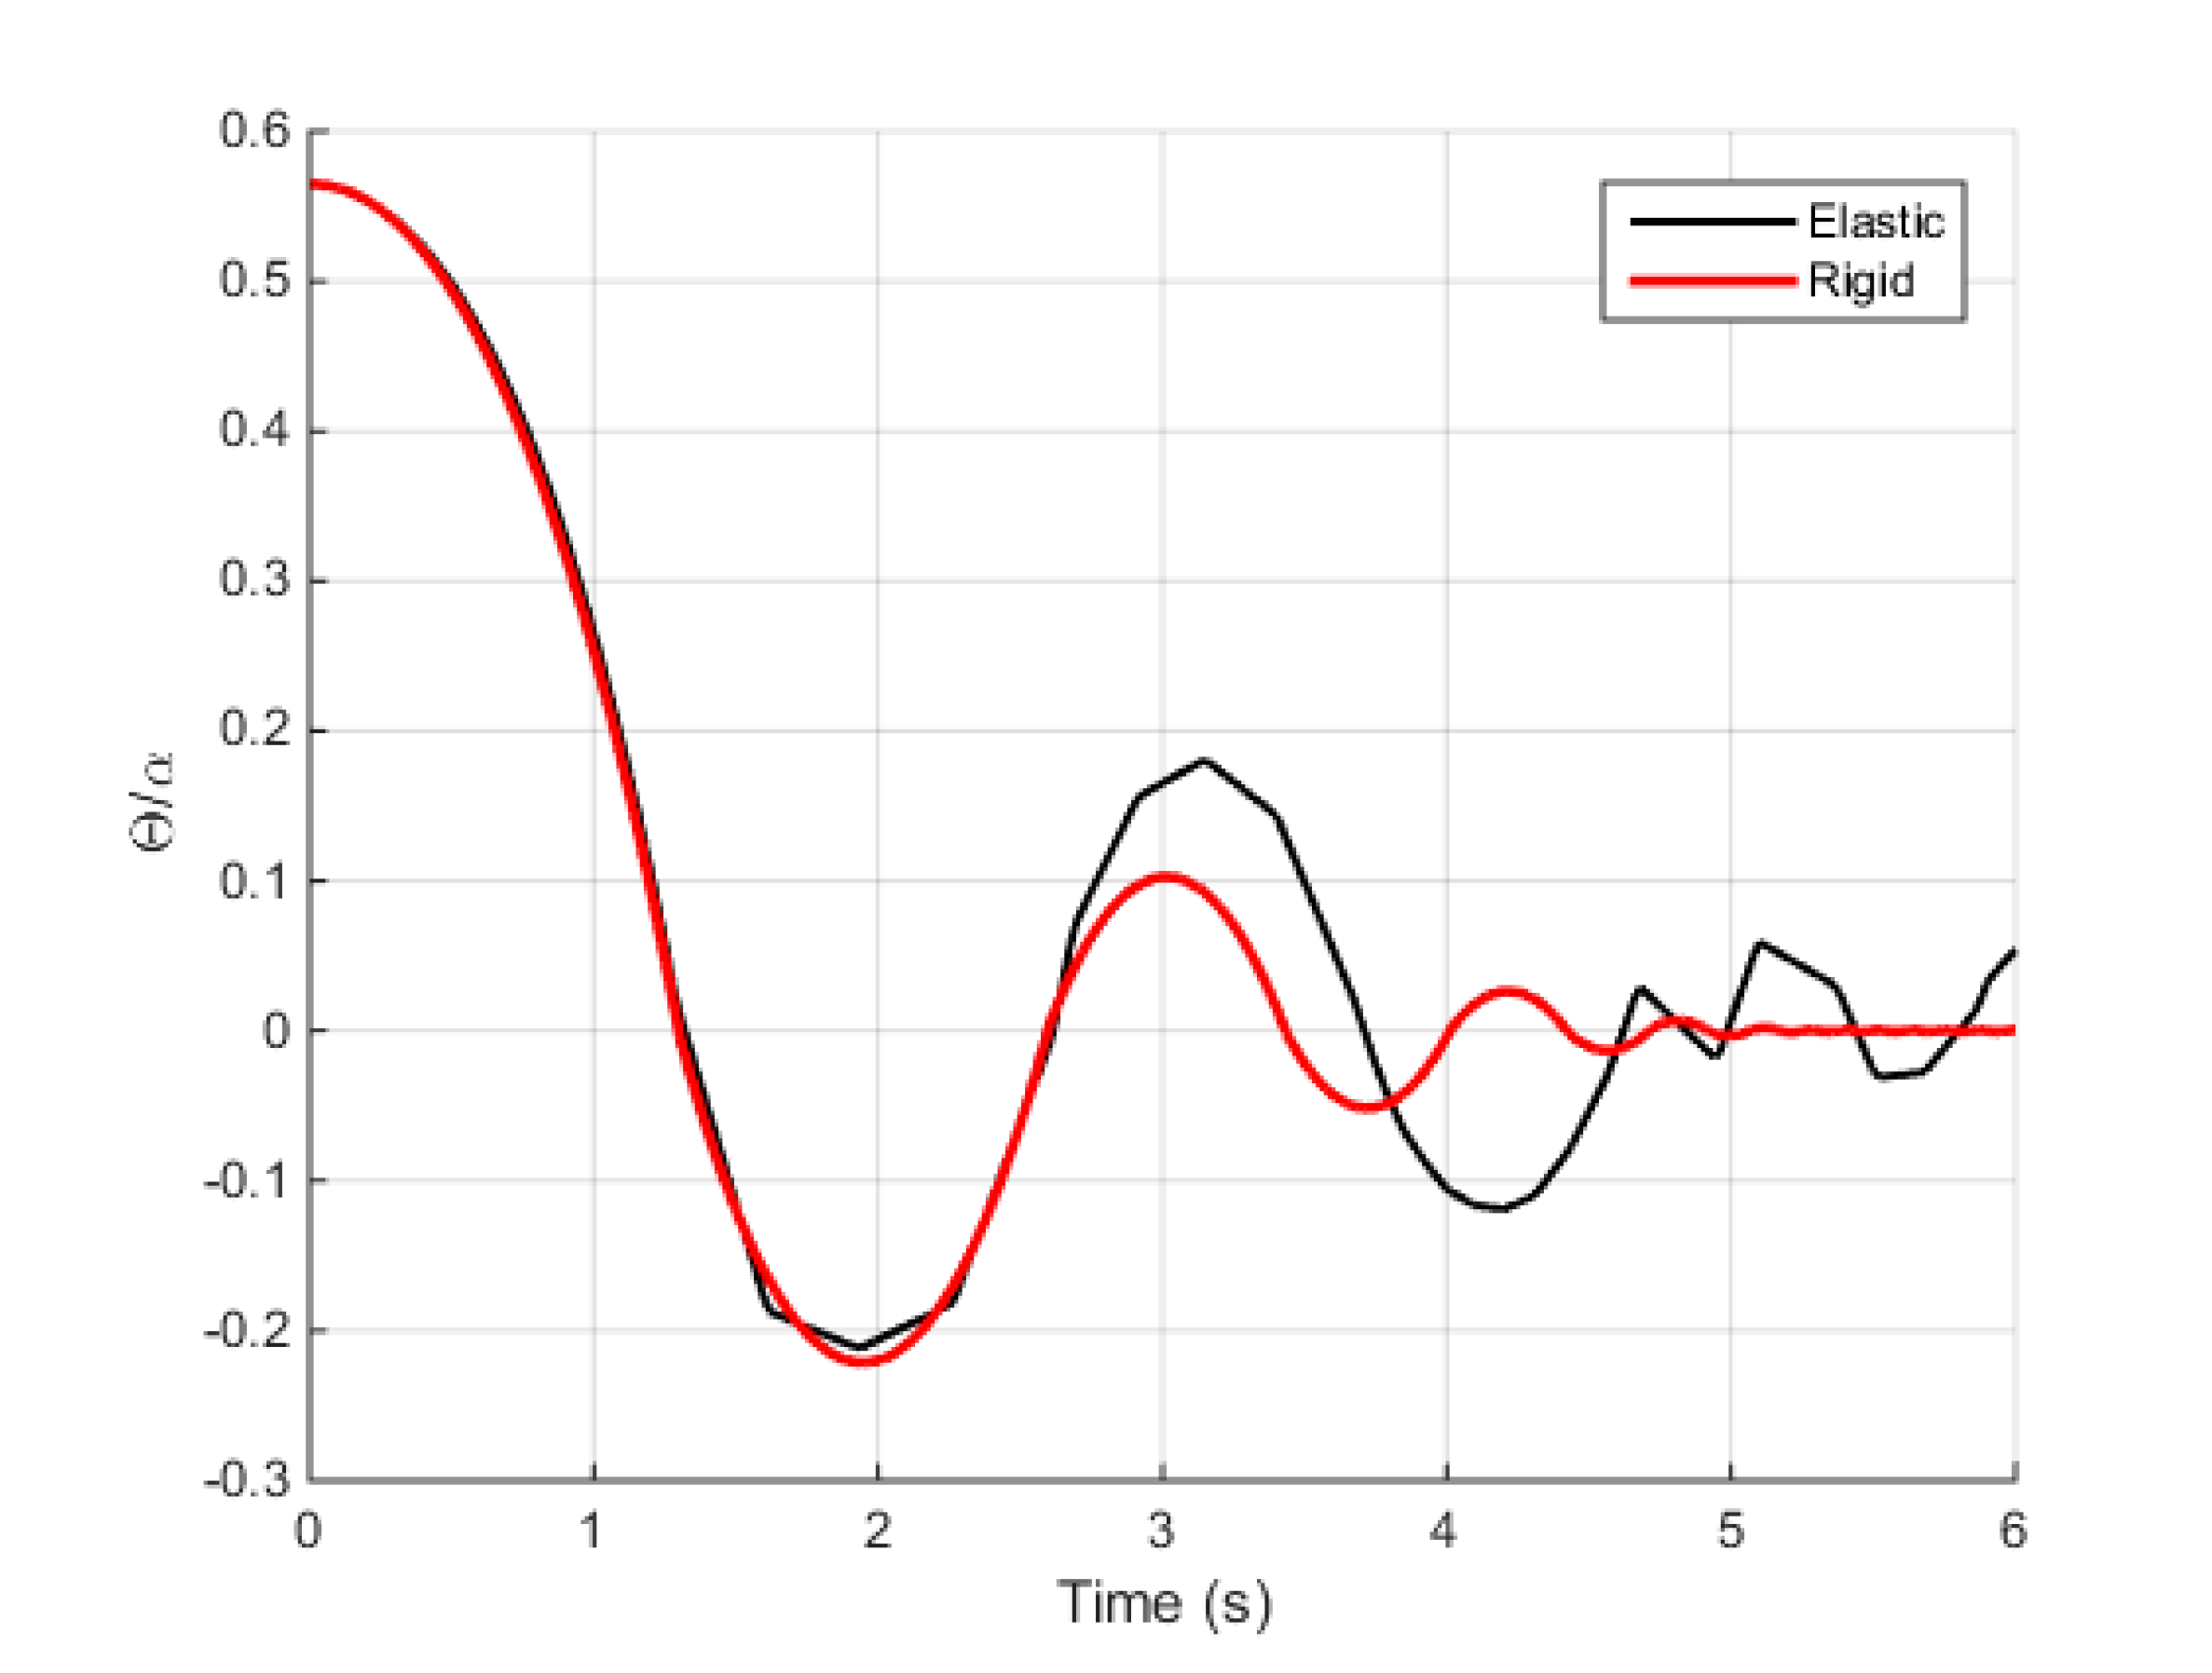
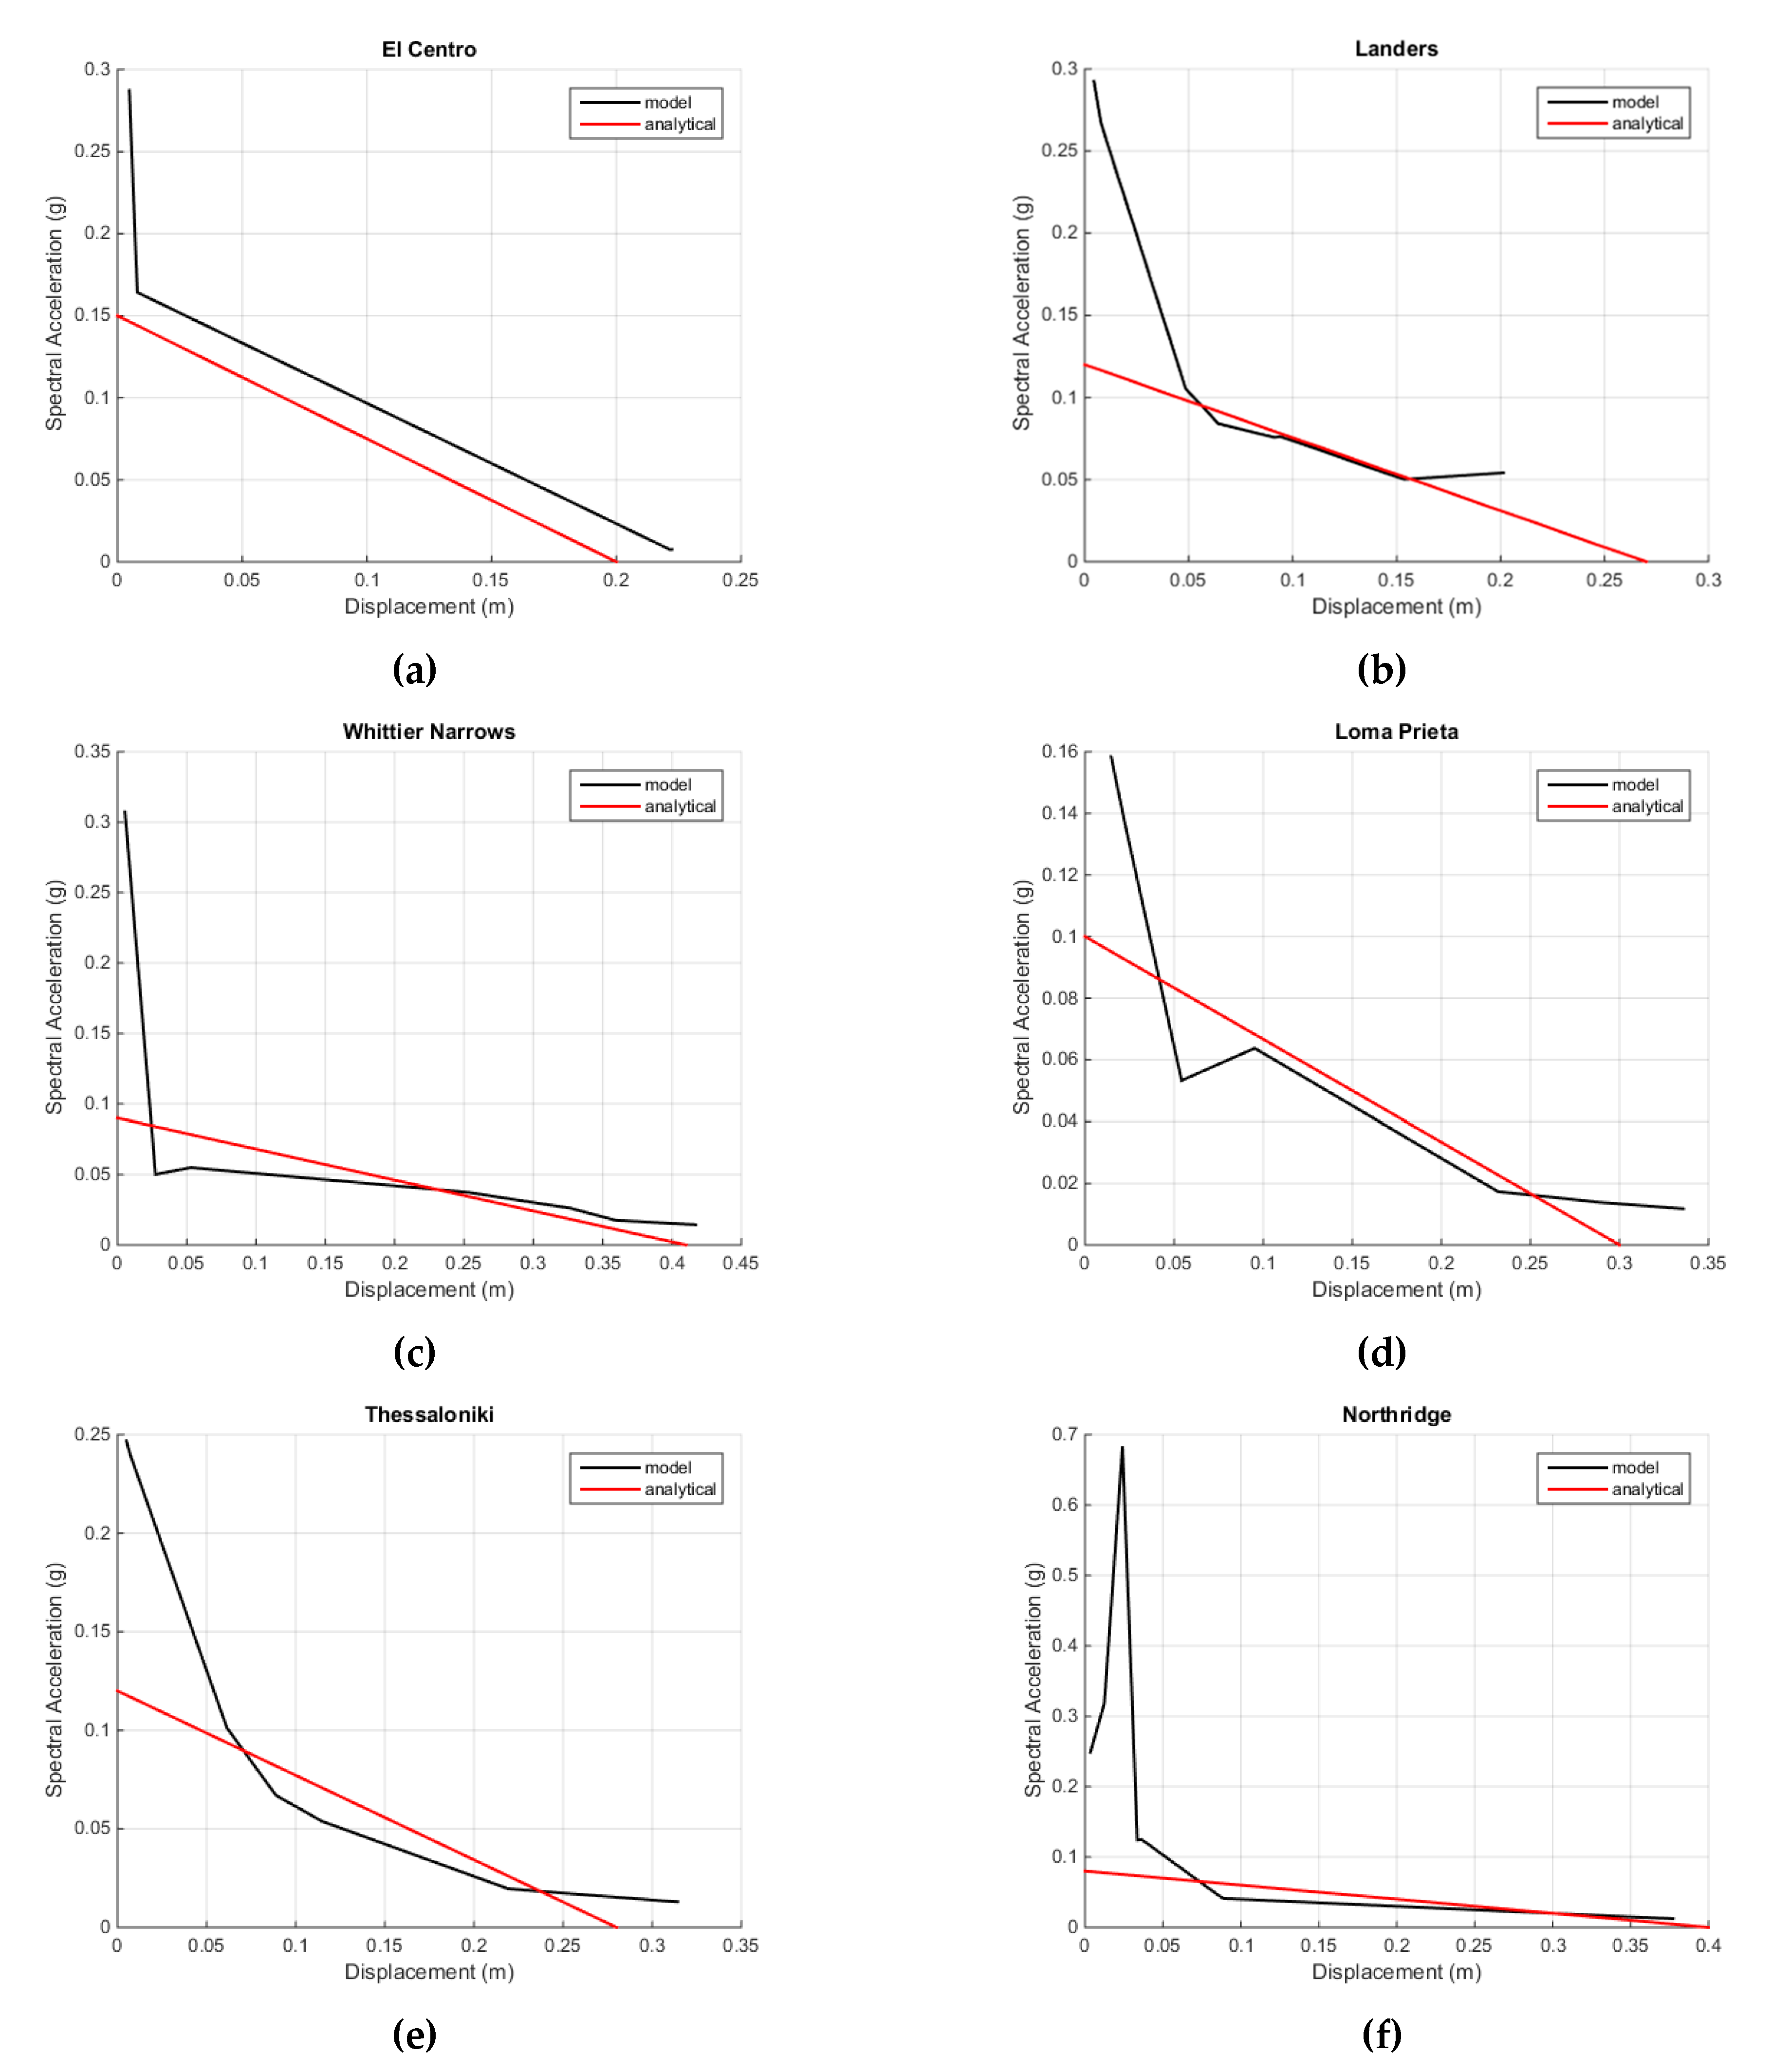
The critical collapse mechanism of a structure can be identified by limit analysis. The out-of-plane safety factor λ is estimated by applying the lower bound theorem for all the possible collapse mechanisms simulating the inertia effect with equivalent static forces (static approach) [8,33,35,36]. The critical ratio λ of the horizontal actions needed to overturn the tower will be the smallest for the studied collapse mechanisms and can be evaluated through the principle of virtual works, as the ratio of the work of the internal actions over the work of the inertia forces [32]. The latter can be expressed as the product of a load multiplier λ on the gravitational forces which results in the expression:
λ ξ = 1 = i W i , x j W j , y
In Equation (1), W i , x is the virtual work of the action i in the horizontal direction x and W j , y is the virtual work of the action j in the vertical direction y . The actions included in Equation (1) are either gravitational forces or frictional ones developed during the sliding of the parts. The gravitational forces take part in both the numerator and the denominator while the frictional forces are only included in the numerator (internal forces).
The possible local collapse mechanisms for these types of towers [32] are presented in Figure 2: (i) overturning of the tower due to a horizontal crack at the base of the structure (Figure 2a); (ii) separation of the walls along a vertical line from bottom to top (Figure 2b); (iii) diagonal cracking of masonry and overturning of the critical triangular part (Figure 2c); and (iv) overturning of the piers of the belfry and local dislocation (Figure 2d).
To compare the load multipliers λ of the various mechanisms an equivalent single-degree-of-freedom (SDOF) system [37] should be defined as each of the mechanisms involves a different mass. Using the properties of the SDOF system of each mechanism, the load multiplier k is converted into spectral acceleration. The equivalent mass involved in the considered mechanism is given by the following equation [38]:
M * = i = 1 N P i Δ x , i 2 g i = 1 N P i Δ x , i 2
where M * is the modal mass of the considered mechanism, P i are the local weights of the parts, and the modal shape components are Δ x , i = φ 1 , i , with φ 1 , i being the modal displacement normalised to 1. Assuming that the deformation of masonry is negligible compared with the displacement due to rotation, all points are tilting by the same angle θ (see Figure 3) and the horizontal projection of the displacements Δ x , i can be assumed linear along the height of the wall. The effective mass ratio is the ratio of the modal mass to the total one given by:
e * = g M * i = 1 N P i
The spectral acceleration at the base point of the equivalent SDOF system needed to initiate the rocking of the rigid body is given by the maximum value of coefficient λ normalized by the effective mass ratio according to the following expression:
a 0 * = λ e *
If the level of the base point of the collapse mechanism is not at the base of the tower, as in the case of belfries (Figure 2d), then the spectral acceleration capacity should be estimated considering the filtering effect of the substructure. The underlying structure acts as a filter of the base motion modifying the frequency characteristics of the base excitation given by the transfer function H T s , T 1 . A number of expressions have been proposed to estimate the floor response spectrum (FRS) given the base response spectrum and the dynamic characteristics of the structure (e.g., [39,40,41,42]).
A simplified expression of the transfer function H T s , T 1 related to the modal period of the rocking system Ts and the main system T1 to estimate the filtering effect of the underlying structure is given by the next expression [43]:
H = { T s < T 1 :   | ψ 1 ( Z ) | γ 1 ( T s / T 1 ) 2 [ ( 1 T s / T 1 ) 2 + [ 0.05 ( T s / T 1 ) / ( η ( ξ s ) η ( ξ 1 ) ) ] ] 1 / 2 T 1 < T s < 1.9 T 1 :   η ( ξ s ) η ( ξ 1 ) | ψ 1 ( Z ) | γ 1 ( T s / T 1 ) 2 [ ( 1 T s / T 1 ) 2 + [ 0.05 ( T s / T 1 ) ] ] 1 / 2 T s > 1.9 T 1 :   3.8 η ( ξ s ) η ( ξ 1 ) | ψ 1 ( Z ) | γ 1
In Equation (5), ψ 1 Z is the shape of the fundamental mode of vibration of the building in the direction considered, normalised with the displacement at the top of the building, and ξs and ξ1 are the modal dampings of the rocking and the main system, respectively. For purely rocking systems, the damping was estimated to equal 3% [38]. As here friction is present, the damping is assumed to be 5%, equal to that of typical masonry buildings [44] and, therefore, their ratio ξs/ ξ1 is equal to 1. A reasonable approximation of the fundamental mode of masonry in regular buildings is given by the ratio Z / h , in which h stands for the height of the structure measured and Z stands for the elevation of the centre of gravity of the mechanism. In Equation (5), γ 1 is the corresponding modal participation factor which depends on the number of internal floors n [45] as γ 1 = 3 n / 2 n + 1 . The results of the analysis are presented in Section 6 with those from FE simulations.

4. Rocking Response

In the previous section the identification of the collapse mechanism was achieved by limit analysis. Once this is defined, the dynamic response to a ground displacement time-history should be estimated. If the inclined rigid block of Figure 3 with height h and thickness b is let free to oscillate, its response can be described from Equation (6) [46], assuming that it will not slide:
I 0 d 2 θ d t 2 ±   W R sin α θ = 0 ,
where θ is the angle of inclination, W its weight, R the distance of the rotation point from the centre of mass, I0 the polar moment of inertia, and the tangent of α is the ratio b/h. The weight from the upper structure is P while the horizontal forces are assumed inertial forces and thus, connected to W and P by the coefficient λ. The response can be given in terms of displacements δx and δy, or in terms of rotation θ. Angle β and radius R are defined from the points of rotation and the centre of mass as shown in Figure 3.
Typically, the rotation that a URM block can undergo does not exceed 20°. In such a case, Equation (6) can be simplified to:
d 2 θ d t 2 p 2 θ + p 2 α = 0 ,
where p = (WR/I0)1/2. The solution of this 2nd order non-homogeneous differential equation is given by:
θ = α α θ o   cosh p t .
where θ0 is the initial rotation. The error introduced by approximating Equation (6) through Equation (7) and its exact solution given by Equation (8) is small (about 2%). By assuming θ = 0, i.e., passing through the equilibrium point, then the time will be t = T/4 where T is the period of the oscillation as a total period would be the time required to return to the initial inclined position. The period vs. the ratio θ/α is plotted in Figure 4 where it is seen that the rocking response varies with θ/α—showing a dependence on the geometric properties (α = b/h)—as well as with θ.
The solution provided by Equation (8), however, does not account for either the elastic deformation of the block or for the possibility of sliding during the oscillation. A more precise estimation is carried out using interface elements in a finite element (FE) analysis [47]. In Figure 5, the sequential positions are shown and a permanent sliding appears at the end of the first period, assuming a friction coefficient of 0.5 at the interface. This friction coefficient is slightly higher than the 0.4 value proposed by EC6, e.g., in [48,49]. It also shown that the impact of its passing through the equilibrium position results in loss of energy, which leads to a gradual decrease in the oscillation amplitude [38].
The comparison of the analytical solution of Equation (8) and the numerical one results in Figure 6: the elastic body continues to oscillate further as the bounding impact leads to a lower loss of energy. The difference in the response of the analytical and the numerical model is due to two factors: (i) the numerical model considers an elastic body, and (ii) the coefficient of restitution estimated by Housner [46] overestimates the energy loss due to bouncing [50,51,52].

5. Variability Analysis

5.1. Variations in Material Properties

A parametric analysis was carried out varying the material properties of masonry used in Section 2.2. In Table 2, various combinations of masonry units and mortars with varying mechanical properties are taken into account, resulting in different masonry elastic effective properties. This range was based on the relevant literature, e.g., [53,54,55,56,57,58,59,60]. The characteristic strength of masonry fk is evaluated applying the Eurocode 6 empirical formula [44] and using the coefficients suggested by [61] for units from stone masonry:
f k = 0.2 f b 0.7 f m 0.3
E = 500 f k
Introducing the material properties of Table 2 (mortar joint fm and units fk strengths), a parametric analysis was conducted regarding a generic tower whose model is shown in Figure 7a. The tower was assumed to be founded on rocky soil and its footprint is a square 4.5 × 4.5 m2 while its height is 27.5 m. The tower was finely discretised in Abaqus [47] with square plane elements 0.3 × 0.3 m2 fixed at the base. The material properties of masonry are assumed to be linear; the interaction between the cracked parts at the belfry is ruled by a friction coefficient equal to 0.5. The collapse mechanism is shown in Figure 7b. The influence of the material properties is illustrated in Figure 8 in terms of maximum horizontal displacement at the control point (top) vs. the homogenised (effective) elastic modulus: for an increase 50% in the elastic modulus the maximum top displacement is only changed by approximately 25%.

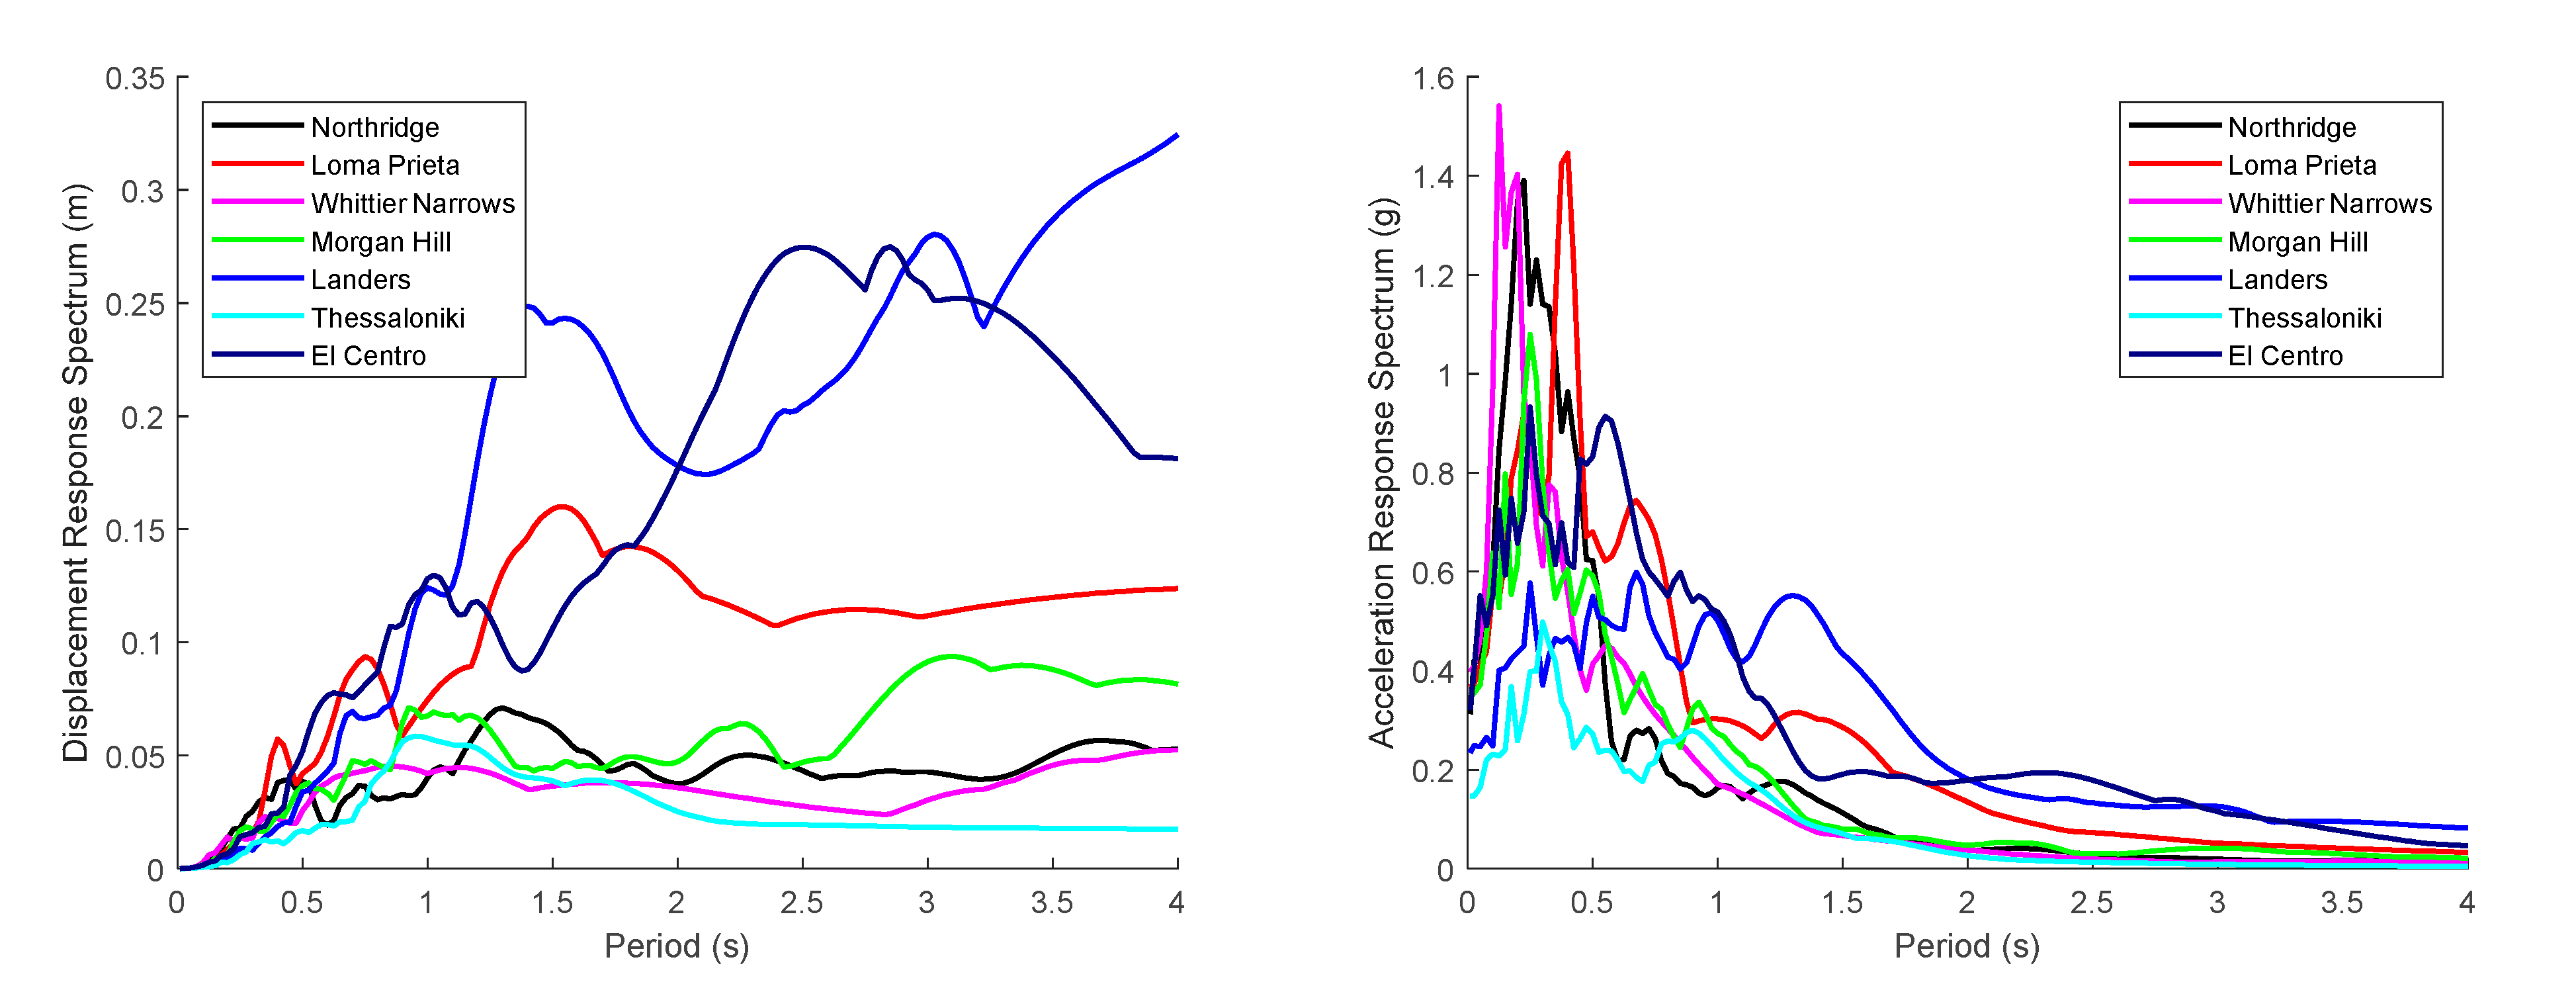
5.2. Variations in Seismic Excitation

A variation in the characteristics of the seismic shaking can appear due to an activation of different seismic faults. To this end, eight different seismic recordings and earthquake spectra were assumed. The displacement spectra of the earthquakes are presented in Figure 9. The set of the considered earthquakes covers a wide area of frequencies with a fundamental period of as little as 0.125 s, for the Whittier Narrows shaking, to 0.675 s for the Landers recording. Their original PGAs (peak ground accelerations) also vary from 0.14 g for the Thessaloniki recording to 0.40 g for the Northridge one.

6. Seismic Fragility of Towers
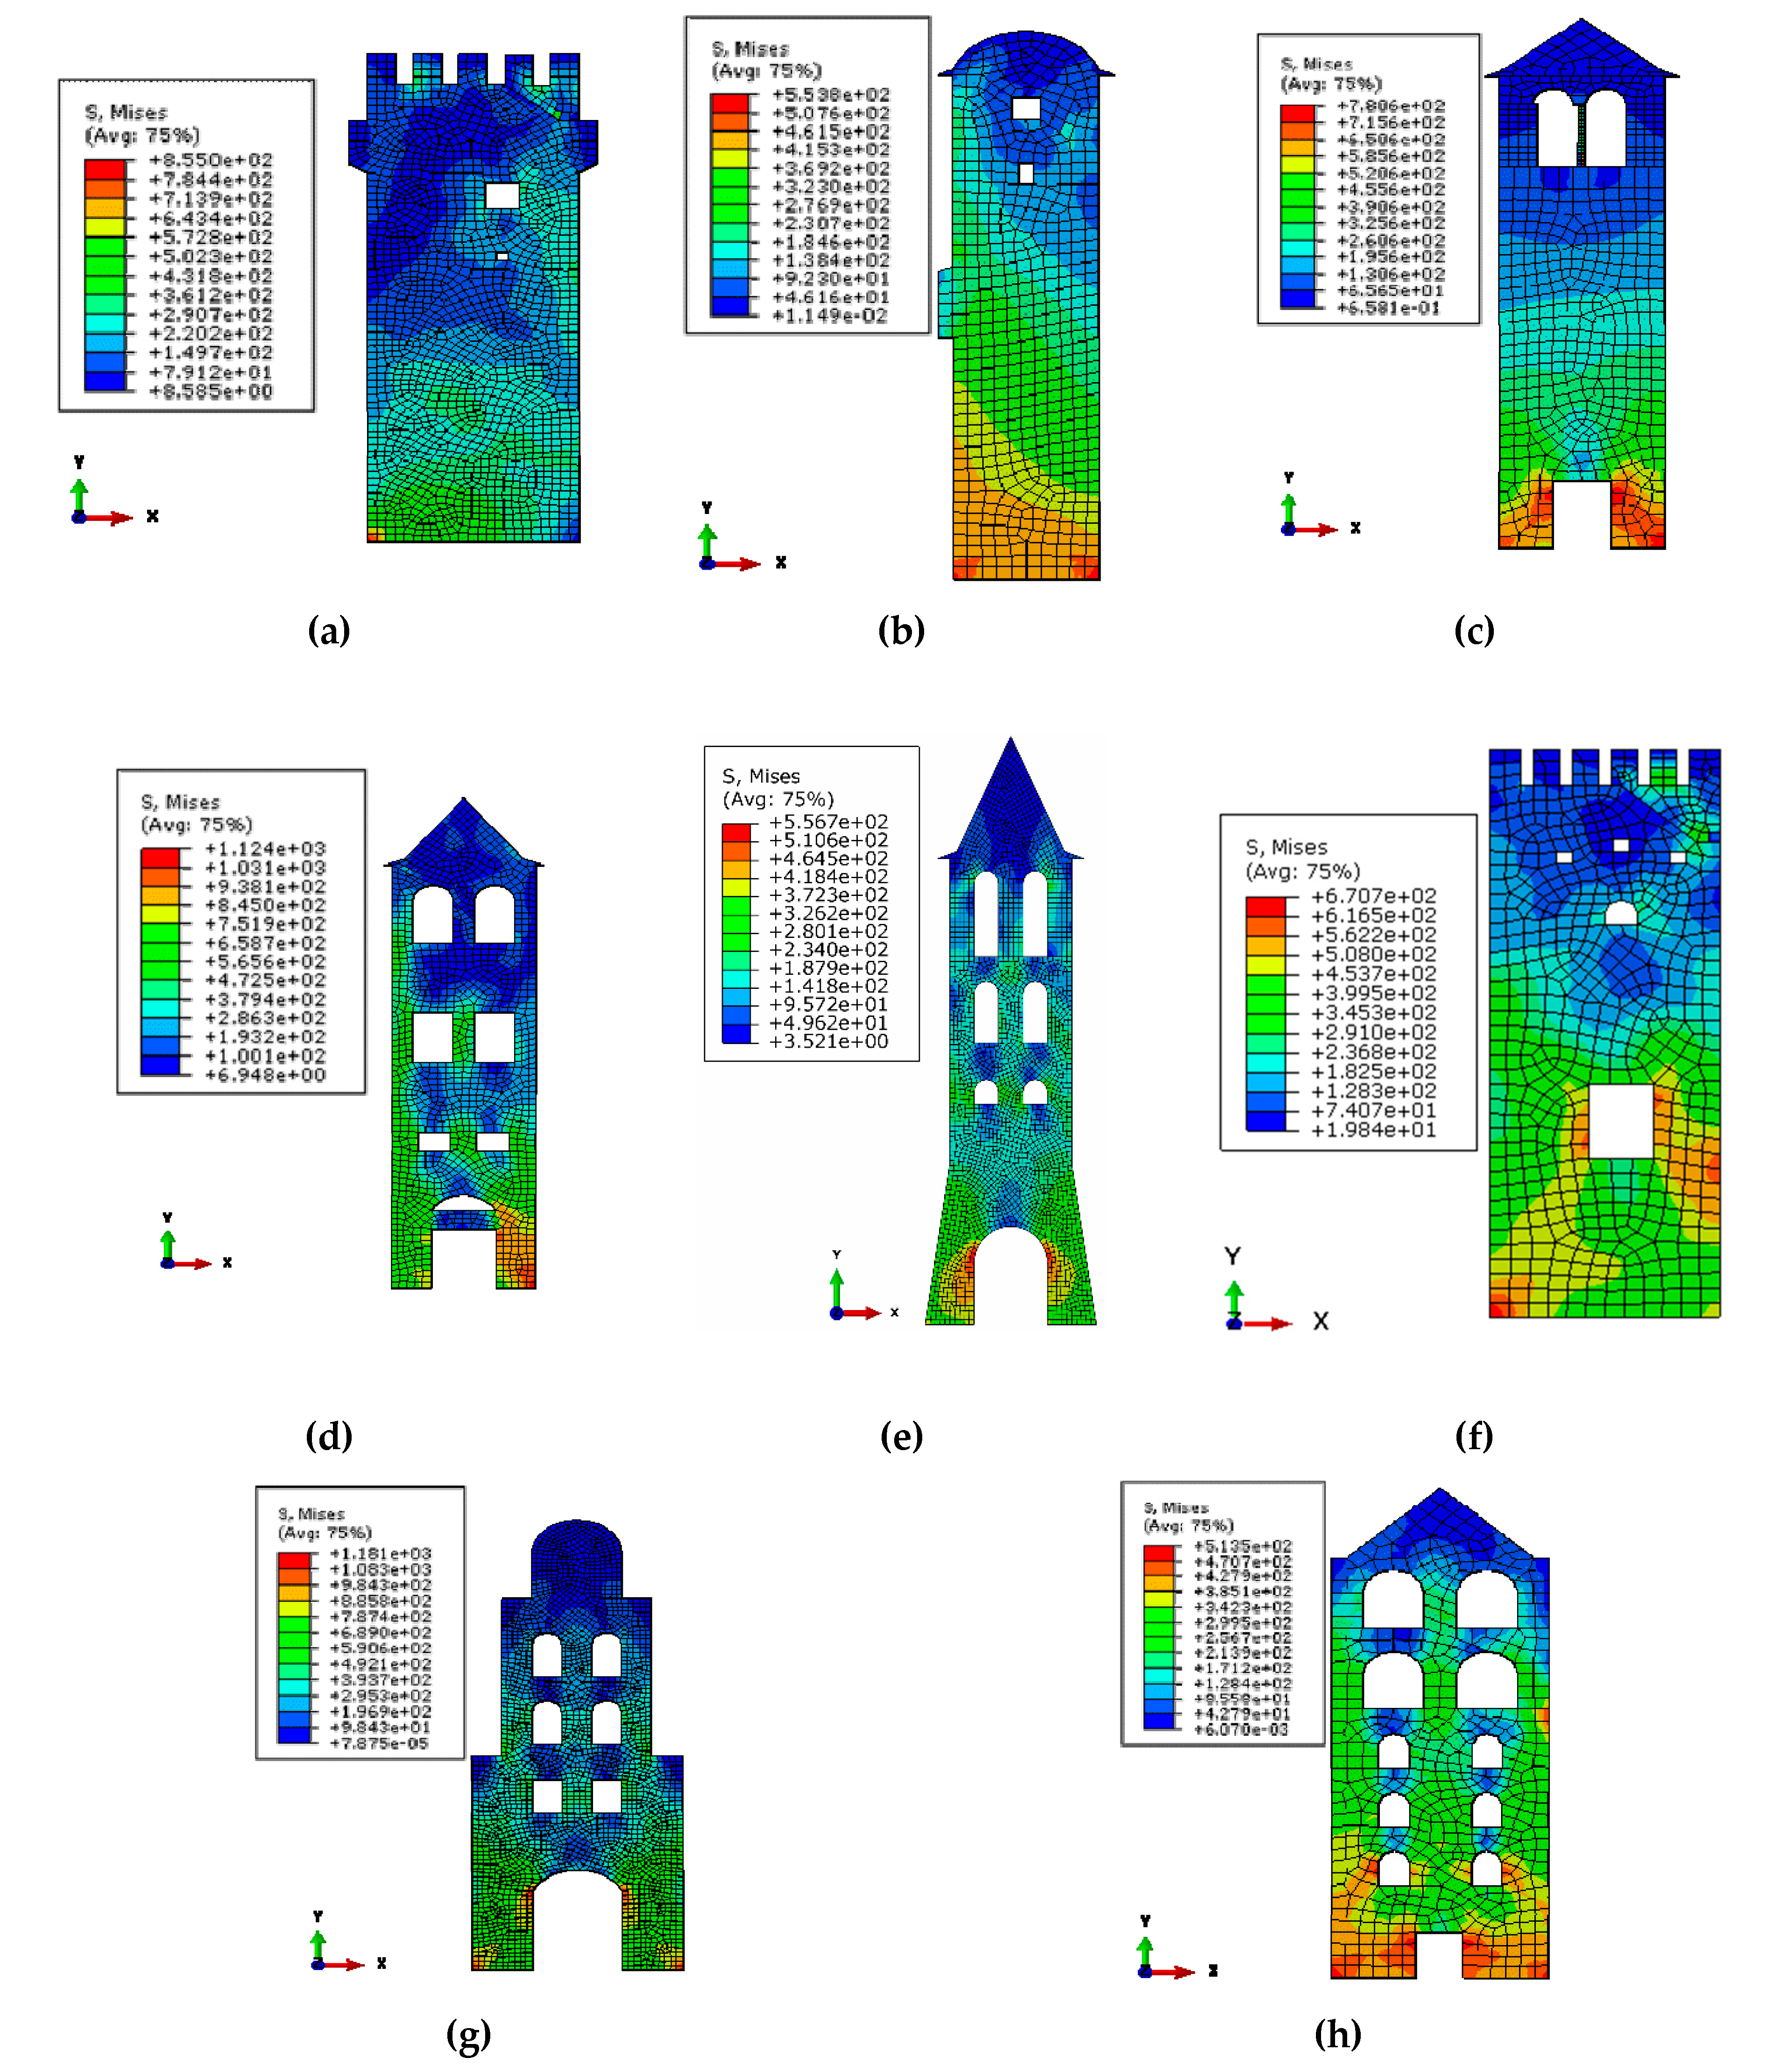
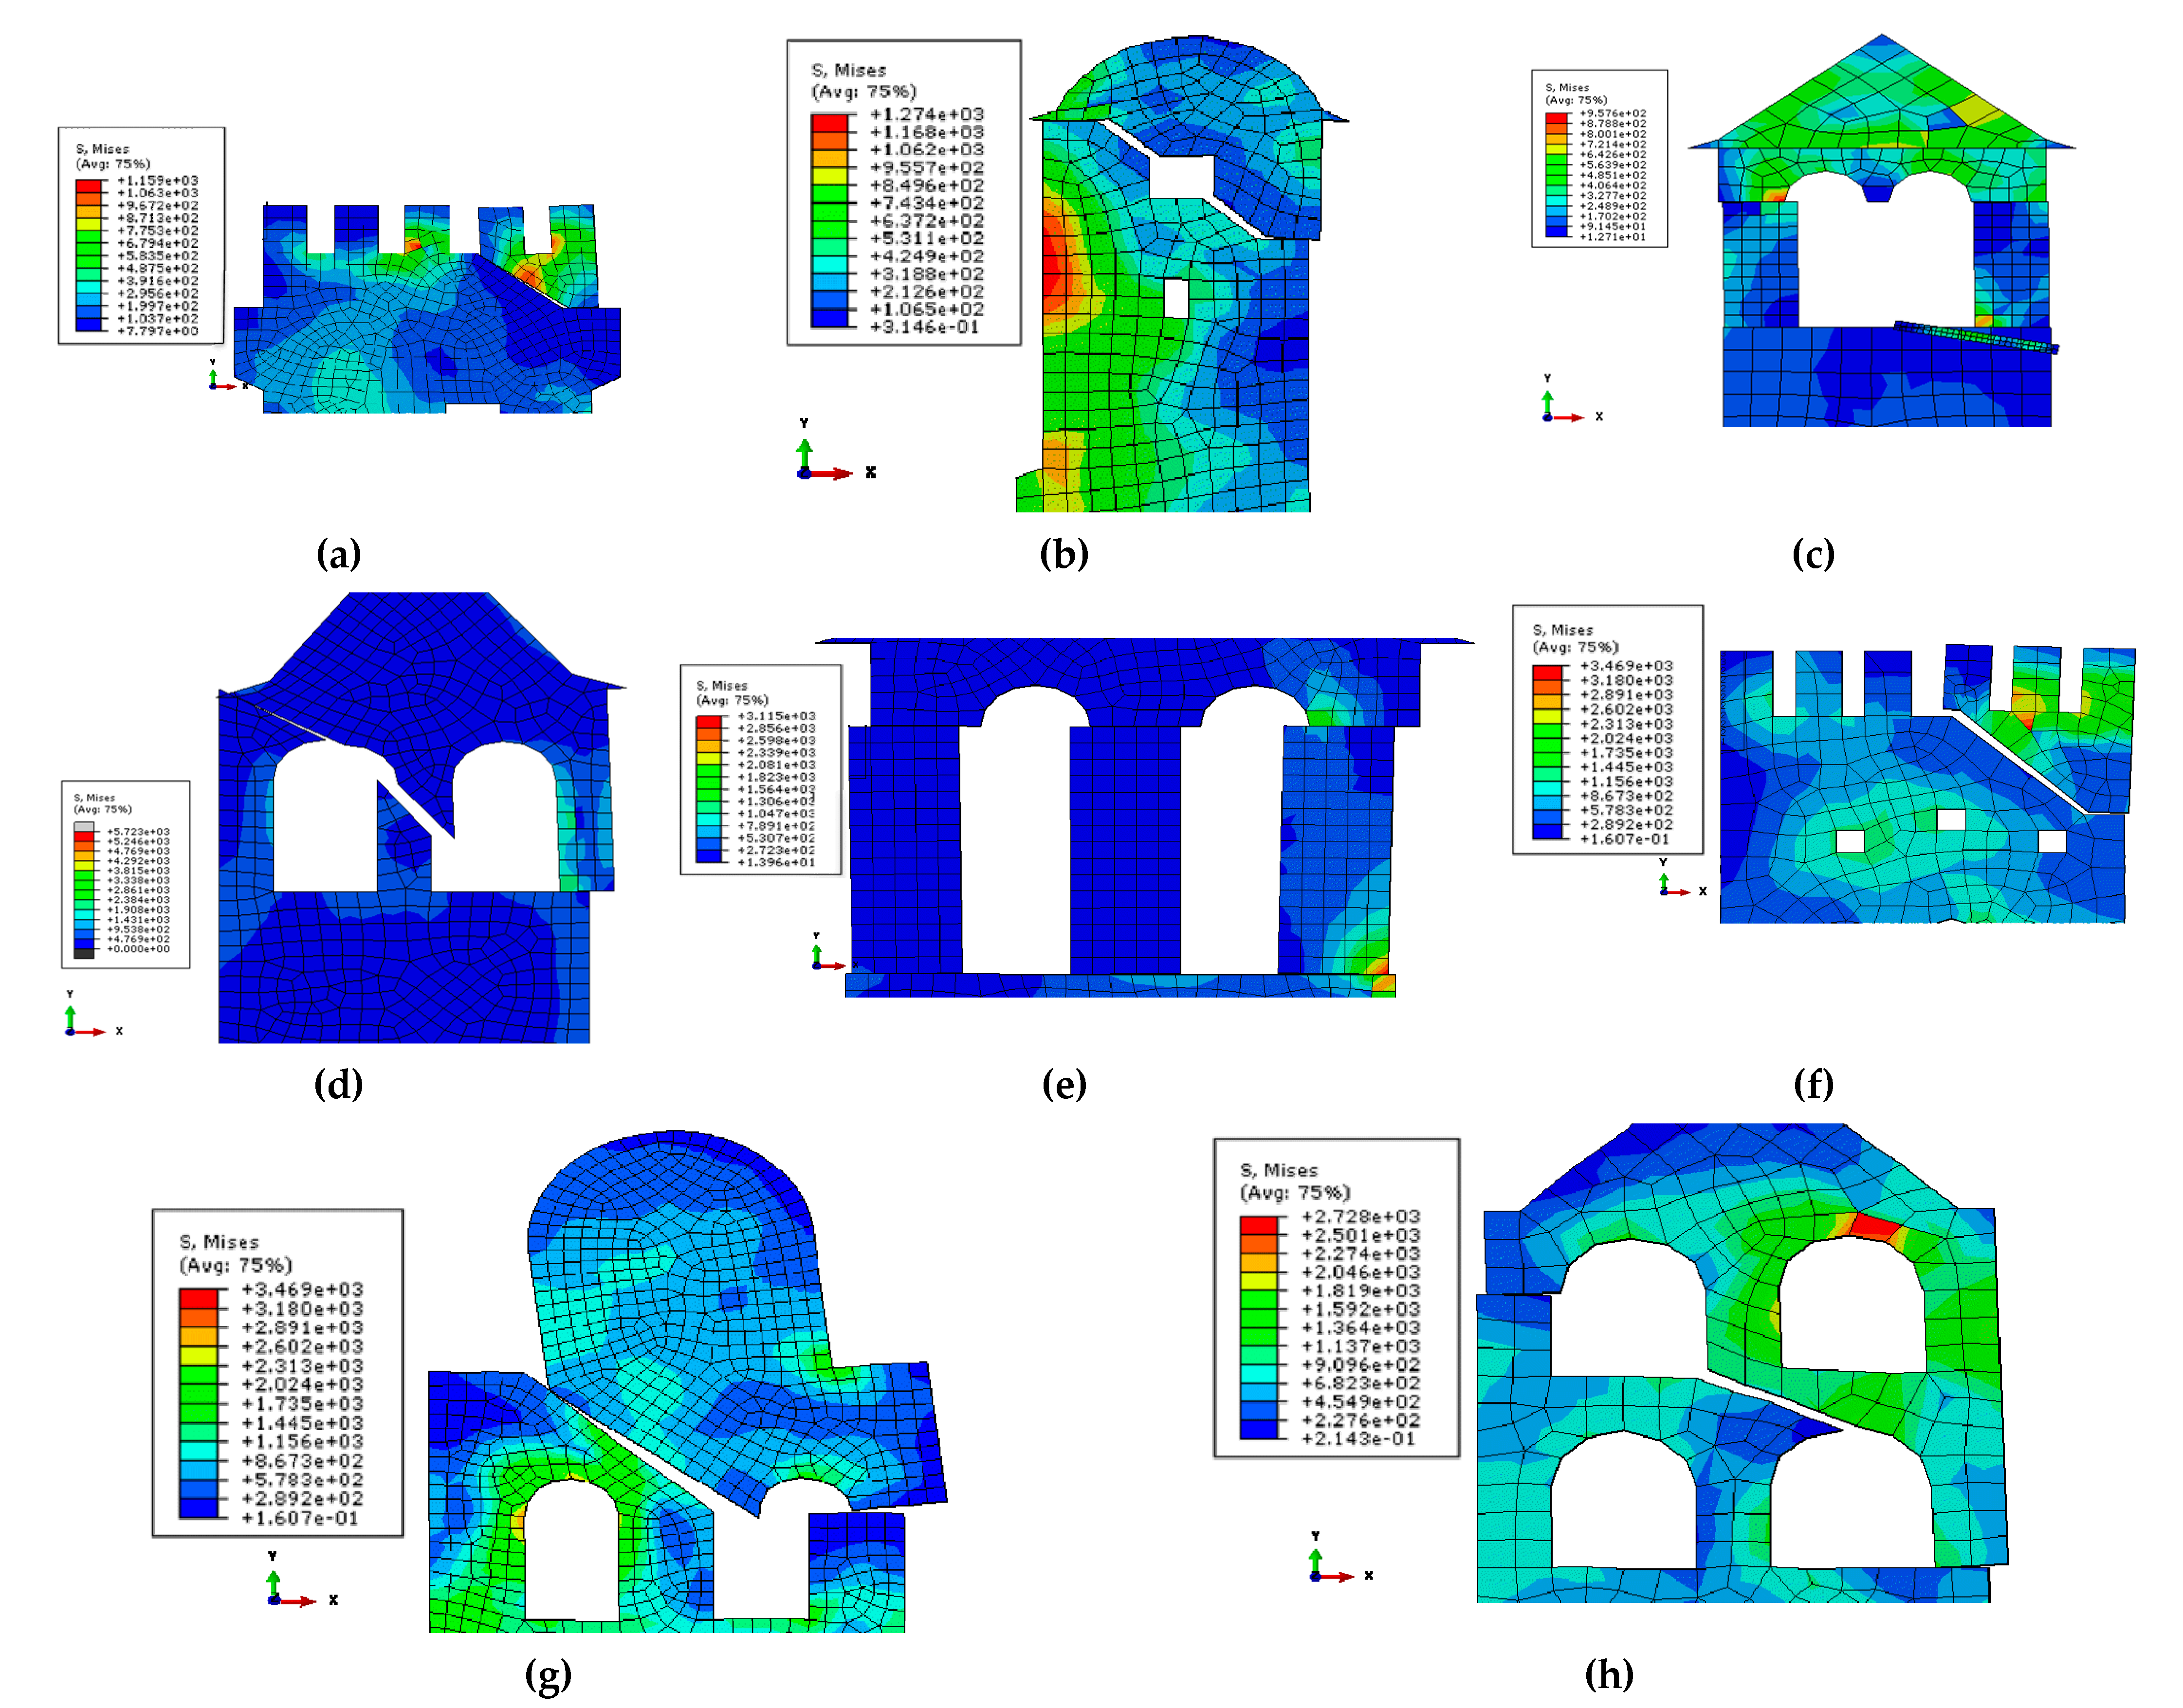
6.1. FE Models

Fragility analysis comes at a high cost. To maintain this cost at an affordable level, 2D models are developed using plane elements for masonry. The façade with the most critical mechanism (Figure 10b,f) or the one with the highest percentage of openings (Figure 10a,c,d,e,g,h) was simulated. As previously mentioned, the main focus is the rocking response due to the presence of cracks. The simulation of the behaviour of towers considers cracks as predefined interfaces following the classical Mohr–Coulomb friction law. These cracks were defined from the limit analysis presented in Section 3. Obviously, these interfaces can open, rotate, and slide. The material laws assumed for masonry are purely elastic as masonry deformation with respect to the opening of cracks is very small. In order to achieve mesh-size independence of the results, a sensitivity analysis was carried out leading to a discretisation of each tower with approximately 2000 elements. The discretisation and the stress fields for gravitational loads for the towers are shown in Figure 10.

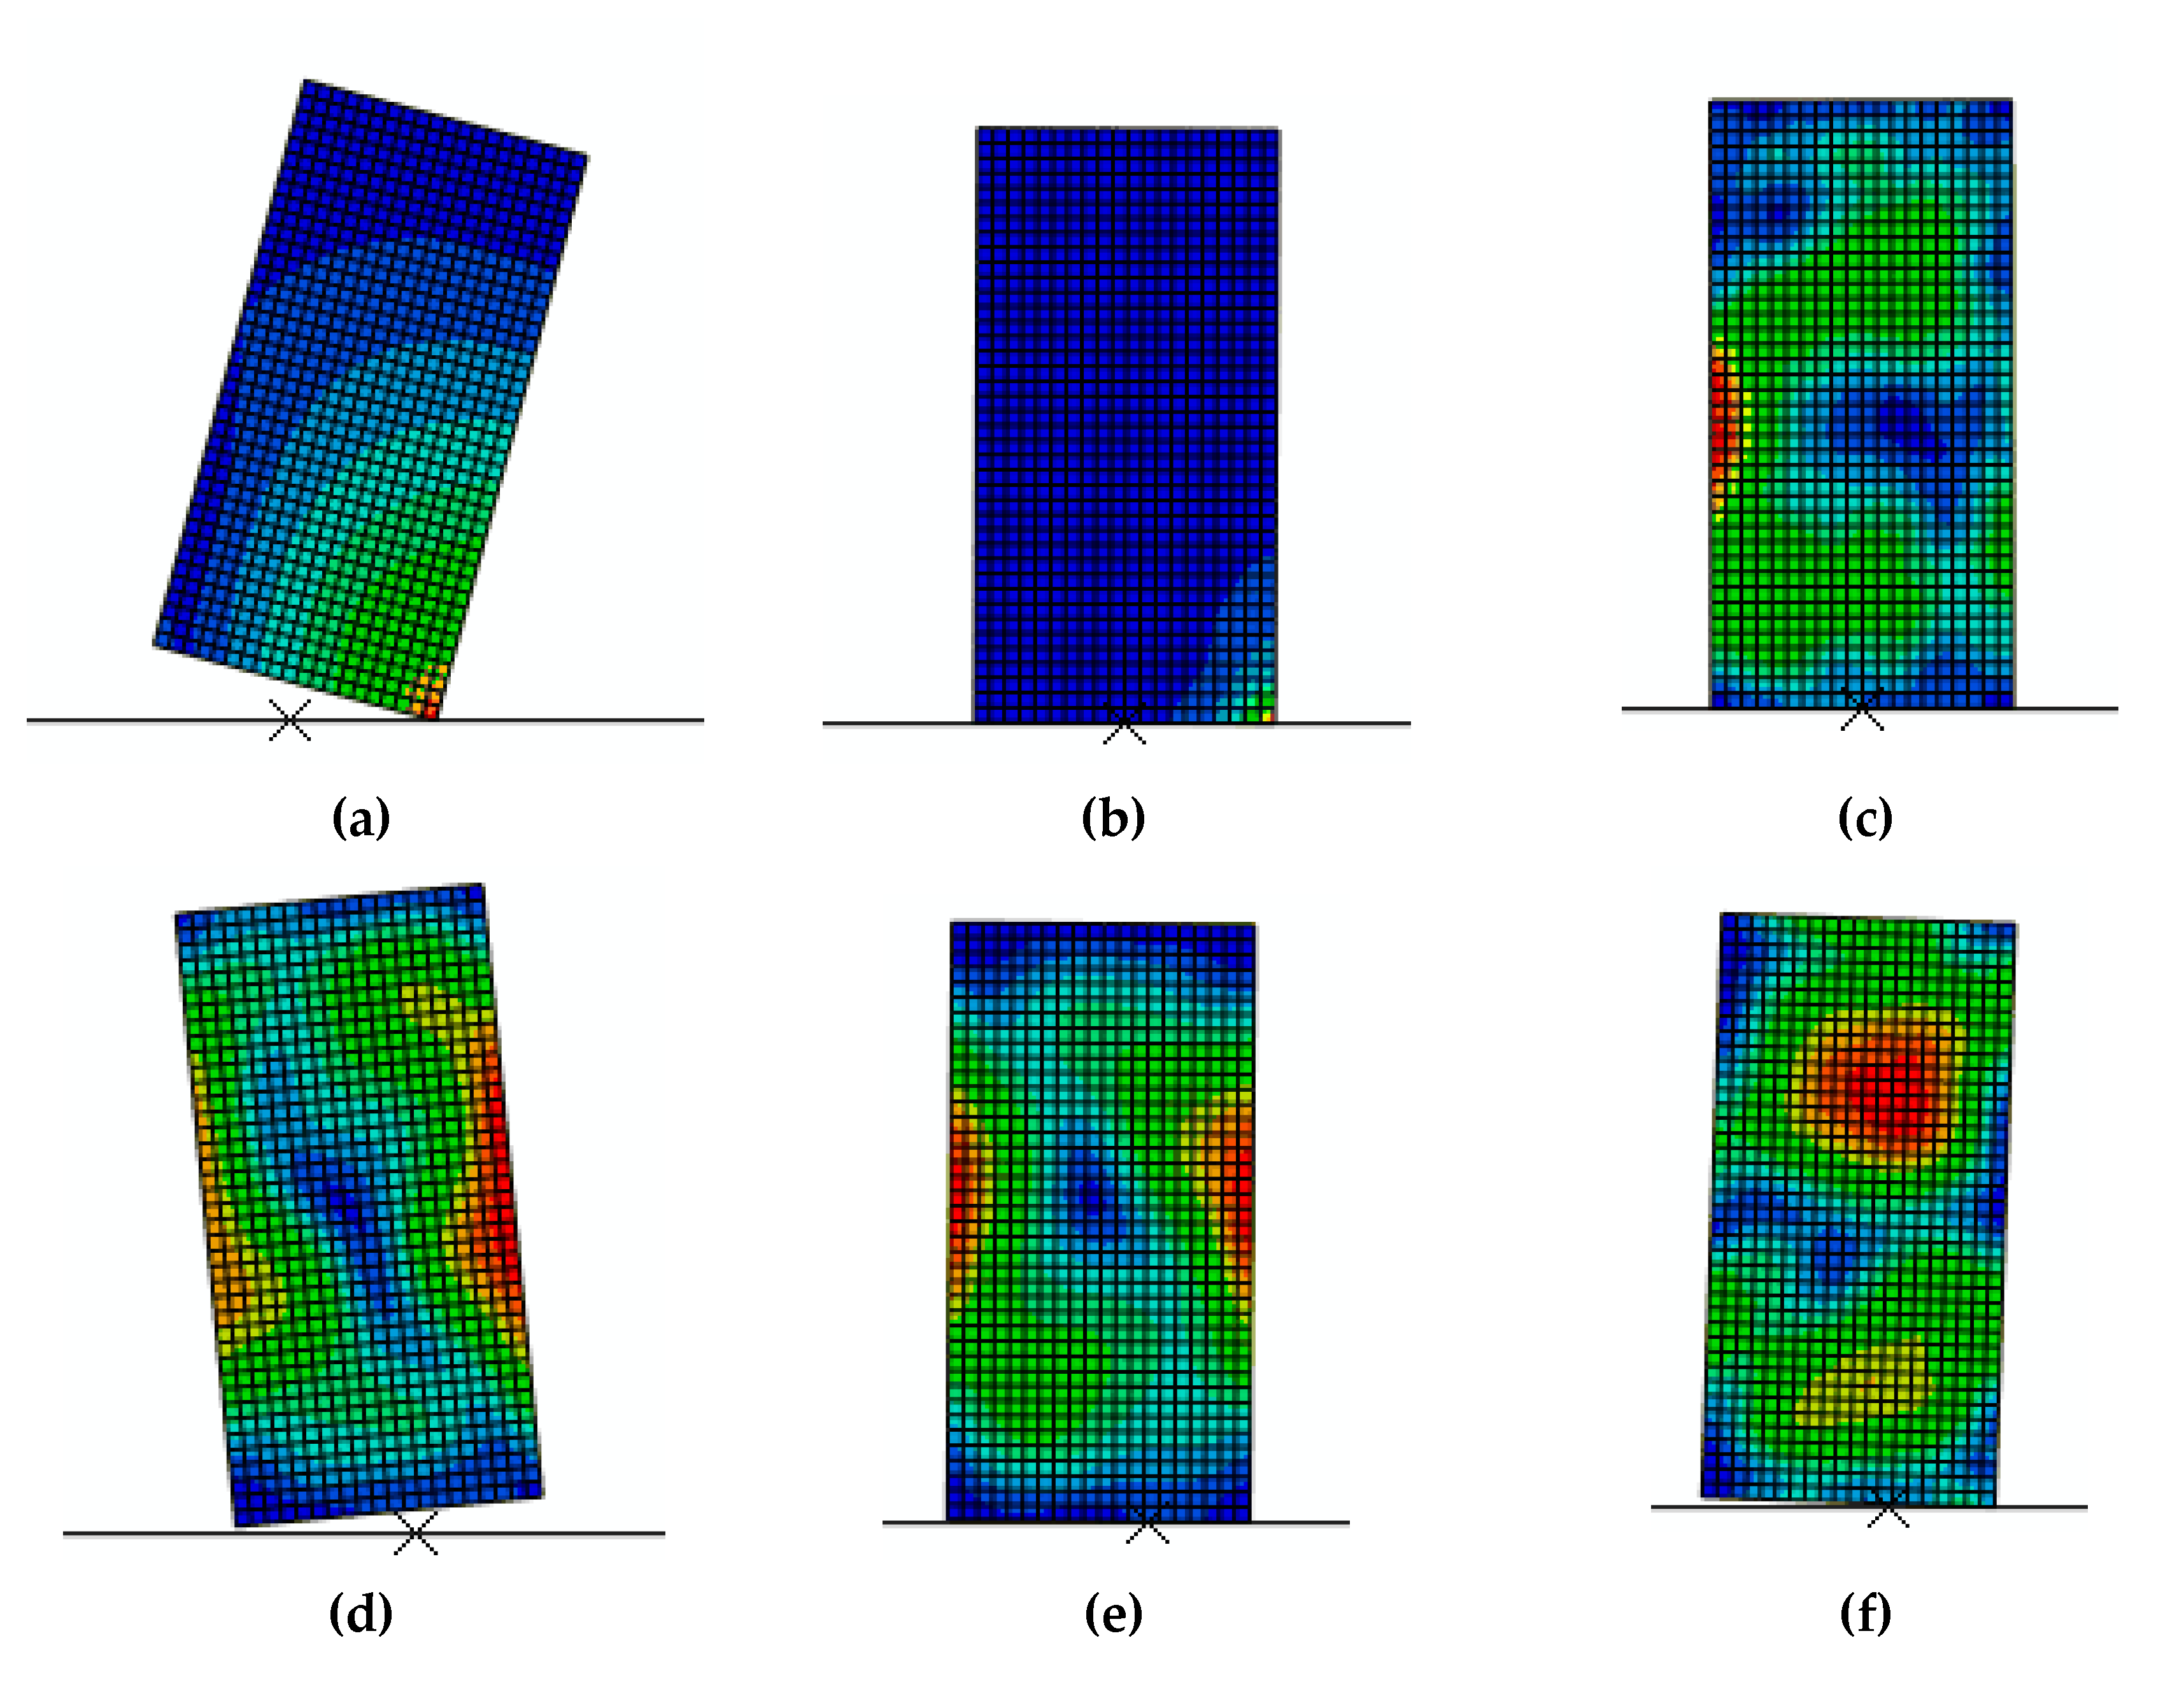
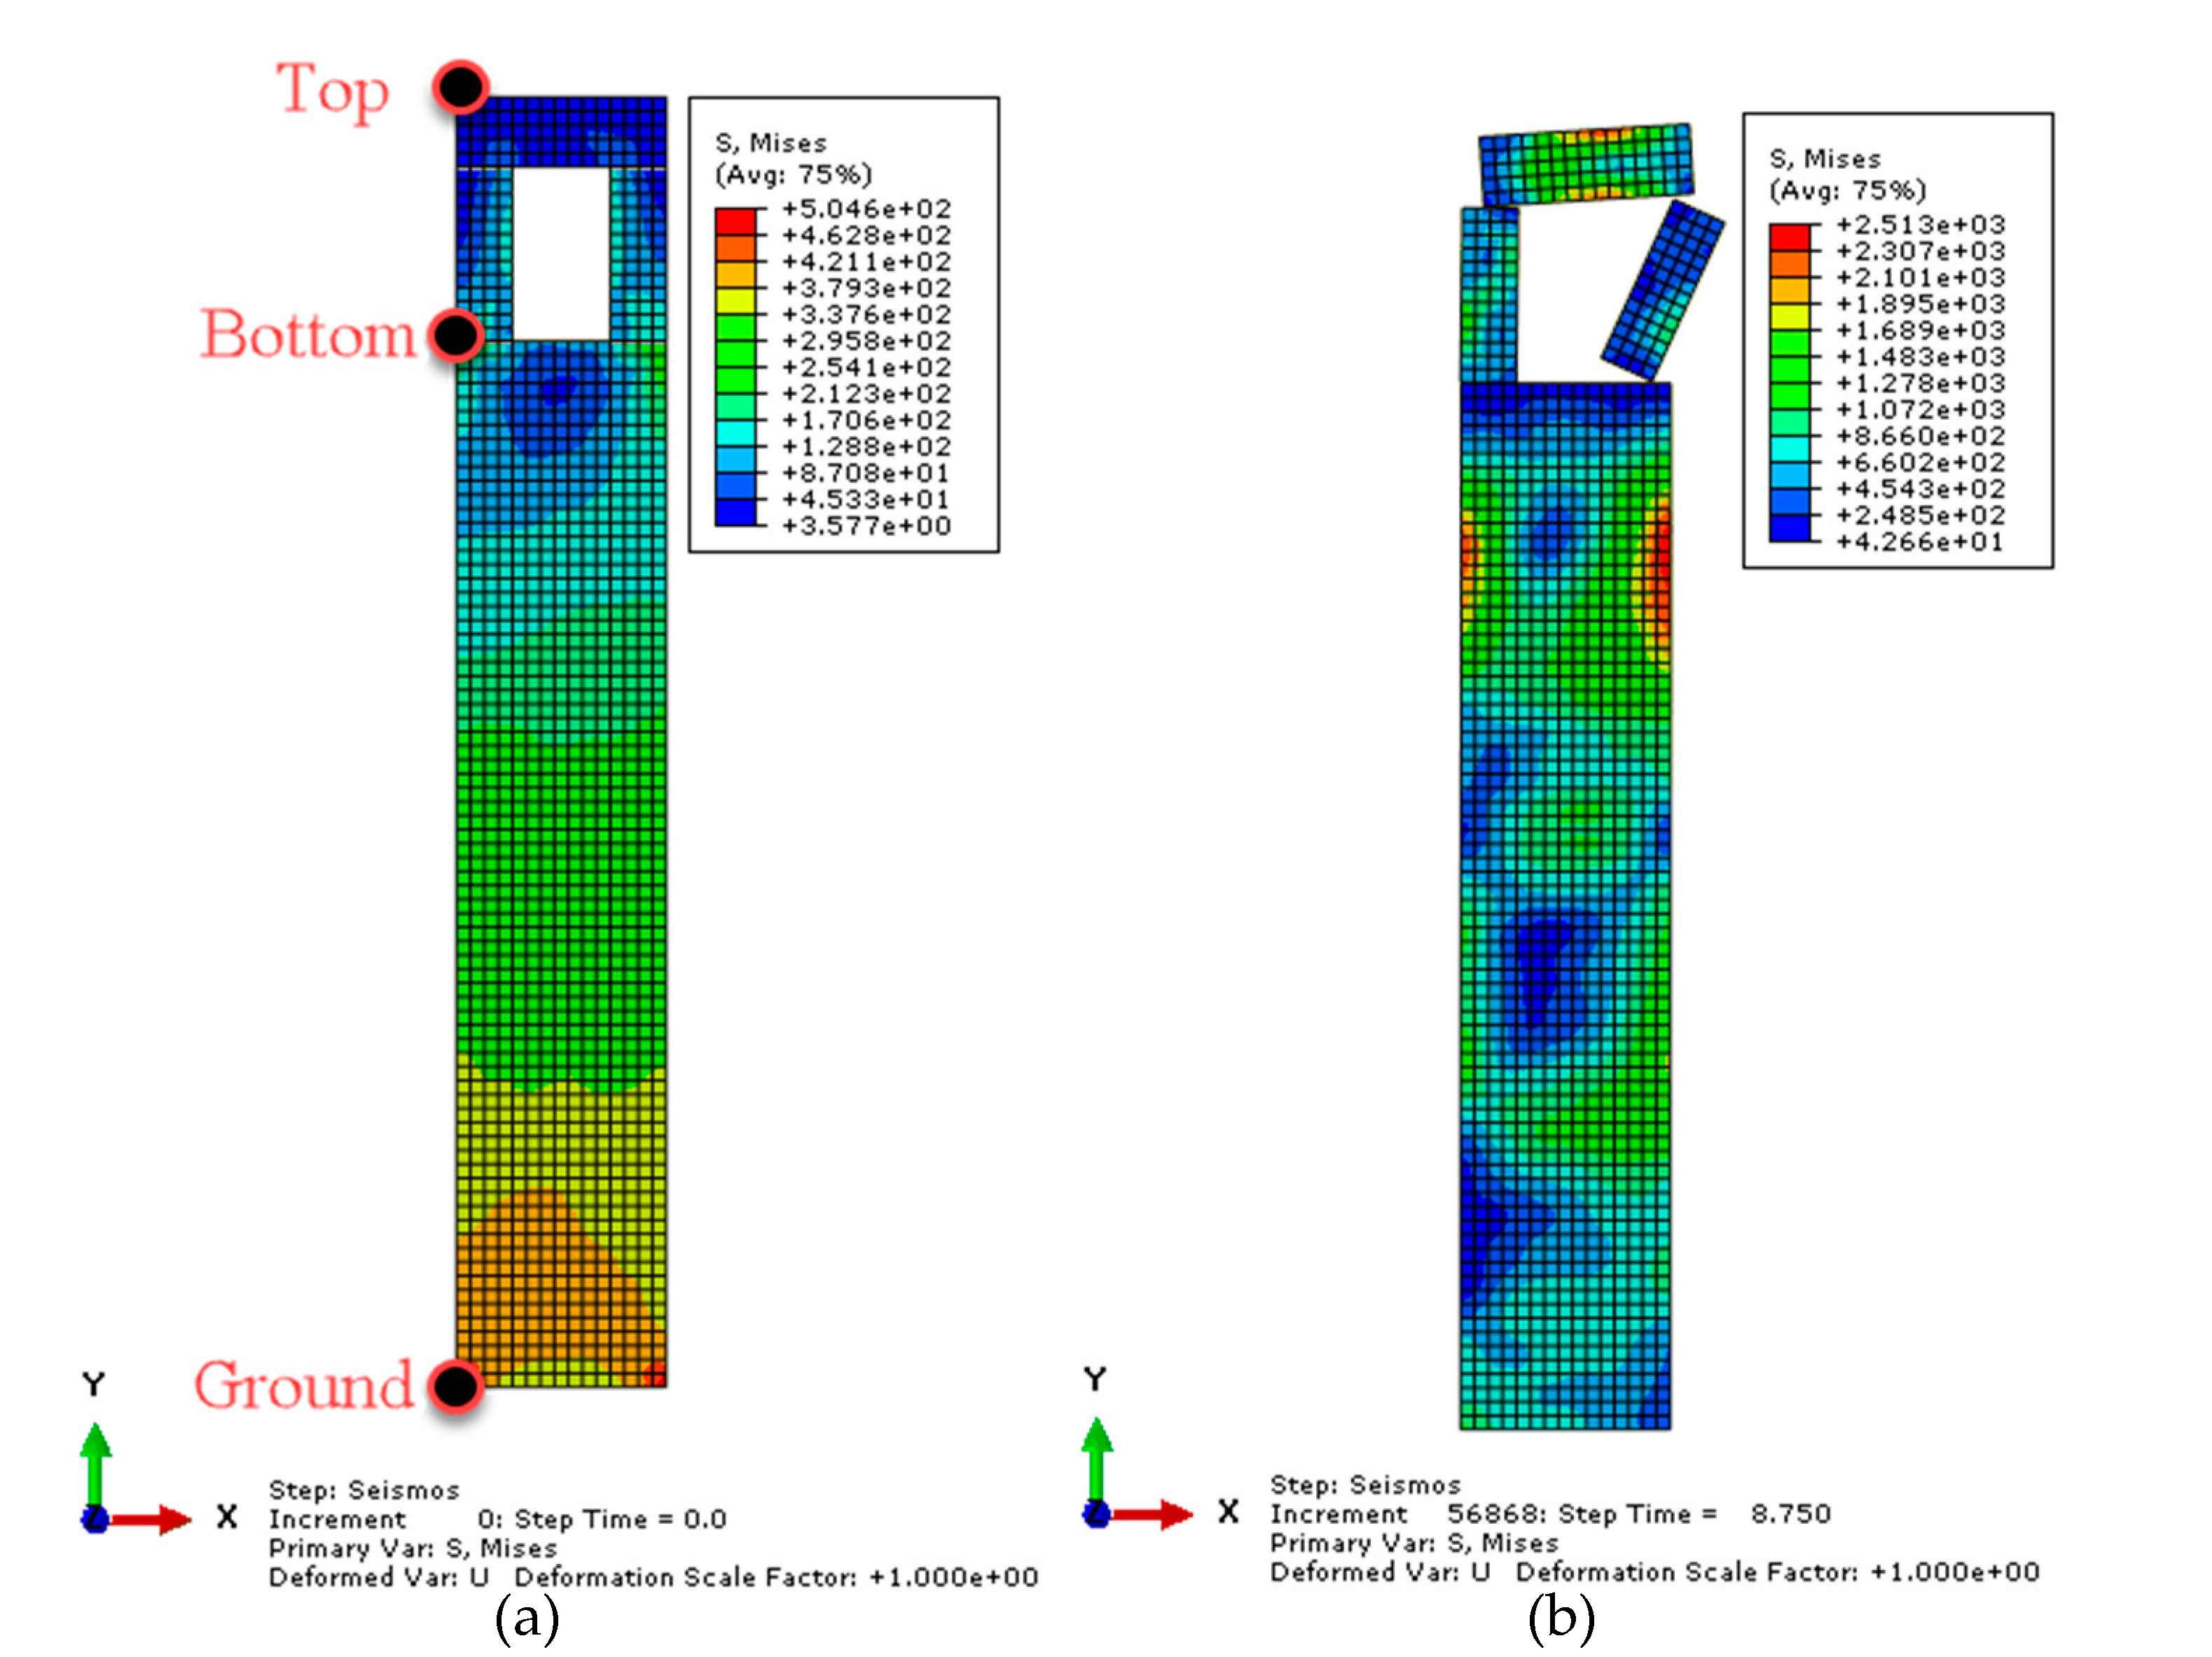
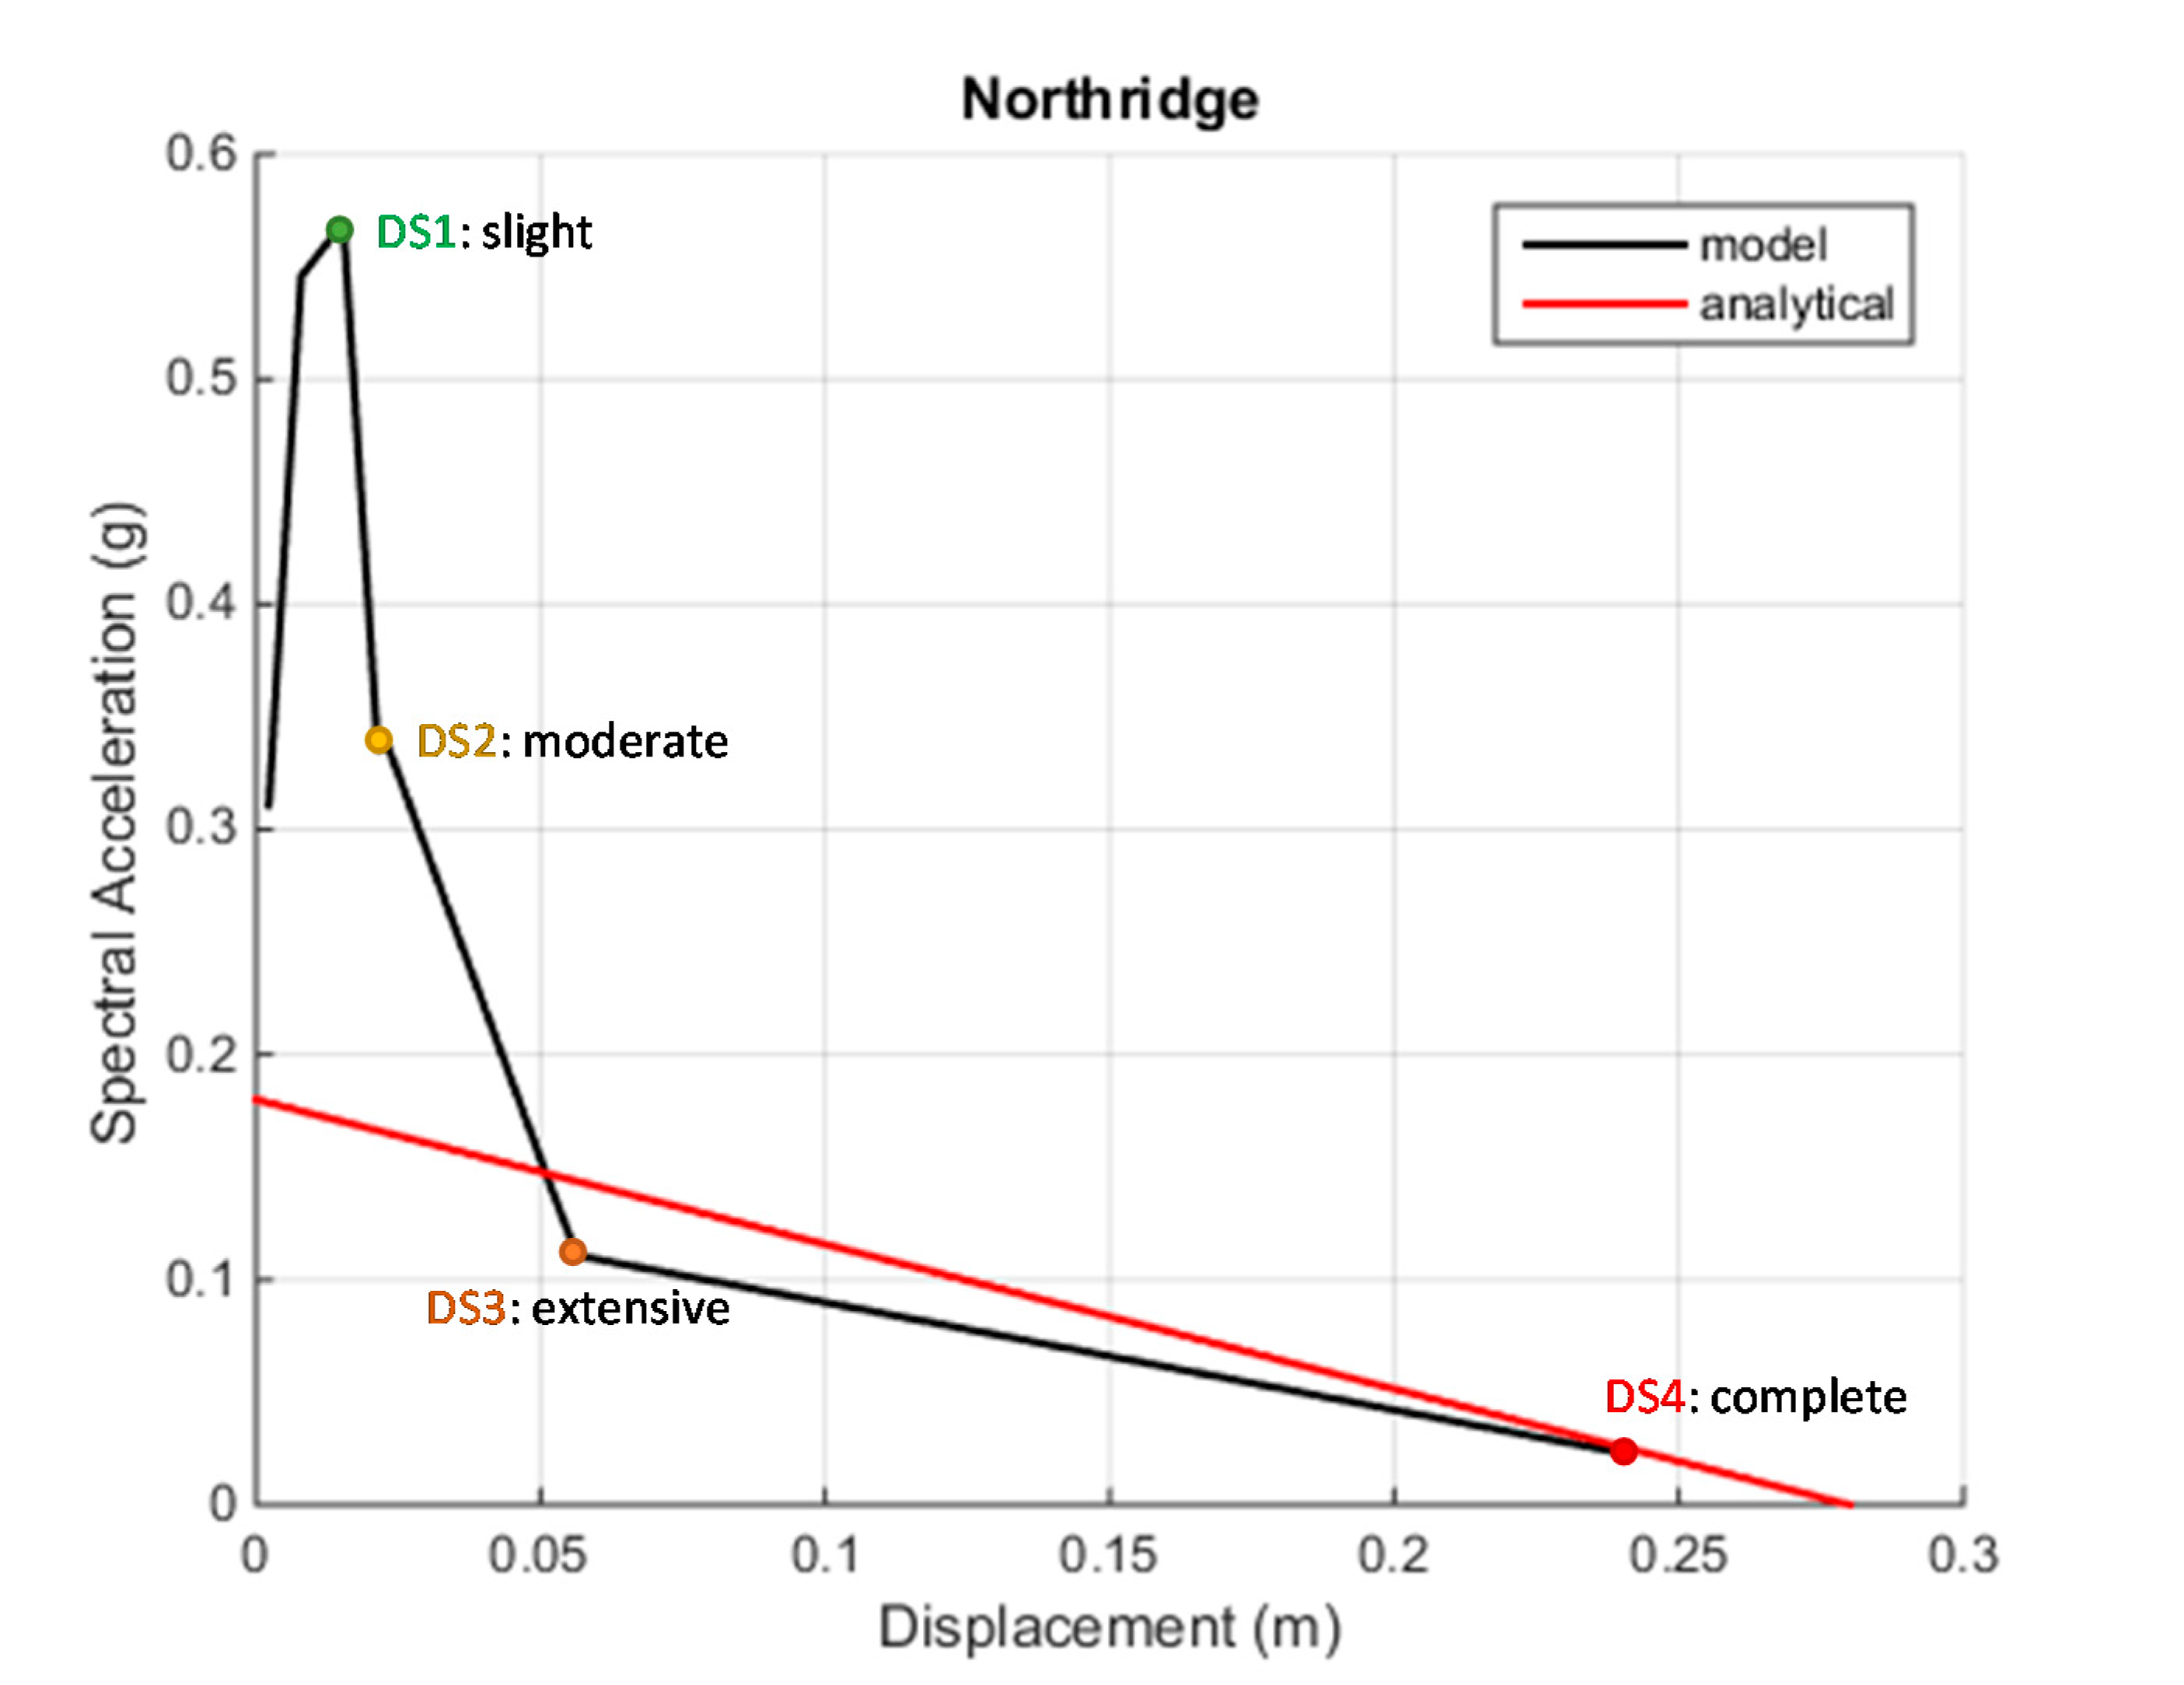
6.2. Collapse Analysis

The incremental dynamic analyses (IDAs) were performed by scaling up the recordings presented in Section 5.2 with a step of 0.1 g. NL explicit dynamic analyses were performed in Abaqus [47]. In Figure 11 the collapse mechanism of the final step of each tower is shown: there are three towers (a, b, and f) collapsing in diagonal failure (see Figure 2), two in belfry failure (c and e), and the rest (d, g, and h) in a combination of diagonal failure and belfry dislocation. Belfry construction can be from masonry pillars or solid stone columns. Protaton belfry’s columns (Figure 11e) overturn before the final collapse. As already stated, the collapse mechanism was defined by performing a limit analysis (see Section 3). Once the mechanism collapses, the analysis stops.
The incremental dynamic analyses (IDAs) result in the capacity curves compiled from the maximum displacement vs. PGA, i.e., the intensity measure (IM) of the ground motion for each step. The acceleration of the seismic vibration is transformed into spectral acceleration using the dynamic characteristics of the rocking part and the results are plotted in Figure 12. As can be observed, the IDA capacity curves present a maximum spectral capacity followed by a steep negative slope. This behaviour, with the initial amplification of the capacity, was also noticed experimentally [62]. In Figure 12, the capacity curves derived from limit analysis [32,38] are also plotted. The maximum displacement capacities estimated with IDA and limit analysis are generally close.

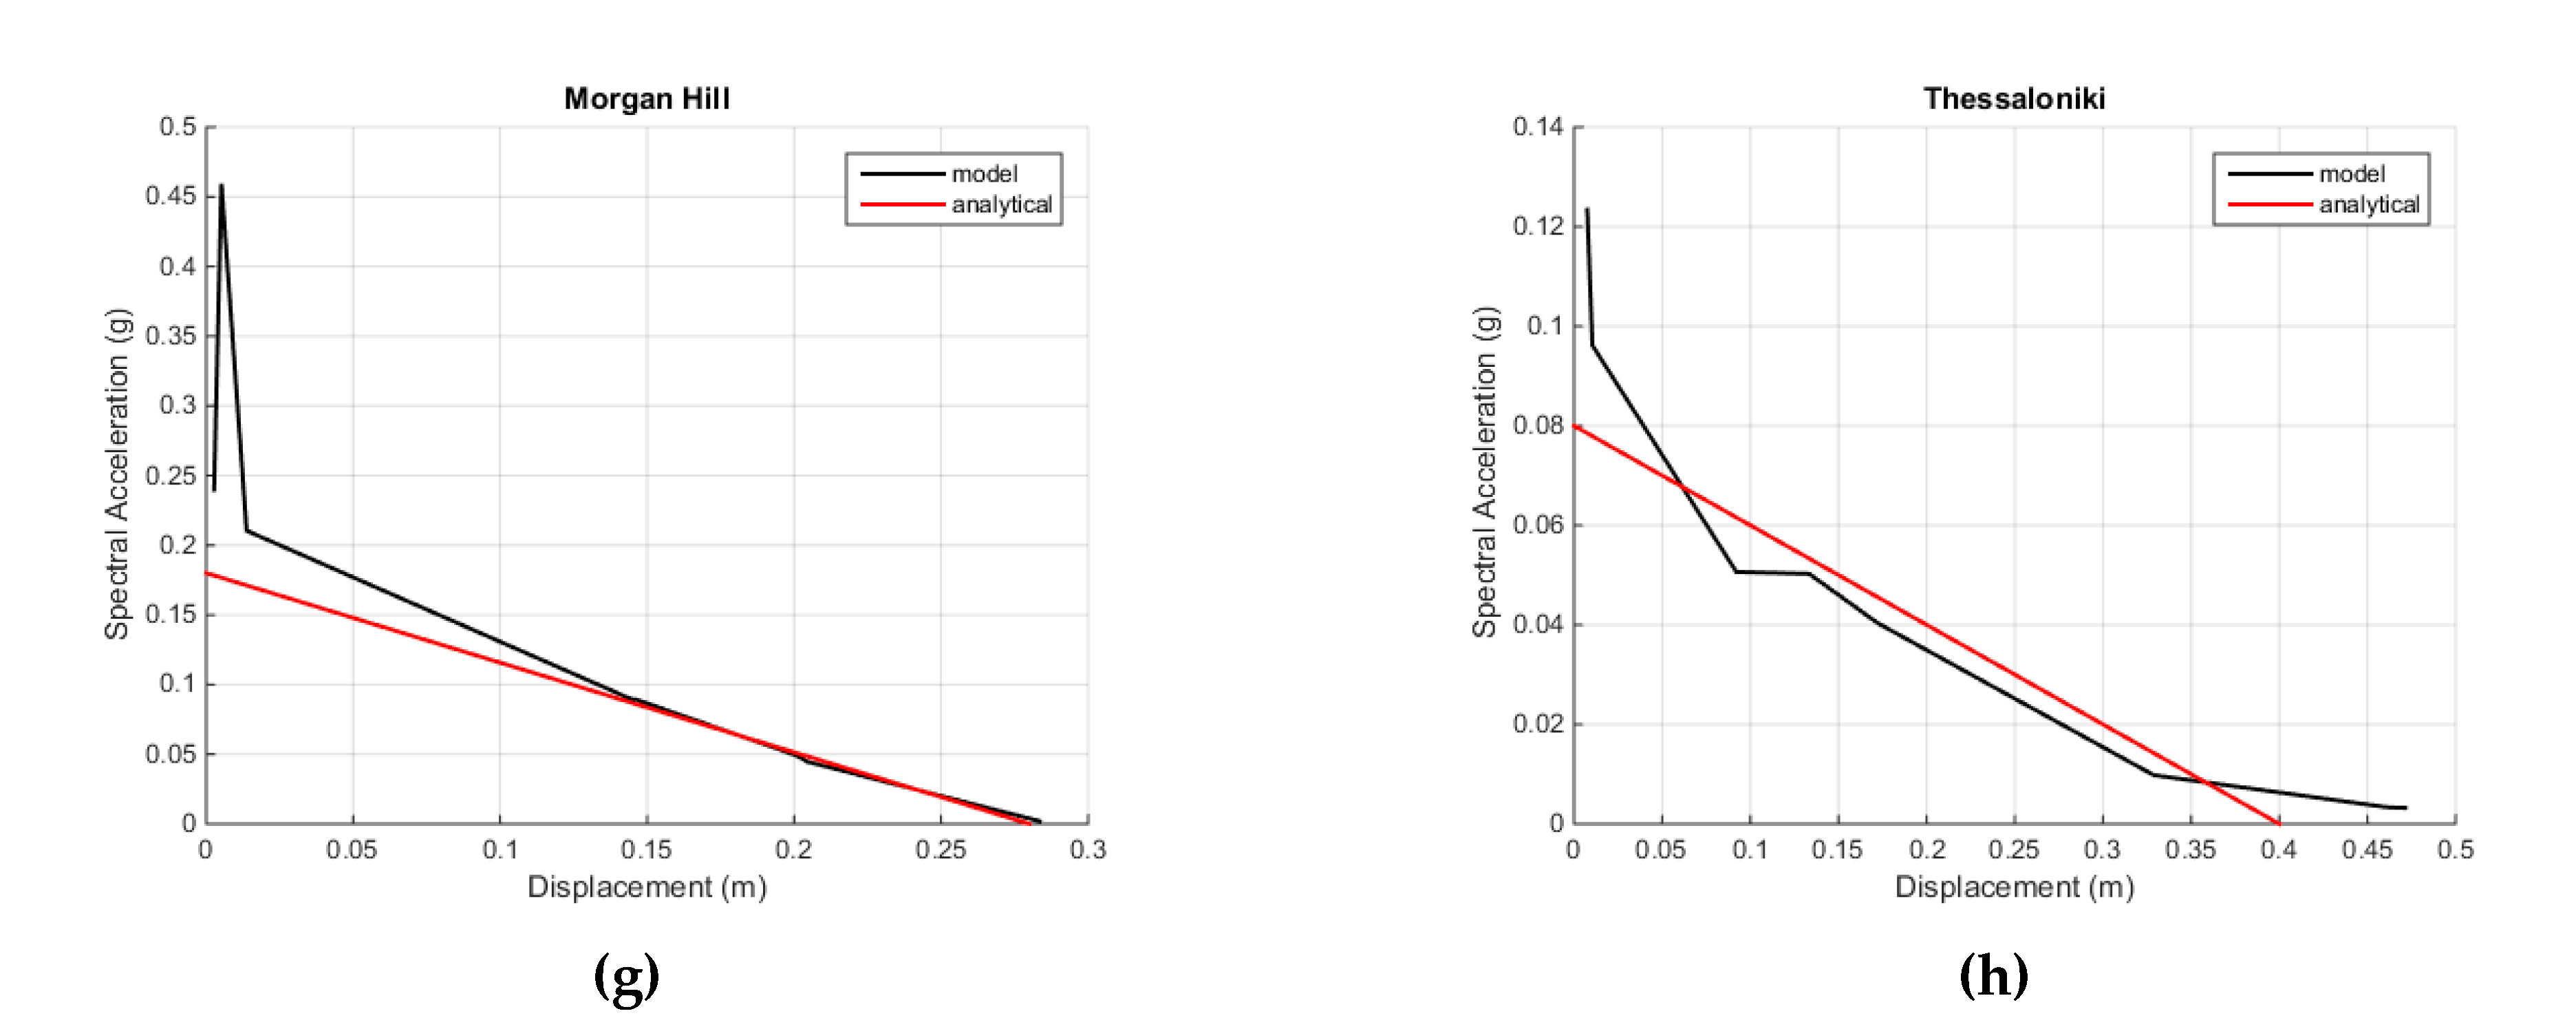
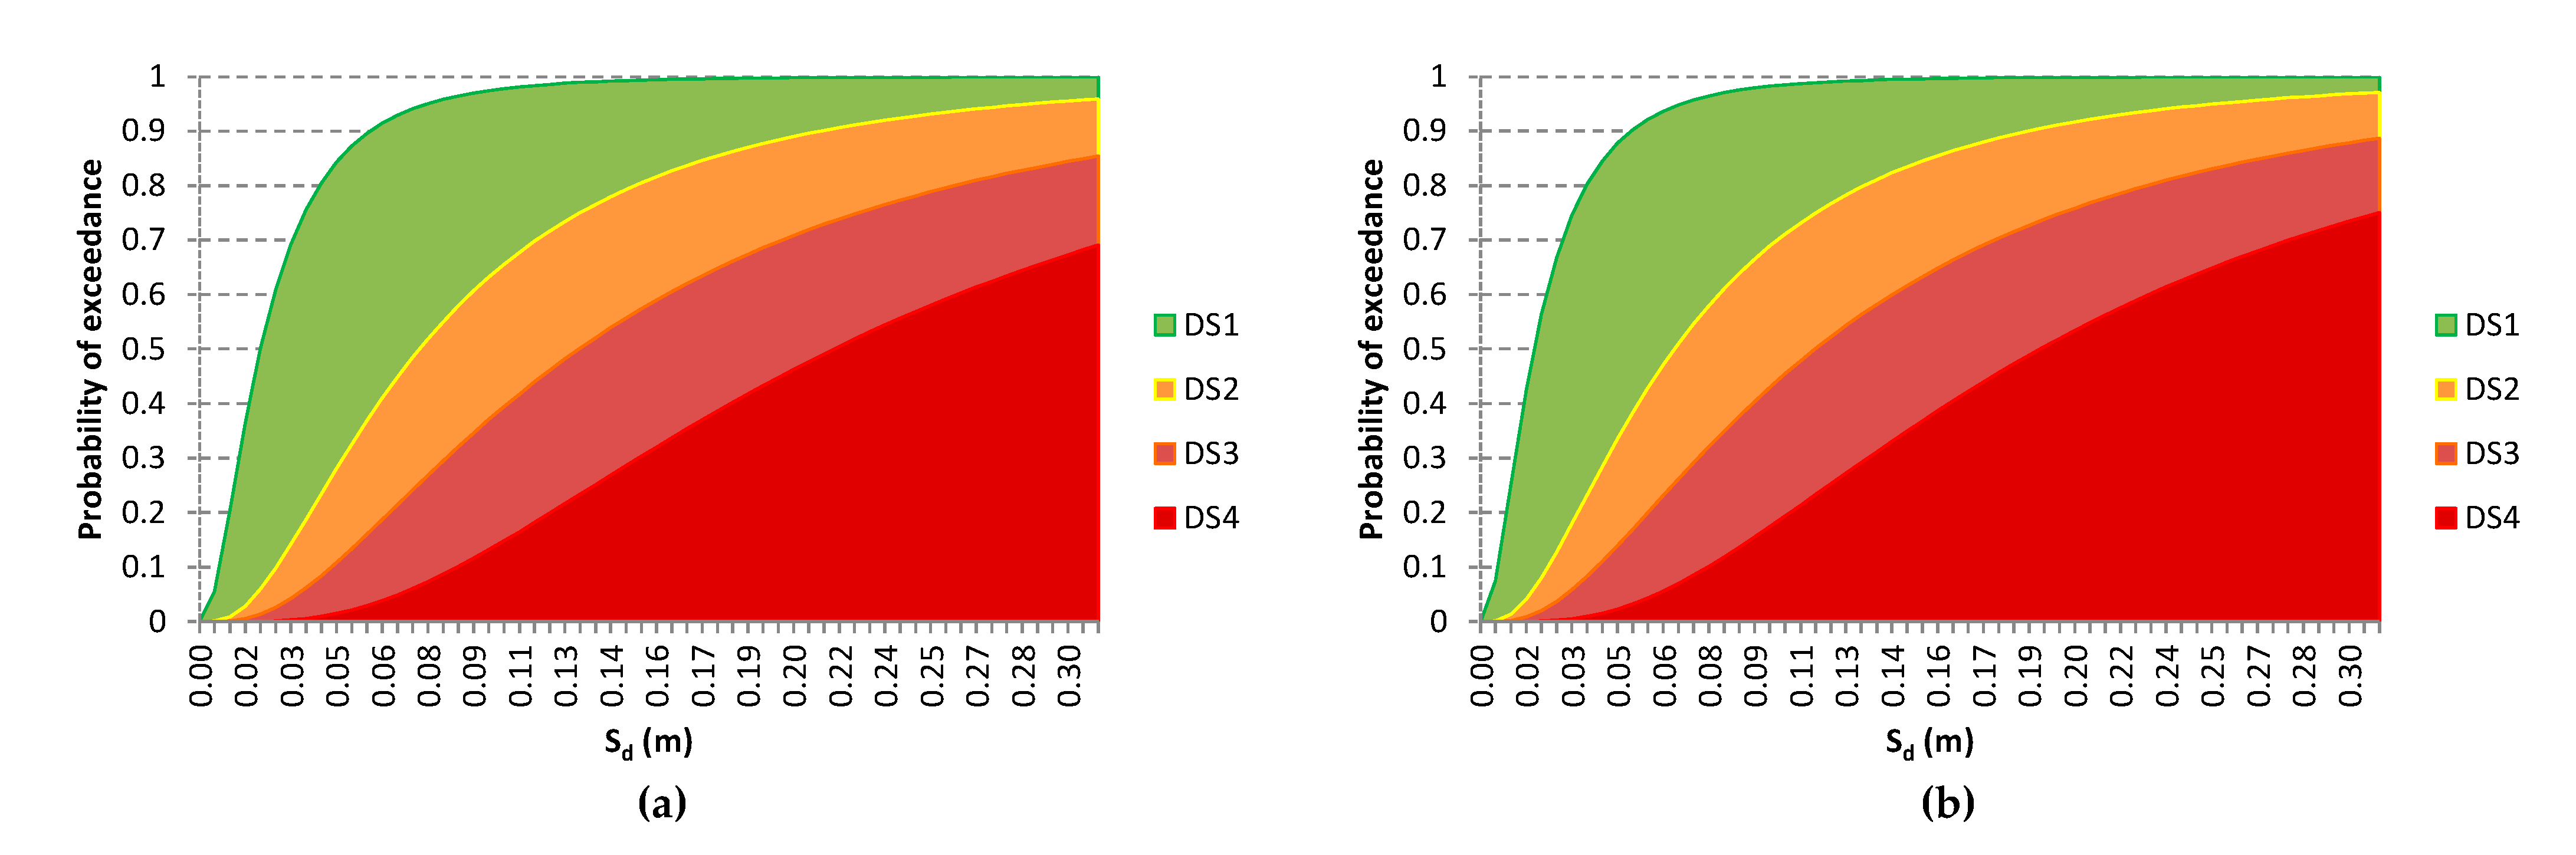
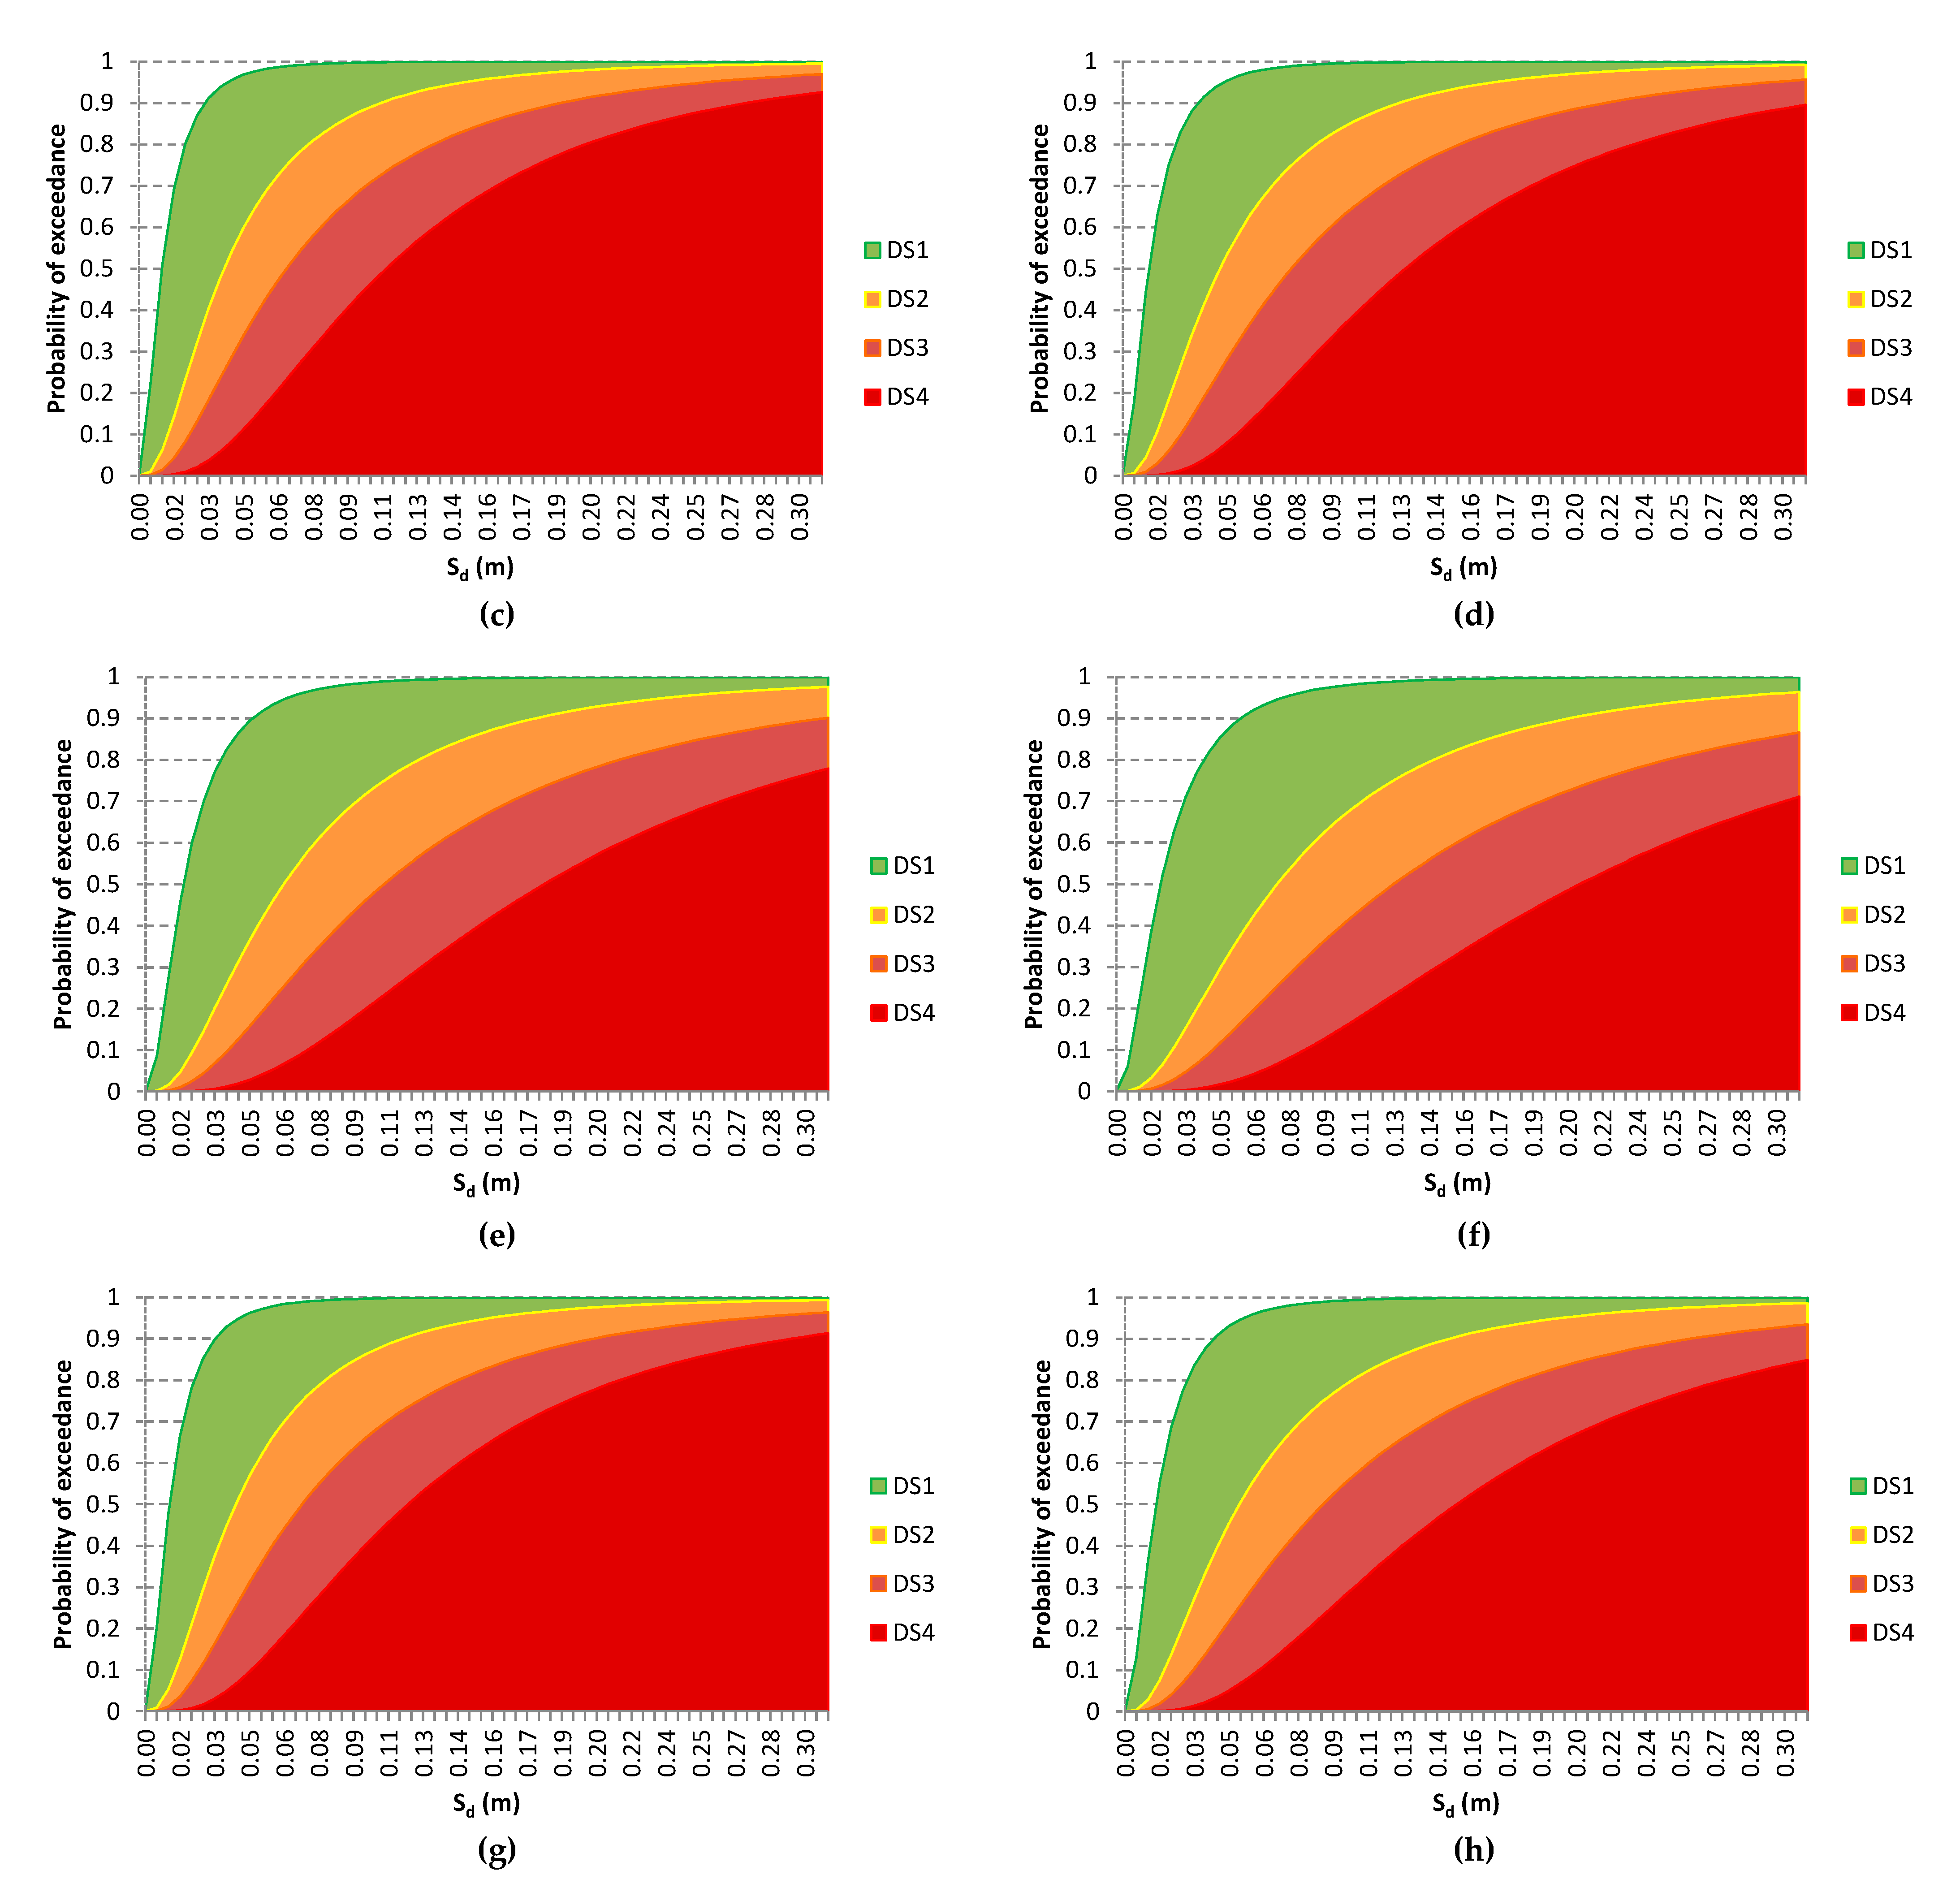
6.3. Fragility Analysis

Fragility curves describing the evolution of damage can be based on a (cumulative) lognormal distribution [63,64,65,66]. The cumulative lognormal fragility curves are dependent on two parameters: the mean value m i   of the spectral displacement and its standard deviation σ i of each limit state i. Statistical simulations such as Monte Carlo analyses can be used to determine the mean value and the standard deviation [8]. Lagomarsino [37] suggested four damage states defined on the capacity curves.
The damage states are defined on the capacity curves from IDAs (Figure 12). Four damage states are adopted: (i) slight damage, (ii) moderate damage, (iii) extensive damage, and (iv) collapse. The general capacity curve contains some distinct points (Figure 11): (i) a peak value signifying the onset of rocking, and (ii) an ultimate linear branch which has a slope very close to that of the limit analysis. In accordance with the capacity curve, the damage states are defined as (Figure 13): (i) the onset of DS1, coinciding with the onset of rocking, (ii) the first point of the last linear branch of the capacity curve, marking the onset of DS3, and (iii) DS3, coinciding with the overturn of the structure. The moderate damage state is defined with respect to the previous (DS1) and the next damage state (DS3) as their mean value [37]. To derive the capacity curve the mean and the standard deviation of each damage state should be estimated from IDAs.
The standard deviation represents the uncertainty coming from the definition of the damage states β T , d s , i , as well as the variability due to the ground motion β D and the variability due to the response of the structure β C . Such fragility curves are shown in Figure 14 for each tower separately, while Figure 15 shows fragility curves for towers and campaniles with small and large area of openings. In Figure 14, the spectral displacement in the x-axis of the fragility curves has a constant range for comparison.
The fragility curves shown in Figure 14 adhere to the studied towers or towers with similar characteristics. To this end, three more general sets of fragility curves were generated for towers and campaniles with characteristics within the range of the studied typologies (see Figure 1 and Table 1 and Table 2). A distinction is made between towers and campaniles, with the latter further divided into two categories (Table 3): (i) campaniles with small openings’ area (openings <10% of external surface) and, (ii) campaniles with large openings’ area (openings ≥10% of the external surface). The fragility curves of these three sets are presented in Figure 15: towers appear to have slight or moderate damage for lower intensities, but for higher intensities they can be more vulnerable than campaniles, whose vulnerability increases with the size of openings.
The analysis shows that the towers are less vulnerable, due to their less slender geometry, than the bell-towers, whose fragility increases partly due to their belfry. Moreover, the openings, despite resulting in a less robust structure due to the reduced mass, improve the vulnerability.

7. Conclusions

A group of representative URM towers was investigated herein to study their seismic performance and provide statistical fragility curves which are useful for their assessment and the prioritisation of interventions. The case-study towers are located on the Athos peninsula (Greece) over an area of approximately 300 km2. The proximity of their locations and the use of the same material sources justifies the adoption of similar elastic properties for all of them, despite the differences in their construction dates. The analysis showed that small variations in the mechanical properties do not substantially affect the global response, as the rocking type of failure dominates. The basic assumption of the procedure is a two-step analysis where the collapse mechanism is first identified and then an incremental dynamic analysis (IDA) of the FE model is performed.
The critical collapse mechanism of the towers was estimated by applying limit analysis. For each collapse mechanism, an FE simulation was developed which was subjected to an IDA to derive the capacity curve. The model involves not only NL interactions of the cracks but also linear material properties.
The capacity curves of the towers with cracks are only meaningful in terms of spectral acceleration and displacement. The capacity curve comprises some distinct features: (a) an initial peak denoting the onset of rocking, and (b) a final descending line leading to overturn very close to the line of the limit analysis. Damage states are defined in terms of these features: the onset of rocking is assumed to coincide with the threshold of slight damage, while the two extremes of the final line denote the extensive and complete damage states. Following this procedure, the mean values of the damage state thresholds were derived for each tower and each earthquake excitation, as well as their standard deviations. Further to this analysis, three main tower types were considered: (i) towers, (ii) campaniles with small openings’ area, and (iii) campaniles with large openings’ area. The mean value and the standard deviations were evaluated.
Using the mean and the standard deviation, a set of vulnerability curves expressed in terms of spectral displacement are proposed which can be used for cultural heritage structures with the characteristics of the three groups. By using these curves, fast and meaningful conclusions can be deducted regarding the risk management of masonry towers.

Author Contributions

Conceptualization, writing—original draft preparation, formal analysis: L.-A.S.K. and E.-G.S.K.; methodology, validation, investigation, data curation: E.-G.S.K.; original draft editing: L.-A.S.K., A.A.K., C.G.K. and E.C.A.; revision and re-organization of original draft: E.C.A., S.K.K., C.G.K. and L.-A.S.K.; supervision: E.C.A.; funding acquisition: E.-G.S.K. All authors have read and agreed to the published version of the manuscript.

Funding

This research was funded by IKY Fellowships of Excellence for Postgraduate Studies in Greece-Siemens Program, grant number SPHD/11167/13b.

Data Availability Statement

The data presented in this study are available on request from the corresponding author.

Acknowledgments

E.C.A. has been supervising the PhD research of E.-G.S.K., whereas S.K.K., C.G.K., and A.A.K. were in the advisory committee providing useful suggestions and remarks. L.-A.S.K. contributed his expertise in the field throughout this research. The previous author also acknowledges the support of FAU through a Mercator Fellow arrangement.

Conflicts of Interest

The authors declare no conflict of interest.

References

  1. Indirli, M.; Kouris, L.A.S.; Formisano, A.; Borg, R.P.; Mazzolani, F.M. Seismic Damage Assessment of Unreinforced Masonry Structures After the Abruzzo 2009 Earthquake: The Case Study of the Historical Centers of L’Aquila and Castelvecchio Subequo. Int. J. Arch. Herit. 2013, 7, 536–578. [Google Scholar] [CrossRef]
  2. Kouris, L.A.S.; Borg, R.P.; Indirli, M. The L’Aquila Earthquake, April 6th, 2009: A review of seismic damage mechanisms. In Urban Habitat Constructions under Catastrophic Events: Proceedings of the COST C26 Action Final Conference; Mazzolani, F.M., Ed.; Taylor & Francis Group: London, UK, 2010; pp. 673–681. [Google Scholar]
  3. Acito, M.; Bocciarelli, M.; Chesi, C.; Milani, G. Collapse of the clock tower in Finale Emilia after the May 2012 Emilia Romagna earthquake sequence: Numerical insight. Eng. Struct. 2014, 72, 70–91. [Google Scholar] [CrossRef]
  4. Ruggieri, S.; Tosto, C.; Rosati, G.; Uva, G.; Ferro, G.A. Seismic Vulnerability Analysis of Masonry Churches in Piemonte after 2003 Valle Scrivia Earthquake: Post-event Screening and Situation 17 Years Later. Int. J. Arch. Herit. 2020, 1–29. [Google Scholar] [CrossRef]
  5. De Matteis, G.; Brando, G.; Corlito, V. Simplified Assessment of the Seismic Vulnerability of Churches after the 2009 L’Aquila Earthquake: An Interdisciplinary Approach; Springer International Publishing: New York, NY, USA, 2019; pp. 1280–1289. ISBN 9783319994406. [Google Scholar]
  6. Casolo, S. A numerical study on the cumulative out-of-plane damage to church masonry façades due to a sequence of strong ground motions. Earthq. Eng. Struct. Dyn. 2017, 46, 2717–2737. [Google Scholar] [CrossRef]
  7. Preciado, A.; Sperbeck, S.T.; Ramírez-Gaytán, A. Seismic vulnerability enhancement of medieval and masonry bell towers externally prestressed with unbonded smart tendons. Eng. Struct. 2016, 122, 50–61. [Google Scholar] [CrossRef]
  8. Sarhosis, V.; Milani, G.; Formisano, A.; Fabbrocino, F. Evaluation of different approaches for the estimation of the seismic vulnerability of masonry towers. Bull. Earthq. Eng. 2018, 16, 1511–1545. [Google Scholar] [CrossRef] [Green Version]
  9. Casolo, S.; Milani, G.; Uva, G.; Alessandri, C. Comparative seismic vulnerability analysis on ten masonry towers in the coastal Po Valley in Italy. Eng. Struct. 2013, 49, 465–490. [Google Scholar] [CrossRef]
  10. Kouris, S.S.; Karaveziroglou-Weber, M.K. Structural analysis and diagnosis of masonry towers. In Proceedings of the ECCOMAS Thematic Conference—COMPDYN 2011: 3rd International Conference on Computational Methods in Structural Dynamics and Earthquake Engineering: An IACM Special Interest Conference Programme, Corfu, Greece, 25–28 May 2011. [Google Scholar]
  11. Chrysostomou, C.Z.; Kyriakides, N.; Kappos, A.J.; Kouris, L.; Papanikolaou, V.; Dimitrakopoulos, E.G.; Giouvanidis, A.I.; Georgiou, E. Seismic safety and vulnerability mitigation of school buildings. In Proceedings of the 4th International fib Congress 2014: Improving Performance of Concrete Structures, Mumbai, India, 10–14 February 2014; pp. 122–124. [Google Scholar]
  12. Giresini, L.; Fragiacomo, M.; Sassu, M. Rocking analysis of masonry walls interacting with roofs. Eng. Struct. 2016, 116, 107–120. [Google Scholar] [CrossRef] [Green Version]
  13. Zucchini, A.; Lourenço, P. A micro-mechanical model for the homogenisation of masonry. Int. J. Solids Struct. 2002, 39, 3233–3255. [Google Scholar] [CrossRef]
  14. Ferrante, A.; Clementi, F.; Milani, G. Dynamic Behavior of an Inclined Existing Masonry Tower in Italy. Front. Built Environ. 2019, 5, 33. [Google Scholar] [CrossRef]
  15. Shehu, R. Implementation of Pushover Analysis for Seismic Assessment of Masonry Towers: Issues and Practical Recommendations. Buildings 2021, 11, 71. [Google Scholar] [CrossRef]
  16. Kouris, L.A.S.; Kappos, A. A practice-oriented model for pushover analysis of a class of timber-framed masonry buildings. Eng. Struct. 2014, 75, 489–506. [Google Scholar] [CrossRef]
  17. Ceroni, F.; Pecce, M.R.; Manfredi, G. Seismic Assessment of the Bell Tower of Santa Maria Del Carmine: Problems and Solutions. J. Earthq. Eng. 2009, 14, 30–56. [Google Scholar] [CrossRef] [Green Version]
  18. Ruggieri, N.; Zinno, R. Behaviour of the Borbone Constructive System under Cyclic Loading: Preliminary Report. Historical Earthquake-Resistant Timber Frames in the Mediterranean Area; Springer: Cham, Switzerland, 2015. [Google Scholar] [CrossRef]
  19. Meireles, H.; Bento, R.; Cattari, S.; Lagomarsino, S. Seismic assessment and retrofitting of Pombalino buildings by pushover analyses. Earthq. Struct. 2014, 7, 57–82. [Google Scholar] [CrossRef]
  20. Kouris, L.A.S.; Kappos, A. Detailed and simplified non-linear models for timber-framed masonry structures. J. Cult. Herit. 2012, 13, 47–58. [Google Scholar] [CrossRef] [Green Version]
  21. Aloisio, A.; Fragiacomo, M.; D’Alò, G. The 18th-Century Baraccato of L’Aquila. Int. J. Arch. Herit. 2019, 14, 870–884. [Google Scholar] [CrossRef]
  22. Dutu, A.; Yamazaki, Y.; Sakata, H. Shear spring model proposed for seismic evaluation of a timber framed masonry infilled wall. Eng. Struct. 2018, 167, 671–682. [Google Scholar] [CrossRef]
  23. Kouris, E.; Kouris, L. Investigation of the Influence of Tie-Rods on the Seismic Behaviour of Slender Towers. Civ. Comp. Proc. 2014, 106. [Google Scholar] [CrossRef]
  24. Saisi, A.; Gentile, C. Investigation Strategy for Structural Assessment of Historic Towers. Infrastructures 2020, 5, 106. [Google Scholar] [CrossRef]
  25. Pavia, A.; Scozzese, F.; Petrucci, E.; Zona, A. Seismic Upgrading of a Historical Masonry Bell Tower through an Internal Dissipative Steel Structure. Buildings 2021, 11, 24. [Google Scholar] [CrossRef]
  26. Kouris, L.A.S.; Penna, A.; Magenes, G. Seismic damage diagnosis of a masonry building using short-term damping measurements. J. Sound Vib. 2017, 394, 366–391. [Google Scholar] [CrossRef]
  27. Kouris, L.A.S.L.; Penna, A.; Magenes, G. Damage detection of an unreinforced stone masonry two storeys building based on damping estimate. In Brick and Block Masonry; CRC Press: Boca Raton, FL, USA, 2016; pp. 2425–2432. ISBN 9781138029996. [Google Scholar]
  28. Kouris, L.A.S.; Penna, A.; Magenes, G. Dynamic Modification and Damage Propagation of a Two-Storey Full-Scale Masonry Building. Adv. Civ. Eng. 2019, 2019, 1–21. [Google Scholar] [CrossRef]
  29. Ruggieri, S.; Perrone, D.; Leone, M.; Uva, G.; Aiello, M.A. A prioritization RVS methodology for the seismic risk assessment of RC school buildings. Int. J. Disaster Risk Reduct. 2020, 51, 101807. [Google Scholar] [CrossRef]
  30. UNESCO. ICOMOS Recommendation for Mount Athos No 454; UNESCO: Paris, France, 1988; p. 6. [Google Scholar]
  31. KEDAK. The Towers of Mount Athos; Konstantinou, M., Nicodimos, L., Papangellos, I., Moustakas, S., Eds.; Ministry of Macedonia-Thrace, Centre for Preservation of Mount Athos Heritage: Thessaloniki, Greece, 2002; ISBN 9608596777. [Google Scholar]
  32. Kouris, E.-G.; Kouris, L.-A.; Konstantinidis, A.; Karayannis, C.; Aifantis, E. Assessment and Fragility of Byzantine Unreinforced Masonry Towers. Infrastructures 2021, 6, 40. [Google Scholar] [CrossRef]
  33. Kouris, E.-G. Dynamic Characteristics and Rocking Response of a Byzantine Medieval Tower. J. Civ. Eng. Sci. 2017, 6, 14–23. [Google Scholar] [CrossRef] [Green Version]
  34. Kouris, E.G. Recent Methodologies for Estimating Traditional Structures. Ph.D. Thesis, Aristotle Univeristy of Thessaloniki, Thessaloniki, Greece, 2019. [Google Scholar]
  35. Abrams, D.P.; Angel, R.; Uzarski, J. Out-of-Plane Strength of Unreinforced Masonry Infill Panels. Earthq. Spectra 1996, 12, 825–844. [Google Scholar] [CrossRef]
  36. Ewing, R.D.; Kariotis, J.C. Methodology for Mitigation of Seismic Hazards in Existing Unreinforced Masonry Buildings: Wall Testing, Out-of-Plane; ABK: EI Segundo, CA, USA, 1981. [Google Scholar]
  37. Lagomarsino, S. On the vulnerability assessment of monumental buildings. Bull. Earthq. Eng. 2006, 4, 445–463. [Google Scholar] [CrossRef]
  38. Doherty, K.; Griffith, M.C.; Lam, N.; Wilson, J. Displacement-based seismic analysis for out-of-plane bending of unreinforced masonry walls. Earthq. Eng. Struct. Dyn. 2002, 31, 833–850. [Google Scholar] [CrossRef]
  39. Vukobratović, V.; Fajfar, P. A method for the direct determination of approximate floor response spectra for SDOF inelastic structures. Bull. Earthq. Eng. 2015, 13, 1405–1424. [Google Scholar] [CrossRef]
  40. Politopoulos, I.; Feau, C. Some aspects of floor spectra of 1DOF nonlinear primary structures. Earthq. Eng. Struct. Dyn. 2007, 36, 975–993. [Google Scholar] [CrossRef] [Green Version]
  41. Menon, A.; Magenes, G. Definition of Seismic Input for Out-of-Plane Response of Masonry Walls: I. Parametric Study. J. Earthq. Eng. 2011, 15, 165–194. [Google Scholar] [CrossRef]
  42. Vukobratović, V.; Ruggieri, S. Floor Acceleration Demands in a Twelve-Storey RC Shear Wall Building. Buildings 2021, 11, 38. [Google Scholar] [CrossRef]
  43. Lagomarsino, S. Seismic assessment of rocking masonry structures. Bull. Earthq. Eng. 2015, 13, 97–128. [Google Scholar] [CrossRef]
  44. CEN. Eurocode 6: Design of Masonry Structures; Part 1: General Rules for Buildings; European Committee for Standardization: Brussels, Belgium, 2004; Volume 1. [Google Scholar]
  45. CEN. Eurocode 8, Design of Structures for Earthquake Resistance; Part 1: General rules, Seismic Actions and Rules for Buildings. Eur. Stand. NF EN 1998, 1; European Committee for Standardization: Brussels, Belgium, 2004. [Google Scholar]
  46. Housner, G.W. The behavior of inverted pendulum structures during earthquakes. Bull. Seismol. Soc. Am. 1963, 53, 403–417. [Google Scholar]
  47. Caumo, A.; Maffi, P.; Nano, R.; Luzi, L.; Hilbrands, R.; Gillard, P.; Jacobs-Tulleneers-Thevissen, D.; Secchi, A.; Keymeulen, B.; Pipeleers, D.; et al. Comparative Evaluation of Simple Indices of Graft Function After Islet Transplantation. Transplantation 2011, 92, 815–821. [Google Scholar] [CrossRef] [PubMed]
  48. Brignola, A.; Frumento, S.; Lagomarsino, S.; Podestà, S. Identification of Shear Parameters of Masonry Panels Through the In-Situ Diagonal Compression Test. Int. J. Arch. Herit. 2008, 3, 52–73. [Google Scholar] [CrossRef]
  49. Foppoli, D.; Armanasco, A. Laboratory and In Situ Calibrations of New Flat Jack Method for Assessing Masonry Shear Characteristics. In Structural Analysis of Historical Constructions; Springer Science and Business Media LLC: Cham, Swizterland, 2019; Volume 18, pp. 513–522. [Google Scholar]
  50. Čeh, N.; Jelenić, G.; Bićanić, N. Analysis of restitution in rocking of single rigid blocks. Acta Mech. 2018, 229, 4623–4642. [Google Scholar] [CrossRef]
  51. Kalliontzis, D.; Sritharan, S.; Schultz, A. Improved Coefficient of Restitution Estimation for Free Rocking Members. J. Struct. Eng. 2016, 142, 06016002. [Google Scholar] [CrossRef]
  52. Chatzis, M.; Espinosa, M.G.; Smyth, A.W. Examining the Energy Loss in the Inverted Pendulum Model for Rocking Bodies. J. Eng. Mech. 2017, 143, 04017013. [Google Scholar] [CrossRef]
  53. Recupero, A.; Spinella, N. The Strengthening of Masonry Walls in Seismic-Prone Areas with the CAM System: Experimental and Numerical Results. Infrastructures 2020, 5, 108. [Google Scholar] [CrossRef]
  54. Lourenço, P. Assessment, diagnosis and strengthening of Outeiro Church, Portugal. Constr. Build. Mater. 2005, 19, 634–645. [Google Scholar] [CrossRef] [Green Version]
  55. Manos, G.; Soulis, V.; Diagouma, A. Numerical investigation of the behaviour of the church of Agia Triada, Drakotrypa, Greece. Adv. Eng. Softw. 2008, 39, 284–300. [Google Scholar] [CrossRef]
  56. Binda, L.; Tiraboschi, C.; Baronio, G. On-site investigation on the remains of the Cathedral of Noto. Constr. Build. Mater. 2003, 17, 543–555. [Google Scholar] [CrossRef]
  57. Bartoli, G.; Betti, M.; Vignoli, A. A numerical study on seismic risk assessment of historic masonry towers: A case study in San Gimignano. Bull. Earthq. Eng. 2016, 14, 1475–1518. [Google Scholar] [CrossRef]
  58. Penna, A.; Magenes, G.; Rota, M.; Mandirola, M.; Rosti, A. Experimental-numerical research on the seismic performance of URM buildings made of lightweight AAC blocks/Experimentell-numerische Untersuchung zum seismischen Verhalten von unbewehrten Mauerwerksgebäuden aus Porenbetonblöcken. Mauerwerk 2015, 19, 130–143. [Google Scholar] [CrossRef]
  59. Tomaževič, M.; Lutman, M.; Petković, L. Seismic behavior of masonry walls: Experimental simulation. J. Struct. Eng. 1996, 122, 1040–1047. [Google Scholar] [CrossRef]
  60. Pintucchi, B.L.; Zani, N. Effectiveness of nonlinear static procedures for slender masonry towers. Bull. Earthq. Eng. 2014, 12, 2531–2556. [Google Scholar] [CrossRef]
  61. Tomazevic, M. Earthquake-Resistant Design of Masonry Buildings; Series on Innovation in Structures and Construction; Imperial College Press: London, UK, 1999; Volume 1, ISBN 9781860940668. [Google Scholar]
  62. Griffith, M.C.; Lam, N.T.K.; Wilson, J.L.; Doherty, K. Experimental Investigation of Unreinforced Brick Masonry Walls in Flexure. J. Struct. Eng. 2004, 130, 423–432. [Google Scholar] [CrossRef] [Green Version]
  63. Whitman, R.V.; Anagnos, T.; Kircher, C.A.; Lagorio, H.J.; Lawson, R.S.; Schneider, P. Development of a National Earthquake Loss Estimation Methodology. Earthq. Spectra 1997, 13, 643–661. [Google Scholar] [CrossRef]
  64. Kouris, L.A.S.; Kappos, A.J. Fragility Curves and Loss Estimation for Traditional Timber-Framed Masonry Buildings in Lefkas, Greece. In Computational Methods in Applied Sciences; Springer Science and Business Media LLC: Cham, Switzerland, 2015; Volume 37, pp. 199–233. [Google Scholar]
  65. Formisano, A.; Marzo, A. Simplified and refined methods for seismic vulnerability assessment and retrofitting of an Italian cultural heritage masonry building. Comput. Struct. 2017, 180, 13–26. [Google Scholar] [CrossRef] [Green Version]
  66. Capanna, I.; Cirella, R.; Aloisio, A.; Alaggio, R.; Di Fabio, F.; Fragiacomo, M. Operational Modal Analysis, Model Update and Fragility Curves Estimation, through Truncated Incremental Dynamic Analysis, of a Masonry Belfry. Buildings 2021, 11, 120. [Google Scholar] [CrossRef]
Figure 1. Case-study towers in Mount Athos: (a) Caracallou, (b) Koutloumousiou, (c) Vatopedi, (d) Philotheou, (e) Protaton, (f) Dionysiou (g) Xenophontos, and (h) Iveron.
Buildings 11 00296 g001
Figure 2. Damage modes for towers: (a) overturning, (b) separation, (c) diagonal failure, and (d) belfry failure.
Buildings 11 00296 g002
Figure 3. Rocking response of a URM block.
Buildings 11 00296 g003
Figure 4. Rocking response of a URM block.
Buildings 11 00296 g004
Figure 5. Sequence of the rocking of a block and stress field in various positions (von Mises stress field in kPa): (a) inclined initial (t = 0); (b) equilibrium (t = T/4); (c) equilibrium-beginning of new rotation inclined opposite (t = T/4); (d) opposite inclination (t = T/2); (e) equilibrium (t = 3T/4); and (f) initial (t = T).
Buildings 11 00296 g005aBuildings 11 00296 g005b
Figure 6. Comparison of the rocking response of URM blocks: rigid and elastic blocks.
Buildings 11 00296 g006
Figure 7. Simulation of the generic tower and stresses in kPa: (a) gravity loads, and (b) collapse.
Buildings 11 00296 g007
Figure 8. Variation of the rocking max displacement at the top for varying effective material properties.
Buildings 11 00296 g008
Figure 9. Seismic recordings in terms of spectral displacement and spectral acceleration (modal damping ζ = 5%).
Buildings 11 00296 g009
Figure 10. FE models of the case-study towers; results for gravity loads (von Mises stress) in kPa: (a) Caracallou, (b) Koutloumousiou, (c) Vatopedi, (d) Philotheou, (e) Protaton, (f) Dionysiou, (g) Xenophontos, and (h) Iveron.
Buildings 11 00296 g010
Figure 11. Collapse mechanism of the case-study towers (von Mises stress in kPa): (a) Caracallou, (b) Koutloumousiou, (c) Vatopedi, (d) Philotheou, (e) Protaton, (f) Dionysiou, (g) Xenophontos, and (h) Iveron.
Buildings 11 00296 g011
Figure 12. Spectral capacity curves (in black from the IDA, in red from the limit analysis): (a) Caracallou, (b) Koutloumousiou, (c) Vatopedi, (d) Philotheou, (e) Protaton, (f) Dionysiou, (g) Xenophontos, and (h) Iveron.
Buildings 11 00296 g012aBuildings 11 00296 g012b
Figure 13. The definition of the limit states on the capacity curve for Protaton bell-tower and Northridge earthquake.
Buildings 11 00296 g013
Figure 14. Fragility curves: (a) Caracallou, (b) Koutloumousiou, (c) Vatopedi, (d) Philotheou, (e) Protaton, (f) Dionysiou, (g) Xenophontos, and (h) Iveron.
Buildings 11 00296 g014aBuildings 11 00296 g014b
Figure 15. Fragility curves: (a) towers, (b) campaniles (small openings’ area), and (c) campaniles (large openings’ area).
Buildings 11 00296 g015
Table 1. Architectural characteristics of the case-study towers.
TowerTotalBelfryWallArea (m2)Slenderness
Height (m)Thickness (m)
Caracallou27.75No1.5281.003.08
Koutloumousiou26.90No1.1528.095.08
Vatopaidion25.55Yes0.8520.255.68
Philotheou24.90Yes1.0530.254.53
Protaton24.00Yes0.8520.255.33
Dionysiou23.16No1.2549.003.31
Iveron20.52Yes1.0545.003.06
Xenophontos19.50Yes1.0549.002.79
Table 2. Variation of material properties.
Νο.fm(MPa)fb(MPa)fk(MPa)E(GPa)
11703.911.96
211005.022.51
31854.482.24
411155.542.77
511306.043.02
61.5704.422.21
71.5955.472.74
81.51106.073.03
92755.062.53
102855.522.76
112955.972.98
122654.572.29
Table 3. Grouping of towers with similar characteristics.
Group 1: TowersGroup 2: Campaniles (Small Openings’ Area)Group 3: Campaniles (Large Openings’ Area)
DionysiouVatopediIveron
CaracallouPhilotheouProtaton
KoutloumousiouXenophontos-
Publisher’s Note: MDPI stays neutral with regard to jurisdictional claims in published maps and institutional affiliations.

