Article

Numerical Simulations of the Seismic Response of a RC Structure Resting on Liquefiable Soil

by
Saif Alzabeebee
1 and
Davide Forcellini
2,*
1
Department of Roads and Transport Engineering, University of Al-Qadisiyah, Al-Diwaniyah 54004, Al-Qadisiyah, Iraq
2
Department of Civil and Environmental Engineering, University of San Marino, 99 Via Consiglio dei Sessanta, 47899 Serravalle, San Marino
*
Author to whom correspondence should be addressed.
Buildings 2021, 11(9), 379; https://doi.org/10.3390/buildings11090379
Submission received: 6 August 2021 / Revised: 22 August 2021 / Accepted: 23 August 2021 / Published: 25 August 2021
(This article belongs to the Special Issue Seismic Performance of New-Designed and Existing RC Buildings)

Abstract

:
The seismic response of buildings resting on liquefiable soil is a complex problem that is still poorly understood despite numerous studies on the topic. This paper attempts to enhance the understanding of this phenomenon by simulating an RC structure resting on liquefiable soil and subjected to seismic shakes. The solid-fluid fully coupled analysis was conducted with OpenSeesPL utilizing 58 earthquake records to simulate a wide range of shaking scenarios. In addition, the effect of the soil density and the thickness of the liquefiable layer were examined. It was noted that the liquefaction-induced settlement of the building increased as peak ground acceleration (PGA) increased, where the percentage increase ranged between 2.5% and 888.0% depending on the soil density, thickness of the liquefiable layer, PGA and the predominant frequency of the seismic shake. However, a scatter of the relationship between the PGA and the liquefaction-induced settlement was also noted due to the effect of the predominant frequency of the seismic shake. In addition, a reduced effect from soil density on the liquefaction-induced settlement was observed, where the settlement changed by up to 55% as the soil density changed from loose to medium, and by 68% as the density changed from loose to dense. Additionally, the results of the lateral displacement of the building did not show a definite trend with the increase in PGA, which could be attributed to the complex interaction between PGA amplification and the predominant frequency of the seismic shake as the liquefiable soil layer thickness changed.

1. Introduction

Evidence from past earthquakes has demonstrated the devastating effect of soil liquefaction on the seismic response of buildings. Thus, the response of buildings resting on liquefiable ground and subjected to earthquake effects has received considerable attention in the literature in order to produce better insights into the potential seismic response of buildings and hence to enhance design procedures [1,2,3,4,5,6,7,8,9,10,11]. A summary of information from previous studies is listed in Table 1.
Dashti et al. [1] reported the results of three centrifuge experiments involving a building resting on liquefiable soil and subjected to earthquake effects. Two thicknesses of the liquefiable layer (3 m and 6 m) were considered in these experiments, with two relative densities of the liquefiable layer (40% and 50%). Karamitros et al. [2,3] studied the liquefaction-induced settlement due to earthquake effects using two-dimensional (2D) and three-dimensional (3D) finite difference methods (FDM). Karamitros et al. [4] investigated the effect of liquefaction on the degradation of bearing capacity. Karamitros et al. [4] also used 2D and 3D FDM in their study. Bertalot and Brennan [5] studied the effects of the thickness of the liquefiable layer and building load on the seismic settlement induced due to liquefaction. In their laboratory centrifuge experiments, they simulated only the applied load (the building was not modelled) by considering four values for building load: 30, 60, 90 and 120 kPa. They noticed that increasing the building load up to 100 kPa increased the liquefaction-induced seismic settlement, while the settlement either stabilized or decreased beyond this load. Dimitriadi et al. [6] applied 2D FDM to study the seismic performance of a foundation resting on a non-liquefiable permeable layer followed by a liquefiable layer. The study focused on the influence of the permeability of the non-liquefiable layer. Dimitriadi et al. [7] assessed the effect of an artificially placed ground layer (ground improvement) on the seismic response of a foundation resting on liquefiable ground, using 2D FDM. They paid significant attention to the role of thickness and the width of the placed layer on the seismic response of the foundation. Alzabeebee [8] collected data on liquefaction-induced settlements obtained from centrifuge modelling and developed a data-driven model to estimate the liquefaction-induced settlements using several parameters, such as the relative density of the ground, cumulative absolute velocity of the earthquake record, building load, width and height of the building, and thickness of the liquefiable and non-liquefiable layers below the building. Chaloulos et al. [9] studied the performance of residential buildings subjected to a seismic effect induced due to gas exploration. The effect of liquefaction has been considered in the analyses as the authors used a PM4Sand soil model, which is a soil model able to simulate soil liquefaction. Forcellini [10] conducted 3D finite element analyses to evaluate the response of a building resting on potentially liquefiable ground by changing the height and weight of the building. Qi and Knappett [11] studied the influence of soil permeability on the performance of isolated and adjacent buildings using centrifuge modelling. Low (1.35 × 10⁻⁴ m/s) and high permeability (5.40 × 10⁻³ m/s) were considered in the investigations. In addition, light buildings (with applied stress of 50 kPa) and heavy buildings (with applied stress of 62 kPa) were also considered.
It is worth noting that the previous studies aimed to assess the response of buildings resting on liquefiable ground by simulating a small range of earthquake records and without considering the influence of the thickness of the liquefiable layer combined with the relative density of the soil. In addition, some of the previous studies did not simulate the whole building and concentrated only on the foundation. Furthermore, there are limited studies on the liquefaction-induced lateral displacement of buildings, although extensive damages have been reported in the literature due to lateral displacement [12]. Thus, to fill these gaps, this study was focused on the response of a reinforced concrete (RC) building resting on liquefiable ground and subjected to earthquake effects with the following considerations:
  • Simulating the real structure of the building to facilitate better insight into liquefaction effects on the response of the building.
  • Considering a wide range of scenarios by performing numerical analyses with different earthquake records.
  • Studying the role of the thickness of the liquefiable layer combined with the relative density of sand on the settlement and lateral displacement of the building.
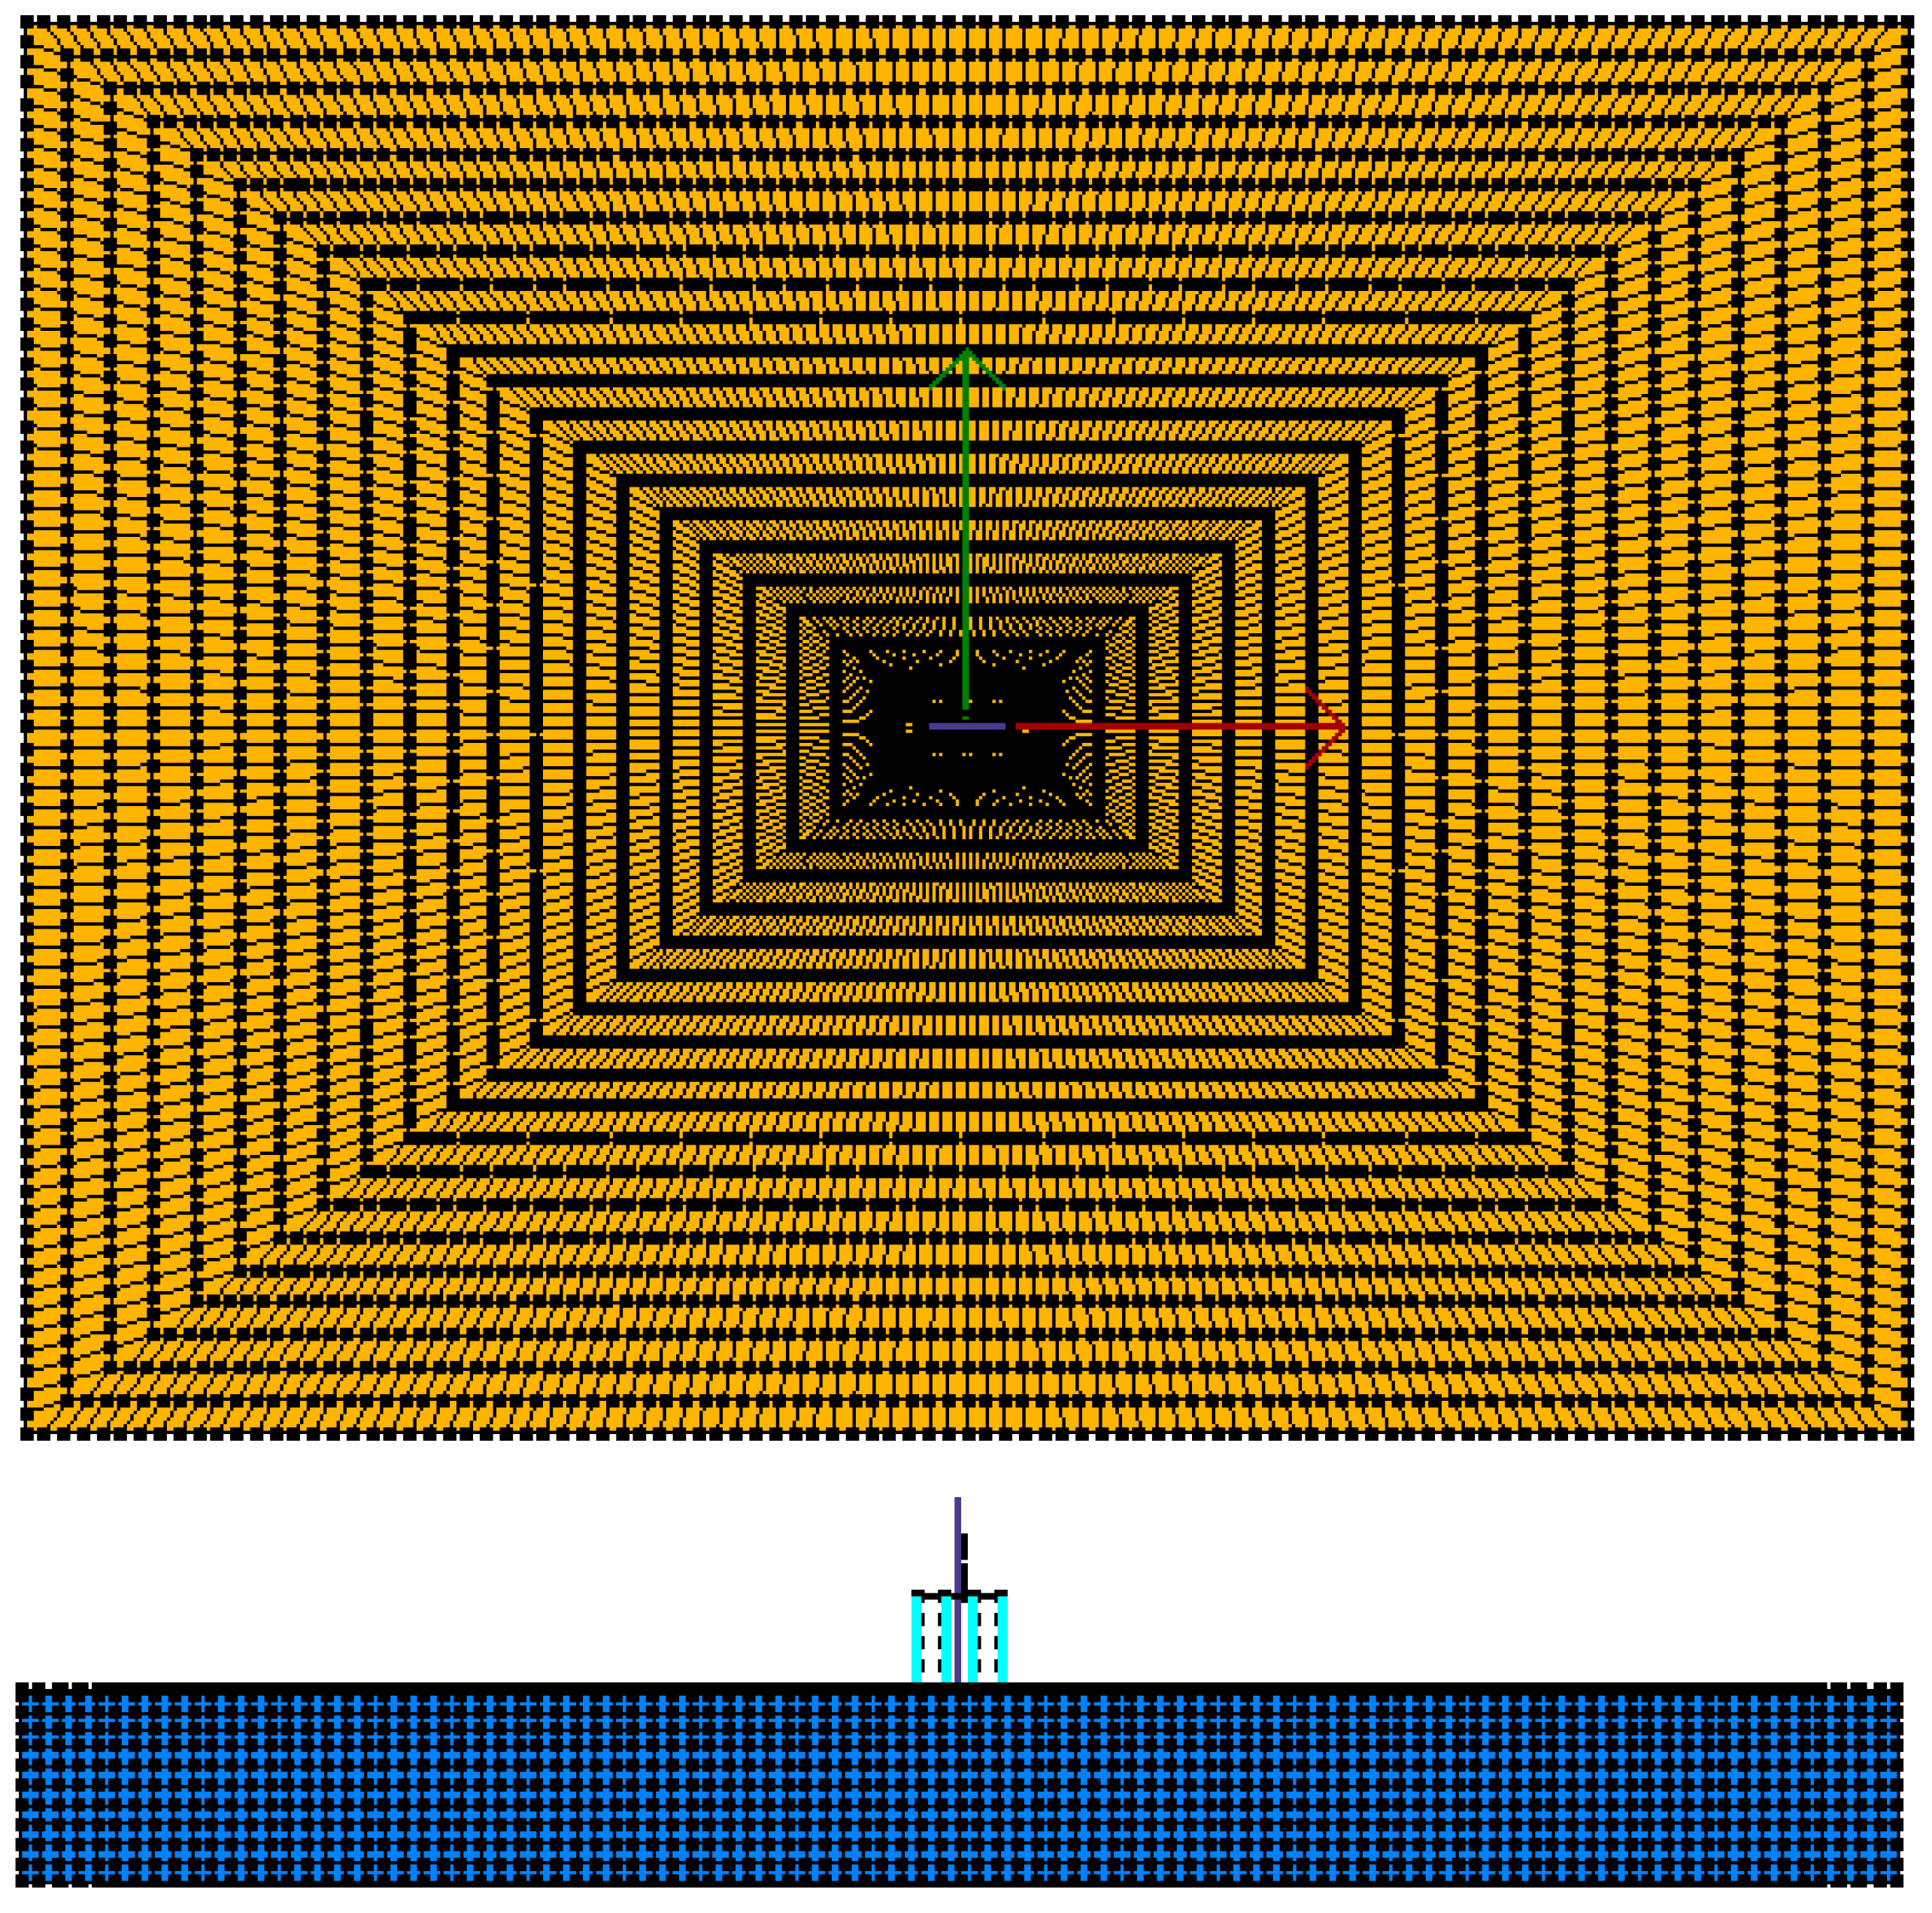
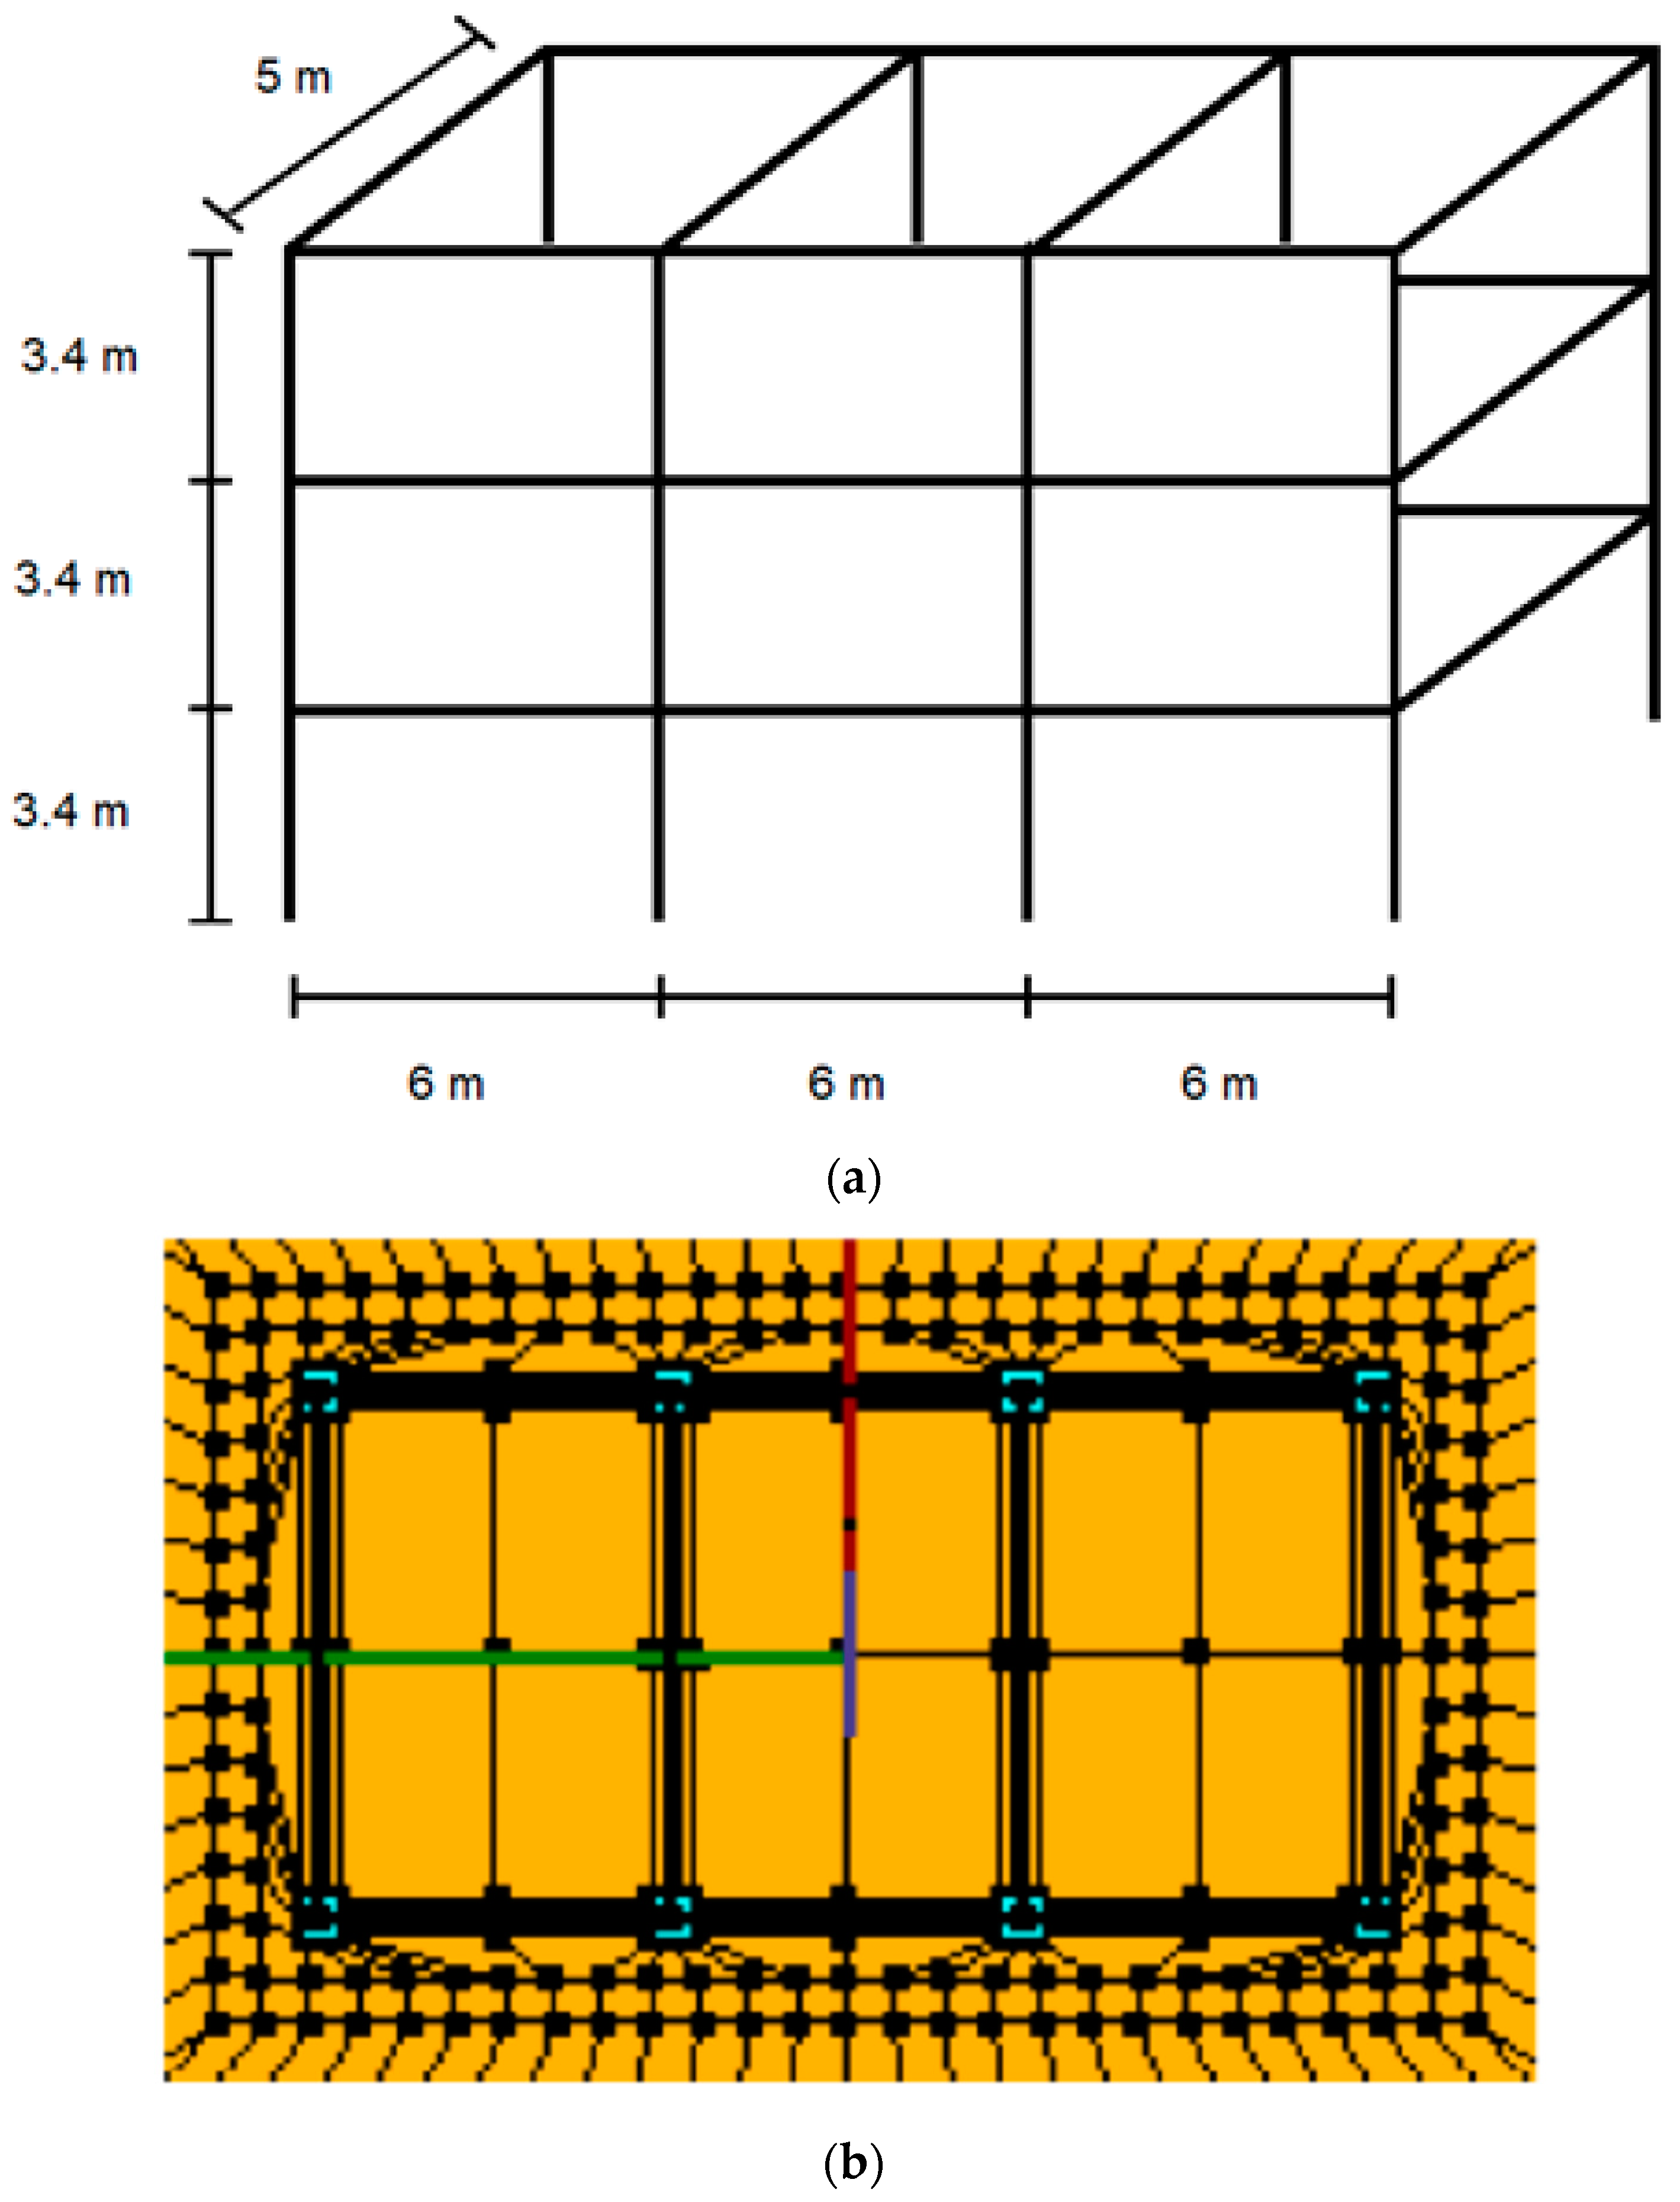
The paper is organized into 6 sections. The details of the numerical models are presented and discussed in Section 2. Section 3 clarifies the choice of the earthquakes applied in the study, while Section 4 shows the characteristics of the soils. Results are shown and discussed in Section 5, followed by the conclusions in Section 6.

2. Numerical Model

The numerical simulations were performed with OpenSeesPL (open-source computational platform), which is an open-source software package developed by the Pacific Earthquake Engineering Research (PEER) centre [13]. Tridimensional soil meshes (120 × 150 m) were described with BrickUP elements (total number: 7992), built up with isoparametric 8-nodes (total number: 10345) and calibrated with a convergence procedure that allowed modelling an infinite domain. These elements allowed consideration of both the displacements (longitudinal, transversal and vertical: degree of freedom: 1, 2 and 3) and the pore pressure (degree of freedom: 4) to simulate the dynamic response of a solid-fluid fully coupled material. In order to investigate the important role of layer thickness in enhancing SSI mechanisms, this study considered the most detrimental depths of the superficial layers: 5 m, 10 m, and 20 m. The dimensions of the elements inside the mesh followed the previous contributions of Forcellini [10,14]. Furthermore, the performance of the lateral boundaries was verified by comparing the accelerations at the top of the mesh with those obtained under free field (FF) conditions to reproduce wave mechanisms. Mesh discretization was derived considering 100 m/s as the lowest soil shear wave velocity and 10 Hz as the maximum frequency. In particular, the maximum element size was calculated by dividing the maximum wavelength by 25, to account for soil softening [10,14]. Particular attention was paid to the boundary conditions by applying absorbing boundaries at the base to dissipate the radiating waves. In addition, the base nodes were set free to move along the longitudinal and transversal directions to model the elastic half-space below the mesh. Vertical direction was modelled as fixed. Moreover, the lateral nodes were constrained to simulate pure shear by applying period boundaries and to ensure free field conditions. At the lateral nodes, the penalty method (tolerance = 10−4) was adopted to avoid problems with equation system conditions [15,16]. In addition, the soil deposit was simulated using the multi-surface plasticity constitutive model [17].
Shallow foundations were considered (slab dimensions: 28.4 m × 34.4 m, 0.5 m) in order to represent the typology most vulnerable to earthquakes, since its strength depends only on contact pressures, without frictional resistance (as it occurs for pile foundations). The rigid concrete slab was modelled by applying equal degrees of freedom to connect the nodes at the base of the columns with those of the soil domain [18]. In order to simulate the interface between the columns and the slab, horizontal rigid links were defined, following Forcellini [10,16]. The foundation slab was modelled elastically with an equivalent material that simulated concrete. The pressure-independent multi-yield (PIMY) model was implemented [13] with the properties shown in Table 2. The design of the foundation consisted in assessing the eccentricity for the most severe condition: minimum vertical loads (gravity and seismic loads) and maximum bending moments.
The benchmark reinforced concrete structure was calibrated to be representative of a residential 3-storey concrete building with three floors (3.4 m each, total height: 10.2 m), 4 columns in longitudinal direction (6 m spaced) and 2 columns in transversal direction (5 m spaced). The columns and the beams were modelled with elastic beam column elements using the properties shown in Table 3. The bearing pressure on the base of the foundation was calculated as 210 kPa. A simplified sketch of the modelled building is shown in Figure 1, vertical view (1a) and plan view (1b). It is worth noting that the dimensions were chosen to represent a recurrent structural scheme that may model typical residential buildings. In particular, the modelled structure needed to be considered a benchmark aimed at representing a class of buildings with similar characteristics.
The finite element analyses were performed by following the approach adopted in Forcellini [10,14] which consists of four steps. In the first step, the soil initial stresses were calculated by considering linear properties (weight, shear and bulk modulus). The hydraulic conditions were applied in step 2, by concentrating the water pressures on the 4th degree of freedom (DOF). The structure and the associated loads were applied, and the properties of the soil were changed from elastic to plastic in step 3. Twenty-five load steps were deemed necessary to ensure numerical convergence. Finally, step 4 consisted of applying the input motion at the base of the soil mesh as acceleration time history with time steps of 0.01 s, as previously applied in the literature [10,14,19,20]. The NewtonLineSearch algorithm was used in the analyses of step 4 [18]. Figure 2 shows the finite element mesh of the cases modelled in this study.

3. Earthquake Records

Fifty-eight earthquake records from the PEER NGA database [21] were employed in the analyses to study the effect of different earthquakes on the response of the RC building. They were chosen in order to represent several intensities and to reproduce liquefaction for several historical earthquakes. In particular, Table 4 presents the name, station, duration, cumulative absolute velocity (CAV), and peak ground acceleration (PGA) for each record. Table 5 shows the statistical (minimum, maximum, average, and standard deviation) values of the duration, CAV, and PGA employed in the analyses.

4. Soil Properties

In order to consider the role of soil density on the liquefaction mechanisms and thus the performance of the building, several soil types were considered. Table 6 shows the parameters chosen for the performed soils: loose, medium, and dense Nevada sands. Such parameters were adopted by considering previous studies in the literature [22,23] in order to guarantee the development of liquefaction. It is worth noting that previous studies did not report soil density. Therefore, typical values (Table 6) were assumed in the analyses. However, the other soil parameters were developed in these previous studies using calibrations against real results of triaxial shear tests and filed measurements of different soil-structure interaction problems under both static and seismic conditions.

5. Results

This section investigates the effects of several parameters, such as earthquake intensity, thickness of the liquefiable layer, and density of the liquefiable layer on the maximum settlement and lateral displacement induced by liquefaction. Thus, this section is divided into two subsections in order to cover the liquefaction induced settlement firstly and then to focus on the liquefaction induced lateral displacement.
Before examining the effect of liquefaction in detail, the most efficient way to present the effect of earthquake intensity was investigated. In this regard, the relationships of the seismic settlement vs. the peak ground acceleration (PGA) and the seismic settlement vs. the cumulative absolute acceleration (CAV) were discussed. Figure 3a,b show the results of these comparisons for the case of a building resting on loose sand where the thickness of the liquefiable layer is equal to 5 m. It is worth noting that liquefaction-induced settlement increases with both PGA and CAV. However, the liquefaction-induced settlement-PGA relationship showed a better trend. In addition, the relationship of the liquefaction-induced settlement vs. PGA achieved a slightly higher coefficient of determination (R2) compared to the settlement-CAV relationship. Therefore, PGA was adopted in the rest of the paper as a measure of earthquake intensity. In particular, this obtained behaviour seems not to reflect the observations of Chaloulos et al. [9], who noticed a lower correlation between the liquefaction-induced settlement and PGA compared to the correlation between settlement and CAV. Karimi et al. [24] also suggested using CAV as a measure of the earthquake intensity. However, these previous studies a used limited number of records, whereas 58 earthquake records were employed in this study.

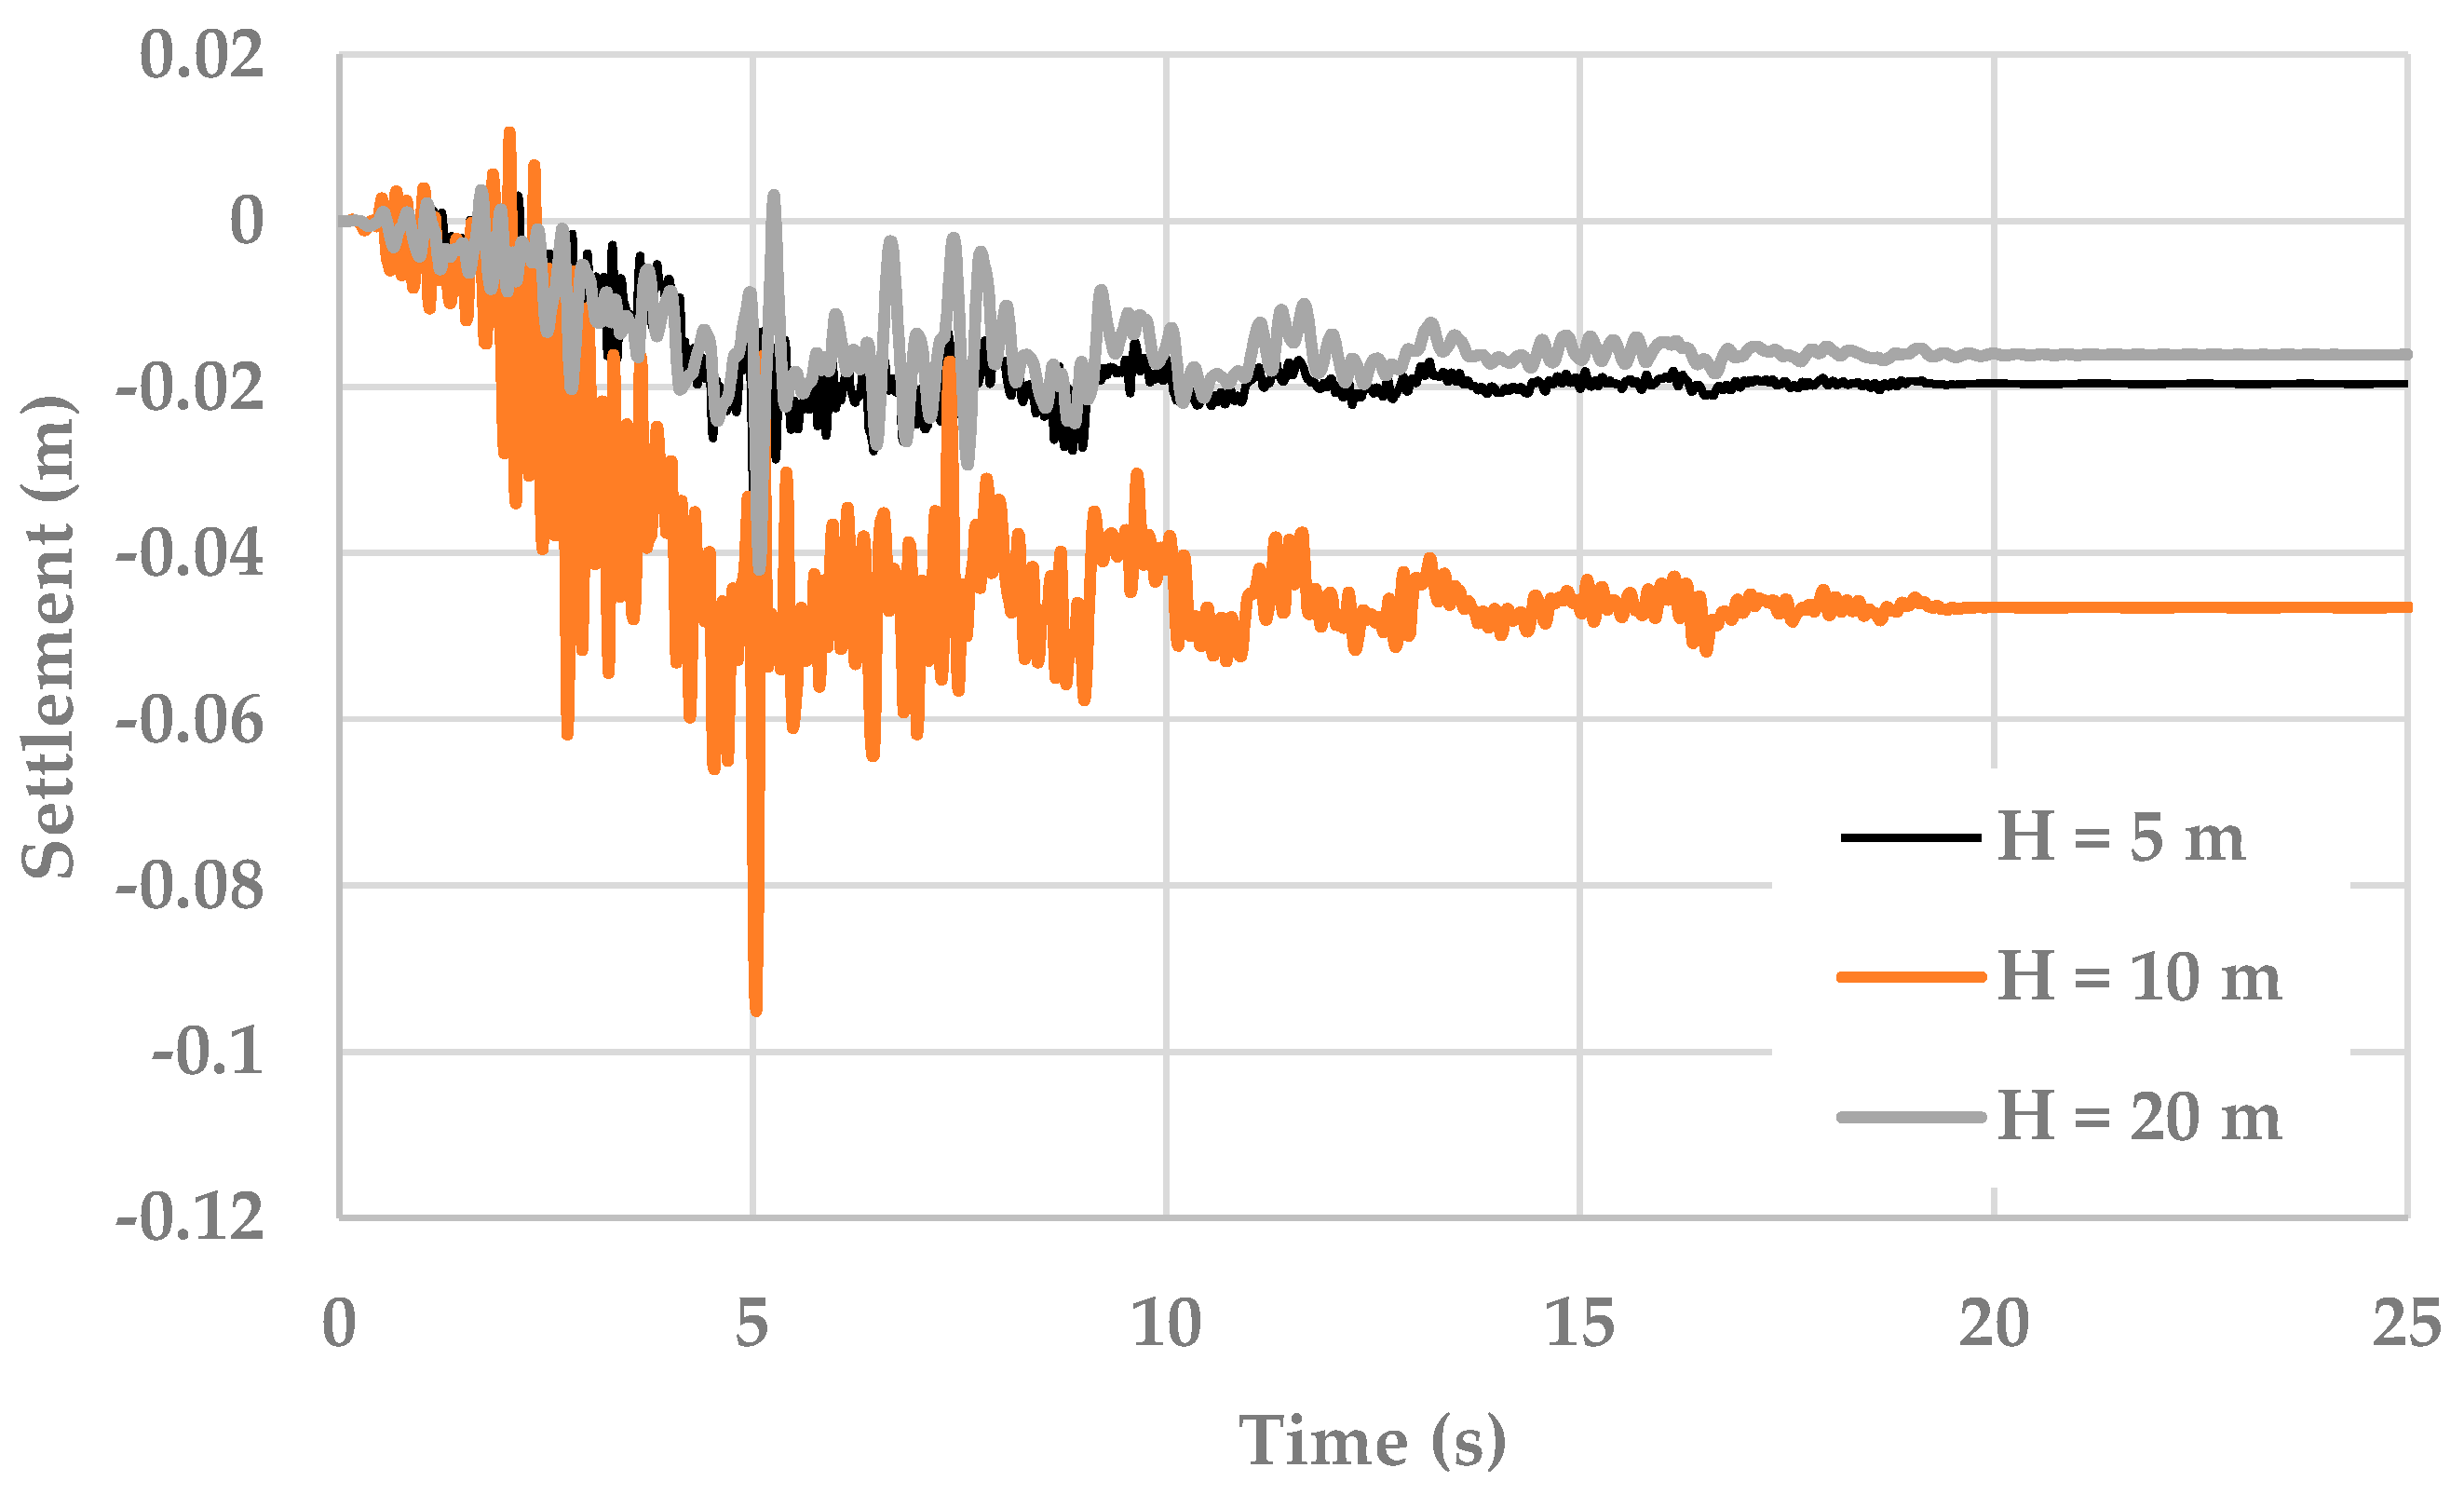
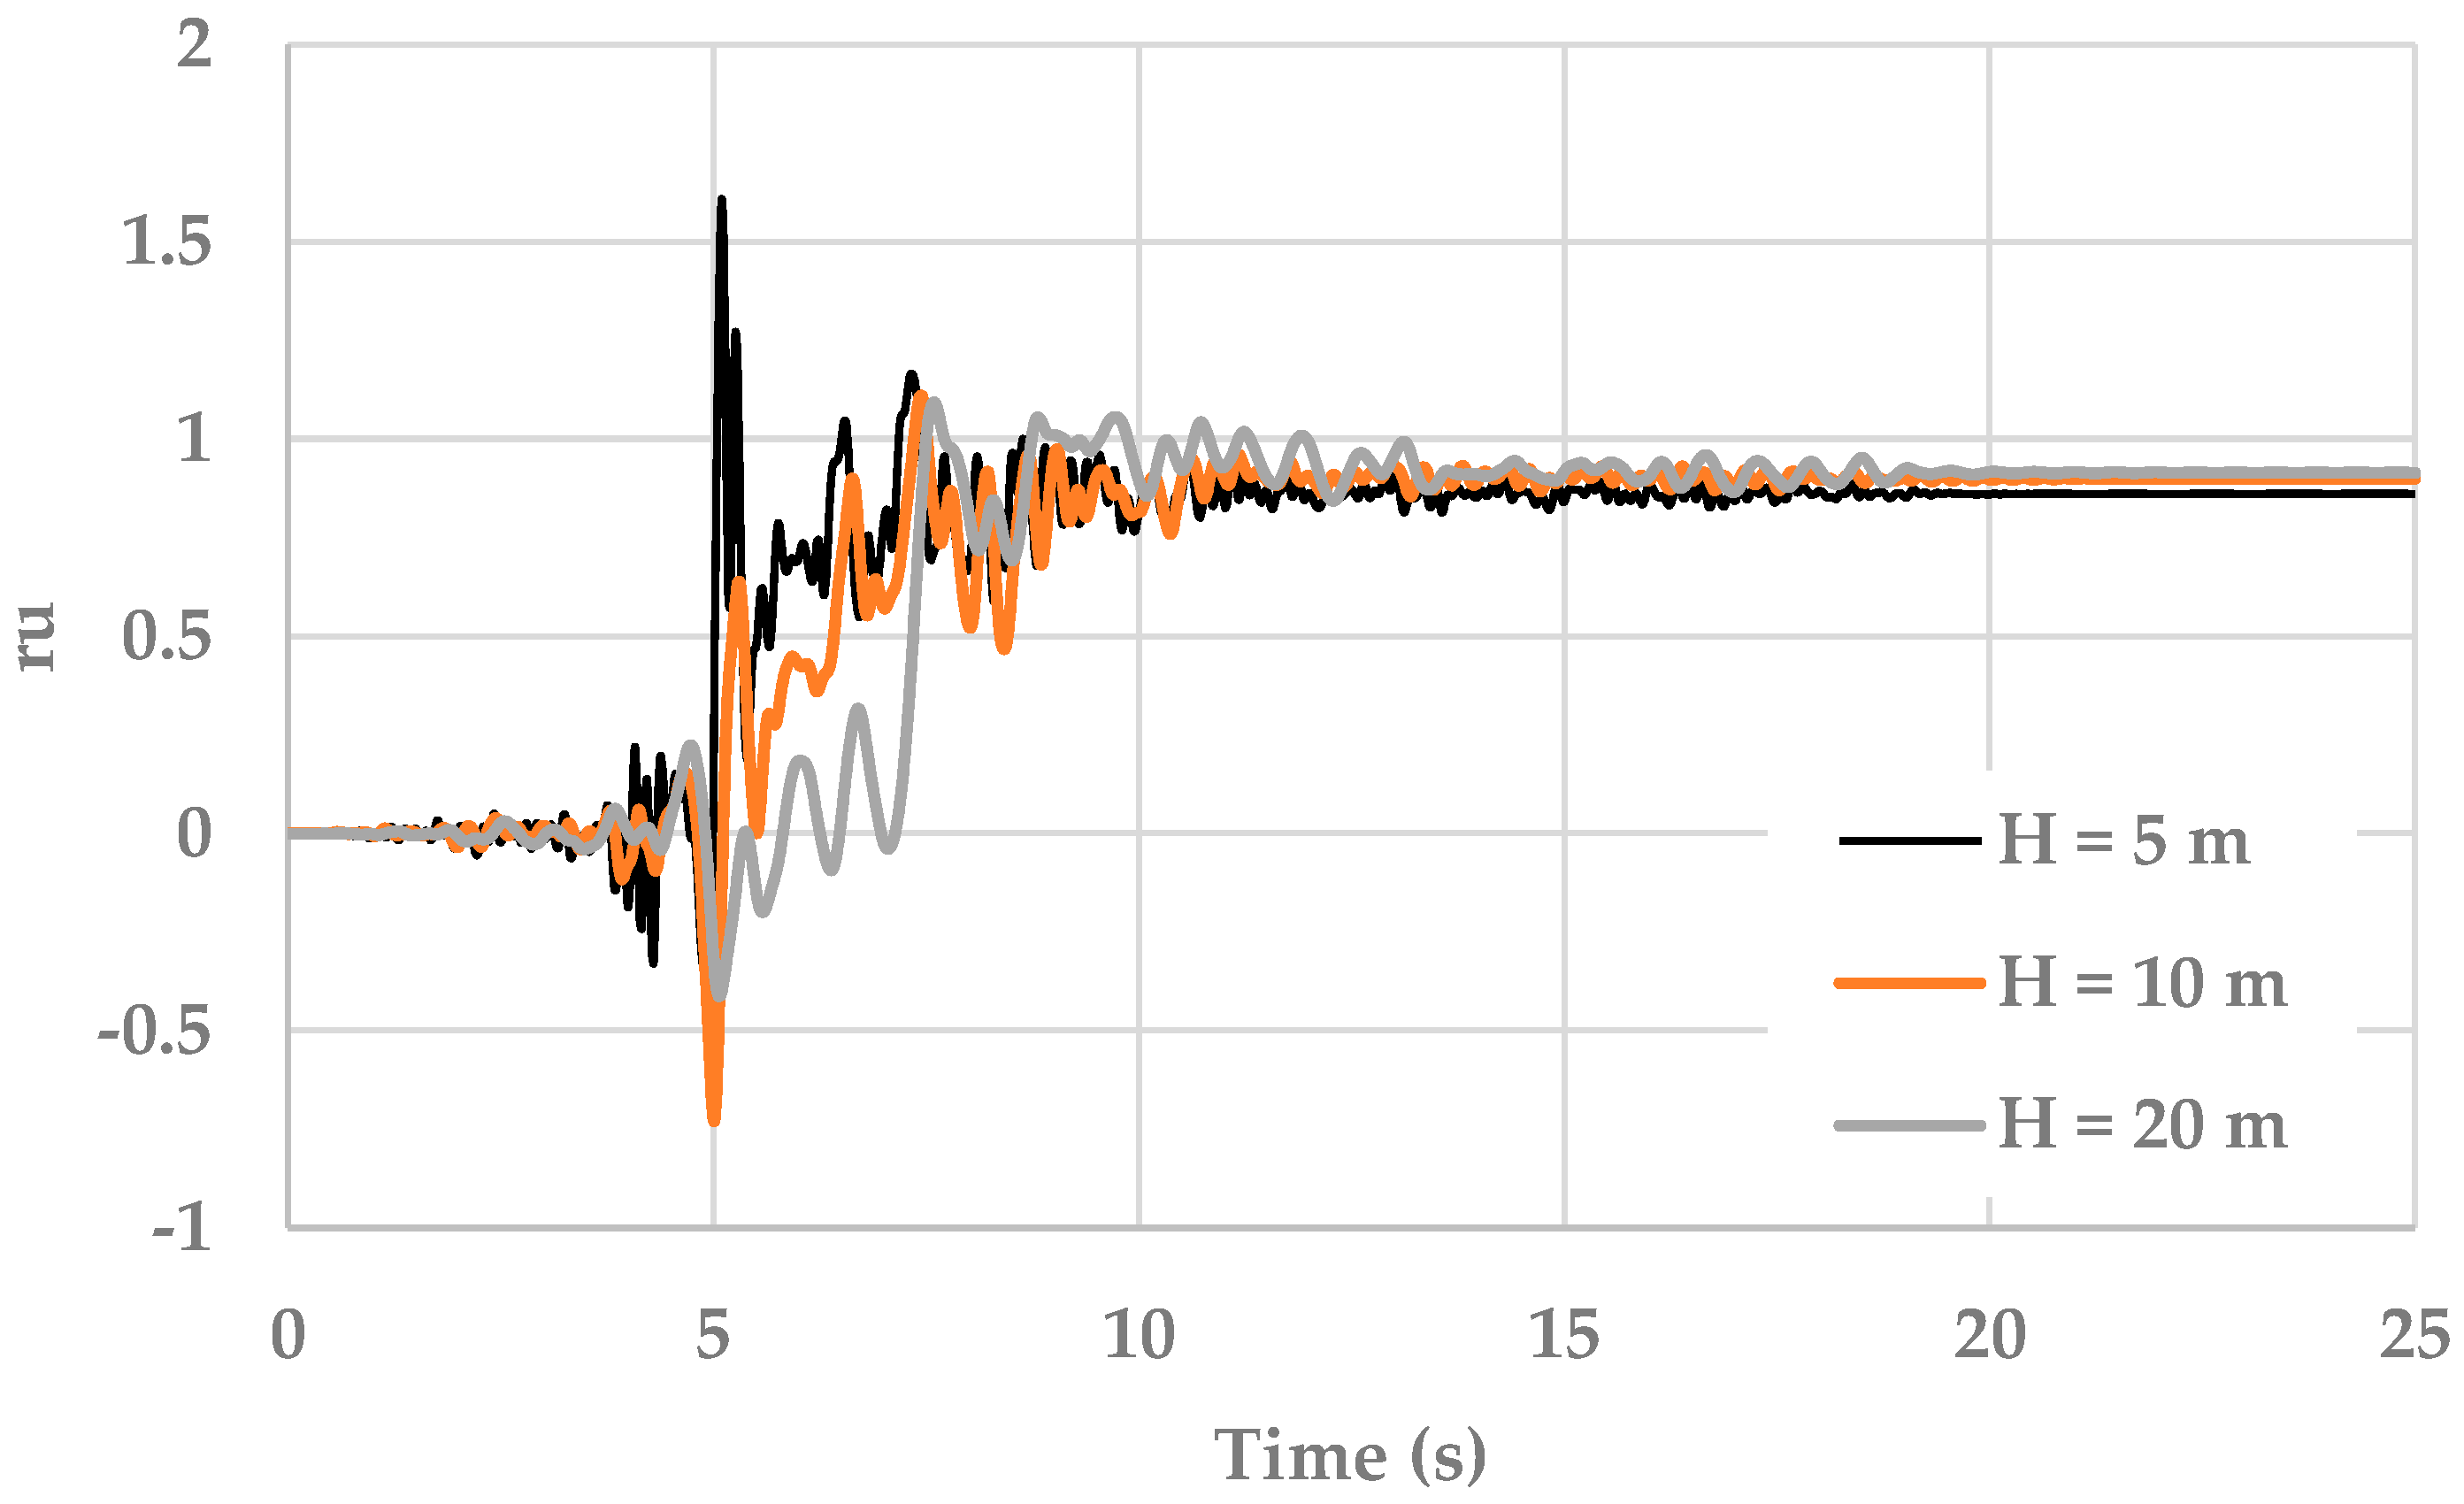
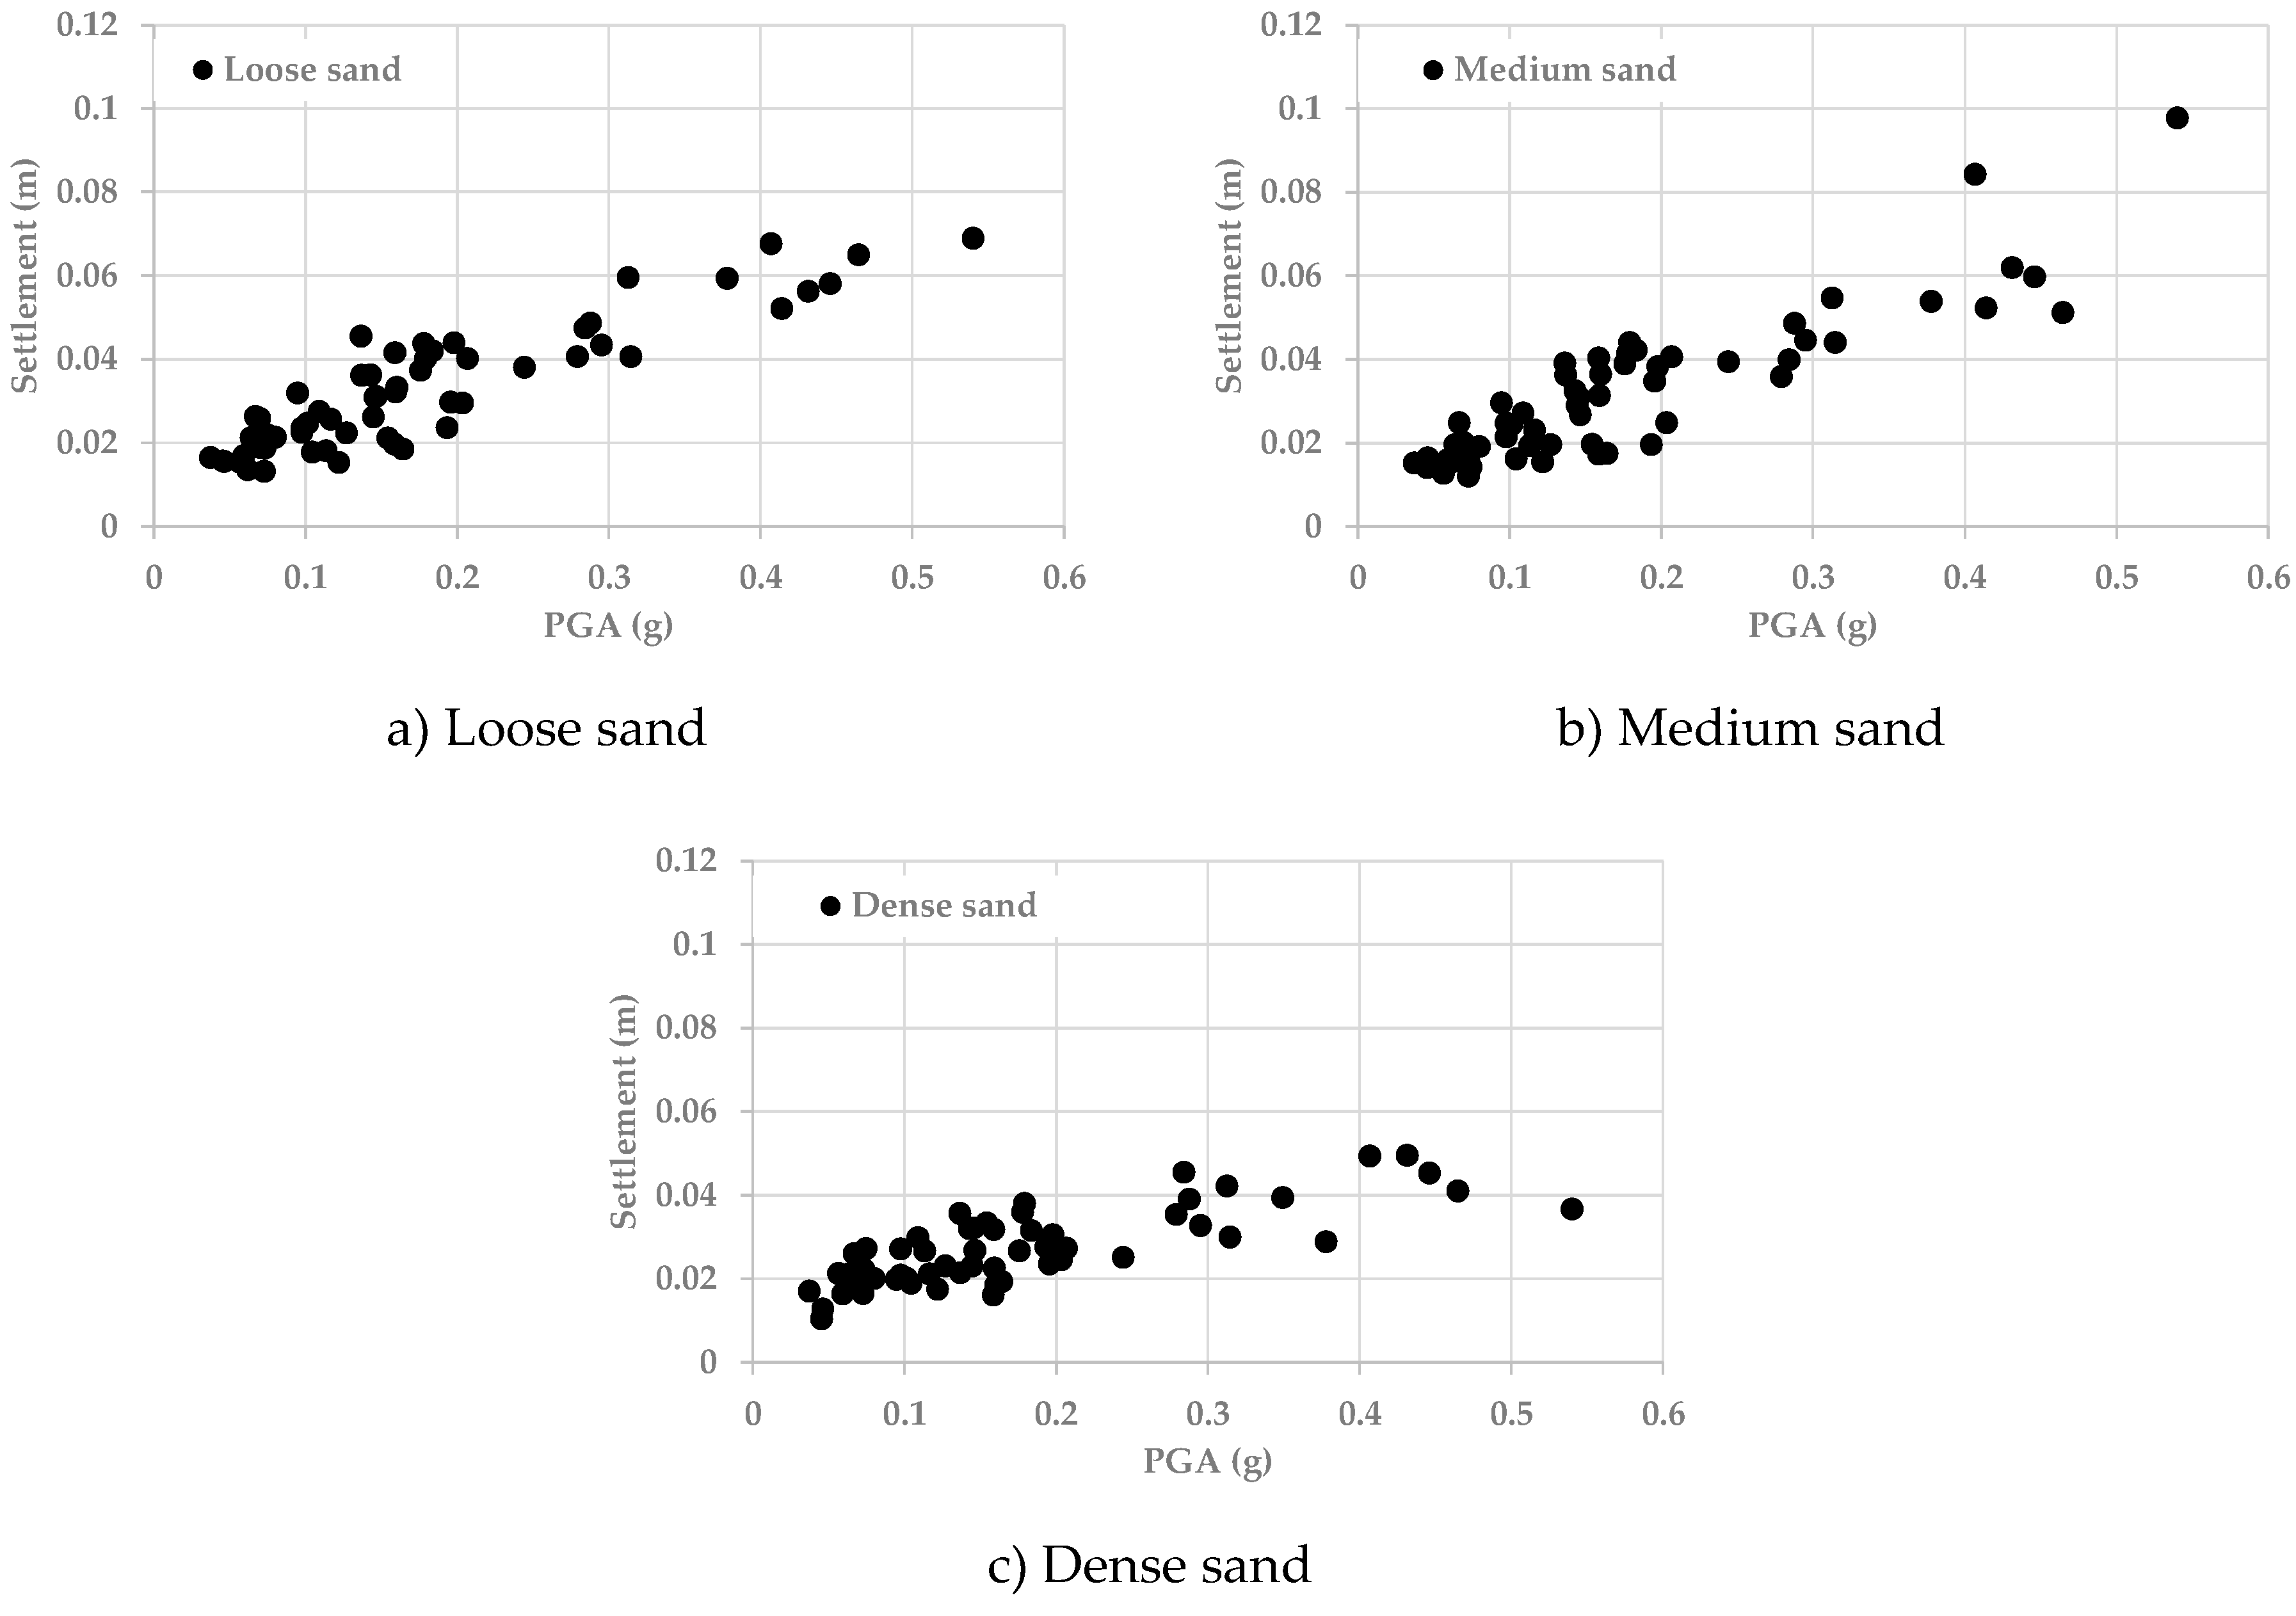
5.1. Seismic Settlement

Figure 4 shows an example of the effect of the thickness of the liquefiable layer on the developed liquefaction-induced seismic settlement with time for the RC structure resting on medium sand and subjected to input motion LOS. In addition, Figure 5 displays the associated pore water pressure ratio (ru) with time beneath the building (for the point located at the centre of the foundation) for medium sand and LOS input motion. It is evident from the results reported in Figure 4 that the settlement dramatically increases with time, then stabilizes. In addition, it is worth noting from Figure 4 that increasing the thickness of the liquefiable layer from 5 m to 10 m dramatically increases the settlement. However, the settlement then declines as the thickness rises from 10 m to 20 m. In addition, Figure 5 shows that the pore water pressure time history follows a similar trend (development followed by stabilization) to that of the settlement. However, the stabilized pore water pressure ratio is not significantly influenced by the change in thickness of the liquefiable layer. The stabilization of the settlement as time increases can be explained by the densification of the soil, which is caused by the seismic shake after a certain time and also due to stabilization of the pore water pressure.
Figure 6a–c show the effect of the earthquake intensity on the maximum liquefaction-induced settlement for loose, medium, and dense sand for the case of the RC structure resting on a 10 m base of liquefiable sand. In general, the trend for the relationship shows that increasing the PGA increases the seismic settlement for all soils used in the analyses. This obtained trend is due to the increase in the strain of the soil and the pore water pressure build-up as the earthquake intensity rises; these changes result in decreasing the stiffness of the soil, which in turn increases the settlement. Similar trends for settlement vs. the PGA were reported by Macedo [25] and Karimi et al. [24,26]. However, Karimi et al. [26] reported the effect of the earthquake intensity using the CAV. It is also clear from Figure 6a–c that the relationship of the settlement with the PGA is not monotonic, and some fluctuations can be noticed. This is due to the influence of the frequency range and the predominant frequency of the earthquake records employed in the analyses, as demonstrated in Alzabeebee [27]. In addition, comparison of the results of Figure 6a–c shows that the liquefaction-induced settlement slightly decreases for some cases and increase for other cases as the density of the liquefiable soil changes from loose to medium. This might be due to the combined effect of the predominant frequency, acceleration amplification, excess pore water pressure build-up, and soil densification. However, it is also evident that the liquefaction-induced settlement remarkably decreases in the case of dense sand, if compared with loose and medium sands.
Figure 7a–c show the effects of the thickness of the liquefiable layer on the obtained liquefaction-induced settlement for loose, medium, and dense sand, respectively. It is worth noting from Figure 7a,b that increasing the thickness of the liquefiable layer from 5 m to 10 m increases the liquefaction-induced settlement for loose and medium sands. However, increasing the thickness from 10 m to 20 m does not necessarily affect the settlement for both loose and medium sands. In addition, Figure 7c shows that the settlement increases as the thickness of the liquefiable layer increases from 5 m to 10 m, then decreases as the thickness further increases to 20 m. This behaviour is due to the complex interaction of the acceleration amplification and the thickness of the compressible layer, where the acceleration amplification declines as the thickness of the soil layer increases; however, increasing the thickness of the soil layer also means increasing the compressibility. In addition, soil amplification and pore water pressure build-up significantly influence the stiffness of the liquefiable layer, which in turn affects the obtained settlement. It is also worth noting that the role of the thickness of the compressible soil also has been demonstrated by Alzabeebee [27] for dry sand.
Overall, it is evident that the results are motion-dependent, since it is hard to define a unique trend among the applied earthquake records as there are many factors that control the behaviour of this complex soil-structure interaction system at the same time.

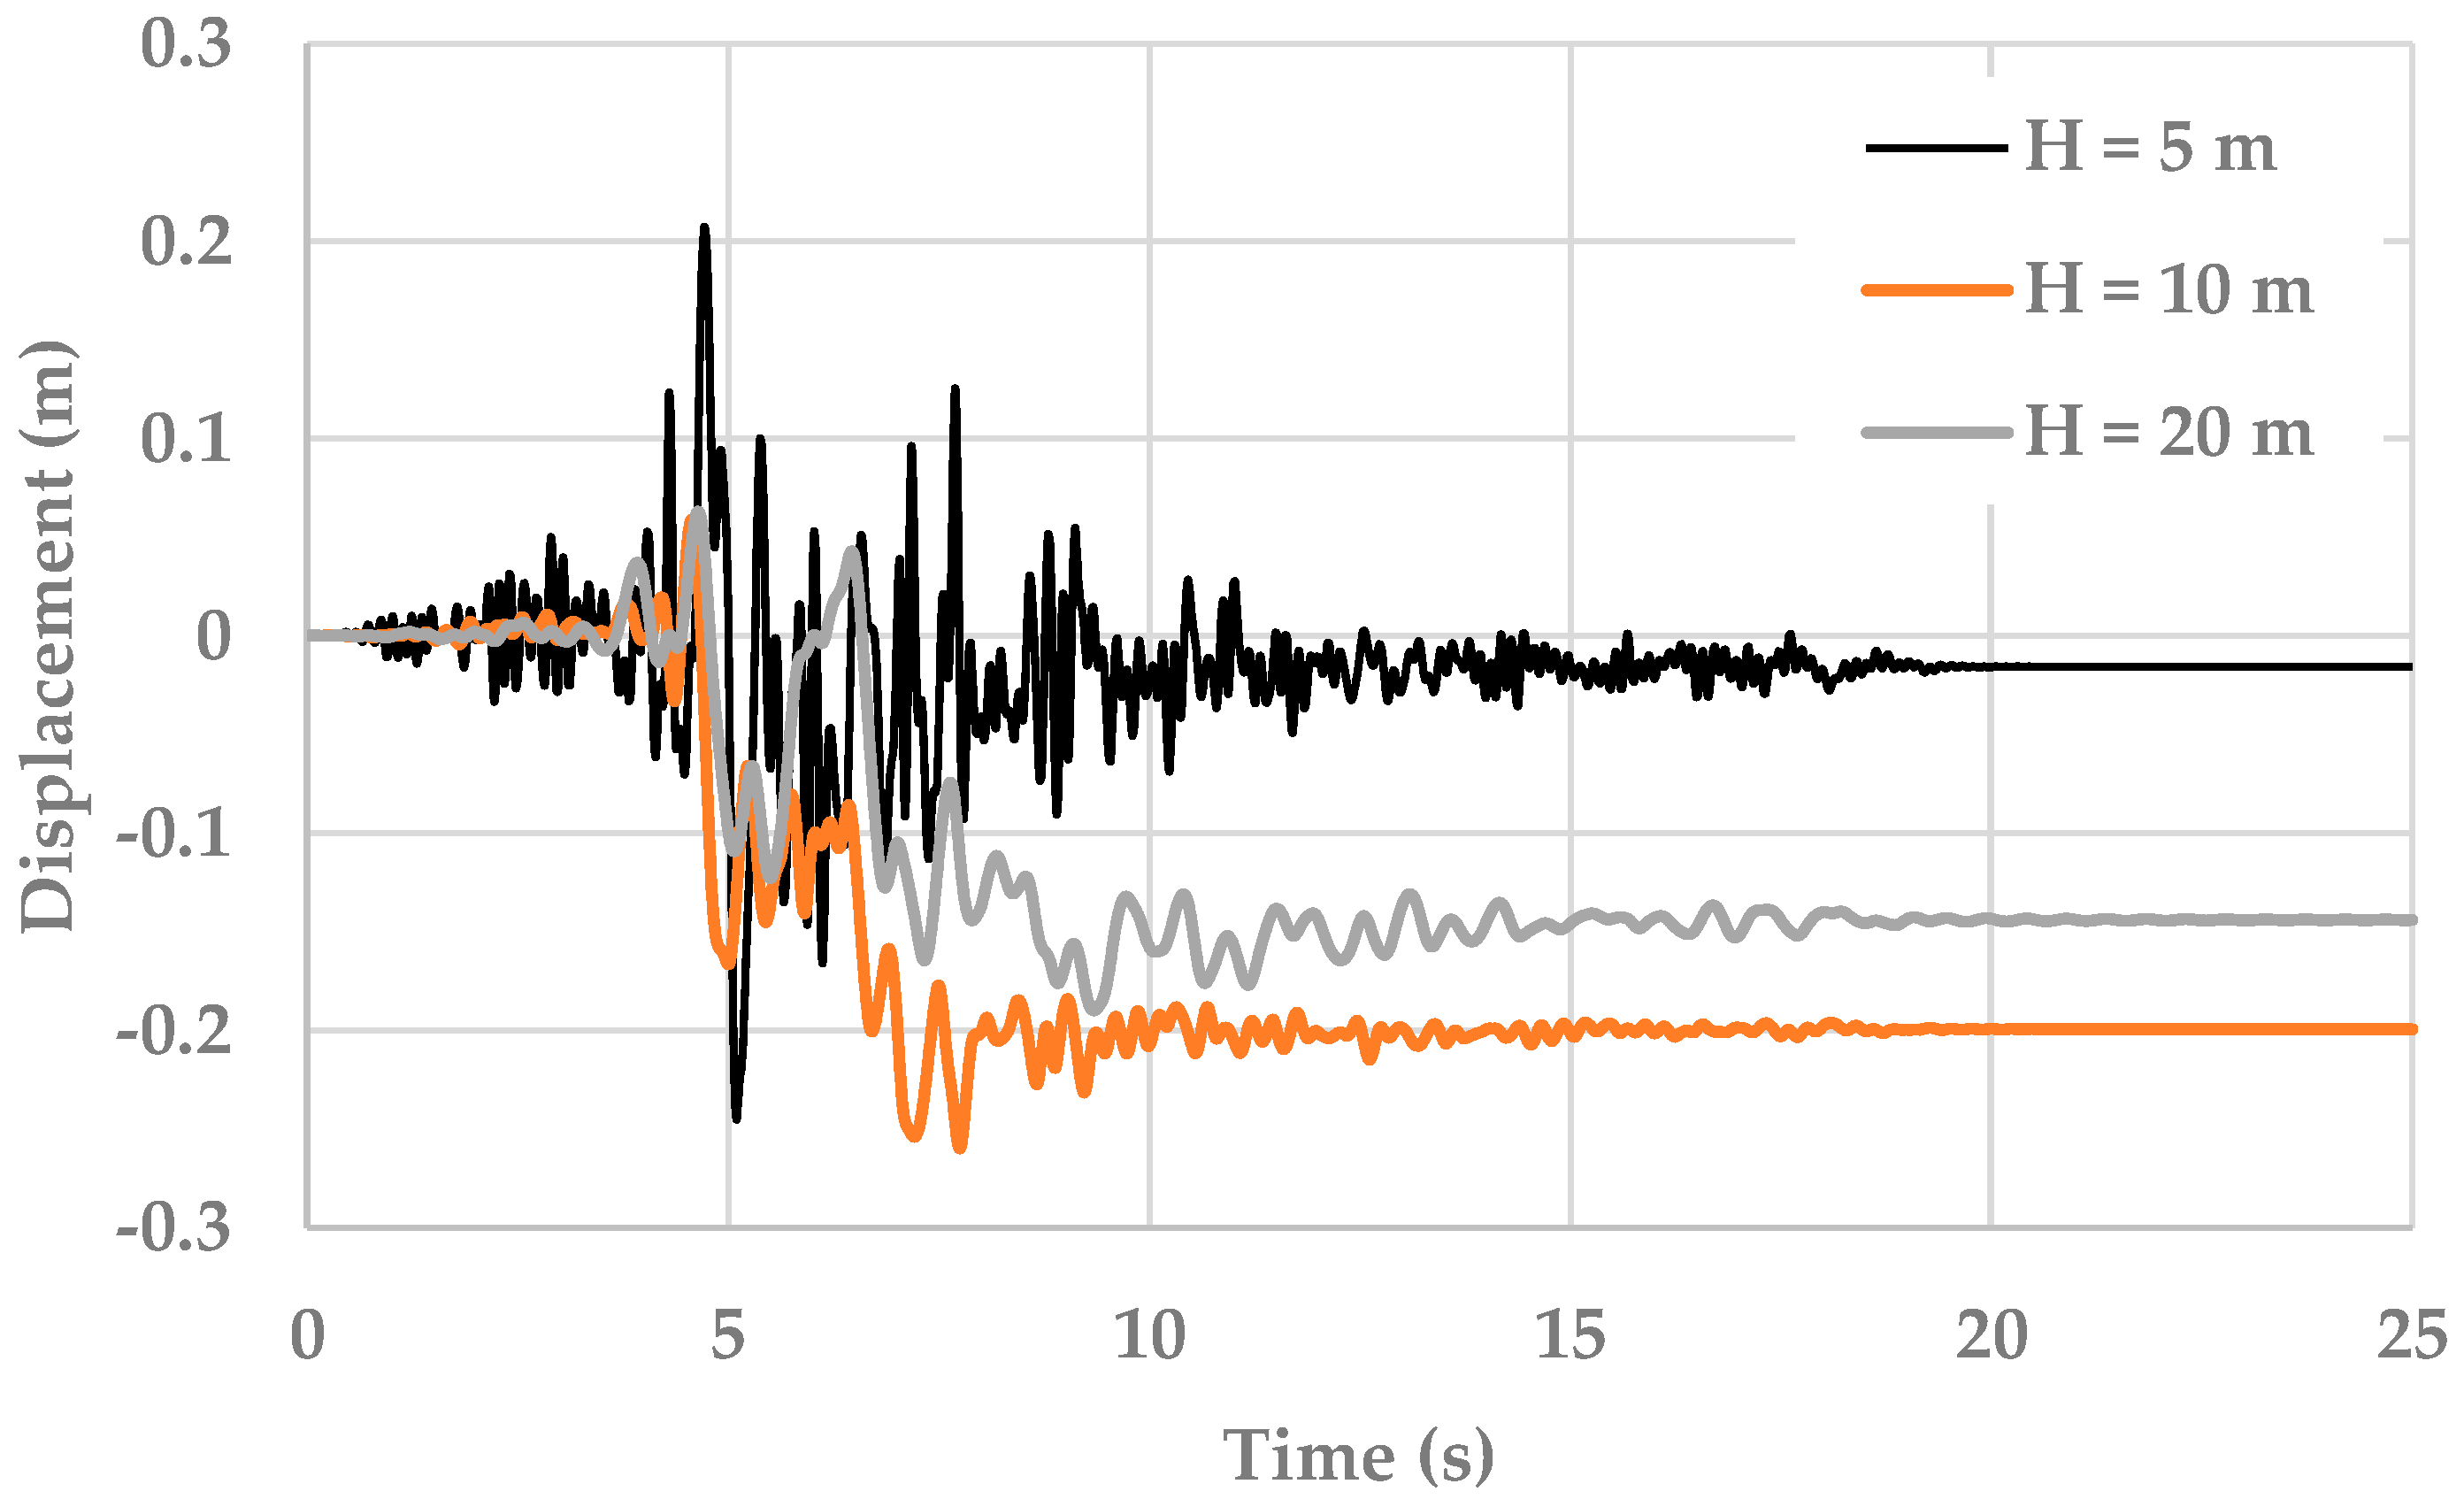
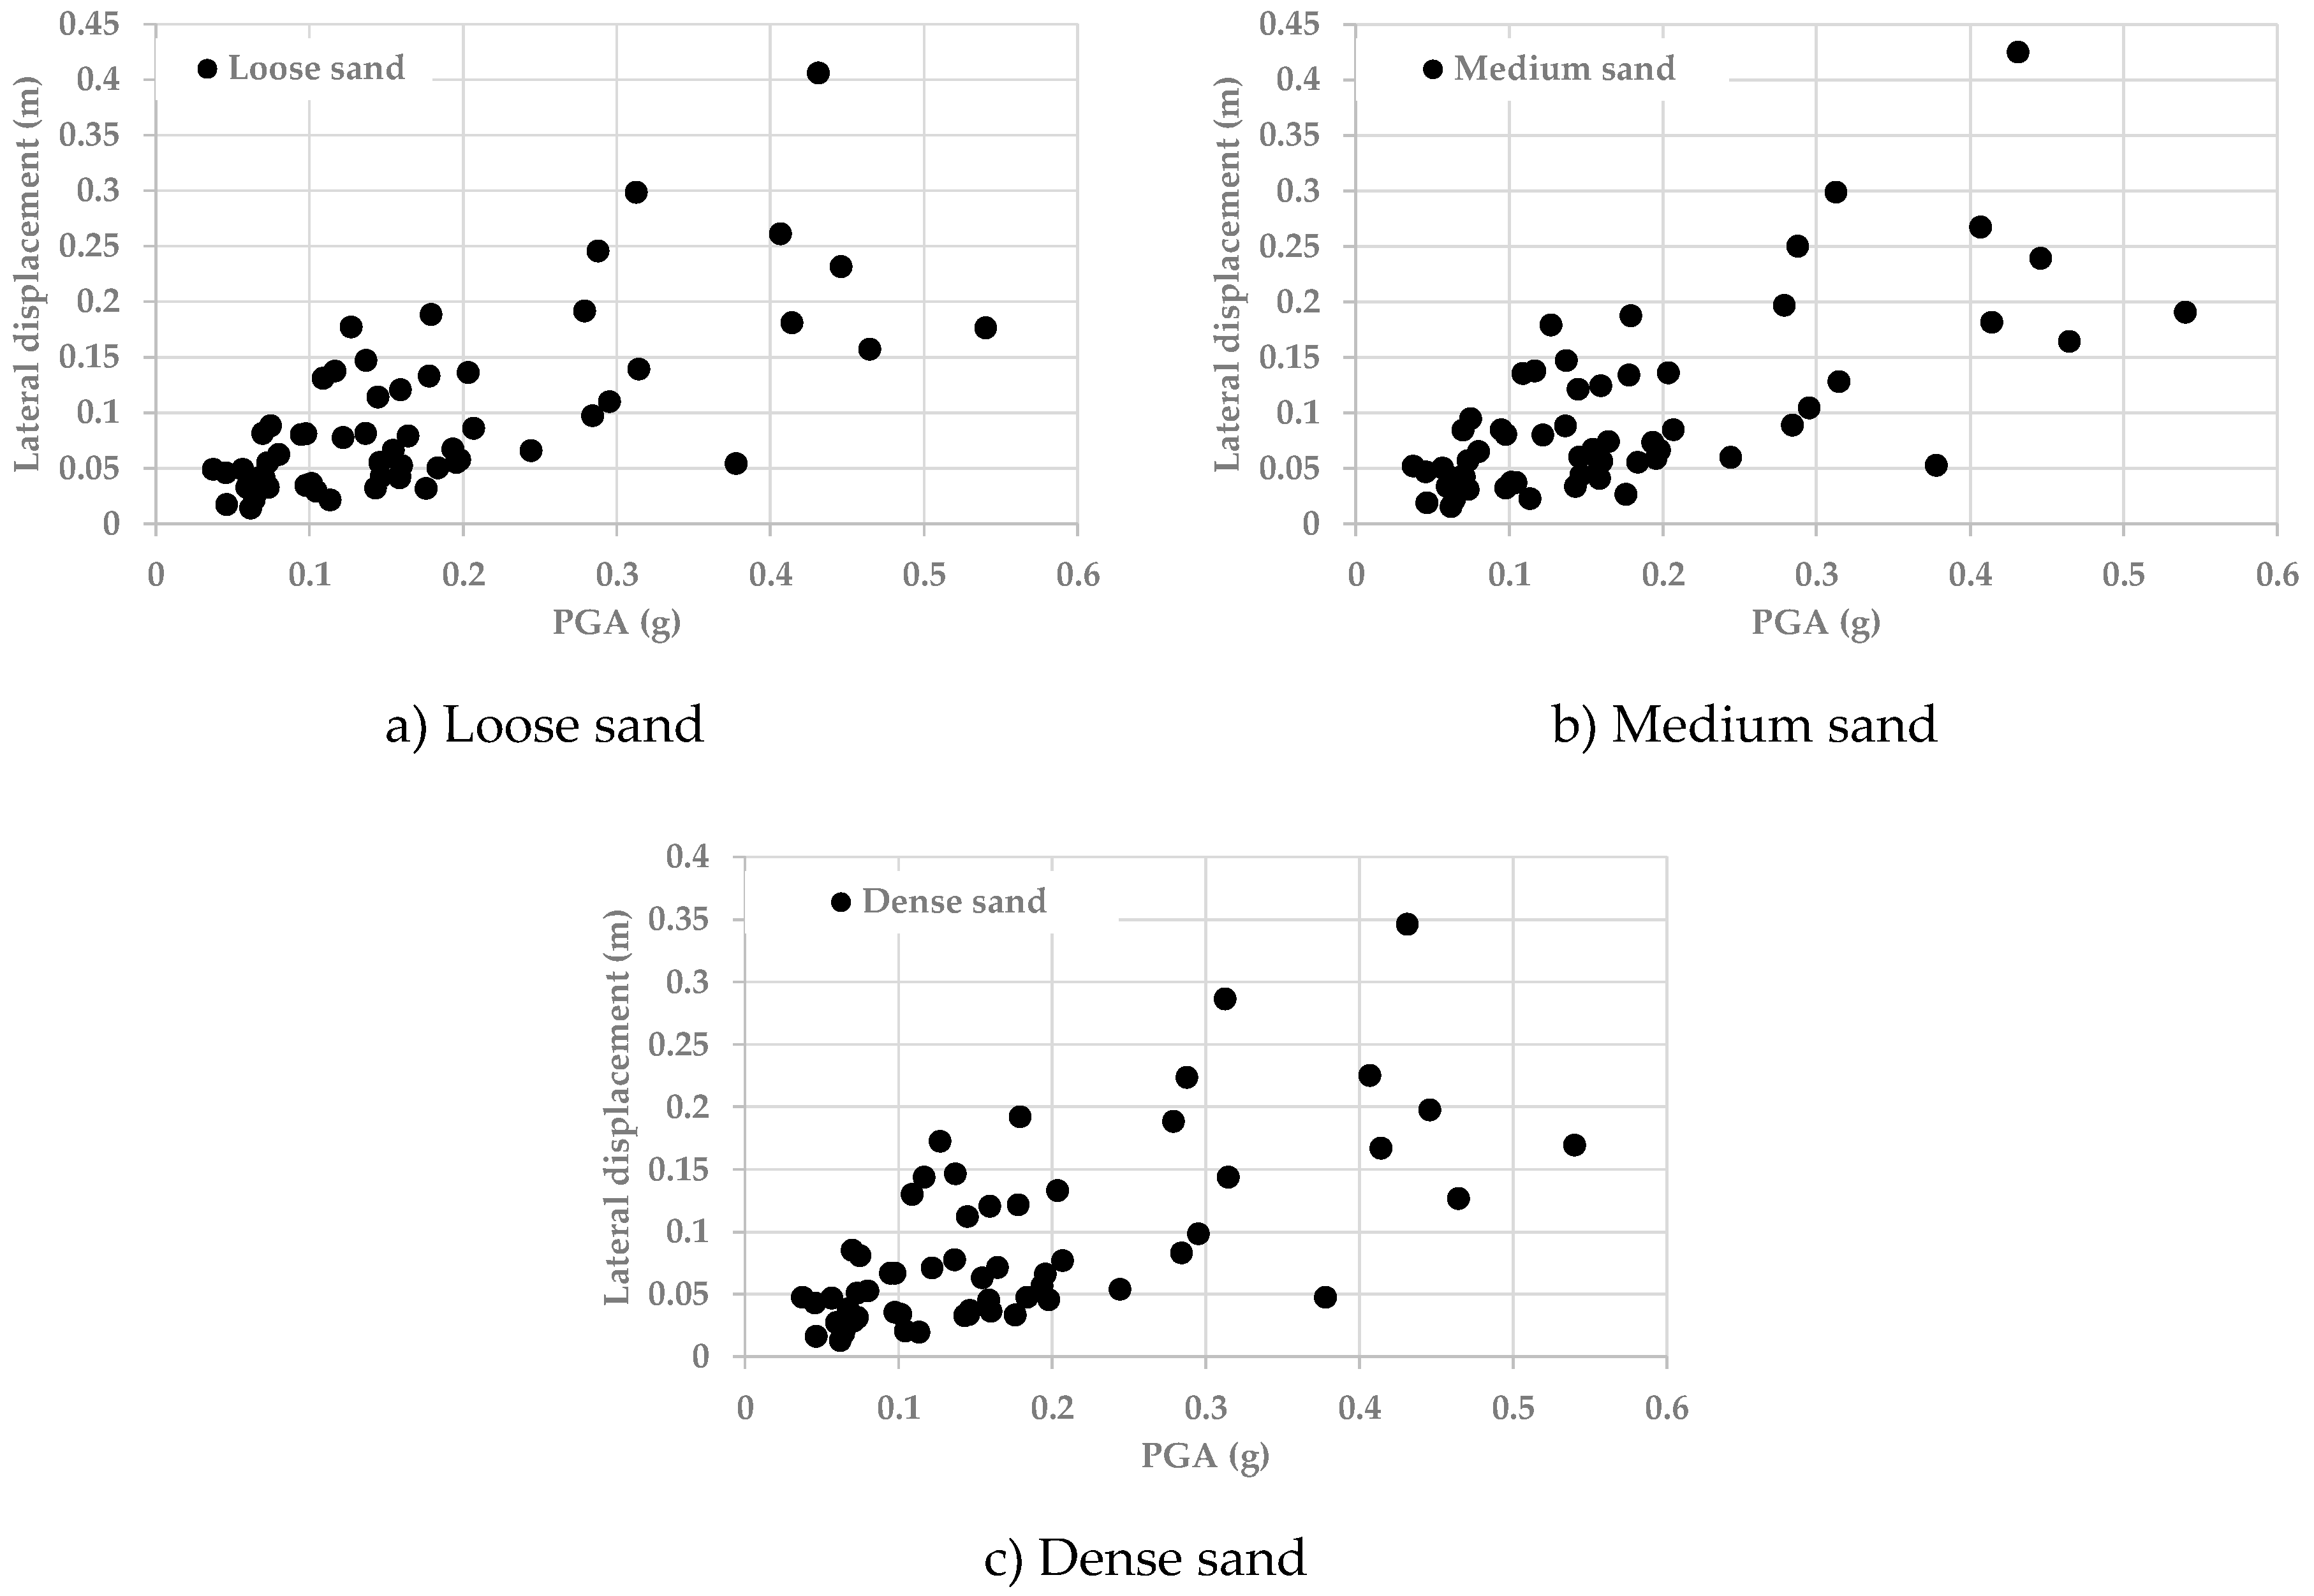
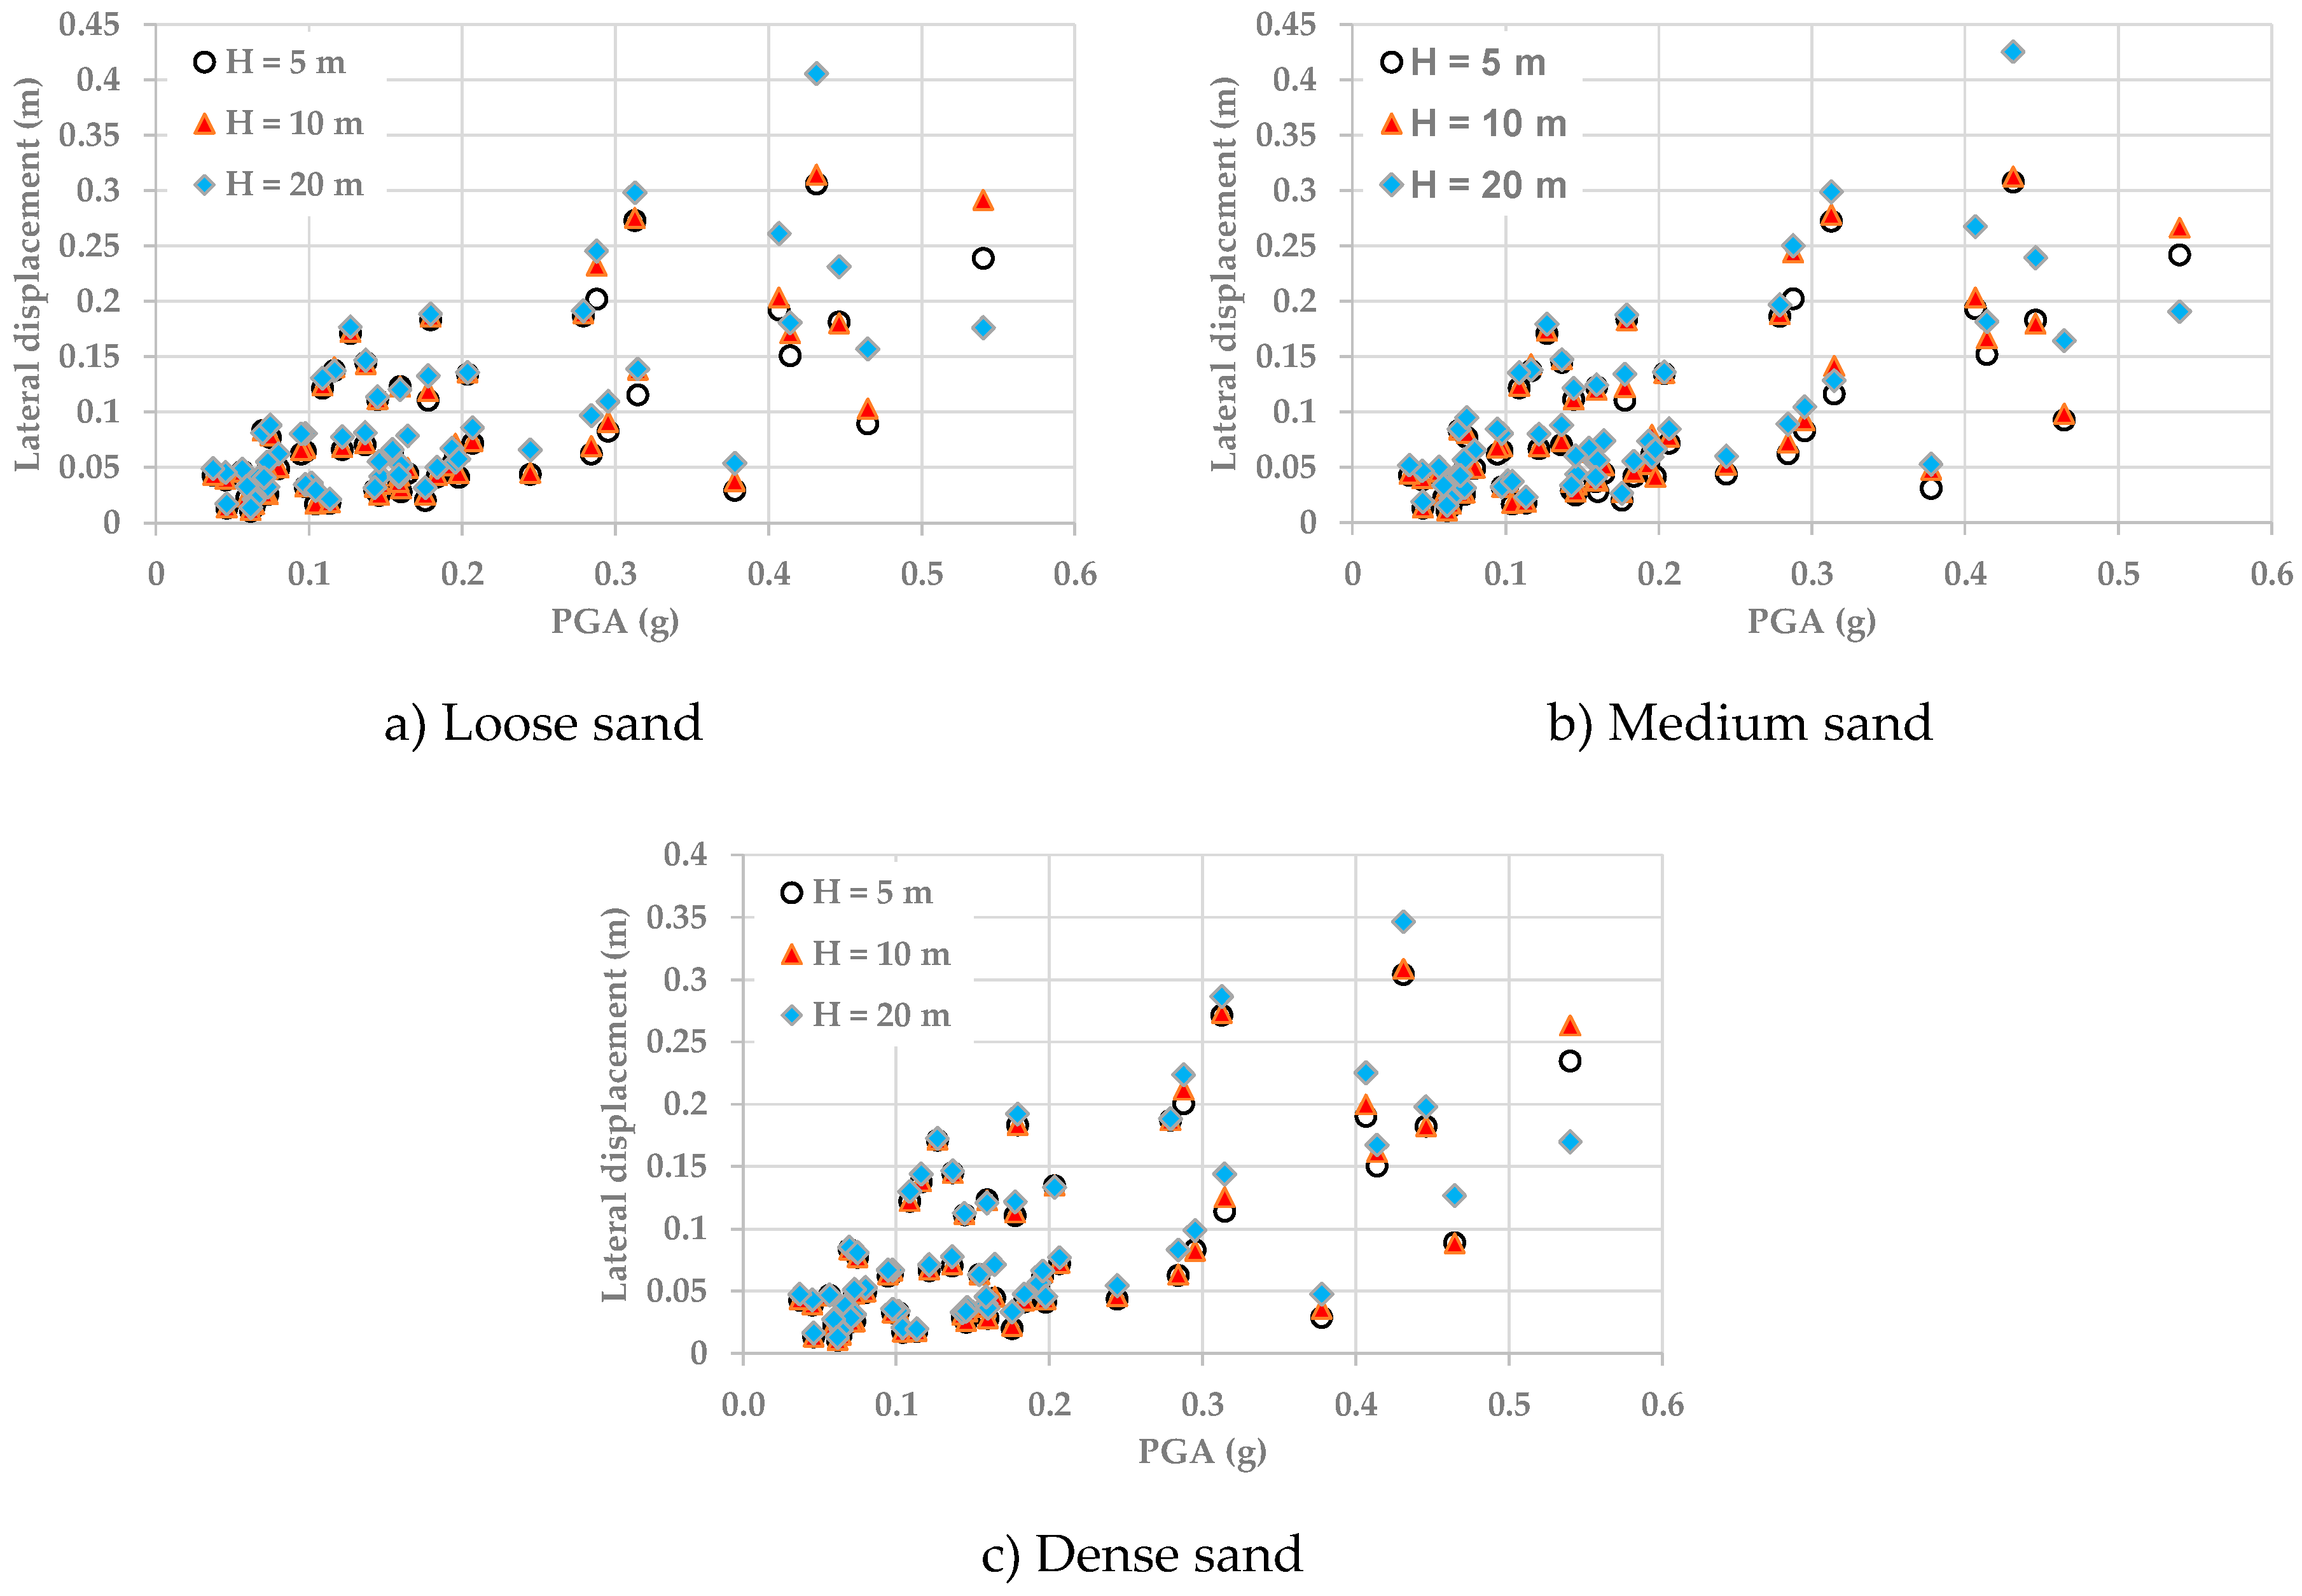
5.2. Lateral Displacement

Figure 8 shows the liquefaction-induced lateral displacement of the building with time for the case of a building resting on medium sand and subjected to input motion LOS. The trend of the lateral displacement relationship with time follows the same trend of the settlement (Figure 4), where the lateral displacement increases with time, then stabilizes. The lowest lateral displacement is reached with a liquefiable layer thickness of 5 m. Figure 9a–c show the maximum liquefaction-induced lateral displacement of the building for loose, medium, and dense sands for the case of a liquefiable layer thickness of 20 m. As expected, increasing the PGA generally increases the liquefaction-induced lateral displacement of the building. This is due to the reduction of the soil strength and the consequent sliding resistance that occur when the earthquake intensity increases. Figure 9a–c show that the relationship between the lateral displacement and the PGA present some fluctuations, which can be explained by the effect of the frequency range and the predominant frequency for the employed records. Figure 9a,b indicate that increasing the sand density from loose to medium does not noticeably influence the resulting lateral displacement. However, if Figure 9a–c are compared, when the RC structure rests on dense sand, the lateral displacement is lower than that from loose or medium sands. Figure 10a–c present the effect of the thickness of the liquefiable layer on the resulting lateral displacement for loose, medium, and dense sand, respectively. It is worth noting that there is no clear relationship between the thickness of the liquefiable layer and the obtained lateral displacement.
Overall, the mechanisms that have been deduced depend on the complex interaction between the input motion (in terms of accelerations, amplification, frequencies, etc.) and the thickness of the compressible layer (and thus the stiffness of the considered soil mesh). All of these interactions drive the increase in liquefaction-induced damage by enhancing the sliding resistance of the entire soil domain.

6. Conclusions

Coupled soil-fluid numerical analyses were conducted to assess the response of an RC structure resting on a liquefiable layer and subjected to seismic effects. The study focused on the combined effect of earthquake intensity, thickness of the liquefiable layer, and density of the liquefiable layer. Fifty-eight earthquake shaking records were employed in the study to show the behaviour of the building using a wide range of seismic events, where the duration of the employed records ranged between 15.72 and 60.00 s, the peak ground acceleration (PGA) ranged between 0.04 and 0.54 g, and the cumulative absolute velocity (CAV) ranged between 131 and 1311 cm/s. Based on the discussions of this research, the following conclusions can be made:
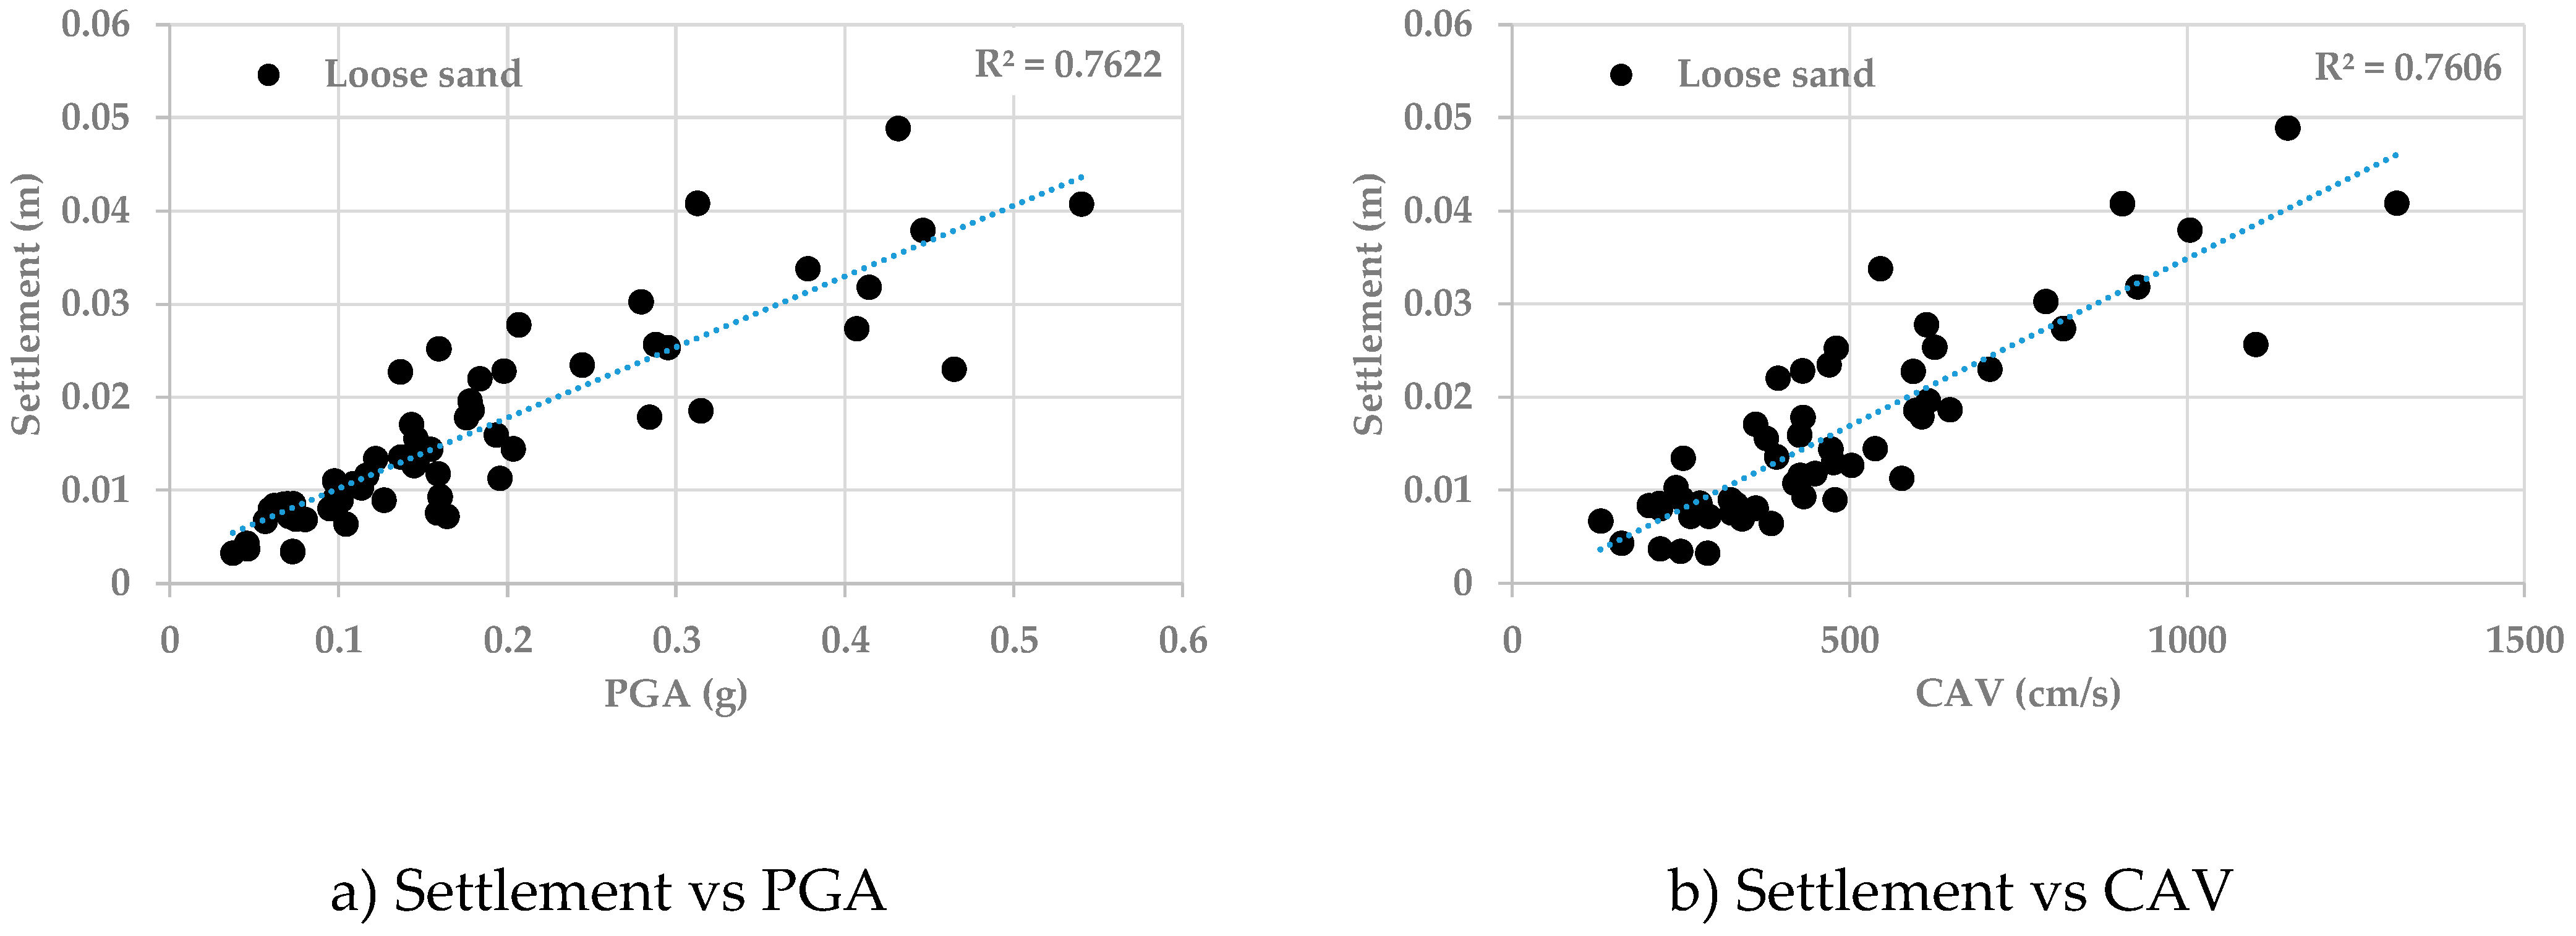
  • The trend in the relationship between the liquefaction-induced settlement and the PGA achieved a slightly higher coefficient of determination when compared with that resulting from the relationship between the settlement and CAV. Hence, PGA is suggested to be applied to measure the earthquake intensity with liquefaction-induced settlement.
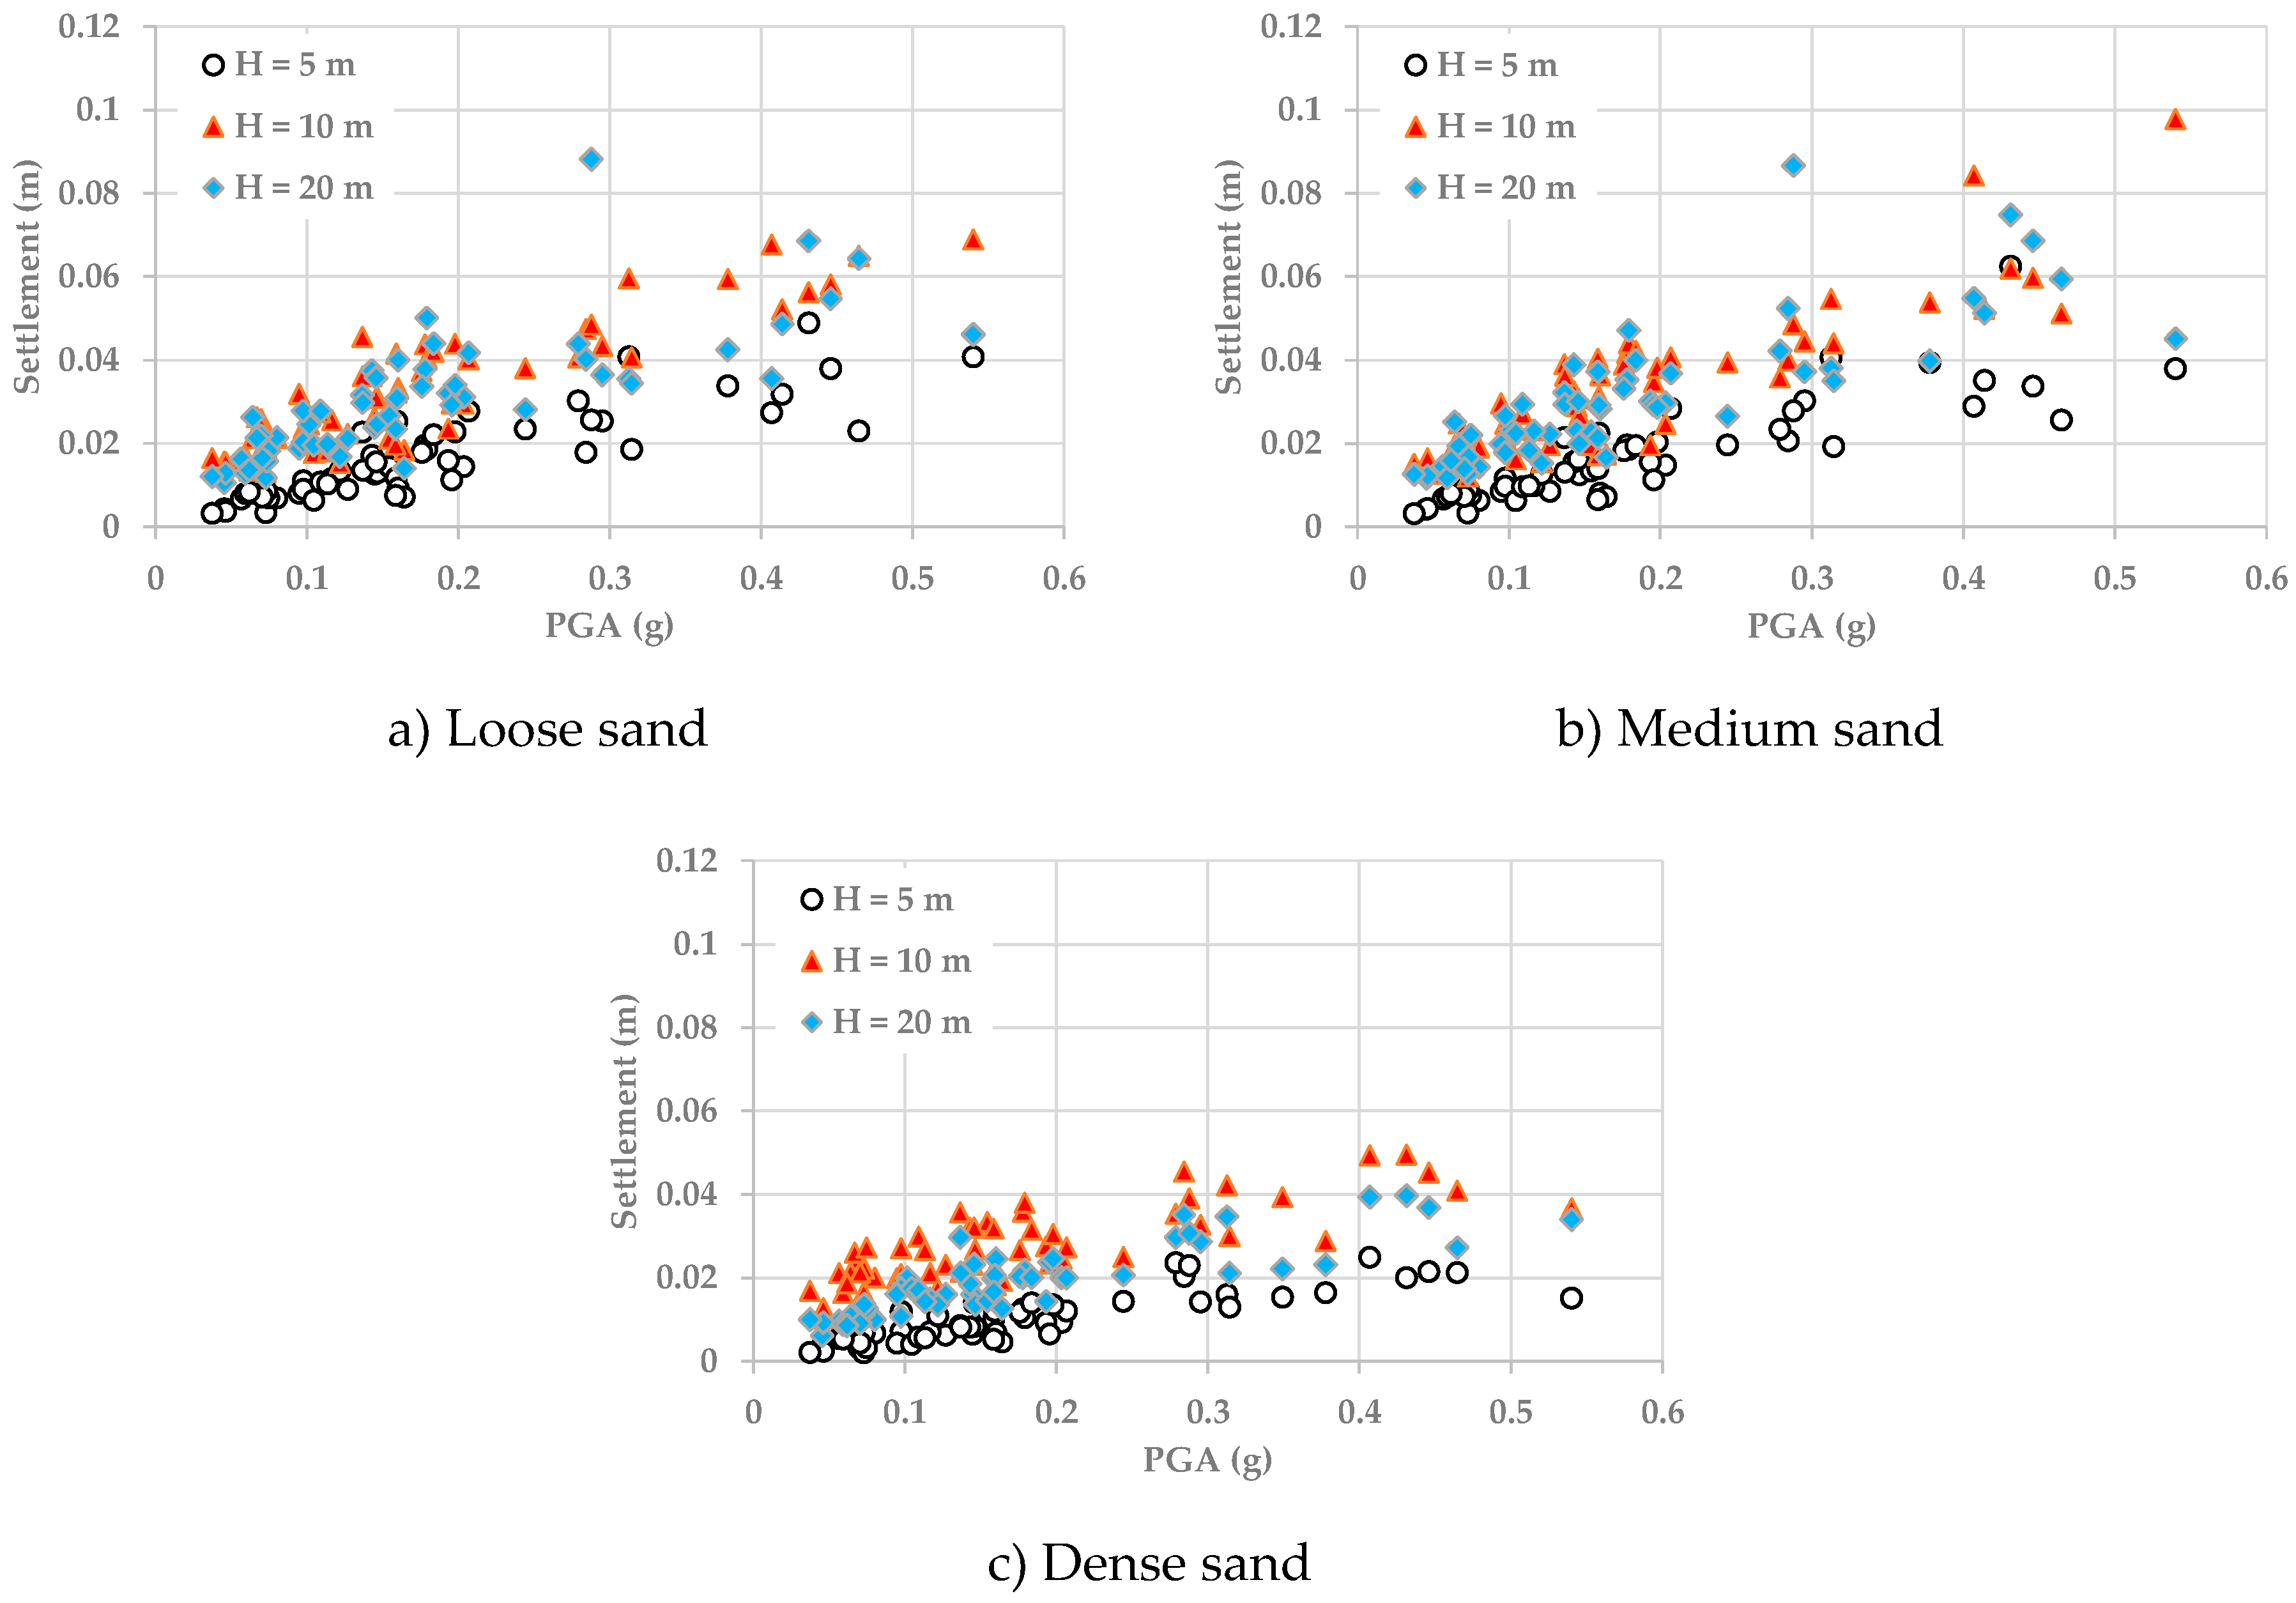
  • In particular, the liquefaction-induced settlement and liquefaction-induced lateral displacement of the building increase as PGA increases. However, there are some fluctuations in the increase that are due to the effect of the predominant frequency of the seismic shake.
  • The liquefaction-induced settlement slightly changes as the soil density changes from loose to medium. Thus, there are some cases of decreasing and increasing settlement when the density of the liquefiable layer changes from loose to medium. However, the dense liquefiable soil produces lower seismic settlement compared to the cases for loose and medium liquefiable ground.
  • On average, increasing the density of the liquefiable soil from loose to medium does not perceptibly impact the development of the liquefaction-induced lateral displacement. However, liquefaction-induced lateral displacement is generally reduced in case of an RC structure resting on dense sand.
  • The lateral displacement of the building is not generally sensitive to the increase in the thickness of the liquefiable layer.
It is worth noting that these results were limited to the proposed case studies. However, they may have interesting applications to design procedures and aid in the proposal of code provisions for liquefaction risk assessments.

Author Contributions

Conceptualization, D.F. and S.A.; methodology, D.F. and S.A.; software, D.F.; validation, D.F.; formal analysis, D.F.; investigation, S.A. and D.F.; resources, S.A.; data curation, D.F.; writing—original draft preparation, S.A.; writing—review and editing, S.A. and D.F.; visualization, S.A. and D.F. Both authors have read and agreed to the published version of the manuscript.

Funding

No funding has been received to conduct this research.

Data Availability Statement

The data are available upon request from the authors.

Conflicts of Interest

The authors declare no conflict of interest.

References

  1. Dashti, S.; Bray, J.D.; Pestana, J.M.; Riemer, M.; Wilson, D. Mechanisms of seismically induced settlement of buildings with shallow foundations on liquefiable soil. J. Geotech. Geoenviron. Eng. 2010, 136, 151–164. [Google Scholar] [CrossRef] [Green Version]
  2. Karamitros, D.K.; Bouckovalas, G.D.; Chaloulos, Y.K. Seismic settlements of shallow foundations on liquefiable soil with a clay crust. Soil Dyn. Earthq. Eng. 2013, 46, 64–76. [Google Scholar] [CrossRef]
  3. Karamitros, D.K.; George, D.B.; Yannis, K.C. Insight into the seismic liquefaction performance of shallow foundations. J. Geotech. Geoenviron. Eng. 2013, 139, 599–607. [Google Scholar] [CrossRef]
  4. Karamitros, D.K.; Bouckovalas, G.D.; Chaloulos, Y.K.; Andrianopoulos, K.I. Numerical analysis of liquefaction-induced bearing capacity degradation of shallow foundations on a two-layered soil profile. Soil Dyn. Earthq. Eng. 2013, 44, 90–101. [Google Scholar] [CrossRef]
  5. Bertalot, D.; Brennan, A.J. Influence of initial stress distribution on liquefaction-induced settlement of shallow foundations. Géotechnique 2015, 65, 418–428. [Google Scholar] [CrossRef] [Green Version]
  6. Dimitriadi, V.E.; Bouckovalas, G.D.; Papadimitriou, A.G. Seismic performance of strip foundations on liquefiable soils with a permeable crust. Soil Dyn. Earthq. Eng. 2017, 100, 396–409. [Google Scholar] [CrossRef]
  7. Dimitriadi, V.E.; Bouckovalas, G.D.; Chaloulos, Y.K.; Aggelis, A.S. Seismic liquefaction performance of strip foundations: Effect of ground improvement dimensions. Soil Dyn. Earthq. Eng. 2018, 106, 298–307. [Google Scholar] [CrossRef]
  8. Alzabeebee, S. Application of EPR-MOGA in computing the liquefaction-induced settlement of a building subjected to seismic shake. Eng. Comput. 2020, 1–12. [Google Scholar] [CrossRef]
  9. Chaloulos, Y.K.; Giannakou, A.; Drosos, V.; Tasiopoulou, P.; Chacko, J.; De Wit, S. Liquefaction-induced settlements of residential buildings subjected to induced earthquakes. Soil Dyn. Earthq. Eng. 2020, 129, 105880. [Google Scholar] [CrossRef]
  10. Forcellini, D. Soil-structure interaction analyses of shallow-founded structures on a potential-liquefiable soil deposit. Soil Dyn. Earthq. Eng. 2020, 133, 106108. [Google Scholar] [CrossRef]
  11. Qi, S.; Knappett, J.A. Effect of soil permeability on soil-structure and structure-soil-structure interaction of low-rise structures. Géotechnique 2021, 1–41. [Google Scholar] [CrossRef]
  12. Goh, A.T.; Zhang, W.G. An improvement to MLR model for predicting liquefaction-induced lateral spread using multivariate adaptive regression splines. Eng. Geolog. 2014, 170, 1–10. [Google Scholar] [CrossRef]
  13. Lu, J.; Elgamal, A.; Yang, Z. OpenSeesPL: 3D Lateral Pile-Ground Interaction, User Manual, Beta 1.0. 2011. Available online: http://soilquake.net/openseespl/ (accessed on 7 July 2021).
  14. Forcellini, D. Numerical simulations of liquefaction on an ordinary building during Italian (20 May 2012) earthquake. Bull. Earthq. Eng. 2019, 17, 4797–4823. [Google Scholar] [CrossRef]
  15. Forcellini, D. Analytical fragility curves of shallow-founded structures subjected to Soil Structure Interaction (SSI) effects. Soil Dyn. Earthq. Eng. 2021, 1413, 106487. [Google Scholar] [CrossRef]
  16. Forcellini, D. Seismic Fragility for a Masonry-Infilled RC (MIRC) Building Subjected to Liquefaction. Appl. Sci. 2021, 11, 6117. [Google Scholar] [CrossRef]
  17. Yang, Z.; Elgamal, A.; Parra, E. Computational model for cyclic mobility and associated shear deformation. J. Geotech. Geoenviron. Eng. 2003, 129, 1119–1127. [Google Scholar] [CrossRef]
  18. Mazzoni, S.; McKenna, F.; Scott, M.H.; Fenves, G.L. Open Systemfor Earthquake Engineering Simulation, User Command-Language Manual. 2009. Available online: http://opensees.berkeley.edu (accessed on 24 August 2021).
  19. Alzabeebee, S. Seismic response and design of buried concrete pipes subjected to soil loads. Tunn. Undergr. Sp. Technol. 2019, 93, 103084. [Google Scholar] [CrossRef]
  20. Alzabeebee, S. Response of buried uPVC pipes subjected to earthquake shake. Innov. Infrastruct. Solut. 2019, 4, 1–14. [Google Scholar] [CrossRef]
  21. Ground Motion Selection. Available online: http://peer.berkeley.edu/nga/ (accessed on 7 July 2021).
  22. Yang, Z.; Elgamal, A.; Adalier, K.; Sharp, M.K. Earth dam on liquefiable foundation and remediation: Numerical simulation of centrifuge experiments. J. Eng. Mech. 2004, 130, 1168–1176. [Google Scholar] [CrossRef]
  23. Tang, L.; Cong, S.; Ling, X.; Lu, J.; Elgamal, A. Numerical study on ground improvement for liquefaction mitigation using stone columns encased with geosynthetics. Geotex. Geomemb. 2015, 43, 190–195. [Google Scholar] [CrossRef]
  24. Karimi, Z.; Dashti, S. Ground motion intensity measures to evaluate II: The performance of shallow-founded structures on liquefiable ground. Earthq. Spectra 2017, 33, 277–298. [Google Scholar] [CrossRef]
  25. Bray, J.D.; Macedo, J. 6th Ishihara lecture: Simplified procedure for estimating liquefaction-induced building settlement. Soil Dyn. Earthq. Eng. 2017, 102, 215–231. [Google Scholar] [CrossRef]
  26. Karimi, Z.; Dashti, S.; Bullock, Z.; Porter, K.; Liel, A. Key predictors of structure settlement on liquefiable ground: A numerical parametric study. Soil Dyn. Earthq. Eng. 2018, 113, 286–308. [Google Scholar] [CrossRef]
  27. Alzabeebee, S. Seismic settlement of a strip foundation resting on a dry sand. Nat. Hazards 2020, 103, 2395–2425. [Google Scholar] [CrossRef]
Figure 1. (a) The structure of the building used in the analyses (vertical view). (b) The structure of the building used in the analyses (plan view): slab dimensions are 28.4 m × 34.4 m × 0.5 m.
Buildings 11 00379 g001
Figure 2. The mesh configurations used in the analyses: structure and soil domain (20 × 120 × 150 m).
Buildings 11 00379 g002
Figure 3. Comparison of the relationships between liquefaction-induced settlement and PGA and liquefaction-induced settlement and CAV.
Buildings 11 00379 g003
Figure 4. Effect of the thickness of the liquefiable layer on the liquefaction-induced settlement-time history for the case of a building resting on medium sand and subjected to LOS earthquake shake.
Buildings 11 00379 g004
Figure 5. Effect of the thickness of the liquefiable layer on the pore water pressure ratio (ru)-time history for the case of a building resting on medium sand and subjected to LOS earthquake shake.
Buildings 11 00379 g005
Figure 6. Effect of the PGA and the soil density on the liquefaction-induced seismic settlement.
Buildings 11 00379 g006
Figure 7. Effect of the thickness of the liquefiable layer on the liquefaction-induced seismic settlement.
Buildings 11 00379 g007
Figure 8. Effect of the thickness of the liquefiable layer on the lateral displacement of the building-time history for the case of a building resting on medium sand and subjected to LOS earthquake shake.
Buildings 11 00379 g008
Figure 9. Effect of the PGA and the soil density on the lateral displacement of the building for the case of a liquefiable layer thickness of 20 m.
Buildings 11 00379 g009
Figure 10. Effect of the thickness of the liquefiable layer on the lateral displacement of the building.
Buildings 11 00379 g010
Table 1. Summary of previous studies on buildings subjected to liquefaction.
No.ReferencesType of StudySoils UsedStory Height (m)Building Height (m)Foundation Length, Width, and Depth (m)PGA (g)Investigated Parameters
1Dashti et al. [1]Laboratory study using centrifugeLoose sand (Dr = 30%)
Medium sand (Dr = 50%)
N/P5
5
9.2
9.0 × 6.0 × N/A
18.0 × 12.0 × N/A
9 × 6 × N/A
0.19 and 0.55- Thickness of the liquefiable layer
- Relative density of the liquefiable layer
2Karamitros et al. [2]2D FDM
3D FDM
Loose sand (Dr = 40%)
Medium sand (Dr = 50%)
Medium-dense sand (Dr = 60%)
**XX ** × 5.0 × N/A
5.3 × 5.3 × N/A
0.10–0.35- Load of the structure
- Relative density of the soil
- Thickness of the liquefiable layer
- Thickness of the non-liquefiable layer
3Karamitros et al. [3]2D FDMMedium sand (Dr = 50%)**XX ** × 5.0 × N/A0.05–0.35- Thickness of the non-liquefiable layer
- Shear strength of the non-liquefiable layer
- Load of the structure
4Karamitros et al. [4]2D FDM
3D FDM
Loose sand (Dr = 40%)
Medium sand (Dr = 50%)
Medium-dense sand (Dr = 60%)
**XX ** × 5.0 × N/A
5.3 × 5.3 × N/A
0.10–0.35- Thickness of the non-liquefiable layer
- Shear strength of the non-liquefiable layer
- Load of the structure
5Bertalot and Brennan [5]Laboratory study using centrifugeLoose sand (Dr = 40%)**2.8 × 2.8 × N/A3.50- Thickness of the liquefiable layer
- Load of the structure
6Dimitriadi et al. [6]2D FDMLoose sand
Medium sand
Medium-dense sand
**XX ** × (3.0–5.0) × N/A0.10–0.35- Thickness of the non-liquefiable layer
- Shear strength of the non-liquefiable layer
- Load of the structure
- Width of the foundation
7Dimitriadi et al. [7]2D FDMLoose sand
Medium sand
Medium-dense sand
**XX ** × (3.0–5.0) × N/A0.15–0.30- Thickness of the non-liquefiable (improved) layer
- Width of the non-liquefiable (improved) layer
8Alzabeebee [8]AI applicationLoose sand
Medium sand
Medium-dense sand
Dense sand
***2–16N/A × (6–12) × N/AN/A- Load of the structure
- Thickness of the liquefiable layer
- Width of the building
9Chaloulos et al. [9]2D FDMLoose sand (Dr = 40%)1-Story3.0XX ** × (0.2–0.7) × 0.50.06–0.17- Thickness of the liquefiable layer
- Thickness of the non-liquefiable layer
- Footing width
- Embedment depth
- Load of the structure
Medium-dense sand (Dr = 50%)2-Story5.1XX ** × (0.2–0.7) × 0.5
10Forcellini [10]3D FEMMedium-dense sand3.46.8
13.6
20.4
XX ** × 7.4 × XX **
XX ** × 7.4 × XX **
XX ** × 7.4 × XX **
0.16- Height of the building
- Weight of the building
11Qi and Knappett [11]Laboratory study using centrifugeMedium-dense sand (Dr = 55 to 60%)363.6 × 3.6 × 0.5
3.6 × 3.6 × 0.7
0.43- Permeability of the soil
* Building has not been modelled/simulated in this study; ** Plan strain modelling of the foundation; *** Number of stories has not been simulated; N/P means that the information has not been provided; N/A means that the information is not applicable; FDM is the acronym for the finite difference method; AI is the acronym for artificial intelligence.
Table 2. Characteristics of the foundation.
ParameterValue
Mass density (kN/m3)24.0
Reference shear modulus (kN/m2)1.25 × 107
Reference bulk modulus (kN/m2)1.67 × 107
Table 3. Characteristics of the building.
ParameterValue
Mass density (kN/m3)24.0
Young modulus (kN/m2)3.50 × 107
Shear modulus (kN/m2)1.73 × 107
Cross area (m2)0.12
Inertial moment (m4)9.0 × 10⁻⁴
Table 4. Details of the earthquake records considered in this research [21].
Number EarthquakeStationDuration (s)CAV (cm/s) PGA (g)
1A-ELC1968 Borrego Mountain40.004780.13
2A2E1989 Loma Prieta39.966170.18
3FMS1989 Loma Prieta39.765380.20
4HVR1989 Loma Prieta39.965030.14
5SJW1989 Loma Prieta39.964270.12
6BAD1994 Northridge35.003230.10
7CAS1994 Northridge39.804760.15
8DLE1994 Northridge35.365940.14
9JAB1994 Northridge35.004240.10
10L011994 Northridge32.003610.09
11LOA1994 Northridge40.004720.15
12LV21994 Northridge32.002510.10
13PHP1994 Northridge60.003400.08
14PIC1994 Northridge40.004260.19
15SOR1994 Northridge36.482780.07
16SSE1994 Northridge35.005770.20
17VER1994 Northridge30.004480.16
18AGW1989 Loma Prieta40.006490.18
19G041989 Loma Prieta39.969270.41
20CNP1994 Northridge25.0011490.43
21FLE1994 Northridge30.006070.28
22LOS1994 Northridge20.009040.54
23RO31994 Northridge30.2810040.45
24H-CXO1979 Imperial Valley37.827910.28
25H-SHP1979 Imperial Valley15.727080.46
26I-ELC1979 Imperial Valley40.0013110.31
27G021989 Loma Prieta39.968170.41
28GOF1989 Loma Prieta39.966260.30
29Z-HVR1984 Morgan Hill 39.985980.31
30B-ELC1968 Borrego Mountain40.003310.07
31H-C051983 Coalinga40.004320.16
32H-C081983 Coalinga32.003840.10
33H-CC41979 Imperial Valley28.542640.16
34H-CMP1979 Imperial Valley36.006140.21
35H-NIL1979 Imperial Valley40.004190.11
36H-PLS1979 Imperial Valley18.761310.06
37A-STP1980 Livermore33.002490.07
38SJB1984 Morgan Hill 28.001620.05
39Z-CAP1984 Morgan Hill 36.003600.14
40Z-HCH1984 Morgan Hill 28.343410.07
41H061986 North Palm Springs40.002180.07
42INO1986 North Palm Springs30.002540.12
43A-CTS1987 Whittier Narrows39.962180.06
44A-HAR1987 Whittier Narrows40.002910.07
45A-SSE1987 Whittier Narrows22.942190.05
46A-STC1987 Whittier Narrows40.004310.18
47H-CAL1979 Imperial Valley39.543910.14
48H-CHI1979 Imperial Valley40.0011020.29
49H-E011979 Imperial Valley39.044800.16
50A-KOD1980 Livermore20.983250.16
51A-SRM1980 Livermore40.002200.06
52Z-AGW1984 Morgan Hill 29.982900.04
53Z-GMR1984 Morgan Hill 29.983940.18
54PHN1935 Port Hueneme28.422430.11
55A-CAS1987 Whittier Narrows21.185460.38
56A-CAT1987 Whittier Narrows32.922030.06
57A-DWN1987 Whittier Narrows40.004700.24
58A-W701987 Whittier Narrows31.944300.20
Table 5. Statistical values of the duration, CAV and PGA of the earthquake records.
IndicatorDuration (s)CAV (cm/s)PGA (g)
Minimum value15.72131.000.04
Maximum value60.001311.000.54
Standard deviation7.41255.360.12
Average34.77483.380.18
Table 6. Characteristics of the foundation.
ParameterLoose Sand Medium Sand * Dense Sand **
Density γ (kN/m3) ***161820
Low-strain shear modulus (G) (at 80 kPa mean effective confinement) (MPa)3380135
Cohesion c’ (kPa)000
Friction Angle ø’ (°)31.035.540
Liquefaction yield strain (γy) (%)1.50.00.0
Contraction parameter (c1)0.170.100.10
Contraction parameter (c2)0.050.050.05
Phase transformation angle (øPT)26.526.526.0
Dilation parameter (d1)0.40.80.80
Dilation parameter (d2)10105.0
* Adopted from Yang et al. [21]; ** from Tang et al. [22]; *** Typical values for these soils.
Publisher’s Note: MDPI stays neutral with regard to jurisdictional claims in published maps and institutional affiliations.

