1. Introduction
The Architecture, Engineering and Construction (AEC) industry is a sector where the design and the preparation of future elements and actions are key to the whole lifecycle of a building [
1]. This goes from its preconception with ground and cost studies to its maintenance with future reparation planning. To address such needs of foresight, anticipation, and preventive correction, this sector is currently using more and more computer technologies [
2,
3]. Among them, building information modelling (BIM) methodology and tools are ones of the most widely used, notably for their power of data follow-up, update, and sharing [
4,
5]. Nonetheless, other computer technologies can also be used in the industry such as virtual reality (VR), augmented reality (AR), the internet of things, or artificial intelligence [
6]. Indeed, for example, the VR technology has been particularly adopted during the design stage of the construction [
7], and AR during the maintenance stage [
8].
In the last years, it has been shown in the literature that computer-based technologies can be beneficial for a large variety of purposes and issues in the AEC industry, such as energy management [
9], construction monitoring [
10], or design reviewing [
7,
11]. Focusing here on one cross-cutting issue in particular, safety is a paramount one in the AEC industry, both before and after the construction of a building. Indeed, on one hand, during the operation and maintenance stages, i.e., after the construction, the safety of the building users is required and can be ensured by carrying out corrective and follow-up actions through safety assessments [
12]. To conduct such safety assessments, computational approaches such as artificial neural networks can be used and contribute to the prediction of potential safety problems and, thus, to the anticipation of maintenance actions, as explained by Harirchian et al. [
13]. On the other hand, before the use of the building and, therefore, during its construction, this is the safety of the AEC workers that must be ensured. The AEC industry is indeed an industry that is particularly dangerous for its workers [
14,
15,
16,
17]. In many countries, accidents are more frequent and more fatal for workers in the AEC industry than in other ones [
18]. To address this crucial issue [
14], computer-based approaches such as BIM-based ones have been proposed in the literature [
19,
20].
In this paper, for our case study, we focused on the construction workers’ safety, on a worksite. According to the Occupational Safety and Health Administration—the OSHA—the most common construction hazards are the fall, electrocution, caught in between, and struck-by hazards [
21]. To address these safety issues, one option is to conduct preventive and corrective actions on the worksites during the construction, for example using signals that highlight hazardous zones in augmented reality [
22] or using monitoring systems that can prevent mechanical failures [
23]. Another option is to take safety measures before the beginning of the construction, notably by improving the understanding of these worksite hazards by the AEC professionals [
24], and by learning more about the ways to identify and mitigate them [
25,
26]. As a result, a technique called design for safety has been proposed in the literature to prevent hazards from the design stage of the building lifecycle [
27,
28,
29]. This has been particularly studied in BIM authoring tools, either to avoid fall hazards with the automatic addition of protections in such hazardous zones [
20,
30], or to prevent electrocution fatalities [
31]. For the two other main kinds of hazards—caught between and struck-by ones—other preventive actions can be done on construction planning, instead of the building design itself. Indeed, these kinds of hazards are directly related to the dynamic aspect of a worksite since they are mostly due to construction vehicles and workers movements [
32,
33]. Then, as construction vehicles and workers follow planned movements during the construction, hazardous zones—zones with conflicts that may result in collisions—can be identified in construction planning, usually using paper plans [
34] or eventually BIM 4D simulations [
35], i.e., construction simulation with 3D representations over time.
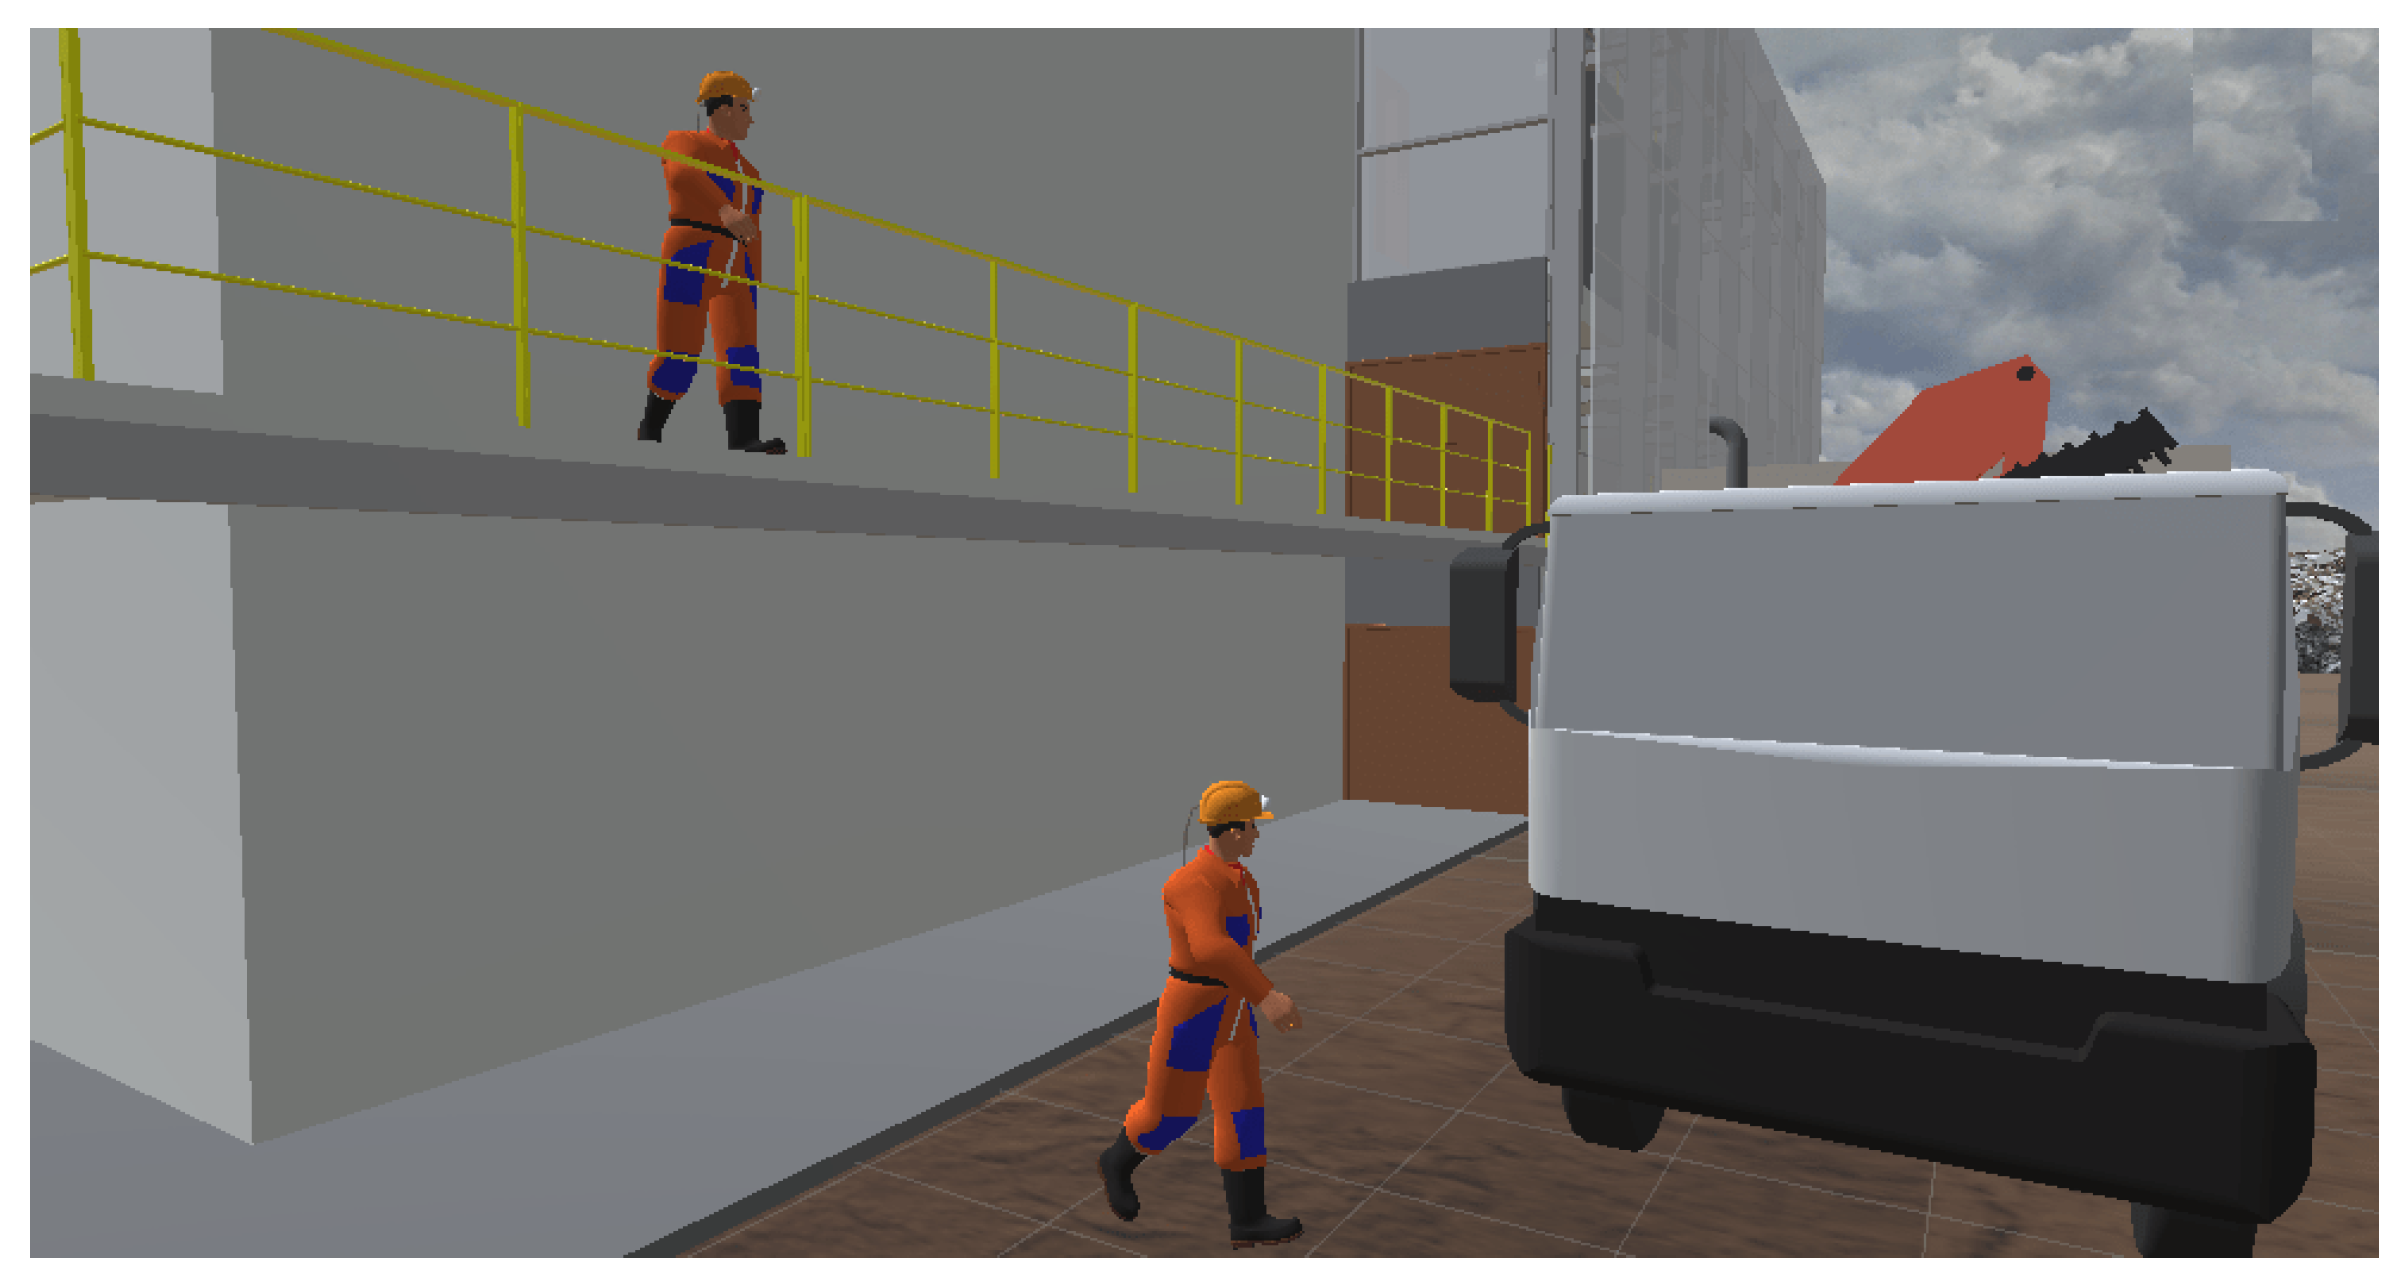
In our approach to improve the workers’ safety, we focused on the preventive actions aforementioned, and in particular on the process of conducting hazard identification reviews. For that, the VR technology can be used [
36], notably for hazards that are related to dynamic events, thanks to the improved sense of immersion and presence that VR offers [
37,
38,
39]. In that sense, several studies have been conducted in the literature about the use of VR for hazard assessment [
40]. Many of them have focused on hazard identification in VR for training purposes, either for workers or civil engineers [
41]. Indeed, Sacks et al. [
42] compared the effect of a traditional training to a VR training on the civil engineers’ memory by evaluating their hazard knowledge after different intervals of times. In their experiment, the VR-trained participants performed better than the control group who used paper plans. Zhao et al. [
43,
44] and Fang et al. [
45] focused their studies on training workers to avoid having hazardous behaviours, for example when they use a crane. Finally, in the same line, Xu et al. [
46] and Joshi et al. [
47] conducted objective and subjective user evaluations on VR training for safety, which confirmed the benefits of this technology for construction workers. Nonetheless, the use of VR has also been studied for other purposes than training, and notably as an environment that can allow safety managers to detect design or construction planning defects that would engender hazardous zones in the future worksite [
48,
49,
50,
51].
In line with the aforementioned papers, which showed the benefits of VR for the hazard identification task, our paper proposes to study the use of VR environments for this specific task, and its design and evaluation process in particular. Indeed, as virtual reality is intrinsically linked to human factors [
52,
53], one issue related to VR is that the design of VR environments and notably its user interactions should be adapted to the VR users’ tasks [
54]. Indeed, the design of the user interactions in VR is paramount since their usability is directly linked to user task performance [
55,
56], and as a result to the effectiveness of the user tasks performed in VR [
57]. To address this issue, user-centred design methodologies have been developed in the VR literature. These methodologies classified the different existing interaction techniques and presented some approaches to make design choices for the VR user interactions [
58,
59,
60]. Nonetheless, a remaining problem is that in these methodologies the main actors of the design process must have knowledge expertise in VR [
58]. Indeed, such user-centred methodologies appear to be conceived to be used by VR developers and then to guide these developers in a process of integration of the users [
60]. As a result, the influence of the users and also of the user tasks characteristics on the design may be lower than expected. To address this problem, we propose here a new methodology for the design and the evaluation of VR user interactions, which is centred on the tasks performed by the users and makes them the main actors of the VR design process. The novelty of our work lies in this task-centred approach for both the design and the evaluation of VR user interactions.
About our task-centred methodology and our evaluation approach in particular, we first followed the principles stated by Bowman et al. about usability [
61,
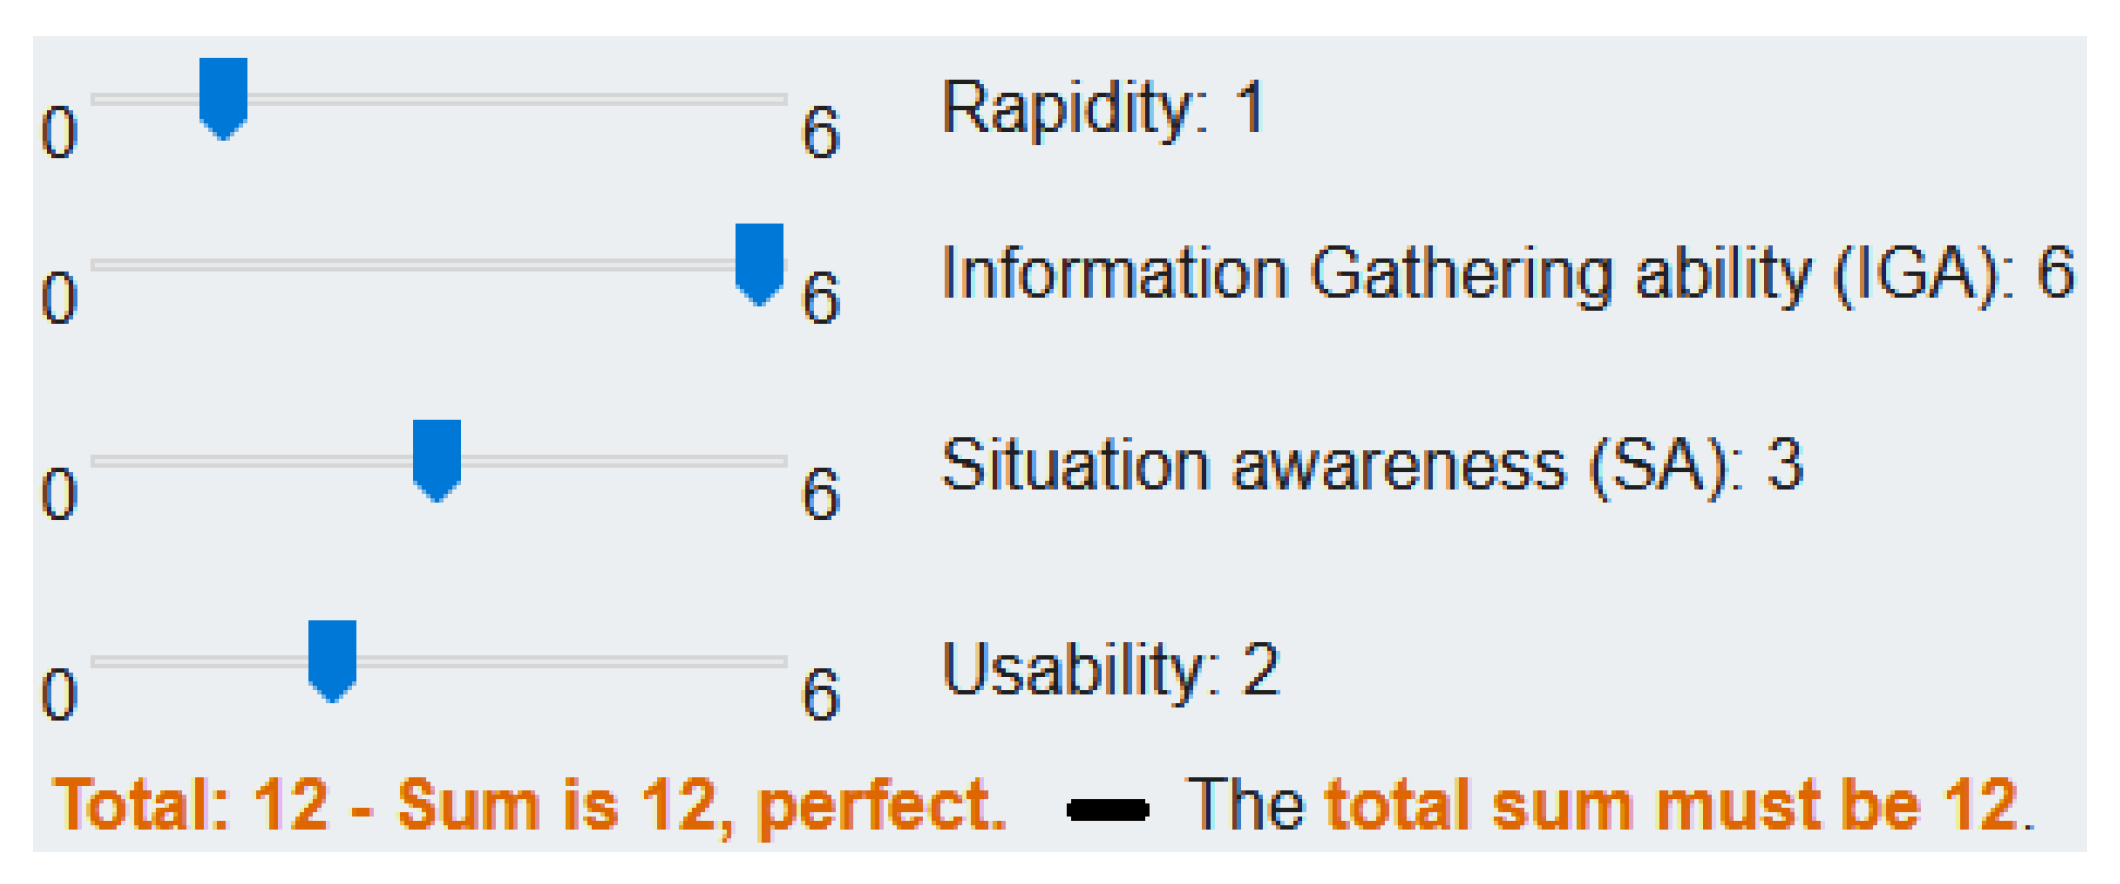
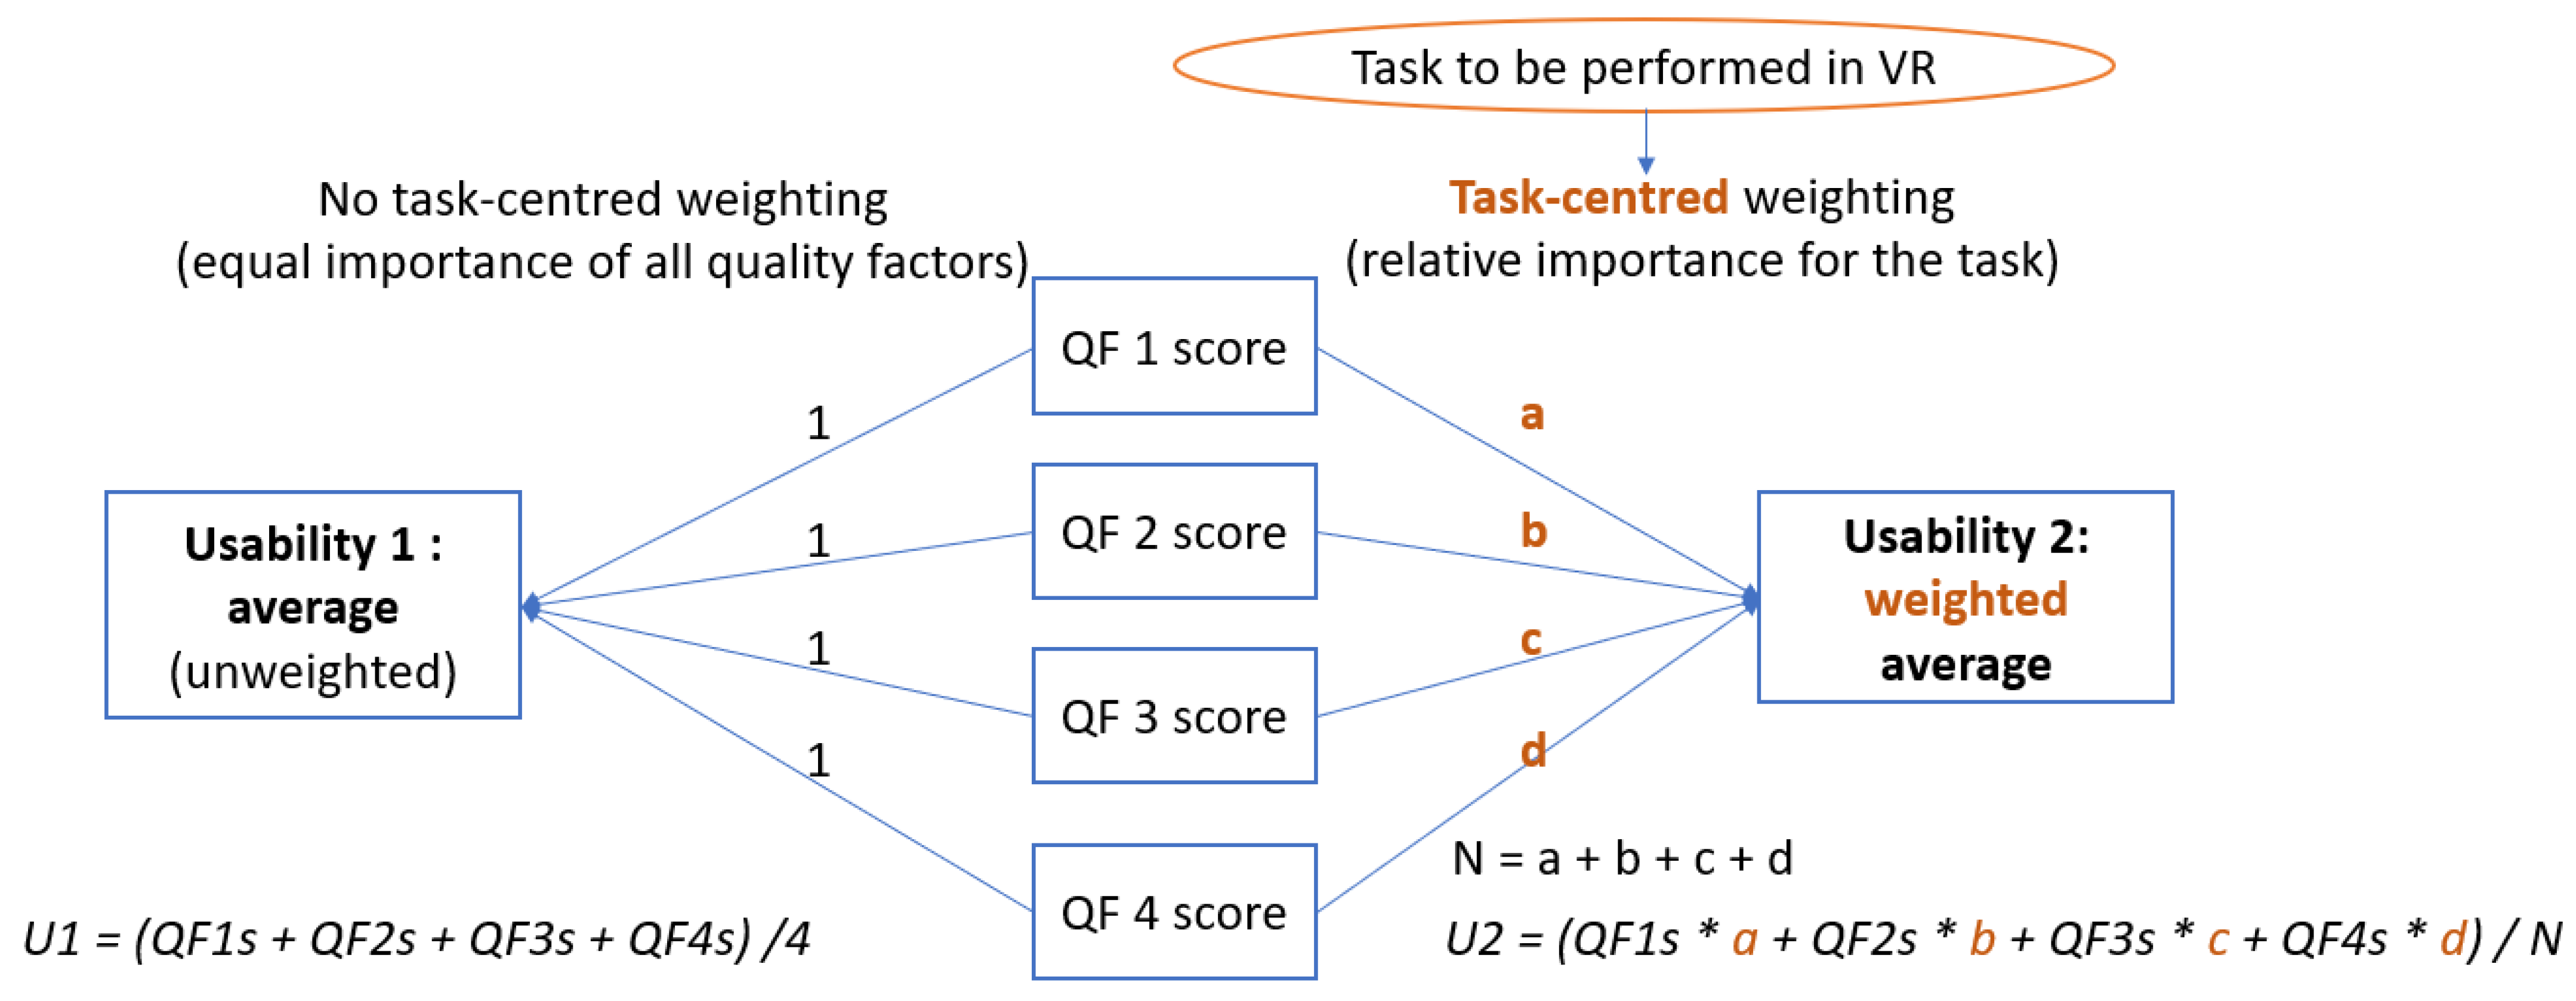
62]. Therefore, we mainly based our evaluation approach on the use of quality factors to define and determine the usability of VR user interaction techniques. Then, we aimed to strengthen the use of these usability quality factors in a task-centred way. Hence, we proposed to attribute different weights to the quality factors, which represent their relative importance for the current task. Then, these weights could be used to perform a task-centred computation of the usability of an interaction technique. In the user evaluation that we conducted in this paper, we computed both weighted-sum and unweighted (simple-sum) usability scores, to compare our task-centred evaluation approach with a non-task-centred one [
59,
60]. We expected that weighted and unweighted scores would give different interpretations about the usability of two different interaction techniques that we tested here. We present in
Section 2 our task-centred methodology, how we applied it on the hazard identification case study, and the user evaluation that we conducted to test our hypothesis. Results of our experiment are given in
Section 3. Finally,
Section 4 provides an interpretation of these results, and
Section 5 gives some conclusions regarding this study and ideas of future work.
4. Discussion
4.1. Statistical Analysis on Desktop Application Usability Scores and Discussion
For our desktop application dataset,
Table 5 (on the top) shows the
p-values obtained from the two-way ANOVA conducted on all our quality factor scores, considering the interaction technique and scenario factors, and
Table 6 (on the bottom) shows the ones obtained for all our usability scores. Scenario
p-values revealed no significant effect as shown previously in
Table 3. Focusing then on the interaction technique factor,
Table 5 (on the top) shows its related
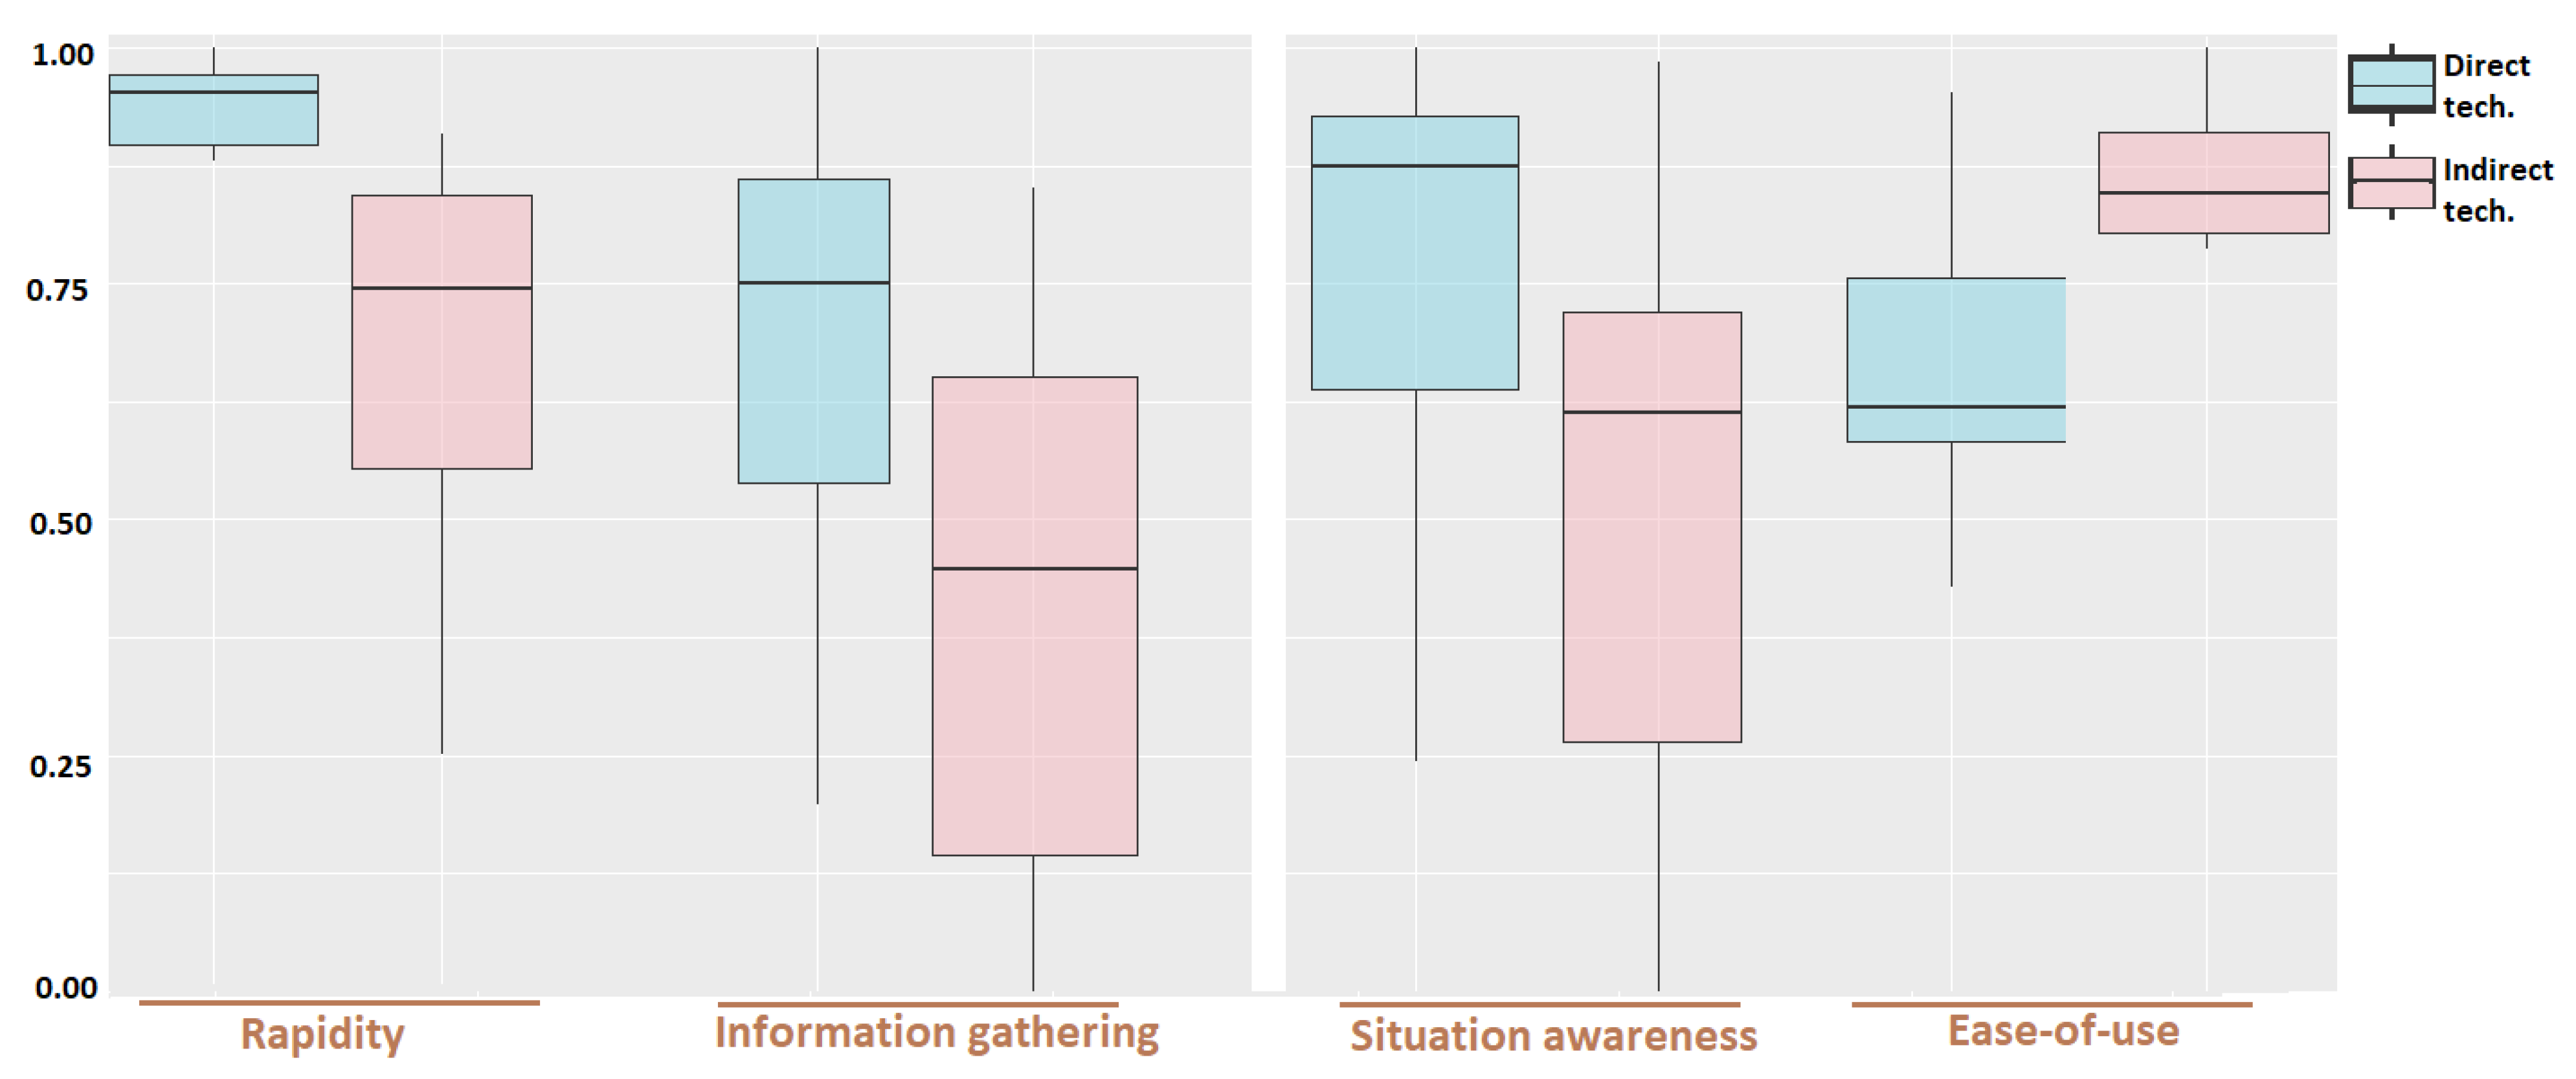
p-values for the rapidity, information gathering, situation awareness and ease of use scores, and
Table 6 (on the bottom) for the four usability scores.
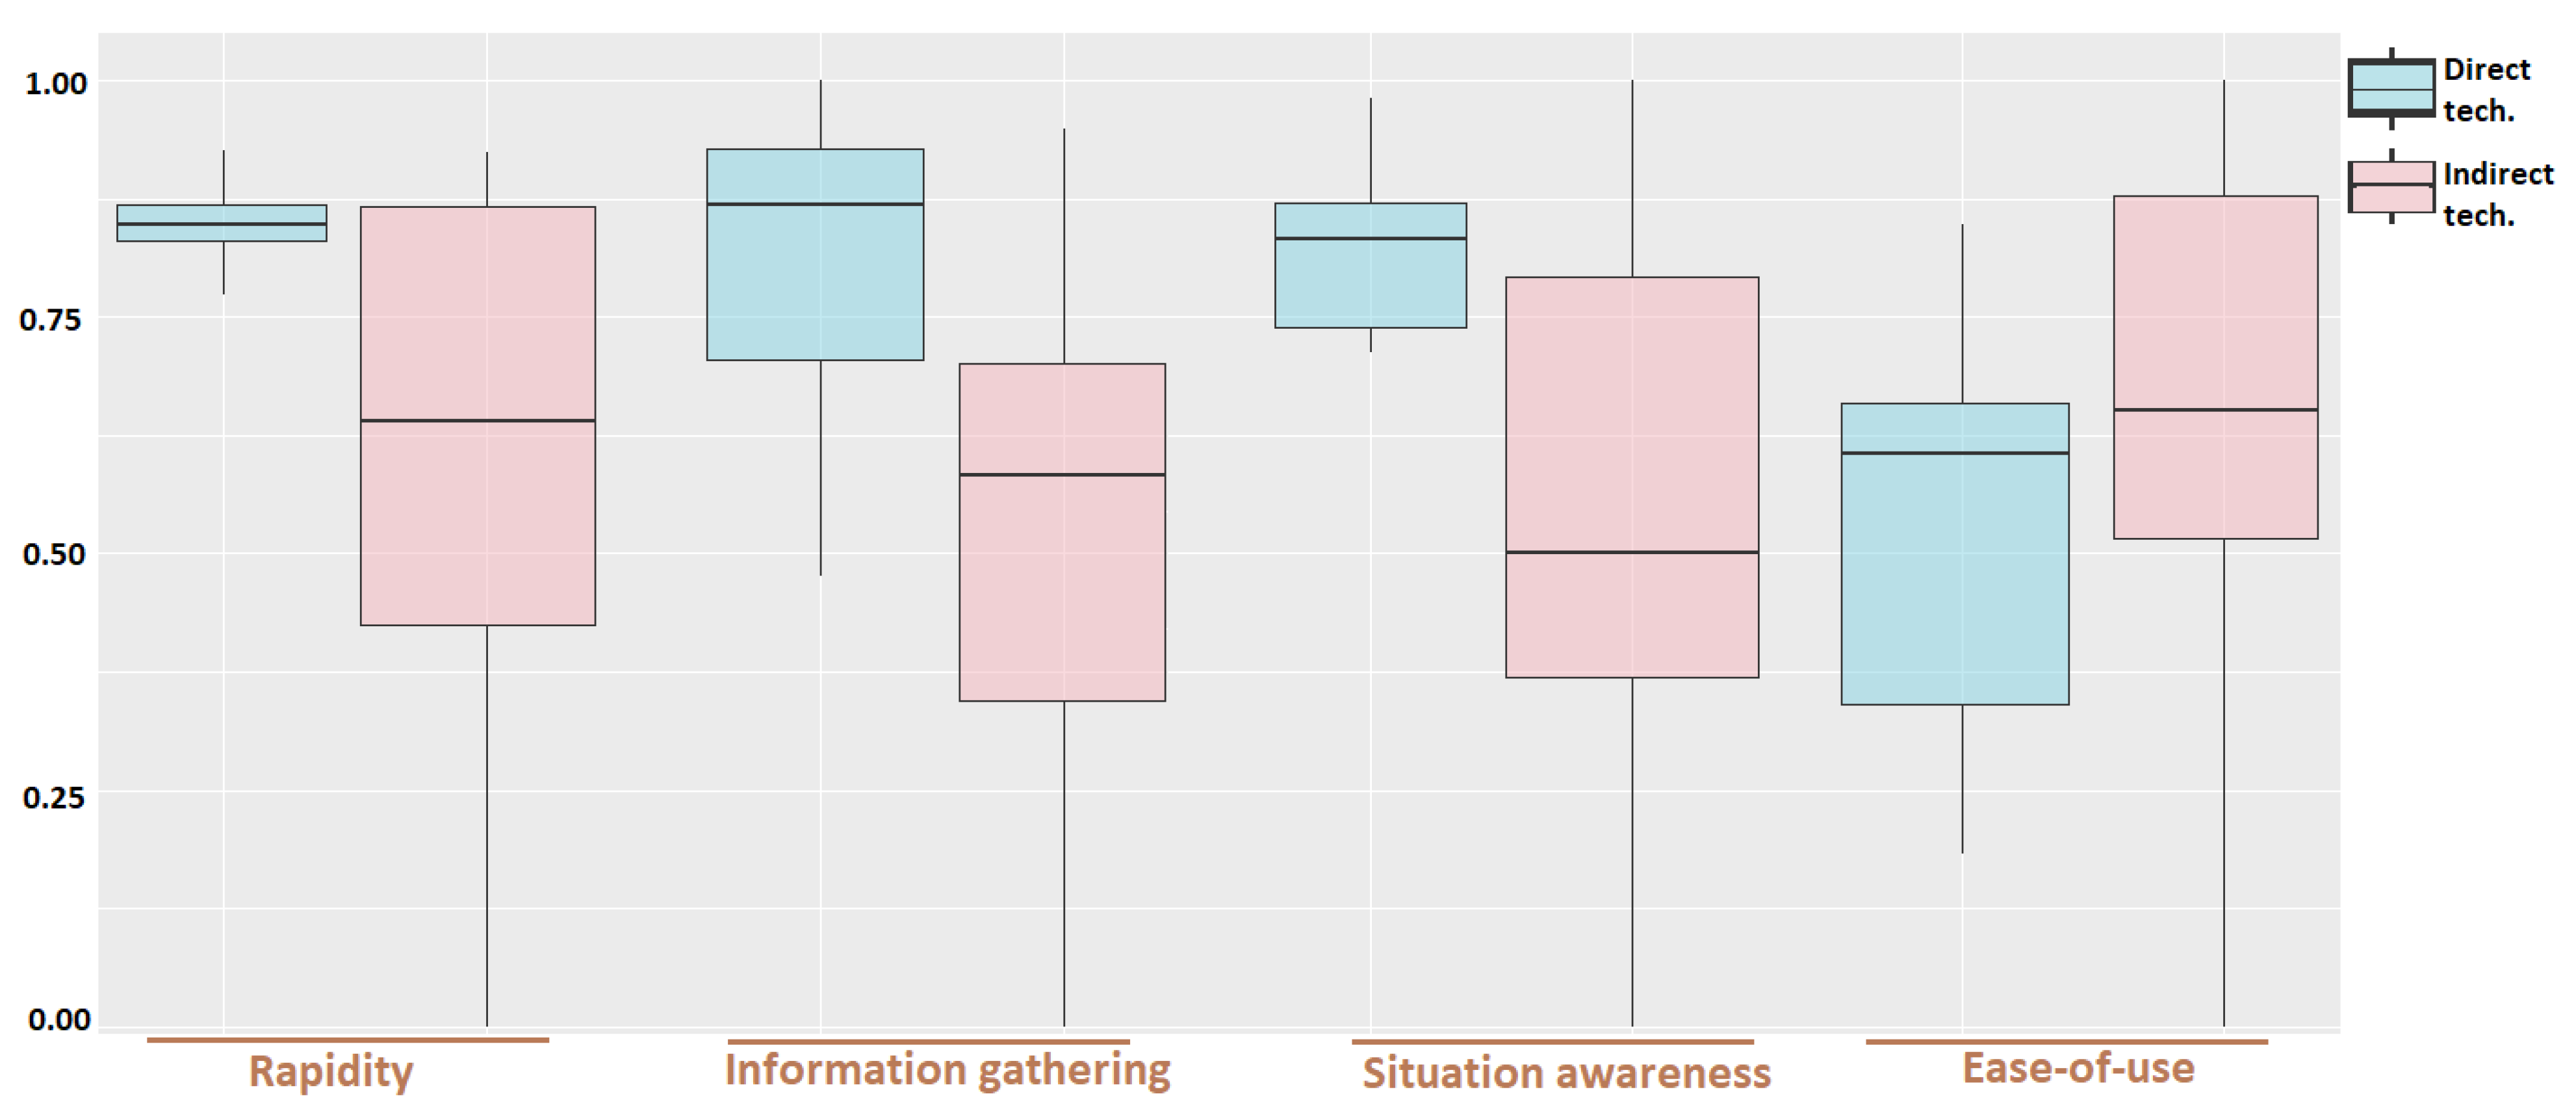
This statistical analysis confirmed the results observed previously in the figures. First, the interaction technique factor does have a significant effect on the rapidity, information gathering and situation awareness scores with p-values of 0.006, 0.002, and 0.013, respectively, on a level of significance of = 0.05. By looking at the results, the best scores for these quality factors are with the direct interaction technique. Moreover, there is no significant effect of the interaction technique on the "ease of use" scores, even if a subtle trend can be noticed with better scores with the indirect technique.
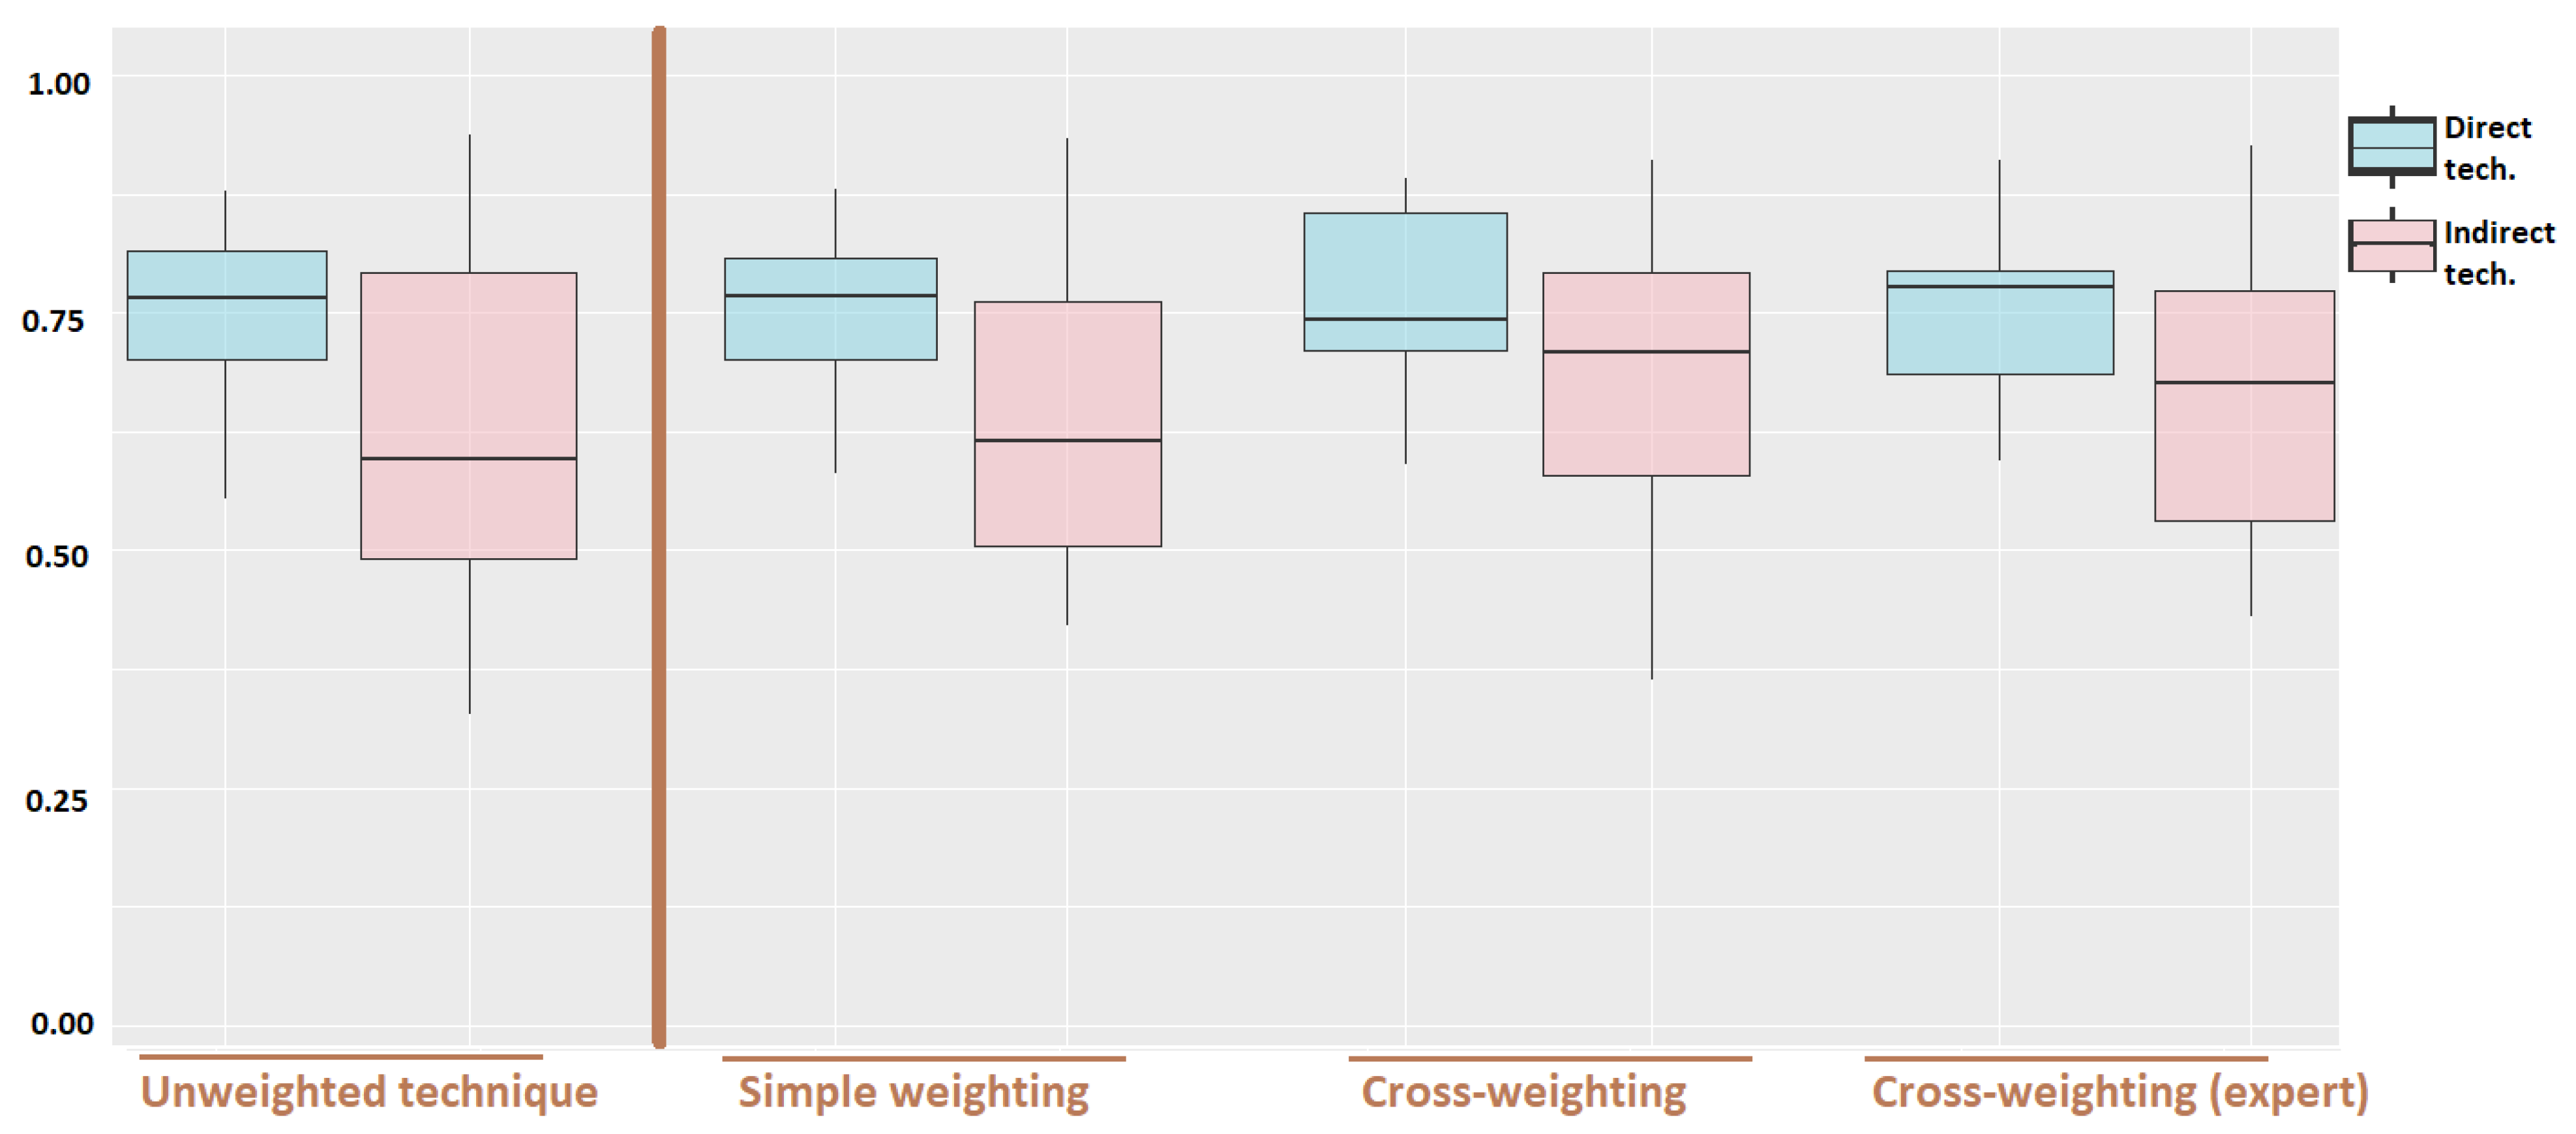
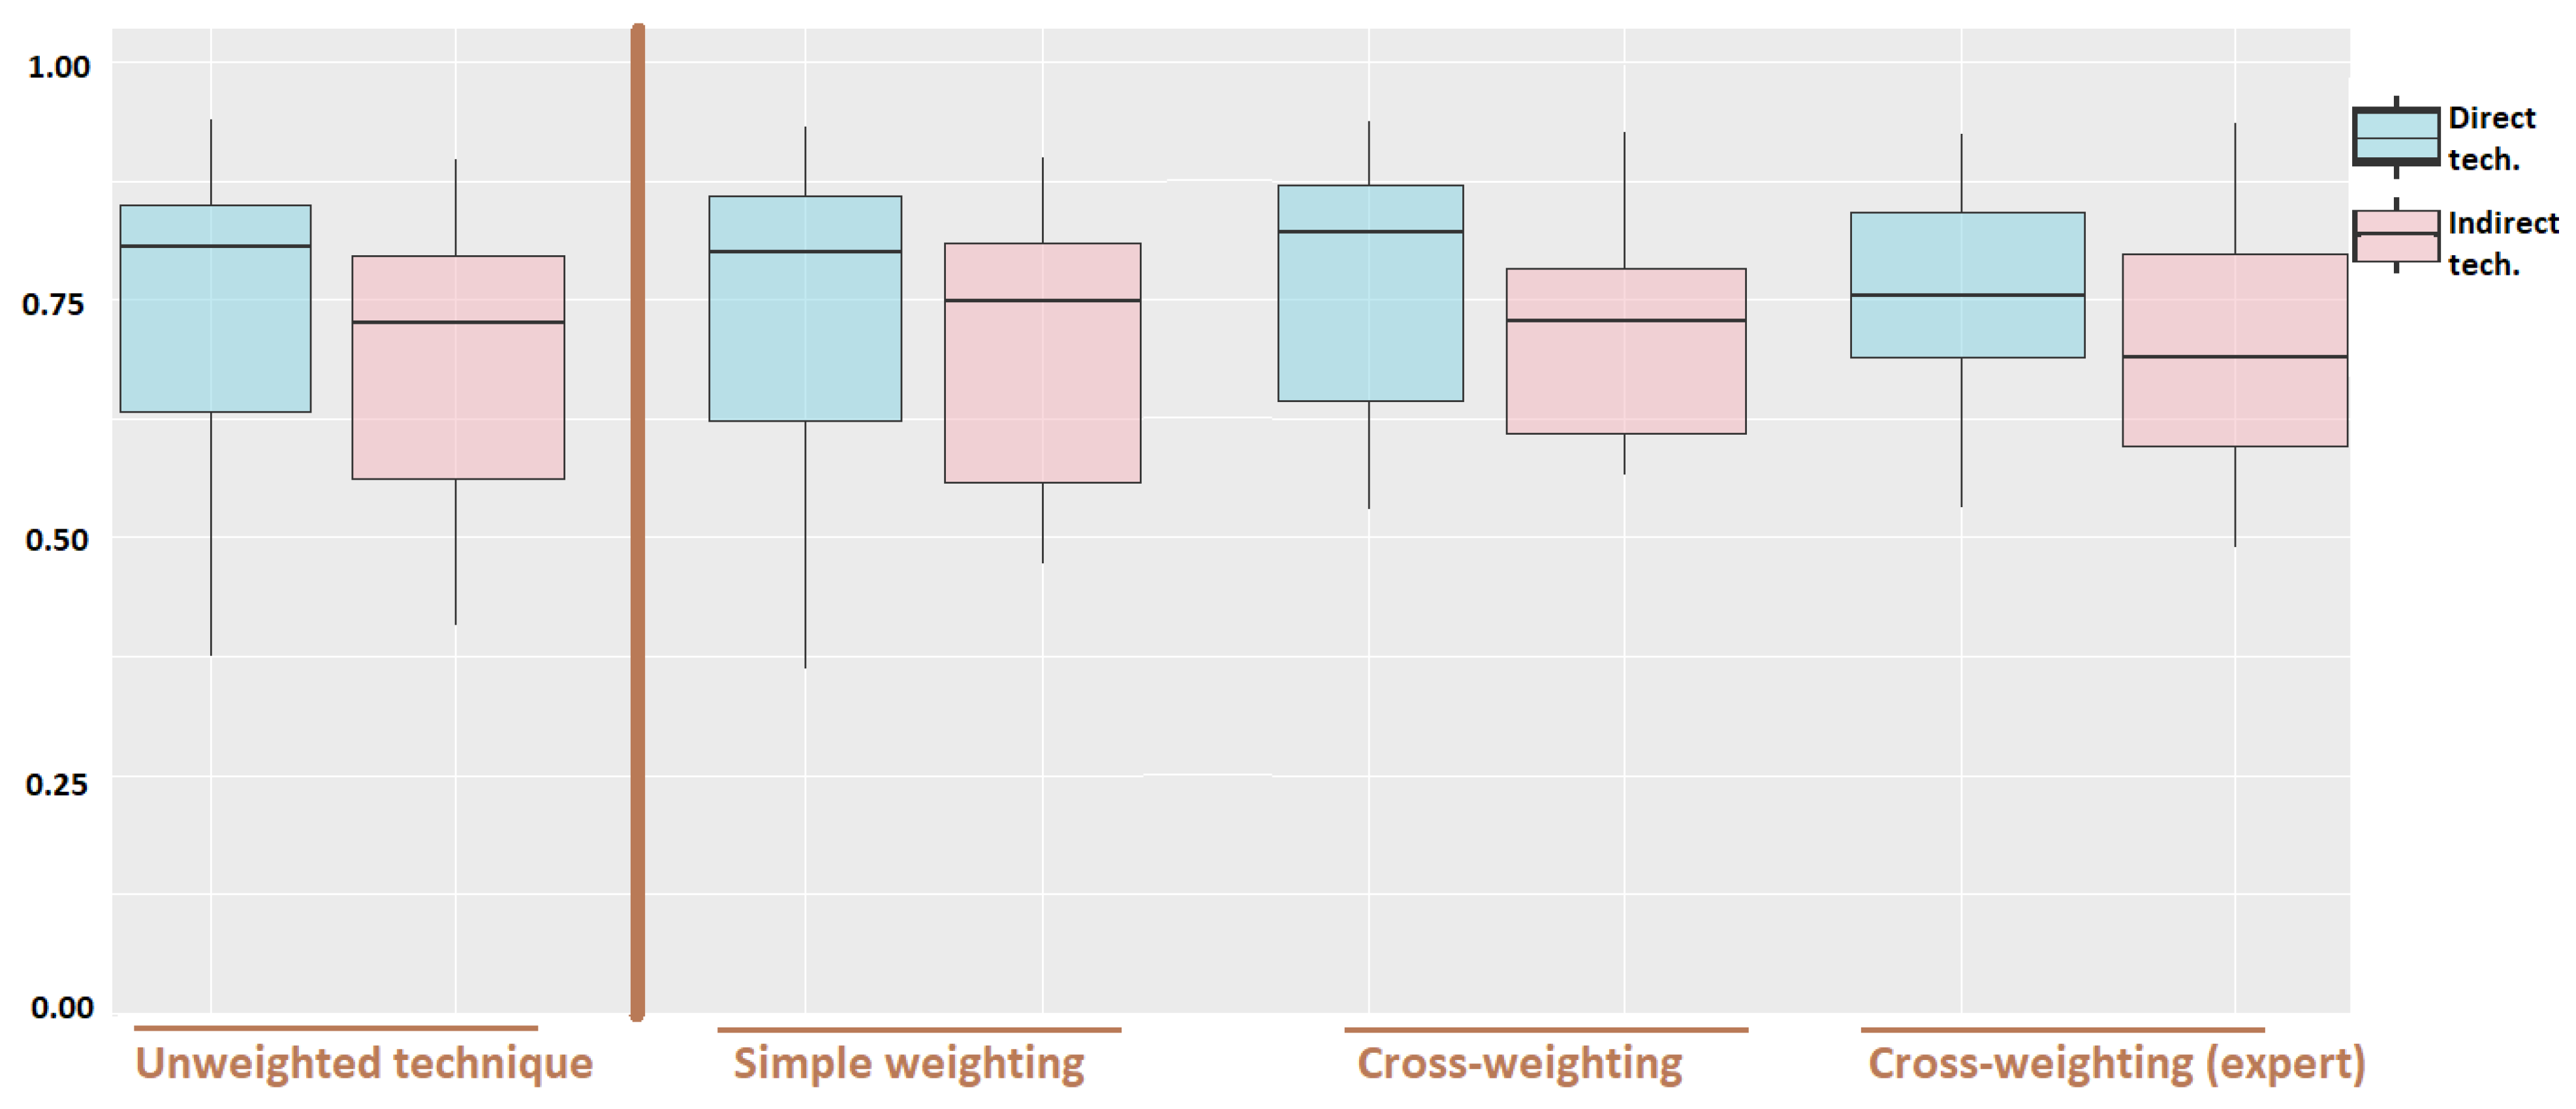
Then, this analysis shows that the interaction technique factor does have a significant effect on the unweighted usability score with a p-value of 0.048 on a level of significance of = 0.05. With the simple-weighting, this is the same, with a p-value of 0.032 on a level of significance of = 0.05. However, with the cross-weighting usability scores, both with the weighting defined by the users and the expert one, there is no significant effect of the interaction technique with p-values of 0.090 and 0.085, respectively, on a level of significance of = 0.05. These last results tend to confirm our hypothesis about the effect of our task-centred approach on the interaction technique usability results. Indeed, the interpretation of the usability results for our two navigation interaction techniques with weighted scores is different and opposed to the one done for the unweighted scores results.
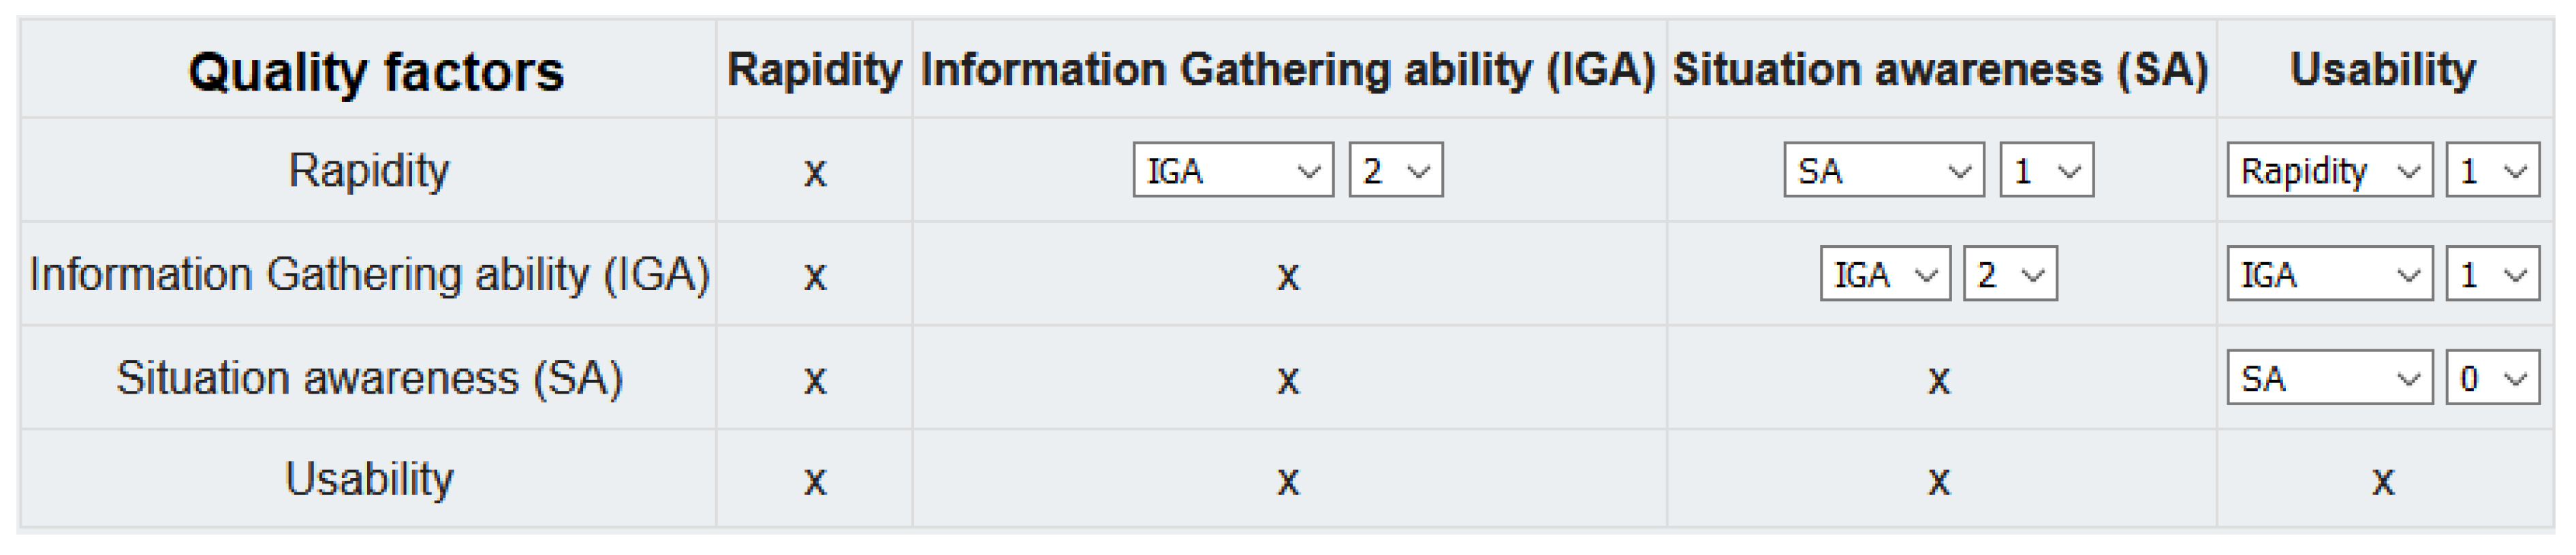
In total, with this desktop application, two over three weighted computations led to an interpretation that is different compared to the one with the unweighted computation, as expected from our hypothesis. Nonetheless, due to this unexpected result with the computation from the simple-weighting technique, some future research should be done on the techniques used to define the quality factors weights. In this experiment, such differences could be explained by the fact that, even if it may be more complex for the users, the cross-weighting technique allowed for a weighting distribution by the users that was closer to the expert one than with the simple-weighting. Indeed, in our experiment, it was expected for the participants to attach the greatest importance to the information gathering quality factor, since this is the most important quality factor for this task of exploration and identification, by definition. However, recomputing the weights with a total of 12 points in all the cases for both weighting techniques, on average the participants gave more importance to this quality factor with the cross-weighting technique—average: 5.20—than with the simple-weighting—average: 4.16. Similarly, it was expected to obtain the lowest possible weights for the least important quality factor for this task, the rapidity; once again, on average our users gave less importance to it with the cross-weighting technique—average: 1.15—than with the simple-weighting technique—average: 1.67.
4.2. Statistical Analysis on HMD Application Usability Scores and Discussion
For our HMD application dataset,
Table 7 (on the top) shows the
p-values obtained from our three-way ANOVA on all our quality factor scores, considering the interaction technique, order and scenario factors, and
Table 8 (on the bottom) shows the ones obtained for all our usability scores. Order and scenario
p-values revealed no significant effect as shown previously in
Table 4.
Table 7 (on the top) shows the interaction technique
p-values for the rapidity, information gathering, situation awareness and ease of use scores, and
Table 8 (on the bottom) for the four usability scores.
This statistical analysis confirmed the results observed graphically on the previous figures. First, the interaction technique factor does have a significant effect on the rapidity, information gathering, situation awareness and ease of use scores with p-values of 0.043, 0.0002, 0.0006, and 0.0009, respectively, on a level of significance of = 0.05. Looking at the scores, the best ones are with the direct interaction technique for the rapidity, information gathering, and situation awareness quality factors, whereas for the ease of use the best scores are with the indirect interaction technique.
Then, the analysis shows that the interaction technique factor does have a significant effect on the unweighted usability score with a p-value of 0.048 on a level of significance of = 0.05. However, with all our three different weighted scores proposed here—the simple-weighting, the cross-weighting by the users, and the expert weighting—there is not a significant effect of the interaction technique factor on the usability scores, with p-values of 0.200, 0.638, and 0.114, respectively, on a level of significance of = 0.05. This means that with the HMD application, in our user study three over three weighted techniques gave opposite results and interpretations for the evaluated interaction techniques, compared to the unweighted evaluation. These results confirm our hypothesis about the effect of our task-centred approach on the interaction technique usability results and their interpretation, and its difference with a non-task-centred approach.
5. Conclusions and Future Work
Virtual reality simulations are paramount in the workflow of numerical engineering, before physical actions in reality such as on a worksite in the case of the AEC industry. In this context, we presented in this paper our task-centred methodology to design and evaluate virtual reality user interactions. To improve this numerical workflow, we created this methodology to guide and facilitate the design of VR applications by VR end users. Indeed, our methodology provides them with the benefit of a formalised approach for the design of VR user interactions, which they can follow without having VR expertise. Through a guided analysis of a user task and its characteristics, a professional in the field to which this task belongs can obtain proposals of VR user interaction designs with our semi-automated system in very few steps. About the evaluation of these VR user interaction designs, our task-centred approach allows for the formalisation of the users’ needs, which improves as a result the quality of the VR user interaction designs in terms of usability. Moreover, this formalisation should also help the VR end users to reduce the number of required iterations when creating a VR application for their specific purposes.
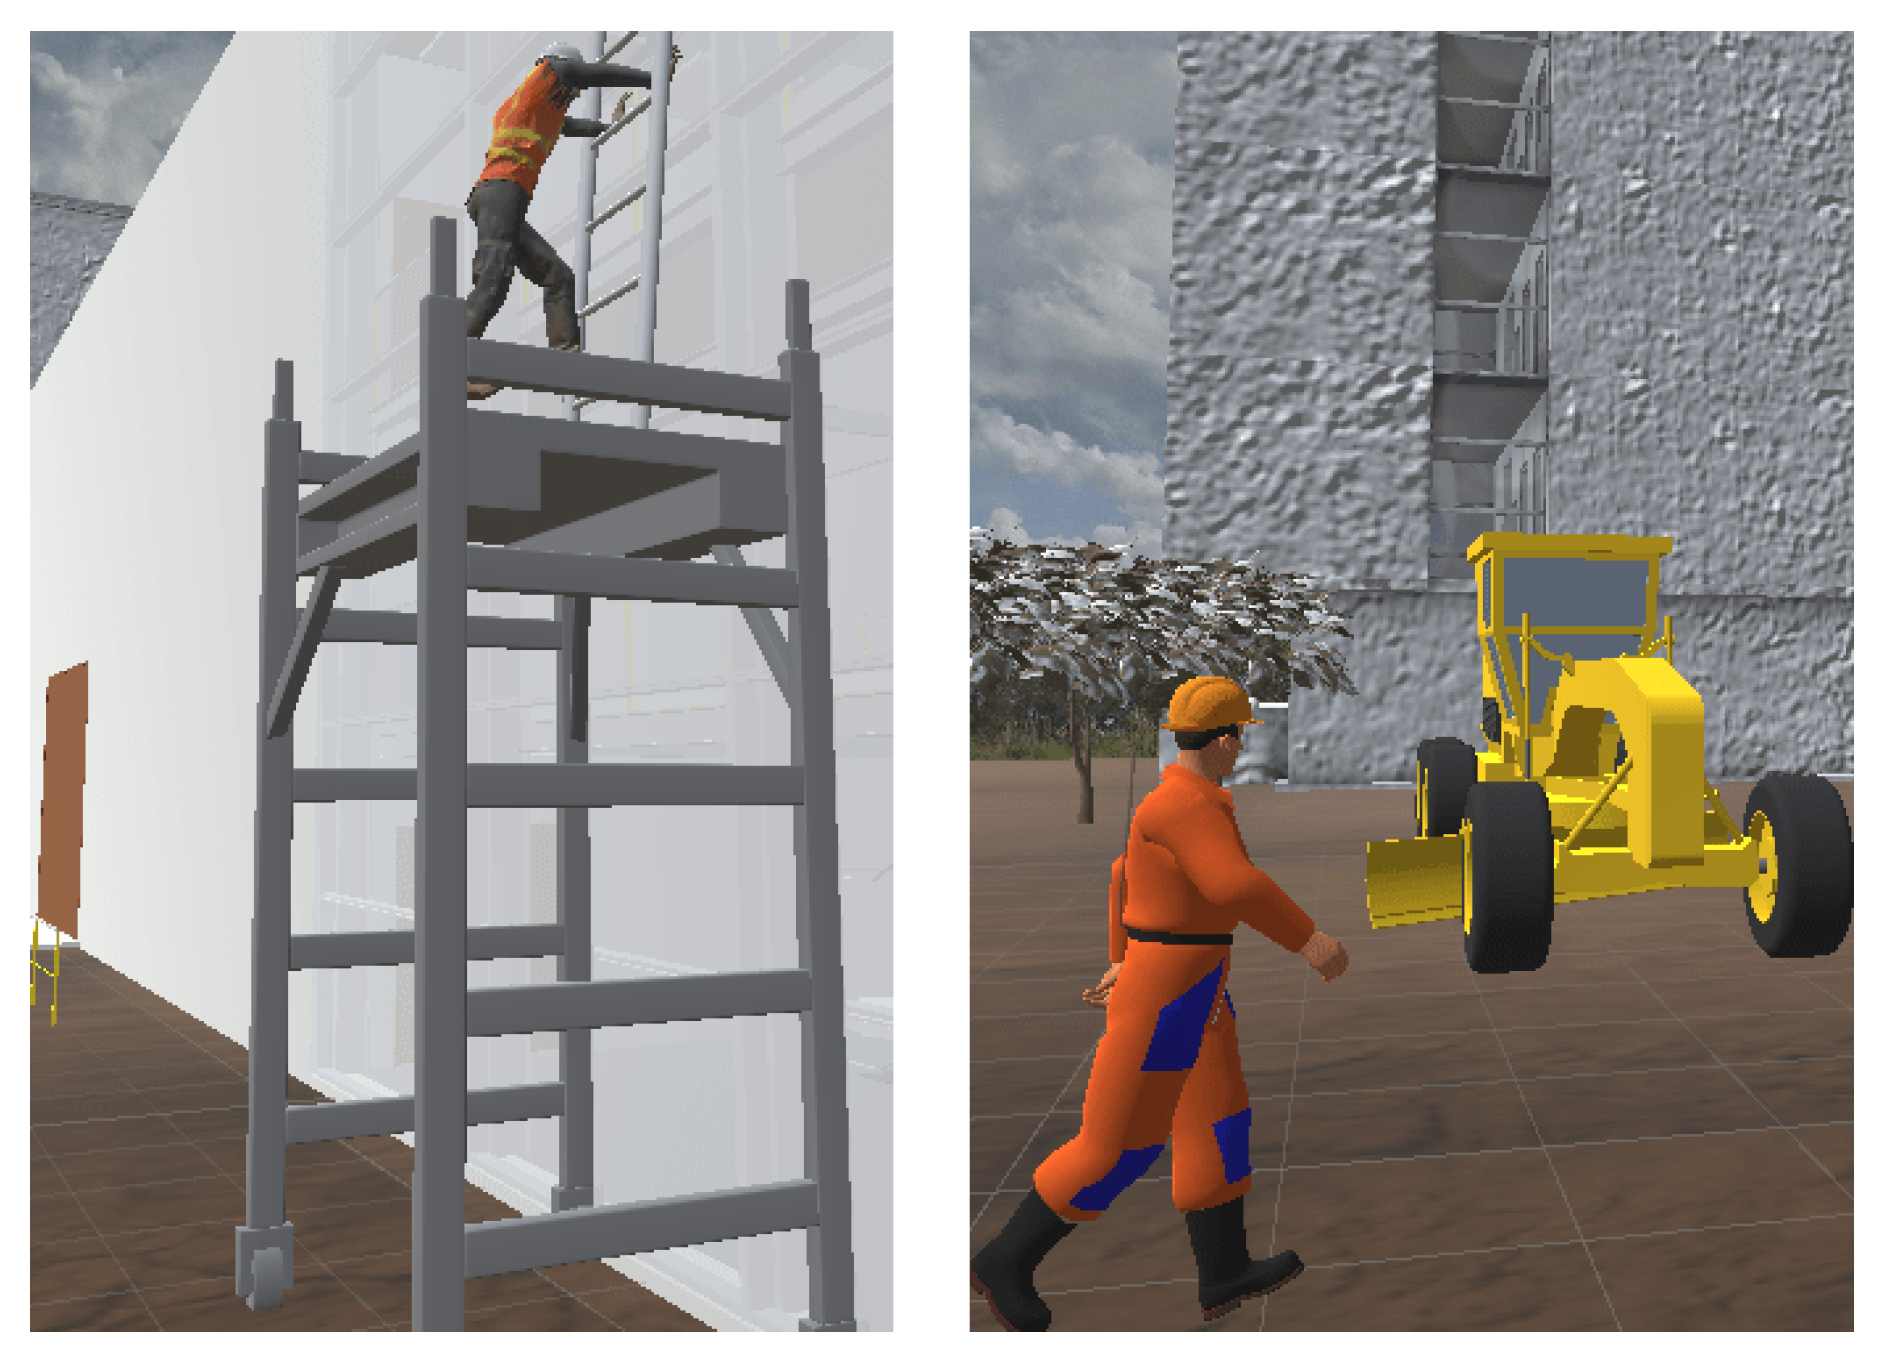
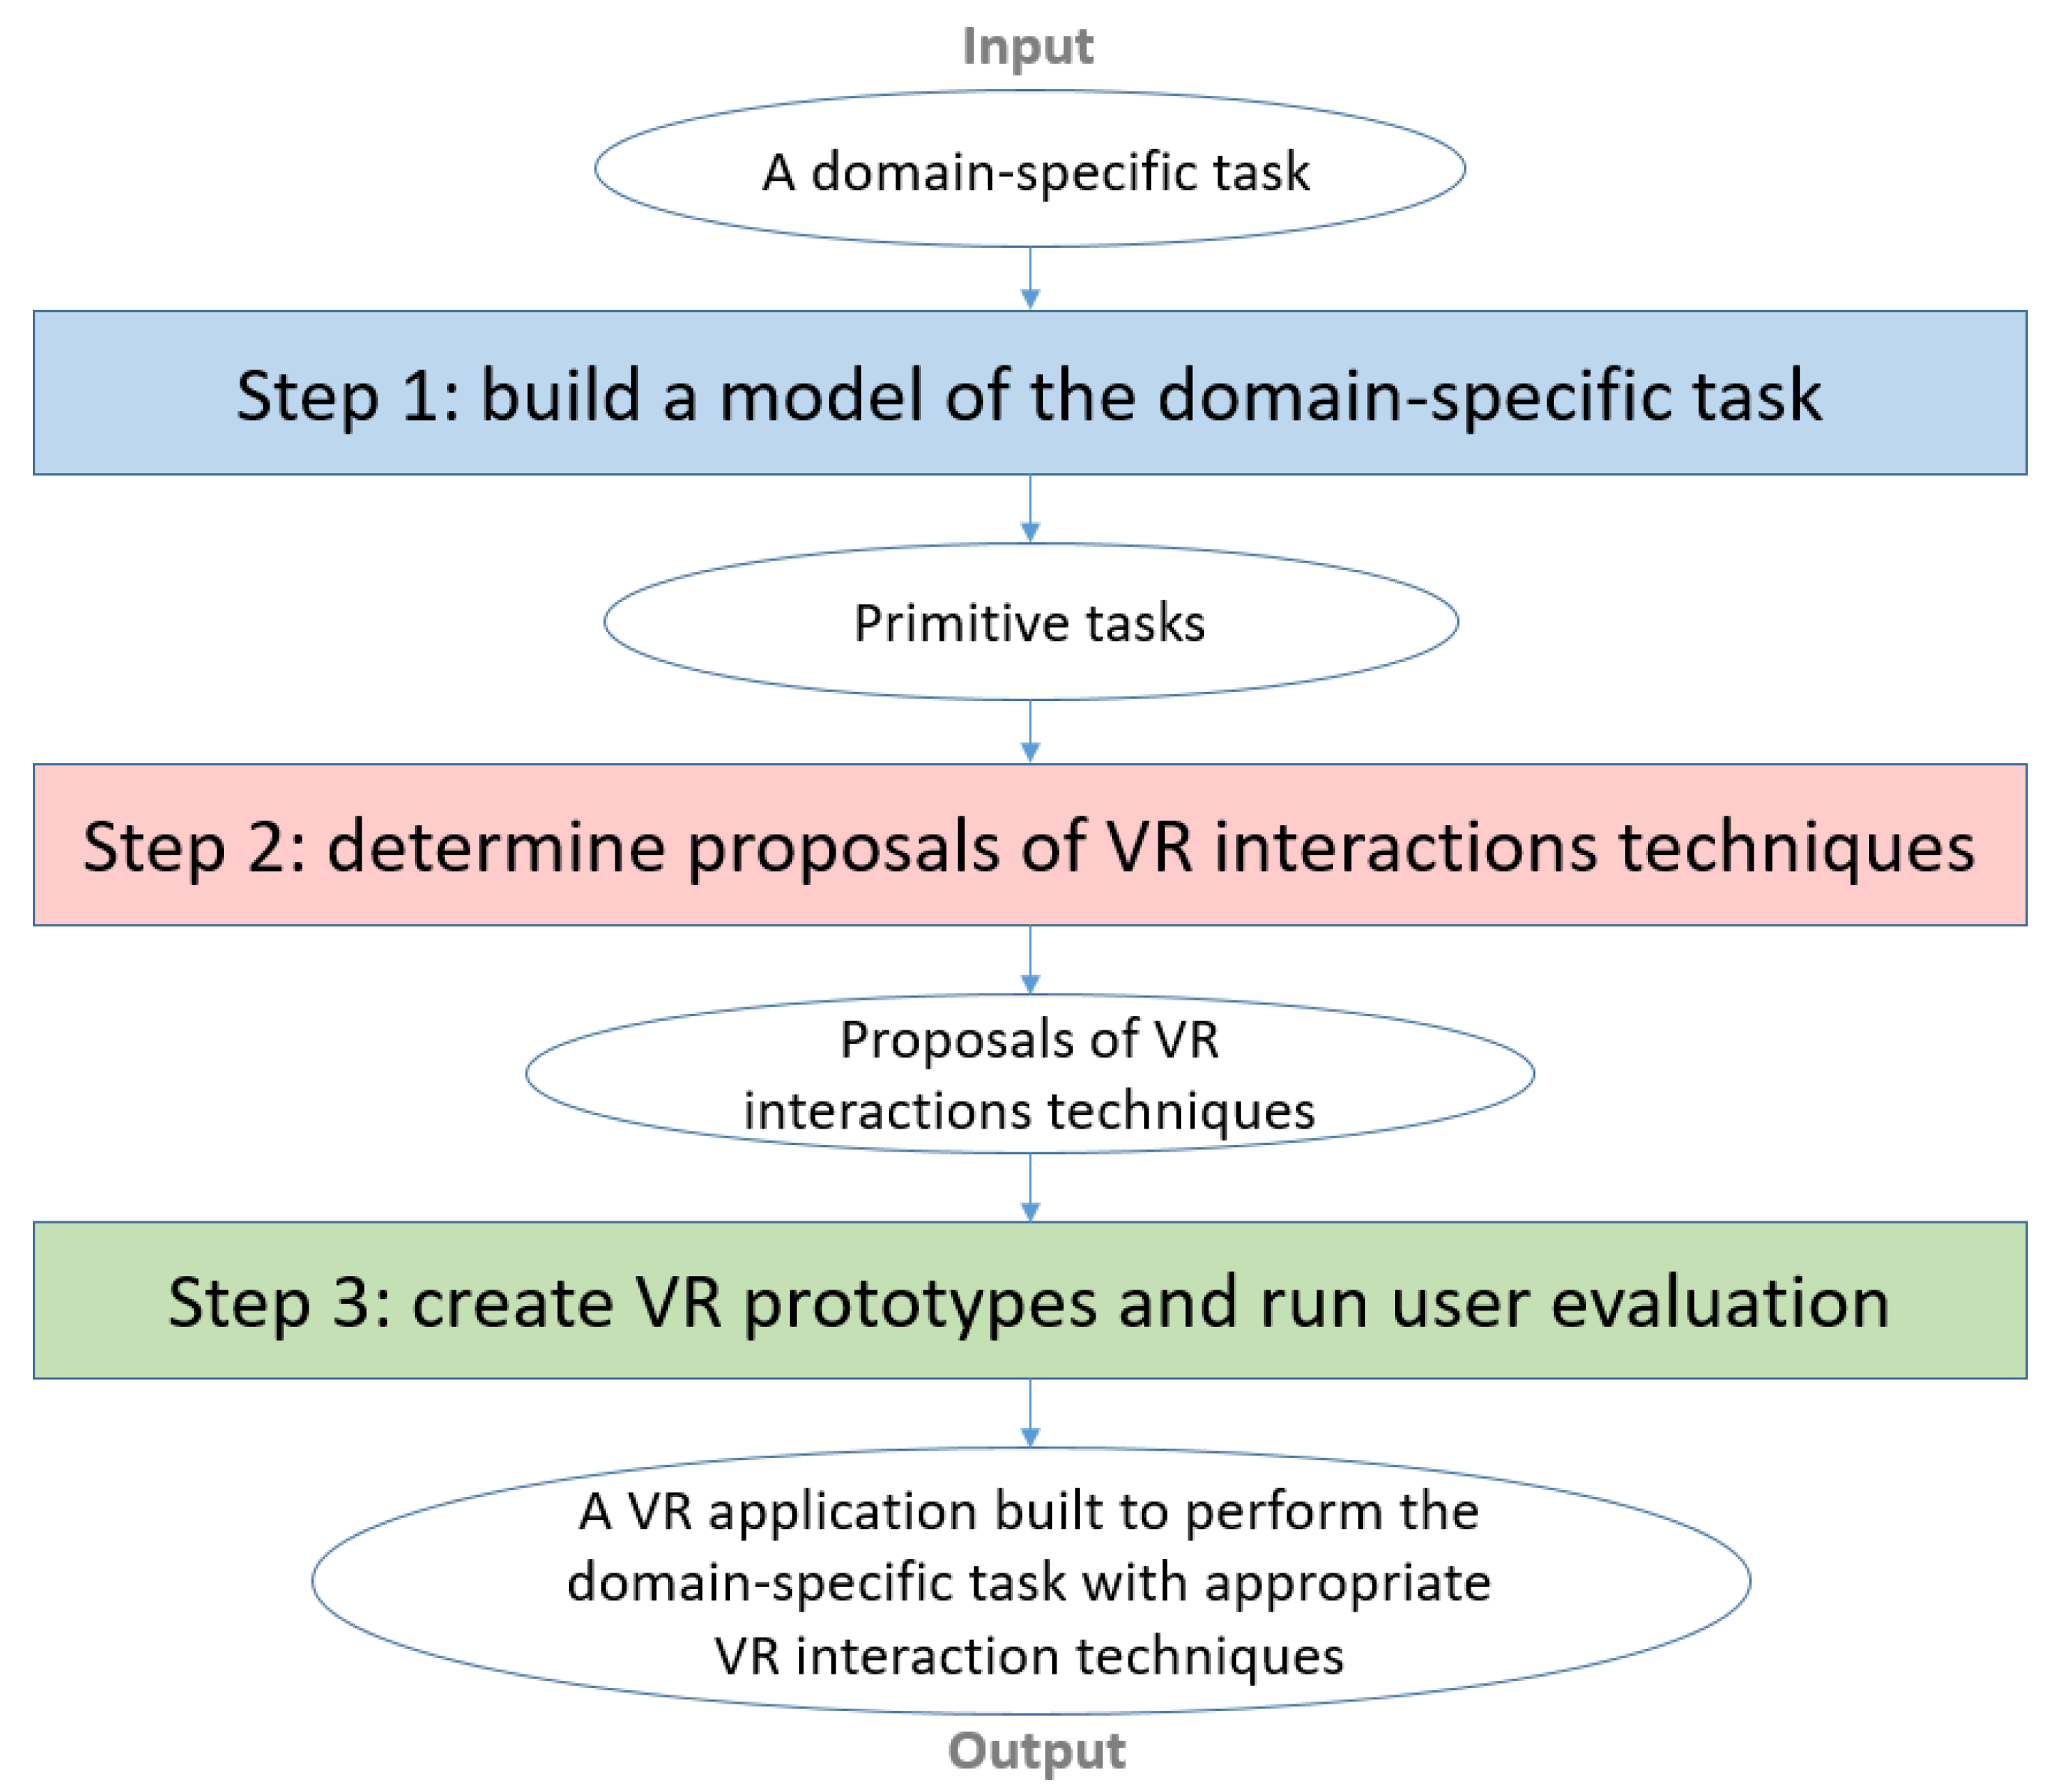
After that, we showed in this paper how we applied our task-centred methodology on the case study of the hazard identification task: construction of a model of the task, determination of proposals for the design of VR user interaction, and user evaluation. For the subtask of worksite exploration, we obtained two possible designs of navigation interaction techniques. These two interaction techniques could then be prototyped, evaluated and compared in terms of usability in our evaluation step, which mainly relies on applying a task-related weight on each quality factor used in the current evaluation. In this study, we proposed to compare the usability results and interpretations of our task-centred evaluation with weights, with the ones without applying such different weights and letting all the quality factors at the same level of importance. Our hypothesis was that our task-centred evaluation based on weights would give usability results that could be interpreted in a significantly different way in comparison with a non-task-centred evaluation without any task-related weights.
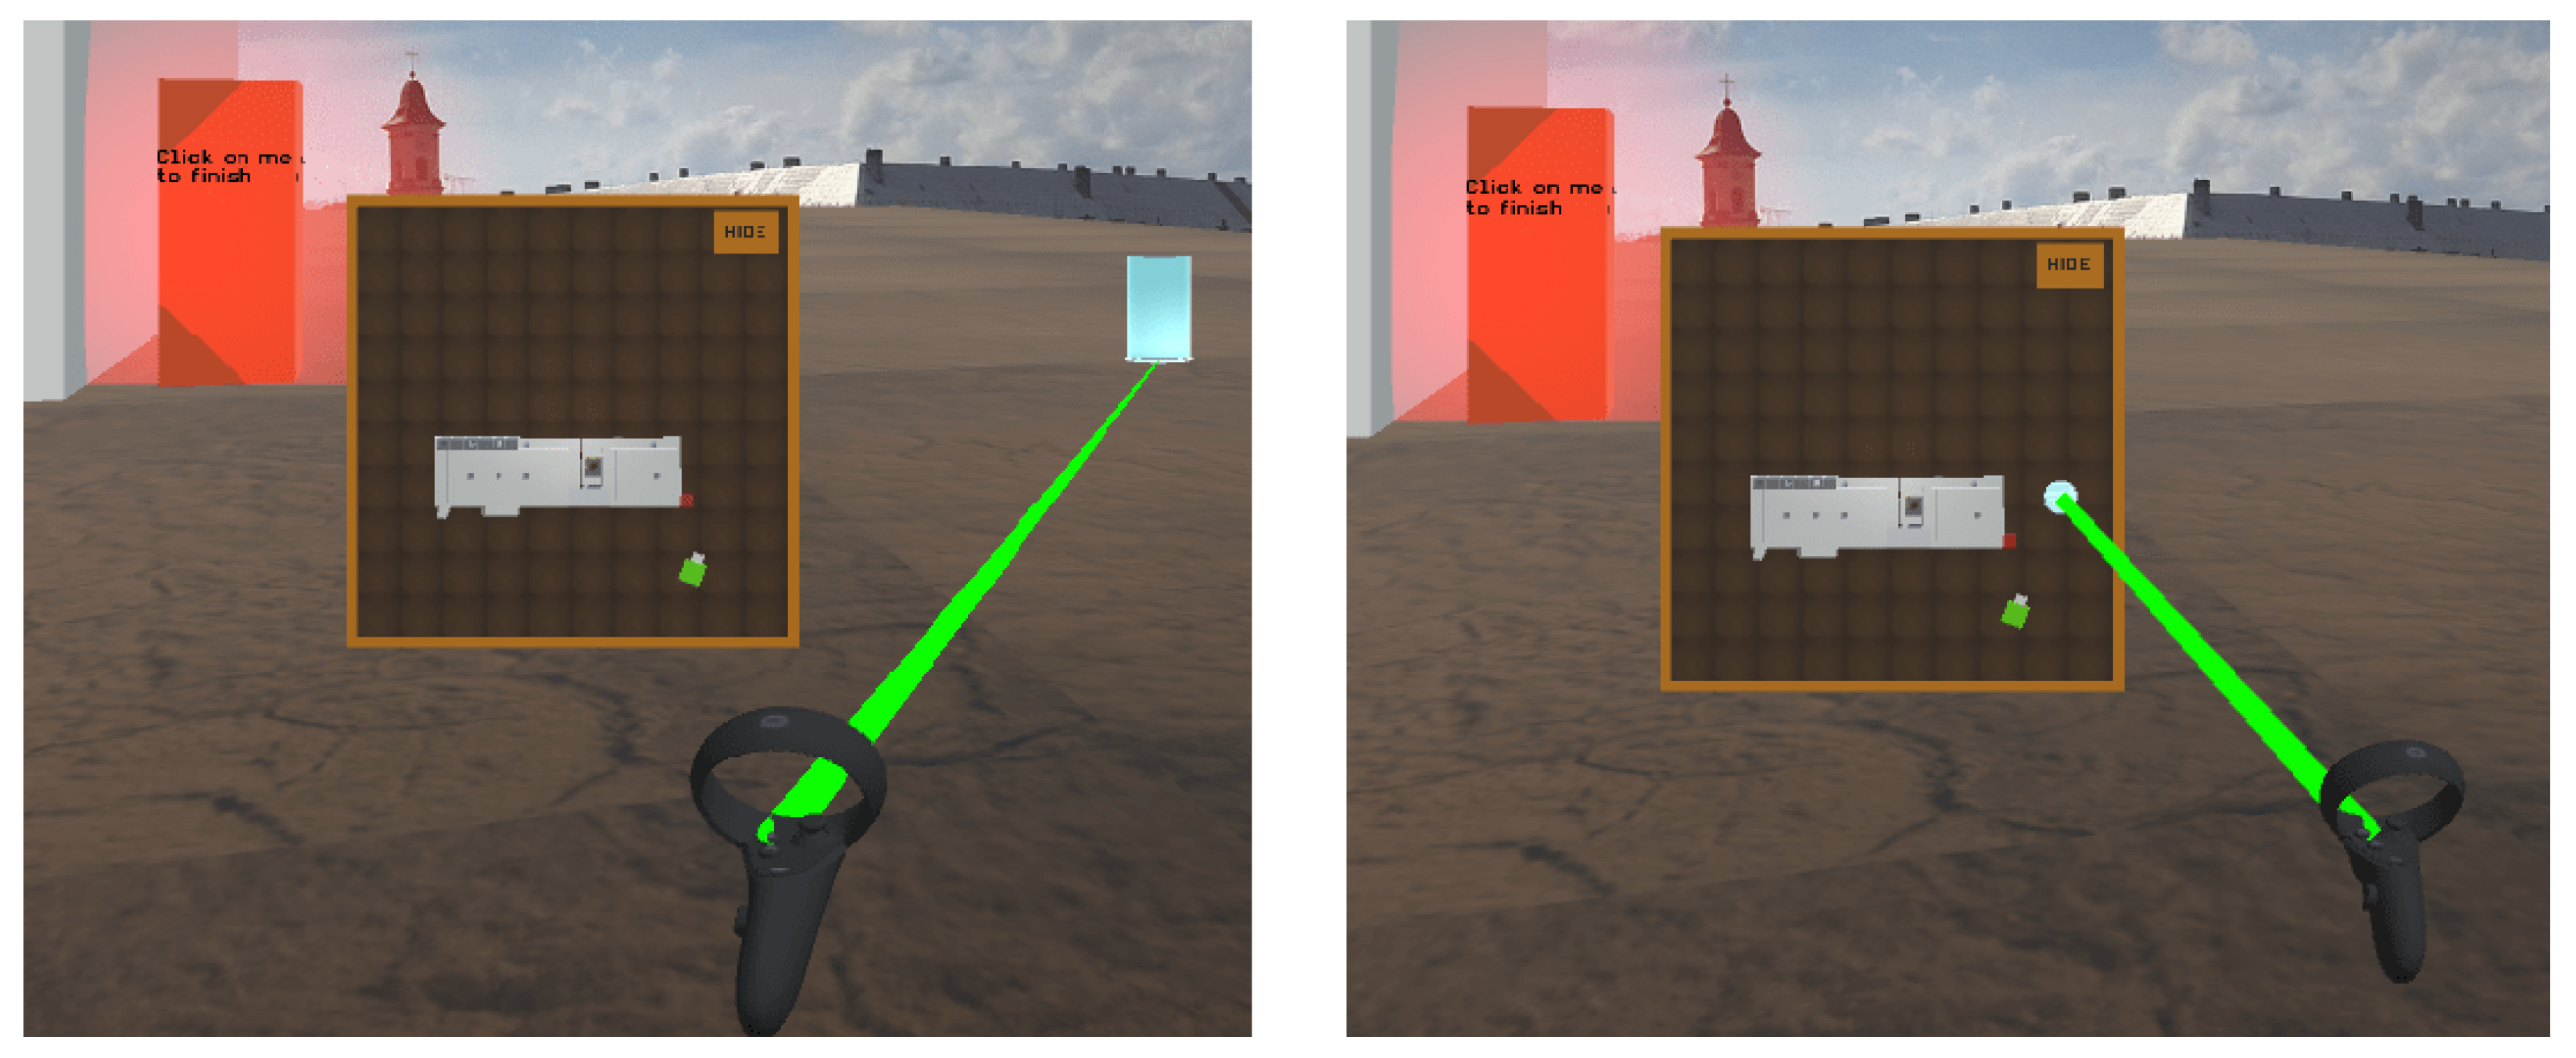
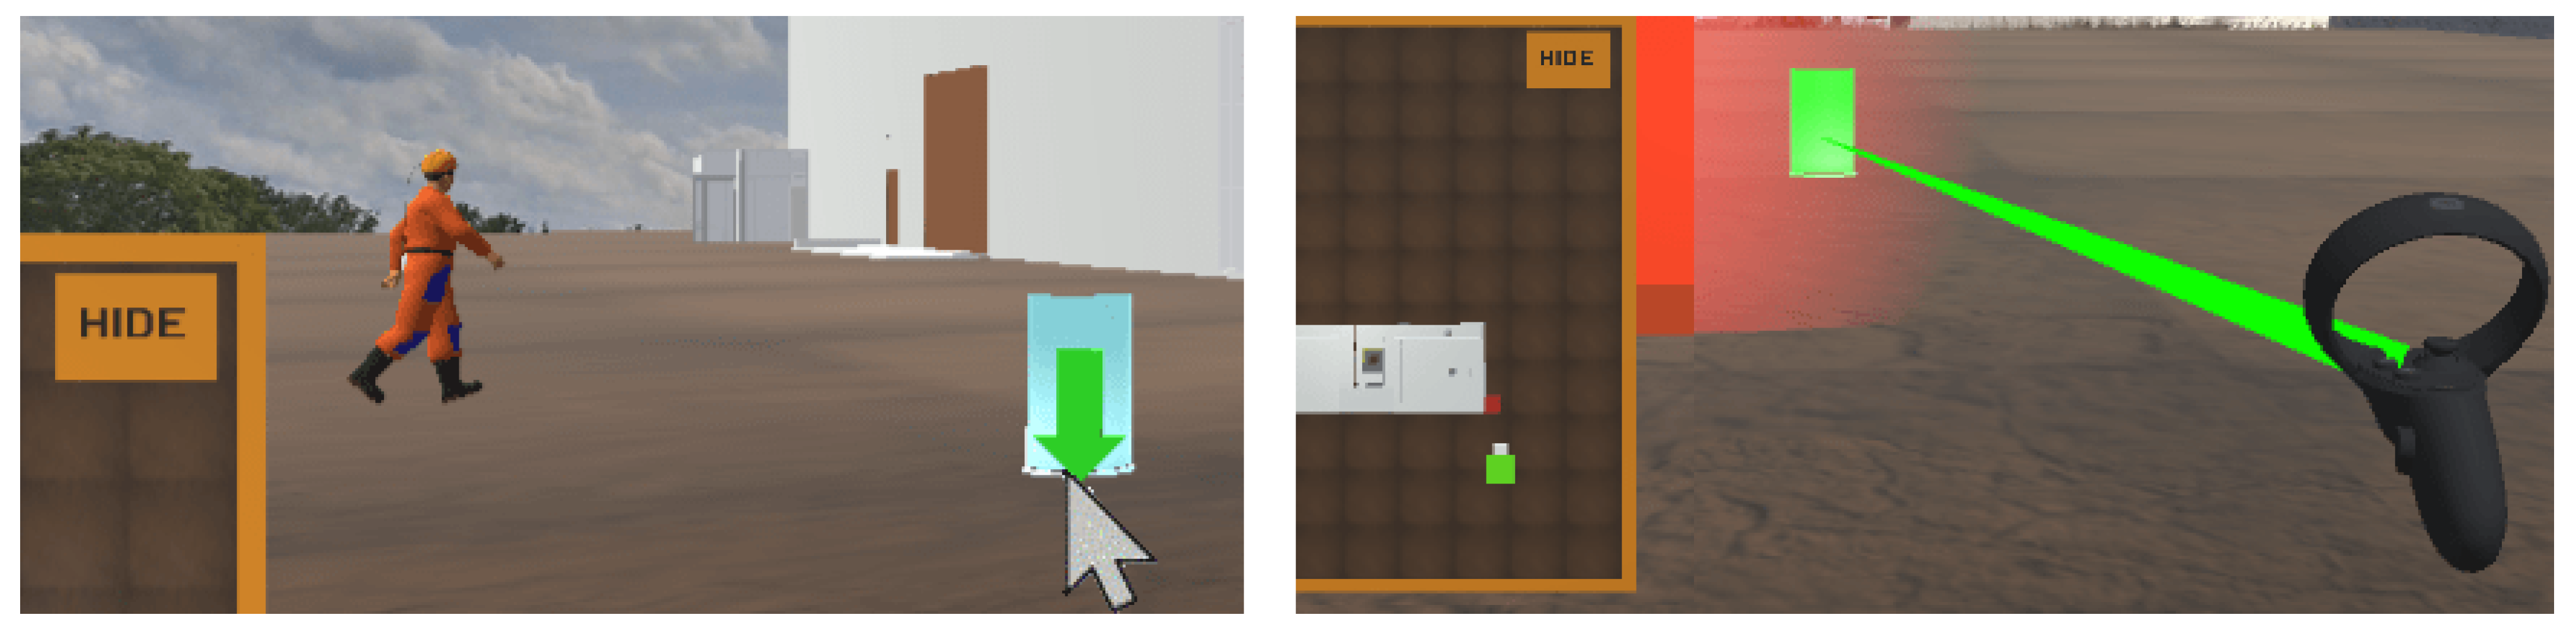
To run this study and its related user evaluation, we built VR applications with our two different navigation interaction techniques. Due to the sanitary crisis context, we conducted this experiment remotely and our users participated through remote modalities—either a desktop application or an HMD application. We took different measures for each quality factor about this navigation interaction, and then we computed both weighted usability scores—with three different formulas—and unweighted ones. Considering both our desktop and HMD modalities, five over six weighted usability scores computed here give an interpretation of the results that is opposed to the one obtained using unweighted usability scores. Indeed, our unweighted scores show a significantly different usability for our two navigation interaction techniques, whereas our weighted scores reveal no significant differences in terms of usability. These results verified thus our hypothesis about the difference between task-centred and non-task-centred evaluations of VR user interactions. This validates the importance of following an approach that takes into account the expertise of the professionals in the field to which a task belongs to create a VR application for performing this task, and, therefore, our task-centred approach is validated.
As future work, it would be interesting first to test and evaluate in a user study the different ways that we used to obtain the quality factors weights, since one way led to one weighted computation with different results than our other five ones. Indeed, a dedicated experiment could be conducted on the evaluation of the weighting procedures themselves—simple and cross weightings—with, for example, some criteria of usability, of understanding how to attribute weights, etc. This would be an important verification in order to know which weighting technique should preferably be used in a task-centred evaluation. Then, our results about our hypothesis should be confirmed by running similar experiments on other case studies with different tasks, interaction techniques and quality factors. Additionally, thanks to these other experiments, a machine learning model could be trained with the aim of attributing automatically the quality factors weights according to the user task. Finally, for on-site applications, which are based on the augmented reality technology instead of the virtual reality technology, our task-centred methodology could be adapted for augmented reality interactions, and studies could be conducted applying this modified methodology.


 ,
, 


