
Condition Assessment Framework for Facility Management Based on Fuzzy Sets Theory


1
Operations and Management Department, University of Wisconsin-Stout, Menomonie, WI 54751, USA
2
Construction Management Department, Colorado State University, Fort Collins, CO 80523, USA
3
Civil and Environmental Engineering Department, Colorado State University, Fort Collins, CO 80523, USA
*
Author to whom correspondence should be addressed.
Buildings 2021, 11(4), 156; https://doi.org/10.3390/buildings11040156
Submission received: 5 March 2021
/
Revised: 2 April 2021
/
Accepted: 6 April 2021
/
Published: 10 April 2021
Abstract
:Condition information is essential to develop effective facility management (FM) strategies. Visual inspections and walk-through surveys are common practices of condition assessment (CA), generally resulting in qualitative and subjective outcomes such as “poor”, “good”, etc. Furthermore, limited resources of the FM process demand that CA practices be efficient. Given these, the purpose of this study is to develop a resource efficient quantitative CA framework that can be less subjective in establishing a condition rating. The condition variables of the study—mean time between failures, age-based obsolescence, facility condition index, occupant feedback, and preventive maintenance cycle—are identified through different sources, such as a computerized maintenance management system, expert opinions, occupants, and industry standards. These variables provide proxy measures for determining the condition of equipment with the implementation example for heating, ventilating, and air conditioning equipment. Fuzzy sets theory is utilized to obtain a quantitative condition rating while minimizing subjectivity, as fuzzy sets theory deals with imprecise, uncertain, and ambiguous judgments with membership relations. The proposed CA framework does not require additional resources, and the obtained condition rating value supports decision-making for building maintenance management and strategic planning in FM, with a comprehensive and less subjective understanding of condition.
1. Introduction and Purpose
Condition assessment (CA) is a fundamental practice of facility management (FM) that provides information regarding the current condition of the built environment to plan appropriate actions for preventing future deficiencies. ASTM International (formerly known as American Society for Testing and Materials), defines CA as a walk-through survey of the built environment with the goal of identifying physical deficiencies, defects, and maintenance needs of building systems, components, or equipment. The “condition” in ASTM’s definition refers to determining the physical state of building systems, components, or equipment utilizing the descriptions of excellent, good, fair, poor, satisfactory, unsatisfactory, etc. [1]. In this study, ASTM’s definition of “condition” is used as an accepted definition for the physical state of a building system, component, or equipment.
Budgetary issues and resource constraints are major obstacles to implementing essential FM practices, such as CA. As part of traditional CA practices, visual inspections and walk-through surveys require additional resources, and the need for resource-efficient processes in condition assessment is apparent. In addition, the subjective results of visual inspection decrease the effective use of condition assessments for strategic planning and decision-making in FM [2]. To better utilize the outcome of CA in building maintenance and FM, less subjective, data-driven, and quantitative processes are necessary.
In light of the need for an enhanced approach to CA, this study aims to develop a quantitative CA framework that can be less subjective, and an alternative to visual inspections, to establish a condition rating value for building maintenance in FM. Furthermore, this study provides an implementation example of the developed framework for heating, ventilating, and air conditioning (HVAC) equipment using a brief case study. HVAC equipment is targeted in the case study because it is a high-value asset of buildings, with a high impact on building performance and energy efficiency in case of any defects [3]. The proposed condition rating value is derived using mean time between failures (MTBF), age-based obsolescence, facility condition index (FCI), occupant feedback, and preventive maintenance cycle variables. Fuzzy sets theory is utilized to obtain a quantitative condition rating value that would be less subjective than that obtained through visual inspections, as fuzzy sets theory deals with imprecise, uncertain, and ambiguous judgments with membership relations.
The proposed framework benefits FM departments in the absence of, or as an alternative to, visual inspection and walk-through surveys. The proposed framework allows for a holistic assessment and a comprehensive understanding of the condition by considering multiple variables from different resources, such as a computerized maintenance management system (CMMS), expert opinions, occupants, and industry standards. As such, the condition rating obtained through this framework supports decision-making for building maintenance management, as well as strategic planning.
The CA framework proposed in this study is illustrated through a brief case study using the framework to determine the condition of chiller equipment in a higher education institution in the state of Colorado. This case study demonstrates how fuzzy sets theory can be applied with identified condition variables focused on the HVAC system. It is important to note that different building equipment or systems may require the consideration of additional variables. Furthermore, not all of the identified variables in the framework may be applicable to other types of building equipment. Acknowledging this fact, additional condition variables based on equipment type might improve the accuracy of the condition rating value obtained through the developed CA framework. Furthermore, the developed framework can be used in the absence of, or to support, visual inspections or walk-through surveys, and additional assessment might be required for identifying the absolute condition.
2. Background
The background section of this study comprises the importance of condition information, current CA studies in FM, and fuzzy sets theory, with its applications in CA practices. Through the literature review, it was identified that the application of fuzzy concepts in the context of CA in building maintenance and FM is limited. Therefore, studies in civil and structural engineering CA are also presented in the background section to reveal the benefits of fuzzy concepts in CA processes.
2.1. The Importance of Condition Information
The National Center for Education Statistics (NCES) highlights the significance of facilities’ condition information as a primary source for effective maintenance management and maintenance decision-making. Additionally, NCES indicates the need for having accurate and timely condition information as an increasing demand in the resource-constrained environment of FM [4]. Condition information can be utilized as a benchmark for preventive maintenance, maintenance prioritization, and performance measurement [5].
Instead of determining the condition at a particular moment in time, an over-time condition analysis provides trends of deterioration and the information that helps to improve building maintenance practices [6]. Moreover, over-time condition information has the potential to assist budget projections, as well as resource allocation. The National Research Council’s Stewardship of Federal Facilities study [7] identified a lack of quantitative information to justify maintenance budgets, which is essential for presenting maintenance funding requests. FM professionals must be able to effectively communicate and establish maintenance needs with the executive level while determining the risks of possible failures. Considering these demands, condition data and information are essential for developing effective building maintenance and FM practices.
One of the most common practices of CA in FM is using the Facility Condition Index (FCI) as an indicator of condition. The FCI considers solely the financial aspect of condition, based on the formula that divides the value of deferred maintenance cost by the value of total replacement cost on a scale between 0 and 100, where 0 is the best condition [8]. Even though FCI is applicable, starting from the equipment level to the overall building level, Dejaco, Cecconi, and Maltese [9] identified the index as an “imperfect” measure of the condition. The critical issue for the use of FCI is the need for a standardized calculation for the deferred maintenance, or maintenance needs, of a system, component, or equipment [10].
A comprehensive study [8] investigated various approaches in calculating FCI and deferred maintenance, starting from its first version represented by Rush [11]. Despite FCI’s wide acceptance in current FM practice, different approaches in calculations make its use inconsistent. The extended versions of FCI, such as the ones including major rehabilitation and replacement costs and costs of future maintenance recommendations, also decrease the efficiency of FCI as an indicator of condition. Subsequently, the importance of condition data and information remain obvious in FM, as well as the need for a holistic approach in CA practices that considers multiple indicators of the existing condition of buildings, systems, and equipment, in addition to the deferred maintenance cost or other financial indicators.
2.2. Current CA Studies in FM
Teicholz and Edgar [12] referred to CA as a static tool that focuses on building deficiencies rather than its capability to support strategic FM planning. Their study identified the limitations in CA practices as follows: (i) absence of life cycle information, (ii) inconsistency in data collection and reporting, (iii) lack of integration with other FM data such as maintenance history, and (iv) subjectivity of the assessments [12]. After almost two decades, similar issues continue to be reported in CA practices, emphasizing the need for a structured and less subjective method with quantitative results [13].
Recent studies in CA and FM have mostly utilized visual inspection and walk-through surveys as part of their processes, which may or may not be feasible due to resource issues; even if feasible, they could lead to subjectivity in the process. In addition, these studies used various condition rating scales with linguistic definitions. The relevant studies and their focus are presented in chronological order in Table 1.
Common characteristics of these studies include: (i) use of subjective and linguistic condition rating and index values; (ii) lack of considering multiple variables for CA; (iii) limited use of existing FM data, such as maintenance history, CMMS, or occupant feedback in the CA process; (iv) dependence of CA on expert judgment and visual inspection; and (v) lack of standardized and resource-efficient processes. In addition, limited efforts have been made to integrate structured multicriteria techniques, such as AHP, revealing the research gap of a standardized and quantitative process in CA and FM. Moreover, these studies rely on visual inspections or walk-through surveys, which are the primary sources of subjectivity in existing CA practices. Moreover, both in-house operations and out-sourcing in CA require additional resource allocation, mainly for visual inspections or walk-through surveys, which increases the need for resource-efficient practices. Consequently, the limitations identified by Teicholz and Edgar [12] in CA practices still remain, and a holistic and comprehensive approach is needed to address these existing issues.
2.3. Fuzzy Sets Theory and Its Applications in CA
Zadeh first introduced the fuzzy sets theory, which is the fundamental concept of fuzzy logic, fuzzy control, fuzzy decision-making, fuzzy neural network, and other fuzzy techniques, in 1965 [21]. Since then, there have been extensive applications of fuzzy sets theory in several concepts and areas. Fuzzy sets theory seeks to resolve the ambiguity in subjective judgments measured in linguistic terms. For vague or approximate judgments such as “big”, “very high”, “average”, “too fast”, and “poor”, the nature of human language is fuzzy, and the definition of these linguistic judgments varies in different contexts [22]. Fuzzy sets theory aids in translating uncertain linguistic variables into numerical and quantitative representations, characterized by membership functions. The elements in a fuzzy set may have partial membership in the set ranging between 0 and 1, where the representation of 0 is no membership, and 1 is full membership.
Fuzzy techniques have been increasingly applied in construction management research areas since the beginning of the 1990s. Chan et al. [22] conducted a comprehensive literature review of 52 journal articles to overview the applications of fuzzy techniques in construction management research. Their study revealed that the fuzzy research efforts in construction management could be classified into three fields: (i) fuzzy sets theory, (ii) fuzzy logic, and (iii) hybrid fuzzy applications. Furthermore, fuzzy research in construction management focuses on decision-making, performance, evaluation/assessment, and modeling applications [22].
A recent study investigating fuzzy techniques in construction engineering and management supported the increasing trend of fuzzy applications in the field [23]. Fuzzy hybrid techniques with multicriteria decision-making, optimization, machine learning, risk analysis, and contingency determination were highlighted in the same study. Moreover, the application of fuzzy techniques was determined “essential” in problems involving expert judgment and subjective uncertainty [23].
The application of fuzzy sets theory and fuzzy concepts in the CA literature for building or infrastructure elements has been mostly performed in civil and structural engineering. Mitra, Jain, and Bhattacharjee [24] utilized fuzzy sets theory to transfer the visual inspection data of corrosion-distressed reinforced concrete building elements into a quantitative condition index. Their study highlighted that the obtained condition index can support the decision-making process about repair needs of the assessed concrete elements [24]. Additional studies utilizing fuzzy concepts in CA were focused on the evaluation of pipe condition including structural damage and environmental risks [25], airport pavement condition and maintenance-needs assessment [26], and condition assessment of reinforced concrete bridges [27]. These studies indicate that the use of fuzzy concepts benefits CA processes by dealing with subjectivity and decreasing time, costs, and efforts in the process. Additionally, fuzzy concepts were used for the performance evaluation and remaining life assessment of reinforced concrete bridge girders [28], and for modeling the service-life prediction of exterior natural stone claddings [29] that supports developing effective maintenance strategies.
However, the use of fuzzy concepts in building maintenance and FM has not received enough attention in the existing literature. Hadipriono [30] proposed using fuzzy sets theory for performance evaluation of facilities during and after the construction period. Another study proposed a fuzzy sets-based framework for facility life-cycle cost analysis for handling the subjective uncertainty of expert opinion in the process [31]. Fuzzy concepts were used in the selection of a performance-based procurement system for maintenance and FM services, such as roofing contractors and janitorial services, with the backward chaining method [32]. Though, none of these studies focused on utilizing fuzzy concepts in the CA process of a building system or equipment.
Applications in civil and structural engineering areas show the promise of fuzzy sets to aid in addressing the subjectivity in the CA process, as well as to develop resource-effective CA practices. In addition, very few studies utilized fuzzy concepts in the context of building maintenance and FM, revealing the gap of fuzzy applications in the FM area.
2.4. Motivation of the Study
Condition has several impacts on the performance and function of a building. Moreover, condition information has the potential to assist in failure detection and prevention, and maintenance planning, which then supports effective resource allocation and occupant comfort [15]. Without proper knowledge of the condition, it is impractical to sustain effective building maintenance strategies.
Prior to this study, the researchers held several discussions with FM professionals in the state of Colorado regarding common issues in the FM industry. These discussions supported that, due to the lack of sufficient resources, visual inspections and walk-through surveys were not performed regularly in their organizations, and neither were any other systematic ways to assess the condition of their buildings, systems, and equipment used. These FM professionals and their organizations were reliant mostly on expert judgment. Another issue mentioned in these discussions was the subjectivity of CA processes and the need for a less subjective and more quantitative condition rating value. Although FCI is a common practice in FM, the FM professionals confirmed that FCI only provides condition information from the financial perspective.
FM data, including maintenance history and maintenance backlog in CMMS, building automation, energy management, building performance, recommissioning data, and occupant feedback, are often underutilized in developing effective FM strategies [33,34]. Subsequently, CMMS data comprising the corrective and preventive maintenance activities in building maintenance have the potential to support the development of less subjective, quantitative, and data-driven CA practices [35].
The challenges due to subjectivity and the lack of standardized CA practices in building maintenance and FM need to be addressed with a systematic and resource-efficient approach. Although condition assessment is critical in successfully implementing effective building maintenance and FM strategies, in practice, there are many challenges. Mostly, these come from dependence on visual inspections and walk-through surveys, which may or may not be feasible due to resource issues. Additionally, even if they are feasible, they lead to subjectivity in the process. Even with accurate expert opinions, existing CA practices often involve subjectivity resulting in a qualitative outcome such as “bad”, “poor”, “good”, etc.
Applying fuzzy sets theory in civil and structural engineering CA is promising to overcome these challenges. In addition, the limited number of studies in the applications of fuzzy concepts in CA and FM reveals the gap in consideration of fuzzy sets theory and fuzzy concepts in CA practices. In light of these, the motivation of the proposed CA framework is to utilize FM data, such as equipment failures in CMMS and occupant feedback, as well as expert opinion and industry standards, which are mostly underutilized, in the absence of, or alternative to, visual inspections or walk-through surveys. Moreover, this study aims to decrease subjectivity in the interpretation of condition, obtained with the FM data, utilizing fuzzy sets theory.
3. Methodology
The CA framework proposed in this study was developed through the integration of the following steps, based on the application of fuzzy sets theory: (1) identification of the variables which may represent the condition of building equipment through a literature review; (2) development of condition scales for each variable integrating expert opinion, literature review, and industry standards; (3) determination of the membership functions for condition variables based on condition scales and fuzzification; (4) defuzzification and obtaining condition rating. The methodology of the condition assessment framework is presented in Figure 1. The following subsections provide details of the proposed CA framework.
3.1. Identification of Condition Variables
The condition of buildings and their equipment depends on several factors, such as age, climate, occupancy, material type, equipment type, and maintenance performance [36]. In addition, several studies revealed the factors that contribute to building equipment deterioration, degradation, or failures, including service life, failure trends, and maintenance strategy [37]. It is apparent that CA in building maintenance and FM must consider multiple factors.
The condition variables identified in this study focused on HVAC equipment as a representative example of the proposed framework. HVAC equipment is mostly considered a high-value asset, and it has a significant impact on building performance [38]. Any issue or failure in HVAC equipment may have severe impacts on the building and its occupants [39]. In addition, a recent study in building maintenance revealed that HVAC equipment receives a higher number of work orders in CMMS data [40].
The condition variables in this study identified for high-value HVAC equipment, such as chillers, air handling units (AHU), and rooftop units (RTU), are: (i) Mean Time Between Failures (MTBF), (ii) Age-based Obsolescence, (iii) Facility Condition Index (FCI), (iv) Occupant Feedback, and (v) Preventive Maintenance Cycle. These variables are proxy measures for determining the condition of the equipment. Each condition variable is evaluated with a different technique, such as using CMMS data, expert opinion, occupant feedback, and industry standard. The approach for processing raw data for each variable is explained in detail in the following subsections, discussing the identified condition variables with detailed explanations, as well as their computations and measures.
3.1.1. Mean Time Between Failures (MTBF)
Building systems are complex and failures may occur at the equipment and component level due to deterioration, lack of preventive maintenance, and improper operation and maintenance practices. Although effective FM strategies aim to enhance the efficiency of these systems, breakdowns are inevitable through the lifecycle of building systems. In addition to several other definitions, Torell and Avelar [41] discussed the definition of “failure” within equipment and component levels. Equipment level failure was identified as the breakdown of essential parts that sustain the equipment’s required functions. Additionally, component-level failure comprises the breakdown of components, which decreases the required performance of equipment without the termination of its required function [41]. Based on these definitions, the focus of this study is on equipment level failures, the management of which is critical to reduce the downtime and functional loss of equipment that affect the building performance and occupant comfort.
Equipment failures may result from several reasons, such as systematic, operational, and random issues. These failures lead to other problems, affecting operations, building performance, and occupant comfort. Tracking equipment failures and identifying any trends in these failures are critical in maintenance management [42]. Preventive and corrective maintenance data support the reliability, availability, and maintainability of the building equipment and assists identification of failure trends [43]. Integrating failure trend information in maintenance planning and prioritization is important in the success of maintenance practices and performance [44].
Mean time between failures (MTBF), is the average period between breakdowns, and an essential indicator for the reliability and availability of equipment, which leads to determining its performance and condition. MTBF has broad applications in manufacturing, industrial and electronic equipment. In addition, the use of MTBF is important in information technology (IT) and mission-critical businesses building equipment, such as chillers, AHU, and RTU. The reliability and availability information are essential in mission-critical businesses building equipment to ensure the business continuity.
CMMSs in building maintenance comprise a large amount of data regarding building equipment performance and failure [45]. CMMS is a tool that supports maintenance functions of any organization based on information technology, including asset management, maintenance planning and monitoring, work order and day-to-day activity tracking features [46]. Manufacturing, production, and utility management areas have integrated CMMS and its data in developing effective maintenance management strategies [47]. The use of CMMS in building maintenance and FM has been limited, and the capabilities of CMMS underutilized, especially in strategic planning and decision-making [48,49,50,51]. However, a recent study revealed that CMMS data in FM, despite its wide use in tracking day-to-day activities, has the potential to identify failure trends that will assist developing effective maintenance and FM strategies [52].
Moreover, Hale et al. [49] presented operations and maintenance data collection efforts on 240 power generation, power distribution, and HVAC items in various facilities. Their study was intended to prioritize maintenance procedures with calculated availability values such as MTBF [49]. Another study focused on HVAC systems failure mode and effects analysis, and proposed the use of MTBF as a “powerful metric” in their model [53]. Although CMMS software is capable of data storage regarding the average time between breakdowns, the use of MTBF is not a common practice in building maintenance.
Considering these facts, this study focused on utilizing CMMS data in identifying failure trends of building equipment, specifically, investigating the mean time between failures (MTBF) concept. The study proposes the use of MTBF as one of the variables representing the condition of the equipment in the developed CA framework. Specifically, MTBF is calculated as the ratio of the equipment’s annual working hours to the number of failures obtained from CMMS data presented in Equation (1).
The annual hours of operation in Equation (1) differ according to the location, climatic conditions, occupancy, facility type, and organization’s operational policy. For instance, while a chiller works 24/7 in a manufacturing facility, a chiller in an office building might work 17 h (5:00 am–10:00 pm) a day. The annual number of failures in the same equation refers to the number of failures gathered from the work orders in the organization’s CMMS. However, not all work orders indicate failures that correspond to equipment conditions. Work orders generated because of water flow issues, operator errors, or building automation system (BAS) errors are external and indirect issues, and they are not related to the equipment condition. Therefore, they are not considered as part of MTBF in the proposed CA framework. It is essential to identify the failure source of work orders to utilize them in the proposed condition assessment framework. In other words, while a work order related to operator error would not be included in the “Annual # of Failures (CMMS)” in Equation (1), a work order related to “pressure issues” or “loud noise” would be considered. This is because pressure issues or loud noise most likely arise from any issues related to the equipment parts, such as the motor and related to the equipment condition. The “annual hours of operation” and the “annual number of work orders (CMMS)” utilized in Equation (1) would be determined for related equipment individually in each case.
3.1.2. Age-Based Obsolescence
Any part of the built environment is subject to deterioration, a natural part of its lifecycle and the aging process. Even though deterioration is unavoidable, effective operation and maintenance practices help minimize impacts that lead to decreased service life of the built environment [54]. The effective age of equipment, which considers the impact of the operation and maintenance practices on the deterioration and aging of the equipment, can be established based on the operation and maintenance practices of any organization.
The total time between when building equipment is put into service until it deteriorates to the minimum acceptable level of performance is determined as its “service life” [37]. Several research efforts focused on the service life and life cycle assessment of buildings and building systems, equipment, and components [55,56,57]. Multiple factors affect the service life of building equipment, such as design and material selection, temperature changes, corrosion, moisture and water, chemical leakage, and change in the occupancy of the building [54]. The consideration of service life in the condition assessment process of building systems, equipment, and components were highlighted in recent research studies, where age and the impact of deterioration and degradation were the main indicators [15,58]. Predictions for the expected service life of any building equipment or component are challenging [16] and most building equipment can continue to perform the necessary functions even after they complete their expected service life, with higher risks of failure, higher maintenance costs, and lower performance [59]. Therefore, the condition information needs to consider the period where equipment serves beyond its expected service life.
Age is an important indicator in condition assessment; however, depending on the operational conditions, maintenance actions, and environmental factors, the condition may differ for the same type of equipment at the same age. In addition, the impact of age on deterioration cannot be considered to be linear in time. Therefore, there is no single curve that can be adopted to identify the change in condition of an equipment solely based on its age [60]. Considering these facts, the proposed condition assessment framework in this study considers the impact of time on the condition of the equipment with “age-based obsolescence”, identified in Grussing’s study [60], and the calculation is presented in Equation (2).
Grussing’s study used the obsolescence index as a proxy indicator, solely based on age, without any adjustment, such as inspection observations [60]. The obsolescence index, based on a Weibull probability model used to project condition degradation over time, is used in their study to consider functional loss deriving from age-based obsolescence. In addition, expected service life in Equation (2) is derived from Grussing’s study, and it indicates the period between the equipment’s install year and end of use. The age-based obsolescence variable contributes to identifying the condition of equipment as a function of time. This is different from how the previously discussed variable MTBF contributes to identifying the condition of equipment, as a function of failures.
The Preventive Maintenance Guidebook of Building Owners and Managers Association (BOMA) International, which is produced by a globally recognized organization with more than 16,500 members maintaining 9 billion square feet of commercial properties, has determined the estimated service life (average useful life) of building systems [61]. The estimated service life of ten HVAC system categories, based on “3500 operating hours, 1800 equivalent full load hours use/year and a normal amount of on-off cycles, with regular preventive maintenance properly performed at prescribed frequencies”, were identified in the guidebook ([61], p. 76). The identified service lives for HVAC equipment in the guidebook are accepted as baseline for age-based obsolescence calculation in this study. Individual components and parts of HVAC equipment might have different service lives, and climatic and environmental conditions might have an increased or decreased impact on the estimated service life of these components. A focus on the condition at the component level is not in the scope of this study. Therefore, the guidebook of BOMA provides a representative value for service life in the illustrative case study. Utilized values need to be considered individually for various cases concerning operating conditions and maintenance levels.
Although it is widely accepted that the older the equipment is, the worse its condition, the service life and condition of building equipment does not depend on age alone. Notwithstanding this, the “age-based obsolescence” variable utilized in this study uses the ratio of age and expected service life, which considers the equipment’s functionality beyond its expected service life. As mentioned earlier, operation and maintenance practices are important and might impact age-based obsolescence as well. The effects of operation and maintenance practices on condition are considered separately as individual condition variables in the proposed CA framework, as will be described in the subsequent sections.
3.1.3. Facility Condition Index (FCI)
Financial challenges in FM lead to a common practice in building maintenance, which is postponing the repair needs of building equipment, systems, or components to align with available funds [62]. This concept is called deferring the maintenance, or deferred maintenance. Hamid, Alexander, and Baldry [63] investigated the cause and effects of deferred maintenance on higher education buildings. In addition to financial constraints, poor FM strategies that result in allocating current resources to emergencies was revealed as another cause of deferred maintenance in their study [63].
As mentioned previously, the FM industry commonly uses FCI as a single variable to identify the condition of buildings and their systems, but this value reflects the condition only from a financial perspective and it is not feasible to use it as a single variable to identify the condition. Additionally, various calculations of the FCI reveal a lack of consistency in its value, as well as ineffective use in practice [13]. However, FCI is a valuable piece of information in the condition assessment process as a proxy reflecting the existing maintenance log. In addition, a well-defined approach in the calculation of FCI would benefit the condition assessment by including deferred maintenance information in the process. This study uses the FCI as one of the condition variables in the proposed CA framework. The equation for FCI calculation in this study is presented in Equation (3).
FCI in this study uses the corrective maintenance backlog in the deferred maintenance cost estimation. In other words, the deferred maintenance cost definition in this study includes only the deferred costs of corrective maintenance activities that are often related to the repair and replace decisions in building maintenance activities. Moreover, corrective maintenance activities reflect the current condition of building equipment, including unplanned and day-to-day activities that are considered in the deferred maintenance definition of this study. Hence, the deferred maintenance costs of preventive maintenance or any other maintenance activities, such as remodeling, renovation, and capital renewal, are not included in the accepted deferred maintenance definition. This is because remodeling, renovation, and capital renewal costs are not directly related to the current condition of the building or component, and the focus of each variable in the study is mainly to identify the current condition of building equipment based on different perspectives.
The total replacement value of the equipment subject to condition assessment is utilized as the benchmark in computing the FCI. The total replacement value is identified as the cost of replacing the equipment without considering any wear and tear due to its age or operational requirements Since wear and tear due to the equipment age is considered in the “age-based obsolescence” condition variable of this study, it is not considered in the total replacement value to avoid double counting the effect of the same variable in the framework. If the deferred maintenance cost of the equipment is closer to the total replacement value, the condition rating of this equipment based on the deferred maintenance cost will be worse. Depending on the type of equipment, total replacement value might include the required construction and demolition costs to replace that equipment.
3.1.4. Occupant Feedback
Significant research has focused on identifying building performance by occupant surveys through conducting post-occupancy evaluation (POE). Utilizing occupant feedback, POE compares a building’s actual performance to the intended criteria, and measures over the life cycle of the building [64]. Occupant feedback in this study refers to feedback on maintenance issues and performance, which is different from POE.
Artan, Donmez, Tekce, and Ergen [65] integrated occupant feedback to use building information modeling (BIM) in FM effectively. Their study showed that occupant feedback includes the location of the maintenance problem, source of the problem, and the time when the problem occurred. This information has the potential to assist in condition assessment practices. Another study by Zagreus, Huizenga, Arens, and Lehrer [66] identifies building occupants as “a rich source of information” in indoor environmental quality, which is also supported by effective operation and maintenance strategies. Goins and Moezzi [67] revealed the importance of utilizing occupant feedback in determining building performance. Their study analyzed occupant complaints related to thermal comfort, air quality, lighting, acoustics, and cleanliness. It specifically mentioned that occupant feedback gathered in their case studies was useful for operators in revealing maintenance problems and necessary actions to address these problems [67].
Therefore, this study proposes the use of occupant feedback as one of the variables representing the condition of equipment in the developed CA framework. At the beginning of this study, the researchers conducted a pilot survey with occupants of a mixed-use building (office and student center) in a higher education institution in the state of Colorado. The purpose of the survey was to collect occupants’ annual maintenance feedback based on common maintenance complaints, such as too hot, too cold, light bulb change, electrical outlet failure, electricity cut off, equipment noise, and ceiling leak. Moreover, the occupants’ feedback regarding these issues was collected based on location or space in the building and time of year measured on a monthly basis. Based on the frequency of the complaints and location, it was possible to identify equipment issues serving that area. For instance, higher frequency of “too hot” issues in May, June, July, August most likely refers to HVAC equipment issues. The occupants took the survey once to provide their feedback for one year with a monthly breakdown. However, the results showed that the occupants only provided general feedback based on their complaints or maintenance issues for the year they had been asked. They could not provide the timing of the maintenance issues with a monthly breakdown.
In light of these facts, occupant feedback in this study is aimed to be collected by a short survey focusing on occupants’ comfort level with the building performance experience. Since the focus of the case study is on HVAC equipment, the multiple-choice thermal comfort question was developed as follows:
Q1. Please indicate your annual thermal comfort level considering space (room/office area/lab etc.) where you spent most of your time in the building, on a scale of 1 to 5. (1 represents bad, 5 represents excellent).
| 1: Bad | 2: Poor | 3: Average | 4: Good | 5: Excellent |
Following this, the second question is open-ended and requests the occupants’ response for any feedback regarding maintenance performance or ongoing issues.
Q2. Please provide your feedback regarding your answer in question 1, with specific information that you would like to provide for any thermal comfort-related maintenance issues.
The results of the first question are planned to be analyzed by quantifying the mean of answers. Since the second question comprises qualitative responses, any possible trend of similar feedback, such as cold issues during the winter season, frequent ceiling leak or equipment noise, are aimed to be identified by content analysis and the frequency of the feedback based on equipment type.
Conducting a survey for a single piece of equipment or a single maintenance issue would not be feasible, with the opportunity to collect very limited information. Any effort gathering occupant feedback would need to be more comprehensive, as utilized in previous research efforts, including all types of maintenance issues [67]. While this is acknowledged, it is worth mentioning that the main point of utilizing the “occupant feedback” variable in this study is to emphasize its importance and value in the CA process. In addition, the developed short survey in the illustration is a preliminary effort for collecting occupant feedback, and the development of an occupant survey for gathering maintenance feedback could be an additional future research study with a comprehensive approach on the data analysis, such as analyzing and integrating qualitative and quantitative results.
3.1.5. Preventive Maintenance Cycle
Preventive maintenance is regularly performed maintenance to improve equipment performance and prolong service life. For instance, a filter in an AHU is replaced every 3 or 6 months and replacement is considered part of preventive maintenance practices [68]. Several studies in the literature focus on the benefits of preventive maintenance on the performance of equipment, effective scheduling of preventive maintenance, and fault detection aspects of preventive maintenance [69,70]. Au-Yong, Ali, and Ahmad [3] studied the impact of HVAC performance on occupant satisfaction. Their study revealed that appropriate preventive maintenance strategies have a positive impact on occupant comfort and satisfaction. It is beyond dispute that preventive maintenance is an essential piece of effective maintenance practices. A robust preventive maintenance program will increase the longevity of equipment, as well as buildings and their systems.
Given these, a “preventive maintenance cycle” is considered one of the variables representing the condition of the equipment in the developed CA framework. The American Society of Heating, Refrigerating, and Air-Conditioning Engineers (ASHRAE) Standard 180-2018 [71]: “Standard practice for inspection and maintenance of commercial building HVAC systems”, is utilized as a base standard for the preventive maintenance practices in this study. ASHRAE is a global organization focusing on building systems, energy efficiency, indoor air quality, and sustainability, with the mission of continuous education, research, and industry standards development [72]. ASHRAE 180-2018 comprises the standard practice for inspection and maintenance of HVAC equipment in buildings to provide consistency in maintenance practices and improve thermal comfort, energy efficiency, and indoor air quality in buildings.
The total number of maintenance activities annually in the standard is accepted as the benchmark value. The annual number of preventive maintenance work orders compiled from the CMMS database was compared to the benchmark value. In other words, the ratio of the equipment’s annual preventive maintenance work orders to the total number of preventive maintenance activities recommended in ASHRAE Standard 180-2018 were found and utilized as the “Preventive Maintenance Cycle” condition variable in the proposed CA framework. The computation of the preventive maintenance cycle variable is presented in Equation (4).
Time is an important component in the maintenance process, and the effect of deferring any maintenance activity may have an additional impact on the condition of equipment. Deferring preventive maintenance activities may progressively accelerate the deterioration process. However, this study does not consider the progressive impact of missing preventive maintenance activities on the condition of equipment due to its limited scope.
To summarize the preceding discussion, the variables that are included in the proposed CA framework, their computations, and the origin of data with reference standards are presented in Table 2.
3.2. Development of Condition Scales
The five-point condition rating scale: bad, poor, average, good, and excellent, is used to identify equipment conditions in this study. The condition scale was then utilized in the application of fuzzy sets theory to obtain corresponding values of equipment condition in a numerical representation. The condition scale utilized in this study is presented in Figure 2.
Even though the utilized scale is referred to as a five-point scale, the corresponding values of each condition refer to a set of numbers represented in Figure 2. For example, the “average” condition numerically comprises the set of numbers between two and four, where the “good” condition comprises the set of numbers between three and five. The set of numbers can be mathematically represented as follows, for “average” and “good” condition examples:
where x represents “average” condition,
where x represents “good” condition.
f (x) = 2 < x < 4
f (x) = 3 < x < 5
Based on these, any number between three and four would refer to both “average” and “good” conditions; in other words, they overlap. Linguistically, any condition between average and good can be expressed as “above average” or “pretty good”. However, the definition of these expressions may change from person to person, including subjective judgment with inconsistency. Subsequently, fuzzy sets theory aids in translating linguistic definitions into numerical representations with their degree of memberships. As such, the numerical representation of any condition has varying degrees of memberships in the fuzzy sets. Based on the identified range of fuzzy sets for each condition, crisp values such as one, two, three, four, and five best correspond to the related condition. For instance, three best corresponds to “average” condition, where four best corresponds “good” condition. Any value between three and four is identified with the degree of its membership (using a range of 0 to 1), such as 0.25 membership of average condition and 0.75 membership of good condition. Details of the membership concept of fuzzy sets theory are provided in Section 3.3.
The values of condition variables best correspond to condition definitions are identified based on different data sources presented in Table 2. The condition variables identified in this study include equipment specific and general variables. MTBF and preventive maintenance cycle variables can be treated as equipment specific, where aged-based obsolescence, FCI, and occupant feedback are general variables, which is important in the development of condition scales for individual variables. As mentioned earlier, based on equipment and building type, condition variables might vary, as well as their best corresponding values to condition definitions. This study focuses on using multiple variables for the condition assessment considering failure trends, cost, deterioration, human perspective, and maintenance practices, which can be represented with other variables for different building equipment. While acknowledging that the best corresponding values of condition variables to bad, poor, average, good, and excellent condition are determined with different methods in this study.
Expert opinion is utilized in determining the relation of MTBF values with the condition definitions. In other words, expert opinion is needed to determine the actual MTBF hours for each condition definition, as best corresponding values, such as: 1241 h best correspond to average condition. The identified values of MTBF for the condition definitions are equipment specific in the case study example, and, based on equipment type, working hours and operating conditions, MTBF might vary.
For the age-based obsolescence condition variable, the condition scale is adapted from a comprehensive study by Grussing [60], performed for the life cycle asset management methodologies for buildings. The condition index and age/expected service life curve in their study is presented in Figure 3. The curve fits the concept of considering functional loss based on age and expected service life in the proposed CA framework. Their study developed the curve based on the Weibull probability distribution model for condition degradation of building systems over time, identified in Grussing et al.’s study [16].
In the computation of the curve, age and the expected service life of the building components are considered as main indicators with respect to the condition index of 0 to 100; where 100 refers to no obsolescence and 0 refers to total deterioration [60]. While adapting the curve, the condition index in the y axis is normalized to the five-point condition scale utilized in this study. The 0–100 scale is normalized to a bad, poor, average, good, and excellent condition scale, with 20 referring to “bad” condition and 100 referring to “excellent” condition. Since this study’s condition scale is referred to a five-point scale, the normalized values of Grussing’s condition index utilized in this study follow the same five-point interval. Therefore, the value 20 in the Grussing’s condition index refers to bad condition (numerical value 1) in the utilized condition scale of this study.
Although the FCI concept has inconsistencies within various computations of deferred maintenance, this study considers deferred corrective maintenance activities in FCI computation. The FCI concept was first introduced by Rush in 1991 and, within three decades since its first introduction, scales ranging from three levels to five levels have been used. This study utilized the five-level condition scale of FCI, which is consistent with the logic and structure of the proposed CA framework. The ratio of the deferred maintenance cost to total replacement value ranges from 0 to 100 percent. The five-level condition scale of FCI adapted in this study is: good (0–5%), fair (6–10%), poor (11–30%), critical (31–50%), and divest (51–100%), based on the original formula and scale concept developed by Rush in 1991. The lower the value of FCI reflects the better condition within different intervals in the scale, considering the exponential impact of deferred maintenance.
The best corresponding values of occupant feedback variable to condition definitions are determined based on the same five-point scale used in the survey questionnaire. As mentioned previously, the presented survey questionnaire for gathering occupant feedback in this study is a preliminary effort emphasizing the importance of utilizing occupant feedback in the CA processes. Lastly, for the best corresponding values of preventive maintenance cycle variable, ASHRAE standard 180-2018 is utilized as a benchmark for the excellent condition. The total annual number of preventive maintenance activities for the water-cooled chiller is obtained from the standard, and that number is assigned as the best corresponding value for excellent condition. Since preventive maintenance practices are critical for the longevity of the equipment and the full application of suggested preventive maintenance activities, in ASHRAE, 180-2018 is determined as the establishing value for excellent condition. The following values of preventive maintenance cycle that best correspond to the good, average, poor, and bad conditions are determined by the researcher with equal intervals. Table 3 represents the values best corresponding to condition definitions for each variable in the proposed CA framework.
3.3. Determination of Membership Functions and Fuzzification
Membership function, which is a fundamental concept of fuzzy sets theory, is the numerical description of the relation of variables with the condition scale [73]. Membership functions provide the numerical representation of a relationship, such as “0.8 grade or degree of membership” instead of “very good” or “very poor”, that identifies the value of belonging for that variable in the condition scale. The shape of the membership function varies based on the interval and the upper and lower bound values for each variable. Even though there are no certain rules or guidelines, nor a consensus for generating the appropriate membership function, it is recommended that the generation of the membership functions should be flexible [74]. Ross [73] suggested six methods to assign membership values or functions: (i) intuition, (ii) inference, (iii) rank ordering, (iv) neural networks, (v) genetic algorithms, and (vi) inductive reasoning. In addition, there are two main approaches for developing the membership function in the literature: expert-driven and data-driven [23,24,25,73,75].
Triangular and trapezoidal-shaped membership functions are the most commonly used, based on their simplicity and flexibility, in several kinds of problems [23]. In addition, Barua, Mudurnuri, and Kosheleva [76] mentioned the use of trapezoidal and triangular membership functions were “practical” compared to other, different shapes. According to Norwich and Turksen [77], membership values should be defined on intervals. In their study, a method called “direct rating procedure” was identified, where the subject is presented with a series of values and then the membership degree to rate each value is determined [77].
In this study, single values that best correspond to the condition definitions (bad, poor, average, good, and excellent) are determined in Table 3, and these values have the full membership for the corresponding conditions. As such, for example, in the “occupant feedback” condition variable, mean value three best corresponds to the “average condition” of the equipment with full membership, and mean value four best corresponds to the “good condition” with full membership. Occupant feedback values between three and four are associated with the “degree of membership” or “the grade of membership”, with corresponding numbers from 0 to 1, based on the membership function.
As a graphical representation of the membership function concept, Figure 4 shows a triangular membership function for the occupant feedback variable with corresponding intervals of condition scale: bad, poor, average, good, and excellent. In the figure, the y axis represents the membership values, where the x axis represents the corresponding values of the variable. Based on the membership function in Figure 4, a mean value of 3.7 occupant feedback has 0.7 degree of membership to good condition and 0.3 degree of membership to average condition, which can be linguistically expressed as “slightly below good condition” or “considerably above average condition”.
As these different linguistic phrases indicate, it is not possible to describe the relation of the value 3.7 to the condition scale with a single linguistic expression; this is where fuzzy sets theory is useful to express this relation mathematically. Moreover, since there is no membership for the other conditions—bad, poor, excellent—the degree of membership of value 3.7 to these conditions will be zero. In light of these, the mathematical representation of the membership function as a discrete fuzzy set for the value of 3.7 is as follows in Equation (5).
The numbers in the numerator represent the degree of membership, and the denominators represent the best corresponding value of the occupant feedback for each condition, respectively. The division and addition notation in the membership function are only used for illustration of the discrete fuzzy set, and they do not represent the binary operations of addition and division. The calculation of the function, which is the defuzzification step in fuzzy sets theory, is explained in Section 3.4.
Even though the best corresponding values regarding the condition definitions are determined for membership functions in Table 3, the relation of the condition definitions, with respect to crisp numbers, are still not deterministic and have uncertainty. In addition, regarding Figure 4, each condition is identified by a set of triangular or trapezoidal areas, as a result of the subjectivity in the linguistic expressions. For instance, the mean value of occupant feedback three is determined as the best corresponding value for “average condition”; however, any mean value of occupant feedback within two and four, under the triangular area of the function, are still considered in “average condition” with partial belonging. Given that, the process of expressing a single value with a corresponding scale in the form of discrete fuzzy sets is identified as fuzzification in fuzzy sets theory. However, while fuzzification is referred to as converting crisp values into fuzzy values [73], it is clear that the relation of the crisp values to the condition is not deterministic and, in the condition scale, crisp values have uncertainty arising from the linguistic and subjective definitions of each identified condition.
The membership function used for the variables of this study is represented in Equation (6), and the triangular and trapezoidal shapes of the membership function are illustrated in Figure 5 and Figure 6, respectively. The values a, b, and c in the equation represent the boundaries of membership functions in fuzzy sets theory. The triangular and trapezoidal membership functions are selected in the fuzzy sets theory application of this study, which is explained in detail in Section 3.4.
3.4. Defuzzification and Obtaining the Condition Rating
Defuzzification, which is the last step of implementing the fuzzy sets theory, produces a quantifiable value by converting membership values into a single scalar quantity [73]. Several methods are described in the literature for defuzzifying fuzzy output. Ross [73] and Hellendoorn and Thomas [78] focused on four methods: (1) max membership principle, (2) centroid method, (3) weighted average method, and (4) mean max membership. While there is not a clear guideline in the literature for the selection of a defuzzification method, Hellendoorn and Thomas [78] identified some criteria for defuzzification methods, including: continuity, disambiguity, plausibility, computational complexity, and weight counting. These criteria consider the impact of the method on the final output. For instance, continuity is described as “a small change in the input of the fuzzy controller should not result in a large change in output”, and computational complexity emphasizes the importance of the practical applications of methods [78].
The weighted average method is the most frequently used defuzzification method because of its computational efficiency and simplicity [73]. Based on these, the weighted average method is the preferred defuzzification method in this study. The weighted average method uses the mean, or the centroids, of the respective membership functions in its computation. Including multiple variables with the goal of obtaining one single condition variable, defuzzification is an important step in the fuzzy sets theory application in the proposed CA framework that allows combining several fuzzy variables into one single rating. For example, for obtaining one single number with the following two fuzzy discrete sets, the application of defuzzification with the weighted average method is presented below in Equations (7)–(9).
*defuzzified value.
4. Implementation of the Proposed CA Framework
The CMMS and FM data of the chiller equipment utilized in the case study were collected from a higher education institution in the state of Colorado. The characteristics of the building and the chiller are provided in Table 4.
The CMMS data comprise the corrective and preventive work orders of the chiller. Corrective maintenance work orders related to the chiller’s condition, such as pressure issues or loud noises, are included in the MTBF calculation of the case study. In addition, preventive maintenance work orders were utilized in the computation of the “preventive maintenance cycle” variable. Deferred maintenance cost, the total replacement value of the chiller, and the chiller’s present age were obtained from the higher education institution’s FM department. As mentioned earlier, occupant feedback was intended to be collected with a survey instrument; however, during this study’s data collection process, most of the buildings in the state of Colorado, much like elsewhere across the globe, were not occupied due to the COVID-19 pandemic precautions and safety protocols. Therefore, an assumed value was utilized for the occupant feedback variable in this case study just to be able to show how the developed framework could be implemented.
The following subsections explain the development of the membership functions, fuzzification in discrete fuzzy sets, and defuzzification with the collected data in a brief case study. Development of the membership functions with the data is explained for each condition variable individually. The final step, defuzzification, illustrates how to obtain the condition rating as an output of the proposed CA framework.
4.1. Development of Membership Functions
4.1.1. Membership Function for the Mean Time between Failures (MTBF) Variable
The membership function of the MTBF is developed based on expert opinion. The number of failures corresponding to each condition level was determined by the higher education institution’s facility manager. The researchers acknowledge that the feedback of multiple experts would increase the accuracy of the corresponding membership functions; however, in this case study, the feedback of one expert was utilized for illustration purposes.
The chiller’s working hours for the calendar year are reported as 17 h per day (5:00 am–10:00 pm) from the FM department; and consequently, the chiller’s annual working hours are 6205 h (17 h × 365 days = 6205 h annually). As shown in Equation (1), the annual working hours as a ratio to the annual number of failures is the MTBF condition variable in this study. Even though the expert opinion provides the best corresponding annual number of failures per each condition, the boundaries in the linguistic definitions are uncertain due to these definitions’ subjectivity. The identified annual number of failures for each condition are utilized in the MTBF calculation in Equation (1) for obtaining the best corresponding values of MTBF for each condition definition. The membership functions regarding bad, poor, average, good, and excellent conditions of MTBF are presented in Figure 7. Since the best corresponding values of the MTBF in condition descriptions are identified with a single value in Table 3, the shape of the membership function is triangular, as that single value refers to the peak value in the function with full membership. Even though each function’s shape is triangular, each triangle’s interval is not the same or equally divided.
4.1.2. Membership Function for the Age-Based Obsolescence Variable
Grussing [60] emphasized consideration of the service life in the life cycle asset management for buildings. Because of the complexity of building systems and equipment, a building has increased maintenance needs as its age increases. In addition, several factors, such as climatic conditions, operation and maintenance practices, and occupancy, can contribute to the uncertainty in these needs, which substantially impacts the lifecycle of buildings, systems, and equipment [60].
The estimated service life for the water-cooled chiller is determined as 20 years in the BOMA [61] reference. When the chiller’s remaining service life is 20 years, the present age is 0, and the corresponding condition is “excellent”. Based on the adapted curve, when the equipment reaches the estimated service life of 20 years, its condition is considered as poor. As mentioned earlier, most equipment might serve more than its estimated life depending on operations and maintenance practices. In light of these, the membership function of the age-based obsolescence variable is presented in Figure 8. Similar to the MTBF membership functions, the values of the age-based obsolescence variable best corresponding to the condition descriptions are identified with a single value in Table 3. The shape of the membership function is triangular, each triangle’s interval is not the same or equally divided.
4.1.3. Membership Function for the Facility Condition Index (FCI) Variable
The definition of the deferred maintenance cost in this study considers the costs of deferred corrective maintenance activities regarding equipment condition. The FM department where the data were collected reported that the estimated total replacement value for the water-cooled chiller is USD 285,000. When the chiller’s deferred maintenance cost is USD 285,000, which is the total replacement value, the corresponding condition is “bad”. Conversely, if the deferred maintenance cost is USD 0, the corresponding condition is “excellent”. The higher the deferred maintenance cost, the poorer the condition in the scale. In addition, Facilities Maintenance & Repair Costs with RSMeans Data [79] can be used to identify the total replacement value of the equipment subject to CA.
The membership function of the FCI condition variable is presented in Figure 9. It is important to note that the corresponding percentages of the ratio of deferred maintenance cost to total replacement value in condition definitions refer to an interval or a set of values; therefore, the shape of the membership function is trapezoidal. In other words, the peak values in the membership function with the full membership fall into the interval of percentages, such as 0–5% or 6–10%.
4.1.4. Membership Function for the Occupant Feedback Variable
As discussed earlier, the occupant feedback condition variable is intended to be identified through a short occupant survey. Even though the survey could not be performed in the context of this study, the five-point Likert scale used in the survey directly corresponds to values of condition scale for “occupant feedback”. For simplicity and consistency purposes, the membership functions for the “occupant feedback” condition variable are developed as triangular functions, as presented in Figure 10.
4.1.5. Membership Function for the Preventive Maintenance Cycle Variable
Membership functions for the preventive maintenance variable are developed based on the maintenance cycles identified in the ASHRAE standard 180-2018. When the number of preventive maintenance activities performed for the chiller is 28 annually, which is the total value obtained from the standard, the corresponding condition is “excellent”. For simplicity and practicality, the corresponding condition values are assumed within equal intervals, as presented in Figure 11. It is important to acknowledge that the input of expert opinions for the preventive maintenance cycle is important, and the preventive maintenance numbers obtained from the standard might be discussed with the maintenance supervisor or facility manager of the organization.
4.2. Fuzzification in Discrete Fuzzy Sets
The identified condition variables of the proposed framework were computed based on the collected data and computations detailed in the methodology section.
- a
- Mean Time Between Failure (MTBF)Annual working hours = 17 h/day × 365 days = 6205 hThe annual number of failures in CMMS data = 4MTBF = 6205/4 = 1551 h (linguistic condition, “above average”)
- b
- Age-based obsolescenceEstimated service life = 20 yearsPresent age = 8 yearsAge-based obsolescence = 8/20 = 0.4 (linguistic condition, “very good”)
- c
- Facility Condition Index (FCI)Deferred maintenance cost = $4500Total replacement value = $285,000FCI = (4500/285,000) × 100 = 1.6% (linguistic condition, “excellent”)
- d
- Occupant FeedbackThe assumed mean of the occupant feedback is 4.2 on the Likert scale. (linguistic condition, “above good”)
- e
- Preventive Maintenance Cycle
The annual number of preventive maintenance activities conducted = 24
ASHRAE 180-2018 annual number of preventive maintenance activities recommended = 28
Preventive maintenance cycle = 24 (linguistic condition, “very good”)
The chiller’s measured condition for each variable and the discrete fuzzy sets representation based on the membership functions of each condition variable are presented in Table 5.
4.3. Defuzzification and Obtaining the Condition Rating
Based on the membership functions, fuzzy discrete set representations of the five variables, and the weighted average defuzzification method, the chiller’s obtained condition rating value is 4.27 on the 1 to 5 scale, with 1 representing bad and 5 representing excellent. The weighted average method uses the degree of membership values as the weight of each condition variable.
CR = 4.27
Considering the data for the brief case study, corresponding linguistic conditions for the condition variables are presented in Table 6.
It is clear that, without the mathematical representation of fuzzy sets theory, it is not possible to obtain one single definition expressing the overall condition of the chiller. Utilizing fuzzy sets theory, the obtained condition value of 4.27 can be expressed as “slightly above good” if there is a need to use any linguistic definitions.
5. Discussion, Conclusions, and Future Research
The effectiveness of decisions for building maintenance activities often relies on condition information, which involves subjectivity and uncertainty as part of the visual inspection or walk-through survey processes. Common linguistic definitions of CA, namely bad, poor, average, good, and excellent, are subject to human judgment, and the association of these definitions to the condition may vary from one expert to another [15,80]. In addition, the use of these definitions in CA may lead to misinterpretation.
This study developed a less subjective and more quantitative CA framework, as an alternative to visual inspections, to obtain a condition rating value for building maintenance in FM. Furthermore, this study illustrated an example implementation of the framework to heating, ventilating, and air conditioning (HVAC) equipment using a brief case study. Mean time between failures (MTBF), age-based obsolescence, facility condition index (FCI), occupant feedback, and preventive maintenance cycles were identified as variables that can be used to obtain the proposed condition rating value. Along with these variables, fuzzy sets theory, which deals with imprecise, uncertain, and ambiguous judgments with the membership relations, was utilized to obtain a less subjective and quantitative condition rating value.
The values utilized in the brief case study are representative measures for implementing fuzzy sets theory. In identifying the membership functions, several individual techniques were utilized, such as using CMMS data, expert opinion, occupant feedback, and industry standards. The effective use of CMMS and FM data is promising in developing resource-efficient building maintenance and FM strategies. This study is an important step in utilizing CMMS data for CA practices. It also reveals the possibility of using CMMS data in FM, in addition to tracking daily activities or work orders.
This study contributes to the body of knowledge in the FM domain by introducing a framework that uses multiple variables in the CA process (as opposed to a single source of information, such as visual inspections) and utilizes fuzzy sets theory in the context of building maintenance and FM. It is worth mentioning that every variable identified in this study might be the topic of an individual future research study to further refine the variables use. For instance, the development of the occupant feedback survey for maintenance issues might be a more comprehensive effort, focusing on several building systems. Moreover, other variables, such as MTBF and preventive maintenance cycle, might be studied in the context of different building equipment and building types. For example, the condition variables or condition rating scale for building equipment in a healthcare facility might be different from similar equipment in an office building.
The proposed CA framework does not require additional resources or funding, which is a significant constraint in existing FM practices; the framework merely requires applying the principles of fuzzy sets theory to readily available data to obtain a condition rating. The obtained condition rating may potentially benefit FM departments by helping to prioritize maintenance activities, justify maintenance budget requests, and support decision-making processes. In addition, CA framework developed in this study is a promising effort to introduce enhanced processes in FM practices, which will likely lead to the adoption of advanced systematic applications. The issue of subjectivity in visual inspection and walk-through surveys is addressed by using multiple variables and by applying fuzzy sets theory. Moreover, the integration of CMMS data, expert opinion, occupant feedback, and industry standards provides a systematic approach in the CA process, which also increases the efficiency and reliability of the process outcome.
Limitations of the study include constraints in comprehensive data collection that result from potential inconsistencies in CMMS data, a lack of expert opinion for the preventive maintenance cycle values obtained from standards, and a lack of real time data collection for occupant feedback due to COVID-19 precautions and safety protocols.
Further studies can be extended to include other building equipment in the CA process. It is worth mentioning that different building equipment or systems may require considering additional factors, as the identified factors for HVAC equipment might not be applicable for other equipment or systems. For example, while the mean time between failures (MTBF) is a variable that is relevant to the condition assessment of HVAC equipment, assessing a building façade may need a different variable that considers climate or environmental factors. Moreover, future research efforts can focus on identifying additional condition variables for other building equipment or systems. The reliability of the obtained condition rating value in the proposed CA framework can be further investigated by comparing it to the outcome of traditional CA methods, such as visual inspection or expert opinion. Future studies can also investigate if and how the condition rating obtained through the proposed framework can be used in conjunction with, and thus supplement, condition ratings obtained through visual inspections and walk-through surveys.
In addition, future studies can focus on the development of the membership functions for the proposed CA framework, including several experts. The outcome of the different defuzzification methods can be investigated in applications of fuzzy sets theory. This study is a promising effort for future applications of fuzzy concepts in the CA, building maintenance and FM areas, providing a systematic and mathematical approach to linguistically ambiguous results.
Author Contributions
Conceptualization, D.B., M.E.O., and R.A.A.; methodology, D.B., M.E.O., and R.A.A.; software, D.B.; formal analysis, D.B.; writing—original draft preparation, D.B.; writing—review and editing, D.B., M.E.O., and R.A.A.; supervision, M.E.O., R.A.A. All authors have read and agreed to the published version of the manuscript.
Funding
This research received no external funding.
Data Availability Statement
The datasets generated and/or analyzed during the current study are available from the corresponding author upon reasonable request.
Acknowledgments
The authors would like to acknowledge and thank numerous individuals from the International Facility Management Association (IFMA) and multiple higher education institutions, such as Auraria Higher Education Center, Colorado State University, University of Colorado Boulder, University of Colorado Anschutz Medical Campus, and University of Denver. The authors would also like to acknowledge the numerous individuals who shared their experience in facility management.
Conflicts of Interest
The authors declare no conflicts of interest.
References
- ASTM E2018-15. Standard Guide for Property Condition Assessments: Baseline Property Condition Assessment Process; ASTM International: West Conshohocken, PA, USA, 2015; Available online: www.astm.org (accessed on 1 August 2020).
- Straub, A. Using a condition-dependent approach to maintenance to control costs and performances. J. Facil. Manag. 2003, 1, 380–395. [Google Scholar] [CrossRef]
- Au-Yong, C.P.; Ali, A.S.; Ahmad, F. Improving occupants’ satisfaction with effective maintenance management of HVAC system in office buildings. Autom. Constr. 2014, 43, 31–37. [Google Scholar] [CrossRef] [Green Version]
- U.S. Department of Education. National Forum on Education Statistics NCES Forum Guide to Facility Information Management: A Resource for State and Local Education Agencies. (NFES 2018-156); National Center for Education Statistics: Washington, DC, USA, 2018.
- Lavy, S. Facility management practices in higher education buildings. J. Facil. Manag. 2008, 6, 303–315. [Google Scholar] [CrossRef]
- Kaleba, F. Facility Condition Assessment from A to Z. Facil. Manag. 2013, 29, 26–30. [Google Scholar]
- National Research Council NRC. Stewardship of Federal Facilities: A Proactive Strategy for Managing the Nation’s Public Assets; The National Academies Press: Washington, DC, USA, 1998. [Google Scholar] [CrossRef]
- Cecconi, F.; Moretti, N.; Dejaco, M.C. Measuring the performance of assets: A review of the Facility Condition Index. Int. J. Strateg. Prop. Manag. 2019, 23, 187–196. [Google Scholar] [CrossRef]
- Dejaco, M.C.; Cecconi, F.R.; Maltese, S. Key performance indicators for building condition assessment. J. Build. Eng. 2017, 9, 17–28. [Google Scholar] [CrossRef]
- Deferred Maintenance Reporting: Challenges to Implementation; General Services Administration GAO, U.S. Government Accountability Office: Washington, DC, USA, 1998.
- Rush, S.C. Managing the Facilities Portfolio: A Practical Approach to Institutional Facility Renewal and Deferred Maintenance; National Assn of College Univ.: Washington, DC, USA, 1991. [Google Scholar]
- Teicholz, E.; Edgar, A. Facility Condition Assessment Practices; Graphic Systems, Inc.: Minneapolis, MN, USA, 2001; pp. 1–13. [Google Scholar]
- Mayo, G.; Karanja, P. Building Condition Assessments–Methods and Metrics. J. Facil. Manag. Educ. Res. 2018, 2, 1–11. [Google Scholar] [CrossRef] [Green Version]
- Brandt, E.; Rasmussen, M.H. Assessment of building conditions. Energy Build. 2002, 34, 121–125. [Google Scholar] [CrossRef]
- Uzarski, D.R.; Hicks, D.K.; Zahorak, J.A. Building and building component condition and capability metrics. In Applications of Advanced Technologies in Transportation; American Society of Civil Engineers: Reston, VA, USA, 2002; pp. 441–448. [Google Scholar]
- Grussing, M.N.; Uzarski, D.R.; Marrano, L.R. Condition and reliability prediction models using the Weibull probability distribution. In Applications of Advanced Technology in Transportation; American Society of Civil Engineers: Reston, VA, USA, 2006; pp. 19–24. [Google Scholar]
- Abbott, G.R.; McDuling, J.J.; Parsons, S.; Schoeman, J.C. Building condition assessment: A performance evaluation tool towards sustainable asset management. In Proceedings of the CIB World Building Congress 2007, Rotterdam, The Netherlands, 26 January 2007; pp. 649–662. [Google Scholar]
- Singh Ahluwalia, S. A Framework for Efficient Condition Assessment of the Building Infrastructure. Ph.D. Thesis, University of Waterloo, Waterloo, ON, Canada, 2008. [Google Scholar]
- Salim, N.A.A.; Zahari, N.F. Developing integrated building indicator system (IBIS) a method of formulating the building condition rating. Procedia Eng. 2011, 20, 256–261. [Google Scholar] [CrossRef] [Green Version]
- Eweda, A.; Zayed, T.; Alkass, S. Space-based condition assessment model for buildings: Case study of educational buildings. J. Perform. Constr. Facil. 2015, 29, 04014032. [Google Scholar] [CrossRef]
- Zadeh, L.A. Fuzzy sets. Inf. Control 1965, 8, 338–353. [Google Scholar] [CrossRef] [Green Version]
- Chan, A.P.; Chan, D.W.; Yeung, J.F. Overview of the application of “fuzzy techniques” in construction management research. J. Constr. Eng. Manag. 2009, 135, 1241–1252. [Google Scholar] [CrossRef] [Green Version]
- Fayek, A.R. Fuzzy Logic and Fuzzy Hybrid Techniques for Construction Engineering and Management. J. Constr. Eng. Manag. 2020, 146, 04020064. [Google Scholar] [CrossRef]
- Mitra, G.; Jain, K.K.; Bhattacharjee, B. Condition assessment of corrosion-distressed reinforced concrete buildings using fuzzy logic. J. Perform. Constr. Facil. 2010, 24, 562–570. [Google Scholar] [CrossRef]
- Yan, J.M.; Vairavamoorthy, K. Fuzzy approach for pipe condition assessment. In New Pipeline Technologies, Security, and Safety; American Society of Civil Engineers: Reston, VA, USA, 2003; pp. 466–476. [Google Scholar]
- Fwa, T.F.; Liu, S.B.; Teng, K.J. Airport pavement condition rating and maintenance-needs assessment using fuzzy logic. In Airfield Pavements: Challenges and New Technologies; American Society of Civil Engineers: Reston, VA, USA, 2004; pp. 29–38. [Google Scholar]
- Sasmal, S.; Ramanjaneyulu, K.; Gopalakrishnan, S.; Lakshmanan, N. Fuzzy logic based condition rating of existing reinforced concrete bridges. J. Perform. Constr. Facil. 2006, 20, 261–273. [Google Scholar] [CrossRef]
- Anoop, M.B.; Rao, K.B. Application of fuzzy sets for remaining life assessment of corrosion affected reinforced concrete bridge girders. J. Perform. Constr. Facil. 2007, 21, 166–171. [Google Scholar] [CrossRef]
- Silva, A.; Vieira, S.M.; de Brito, J.; Gaspar, P.L. Fuzzy systems in the service-life prediction of exterior natural stone claddings. J. Perform. Constr. Facil. 2016, 30, 04016005. [Google Scholar] [CrossRef]
- Hadipriono, F.C. Fuzzy set concepts for evaluating performance of constructed facilities. J. Perform. Constr. Facil. 1988, 2, 209–225. [Google Scholar] [CrossRef]
- Sobanjo, J.O. Facility life-cycle cost analysis based on fuzzy sets theory. In Proceedings of the Eighth International Conference on Durability of Building Materials and Components, Montreal, ON, Canada, 30 May–3 June 1999; pp. 1798–1809. [Google Scholar]
- Kashiwagi, D.T. Reducing facility maintenance cost using fuzzy logic and the management of information. In Proceedings of the 1995 Construction Congress, ASCE, Reston, VA, USA, 22–26 October 1995; pp. 149–156. [Google Scholar]
- Korka, J.W.; Oloufa, A.A.; Thomas, H.R. Facilities computerized maintenance management systems. J. Archit. Eng. 1997, 3, 118–123. [Google Scholar] [CrossRef]
- Suprabhas, K.; Dib, H.N. Integration of BIM and utility sensor data for facilities management. Comput. Civ. Eng. 2017, 26–33. [Google Scholar] [CrossRef] [Green Version]
- Bartels, L. Alternate Methods to Obtain Facility Condition Assessment Data Using Non-Engineering Resources. Int. J. Inf. Electron. Eng. 2014, 4, 326. [Google Scholar] [CrossRef]
- Ahzahar, N.; Karim, N.A.; Hassan, S.H.; Eman, J. A study of contribution factors to building failures and defects in construction industry. Procedia Eng. 2011, 20, 249–255. [Google Scholar] [CrossRef] [Green Version]
- Balaras, C.A.; Droutsa, K.; Dascalaki, E.; Kontoyiannidis, S. Deterioration of European apartment buildings. Energy Build. 2005, 37, 515–527. [Google Scholar] [CrossRef]
- Zhang, R.; Hong, T. Modeling of HVAC operational faults in building performance simulation. Appl. Energy 2017, 202, 178–188. [Google Scholar] [CrossRef]
- Goyal, S.; Barooah, P.; Middelkoop, T. Experimental study of occupancy-based control of HVAC zones. Appl. Energy 2015, 140, 75–84. [Google Scholar] [CrossRef]
- Besiktepe, D.; Ozbek, M.E.; Atadero, R. Analysis of the Maintenance Work Order Data in Educational Institutions. In Proceedings of the ISEC 10 Conference: Interdependence between Structural Engineering & Construction Management, FAM.03.1-FAM.03.6, Chicago, IL, USA, 20–25 May 2019. [Google Scholar]
- Torell, W.; Avelar, V. Mean Time between Failure: Explanation and Standards; Schneider Electric’s Data Center Science Center: Paris, France, 2004; 78p. [Google Scholar]
- Murthy, D.N.P.; Atrens, A.; Eccleston, J.A. Strategic maintenance management. J. Qual. Maint. Eng. 2002, 8, 287–305. [Google Scholar] [CrossRef]
- Schuman, C.A.; Brent, A.C. Asset life cycle management: Towards improving physical asset performance in the process industry. Int. J. Oper. Prod. Manag. 2005, 25, 566–579. [Google Scholar] [CrossRef] [Green Version]
- Tsang, A.H.; Jardine, A.K.; Kolodny, H. Measuring maintenance performance: A holistic approach. Int. J. Oper. Prod. Manag. 1999, 19, 691–715. [Google Scholar] [CrossRef]
- Labib, A.W. A decision analysis model for maintenance policy selection using a CMMS. J. Qual. Maint. Eng. 2004, 10, 191–202. [Google Scholar] [CrossRef] [Green Version]
- Lopes, I.; Senra, P.; Vilarinho, S.; Sá, V.; Teixeira, C.; Lopes, J.; Alves, A.; Oliveira, J.A.; Figueiredo, M. Requirements specification of a computerized maintenance management system—A case study. Procedia CIRP 2016, 52, 268–273. [Google Scholar] [CrossRef] [Green Version]
- O’Donoghue, C.D.; Prendergast, J.G. Implementation and benefits of introducing a computerised maintenance management system into a textile manufacturing company. J. Mater. Process. Technol. 2004, 153, 226–232. [Google Scholar] [CrossRef]
- Tanaka, T.; Gotoh, S. A study on evaluation of random failure in building facilities. ASHRAE Trans. 1998, 104, 136. [Google Scholar]
- Hale, P.S.; Arno, R.G.; Dylis, D.D. Reliability and availability data collection program for power distribution, power generation, and HVAC components of commercial industrial, and utility installations. In IEEE Systems Technical Conference on Industrial and Commercial Power; IEEE: New York, NY, USA, 6 June 2005; pp. 199–203. [Google Scholar]
- Arno, R.; Dowling, N.; Schuerger, R. Equipment failure characteristics RCM for optimizing maintenance cost. In Proceedings of the 2015 IEEE/IAS 51st Industrial Commercial Power Systems Technical Conference (ICPS), Calgary, AB, Canada, 5–8 May 2015. [Google Scholar]
- Thompson, C.C.; Hale, P.S., Jr.; Gao, D.Y. An Evaluation of HVAC Failure and Maintenance Equipment Data for Facility Resiliency and Reliability. ASHRAE Trans. 2018, 124, 116–127. [Google Scholar]
- Besiktepe, D.; Ozbek, M.E.; Atadero, R.A. Computerized Maintenance Management System Data Utilization in Facility Management. In Proceedings of the 6th International Project and Construction Management Conference (IPCMC2020), Istanbul Technical University, Istanbul, Turkey, 12–14 November 2020. [Google Scholar]
- Yang, C.; Shen, W.; Chen, Q.; Gunay, B. A practical solution for HVAC prognostics: Failure mode and effects analysis in building maintenance. J. Build. Eng. 2018, 15, 26–32. [Google Scholar] [CrossRef]
- Richardson, B. Defects and Deterioration in Buildings: A Practical Guide to the Science and Technology of Material Failure; Routledge: Oxford, UK, 2000. [Google Scholar]
- Grant, A.; Ries, R. Impact of building service life models on life cycle assessment. Build. Res. Inf. 2013, 41, 168–186. [Google Scholar] [CrossRef]
- Cabeza, L.F.; Rincón, L.; Vilariño, V.; Pérez, G.; Castell, A. Life cycle assessment (LCA) and life cycle energy analysis (LCEA) of buildings and the building sector: A review. Renew. Sustain. Energy Rev. 2014, 29, 394–416. [Google Scholar] [CrossRef]
- Rauf, A.; Crawford, R.H. Building service life and its effect on the life cycle embodied energy of buildings. Energy 2015, 79, 140–148. [Google Scholar] [CrossRef]
- Cecconi, F.; Dejaco, M.C.; Maltese, S. Efficiency indexes for building condition assessment. Int. J. Hous. Sci. 2014, 38, 271–279. [Google Scholar]
- Grussing, M.N. Risk-Based Facility Management Approach for Building Components Using a Discrete Markov Process-Predicting Condition, Reliability, and Remaining Service Life. Ph.D. Thesis, University of Illinois at Urbana-Champaign, Champaign, IL, USA, 2015. [Google Scholar]
- Grussing, M.N. Life cycle asset management methodologies for buildings. J. Infrastruct. Syst. 2014, 20, 04013007. [Google Scholar] [CrossRef]
- Building Owners and Managers Association (BOMA) International. Preventive Maintenance Guidebook: Best Practices to Maintain Efficient and Sustainable Buildings; Building Owners and Managers Association (BOMA) International: Washington, DC, USA, 2010. [Google Scholar]
- Kaiser, H. Capital Renewal and Deferred Maintenance; APPA: Alexandria, VA, USA, 2016. [Google Scholar]
- Hamid, M.Y.; Alexander, K.; Baldry, D. The Cause and Effect of Deferred Maintenance on Higher Education Buildings. J. Univ. Salford 2007, 78–88. [Google Scholar]
- Ozturk, Z.; Arayici, Y.; Coates, S.P. Post Occupancy Evaluation (POE) in Residential Buildings Utilizing BIM and Sensing Devices: Salford Energy House Example; The University of Salford: Salford, UK, 2012. [Google Scholar]
- Artan, D.; Donmez, D.; Tekce, I.; Ergen, E. Modelling Information Flow of Occupant Feedback in Office Buildings. In Proceedings of the International Symposium on Automation and Robotics in Construction, Berlin, German, 20–25 July 2018. [Google Scholar]
- Zagreus, L.; Huizenga, C.; Arens, E.; Lehrer, D. Listening to the Occupants: A Web-Based Indoor Environmental Quality Survey; Europe PMC: Bethesda, MD, USA, 2004. [Google Scholar]
- Goins, J.; Moezzi, M. Links between Occupant Complaint Handling and Building Performance; Center for the Built Environment: Berkeley, CA, USA, 2012. [Google Scholar]
- Wang, L.; Hong, T. Modeling and Simulation of HVAC Faulty Operations and Performance Degradation due to Maintenance Issues; Energy Technologies Area: Berkeley, CA, USA, 2013.
- Kwak, R.Y.; Takakusagi, A.; Sohn, J.Y.; Fujii, S.; Park, B.Y. Development of an optimal preventive maintenance model based on the reliability assessment for air-conditioning facilities in office buildings. Build. Environ. 2004, 39, 1141–1156. [Google Scholar] [CrossRef]
- Wiggins, M.; Brodrick, J. HVAC fault detection. ASHRAE J. 2012, 54, 78–80. [Google Scholar]
- Refrigerating, and Air-Conditioning Engineers (ASHRAE) Standard Practice for Inspection and Maintenance of Commercial Building HVAC Systems; Standard 180-2018; American Society of Heating: Atlanta, GA, USA, 2018.
- American Society of Heating. Refrigerating, and Air-Conditioning Engineers (ASHRAE). About ASHRAE. Available online: https://www.ashrae.org/about (accessed on 15 November 2020).
- Ross, T.J. Fuzzy Logic with Engineering Applications; Wiley: Hoboken, NJ, USA, 2010. [Google Scholar]
- Medasani, S.; Kim, J.; Krishnapuram, R. An overview of membership function generation techniques for pattern recognition. Int. J. Approx. Reason. 1998, 19, 391–417. [Google Scholar] [CrossRef] [Green Version]
- Sasmal, S.; Ramanjaneyulu, K.; Iyer, N.R. Condition Ranking and Rating of Bridges Using Fuzzy Logic; INTECH Open Access Publisher: London, UK, 2012. [Google Scholar]
- Barua, A.; Mudunuri, L.S.; Kosheleva, O. Why trapezoidal and triangular membership functions work so well: Towards a theoretical explanation. J. Uncertain Syst. 2014, 8, 164–168. [Google Scholar]
- Norwich, A.; Turksen, I.B. A model for the measurement of membership and the consequences of its empirical implementation. Fuzzy Sets Syst. 1984, 12, 1–25. [Google Scholar] [CrossRef]
- Hellendoorn, H.; Thomas, C. Defuzzification in fuzzy controllers. J. Intell. Fuzzy Syst. 1993, 1, 109–123. [Google Scholar] [CrossRef]
- Brian, A. Facilities Maintenance Repairs Costs Book with RSMeans Data, 27th ed.; Gordion Construction Publishers Consultants: Rockland, MA, USA, 2020. [Google Scholar]
- Lee, J.H.; Aktan, H.M. A Study of Building Deterioration. In Proceedings of the Infrastructure Condition Assessment: Art, Science, and Practice, Boston, MA, USA, 25–27 August 1997; pp. 1–10. [Google Scholar]
Figure 1.
Methodology of the proposed CA framework based on fuzzy sets theory.
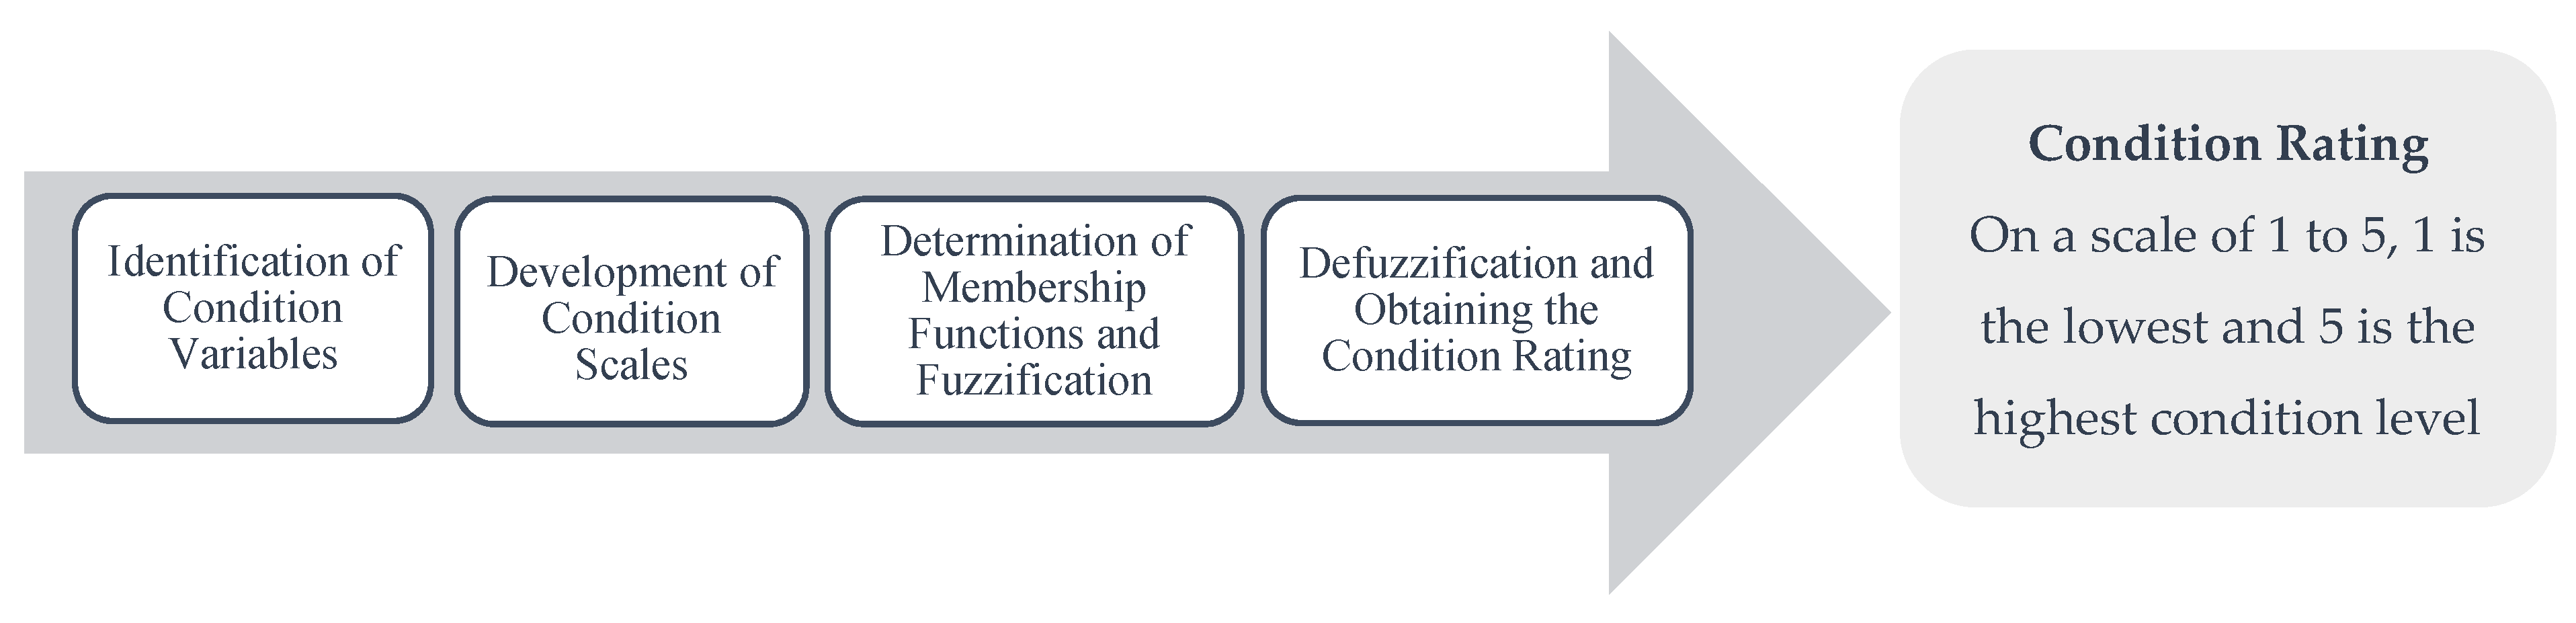
Figure 2.
Condition rating scale used in this study.
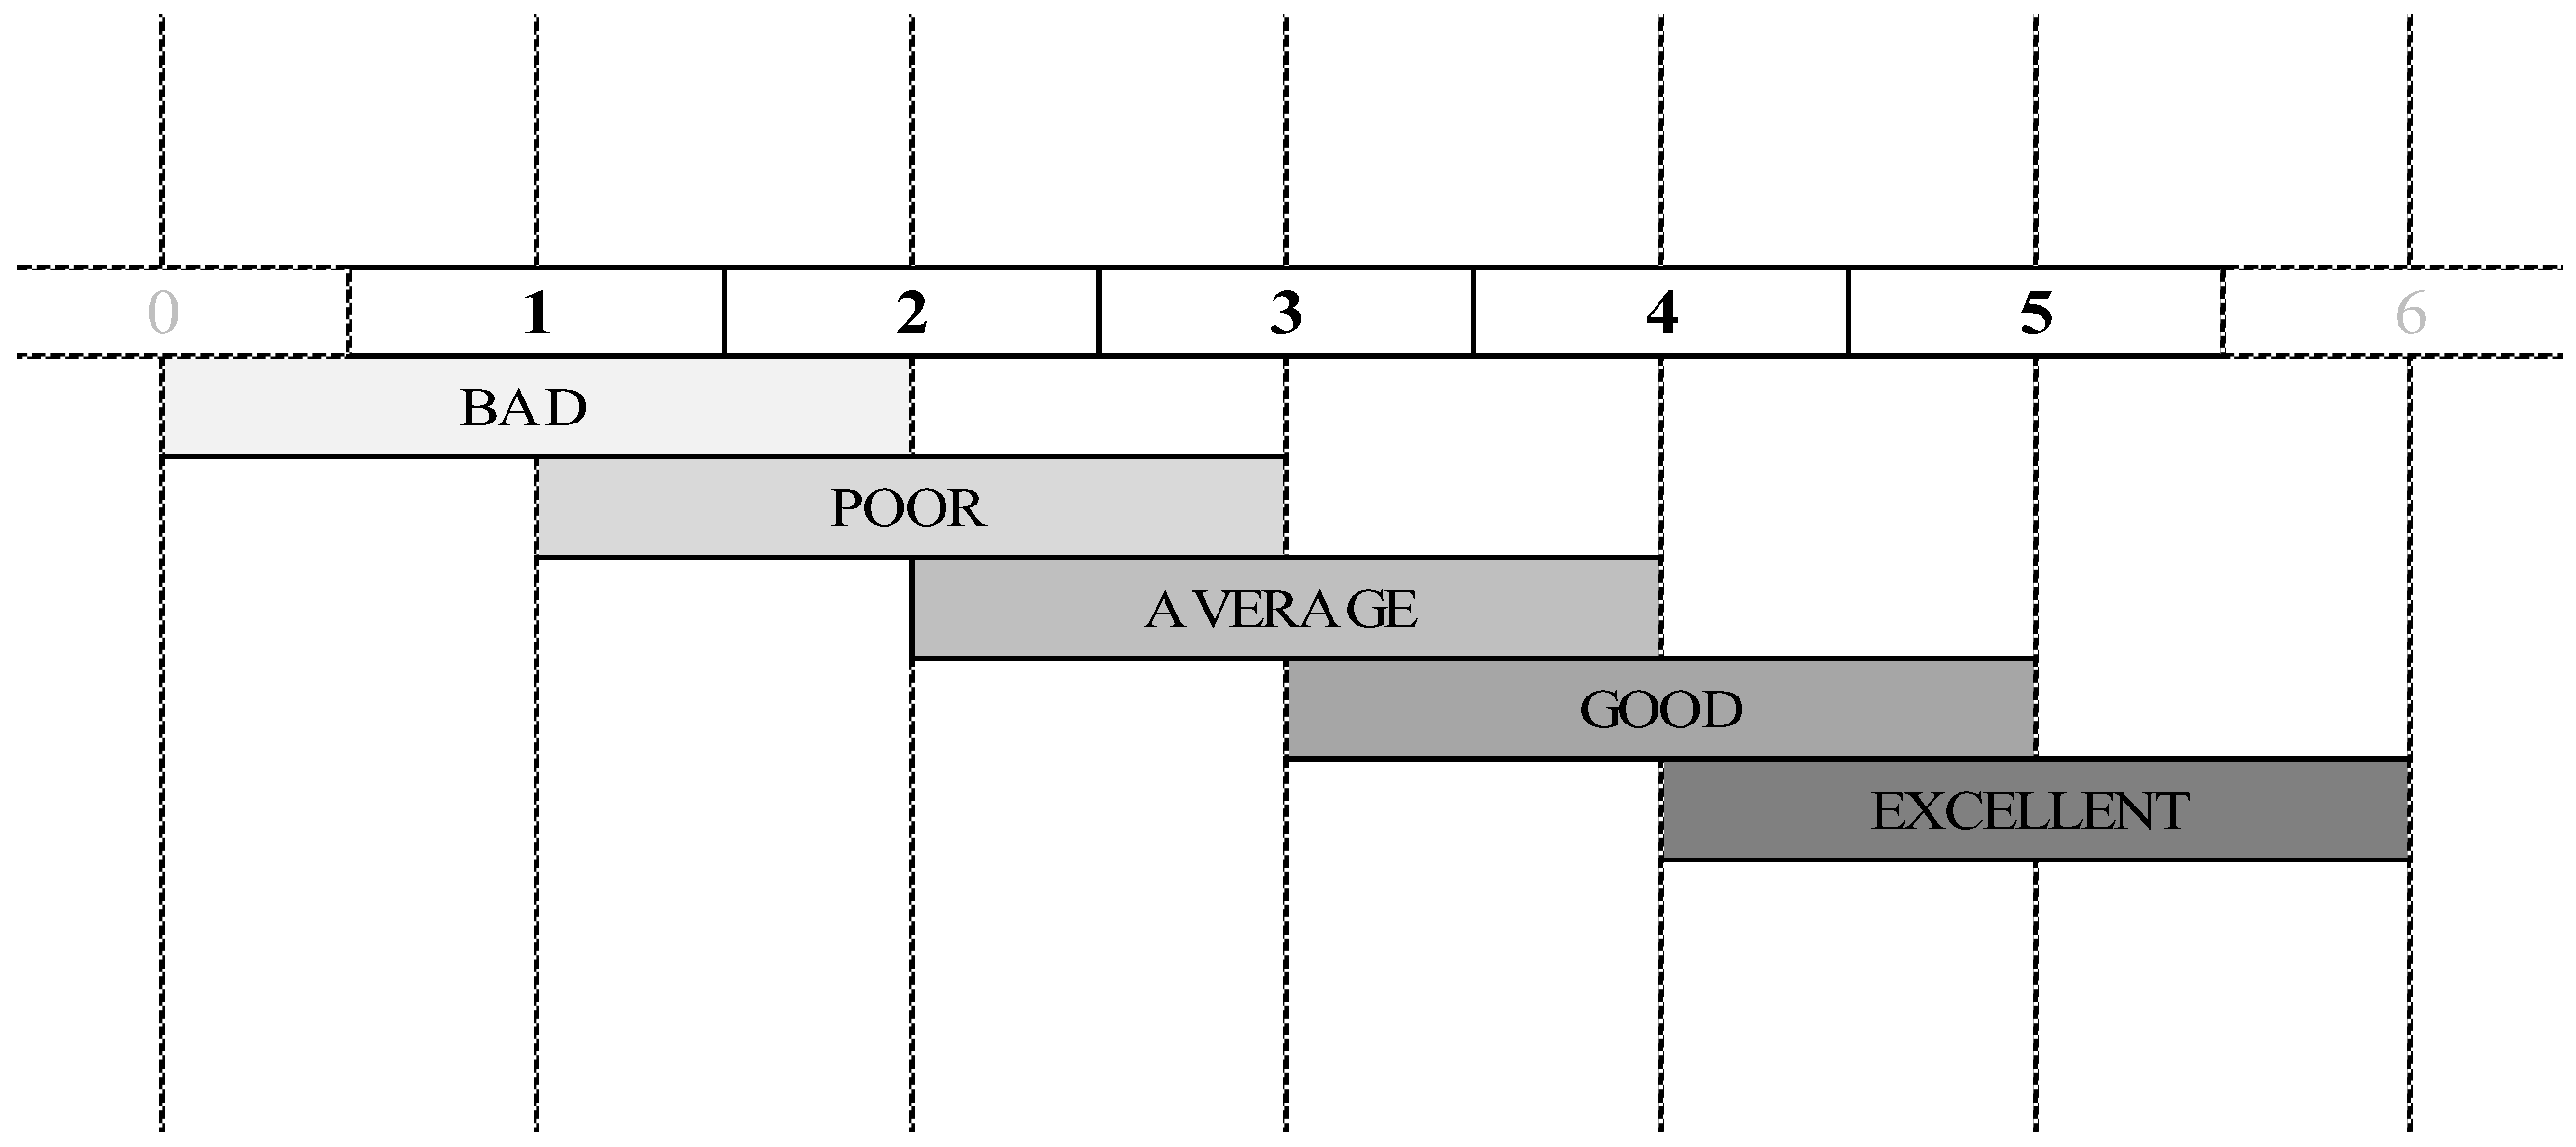
Figure 3.
Condition index and age-based obsolescence curve. (Adapted with the permission of Reference [60]. Copyright 2014 ASCE).
Figure 3.
Condition index and age-based obsolescence curve. (Adapted with the permission of Reference [60]. Copyright 2014 ASCE).
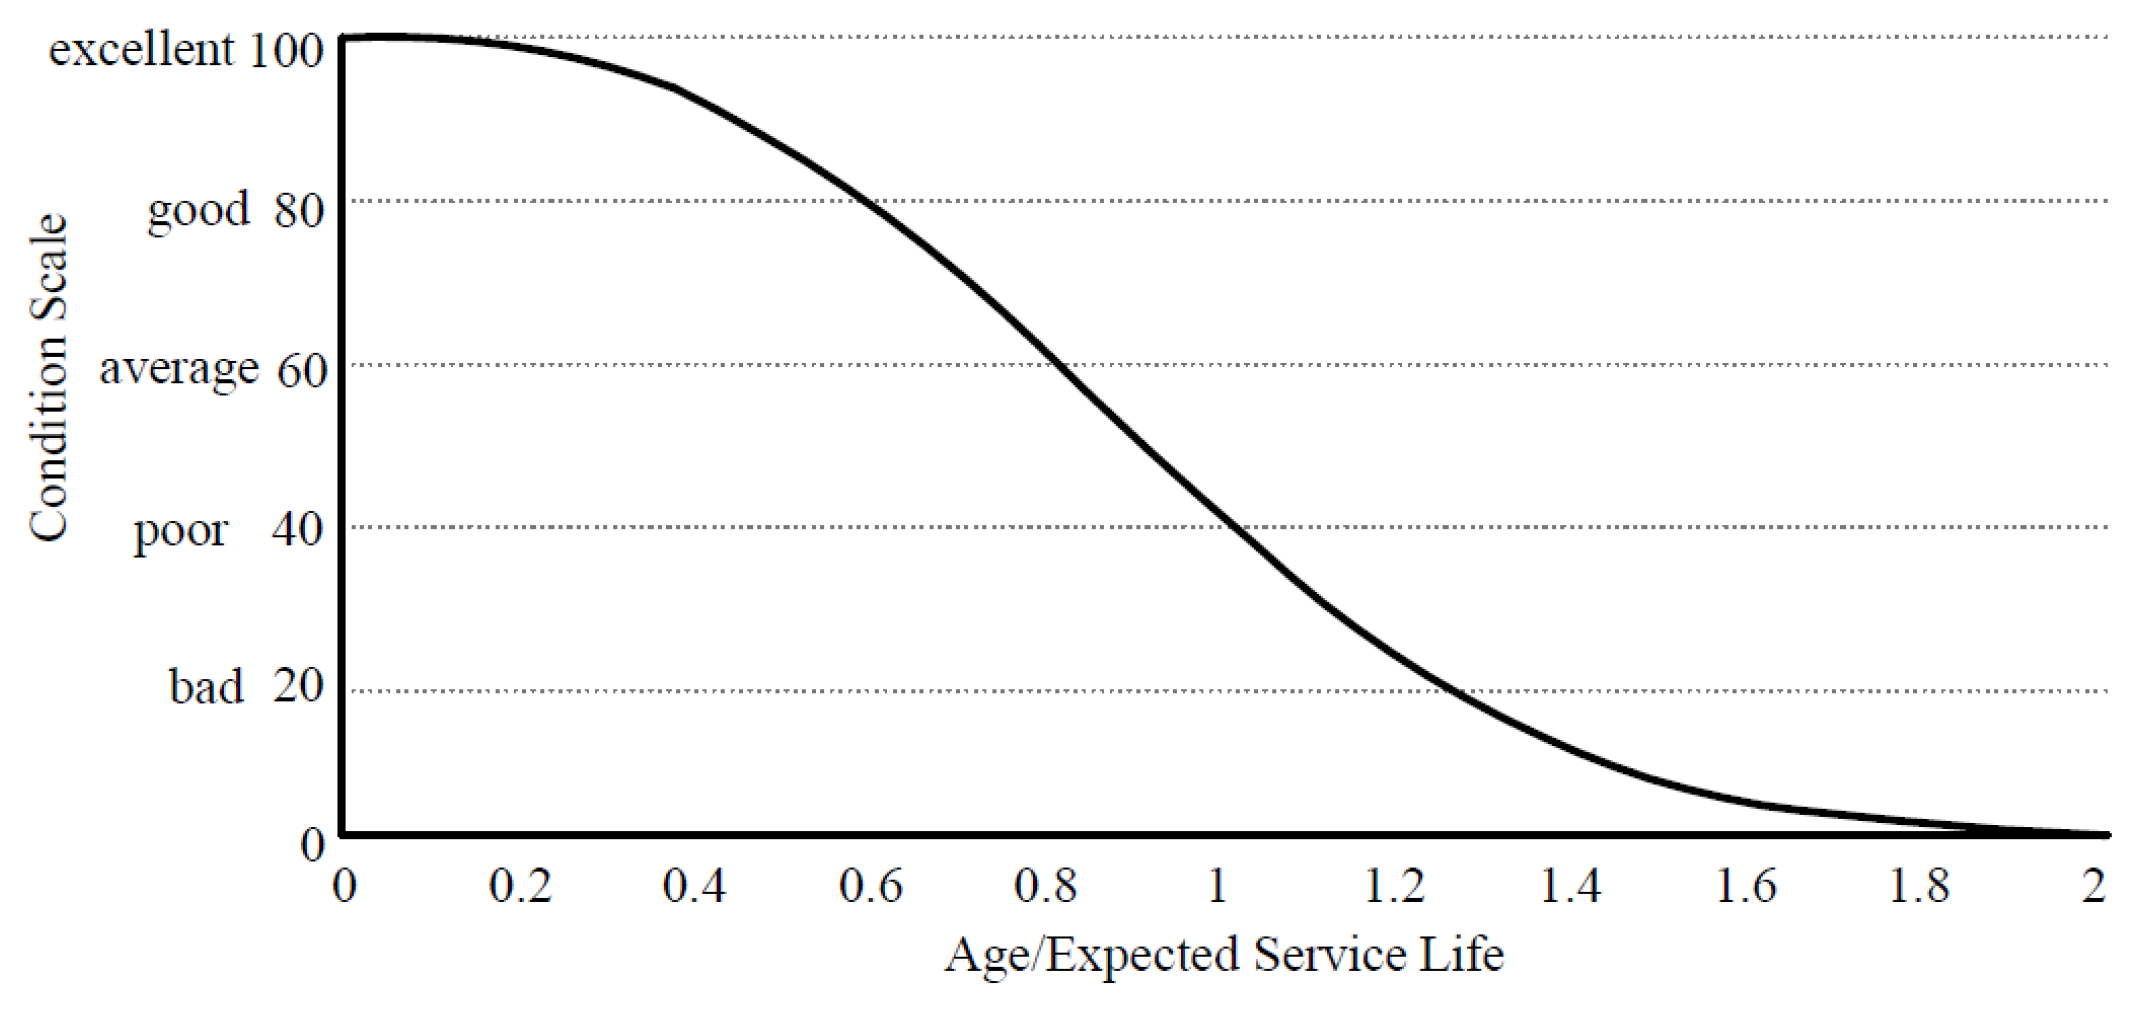
Figure 4.
Example of a triangular membership function with the corresponding condition scale.

Figure 5.
Triangular membership function.

Figure 6.
Trapezoidal membership function.

Figure 7.
Membership functions of the condition scale for MTBF.

Figure 8.
Membership functions of the condition scale for Age-based obsolescence.

Figure 9.
Membership functions of the condition scale for Facility Condition Index (FCI).

Figure 10.
Membership functions of the condition scale for Occupant Feedback.
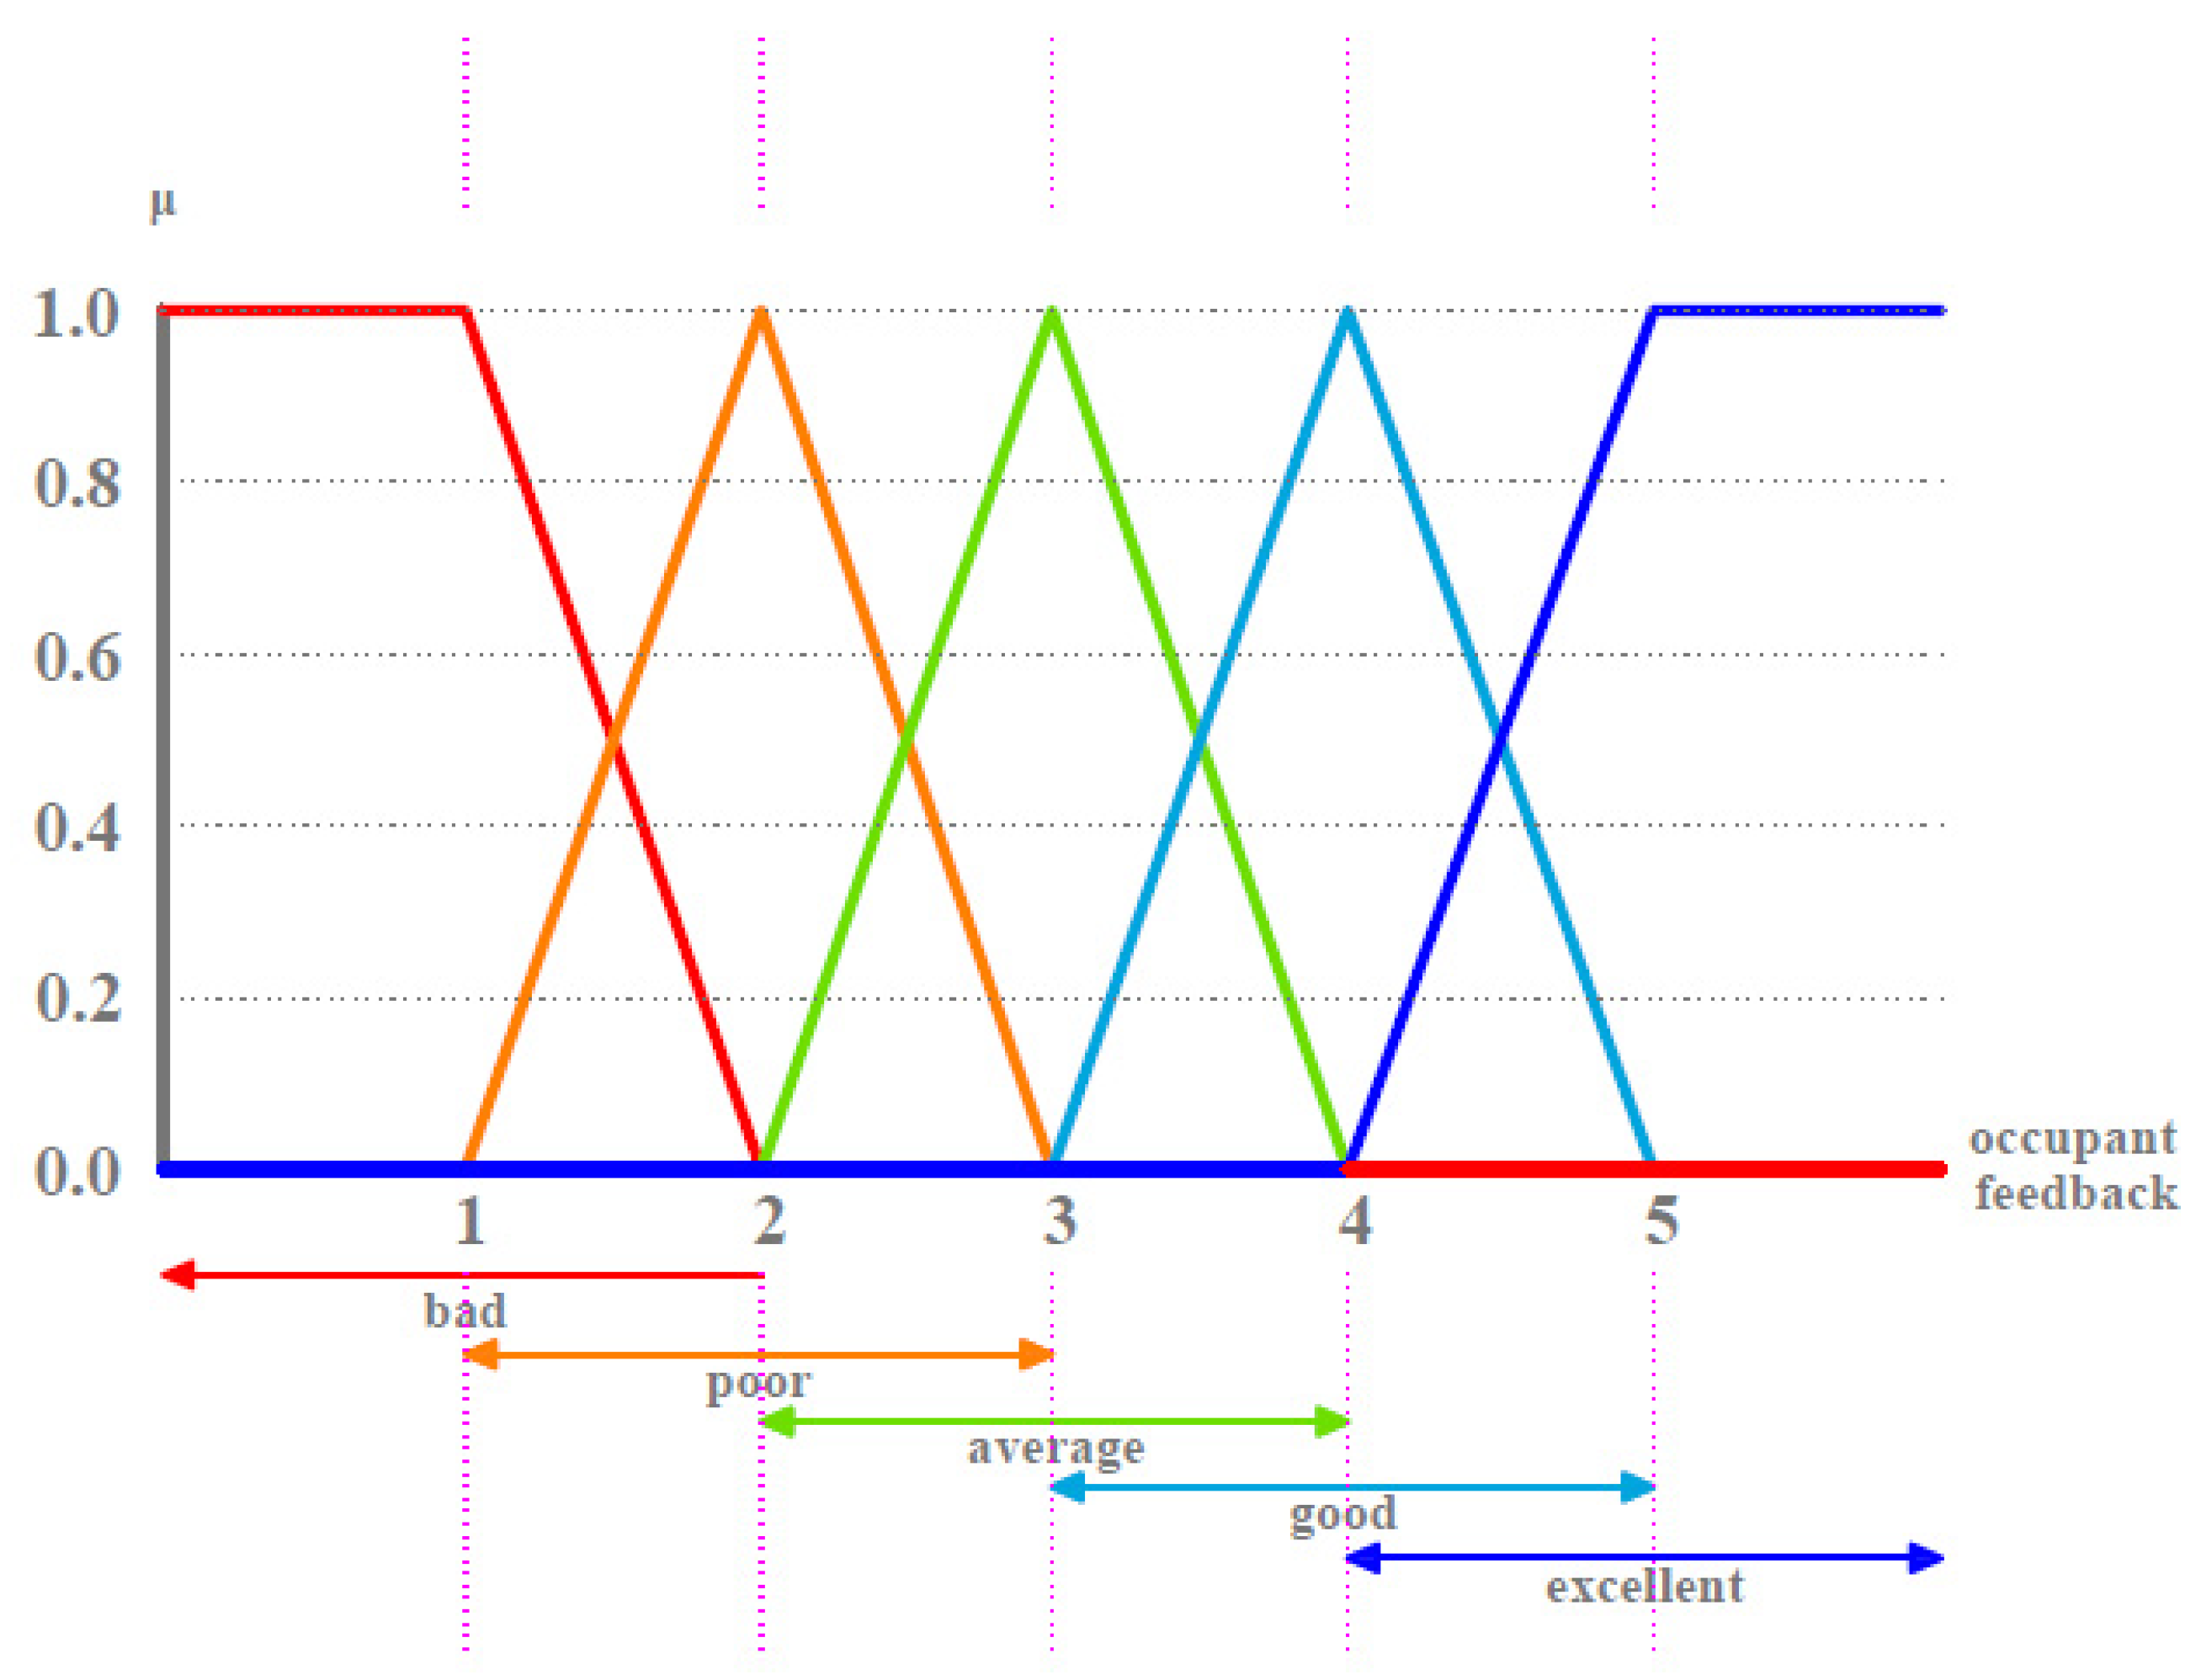
Figure 11.
Membership functions of the condition scale for Preventive Maintenance (PM) Cycle.
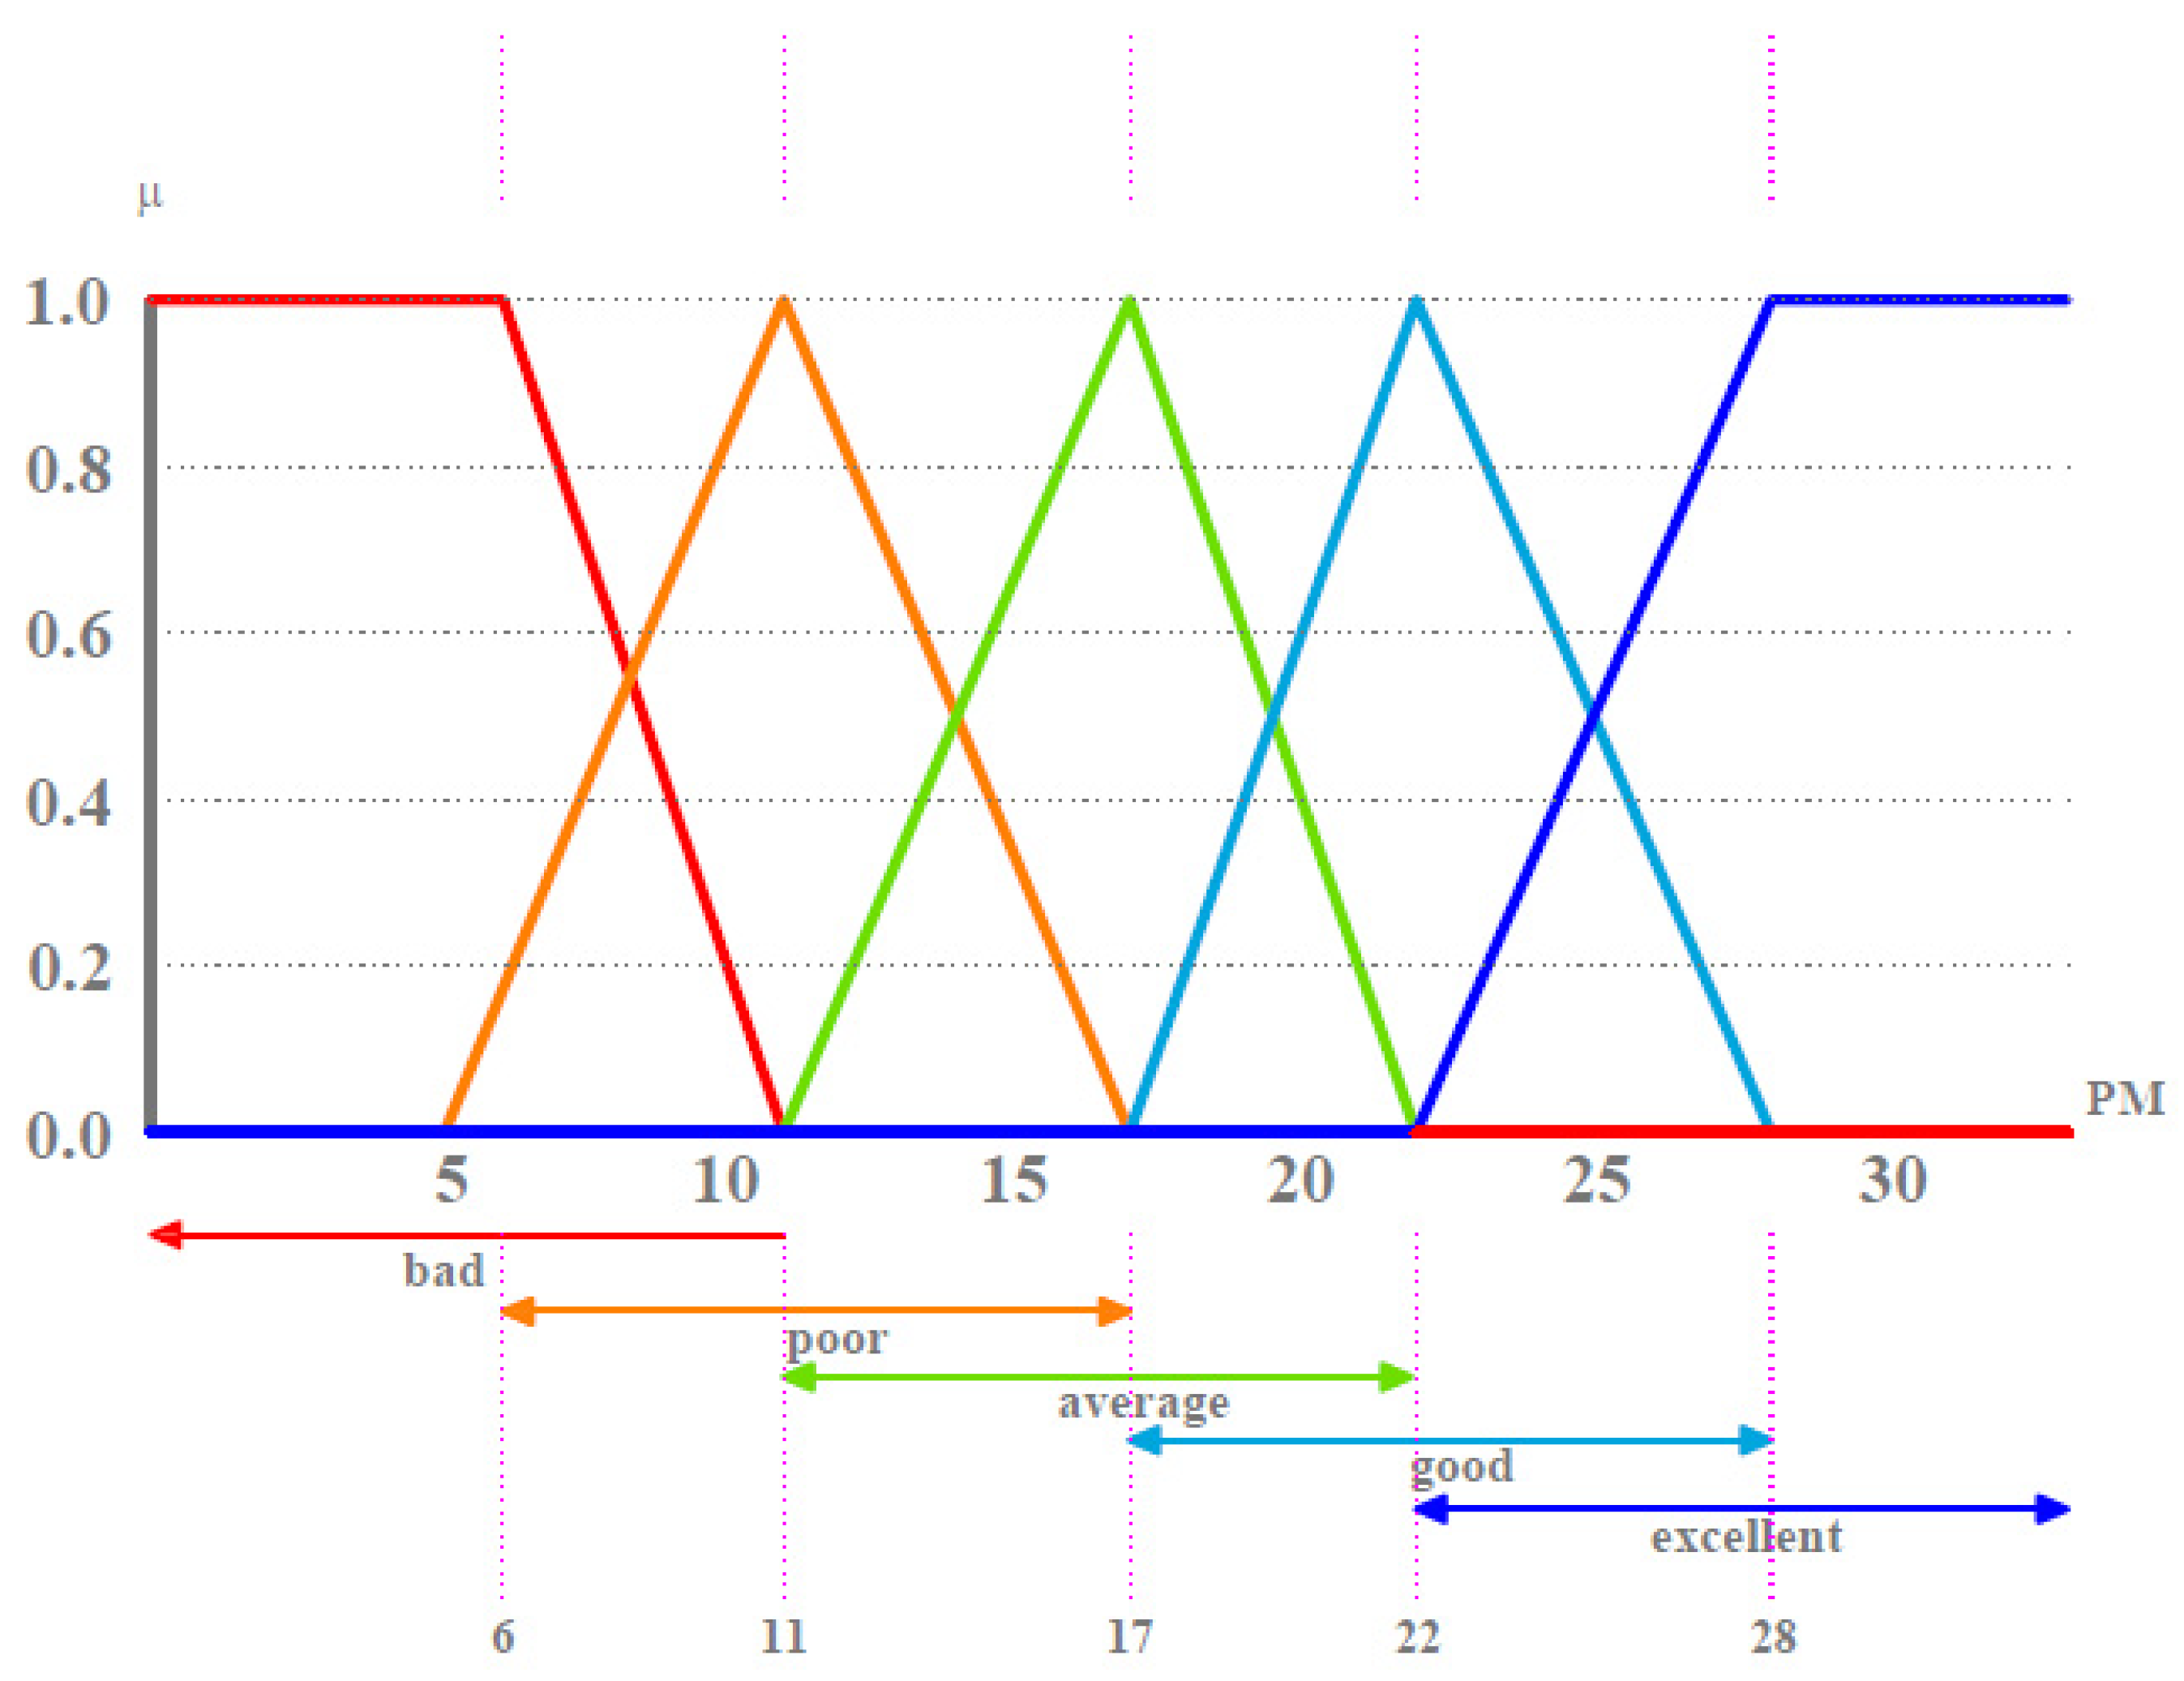

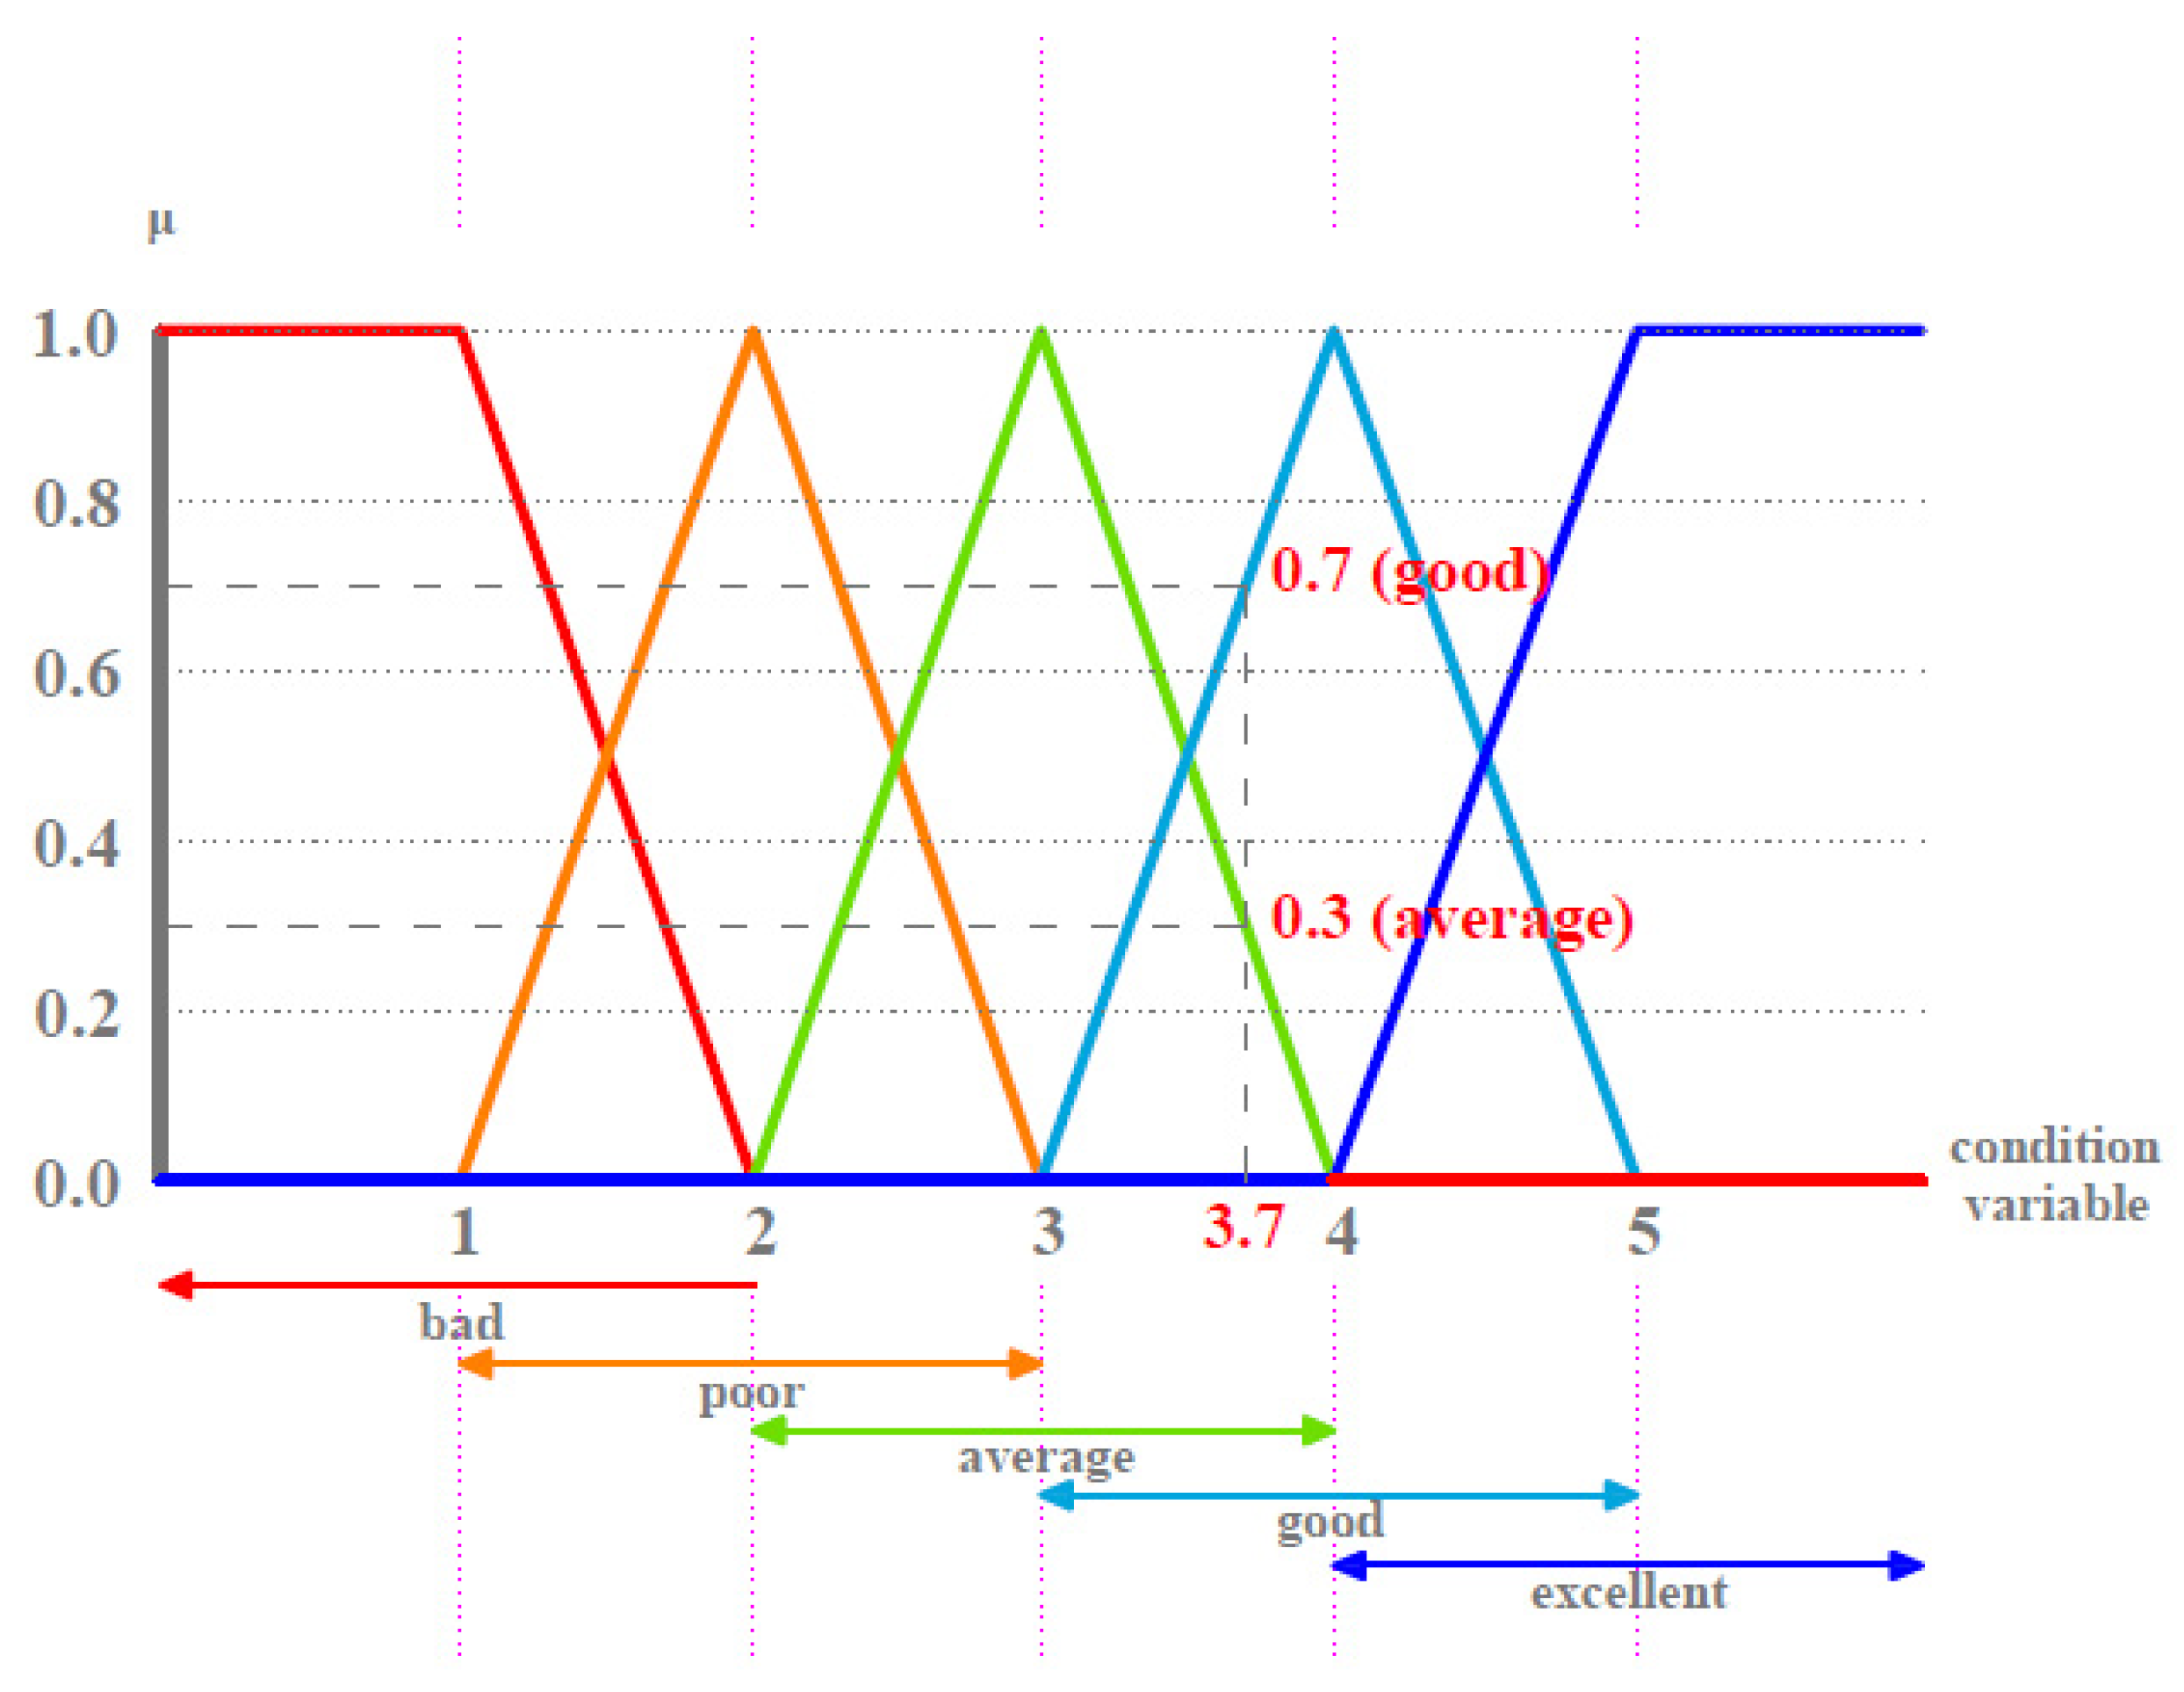
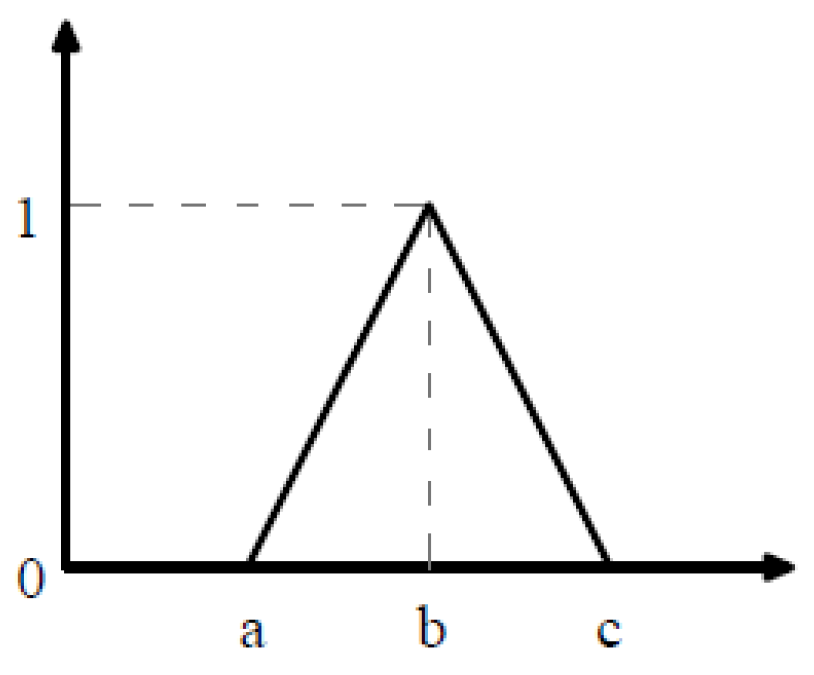
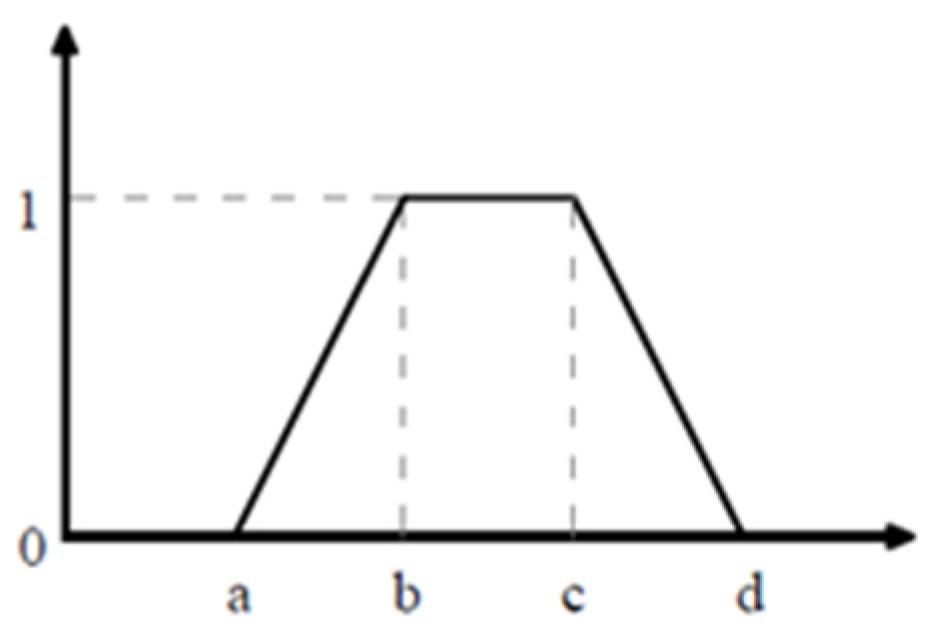
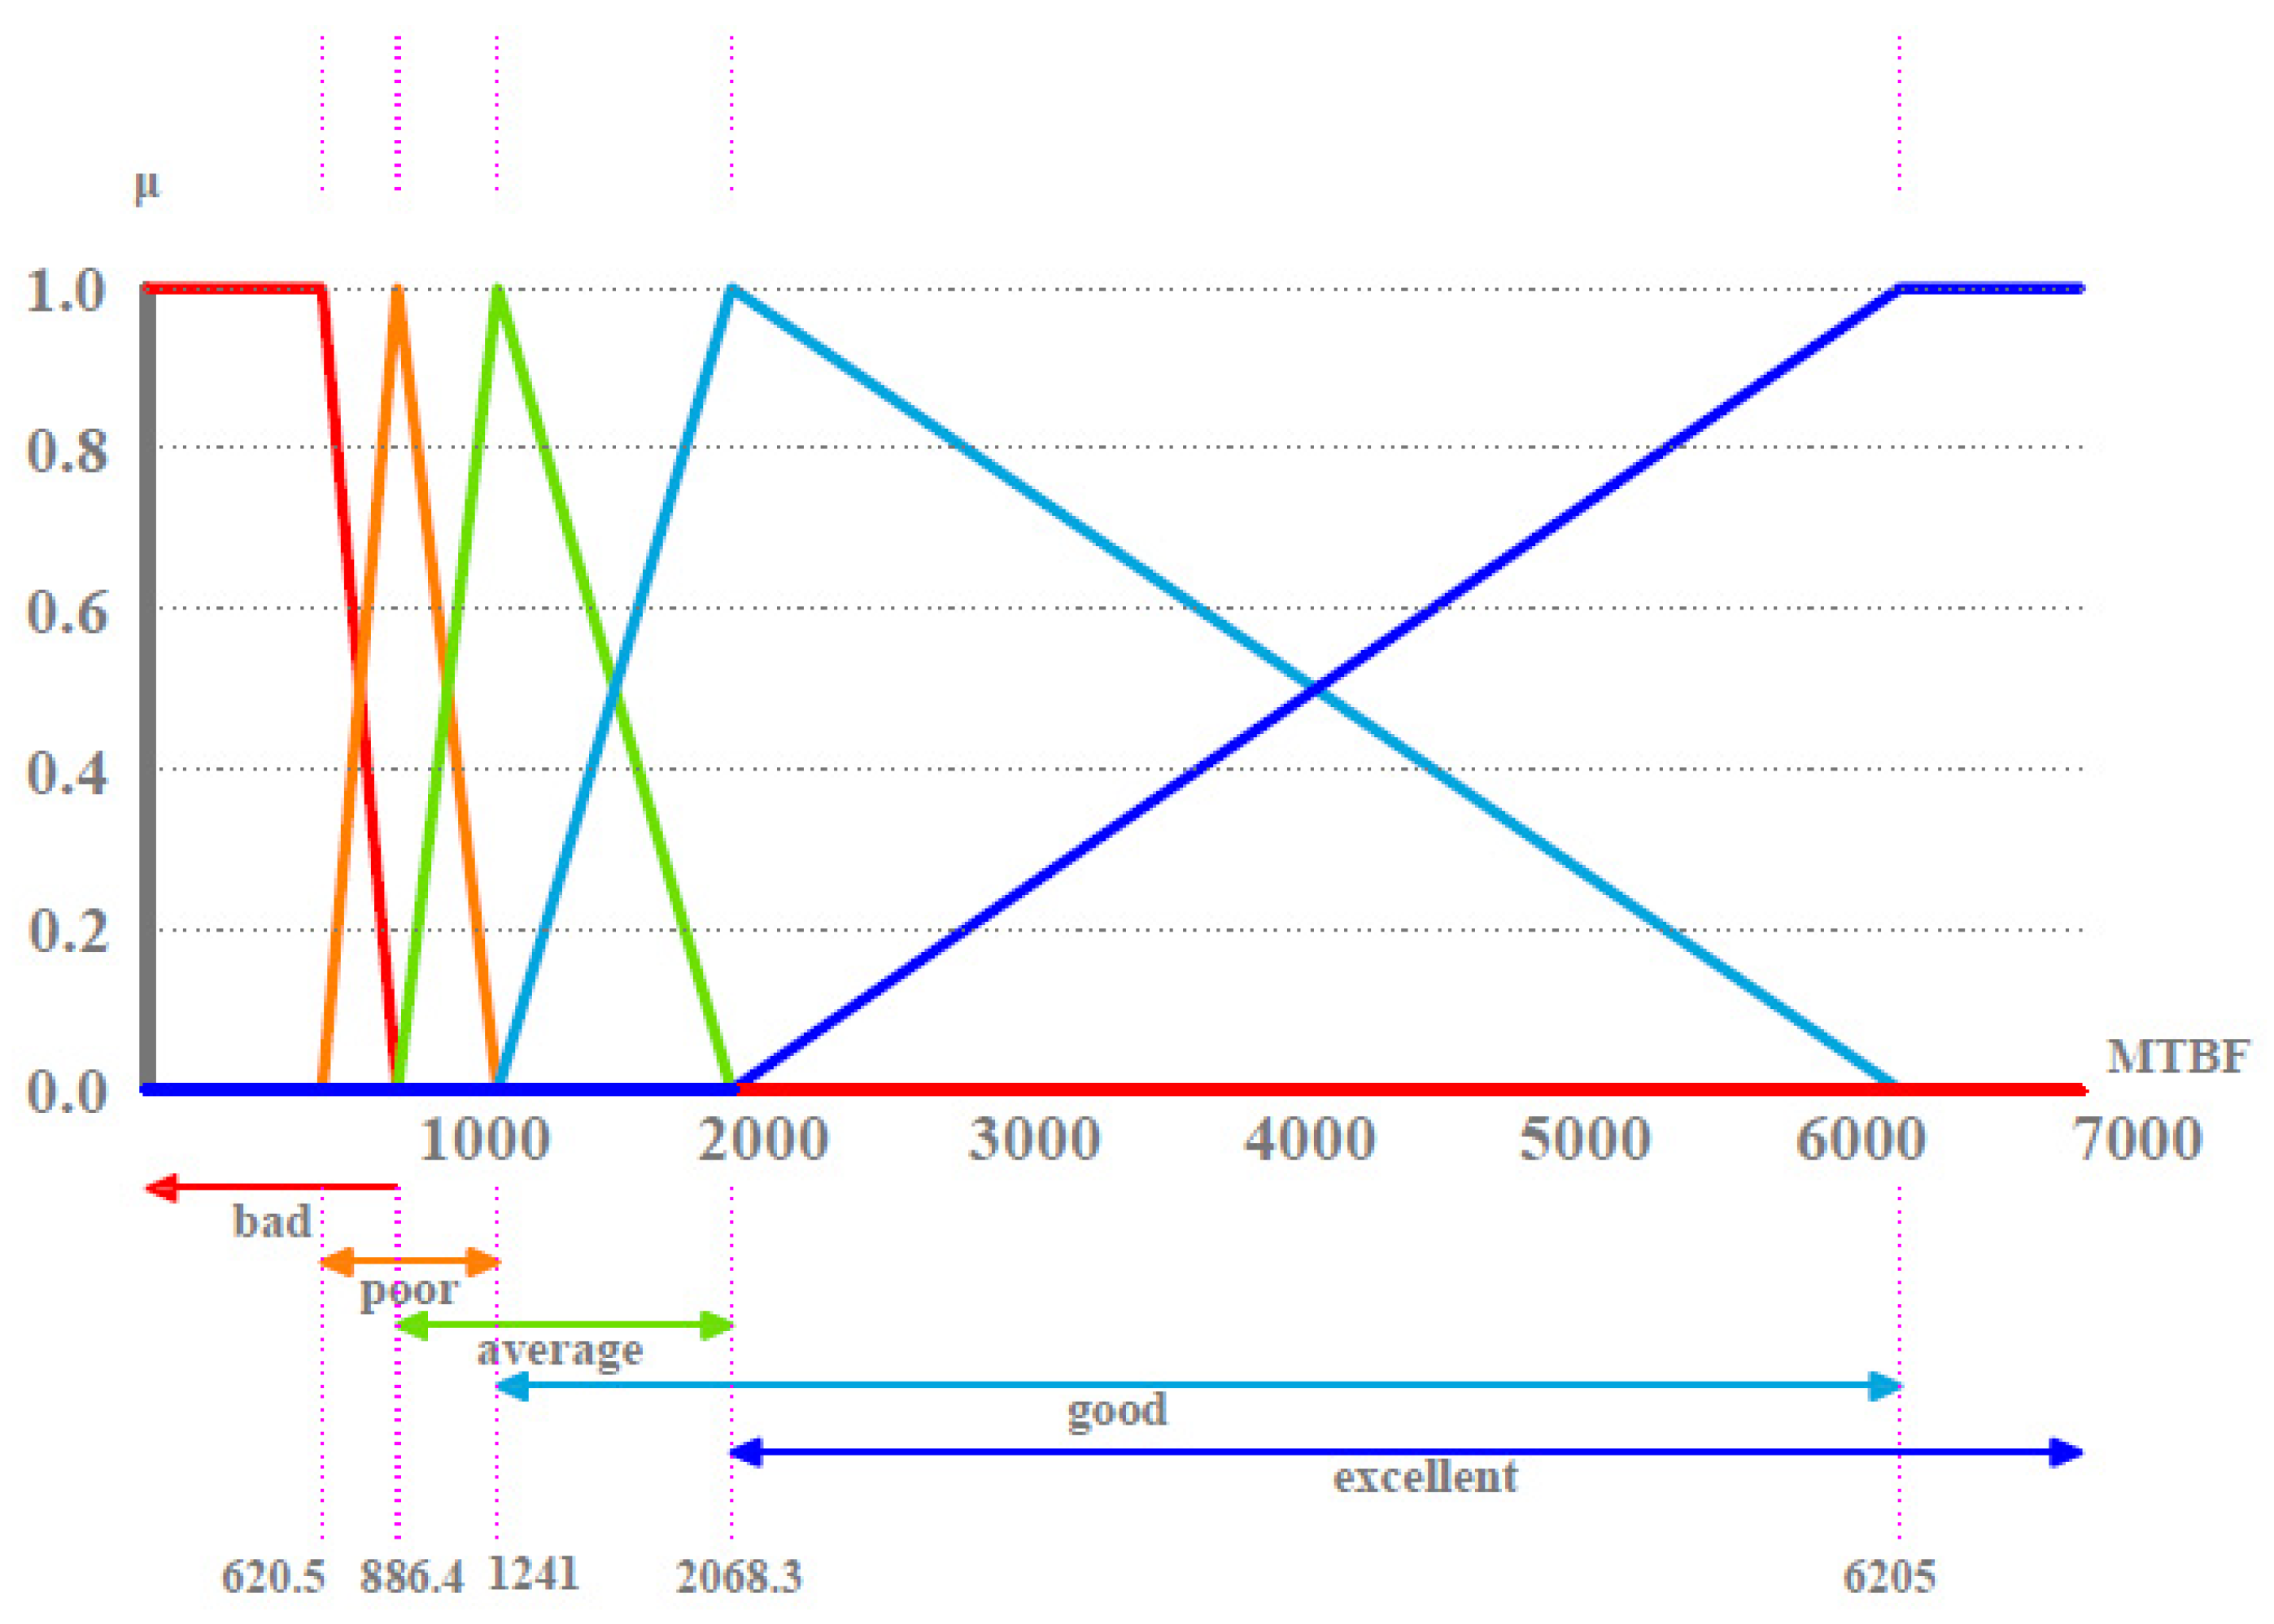
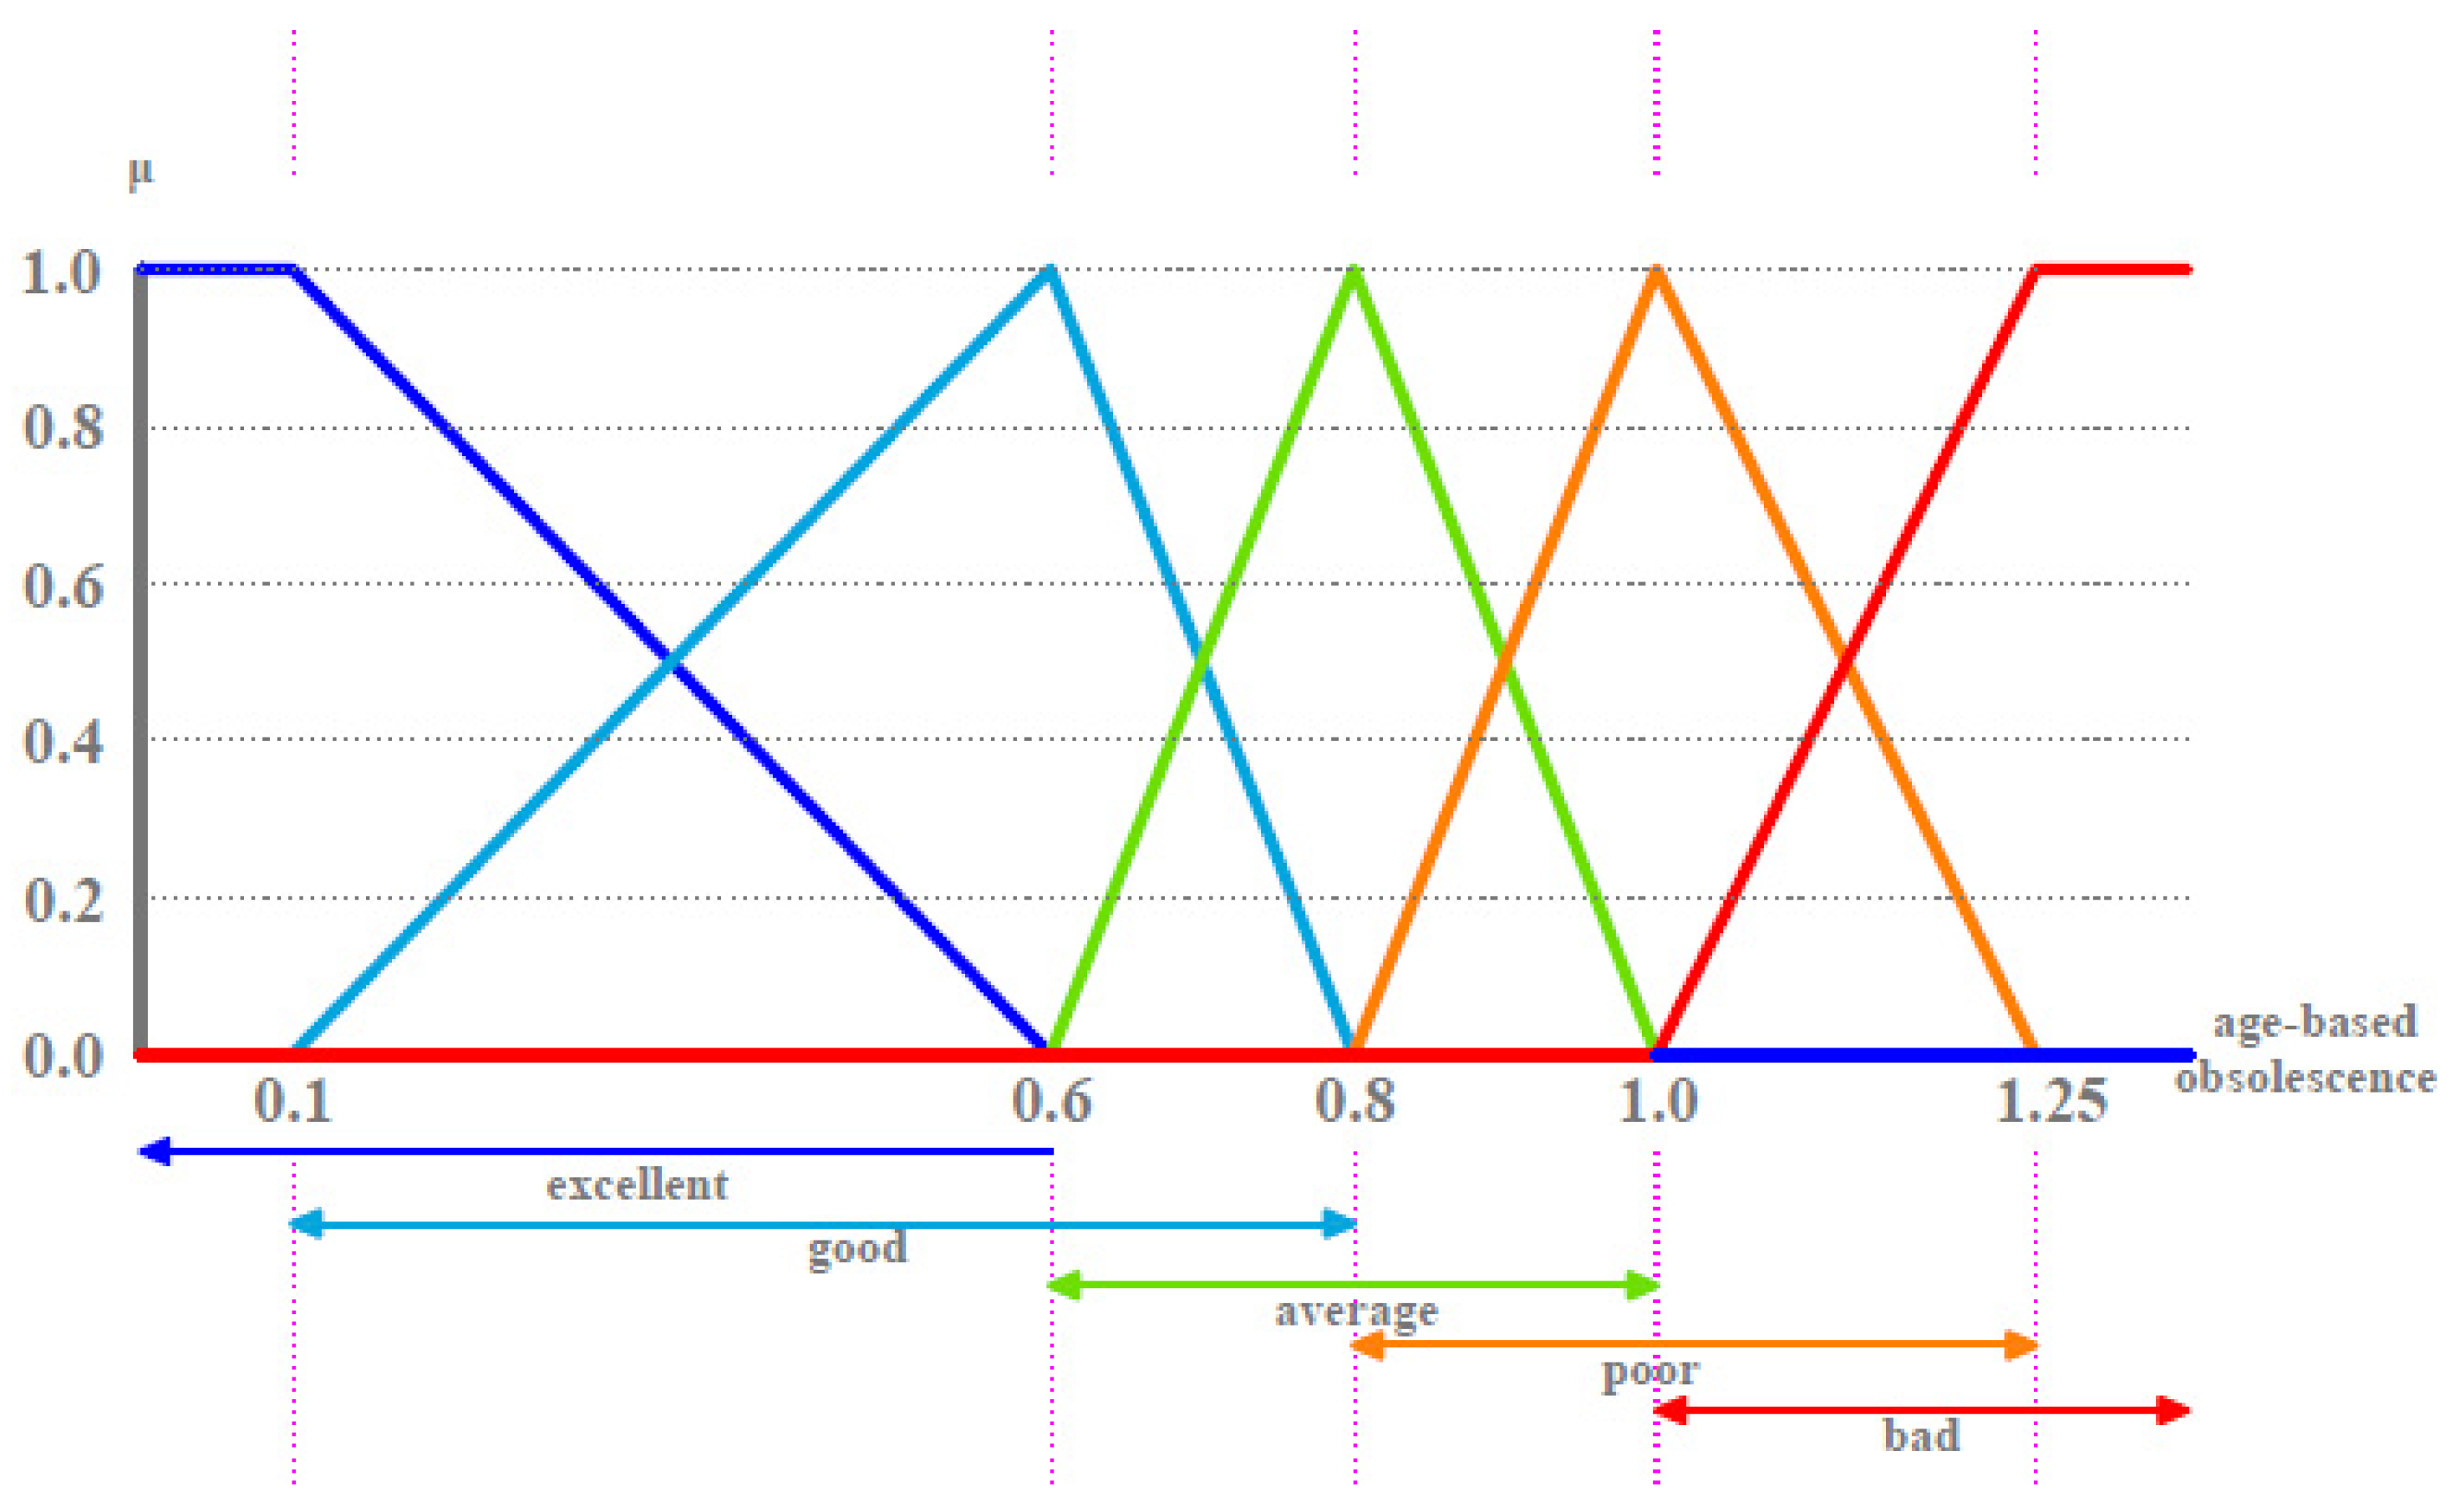
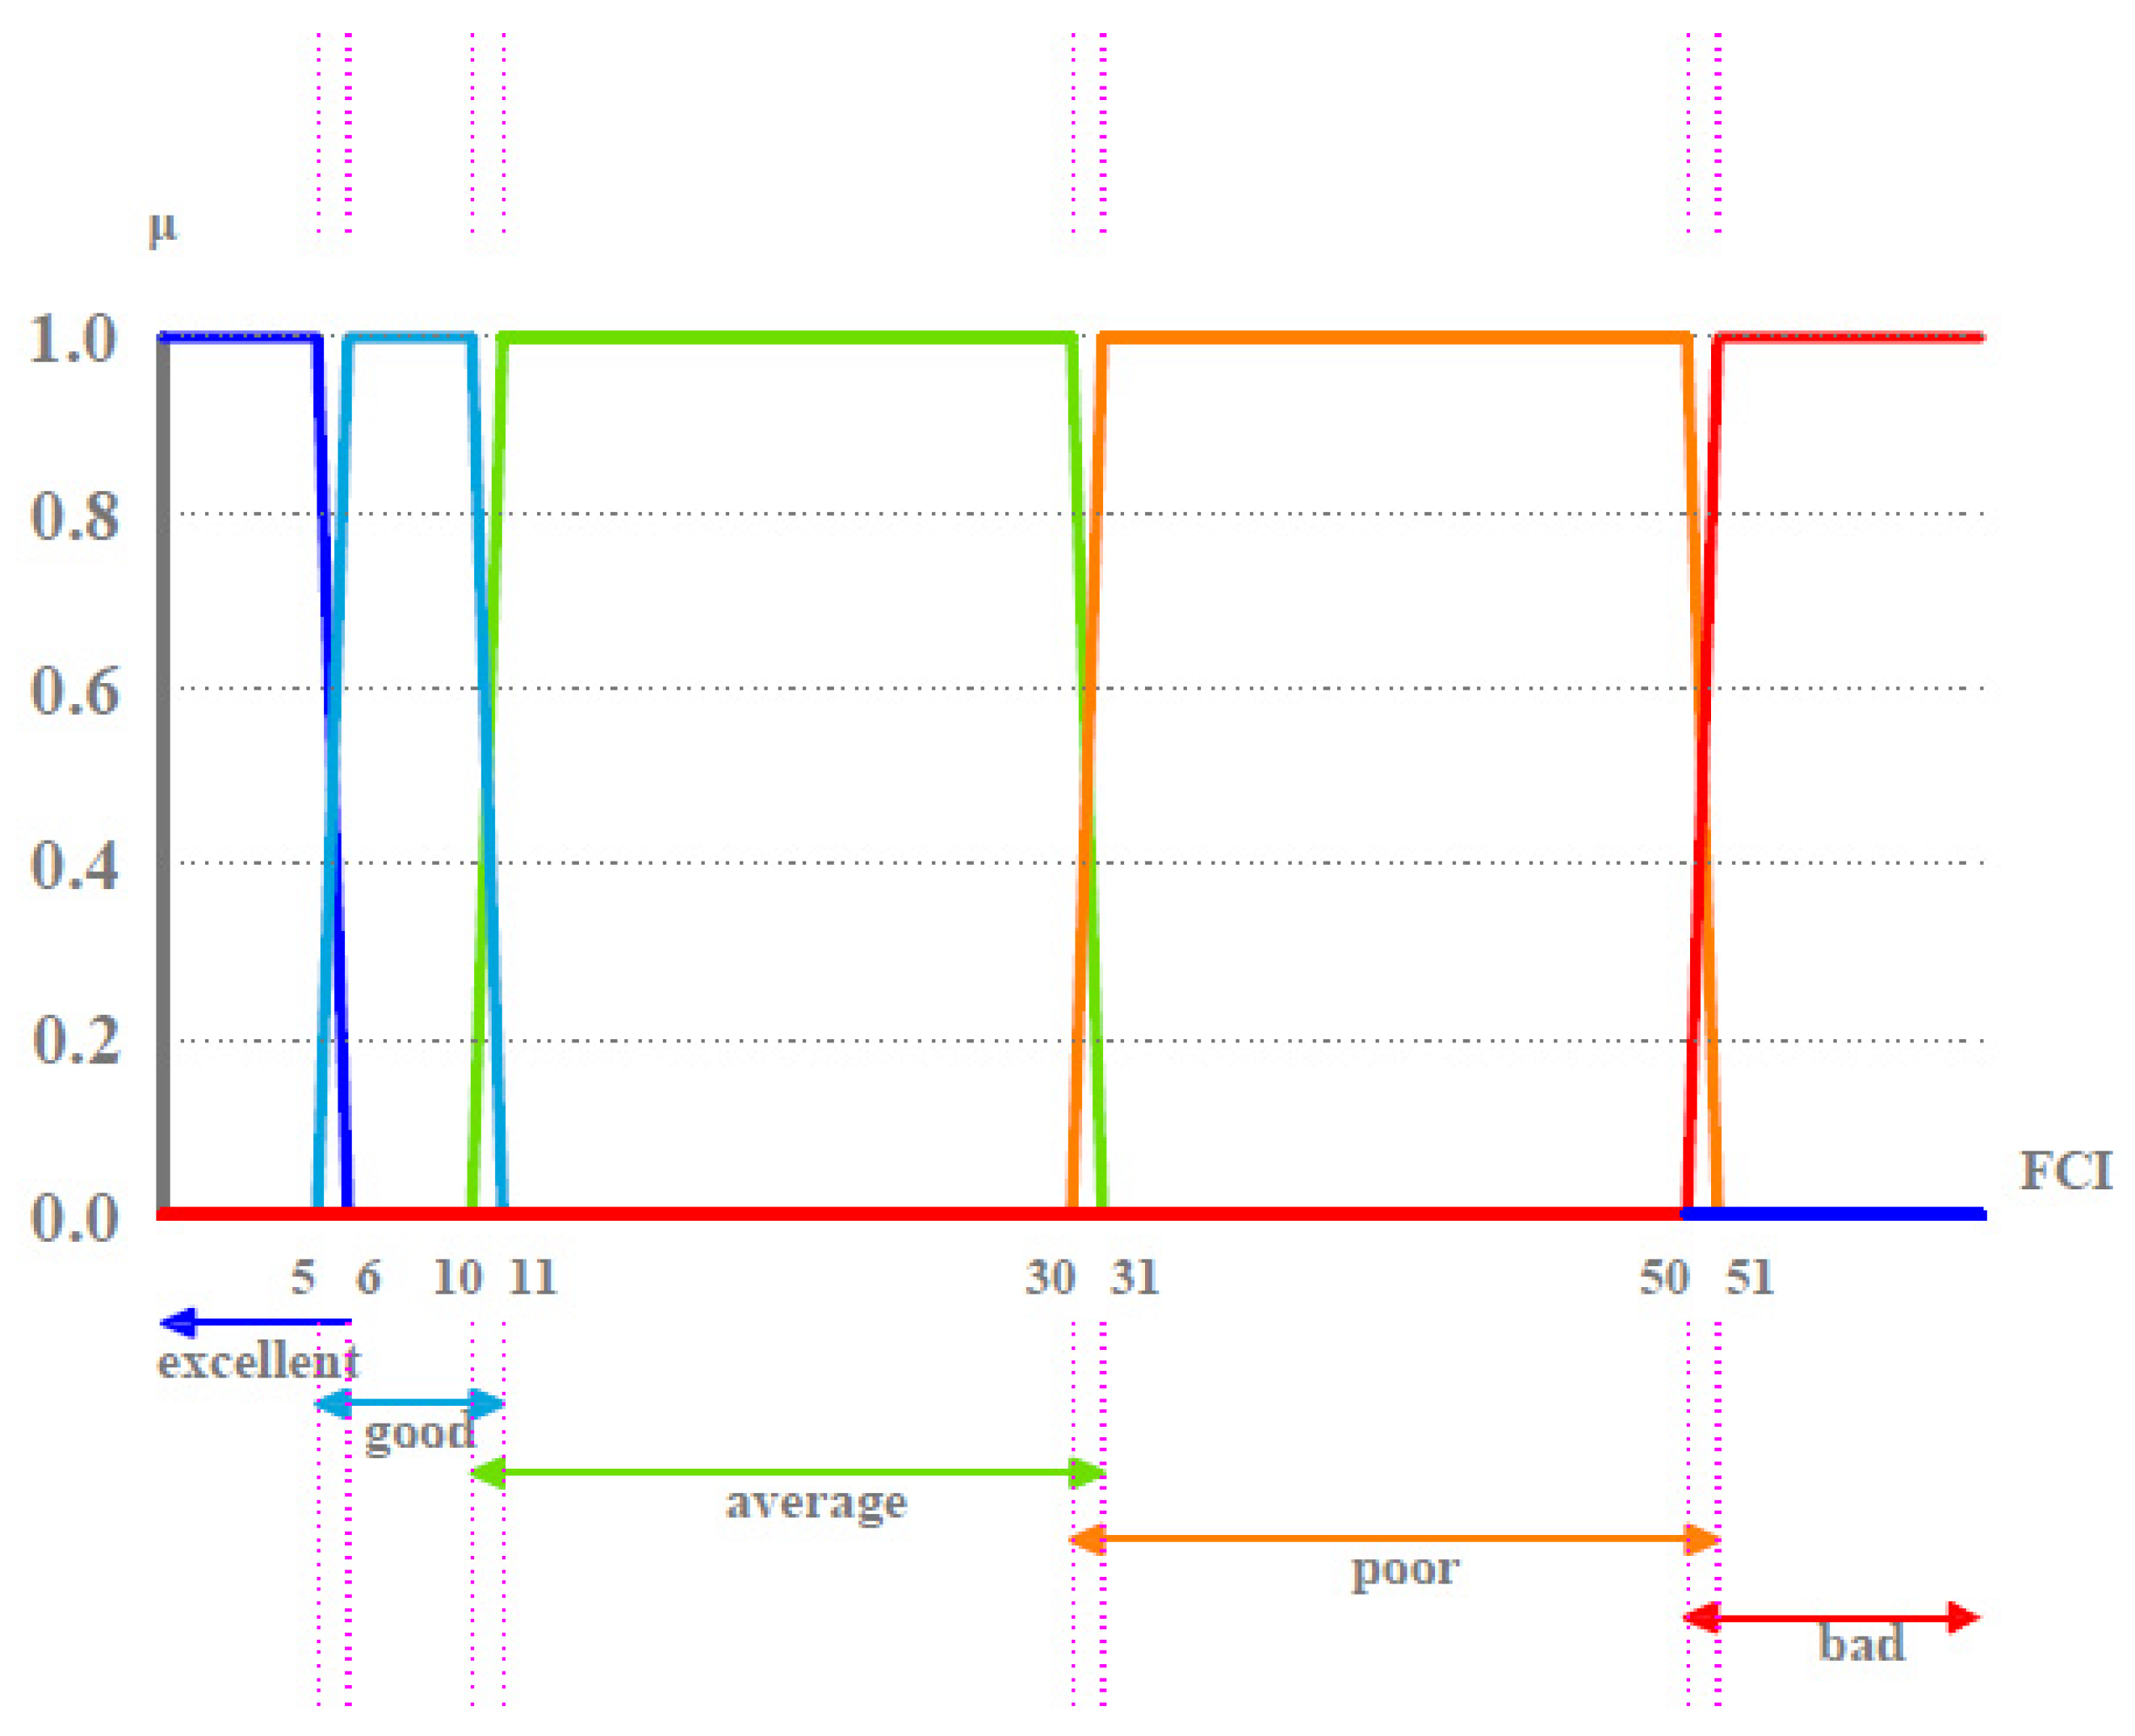
Table 1.
Recent Studies in CA applied in FM area.
| Studies | Focus |
|---|---|
| Brandt & Rasmussen, 2002 [14] | Condition checklist for identifying the needs for retrofitting and functional obsolescence |
| Uzarski, Hicks, & Zahorak, 2002 [15] | The U.S. Army Engineering and Research Development Center, Construction Engineering Research Laboratory (ERDC-CERL) condition assessment system BUILDER that uses condition indexes within the range of failed to excellent (seven-point scale) |
| Grussing, Uzarski, & Marrano, 2006 [16] | Condition prediction model using the Weibull probability distribution function and visual inspection data |
| Abbott, McDuling, Parsons, & Schoeman, 2007 [17] | A five-point color-coded condition rating system for identifying the required maintenance needs with budget allocation |
| Singh Ahluwalia, 2008 [18] | Visual guidance for condition assessment with location-based inspection practice (four-point scale) |
| Salim & Zahari, 2011 [19] | Development of a building condition rating on a scale from 1 (highest) to 5 (lowest) that considers building type, building age, visual inspection, and the cost of repair |
| Eweda, Zayed, & Alkass, 2015 [20] | Space-based condition assessment model using analytical network process (ANP), analytical hierarchy process (AHP) techniques, and multi-attribute utility theory (MAUT) (six-point scale) |
Table 2.
Variables Considered in the Developed CA Framework.
| Condition Variables | Computation | Data Origin and Reference Standards |
|---|---|---|
| 1-Mean Time Between Failures (MTBF) | 1a-FM data (based on building and equipment type, unit loading, geographic location) 1b-CMMS data (annual # of work orders per equipment) | |
| 2-Age-Based Obsolescence | 2a-The age of equipment at the time of CA 2b-BOMA (suggested expected service life for HVAC equipment) | |
| 3-Facility Condition Index (FCI) | 3a-FM data (corrective maintenance backlog) 3b-FM data (the cost of replacing the equipment without considering any wear and tear) | |
| 4-Occupant Feedback | The analysis of occupant satisfaction survey data regarding building maintenance 4a | 4a-Occupant satisfaction survey focusing on the building maintenance performance |
| 5-Preventive Maintenance (PM) Cycle | 5a-CMMS data (annual # of PM per equipment) 5b-ASHRAE 180-2018 (suggested annual # of PM in the standard) |
Table 3.
The values best corresponding to condition definitions for each variable.
| Condition Definition | MTBF (Hours) | Age—Based Obsolescence [60] | FCI | Occupant Feedback (Mean of the Occupant Answers) | Preventive Maintenance Cycle (Based on ASHRAE 180—2018) |
|---|---|---|---|---|---|
| Bad | 620.5 | 1.25 | 51—100% | 1 | 6 |
| Poor | 886.4 | 1.00 | 31—50% | 2 | 11 |
| Average | 1241 | 0.80 | 11—30% | 3 | 17 |
| Good | 2068.3 | 0.60 | 6—10% | 4 | 22 |
| Excellent | 6205 | 0.10 | 0—5% | 5 | 28 |
Table 4.
Characteristics of the case study building and the chiller.
| Building | Chiller | ||
|---|---|---|---|
| Building type | Office and classroom | Chiller type | Water-cooled condenser (Vapor compression, Screw) |
| Building age | 38 years | Chiller age | 8 years |
| Building area | 156.261 gross square feet | Chiller capacity | 200 tons |
Table 5.
Chiller condition data and fuzzy discrete sets.
| Condition Variables | Condition Data | Fuzzy Discrete Sets |
|---|---|---|
| MTBF | 1551 h | |
| Age-based obsolescence | 0.4 | |
| FCI | 1.6% | |
| Occupant feedback | 4.2 | |
| Preventive maintenance cycle | 24 |
Table 6.
Linguistic conditions for condition variables.
| Condition Variables | Linguistic Condition |
|---|---|
| Mean time between failures (MTBF) | Above average |
| Age-based obsolescence | Very good |
| Facility Condition Index (FCI) | Excellent |
| Occupant feedback | Above good |
| Preventive maintenance cycle | Very good |
Publisher’s Note: MDPI stays neutral with regard to jurisdictional claims in published maps and institutional affiliations. |
© 2021 by the authors. Licensee MDPI, Basel, Switzerland. This article is an open access article distributed under the terms and conditions of the Creative Commons Attribution (CC BY) license (https://creativecommons.org/licenses/by/4.0/).
Share and Cite
MDPI and ACS Style
Besiktepe, D.; Ozbek, M.E.; Atadero, R.A. Condition Assessment Framework for Facility Management Based on Fuzzy Sets Theory. Buildings 2021, 11, 156. https://doi.org/10.3390/buildings11040156
AMA Style
Besiktepe D, Ozbek ME, Atadero RA. Condition Assessment Framework for Facility Management Based on Fuzzy Sets Theory. Buildings. 2021; 11(4):156. https://doi.org/10.3390/buildings11040156
Chicago/Turabian StyleBesiktepe, Deniz, Mehmet E. Ozbek, and Rebecca A. Atadero. 2021. "Condition Assessment Framework for Facility Management Based on Fuzzy Sets Theory" Buildings 11, no. 4: 156. https://doi.org/10.3390/buildings11040156
Note that from the first issue of 2016, this journal uses article numbers instead of page numbers. See further details here.