Article

Impact of Environmental Exposure Conditions on the Maintenance of Facades’ Claddings

1
CERIS, Instituto Superior Técnico, Universidade de Lisboa, Av. Rovisco Pais, 1049-001 Lisbon, Portugal
2
Departament of Civil Engineering, Architecture and Georesources, Instituto Superior Técnico, Universidade de Lisboa, Av. Rovisco Pais, 1049-001 Lisbon, Portugal
*
Author to whom correspondence should be addressed.
Buildings 2021, 11(4), 138; https://doi.org/10.3390/buildings11040138
Submission received: 28 January 2021 / Revised: 19 March 2021 / Accepted: 24 March 2021 / Published: 26 March 2021

Abstract

:
Façades, as the most external building envelope component, are subject to different ex-ternal environmental loads, such as: Temperature, precipitation, damp, and wind. Therefore, the contribution of environmental actions to the occurrence of defects in façades claddings is an important subject of study since these actions strongly affect the degradation process and natural ageing of these components during their service life. In this study, a methodology to support decision-makers in the process of selecting a façade cladding system and the maintenance strategy to implement is presented and discussed. This methodology covers the performance of four façade claddings (ceramic tiling systems (CTS), natural stone claddings (NSC), external thermal insulation composite systems (ETICS), and architectural concrete façades (ACF)) over time, according to three environmental exposure variables (exposure to damp, distance from the sea, and orientation). The databases were established based on the diagnosis of the degradation condition of these claddings in-service conditions, in Portugal. The results reveal that the environmental exposure variables have a significant impact on maintenance requirements and costs. For all the categories of the environmental exposure condition variables, under all scenarios, ETICS is the least favorable constructive solution while CTS is the most advantageous solution. Furthermore, the results show that properly implemented maintenance activities enhance the performance level of building components, which positively affects their degradation behavior over time.

1. Introduction

Façades are crucial to buildings’ overall performance [1] and are expected to meet aesthetic, comfort, safety, and durability requirements [2]. The façades, being external walls [2], are part of the building envelope, the barrier that separates the external environment from the interior [3,4]. In this sense, façades are designed with the purpose of protecting the inside of the building from undesirable climate influence [5]. Part of the façade’s functions is established based on the interaction with external environmental conditions, such as the following [6]: Mitigation of water and air leakage; thermal and acoustical insulation; solar and glare control; and natural lighting. A façade is a complex system, in terms of design, construction, and maintainability [1].
The cladding, the façade “skin” [2,7], being the outer layer of the system, is a particularly vulnerable component. Façades performance is highly dependent on the climate [8], since they are directly subjected to the variability of different types of external loads over decades, such as the following [5]: Temperature, precipitation, damp, and wind. Its robustness, resilience, and adaptability are vital, not only to users’ protection, but also to prevent escalating damage after weather events [4]. The façade cladding material is often less durable than the structure of the building, although it is expected to promote the overall durability of constructions, when properly maintained or refurbished [2].
Environmental actions have an evident contribution to the occurrence of defects in façade claddings, in spite of the observed significance of causes associated with design and execution errors [9,10,11,12]. Climate agents strongly affect the degradation process and natural ageing of the building external components, during their service life [4]. Durability depends on the external climate loads and on the building specific location, in terms of topography, rural or urban context, altitude and distance to the sea [5]. These factors, both beyond the control of designers, are related and contribute to characterize the climate at a local level. Maintenance needs are known to vary according to local climate [13] and so does the degradation condition.
Having acknowledged the relevance of local climate to the durability of façades, other particularities must be considered too. The environmental exposure of a building relates to the environment around it, characterized by degradation agents that have an impact on its materials and components [14]. Environmental exposure can be analyzed under different levels of a climate scale classification, of which local climate is part, followed by microclimate [14,15]. The microclimate level is characterized by the meteorological variables directly close or adjacent to the cladding surface [14]. The micro environmental conditions are fundamental to the materials degradation, vary considerably in real service circumstances [15], and can be directly measured and monitored [16]. The façade’s microclimate depends on several factors, such as the following [14,16]: Orientation; characteristics of the cladding material; characteristics of building (e.g., height); topography of the ground and protection of the surface, by elements existing in the façade or by external surrounding elements.
The microclimate results from a combination of environment-related factors, and it is too simplistic to assume that the contribution of one specific climate parameter to in-service degradation can be individually understood, without considering the influence of others. Durability problems are likely to result from the simultaneous occurrence of different climate loads. The combined action of environmental agents should be considered, to deepen the knowledge on the real-life degradation phenomena [17]. For example, the orientation of the façade influences the action of several climate agents, such as solar radiation, temperature, damp, wind, and rain [2,16,18], on the surface of the cladding.
Nevertheless, human actions, specifically decision-making in the project, construction, or maintenance phases, are indeed critical to enhance the durability of the building envelope components, guaranteeing suitable in-service performance. The specification and choice of materials and the detailing of construction solutions and infrastructures (aspects under the control of the designers) are also a key factor for durability [5].
Using scientific evidence on the service life of façade claddings is an advantage, to support decision-making. However, usually, the choice of materials is not scientifically based, but rather supported by subjective experience [19] and led by the material’s appearance and initial costs [20]. For example, only the owners/managers have the authority to select the constructive solution to be implemented in the building’s façades and choose the maintenance level to be adopted. However, this process is based on personal perspectives, rather than objective evidence [20,21,22]. Therefore, the best choice can be only made if all parameters available are considered. These parameters can include budget limitations, aesthetic appearance, desired condition level, local constraints, environmental exposure conditions, and the social and economic contexts of the building. Furthermore, based on the identified common relation between maintenance needs and design errors, the components’ maintainability requirements and degradation performance are not always known to the building designers [23]. Frequently, the maintainability of the material is not a priority, which compromises the future maintenance activities and the costs throughout the service life [19]. Reliable information on the service life of building materials and components is not only relevant to support decision-making, but also the base for practicing sustainable construction [24] and to develop effective maintenance strategies [25]. Service life prediction methodologies [7,26] have been developed to provide useful information on the degradation phenomena of building components, in real service conditions, and to know “how” and “when” to intervene [17].
The degradation of building components is a complex phenomenon [7] that presents a high level of randomness and uncertainty, whose stochastic nature should be recognized in the building management system research [17]. The climate, a significant aspect in the degradation process, is a complex system too. It is no longer adequate to assume that these complex systems can be analyzed separately and the relations between them are entirely understood [27]. To fully understand the influence of environmental exposure on the performance of the façades, which reflects their degradation condition, the following aspects must be considered: (i) Climate (the agents); (ii) cladding material (the object); and (iii) what results from the interaction between the previous (the mechanisms that generate defects and the degradation itself).
Currently, when addressing environmental exposure conditions of façades, the impact that climate change is expected to have on buildings should also be acknowledged, specifically on the durability of materials and components and on the extreme events-related damage of structures, namely in susceptible older constructions [28,29,30]. An increase in maintenance needs and costs is expected, for instance in Norway [31], where climate change-induced increase in annual maintenance needs is estimated to cost more than 400 million euros, for the period 2070–2100 [32]. Knowledge on how constructive solutions respond to climate is essential to adapt maintenance planning, introducing climate change-induced hazards. New methodologies must be developed to accurately assess a subject of such complexity, assuming that building envelopes will need to resist stricter weather conditions [31].
Therefore, the decision-making about the selection of a façade cladding is not simple. There is no single solution based on the individual evaluation of costs, material properties and/or environmental exposure conditions. This is a multi-decision problem that involves a trade-off between different parameters, but most of all, the decision relies on the decision-maker. However, objective methodologies to support decision-making are scarce, especially considering the environmental exposure conditions.
As this study presents, the assessment of façade claddings service life, based on real service conditions, through visual inspections of the components in situ, and according to complex environmental variables (e.g., orientation), which are explained by a set of climate parameters, is indeed relevant. Furthermore, the choice of cladding material, during the design phase, plays an important role on the environmental degradation of the façade. The impact of environmental exposure conditions on the cladding’s predicted service life, maintenance needs and respective costs is covered by the present study, based on the assessment of four constructive solutions: Ceramic tiling system (CTS); natural stone cladding (NSC); external thermal insulation composite system (ETICS); and architectural concrete façades (ACF). The comparison of results can be useful to support not only the decision-making process during the design phase of the building, but also the maintenance strategy, during the life cycle.
If adequately implemented to building stock management, maintenance can be an important instrument for the adaptation of constructions to climate change [33]. The present study is a valid contribution within this context. It was developed with the objective of adding new information regarding the impact of environmental variables on the maintenance of different façade claddings, based on the assessment of in-service conditions. The results contribute to: (i) Understanding the influence of the type of cladding material and the environmental exposure on the service life, maintenance costs, efficiency and number of interventions; (ii) supporting the choice of the cladding based on maintainability [34] and over time performance, considering the action of climate degradation agents; and (iii) bringing useful information to further research, regarding a maintenance strategy adapted to climate change, critical to delay the end of buildings’ service life [35], ensuring adequate performance.

2. Materials and Methods

2.1. Constructive Solutions Analyzed

In this study, four building facades’ constructive solutions are analyzed: Ceramic tiling system (CTS); natural stone cladding (NSC); external thermal insulation composite system (ETICS); and architectural concrete façades (ACF). These claddings were selected since they are expensive solutions with long service lives and, so, their long-term behavior deserves to be maintained. In Figure 1, an illustrative example for each constructive solution is given.

2.2. Maintenance Model

To perform this analysis, a stochastic maintenance model based on the Petri nets formalism is used to compute all parameters required to analyze the four constructive solutions. The maintenance model was previously developed by the authors [36]. This model, in addition to being considered a life cycle model, is also a condition-based model. The maintenance model includes the degradation, inspection, and maintenance processes, and it is assumed that the decisions to intervene are only carried out after the element’s condition has been assessed through inspections.
The classification system implemented in the degradation process of the maintenance model is based on the work of Gaspar and de Brito [26]. This classification system is composed of five degradation conditions, ranging from A (no visual degradation) to E (generalized degradation). In this classification system, the overall degradation condition of the different constructive solutions is computed through the severity of degradation index, Sw, corresponding to the ratio between the area affected by the anomalies observed in the constructive solutions, weighted according to their severity, and a reference area equivalent to the total area with the highest possible degradation level—Equation (1).
S w = A n × k n × k a , n A × k ,
where:
  • Sw is the severity of degradation (in percentage);
  • An the area affected by anomaly n (in m2);
  • kn the multiplication factor for the anomaly n;
  • ka,n the weighting coefficient according to the relative weight of the anomaly n;
  • A the total area of the constructive solution (in m2); and
  • k the multiplying factor corresponding to the highest degradation condition of the area A.
These parameters vary according to the constructive solution. The classification system for the different constructive solutions are presented in Appendix A: Table A1 for CTS [37]; Table A2 for NSC [38]; Table A3 for ETICS [39]; and Table A4 for ACF [40].
On the other hand, in the maintenance model, interventions are divided in four levels: (i) Inspections; (ii) cleaning operations; (iii) minor interventions; and (iv) total replacement [1,25,36,41,42,43,44]. In terms of activities, the inspection includes only the visual assessment of the cladding and the decision to intervene is based on the inspection results. If the degradation condition of the element is A, no maintenance is required or carried out; B, a cleaning operation must be implemented; C, a minor intervention is needed; and, finally, D or E, total replacement is required (representing the end of the service life). In general, condition A represents a situation with no visible degradation; condition B begins to present some visual anomalies and some loss of integrity, which do not put at risk the cladding’s performance; condition C corresponds to a cladding with slight degradation, with anomalies related with joints and loss of integrity of the cladding; condition D corresponds to a cladding with moderate degradation, with an evolution of the condition C anomalies; finally, condition E corresponds to a generalized degradation of the cladding, with the presence of severe anomalies (Appendix A). The cleaning operation comprises the removal of the aesthetical and visual anomalies (soiling, stains and other deposits); the minor intervention covers previous cleaning operation activities, localized repair and/or partial replacement of the cladding; and, finally, in the last level, the total replacement of the cladding is carried out.
The parameters (service life, life-cycle costs, efficiency index, and number of interventions) used to assess the constructive solutions are the outputs of the maintenance model. Since, in this model, a Monte Carlo simulation was adopted to consider uncertainty in the degradation, inspection, and maintenance processes, the parameters are computed in the following ways:
  • Service life: The end of the service life (ESL) is predicted through the cumulative distribution functions (CDF) computed in the degradation process [36]. It is assumed that the ESL of the constructive solutions is reached when the probability of transition between degradation conditions C and D is equal to 50%. This value was defined based on previous works [7] and experts’ judgment.;
  • Life-cycle costs: The life-cycle costs (LCC), defined by Equation (2), correspond to the sum of the construction costs (production and application), Cinitial, the costs related with inspections, ∑Cinspection,t, and the costs related with other maintenance activities, ∑Cmaintenance,t. Basically, LCC represents the accumulate costs that the owner/manager will incur during the time horizon, th, to keep the cladding in operation [45].
    L C C = C i n i t i a l + t = 0 t h C i n s p e c t i o n , t + t = 0 t h C m a i n t e n a n c e , t .
    To contemplate future investments, Equations (3) and (4) are used to compute the net present value of the inspection and maintenance activities, respectively [46,47].
    t = 0 t h C i n s p e c t i o n , t = t = 0 t h C i n s p e c t i o n 1 + υ t ,
    t = 0 t h C m a i n t e n a n c e , t = t = 0 t h C m a i n t e n a n c e 1 + υ t ,
    where Cinspection and Cmaintenance are inspection and maintenance activity costs at time t, respectively, and υ the real discount rate. In this study, a private sector environment is considered, and therefore, a real discount rate of 6% is adopted [45,48];
  • Efficiency index: The ability of a maintenance strategy to maintain the cladding in a good performance condition (in terms of degradation) is described by the efficiency index (EI)—Equation (5).
    E I = t = 0 t h S w t d t 100 · t h ,
    where ∫ Sw(t) dt represent the area underneath the degradation profile (loss of performance), and 100∙th the area underneath the degradation profile when there is no degradation (theoretical situation). The efficiency index ranges between 0 and 1. The higher the EI value, the more efficient the maintenance strategy is over time;
  • Number of interventions: The number of interventions represents the average number of times that the different interventions (cleaning operations, minor interventions, and total replacement) are carried out in the cladding during the period under analysis.

2.3. Multi-Criteria Decision Analysis

In order to support decision-makers to assess the information available, multi-criteria decision analysis (MCDA) can be used to identify a single option, to select a short-list of options for future detailed appraisal, or to tell acceptable and unacceptable possibilities apart [49]. In this work, an additive aggregation approach with compensatory rationality is implemented. In this methodology, a standardization of the criteria is performed, and a global ranking is determined for each option through Equation (6) [50].
X i = j = 1 m λ j · x i j ,   with   j = 1 m λ j = 1   or   100 % ,
where Xi is the global ranking of the option i, λj the weight of criterion j, and xij the standardized classification of option i according to criterion j. Since usually the different criterion analyzed have different scales, a standardization by interval is implemented. Equation (7) is used for an increased order of preference, while Equation (8) for a decreased order of preference [7].
x i j = X i j min X i j max X i j min X i j ,
x i j = max X i j X i j max X i j min X i j ,
where Xij is the classification of option i according to criterion j, and min Xij and max Xij are, respectively, the minimum and maximum value of criterion j.

2.4. Environmental Exposure Conditions

According to Lewry and Crewdson [51], weathering factors, such as ultraviolet (UV) radiation, temperature, damp, air pollutants and marine environments, are the main influencers of the degradation of building materials and components. In this way, external claddings are the building components most exposed to different environmental exposure conditions, and this exposure will strongly influence the degradation rate and the expected service life of external claddings. In this sense, in this study, the impact of three environmental exposure conditions (exposure to damp, distance from the sea, and orientation) are assessed in the overall degradation and maintenance of the four constructive solutions over time.

2.4.1. Exposure to Damp

One of the primary promoters of the degradation of external claddings is exposure to damp [52]. The presence of moisture in conjunction with salts significantly increases the degradation rate of external claddings, leading to aesthetic anomalies (such as scaling, flaking, efflorescence, strains, and biological growth) or more severe anomalies (such as cracking, swelling, detachment, spilling, and material loosening) [53,54,55,56]. In this study, exposure to damp is divided into two categories: (i) Low, for claddings in buildings located in an urban context, at more than 5 km from the sea and without the influence of dominant winds carrying sea salts; and (ii) high, for buildings located closer to the sea or other humidity sources, under the direct influence of sea winds, or in areas with an average annual rainfall higher than 500 mm or average annual relative humidity higher than 75%.

2.4.2. Distance from the Sea

Exposure to atmospheric salinity in coastal environments leads to severe degradation of buildings’ materials and components [57]. The presence of sea salts on the external surfaces causes the occurrence of anomalies such as: Efflorescence, cryptoflorescence, exfoliations, spalling, granular disintegration, and scaling [58,59,60]. In this study, regarding their distance from the sea, cladding systems are divided into two categories: (i) Coastal areas (less than 5 km); and (ii) inland (more than 5 km).

2.4.3. Orientation

The claddings’ orientation has a significant impact on their degradation process, since the “microclimate” on each surface is different. For instance, in the north hemisphere, claddings with north and west orientation are more likely to degrade. Claddings facing north have lower periods of solar exposure and, consequently, are more susceptible to the presence of moisture cycles and therefore biological growth, while west have higher probabilities of the combined occurrence of wind and rain [7,61]. Furthermore, in the north hemisphere, south is also a critical orientation since it has longer solar exposure, showing higher probabilities of loss of color and cracking [62,63]. In this study, in terms of claddings’ orientation, the sample is divided into the four main cardinal directions: West, south, east, and north.

3. Results

In this study, four constructive solutions (ceramic tiling system (CTS); natural stone cladding (NSC); external thermal insulation composite system (ETICS); and architectural concrete façades (ACF)) are analyzed as case studies. To investigate the maintenance strategies more relevant for the increase of the efficiency of the constructive solutions three maintenance strategies (MS) were considered [36,43,44]:
  • MS1: Total replacement only;
  • MS2: Combination of minor interventions and total replacement; and
  • MS3: Combination of cleaning operations, minor interventions, and total replacement.
In the maintenance model, for all environmental exposure conditions and constructive solutions, the degradation process follows a Weibull distribution. The optimal parameters of the degradation process are presented in Table 1, in terms of mean and standard deviation of the sojourn time in each degradation condition. The fit of the degradation process to the historical data (collected through in-situ visual inspections) was performed through a degradation model based on stochastic Petri nets, in which the choice of the best probability distribution that describes the degradation process is performed through the maximization of the logarithm of the likelihood [17]. The information presented in this table can be read in the following way: For a CTS, for the situation without impact of the environmental exposure conditions, a transition between conditions A and B, TA, takes, on average, 6.6 years to occur, with a standard deviation of 6.5 years. The same analysis can be performed for the other environmental exposure and degradation conditions. In Table 1, the values of TA are lower due to the reduced interval associated with the severity of degradation, Sw, and the anomalies considered to quantify the severity of degradation in conditions A and B. The severity of degradation of condition A varies between 0 and 1% (for all constructive solutions), showing that the deposit of superficial dirt is sufficient to move them from condition A to B. Moreover, the classification system is highly dependent on the inspector, geographic location, exposure conditions and time of the year.
Instead, the information of the maintenance activities (costs, application zones, and impacts) is shown in Table 2. The costs were estimated based on CYPE cost database [64], and the quantification of the impact of the interventions were estimated based on a probabilistic approach, implemented through the maintenance model, by assessing the impact of the intervention on the overall degradation condition of the constructive solution [65]. More specifically, this information indicates, for example, that a cleaning operation in a CTS has a cost of 27.48 €/m2, it is applied when the cladding reaches condition B, and improves the cladding’s condition to A, PA, with a probability of 30.6%, or maintains condition B, PB, with a probability of 69.4%. The reduced probabilities of the claddings improving to condition A (Table 2) are associated with the classification system. The severity of degradation of condition A varies between 0 and 1%. Thus, small anomalies, such as: Change of shine and/or color, that are not corrected by either cleaning operations or minor interventions, suffice to change the condition from A.
Furthermore, for each analysis, a time horizon, th, of 80 years, and an initial severity of degradation, Sw, of 0% (condition A), at the beginning, is considered. In this study, a time horizon, th, of 80 years is chosen because, nowadays, the climate scenarios are performed until 2100 [66]. Finally, it is referred that all solutions analyzed are technically feasible.

3.1. Analysis without the Impact of Environmental Exposure Conditions

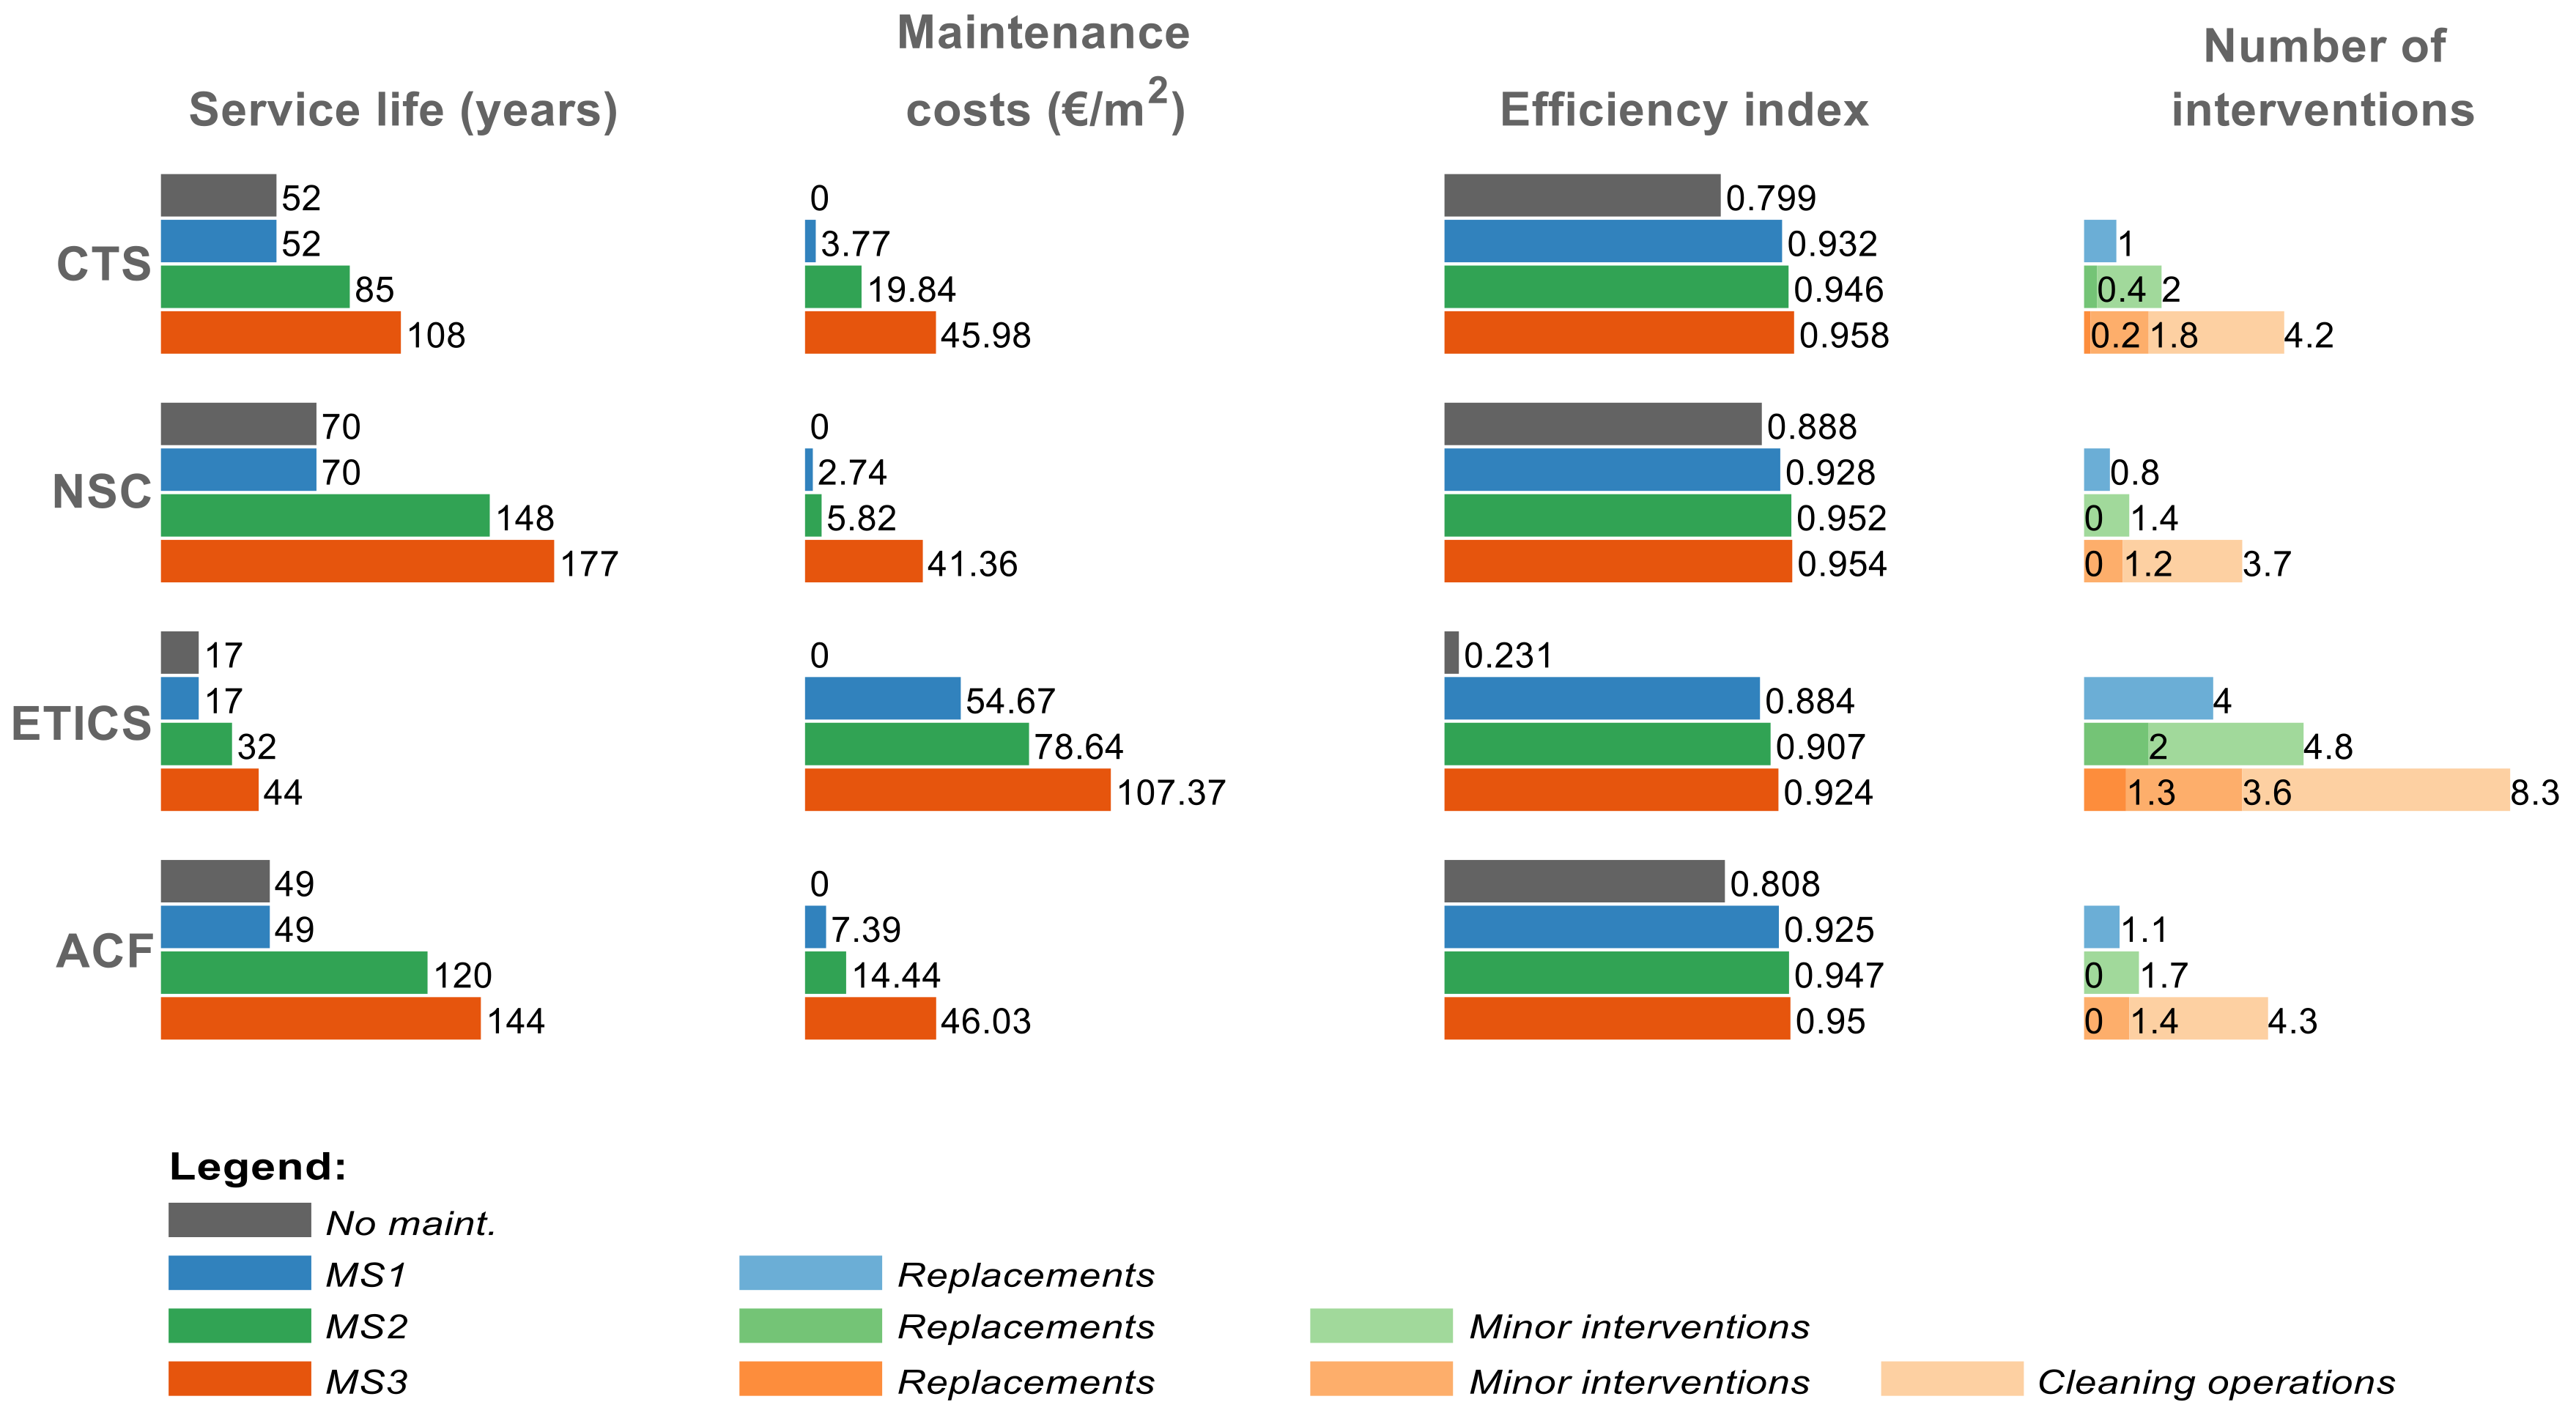
Concerning the situation without the impact of environmental exposure conditions, in Figure 2, the four parameters (service life, maintenance costs, efficiency index, and number of interventions) are compared for the four different types of constructive solutions.
From the results, at first sight, it seems that all the constructive solutions present similar behavior. As maintenance strategies become more complete (i.e., more maintenance activities are performed, from MS1 to MS3), there is an increase of the service life of the solution and the maintenance strategy becomes more efficient. In addition, although there is an increase of the global number of interventions, the number of deep interventions (replacements) is substantially reduced, allowing reducing the users’ satisfaction during the time horizon [67]. Finally, in terms of costs, the increase of the complexity of the maintenance strategy and, consequently, the increase of the number of interventions has a greater impact on the maintenance costs.
Furthermore, Figure 2 allows understanding that the four constructive solutions have distinct characteristics and how the impact of maintenance strategies and the relationship between the parameters can be different. For example, by analyzing the service lives, the results reveal that NSC is the solution with the longest service life and ETICS is the one with the shortest one, while CTS and ACF are the intermediate solutions. However, if the service life values for CTS and ACF are analyzed in more detail (in function of the maintenance strategy), it seems that, although they present similar values for MS1, the impact of cleaning operations and minor interventions is much more significant in ACF. In addition, the increase of the service life for ACF occurs without a significant difference between maintenance costs, efficiency indexes and the number of interventions of the two construction solutions.
On the other hand, despite the four constructive solutions presenting similar values of the efficiency index for the three maintenance strategies, a greater impact of the maintenance strategies occurs for ETICS, when compared to the situation without maintenance. However, this solution also shows a greater number of interventions and higher maintenance costs. This is mainly because this solution has a shorter service life compared to the time horizon implemented in this study, and so ETICS will need a greater number of maintenance activities over the time horizon to present the same degradation conditions.
Finally, if the different costs are analyzed (Table 3), a solution with less initial costs does not necessarily correspond to the most economical solution in global terms (Equation (2)). For example, for similar efficiency indexes, NSC implies a higher initial cost than ETICS, but its low maintenance costs make this solution more attractive in a long-term analysis, during the life cycle. In addition, NSC bring other advantages compared to ETICS, such as the smaller number of interventions and longer service lives.
This analysis reveals that different solutions have different performance, advantages, and weaknesses and, therefore, the selection of the undoubtedly best is an impossible task. Consequently, the environmental exposure conditions will also present different impacts on construction solutions. In this sense, when selecting a given solution, the owners/managers/designers should be adequately informed regarding the behavior of that solution when facing the climatic agents. In the following sections, three environmental exposure conditions are assessed: (i) Exposure to damp (Section 3.2); (ii) distance from the sea (Section 3.3); and (iii) orientation (Section 3.4).

3.2. Exposure to Damp

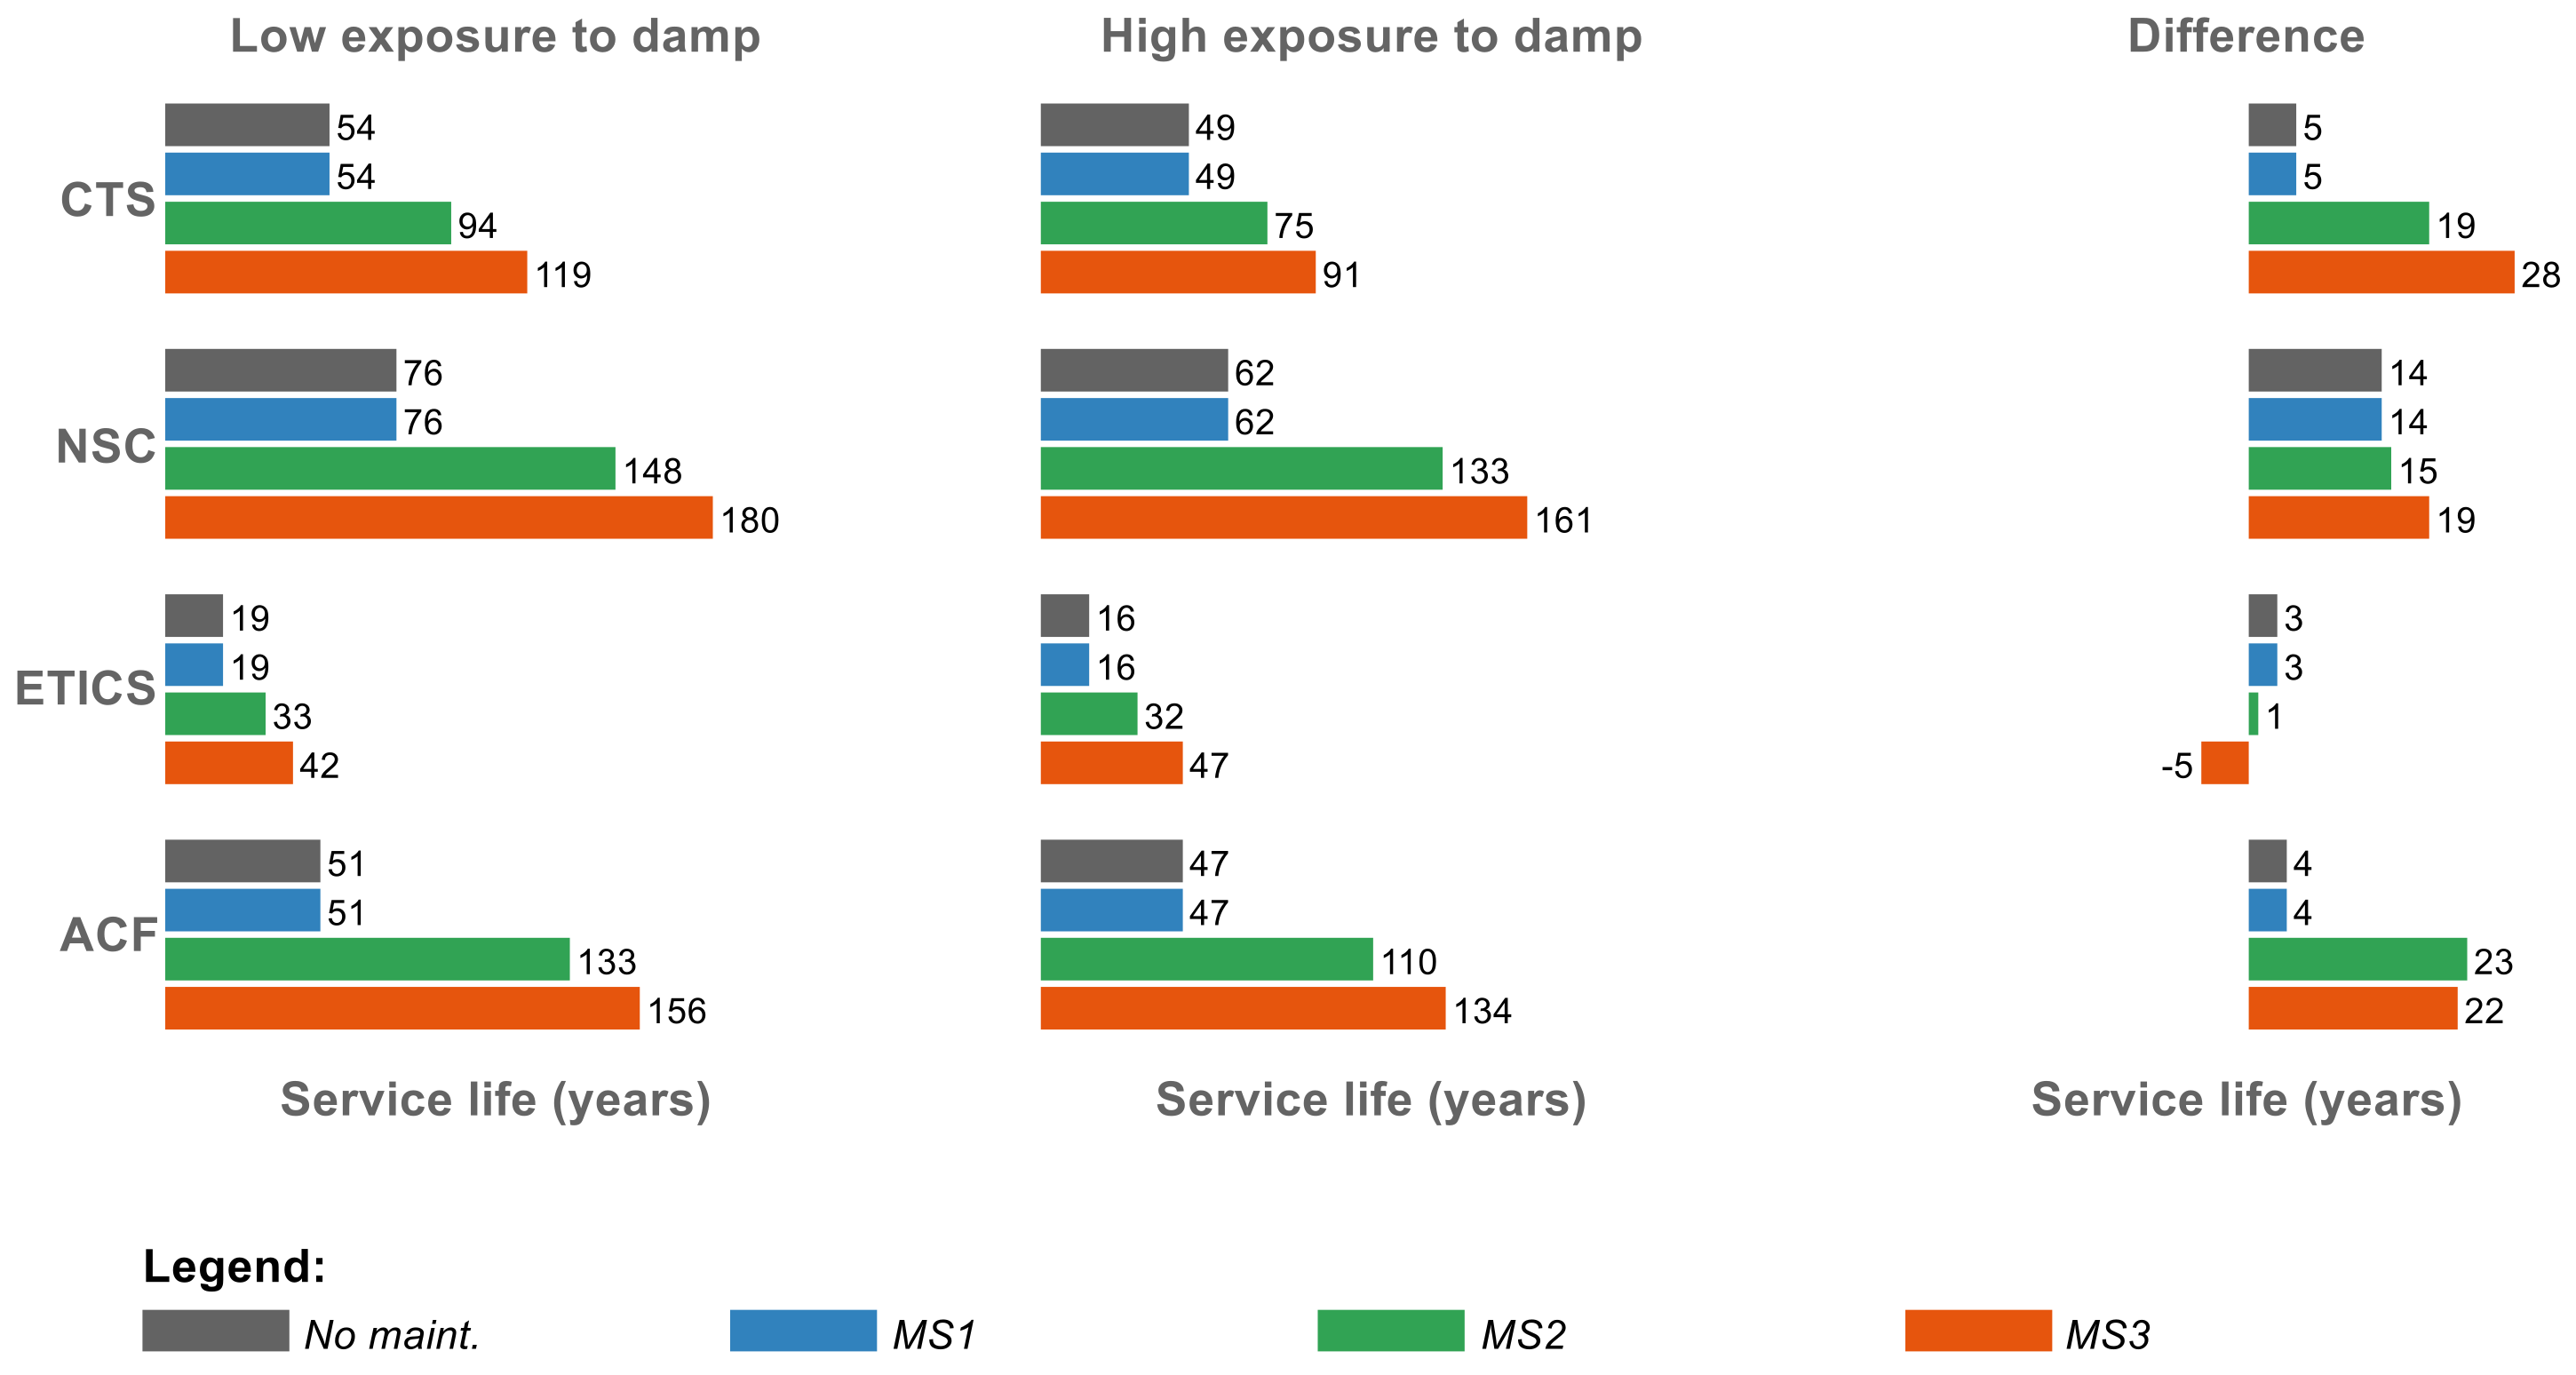
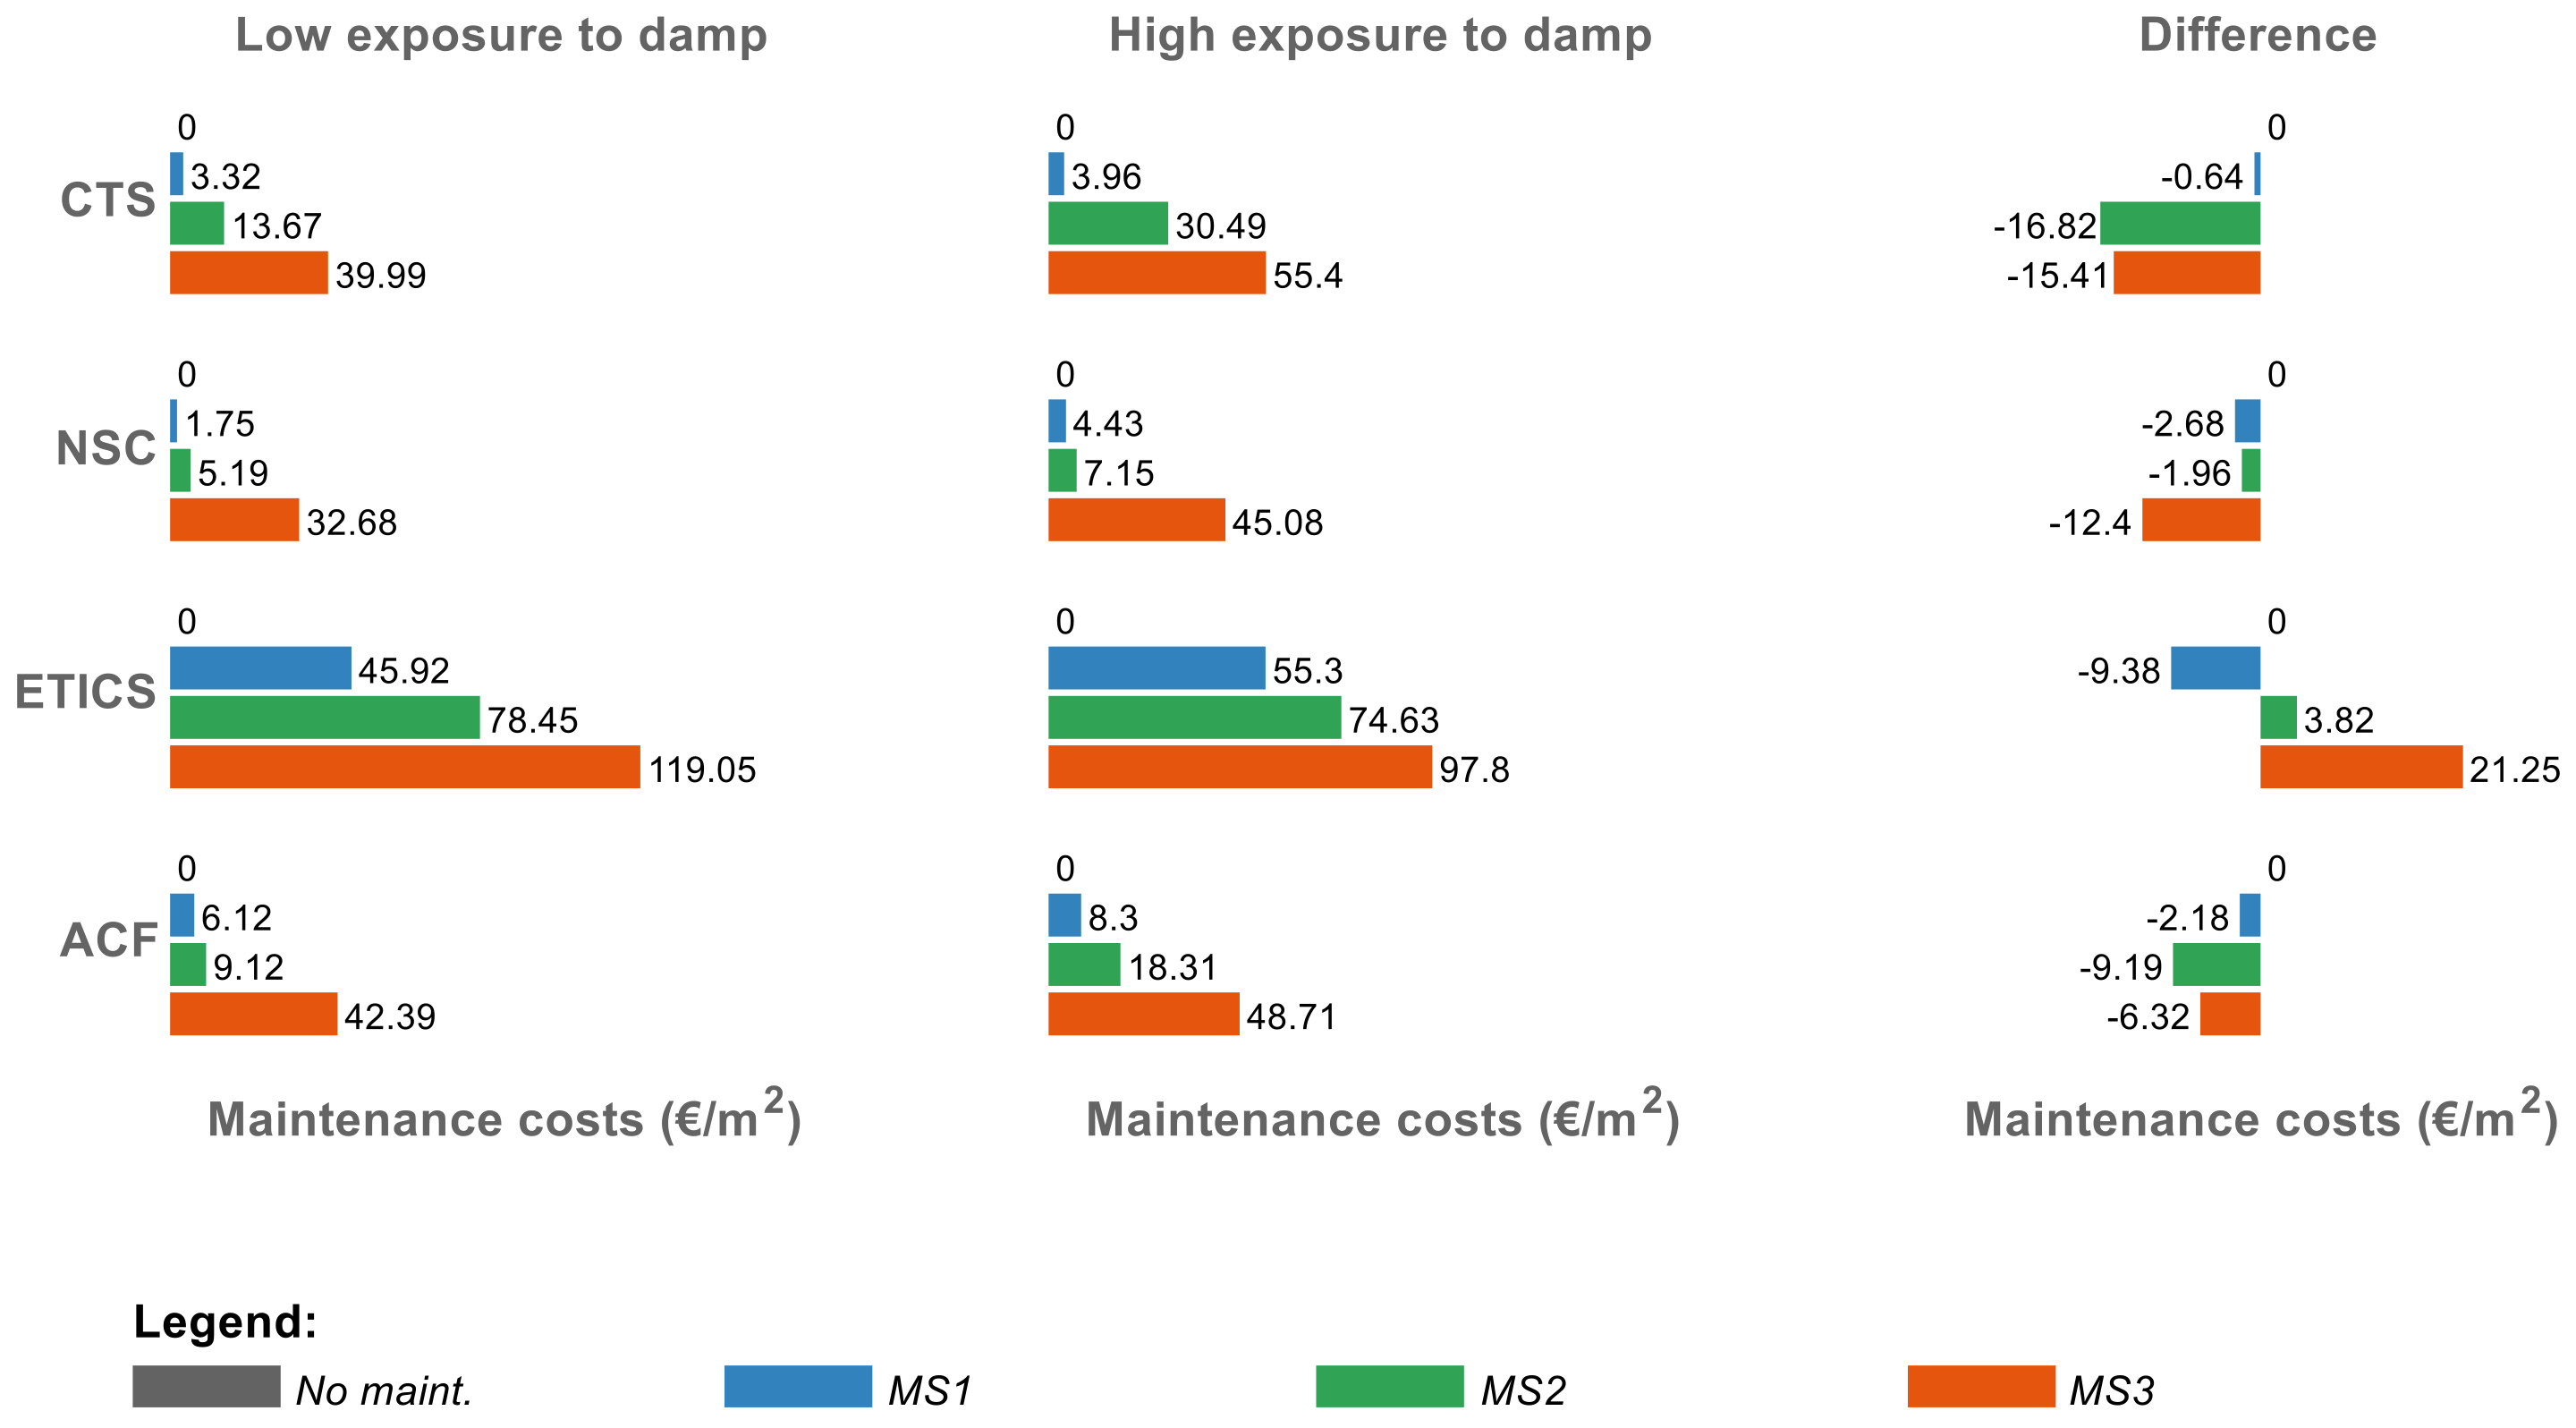
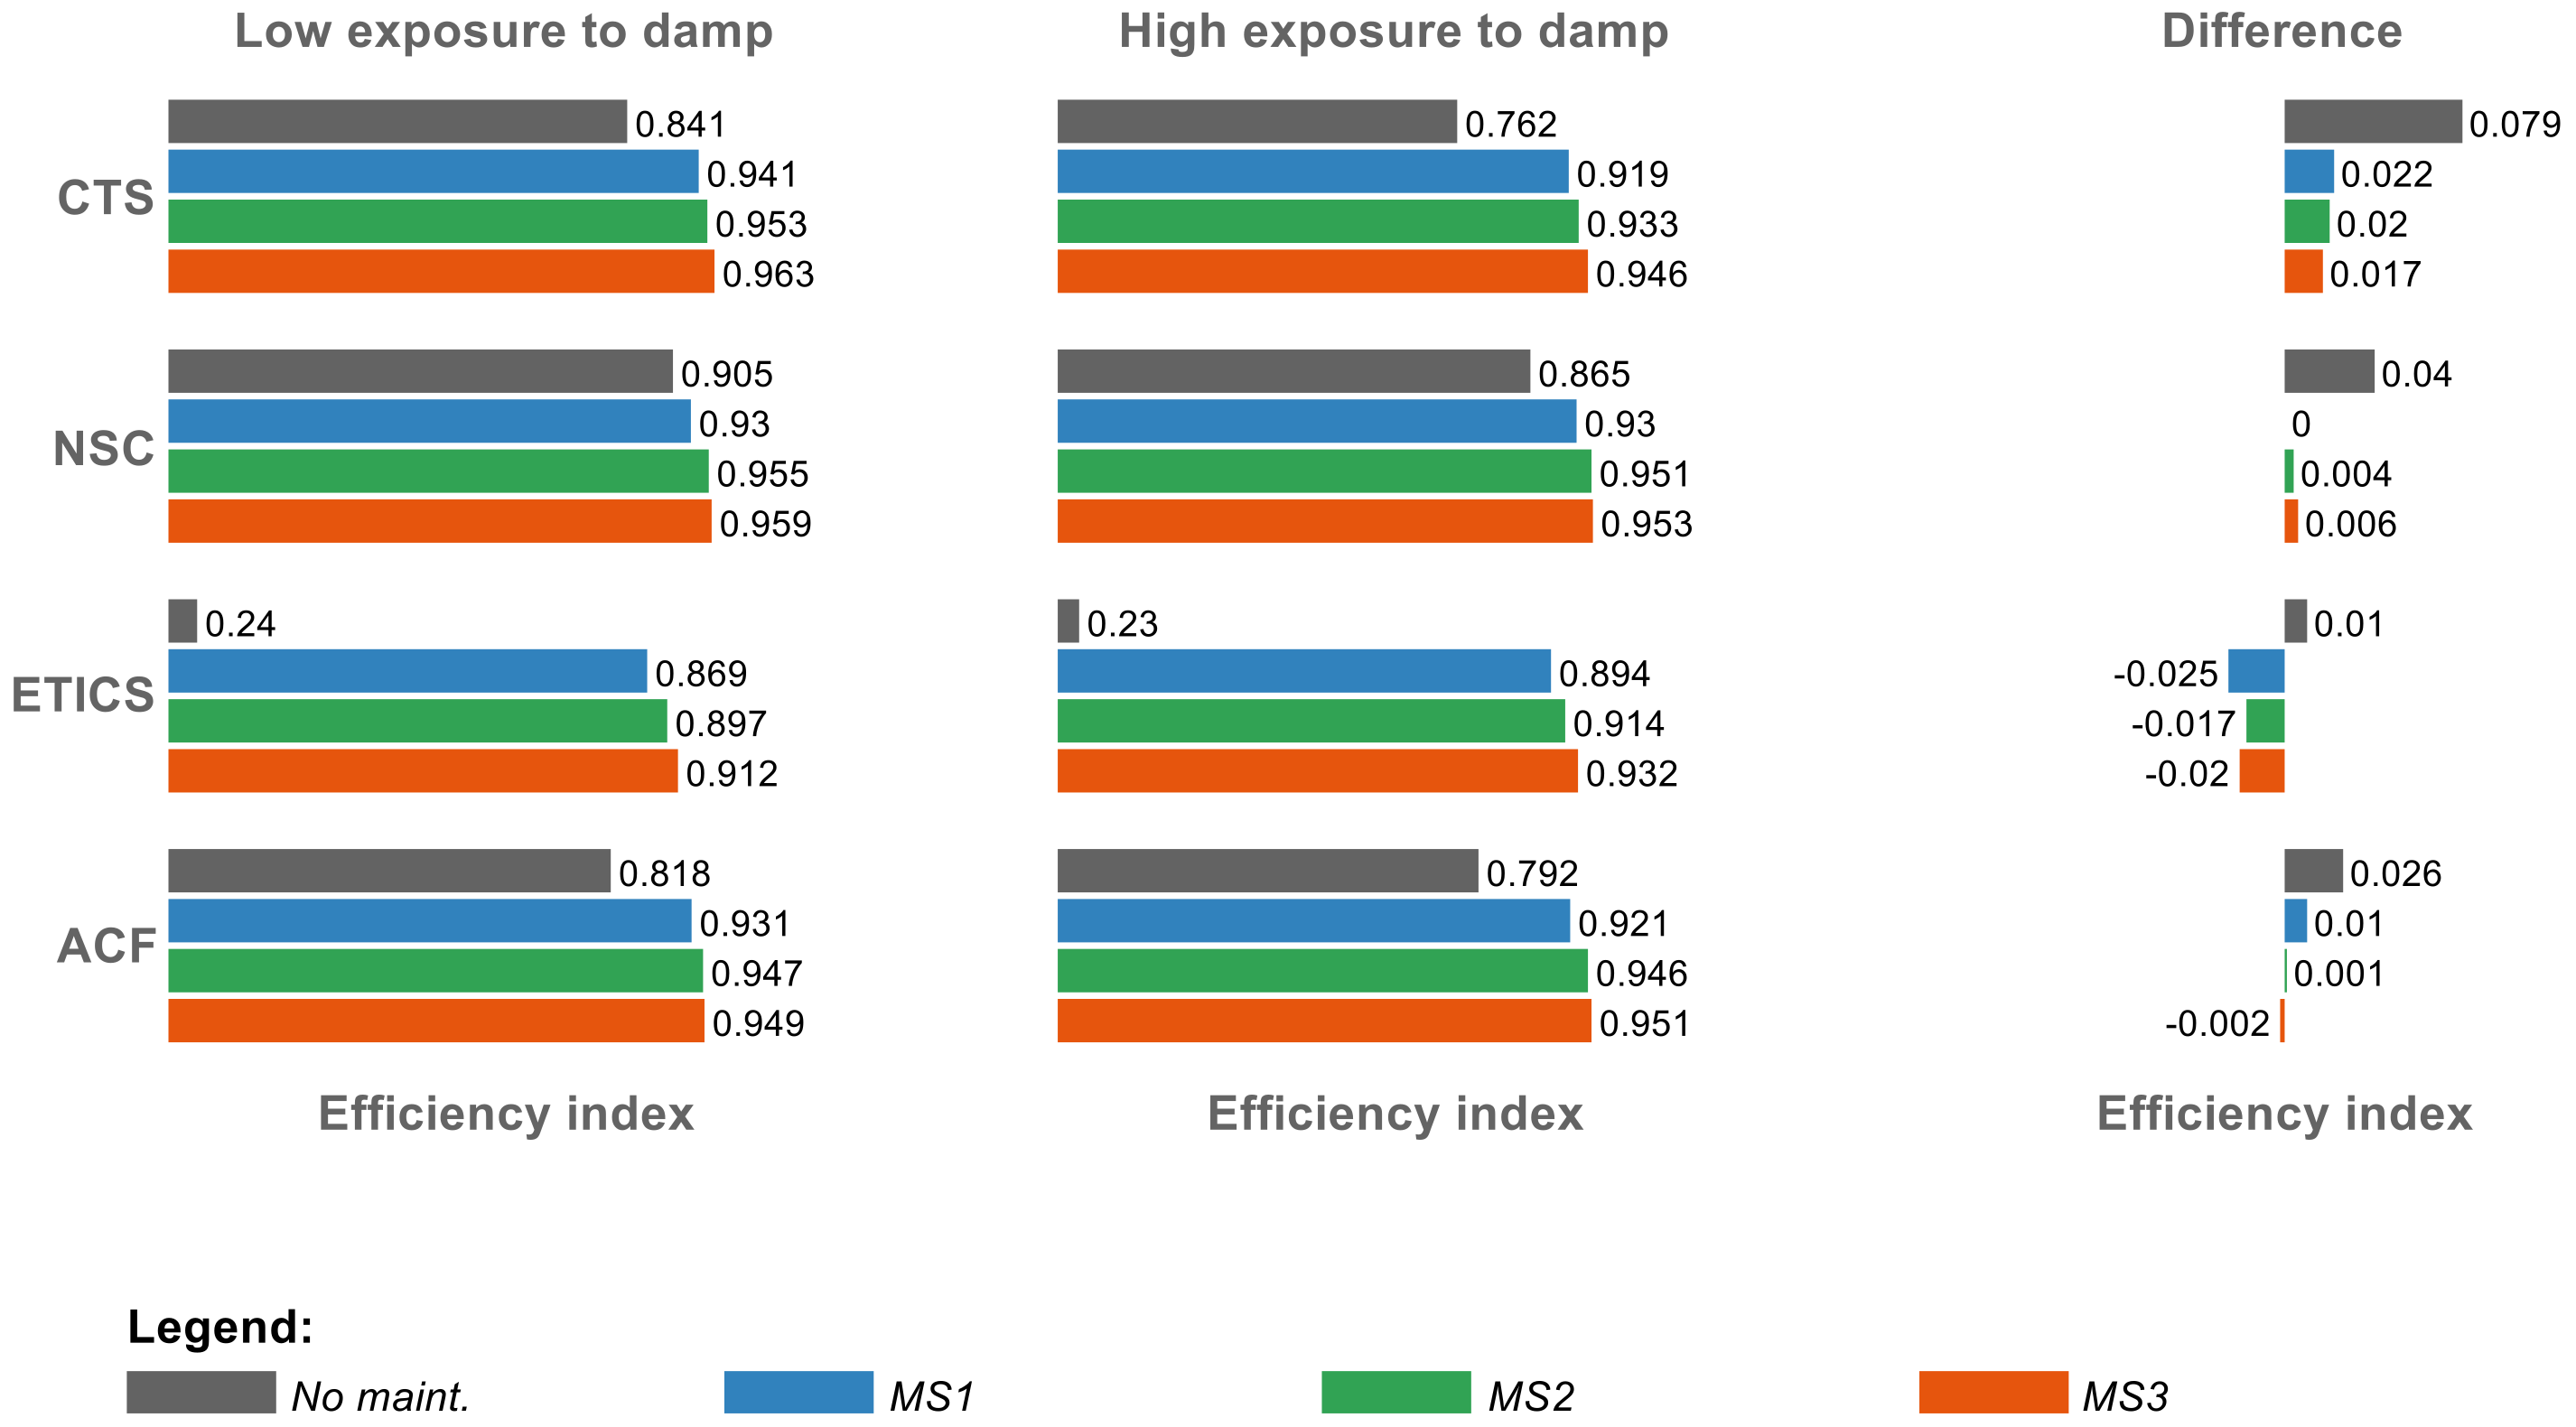
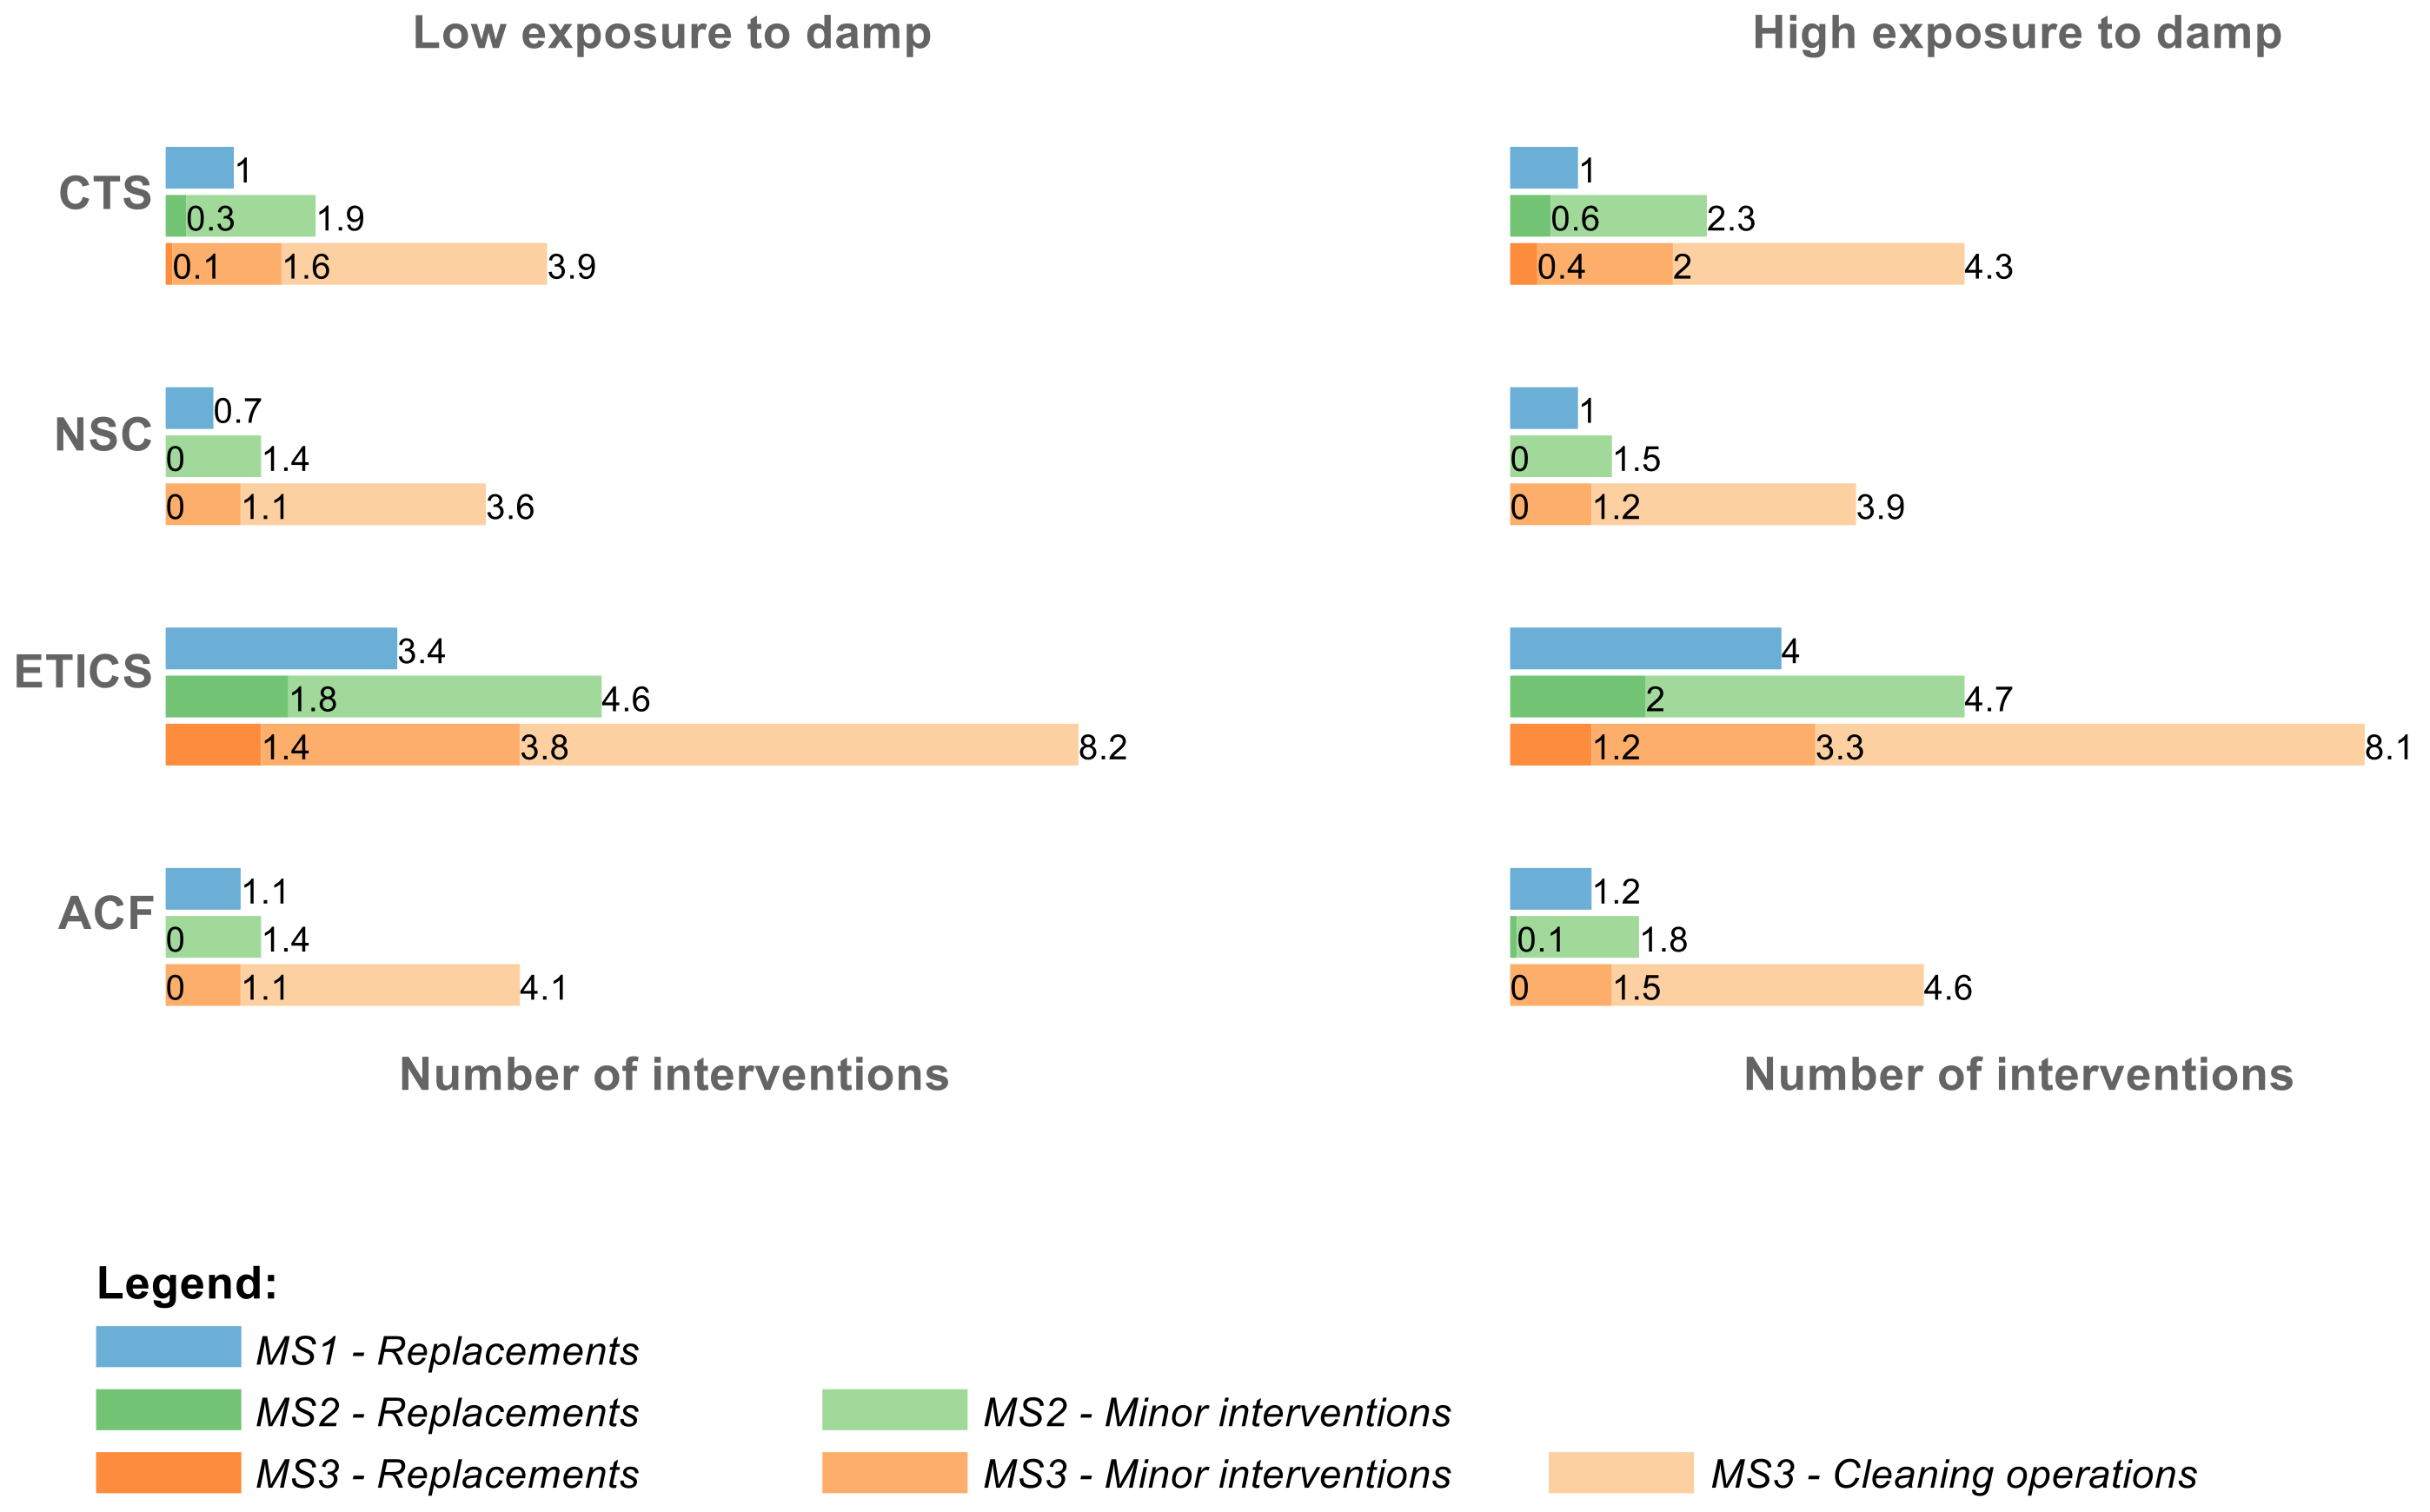
In Figure 3, Figure 4, Figure 5 and Figure 6, the four constructive solutions are compared for the two categories of the variable and for the four parameters (service life, maintenance costs, efficiency index and number of interventions), respectively. Furthermore, in Figure 3, Figure 4 and Figure 5 there is a third graphic where is plotted the difference between the low and the high exposure to damp.
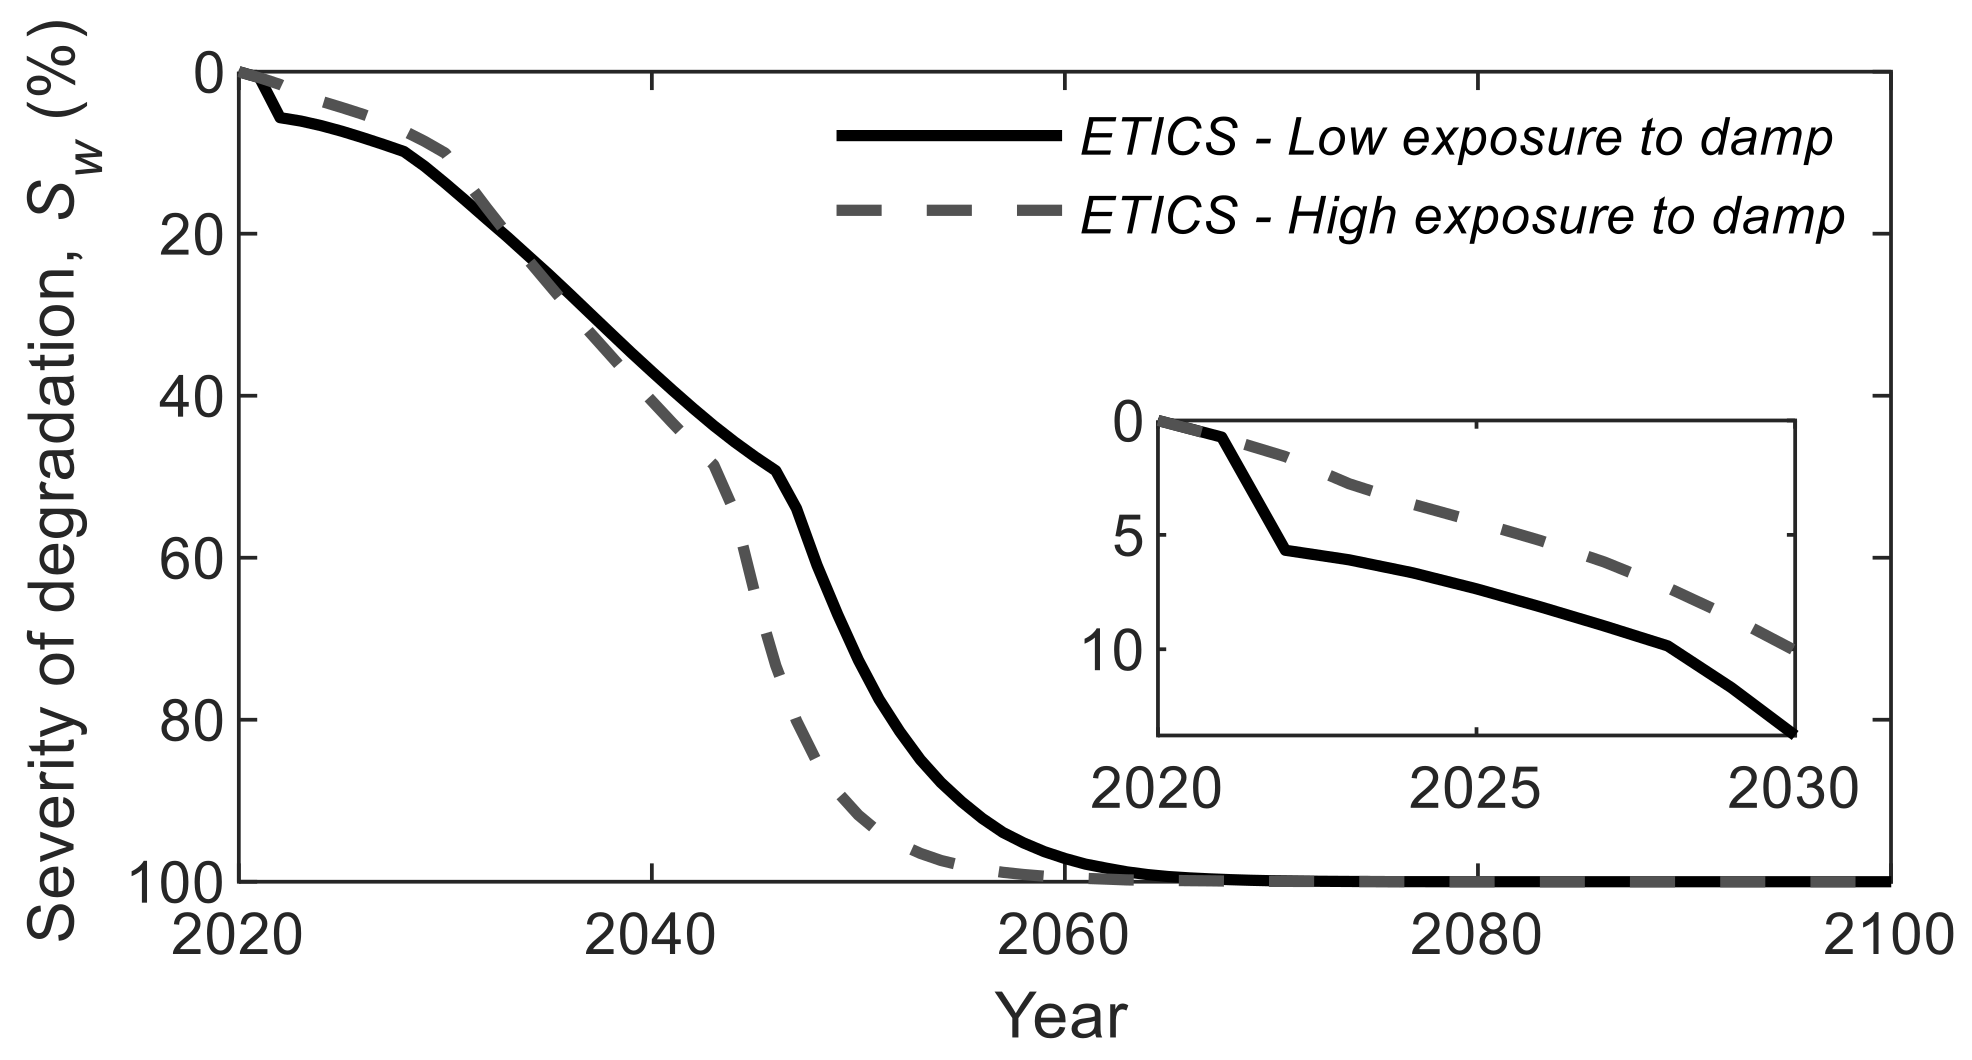
For these environmental exposure conditions, the results of CTS, NSC, and ACF are as expected. The claddings with a low exposure to damp have longer service lives (Figure 3) which implies less costs with their maintenance over the time horizon (Figure 4), smaller number of interventions (Figure 6) and better efficiency indexes (Figure 5). In other words, the sojourn time in the best degradation conditions, during the time horizon, is greater. However, the behavior of the results regarding ETICS is different. These results are related to the fact that the degradation curve for low exposure to damp has a high slope for the best degradation conditions (Figure 7).
This means that the time in condition A is 70% lower at low exposure to damp than at high exposure. The main reason for this lies on the characteristics of the sample, since none of the case studies analyzed under low exposure to damp are in degradation condition A (because the case studies under low exposure to damp are older than those under high exposure), which, in some way, biases the expectations regarding what would be expected in relation to the relationship between the degradation condition and the exposure to damp of the ETICS.
Moreover, the higher slope observed in the degradation curve for ETICS at low exposure to damp can also be explained by the seasonal water changes phase, associated with summer, which vary over the course of a single year [68]. Since the exposure to damp is lower, with the contribution of warm temperatures, there is a greater likelihood of the existing moisture, inside the cladding, becoming vapor. This vapor is trapped by the water vapor resistance of the materials, and Daniotti et al. [69] observed that, although UV radiation and winter cycles do not cause changes in ETICS, after the summer cycle, the occurrence of blisters can be observed in ETICS. For MS1, this fact is not very visible in the service life because the sojourn time in conditions B (Sw between 1% and 10%) and C (Sw between 10% and 30%) for low exposure to damp is higher than for high exposure, compensating the lower sojourn time in condition A at the end of the service life. However, when cleaning operations and minor interventions are considered, the initial behavior of the degradation curves starts to have a greater impact on the end of the service life, considering the improvement in terms of sojourn times in conditions A, B and C. Concerning the impact of the maintenance strategies, similar observations to those of Section 3.1 can be made for these environmental exposure condition.

3.3. Distance from the Sea

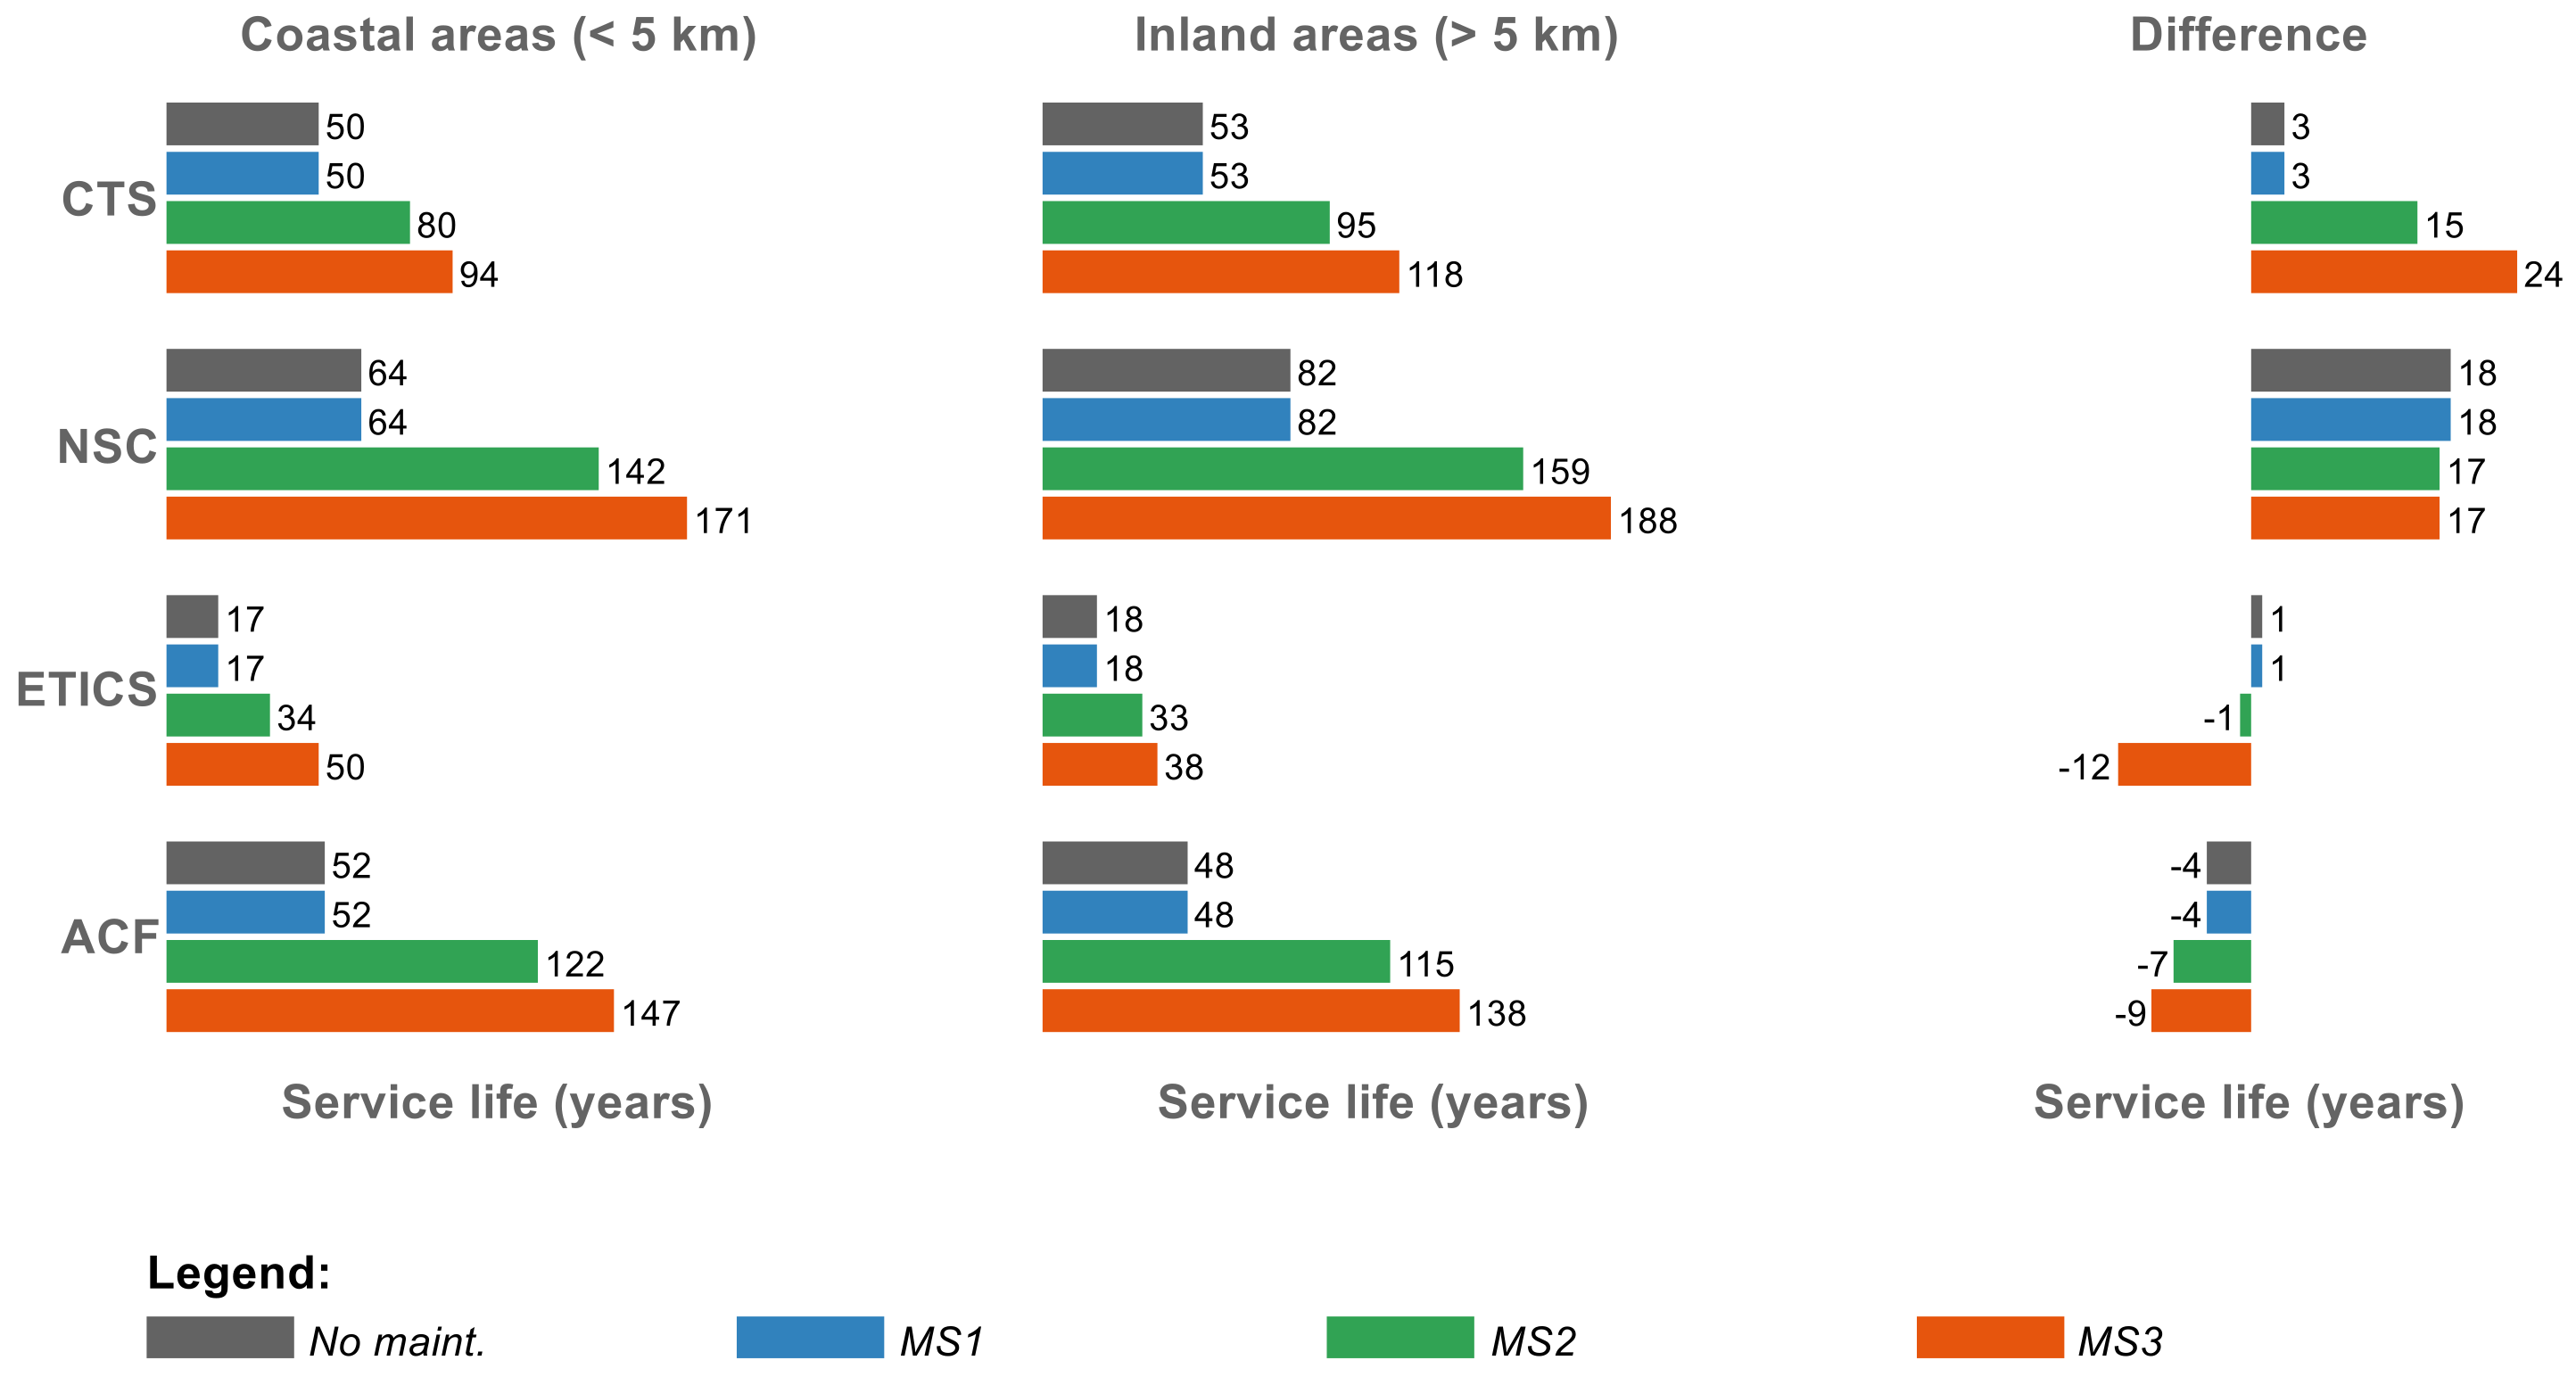
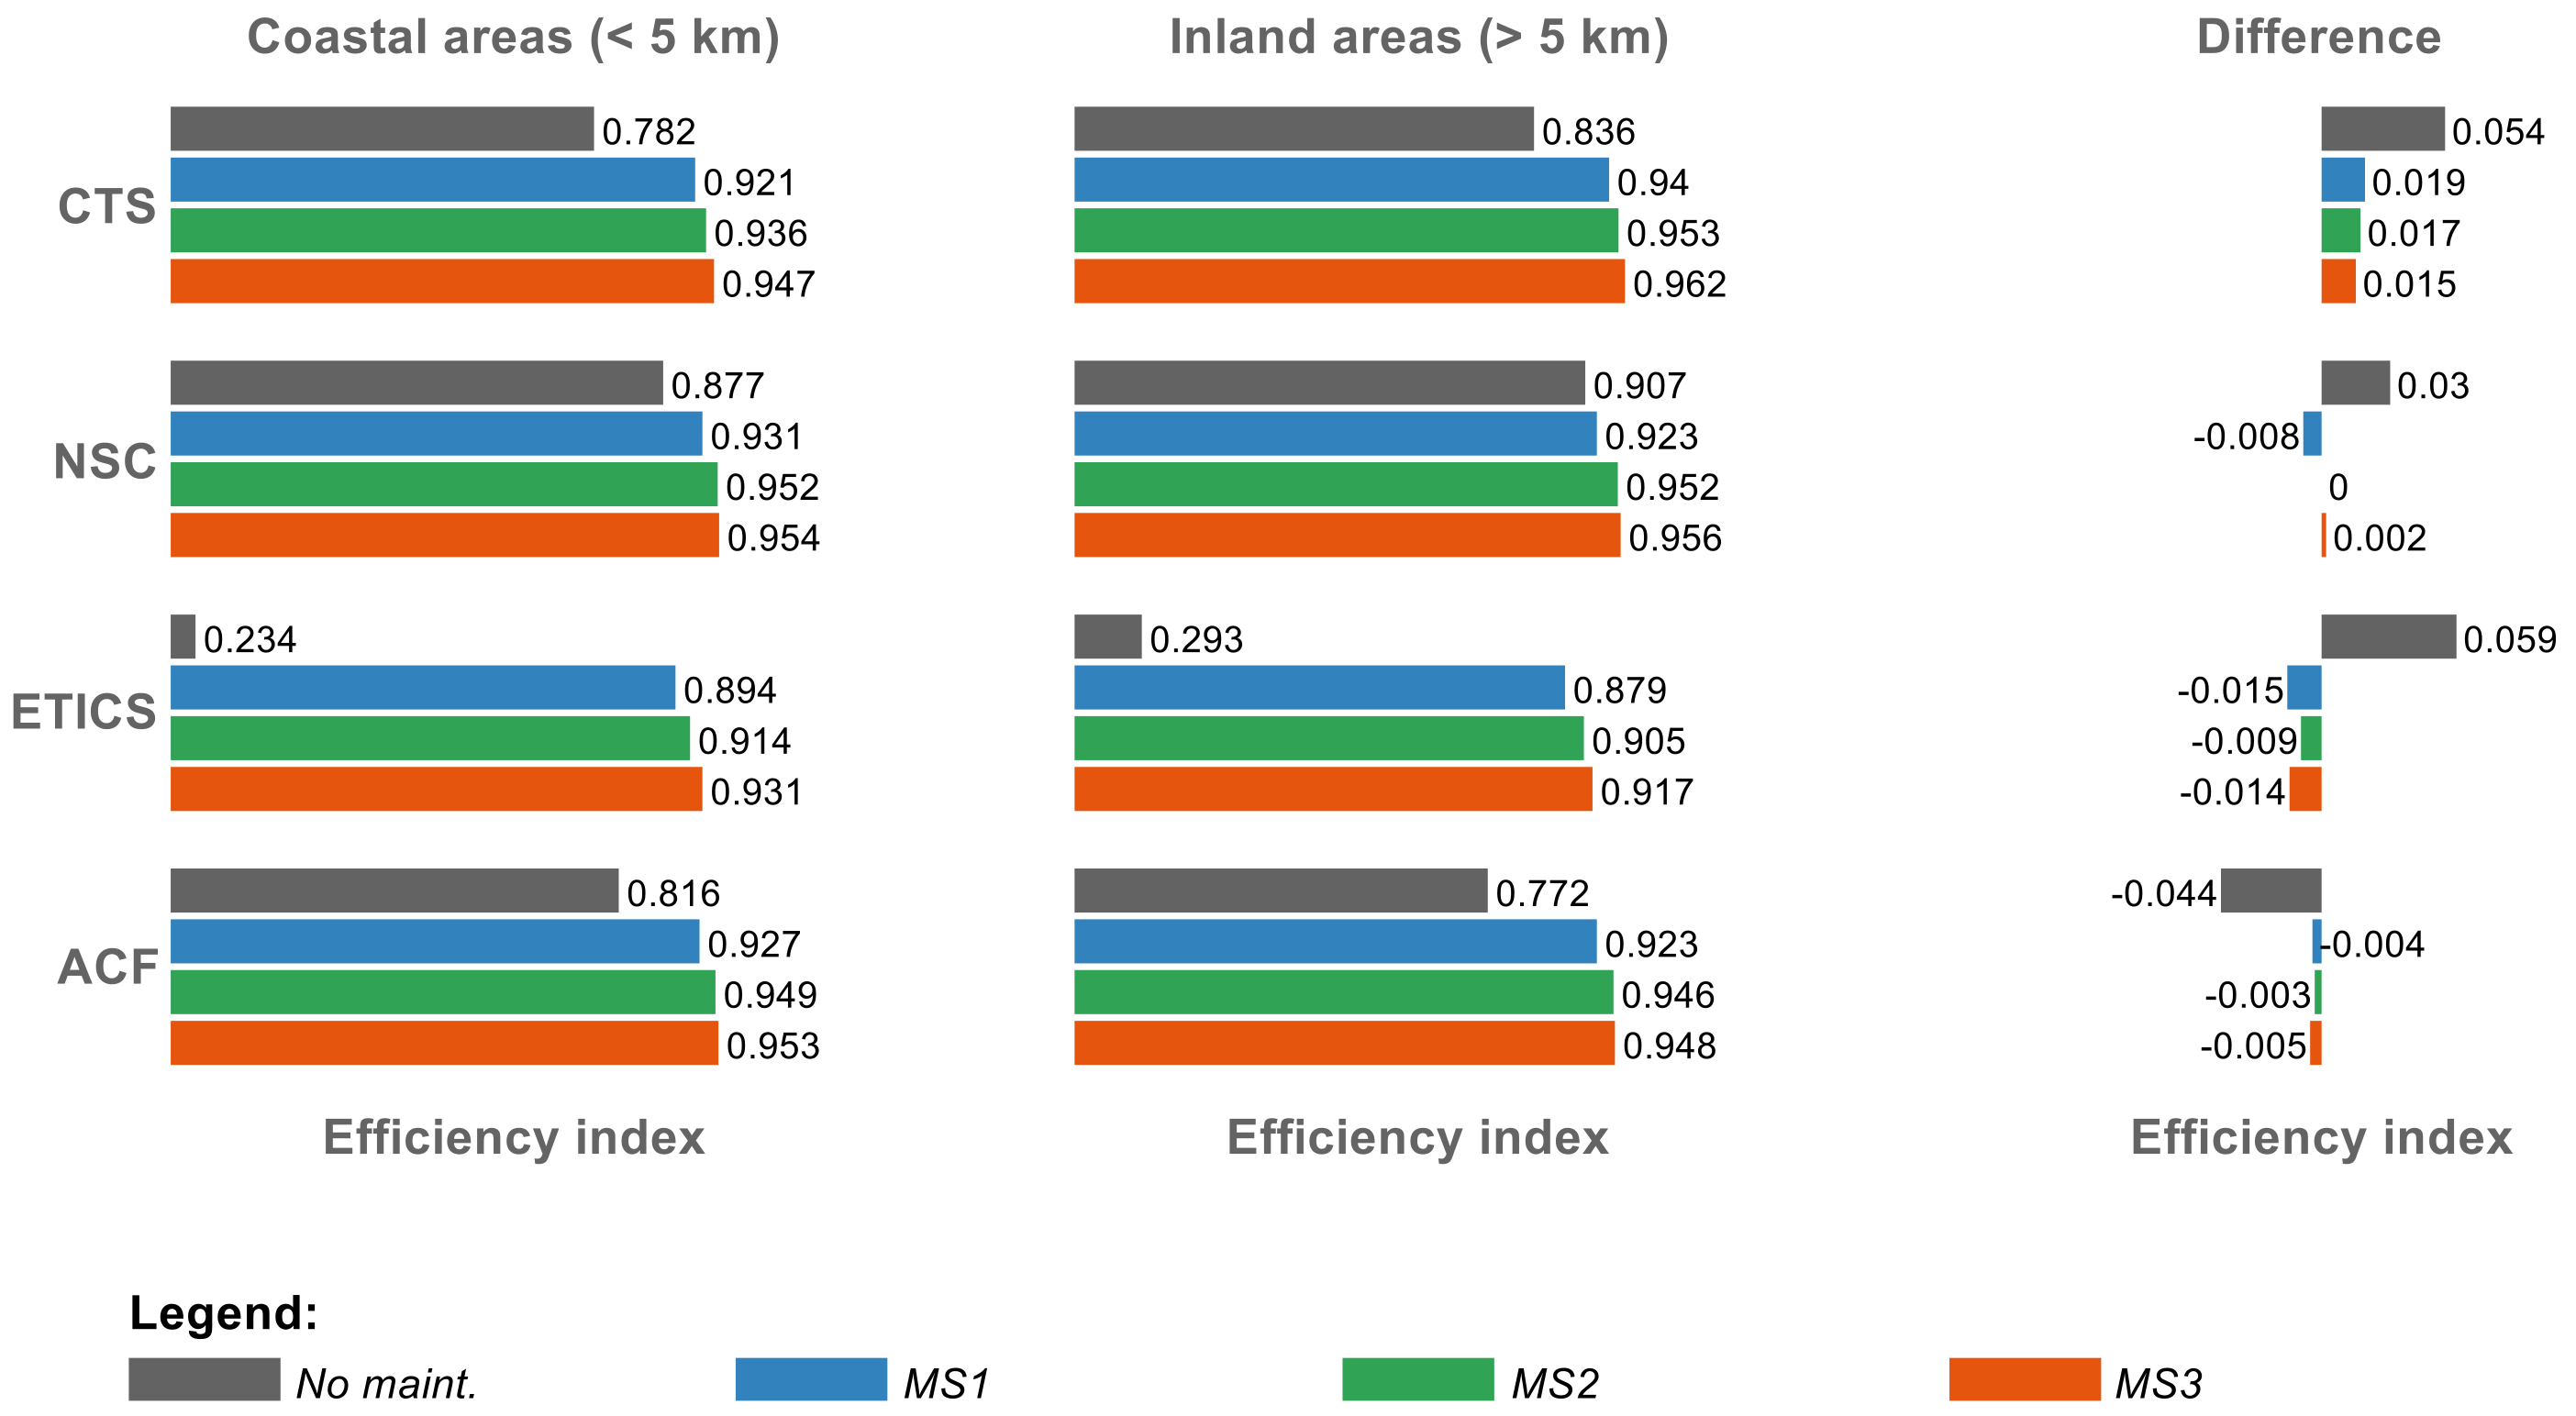
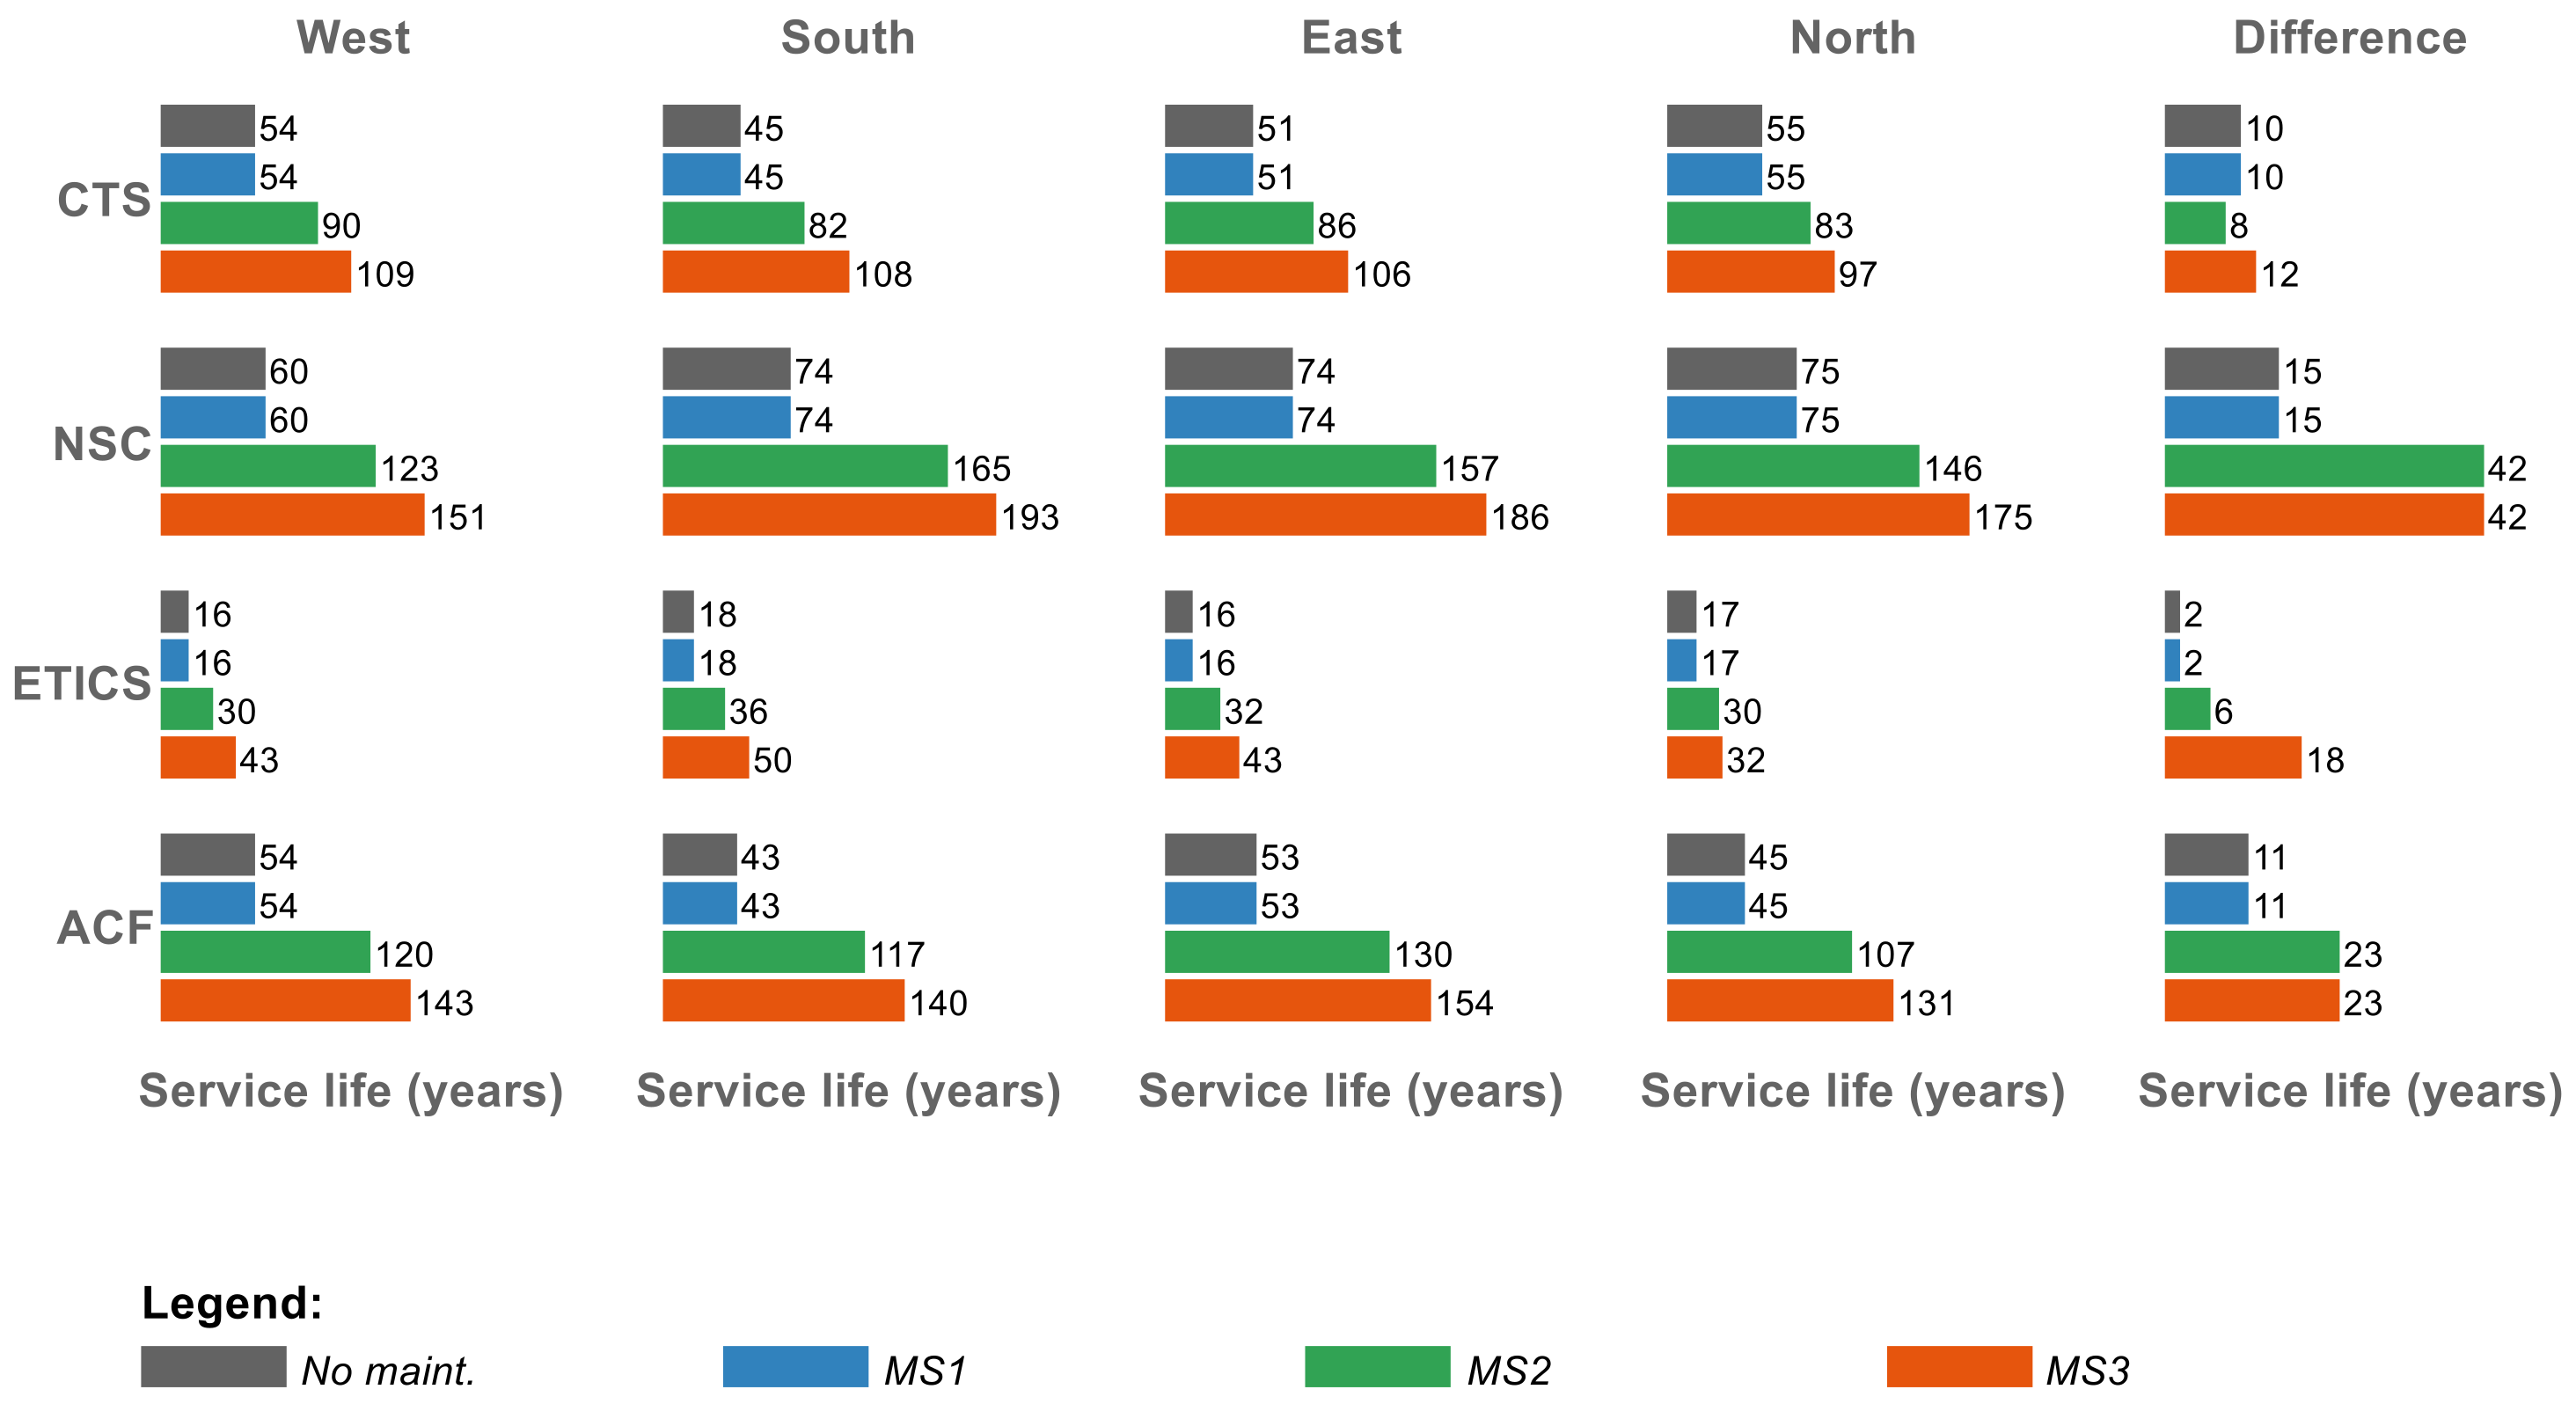
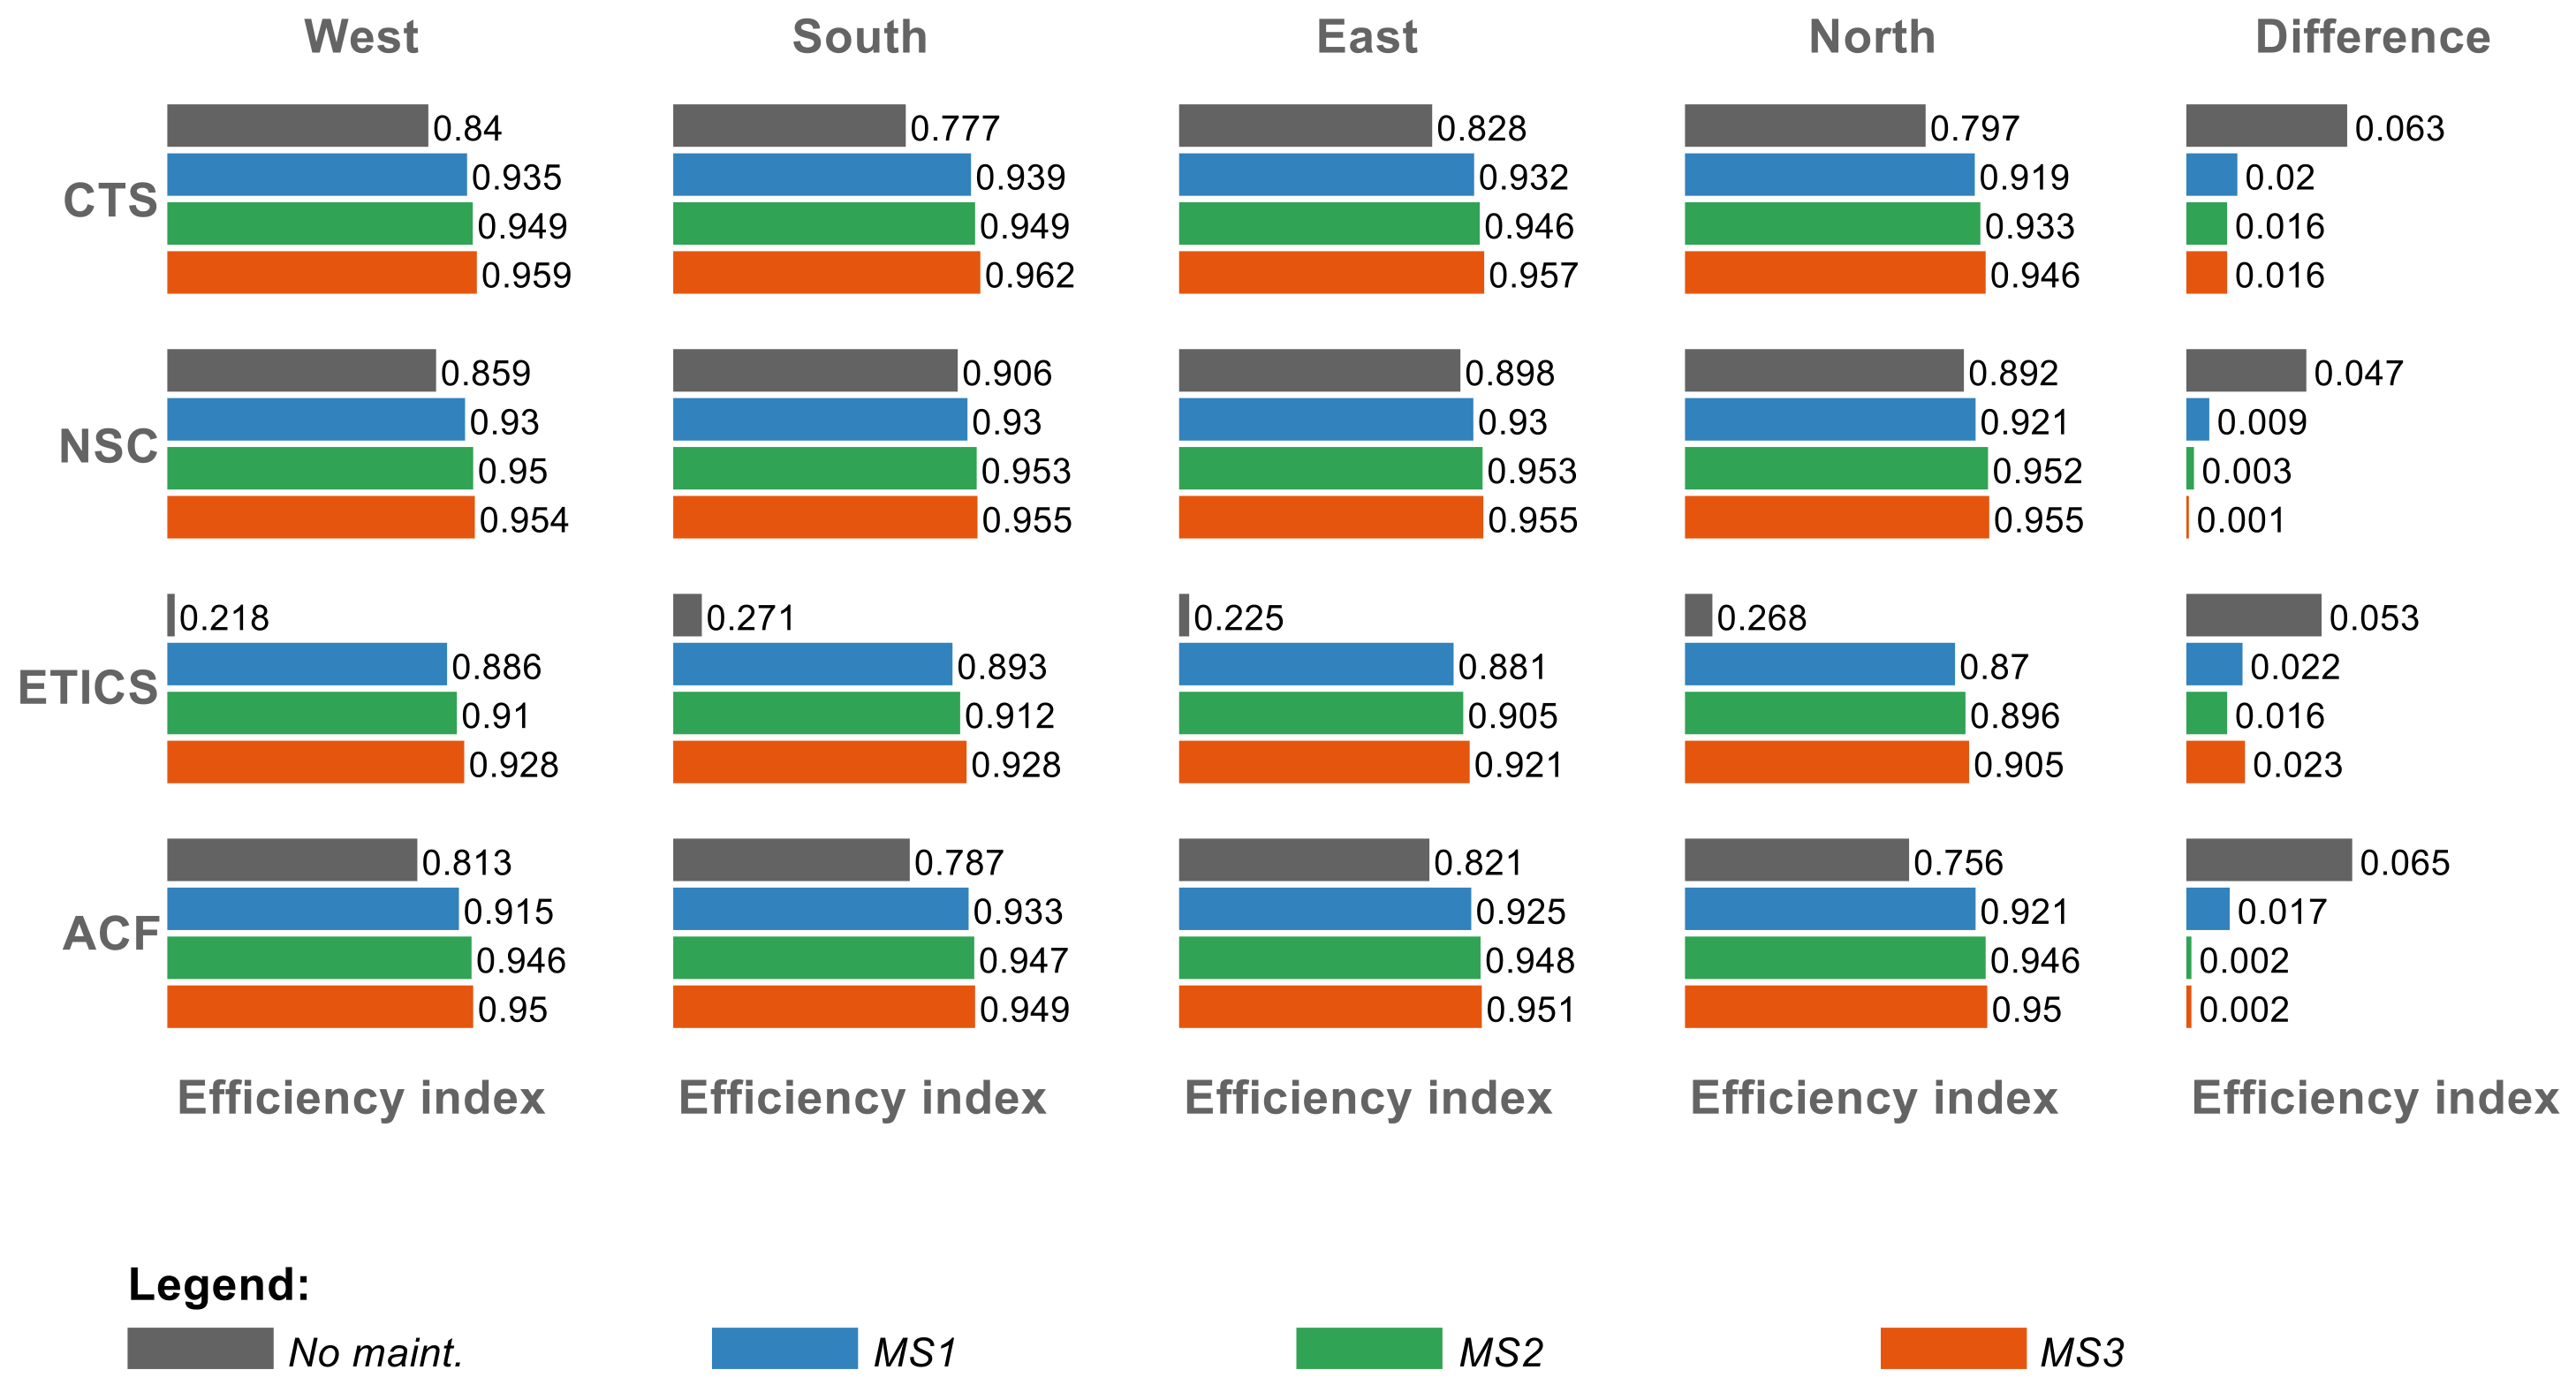
Figure 8, Figure 9, Figure 10 and Figure 11 present the comparison of the four parameters considered for the four constructive solutions analyzed. In addition, in Figure 8, Figure 9 and Figure 10, the differences between the inland and coastal areas are presented in the third graph.
For CTS and NSC, the results reveal, as expected, that claddings in inland areas present longer service lives (Figure 8), lower maintenance costs over the time horizon (Figure 9), better efficiency indexes (Figure 10) and smaller number of interventions (Figure 11). However, for ETICS and ACF, the conclusions are different. The analysis of the ACF results must be carried out carefully. While, for the other three constructive solutions, it is possible to find more resistant claddings on the coastal or inland areas with similar probabilities, for concrete structures there are standards with design rules and recommendations.
In concrete structures, most anomalies are related to the corrosion of reinforcement induced by chloride [70,71]. Since, in coastal areas, the content of chloride is higher, there is a greater risk that concrete structures will be affected by chlorides and, consequently, degrade more rapidly. Based on this knowledge, the Eurocode 2 standard [72], for the safety, serviceability, and durability principles to be complied with, stipule that the strength class and cover thickness of concrete structures in coastal areas are higher than in inland areas. The results reveal that, although coastal areas are more aggressive, the solutions implemented are also more robust and effective, translating into longer services lives for the ACF. For example, in the sample of ACF used in this study, the incidence of anomalies related to the corrosion of reinforcement, such as corrosion stains, wear/erosion, and spalling, is higher in inland areas than in coastal areas. Moreover, a higher percentage of construction anomalies is observed in inland areas. Specifically, it appears that there is a greater concern with technical execution in coastal areas.
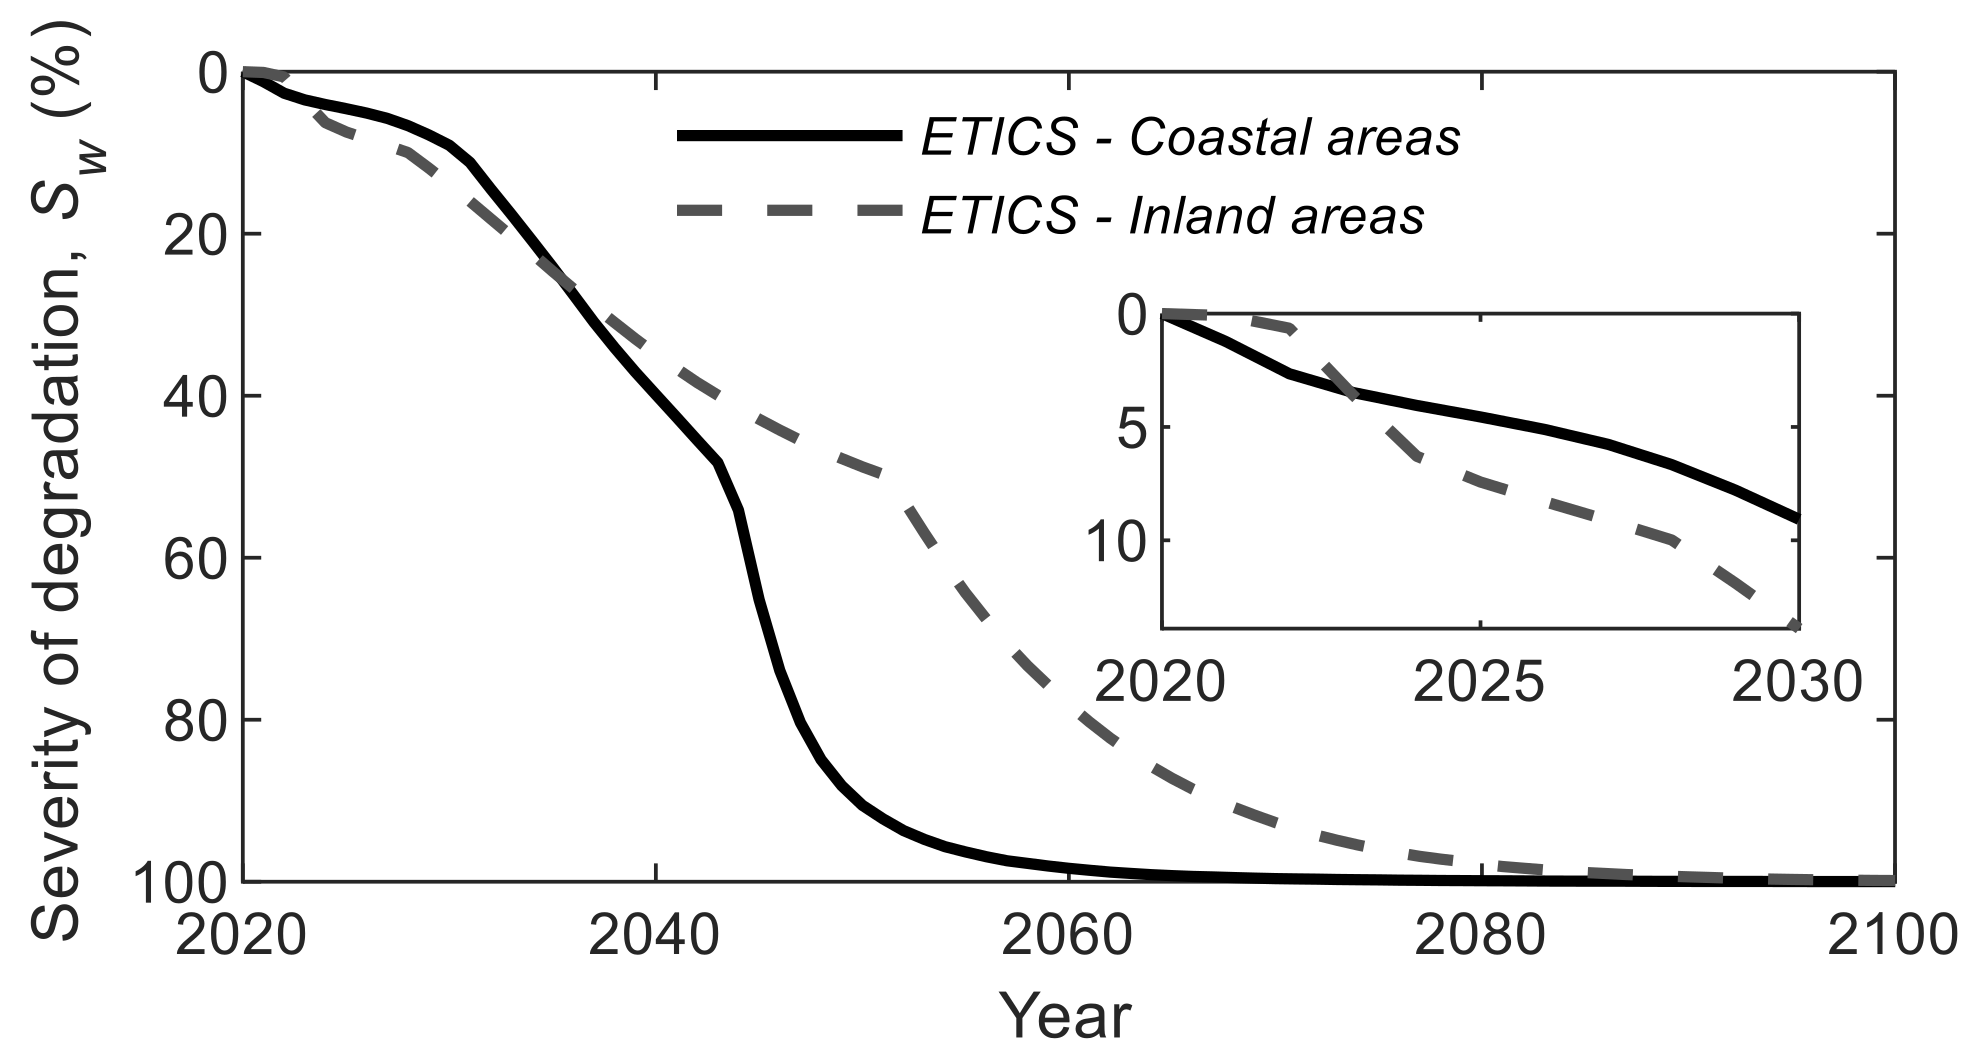
For ETICS, the same behavior that was explained in Section 3.2 is observed, i.e., as maintenance strategies become more complete, claddings in coastal areas present better results. In Figure 12, the ETICS degradation curves for these two categories are compared. By comparing with coastal areas, the sharp slope of the degradation curve for condition B (Sw between 1% and 10%) in inland areas reduces the sojourn time in condition B by 13%, approximately. However, over the years, ETICS in inland areas degrade more slowly. As maintenance plans become more complete, this behavior of the degradation curves becomes more pronounced in the parameters. Regarding the impact of the maintenance strategies, similar observations to those of Section 3.1 can be made for these environmental exposure conditions.

3.4. Orientation

The four constructive solutions are compared for the four façade directions in Figure 13, Figure 14, Figure 15 and Figure 16. In the same way as for the environmental exposure conditions, the four parameters (service life, maintenance costs, efficiency index and number of interventions) are assessed. In addition, in Figure 13, Figure 14 and Figure 15, the differences between the lowest and the highest values are presented in the fifth graph.
Among the four constructive solutions, the main observations are different, and it is concluded that solar exposure has different impacts according to the solution adopted. This is in line with the results obtained in previous studies [7,17,39,40,73,74,75]:
  • If only the situation without maintenance is analyzed, CTS facing south has the shortest service life and the remaining orientations have similar values. Thus, the direct incidence of solar radiation has a significant impact on the durability of this constructive solution. However, if the impact of cleaning operations and minor interventions is analyzed, it seems that this type of actions has a greater impact on claddings facing south and a lower impact on those facing north;
  • For NSC, the west orientation is the one with the shortest service life for all maintenance strategies and the south orientation is the one with the longest service life for all maintenance strategies. For MS1, the service life of the south, east and north orientations is similar. However, for maintenance strategies more complete, the south orientation presents higher service lives (Figure 13) for, approximately, the same maintenance costs (Figure 14), number of replacements (Figure 16) and efficiency indexes (Figure 15) when compared with other orientations;
  • For ETICS, there is a lower degradation tendency for claddings south oriented and a greater degradation for those north oriented, showing that damp has a significant impact on the durability and service life of ETICS. These observations are corroborated by other authors [76,77];
  • Finally, for ACF, facades facing south have shorter service lives (for MS1), showing that direct incidence of solar radiation has a significant impact on the degradation of facades. In other words, direct incidence of solar radiation tends to increase the surface damage and cracking due to thermal gradients [40]. However, it is also found that cleaning operations and minor interventions have a significant impact on facades with this orientation (at least, compared to facades north oriented). On the other hand, facades facing east have a longer service life.

3.5. Multi-Criteria Decision Analysis

One observation from the Section 3.2, Section 3.3 and Section 3.4 is that the selection of the more/less-advantageous solution is a difficult task, especially when considering the different parameters only from an individual point of view. The constructive solutions’ advantages and disadvantages change according to the parameters analyzed. For example, if the results are analyzed in terms of environmental exposure conditions, it is possible to understand, in general for all constructive solutions, that claddings with low exposure to damp, in inland areas and facing east and/or south are associated to longer service lives and, therefore, lead to lower maintenance costs, better efficiency indexes and smaller number of interventions. Furthermore, an increase of the maintenance complexity allows increasing the service life and the efficiency index of the maintenance strategy and decrease the number of total replacements. On the other hand, these maintenance strategies are associated with higher maintenance costs. However, one conclusion that it is not possible to be made based on an individual analysis is whether it is advantageous to apply a given type of constructive solution for a given environmental exposure condition.
The present study was conducted with the purpose of assessing the constructive solutions through a more complex analysis, to support and complement the results from the previous sections. For each environmental exposure condition, the various constructive solutions and maintenance strategies are globally ranked in terms of durability, performance, and costs. Within the MCDA, four criteria are considered (efficiency index, initial costs, maintenance costs including the inspection costs, and number of total replacements during the time horizon) and five scenarios are assessed (scenario 1: Equal weights are assigned to all criteria; scenario 2: A higher weight is assigned to the efficiency index; scenario 3: A higher weight is assigned to initial costs; scenario 4: A higher weight is assigned to maintenance costs; and scenario 5: A higher weight is assigned to the number total of replacements). The results obtained for exposure to damp, distance from the sea, and orientation are presented in Table 4, Table 5 and Table 6, respectively. In these tables, two analyses can be made. The results allow determining which the more/less-advantageous constructive solution is and how the more adequate maintenance strategy varies according to the environmental exposure condition.
Concerning the environmental exposure condition “exposure to damp” (Table 4), the results reveal that, for all scenarios, CTS is always the most advantageous constructive solution, and ETICS and NSC the less beneficial options. Particularly, NSC for the scenario where a higher emphasis is given to initial costs (scenario 3), and ETICS for the remaining scenarios. Regarding the maintenance strategies, not considering scenario 4 where higher weight is given to maintenance strategies with lower maintenance costs, the results show that, in situations of high exposure to damp, applying more complete maintenance strategies, such as MS3, is the most advantageous option. On the other hand, for situations with low exposure to damp, MS2 is the most advantageous maintenance strategy for scenarios 1, 3, and 4, and MS3 for the remaining scenarios. On the other hand, MS1 is the least advantageous maintenance strategy.
Concerning distance from the sea (Table 5), similarly to exposure to damp, ETICS and NSC represent the least advantageous options. However, as for the most beneficial solutions, there is an advantage in adopting ACF in detriment of CTS in coastal areas. This change can be observed in scenarios 2 (higher weight of the efficiency index) and 5 (higher emphasis of the number of replacements). In terms of maintenance strategies, MS2 is the one that shows the best trade-off between durability, performance, and costs. This maintenance strategy is only replaced by MS1, in coastal areas, if a higher emphasis is put on maintenance costs, and for MS3, in inland areas, if a higher importance is given to the efficiency index. Globally, MS1 and MS3 are the least advantageous maintenance strategies.
Finally, in Table 6 the results for the environmental exposure condition “orientation” are presented. Concerning the most/least advantageous constructive solutions, the results reveal that CTS is always the more advantageous solution, while ETICS and NSC (only for scenario 3) are the least advantageous solutions. Regarding the maintenance strategies, there is a tendency to adopt more detailed maintenance strategies (MS3), mainly when the claddings are facing north.

4. Discussion

As the present study reveals, environmental exposure variables have an influence on maintenance requirements and costs. The durability of façade claddings is affected by the combined action of different climate agents, at a microclimate level. Thus, predicting the service life of façades under the context of climate change, according to climate projections, is quite challenging, since the projections do not follow this level of complexity [5].
Generally, projections show an increase of average Earth’s surface temperature between 1.4 °C and 5.8 °C, from 1990 to 2100 [66]. In Portugal, the rise of the mean temperature, since the 1970s, is of 0.3 °C per decade, approximately. In addition, the five warmest years were registered post 1990s [78]. An intensification of hot extremes has been observed in Europe, from 1960 to 2010 [79]. In the Mediterranean region, the mean precipitation is expected to decrease and its variability to increase during the warm season, leading to drier summers [80]. Despite the high level of uncertainty, in Portugal, there is a tendency towards briefer periods with higher intensity of precipitation, in winter [78]. Portugal is particularly vulnerable to the impacts of climate change not only because of the decreasing precipitation, but also due to sea level rise and intensification of extreme weather events, such as heat waves, droughts and floods caused by heavy rainfall [81].
A direct association between the decrease in precipitation and damp and a lower frequency of cladding defects related to these climate agents, such as damp stains or biological colonization, is feasible. However, the increase of intensity and of wind-driven rain effects must also be considered, which might increase the probability of water infiltration on the materials’ microstructure. Another possible speculation would be the increase of cracking, resulting from the thermal behavior of materials, due to the intensification of extreme hot temperatures, e.g., the volume changes occurring in concrete structures in response to temperature, leading to strain and cracking, for which solar radiation also has a relevant contribution [82]. In this case, the orientation of the façade is likely to be an important aspect, as well as having more climate change projections data on temperature range.
Generally, weather varies throughout the day and seasonally, over the years. These variations have direct repercussions on how climate agents (e.g., solar radiation, temperature, damp, wind, and precipitation) affect the surface of the façades over time [2]. The prolonged effect of climate is reflected on the cladding’s degradation history. In the context of climate change, the environmental effects on buildings can occur due not only to gradual changes, for instance in climate parameters, but also extreme weather events, like floods [83]. Degradation can be accelerated at different rates, depending on the pace to which climate evolves, namely regarding the intensity and duration of climate parameters’ extremes and severe climate events. Without constant monitoring of the façade, it is very difficult to track the defects development rate and associate it with the action of specific climate agents, that can be, more or less, preponderant at different periods of the cladding’s service life.
The different climate induced mechanisms of degradation can be characterized by different velocities [29]. The more favorable the triggering conditions are, the faster the mechanism of degradation associated with a specific defect tends to evolve. Notwithstanding the relevance of local and microclimate to the degradation process, the cladding material itself also has a crucial role. To be able to identify the environmental agents and understand the impact they have on a particular degradation phenomenon, it is necessary to associate them with the mechanisms of degradation and the material responsiveness [15].
How the cladding reacts to climate loads, its vulnerability to environmental degradation, depends on the characteristics of the material: (i) The ones inherent to its chemical properties (e.g., stone minerals composition and arrangement) and physical and mechanical properties (e.g., capillary water absorption), and (ii) the ones resulting from design options (e.g., surface texture and color). For example, the following characteristics of a stone façade cladding are relevant durability indicators [84]: Sorptivity, open porosity and frost resistance, especially for colder and humid climates; and linear expansion coefficient, particularly for warmer climates or climates characterized by high temperature range. Vulnerabilities to environmental agents can be found in different types of stone. Carbonate rocks tend to be particularly vulnerable to precipitation [85], which is commonly acidic, due to the presence of calcite in its composition. Silicate rocks tend to be especially vulnerable to saline fog and humidity in the pores by contact with water for long periods, due to the presence of feldspar [84]. The same applies when comparing different types of materials. For example, bio-based materials are more resistant to freeze–thaw cycles, due to the flexibility of the cellular structure, than concrete or stone, which are porous rigid materials [2].
It is also important to acknowledge that part of the complexity of environmental degradation lies, not only on some climate parameters being more relevant for some cladding materials than to others, but also on the type of value characterizing the parameter (e.g., mean values versus extreme values). Generally, wind extremes are more relevant than mean velocities when designing a façade and the intensity of the combined wind-rain action may be more important than the duration of precipitation events for board cladded façades [31].
The discussion of results within the context of climate change is a task that, at this point of research, would hardly fit in the present study. The reasons are (i) the complexity of the relation between the environmental agents and the degradation of materials and components, and (ii) the limitations of climate projections, regarding regional/local and parameter detail. Further research is necessary to deepen the knowledge on how each cladding system responds to environmental loads at a microclimate level. Consequently, a closer understanding of how climate change will particularly affect the degradation and maintenance requirements of the cladding can be achieved. Exploring the impact of complex environmental variables is likely to be a rewarding path of research, as demonstrated by this study.
The results obtained in this study, in particular through the MCDA, reveal that ETICS is the less favorable constructive solution, regarding all the categories of the environmental exposure conditions variables, under all scenarios. The only exception is when the initial cost is the critical criterion (scenario 3). NSC would be the most unfavorable choice in this case, since it is a more expensive solution to implement, compared to other cladding types [86,87].
ETICS presents a lack of robustness, regarding the exposure to environmental agents, specifically wind-driven rain. The resultant presence of damp in the system has been affecting its durability, not only in Nordic countries, but also in moderate climate areas with less precipitation, such as the Mediterranean region [88]. Damp has a key role in the degradation of ETICS [77]. Atmospheric humidity tends to condensate on the external layer, due to steep temperature decrease caused by limitations of heat flux release from the interior of the building [89]. Therefore, the risk of biological colonization development on the ETICS surface is likely to be more elevated than on other façade claddings [76]. In addition, the surface of ETICS tends to overheat when exposed to solar radiation, due to the rapid temperature rise of the reduced thickness outer layer. The risk of superficial cracking increases, which is becoming more noticeable in refurbished buildings in southern Europe [90].
CTS is considered the most favorable choice of cladding, in an overall analysis, based on all the scenarios covered by the MCDA. CTS is a durable cladding with reduced implementation costs and with competitive maintenance costs, comparatively to NSC and ACF. Unlike CTS, ACF is not a prepared cladding solution, ready to implement on the construction site. In the context of the present study, ACF can be fair-faced precast reinforced concrete. Environmental exposure conditions have an important role, not only on the natural ageing and degradation of this material, but also on its lasting final quality. Despite being a theme that goes beyond the scope of this study, it is useful to stress how crucial environmental agents are for the curing process of concrete, differentiating it from other cladding materials, like CTS and NSC.
Nevertheless, environmental conditions can also influence the adhesion of tiles to the substrate, which might have consequences on the performance of the cladding system over time [91]. In ACF, the emergence of plastic cracking, one of the main early defects in precast reinforced concrete, can be influenced by climate parameters, such as temperature, damp, and wind velocity [92]. The durability problems of concrete lie on the infiltration of water from the surface into the microstructure of the material, destabilizing its chemical behavior [93], for which plastic cracking offers deep paths [92]. Nevertheless, structural codes [72] have a determinant influence on the design of ACF and likely contribute to make it a robust cladding solution.
The results show that properly implemented maintenance activities (e.g., cleaning, localized repairs, replacements, and treatments) [42] enhance the performance level of building components, which positively affects their degradation behavior over time [42]. The service life of buildings can be extended, due to maintenance planning, since it promotes the control of degradation agents’ impacts [4]. However, the decision-makers frequently disregard how relevant periodic inspections and maintenance activities are to the durability of constructions [91]. For example, frequently, the defects in the joints of a ceramic cladded façade are ignored, as well as the replacement of sealants in expansion joints. The façade performance over time and its longevity rely on the acknowledgment of the components’ maintenance requirements, namely the expected repair of expansion joints within 10 to 15 years [91].

5. Conclusions

In this study, a methodology is proposed to support the decision-makers in the process of selecting a façade cladding system and the maintenance strategy to implement. The methodology covers the performance of different façade claddings (CTS, NSC, ETICS, and ACF) over time, according to the environmental exposure conditions they are subjected to. The data are assessed per environmental condition variable (exposure to damp, distance from the sea, and orientation). The first results allow the comparison between the different cladding solutions, for each variable, considering their service life, maintenance costs and efficiency and required number of interventions, for an 80 years’ time horizon. In this study, three maintenance strategies were assessed (MS1, MS2, and MS3).
Performing a multi-criteria decision analysis (MCDA) was necessary, on a subsequent approach, so the results could be presented in a comprehensive way and become more useful to support the decision-making process. The MCDA covered five scenarios. In the first scenario considered, all the variables had the same weight. In the other four scenarios, a higher weight was given to each one of the criteria analyzed, respectively: Efficiency index, initial costs, maintenance costs including inspection costs, and number of total replacements. This methodology will enable the decision-makers to analyze all information gathered in an objective way. At the same time, since it is not a closed methodology, it will allow to add the decision-makers’ points of view and personal perceptions and requirements, through the evaluation of other criteria, scenarios and/or weights.
The presented methodology, more than supporting the decision-making process in choosing the most adequate option, allows the decision-maker to be aware of the main outcomes that may arise with the different decisions. In the end, this methodology must be seen as a guideline to select the more adequate constructive solutions without disregarding the decision-maker’s preferences. However, further research is necessary to deepen the knowledge on how each cladding system responds to environmental loads at a microclimate level.

Author Contributions

Conceptualization, C.F., J.B., A.S., J.d.B., I.S.D. and I.F.-C.; methodology, C.F. and J.B.; software, C.F.; validation, C.F. and J.B.; formal analysis, C.F. and J.B.; investigation, C.F., J.B., A.S., J.d.B., I.S.D. and I.F.-C.; writing—original draft preparation, C.F. and J.B.; writing—review and editing, A.S., J.d.B., I.S.D. and I.F.-C. All authors have read and agreed to the published version of the manuscript.

Funding

This research was funded by FCT (Portuguese Foundation for Science and Technology) through the project BestMaintenance-LowerRisks (PTDC/ECI-CON/29286/2017) and the PhD program PD/BD/150397/2019.

Institutional Review Board Statement

Not applicable.

Informed Consent Statement

Not applicable.

Data Availability Statement

The data presented in this study are available on request from the corresponding author.

Conflicts of Interest

The authors declare no conflict of interest.

Appendix A

The following tables present the classification systems of the different constructive solutions.
Table A1. Classification system for ceramic tiling systems (CTS) [37].
Degradation ConditionAnomalies ka,n% Area AffectedSeverity of Degradation (%)
A (kn = 0)No visible degradation--Sw ≤ 1
B (kn = 1)Visual or surface degradationSurface dirt0.25≤101 < Sw ≤ 6
Small surface craters/wear or scratches/crushing or scaling of the borders/change of shine and/or color/damp stains0.60≤10
CrackingCracked glazing0.25-
Markedly orientated cracking (<0.2 mm) b without leakage a1.00-
Joint deteriorationStaining or change in color0.25-
C (kn = 2)Visual or surface degradationSmall surface craters/wear or scratches/crushing or scaling of the borders/change of shine and/or color/damp stains0.60>10 and ≤506 < Sw ≤ 20
Biological growth/efflorescence1.00≤30
CrackingCracking with no predominant direction
Markedly orientated cracking (>0.2 mm) c without leakage a
1.00≤30
Joint deteriorationWithout loss of filling material1.00≤30
With loss of filling material1.50≤10
DetachmentLoss of adherence
Swelling
1.50≤20
D (kn = 3)Visual or surface degradationSmall surface craters/wear or scratches/crushing or scaling of the borders/change of shine and/or color/damp stains0.60>5020 < Sw ≤ 50
Biological growth/efflorescence1.00>30
CrackingCracking with no predominant direction
Markedly orientated cracking (>1 mm) d without leakage a
1.00>30 and ≤50
Joint deteriorationWithout loss of filling material1.00>30 and ≤50
With loss of filling material1.50>10 and ≤30
DetachmentLoss of adherence
Swelling
1.50>20
Localized detachment2.00≤10
E (kn = 4)CrackingCracking with no predominant direction
Markedly orientated cracking (>5 mm) e
1.00>50Sw > 50
Joint deteriorationWithout loss of filling material1.00>50
With loss of filling material1.50>50
DetachmentGeneralized detachment2.00>10
a with leakage—the degradation level is increased by one; b Cracking: detectable at a distance greater than 5 m only if binoculars are used; c Tenuous cracking line: easily detectable at a distance greater than 5 m using binoculars; d Well-defined cracking: visible from a distance of more than 5 m without using binoculars; e Cracking: characterized by a thick line in which a clear separation of the borders can be seen from a distance of more than 5 m with aid of binoculars.
Table A2. Classification system for natural stone claddings (NSC) [38].
Degradation ConditionAnomalies ka,n% Area AffectedSeverity of Degradation (%)
A (kn = 0)No visible degradation--Sw ≤ 1
B (kn = 1)Visual or surface degradation anomaliesSurface dirt0.13>101 < Sw ≤ 8
Moisture stains/localized stains/color change0.13≤15
Flatness deficiencies0.13≤10
Loss-of-integrity anomaliesMaterial degradation * ≤1% plate thickness1.00-
Material degradation * ≤10% plate thickness1.00≤20
C (kn = 2)Visual or surface degradation anomaliesMoisture stains/localized stains/color change0.13>158 < Sw ≤ 20
Moss, lichen, algae growth/parasitic vegetation/efflorescence0.13≤30
Flatness deficiencies0.13>10 and ≤50
Joint anomaliesJoint material degradation0.25≤30
Material loss—open joint1.00≤10
Bond-to-substrate anomaliesScaling of stone near the edges
Partial loss of stone material
1.20≤20
Loss-of-integrity anomaliesMaterial degradation * ≤10% plate thickness
Cracking width ≤1 mm
1.00>20
Material degradation * >10% and ≤30% plate thickness
Cracking width >1 mm and ≤5 mm
1.00≤20
Fracture1.00≤5
D (kn = 3)Visual or surface degradation anomaliesMoss, lichen, algae growth/parasitic vegetation/efflorescence0.13>3020 < Sw ≤ 45
Flatness deficiencies0.13>50
Joint anomaliesJoint material degradation0.25>30
Material loss—open joint1.00>10
Bond-to-substrate anomaliesScaling of stone near the edges
Partial loss of stone material
1.20>20
Loss of adherence1.20≤10
Loss-of-integrity anomaliesMaterial degradation * >10% and ≤30% plate thickness
Cracking width >1 mm and ≤5 mm
1.00>20
Material degradation * >30% plate thickness
Cracking width >5 mm
1.00≤20
Fracture1.00>5 and ≤10
E (kn = 4)Bond-to-substrate anomaliesLoss of adherence1.20>10Sw > 45
Loss-of-integrity anomaliesMaterial degradation * >30% plate thickness
Cracking width >5 mm
1.00>20
Fracture1.00>10
* Material degradation is meant to be every anomaly that involves loss of volume of the stone material.
Table A3. Classification system for external thermal insulation composite systems (ETICS) [39].
Degradation ConditionAnomalies ka,n% Area AffectedSeverity of Degradation (%)
A (kn = 0)No visible degradation--Sw ≤ 1
B (kn = 1)Continuity/integrityCracks width ≤0.2 mm—little or very little quantity1.00-1 < Sw ≤ 10
Deterioration of the reinforcement corner profiles caps (cracks)1.00-
Stains/color changes or textureSurface dirt; drainage marks; oxidation stains; fungi/moisture stains—sight or few perceptible changes1.00-
JointVisible joints between panels due to dirt- or/and fungal-related color change—slight or few perceptible changes1.00-
C (kn = 2)Continuity/integrityCracks width ≤0.2 mm—moderate quantity1.00-10 < Sw ≤ 30
Cracks width >0.2 mm—little or very little quantity1.00-
Deterioration of the reinforcement corner profiles caps (cracks)1.00-
Stains/color changes or textureDrainage marks; oxidation stains; fungi/moisture stains—moderate or quite perceptible1.00-
Efflorescence; lichen and algae; parasitic vegetation—sight or few perceptible changes1.00-
Loss of adherenceBlistering largest size <15 cm—small quantity1.00-
JointJoint cracking ≤0.2 mm1.00-
Visible joints between panels due to fungal-related color change—moderate or quite perceptible1.00-
D (kn = 3)Continuity/integrityCracks width ≤0.2 mm—very high quantity1.00-30 < Sw ≤ 50
Cracks width >0.2 mm—moderate quantity1.00-
Stains/color changes or textureDrainage marks; fungi/moisture stains—high or strongly marked changes1.00-
Efflorescence; lichen and algae; parasitic vegetation—moderate or quite perceptible1.00-
Loss of adherenceBlistering largest size <15 cm—moderate quantity1.00-
Blistering largest size >15 cm—small quantity1.00-
Peeling largest size <15 cm—small quantity1.00-
JointJoint cracking >0.2 mm and ≤1 mm1.00-
Visible joints between panels due to fungal-related color change—high or strongly marked changes1.00-
E (kn = 4)Continuity/integrityCracks width >0.2 mm—very high quantity1.00-Sw > 50
Stains/color changes or textureDrainage marks; fungi/moisture stains—very high or quite strongly marked changes1.00-
Efflorescence; lichen and algae; parasitic vegetation—high or strongly marked changes1.00-
Loss of adherenceBlistering largest size >15 cm—moderate quantity1.00-
Blistering (any dimension)—dense pattern1.00-
Peeling largest size >15 cm—small quantity1.00-
Peeling (any dimension)—dense pattern1.00-
JointJoint cracking > 1 mm1.00-
Table A4. Classification system for architectural concrete façades (ACF) [40].
Degradation ConditionAnomalies ka,n% Area AffectedSeverity of Degradation (%)
A (kn = 0)No visible degradation--Sw ≤ 1
B (kn = 1)Aesthetical anomaliesDirt stains/moisture stains0.15<151 < Sw ≤ 10
Corrosion stains0.50<15
Bug holes0.10<10
Efflorescence0.20<10
Biological growth0.60<10
Wear/erosion2.00<10
Constructive anomaliesFlatness defects0.10<20
Dribbling0.10≤10
C (kn = 2)Aesthetical anomaliesDirt stains/moisture stains0.15>15 and ≤4010 < Sw ≤ 20
Corrosion stains0.50>15 and ≤40
Bug holes0.10>10 and ≤30
Efflorescence0.20>10 and ≤30
Biological growth0.60>10 and ≤30
Wear/erosion2.00>10 and ≤30
Mechanical anomaliesDisaggregation5.00<10
Spalling4.00<10
Oriented cracking (≤0.5 mm)1.00<20
Constructive anomaliesFlatness defects0.10>20 and ≤50
Dribbling0.10>10
Fastening marks0.10≤5
Honeycombing0.30<10
Crusts/formwork incrustation0.10<10
D (kn = 3)Aesthetical anomaliesDirt stains/moisture stains0.15>4020 < Sw ≤ 50
Corrosion stains0.50>40
Bug holes0.10>30
Efflorescence0.20>30
Biological growth0.60>30
Wear/erosion2.00>30
Mechanical anomaliesDisaggregation5.00>10 and ≤30
Spalling4.00>10 and ≤30
Mapped cracking0.15<50
Oriented cracking (>0.5 mm and <3 mm)1.00≥5
Oriented cracking (≥3 mm)1.00<5
Constructive anomaliesFlatness defects0.10>50
Fastening marks0.10>5
Honeycombing0.30≥10
Crusts/formwork incrustation0.10≥10
E (kn = 4)Mechanical anomaliesDisaggregation5.00>30Sw > 50
Spalling4.00>30
Mapped cracking0.15≥50
Oriented cracking (≥3 mm)1.00≥5

References

  1. Madureira, S.; Flores-Colen, I.; de Brito, J.; Pereira, C. Maintenance planning of facades in current buildings. Constr. Build. Mater. 2017, 147, 790–802. [Google Scholar] [CrossRef]
  2. Sandak, A.; Sandak, J.; Brzezicki, M.; Riggio, M. Bio-Based Building Skin; Springer International Publishing: Singapore, 2019. [Google Scholar]
  3. Lacasse, M.A. Specifying Resistance to Deterioration for Building Elements of Environmental Separation in the NBC; Technical Report CRBCPI-Y2-R2; National Research Council Canada: Ottawa, ON, Canada, 2018.
  4. de Brito, J.; Pereira, C.; Silvestre, J.D.; Flores-Colen, I. Expert Knowledge-Based Inspection Systems—Inspection, Diagnosis and Repair of the Building Envelope; Springer International Publishing: Zurich, Switzerland, 2020. [Google Scholar]
  5. Phillipson, M.C.; Emmanuel, R.; Baker, P.H. The durability of building materials under a changing climate. Wiley Interdiscip. Rev. Clim. Chang. 2016, 7, 590–599. [Google Scholar] [CrossRef] [Green Version]
  6. Martinez, A.; Patterson, M.; Carlson, A.; Noble, D. Fundamentals in façade retrofit practice. Procedia Eng. 2015, 118, 934–941. [Google Scholar] [CrossRef] [Green Version]
  7. Silva, A.; de Brito, J.; Gaspar, P.L. Methodologies for Service Life Prediction of Buildings: With a Focus on Façade Claddings; Springer International Publishing: Zurich, Switzerland, 2016. [Google Scholar]
  8. Freitas, S.S.; de Freitas, V.P. Cracks on ETICS along thermal insulation joints: Case study and a pathology catalogue. Struct. Surv. 2016, 34, 57–72. [Google Scholar] [CrossRef]
  9. Silvestre, J.D.; de Brito, J. Ceramic tiling in building façades: Inspection and pathological characterization using an expert system. Constr. Build. Mater. 2011, 25, 1560–1571. [Google Scholar] [CrossRef]
  10. Neto, N.; de Brito, J. Validation of an inspection and diagnosis system for anomalies in natural stone cladding (NSC). Constr. Build. Mater. 2012, 30, 224–236. [Google Scholar] [CrossRef]
  11. Amaro, B.; Saraiva, D.; de Brito, J.; Flores-Colen, I. Statistical survey of the pathology, diagnosis and rehabilitation of ETICS in walls. J. Civ. Eng. Manag. 2014, 20, 511–526. [Google Scholar] [CrossRef] [Green Version]
  12. da Silva, C.; Coelho, F.; de Brito, J.; Silvestre, J.; Pereira, C. Statistical survey on inspection, diagnosis, and repair of architectural concrete surfaces. J. Perform. Constr. Facil. 2017, 31. [Google Scholar] [CrossRef]
  13. Silva, C.M.; Flores-Colen, I.; Coelho, A. Green roofs in Mediterranean areas—Survey and maintenance planning. Build. Environ. 2015, 94, 131–143. [Google Scholar] [CrossRef]
  14. Westberg, K.; Norén, J.; Kus, H. On using available environmental data in service life estimations. Build. Res. Inf. 2001, 29, 428–439. [Google Scholar] [CrossRef]
  15. Haagenrud, S.E.; Krigsvoll, G.; Lisø, K.R.; Thiis, T.; Sjöström, C. Environmental characterisation and mapping with respect to durability. In Proceedings of the 10th DBMC International Conference on Durability of Building Materials and Components, Lyon, France, 17–20 April 2005. [Google Scholar]
  16. Gaspar, P.L. Vida Útil das Construções: Desenvolvimento de uma Metodologia Para a Estimativa da Durabilidade de Elementos da Construção. Aplicação a Rebocos de Edifícios Correntes. Ph.D. Thesis, Universidade Técnica de Lisboa, Lisbon, Portugal, 2009. [Google Scholar]
  17. Ferreira, C.; Neves, L.C.; Silva, A.; de Brito, J. Stochastic Petri-net models to predict the degradation of ceramic claddings. Build. Res. Inf. 2019, 47, 697–715. [Google Scholar] [CrossRef]
  18. Crocker, C.R. Influence of Orientation on Exterior Cladding; Technical Report CBD 126; National Research Council Canada: Ottawa, ON, Canada, 1970.
  19. Kanniyapan, G.; Nesan, L.J.; Mohammad, I.S.; Keat, T.S.; Ponniah, V. Selection criteria of building material for optimising maintainability. Constr. Build. Mater. 2019, 221, 651–660. [Google Scholar] [CrossRef]
  20. Beasley, K.J. Building facade failure risk assessment. J. Perform. Constr. Facil. 2014, 28. [Google Scholar] [CrossRef]
  21. Al-Khaiat, H.; Fattuhi, N.I. Evaluating building materials used in Kuwait. Constr. Build. Mater. 1990, 4, 32–36. [Google Scholar] [CrossRef]
  22. Das, S.; Chew, M.Y.L.; Poh, K.L. Multi-criteria decision analysis in building maintainability using analytical hierarchy process. Constr. Manag. Econ. 2010, 28, 1043–1056. [Google Scholar] [CrossRef]
  23. Carretero-Ayuso, M.J.; Moreno-Cansado, A.; García-Sanz-Calcedo, J. Influence of climate conditions on deficiencies of building roofs. Appl. Sci. 2019, 9, 1389. [Google Scholar] [CrossRef] [Green Version]
  24. Lacasse, M.A.; Gaur, A.; Moore, T.V. Durability and climate change—Implications for service life prediction and the maintainability of buildings. Buildings 2020, 10, 53. [Google Scholar] [CrossRef] [Green Version]
  25. Flores-Colen, I.; de Brito, J. Discussion of proactive maintenance strategies in façades’ coatings of social housing. J. Build. Apprais. 2010, 5, 223–240. [Google Scholar] [CrossRef]
  26. Gaspar, P.L.; de Brito, J. Limit states and service life of cement renders on façades’. J. Mater. Civ. Eng. 2011, 23, 1396–1404. [Google Scholar] [CrossRef]
  27. Homer-Dixon, T. Complexity science. Oxf. Leadersh. J. 2011, 2, 1–15. [Google Scholar]
  28. Armstrong, M.; Egorov, I.; Lacasse, M.A.; Laouadi, A.; Trischuk, K. Climate Resilience of Buildings—Review of State of Practice: Climate Resilience of Building Enclosures and Temperature Effects on Buildings; Technical Report CRBCPI-Y1-R7; National Research Council Canada: Ottawa, ON, Canada, 2017.
  29. Cavalagli, N.; Kita, A.; Castaldo, V.L.; Pisello, A.L.; Ubertini, F. Hierarchical environmental risk mapping of material degradation in historic masonry buildings: An integrated approach considering climate change and structural damage. Constr. Build. Mater. 2019, 215, 998–1014. [Google Scholar] [CrossRef]
  30. Saha, M.; Eckelman, M.J. Urban scale mapping of concrete degradation from projected climate change. Urban Clim. 2014, 9, 101–114. [Google Scholar] [CrossRef]
  31. Lisø, K.R.; Aandahl, G.; Eriksen, S.; Alfsen, K. Preparing for climate change impacts in Norway’s built environment. Build. Res. Inf. 2003, 31, 200–209. [Google Scholar] [CrossRef]
  32. Lisø, K.R.; Kvande, T.; Time, B. Climate adaptation framework for moisture-resilient buildings in Norway. Energy Procedia 2017, 132, 628–633. [Google Scholar] [CrossRef]
  33. Grynning, S.; Gradeci, K.; Gaarder, J.E.; Time, B.; Lohne, J.; Kvande, T. Climate adaptation in maintenance operation and management of buildings. Buildings 2020, 10, 107. [Google Scholar] [CrossRef]
  34. Ebeling, C.E. An Introduction to Reliability and Maintainability Engineering; McGraw-Hill: New York, NY, USA, 1997. [Google Scholar]
  35. Grynning, S.; Wærnes, E.; Kvande, T.; Time, B. Climate adaptation of buildings through MOM—And upgrading—State of the art and research needs. Energy Procedia 2017, 132, 622–627. [Google Scholar] [CrossRef]
  36. Ferreira, C.; Neves, L.C.; Silva, A.; de Brito, J. Stochastic maintenance models for ceramic claddings. Struct. Infrastruct. Eng. 2020, 16, 247–265. [Google Scholar] [CrossRef]
  37. Bordalo, R.; de Brito, J.; Gaspar, P.L.; Silva, A. Service life prediction modelling of adhesive ceramic tiling systems. Build. Res. Inf. 2011, 39, 66–78. [Google Scholar] [CrossRef]
  38. Silva, A.; de Brito, J.; Gaspar, P.L. Service life prediction model applied to natural stone wall claddings (directly adhered to the substrate). Constr. Build. Mater. 2011, 25, 3674–3684. [Google Scholar] [CrossRef]
  39. Ximenes, S.; de Brito, J.; Gaspar, P.L.; Silva, A. Modelling the degradation and service life of ETICS in external walls. Mater. Struct. 2015, 48, 2235–2249. [Google Scholar] [CrossRef]
  40. Serralheiro, M.I.; de Brito, J.; Silva, A. Methodology for service life prediction of architectural concrete facades. Constr. Build. Mater. 2017, 133, 261–274. [Google Scholar] [CrossRef]
  41. Flores-Colen, I.; de Brito, J.; Freitas, V. Discussion of criteria for prioritization of predictive maintenance of building façades: Survey of 30 experts. J. Perform. Constr. Facil. 2010, 24, 337–344. [Google Scholar] [CrossRef]
  42. Flores-Colen, I.; de Brito, J. A systematic approach for maintenance budgeting of buildings façades based on predictive and preventive strategies. Constr. Build. Mater. 2010, 24, 1718–1729. [Google Scholar] [CrossRef]
  43. Ferreira, C.; Silva, A.; de Brito, J.; Dias, I.; Flores-Colen, I. Definition of a condition-based model for natural stone claddings. J. Build. Eng. 2020, 33. [Google Scholar] [CrossRef]
  44. Ferreira, C.; Silva, A.; de Brito, J.; Dias, I.; Flores-Colen, I. Maintenance modelling of ceramic claddings in pitched roofs based on the evaluation of their in situ degradation condition. Infrastructures 2020, 5, 77. [Google Scholar] [CrossRef]
  45. Sánchez-Silva, M.; Klutke, G.-A. Reliability and Life-Cycle Analysis of Deteriorating Systems; Springer International Publishing: Zurich, Switzerland, 2016. [Google Scholar]
  46. ISO 15686-5. Buildings and Constructed Assets—Service Life Planning—Part 5: Whole Life Costing; International Organization for Standardization (ISO): Geneva, Switzerland, 2012. [Google Scholar]
  47. Frangopol, D.M.; Kallen, M.J.; van Noortwijk, J.M. Probabilistic models for lifecycle performance of deteriorating structures: Review and future directions. Prog. Struct. Eng. Mater. 2004, 6, 197–212. [Google Scholar] [CrossRef]
  48. Langdon, D. Life Cycle Costing (LCC) as a Contribution to Sustainable Construction. Guidance on the Use of the LCC Methodology and Its Application in Public Procurement; Davis Langdon Management Consulting: London, UK, 2007. [Google Scholar]
  49. Dodgson, J.S.; Spackman, M.; Pearman, A.; Phillips, L.D. Multi-Criteria Analysis: A Manual; Department for Communities and Local Government: London, UK, 2009.
  50. Cochran, J.K.; Chen, H.N. Fuzzy multi-criteria selection of object-oriented simulation software for production system analysis. Comput. Oper. Res. 2005, 32, 153–168. [Google Scholar] [CrossRef]
  51. Lewry, A.J.; Crewdson, L.F.E. Approaches to testing the durability of materials used in the construction and maintenance of buildings. Constr. Build. Mater. 1994, 8, 211–222. [Google Scholar] [CrossRef]
  52. Straube, J.F. Moisture in buildings. ASHRAE J. 2002, 44, 15–19. [Google Scholar]
  53. Lau, D.; Büyüköztürk, O. Fracture characterization of concrete/epoxy inter-face affected by moisture. Mech. Mater. 2010, 42, 1031–1042. [Google Scholar] [CrossRef]
  54. Madkour, F.S.; Khallaf, M.K. Degradation processes of Egyptian faience tiles in the step pyramid at Saqqara. Procedia Soc. Behav. Sci. 2012, 68, 63–76. [Google Scholar] [CrossRef] [Green Version]
  55. Norvaišienė, R.; Griciutė, G.; Bliūdžius, R.; Ramanauskas, J. The changes of moisture absorption properties during the service life of external thermal insulation composite system. Mater. Sci. 2013, 19, 103–107. [Google Scholar] [CrossRef] [Green Version]
  56. Bolton, J. Granite and marine salt weathering anomalies from submerged and inter-tidal and coastal archaeological monuments in Ireland. In Proceedings of the 13th International Congress on the Deterioration and Conservation of Stone, Paisley, Scotland, 6–10 September 2016. [Google Scholar]
  57. Cardell, C.; Delalieux, F.; Roumpopoulos, K.; Moropoulou, A.; Auger, F.; Van Grieken, R. Salt-induced decay in calcareous stone monuments and buildings in a marine environment in SW France. Constr. Build. Mater. 2003, 17, 165–179. [Google Scholar] [CrossRef]
  58. Hobbs, D.W. Concrete deterioration: Causes, diagnosis, and minimising risk. Int. Mater. Rev. 2001, 46, 117–144. [Google Scholar] [CrossRef]
  59. Cardell, C.; Rivas, T.; Mosquera, M.J.; Birginie, J.M.; Moropoulou, A.; Prieto, B.; Silva, B.; Van Grieken, R. Patterns of damage in igneous and sedimentary rocks under conditions simulating sea-salt weathering. Earth Surf. Process. Landf. 2003, 28, 1–14. [Google Scholar] [CrossRef]
  60. da Fonseca, B.S.; Simão, J.A.R.; Galhano, C. Effect of coastal environment in clay facing bricks and roof tiles. In Proceedings of the 1st Annual International Interdisciplinary Conference, Azores, Portugal, 24–26 April 2013. [Google Scholar]
  61. Gaspar, P.L.; de Brito, J. Service life estimation of cement-rendered facades. Build. Res. Inf. 2008, 36, 44–55. [Google Scholar] [CrossRef]
  62. Guan, W.L.; Alum, J.; Liu, Z.J.; Yang, T. Performance of external tiled-wall systems under tropical weathering. J. Perform. Constr. Facil. 1997, 11, 24–34. [Google Scholar] [CrossRef]
  63. Yiu, C.Y.; Ho, D.C.W.; Lo, S.M. Weathering effects on external wall tiling systems. Constr. Build. Mater. 2007, 21, 594–600. [Google Scholar] [CrossRef]
  64. CYPE Price Generator. Available online: http://www.geradordeprecos.info/ (accessed on 12 October 2020).
  65. Ferreira, C.; Silva, A.; de Brito, J.; Dias, I.S.; Flores-Colen, I. The impact of imperfect maintenance actions on the degradation of buildings’ envelope components. J. Build. Eng. 2021, 33, 101571. [Google Scholar] [CrossRef]
  66. Intergovernmental Panel on Climate Chante (IPCC). Climate Change 2013: The Physical Science Basis; Cambridge University Press: Cambridge, UK, 2013. [Google Scholar]
  67. Alzahrani, A.; Boussabaine, H.; Alzaed, A.N. Emerging climate changes and the risks to the operation of building assets in the UK. J. Facil. Manag. 2016, 14, 21–35. [Google Scholar] [CrossRef]
  68. Daniotti, B.; Cecconi, F.R.; Paolini, R.; Galliano, R.; Ferrer, J.; Battaglia, L. Durability evaluation of ETICS: Analysis of failures case studies and heat and moisture transfer simulations to assess the frequency of critical events. In Proceedings of the 4th Portuguese Conference on Mortars and ETICS, Coimbra, Portugal, 29–30 March 2012. [Google Scholar]
  69. Daniotti, B.; Paolini, R.; Cecconi, F.R. Effects of ageing and moisture on thermal performance of ETICS cladding. In Durability of Building Materials and Components; de Freitas, V.P., Delgado, J.M.P.Q., Eds.; Springer: Berlin/Heidelberg, Germany, 2013; pp. 127–171. [Google Scholar]
  70. Glass, G.K.; Buenfeld, N.R. The influence of chloride binding on the chloride induced corrosion risk in reinforced concrete. Corros. Sci. 2000, 42, 329–344. [Google Scholar] [CrossRef]
  71. Otieno, M.; Golden, G.; Alexander, M.G.; Beushausen, H. Acceleration of steel corrosion in concrete by cyclic wetting and drying: Effect of drying duration and concrete quality. Mater. Struct. 2019, 52, 50. [Google Scholar] [CrossRef]
  72. European Committee for Standardization. Eurocode 2: Design of Concrete Structures—Part 1-1: General Rules and Rules for Buildings; European Committee for Standardization (CEN): Brussels, Belgium, 2008. [Google Scholar]
  73. Marques, C.; de Brito, J.; Silva, A. Application of the factor method to the service life prediction of ETICS. Int. J. Strateg. Prop. Manag. 2018, 22, 204–222. [Google Scholar] [CrossRef] [Green Version]
  74. Jardim, A.; Silva, A.; Brito, J.D. Application of the factor method to the service life prediction of architectural concrete. Can. J. Civ. Eng. 2019, 46, 1054–1062. [Google Scholar] [CrossRef] [Green Version]
  75. Tavares, J.; Silva, A.; de Brito, J. Computational models applied to the ser-vice life prediction of External Thermal Insulation Composite Systems (ETICS). J. Build. Eng. 2020, 27. [Google Scholar] [CrossRef]
  76. Ramos, N.M.M.; Barreira, E.; Simões, M.L.; Delgado, J.M.P.Q. Probabilistic risk assessment methodology of exterior surfaces defacement caused by algae growth. J. Constr. Eng. Manag. 2014, 140. [Google Scholar] [CrossRef]
  77. Liisma, E.; Sepri, R.; Raado, L.M.; Lill, I.; David, E.; Will, Q.; Sulakatko, V.; Põldaru, M. Defect analysis of renovated facade walls with ETICS solutions in cold climate conditions. In Proceedings of the Central Europe towards Sustainable Building, Prague, Czech Republic, 22–24 June 2016. [Google Scholar]
  78. Pereira, T.C.; Amaro, A.; Borges, M.; Silva, R.; Pina, A.; Canaveira, P. Portuguese National Inventory Report on Greenhouse Gases, 1990–2017; Portuguese Environmental Agency: Amadora, Portugal, 2019. [Google Scholar]
  79. Fischer, E.M.; Knutti, R. Detection of spatially aggregated changes in temperature and precipitation extremes. Geophys. Res. Lett. 2014, 41, 547–554. [Google Scholar] [CrossRef]
  80. Giorgi, F. Climate change hot-spots. Geophys. Res. Lett. 2006, 33. [Google Scholar] [CrossRef]
  81. Carvalho, A.; Schmidt, L.; Santos, F.D.; Delicado, A. Climate change research and policy in Portugal. Wiley Interdiscip. Rev. Clim. Chang. 2014, 5, 199–217. [Google Scholar] [CrossRef] [Green Version]
  82. Newell, S.; Goggins, J. Investigation of thermal behaviour of a hybrid pre-casted concrete floor using embedded sensors. Int. J. Concr. Struct. Mater. 2018, 12, 1–21. [Google Scholar] [CrossRef] [PubMed]
  83. de Wilde, P.; Coley, D. The implications of a changing climate for buildings. Build. Environ. 2012, 55, 1–7. [Google Scholar] [CrossRef] [Green Version]
  84. Henriques, A.; Tello, J.; Pinto, A.; Alho, A.; Moura, A.; Carvalho, C.; Ramos, J.; Almeida, N.; Mestre, V. Manual da Pedra Natural Para a Arquitectura; Direcção Geral de Geologia e Energia: Lisbon, Portugal, 2006.
  85. Bonazza, A.; Messina, P.; Sabbioni, C.; Grossi, C.M.; Brimblecombe, P. Mapping the impact of climate change on surface recession of carbonate buildings in Europe. Sci. Total Environ. 2009, 407, 2039–2050. [Google Scholar] [CrossRef] [PubMed]
  86. Shohet, I.M.; Laufer, A. Exterior cladding methods: A technoeconomic analysis. J. Constr. Eng. Manag. 1996, 122, 242–247. [Google Scholar] [CrossRef]
  87. Shohet, I.M.; Paciuk, M. Service life prediction of exterior cladding components under standard conditions. Constr. Manag. Econ. 2004, 22, 1081–1090. [Google Scholar] [CrossRef]
  88. Kvande, T.; Bakken, N.; Bergheim, E.; Thue, J.V. Durability of ETICS with rendering in Norway—Experimental and field investigations. Buildings 2018, 8, 93. [Google Scholar] [CrossRef] [Green Version]
  89. D’Orazio, M.; Cursio, G.; Graziani, L.; Aquilanti, L.; Osimani, A.; Clementi, F.; Yéprémian, C.; Lariccia, V.; Amoroso, S. Effects of water absorption and surface roughness on the bioreceptivity of ETICS compared to clay bricks. Build. Environ. 2014, 77, 20–28. [Google Scholar] [CrossRef]
  90. Zinzi, M. Exploring the potentialities of cool facades to improve the thermal response of Mediterranean residential buildings. Sol. Energy 2016, 135, 386–397. [Google Scholar] [CrossRef]
  91. Thai-Ker, L.; Chung-Wan, W. Challenges of external wall tiling in Singapore. In Proceedings of the Qualicer 2006: IX World Congress on Ceramic Tile Quality, Castellón, Spain, 12–15 February 2006. [Google Scholar]
  92. Kayondo, M.; Combrinck, R.; Boshoff, W.P. State-of-the-art review on plastic cracking of concrete. Constr. Build. Mater. 2019, 225, 886–899. [Google Scholar] [CrossRef]
  93. Evangelista, L.; de Brito, J. Durability performance of concrete made with fine recycled concrete aggregates. Cem. Concr. Compos. 2010, 32, 9–14. [Google Scholar] [CrossRef]
Figure 1. Illustrative example of the four constructive solutions: (a) Ceramic tiling system (CTS); (b) natural stone cladding (NSC); (c) external thermal insulation composite system (ETICS); (d) architectural concrete façades (ACF).
Buildings 11 00138 g001
Figure 2. Comparison of the different parameters (service life, maintenance costs, efficiency index and number of interventions) for the situation without the impact of environmental exposure conditions.
Buildings 11 00138 g002
Figure 3. Comparison of the service life according to exposure to damp.
Buildings 11 00138 g003
Figure 4. Comparison of the maintenance costs according to exposure to damp for a time horizon of 80 years.
Buildings 11 00138 g004
Figure 5. Comparison of the efficiency index according to exposure to damp for a time horizon of 80 years.
Buildings 11 00138 g005
Figure 6. Comparison of the number of interventions according to exposure to damp for a time horizon of 80 years.
Buildings 11 00138 g006
Figure 7. Comparison of the ETICS degradation curves without maintenance for low and high exposure to damp.
Buildings 11 00138 g007
Figure 8. Comparison of the service life according to distance from the sea.
Buildings 11 00138 g008
Figure 9. Comparison of the maintenance costs according to distance from the sea for a time horizon of 80 years.
Buildings 11 00138 g009
Figure 10. Comparison of the efficiency index according to distance from the sea for a time horizon of 80 years.
Buildings 11 00138 g010
Figure 11. Comparison of the number of interventions according to distance from the sea for a time horizon of 80 years.
Buildings 11 00138 g011
Figure 12. Comparison of the ETICS degradation curves without maintenance for the coastal and inland areas.
Buildings 11 00138 g012
Figure 13. Comparison of the service life according to orientation.
Buildings 11 00138 g013
Figure 14. Comparison of the maintenance costs according to orientation for a time horizon of 80 years.
Buildings 11 00138 g014
Figure 15. Comparison of the efficiency index according to orientation for a time horizon of 80 years.
Buildings 11 00138 g015
Figure 16. Comparison of the number of interventions according to orientation for a time horizon of 80 years.
Buildings 11 00138 g016
Table 1. Optimal parameters of the degradation process according to the environmental exposure conditions and the constructive solutions.
Constructive SolutionsEnvironmental Exposure ConditionsMean (Years)Standard Deviation (Years)
TATBTCTDSDASDBSDCSDD
CTSWithout impact 6.623.622.331.66.511.51.15.0
Exposure to dampLow7.228.418.453.07.69.71.12.3
High5.517.127.928.00.211.81.36.8
Distance from the seaCoastal4.720.227.929.23.214.22.62.0
Inland6.329.218.241.08.09.11.11.9
OrientationWest7.426.122.549.85.317.31.32.3
South7.923.718.328.914.80.50.51.0
East6.124.421.551.36.413.21.12.1
North6.717.533.327.75.513.01.710.9
NSCWithout impact 4.142.922.449.97.010.31.42.4
Exposure to dampLow9.639.726.350.78.19.61.32.6
High3.239.318.042.82.19.21.12.1
Distance from the seaCoastal3.942.018.359.36.19.21.02.4
Inland5.642.733.341.58.012.61.62.0
OrientationWest4.435.419.149.51.29.30.72.6
South4.847.620.344.20.56.50.93.0
East5.245.225.247.611.510.410.52.6
North5.038.530.326.30.86.19.41.3
ETICSWithout impact 1.88.16.57.22.43.62.03.0
Exposure to dampLow1.18.49.74.90.35.15.00.6
High2.77.95.57.23.22.41.90.8
Distance from the seaCoastal2.38.95.76.63.82.30.41.4
Inland2.47.78.212.80.96.33.79.5
OrientationWest2.07.65.96.62.22.72.90.9
South1.99.86.010.43.03.20.35.7
East1.48.36.76.42.94.31.33.0
North2.95.59.510.50.35.84.00.7
ACFWithout impact 4.531.013.545.58.810.91.72.4
Exposure to dampLow3.836.510.041.94.39.21.02.0
High5.127.015.742.111.310.05.21.8
Distance from the seaCoastal6.830.314.047.212.512.71.42.4
Inland3.029.914.131.33.06.82.11.6
OrientationWest4.427.822.335.95.910.72.61.9
South3.732.86.644.77.69.31.62.0
East5.433.315.842.410.514.70.81.9
North4.126.814.232.57.56.51.11.9
TA,B,C,D—Mean sojourn time in each degradation condition; SDA,B,C,D—Standard deviation of the sojourn time in each degradation condition; CTS—Ceramic tiling systems; NSC—Natural stone claddings; ETICS—External thermal insulation composite system; ACF—Architectural concrete façades.
Table 2. Costs, application zones, and impacts of the different types of interventions analyzed for the four constructive solutions.
Constructive SolutionsInterventionCost (€/m2)Application Zone ConditionImpact of the Intervention
PA (%)PB (%)PC (%)
CTSInspection1.03All---
Cleaning operation27.48B30.669.4-
Minor intervention65.77C3.158.538.5
Total replacement68.85D, E100.0--
NSCInspection1.03All---
Cleaning operation31.37B15.085.0-
Minor intervention68.80C0.080.419.6
Total replacement149.51D, E100.0--
ETICSInspection1.03All---
Cleaning operation26.88B34.965.1-
Minor intervention58.13C37.330.532.2
Total replacement95.98D, E100.0--
ACFInspection1.03All---
Cleaning operation27.18B17.182.9-
Minor intervention84.75C61.538.50.0
Total replacement106.48D, E100.0--
PA,B,C—Probability of transition to condition A, B, or C; CTS—Ceramic tiling systems; NSC—Natural stone claddings; ETICS—External thermal insulation composite system; ACF—Architectural concrete façades.
Table 3. Comparison of the costs (initial, inspection, maintenance and total) of the four constructive solutions for the three maintenance strategies.
Constructive SolutionMaintenance StrategyInitial Costs (€/m2)Inspection Costs (€/m2)Maintenance Costs (€/m2)Total Costs (€/m2)
CTSMS155.443.89 13.7763.09
MS219.8479.16
MS345.98105.31
NSCMS1136.793.02 22.74142.55
MS25.82145.62
MS341.36181.17
ETICSMS178.385.34 354.67138.38
MS278.64162.36
MS3107.37191.09
ACFMS1104.543.89 17.39115.82
MS214.44122.87
MS346.03154.46
1 Inspected every four years; 2 Inspected every five years; 3 Inspected every three years; CTS—Ceramic tiling systems; NSC—Natural stone claddings; ETICS—External thermal insulation composite system; ACF—Architectural concrete façades.
Table 4. Multi-criteria decision analysis for the exposure to damp.
Exposure to DampLowHighLowHighLowHighLowHighLowHigh
Scenario12345
CriteriaWeight, λj
Efficiency index25%50%16.7%16.7%16.7%
Initial costs25%16.7%50%16.7%16.7%
Maintenance costs25%16.7%16.7%50%16.7%
Total replacements25%16.7%16.7%16.7%50%
MSSolutionsStandardized Global Rating, xi
MS1CTS0.900.960.850.740.920.970.981.000.830.89
NSC0.480.580.560.630.000.000.720.740.650.69
ETICS0.000.000.000.000.100.080.210.000.000.00
ACF0.580.650.630.590.320.330.770.760.650.71
MS2CTS1.000.990.960.881.000.991.000.840.990.96
NSC0.650.840.780.950.130.190.820.900.840.95
ETICS0.210.310.250.350.250.310.200.080.330.43
ACF0.770.930.810.960.460.530.880.880.911.00
MS3CTS0.971.001.001.000.981.000.870.681.001.00
NSC0.580.680.760.890.070.070.650.540.800.87
ETICS0.180.430.310.570.230.390.000.000.380.59
ACF0.660.820.760.950.380.450.660.610.840.95
CTS—Ceramic tiling systems; NSC—Natural stone claddings; ETICS—External thermal insulation composite system; ACF—Architectural concrete façades; MS1—Total replacement only; MS2—Combination of minor interventions and total replacement; MS3—Combination of cleaning operations, minor interventions, and total replacement; Scenario 1—Equal weights are assigned to all criteria; Scenario 2—Higher weight is assigned to the efficiency index; Scenario 3—Higher weight is assigned to initial costs; Scenario 4—Higher weight is assigned to maintenance costs; Scenario 5—Higher weight is assigned to the number total of replacements.
Table 5. Multi-criteria decision analysis for distance from the sea.
Distance from the SeaCoastalInlandCoastalInlandCoastalInlandCoastalInlandCoastalInland
Scenario12345
CriteriaWeight, λj
Efficiency index25%50%16.7%16.7%16.7%
Initial costs25%16.7%50%16.7%16.7%
Maintenance costs25%16.7%16.7%50%16.7%
Total replacements25%16.7%16.7%16.7%50%
MSSolutionsStandardized Global Rating, xi
MS1CTS0.940.890.750.830.960.921.000.970.870.84
NSC0.560.460.630.500.000.000.750.710.680.67
ETICS0.000.000.000.000.080.100.020.200.000.00
ACF0.670.530.660.540.350.290.790.730.720.63
MS2CTS1.001.000.930.971.001.000.871.000.971.00
NSC0.820.640.960.760.190.130.910.810.940.83
ETICS0.320.230.350.270.320.270.120.210.440.35
ACF0.940.741.000.780.540.450.920.831.000.89
MS3CTS0.950.970.991.000.960.980.630.860.971.00
NSC0.660.540.890.730.070.060.550.600.860.78
ETICS0.410.180.550.310.380.240.000.000.580.37
ACF0.820.640.970.740.460.370.640.620.940.83
CTS—Ceramic tiling systems; NSC—Natural stone claddings; ETICS—External thermal insulation composite system; ACF—Architectural concrete façades; MS1—Total replacement only; MS2—Combination of minor interventions and total replacement; MS3—Combination of cleaning operations, minor interventions, and total replacement; Scenario 1—Equal weights are assigned to all criteria; Scenario 2—Higher weight is assigned to the efficiency index; Scenario 3—Higher weight is assigned to initial costs; Scenario 4—Higher weight is assigned to maintenance costs; Scenario 5—Higher weight is assigned to the number total of replacements.
Table 6. Multi-criteria decision analysis for orientation.
OrientationWSENWSENWSENWSENWSEN
Scenario12345
CriteriaWeight, λj
Efficiency index25%50%16.7%16.7%16.7%
Initial costs25%16.7%50%16.7%16.7%
Maintenance costs25%16.7%16.7%50%16.7%
Total replacements25%16.7%16.7%16.7%50%
MSSolutionsStandardized Global Rating, xi
MS1CTS0.930.940.910.950.820.810.810.810.940.960.930.971.001.001.001.000.890.860.860.88
NSC0.490.470.530.520.540.500.590.590.000.000.000.000.690.700.750.760.630.620.700.68
ETICS0.000.000.000.000.000.000.000.000.080.110.060.120.040.070.100.250.000.000.000.00
ACF0.560.570.610.620.490.570.600.640.300.320.320.340.730.710.780.790.680.610.700.68
MS2CTS1.001.001.001.000.950.910.950.921.001.001.001.000.960.960.970.911.000.950.990.97
NSC0.670.710.720.770.780.780.830.910.140.170.140.170.800.850.860.890.840.860.880.91
ETICS0.240.290.260.210.280.290.290.270.250.310.260.270.070.160.150.210.360.420.390.34
ACF0.780.800.820.880.810.790.860.940.470.480.480.520.820.850.890.900.910.900.940.97
MS3CTS0.981.000.981.001.001.001.001.000.981.000.981.000.810.790.810.811.001.001.001.00
NSC0.560.550.600.660.740.710.780.870.060.060.050.100.520.510.600.680.780.770.810.86
ETICS0.320.320.290.140.440.410.400.290.320.330.280.220.000.000.000.000.500.510.480.33
ACF0.690.660.720.790.790.730.820.910.400.380.400.450.590.550.650.720.860.830.880.93
CTS—Ceramic tiling systems; NSC—Natural stone claddings; ETICS—External thermal insulation composite system; ACF—Architectural concrete façades; MS1—Total replacement only; MS2—Combination of minor interventions and total replacement; MS3—Combination of cleaning operations, minor interventions, and total replacement; Scenario 1—Equal weights are assigned to all criteria; Scenario 2—Higher weight is assigned to the efficiency index; Scenario 3—Higher weight is assigned to initial costs; Scenario 4—Higher weight is assigned to maintenance costs; Scenario 5—Higher weight is assigned to the number total of replacements.
Publisher’s Note: MDPI stays neutral with regard to jurisdictional claims in published maps and institutional affiliations.