Abstract
Masonry towers, located in seismic zones, are vulnerable and prone to damages up to compromise their stability. The scatter of data on the mechanical properties of masonry, geometry and boundary conditions determine a lack of building knowledge on their expected behaviour. Therefore the assessment of the seismic capacity represents a critical task. This paper contributes to the issue of seismic analysis of masonry towers, focusing a meaningful case study: the St.Silvestro belfry in L’Aquila, Italy. The tower, severely damaged by the 2009 earthquake sequence, underwent extensive restoration works, endeavoured to mitigate its vulnerability. The observed seismic damage, the performed no-destructive testing campaign and the accomplished rehabilitation measures are described in the paper. The authors appraised the actual seismic performances of the St.Silvestro belfry, reinforced by the last restoration works. At first, the Operational Modal Analysis (OMA) is carried out to enhance building knowledge. In a second step, a refined finite element model is calibrated on the results from OMA to seize the actual dynamic response. Ultimately, by using the updated finite element model, the authors estimate the fragility curves in terms of peak ground acceleration using truncated incremental dynamic analyses.
1. Introduction
Masonry towers (MTs) are monumental constructions conceived, from ancient times, to withstand gravity loads. MTs were built either as isolated construction or included in clustered buildings, sometimes linked to city walls, castles and churches. The prediction of the MTs seismic response is a rather complex problem due to the uncertainties in the characterization of the masonry and the structural configuration. Still, the seismic performance of masonry towers receives interest from the scientific community [1,2,3,4,5] to protect their architectural value through strengthening measure [6,7,8,9,10] and monitoring system [11,12,13,14].
A thorough investigation of morphology, boundary conditions, construction process, architectural alterations or restorations, modelling errors should anticipate any seismic assessment.
Unfortunately, extensive knowledge is difficult to achieve due to the lack of historical data and the cost of invasive and destructive tests [15]. Furthermore, MTs may show dynamic phenomena which are uncommon in ordinary masonry buildings. Its slenderness leads to high displacement capacity and the geometric features, i.e., irregularities and large openings, give rise to concentrated local stresses. Low mechanical properties of the materials used (e.g., stone, brick masonry, adobe and wood) assembled according to empirical rules, without connection among different structural compounds, lead to reduced resistance against lateral loading.
Field observations, after seismic events, reveal similar damage mechanisms, despite the uniqueness of each construction. The Italian Guidelines for Cultural Built Heritage [16] list the recurrent damage patterns for cultural buildings, driven by collapse mechanisms of different structural parts, named macro-elements, with independent behaviour [17,18], including MTs. Their recurring scenario consists of extended cracks, out-of-plane overturning and local collapse, see Figure 1.
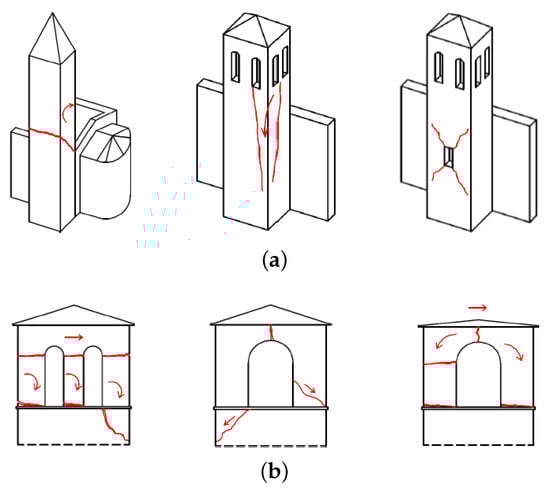
Figure 1.
Collapse mechanisms: (a) tower stem; (b) tower top [16].
The damage patterns occurs differently in the stem, Figure 1a, and at the top of the tower, Figure 1b.
The position of the tower, concerning other constructions, affects the response of the stem. When the tower is next to a building, the stem suffers a sort of stiffness increase: this usually leads to extensive cracking, with severity related to the hammering intensity. At worst, the collapse of the stem compromises the safety of the adjacent building [19]. Additionally, along the stem, the large openings increase the vulnerability to shear failures. Seismic amplification may cause local collapse at the top of the tower, which is generally involved in the rotation and sliding of the pillars, causing cracks in the arches (Figure 1b). The damage may derive from the lack of tie rods or hooping ties, pillars slenderness, and too heavy and thrusting roofs.
An isolated tower generally exhibits a more satisfactory seismic performance, although significantly out-of-plumb phenomena may occur.
The presence of surrounding buildings should be taken into account in the assessment to attain reliable results. The neighbouring structures offer a horizontal restrain, modifying the free height of the structure.
The Italian National Design Code [20,21] offers a simplified equation to calculate the fundamental vibration period. Alternatively, several empirical formulations, available in the literature, provide an estimation of the fundamental vibration period, depending on the height of the tower. The empirical correlations allow the estimation of the fundamental vibration period, including only geometric features, in agreement with the experimental data collected by [22,23]. The modal characteristics, such as modal shapes and frequencies, can be experimentally identified to characterize the current conditions of a structure [24,25,26,27], which is the base for the design of the strengthening and retrofitting interventions. Dynamic tests in Operational Conditions are reliable tools for non-destructively characterizing the linear dynamic of historical structures [28,29,30,31,32,33,34].
This paper presents the evaluation of the dynamic response of a masonry tower, the St.Silvestro belfry, located in L’Aquila, Italy, severely damaged by the 2009 earthquake. The case study ranges from the description of its seismic response to its expected seismic performance after the structural interventions. The authors calibrated a Finite Element model using data from experimental modal identification in operational conditions. Then the fragility curves, in terms of peak ground acceleration, were obtained using the truncated incremental dynamic analysis to assess the probabilistic seismic performance of the belfry.
2. The Case Study: The St.Silvestro Belfry
2.1. The St.Silvestro Complex: Historical Information and Description of The Building
The complex of St.Silvestro is a medieval building, located in the centre of L’Aquila, Italy, see Figure 2a, composed of the church, the belfry, the canonical house, and the chapel (Figure 3 and Figure 4).
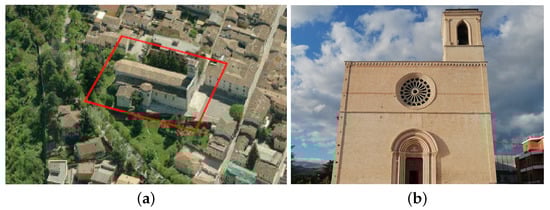
Figure 2.
(a) Top view of the St.Silvestro Church (from https://earth.google.com, accessed on 15 March 2021); (b) View of the facade of the Church.
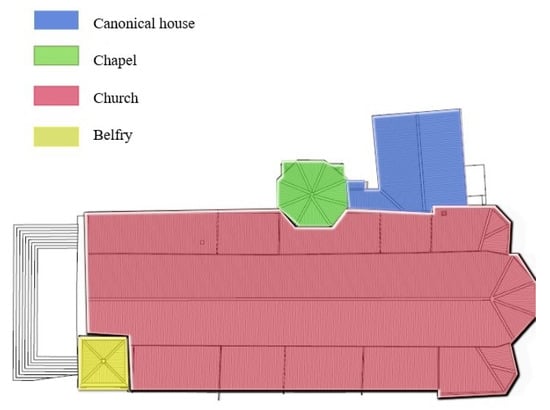
Figure 3.
Plan of the building: the colors highlight the position of the structural elements.
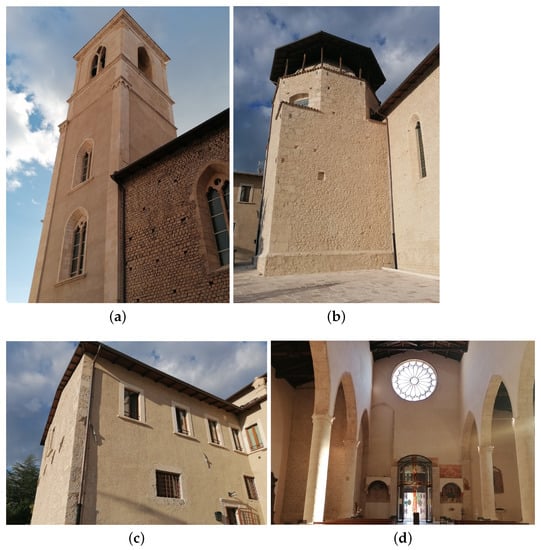
Figure 4.
The St.Silvestro complex after the rehabilitation works following the 2009 earthquake: (a) Belfry, (b) Chapel, (c) Canonical house, (d) Interior of the church.
It was built between the XIII and XIV century by the inhabitants of the Collebrincioni Castle, during the dominance of the king Federico II. Many historians [35] believed that the earthquake in 1349 preceded the construction of the church. Other sources proved the presence of the church around 1350. According to the studies carried out by the Fine Art Authority, the most acknowledged chronological hypothesis is that the church was built in the XIII century, starting from the central part of the building. After the 1265 earthquake, the construction works were interrupted due to the lack of funds. Two earthquakes in 1315 and 1350 damaged the church, during the erection of the apse and the facade. In 1500, during the realization of the interior fresco, a tower of the city walls became the chapel of the church [36]. The 1969 restoration removed the baroque additions. Therefore, from its construction, the St.Silvestro complex underwent many restorations, without changing the external configuration, as proved by historical maps (Figure 5).
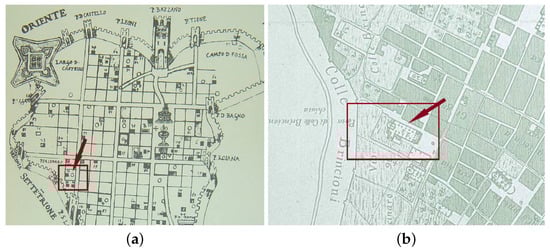
Figure 5.
(a) Historical Maps by Fonticulano, 1575 and by Vandi, 1753 (b).
Currently, the building exhibits the main features of medieval architecture. The church has a 60.23 m by 22.54 m rectangular plan, Figure 6. The interior consists of three naves: the length of the central nave is two times the length of the lateral ones.
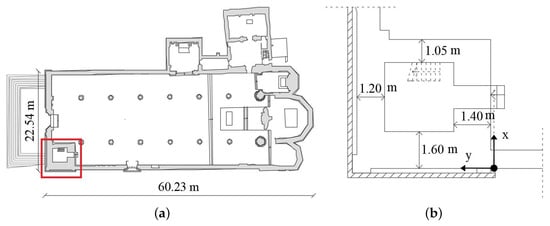
Figure 6.
(a) Plan of the church: the red rectangle indicates the belfry; (b) Cross-section of the masonry tower.
Two masonry walls, 0.80 m thick and 5 m high, with six and seven ogival arches respectively, divide the naves between each other. The facade is in Gothic style, with a central rose window, Figure 2b. The belfry stands by the right side of the façade. It has a 5.5 m by 6.9 m rectangular plan and is 33 m high. A steel staircase reaches the bell cell, see Figure 7, distinguished by slender masonry piers and large openings.
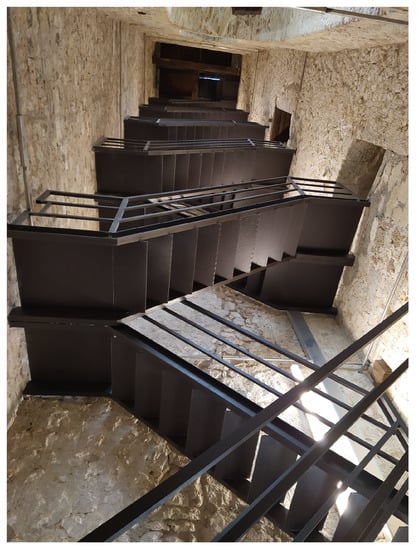
Figure 7.
Interior of the belfry.
The thickness of the belfry wall is not constant. It changes in correspondence with each wall: 1.05, 1.20, 1.40 and 1.60 m, Figure 6b. The belfry was erected using rubble stone masonry with lime mortar, see Figure 8a. A different type of masonry constitutes the lateral walls, with semi-regular ashlar units, shown in Figure 8b, the so-called “Apparecchio Aquilano”.
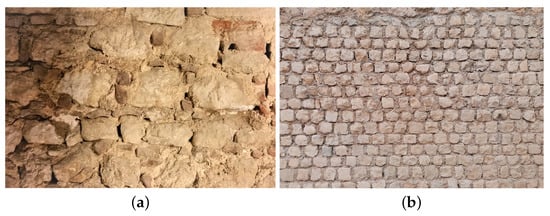
Figure 8.
Texture of the masonry, after the restoration of the belfry (a) and of the nave wall (b).
The roof consists of wooden trussed, except for the apse and chapel, where wooden trusses cover the vaulted ceilings. The frescoes, see Figure 9a–d, belong to different periods, starting from the XVI century.
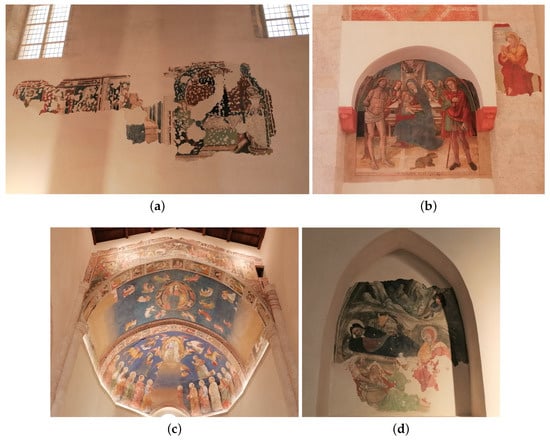
Figure 9.
Views of the different frescoes of the church: (a) on the left nave wall; (b) near the entrance; (c) on the ceiling of the apse; (d) on the right nave wall.
In particular, the decorations of the main chapel, named “Cappella degli Stucchi”, see Figure 10a, possess a considerable historical value, representing one of the first examples of the Baroque style in the local architectural heritage.
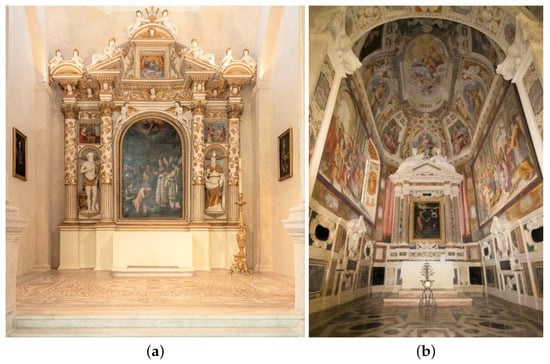
Figure 10.
View of the chapel “Cappella degli Stucchi” (a); View of the chapel “Cappella Branconio” (b).
Starting from the XV century, an inner chapel named “Cappella Branconio”, see Figure 10b, was obtained from the minor apse through architectonic alterations.
2.2. The 2009 Earthquake: Suffered Damage
On 6 April 2009, at 3.32 a.m., an earthquake with Mw = 6.3 struck L’Aquila and the central Apennines. The epicentre was located 10 km west of L’Aquila and 95 km east of Rome. The earthquake originated from the motion of a normal fault in the North-South direction [37]. The main-shock was the third earthquake event by intensity, occurred in Italy since 1972, after the Friuli event, recorded in 1976 with Mw = 6.4, and the Irpinia event, recorded in 1980 with Mw = 6.9. The response spectral acceleration of the records of the earthquake is reported in Figure 11.
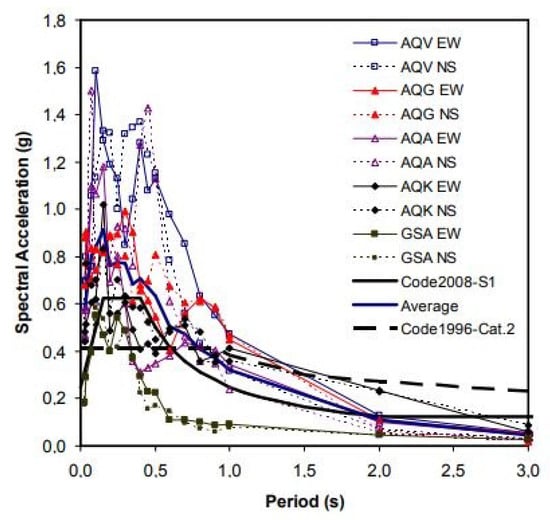
Figure 11.
Response spectra of the records from 5 stations for damping and comparison with Normative code design spectrum [38].
According to the regional seismic response, investigated after the 2009 earthquake, the subsoil conditions in the urban area of L’Aquila, including the St.Silvestro site, are quite complex. The upper part of the subsoil consists of a deposit, called “Brecce dell’Aquila”, i.e., calcareous fragments of variable size embedded in a sandy or silty matrix with highly variable cementation and mechanical properties. The soil layer is 80–100 m thick, and it is above a fine and medium-grained layer, mostly silty lacustrine deposits of an average thickness of 250–270 m [39].
The 2009 earthquake highlighted the vulnerabilities of the complex. The most compromised parts were the facade and the belfry. The facade suffered damage, originated from the asymmetrical structural configuration, due to the presence of the belfry on the right side. The gable showed incipient overturning in the unrestrained side, indicated in blue in Figure 12a. The upper part of the facade, on the left side, is free of constraints and was prone to overturning. Nevertheless, the presence of a few retaining ties avoided the collapse, see Figure 12b.
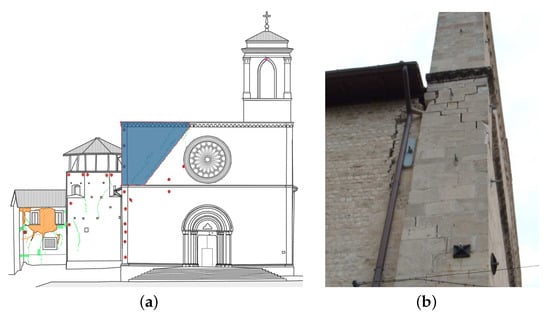
Figure 12.
(a) Observed collapse mechanisms of the St.Silvestro facade; (b)External view of the cracks, taken by Fine Art Authority.
The bell tower exhibited extended cracks originated from diverse overturning mechanisms which can be recognised from the direct observation of the damage pattern, see Figure 13.
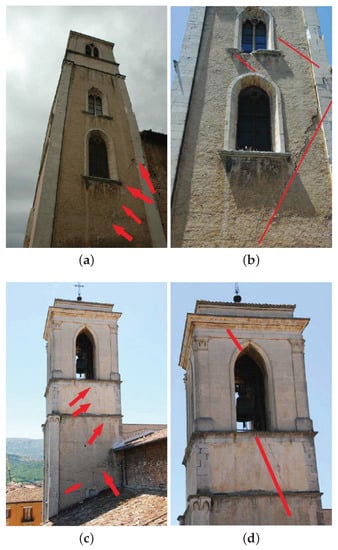
Figure 13.
Views of the St.Silvestro belfry after the 2009 earthquakes: red lines and arrows points out the damage pattern (taken by Fine Art Authority): (a,b) cracks pattern along the stem of the belfry; (c,d) cracks pattern along the stem of the bell cell.
The first mechanism affected the entire belfry, which pivoted around a cylindrical hinge located at the base, depicted in Figure 14a. The second mechanism involved the upper part of the belfry, which pivoted around a cylindrical hinge at 10.20 m, as pictured in Figure 14b.
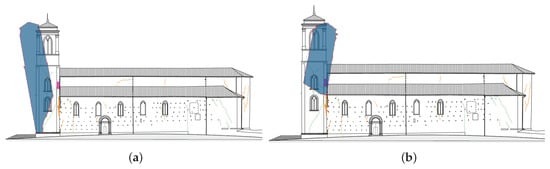
Figure 14.
Observed collapse mechanism of the St.Silvestro belfry: (a) The first overturning; (b) The second overturning.
Both mechanisms caused severe diagonal cracks. The lack of connections among different structural parts gave rise to local mechanisms also in other components of the monumental complex.
2.3. The Diagnostic Campaign and the Rehabilitation Works
After the 2009 earthquake, the Fine Art Authority carried out a non-destructive testing campaign to enhance structural knowledge. Regarding the belfry, Figure 15 illustrates the locations of the tests.
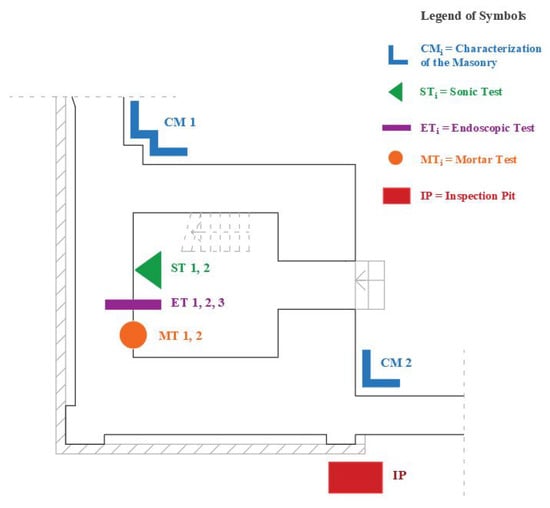
Figure 15.
Plan of the diagnostic tests on the belfry.
The endoscopy technique manifested the arrangement of the masonry units inside the wall, in three different locations: 2.5 m (Endoscopic Test ET1), 8.5 m (Endoscopic Test ET2) and 14.5 m (Endoscopic Test ET3), measured from the floor of the belfry. Masonry consists of irregular units, in local stone, arranged with mortar heterogeneously. According to the results of the three chemical-physical analysis (Chemical-Physical Analysis CPA1, CPA2, CPA3, in the points illustrated in Figure 15), the mortar composition consists of calcareous aggregate, with a negligible silica fraction, and a hydraulic binder, with a small aerial fraction. The sonic investigation technique allowed a more deep characterization of the masonry of the belfry walls, by detecting the sonic velocities V. The results of the first (ST1) and second (ST2) tests are reported in Table 1.

Table 1.
Results of the Sonic Tests (ST1, ST2).
According to the Equation (1) reported in the UNI-EN 12504-4 (2005), the dynamic elastic modulus of masonry is evaluated from the mean value of sonic velocities , the Poisson’s ratio (set equal to 0.2), the density of the material (set equal to 20 kN/m3), and g, the gravity acceleration g.
The obtained is equal to 1530 MPa and 1515 MPa from the first and second test, respectively.
Two visual inspections, called CS1 and CS2, are carried out to characterize the connection between different structural parts. The investigations highlighted the lack of the connection between the belfry and the adjacent building: the photos Figure 16a,b show the different textures of the facade and the belfry wall (CS1), Figure 16c,d the nave wall and the belfry wall (CS2).
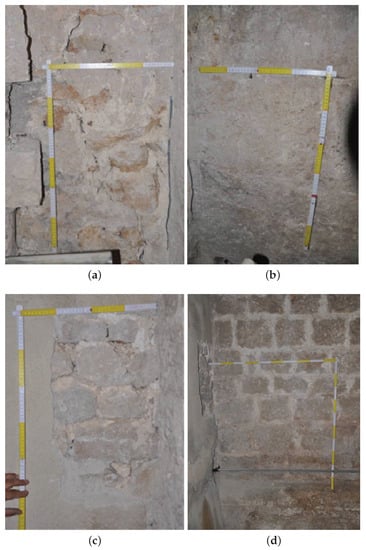
Figure 16.
Characterization of the masonry surveys: (a,b) views of the first test, CS1; (c,d) views of the second test, CS2, taken by Fine Art Authority.
An inspection pit IP, see Figure 17, investigated the foundation of the belfry: it consists of squared unit stones, nearly 0.6 m high.
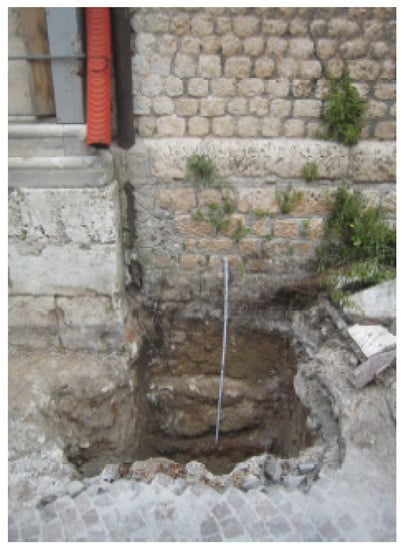
Figure 17.
Photo of the inspection Pit, IP, near the foundation of the belfry, taken by Fine Art Authority.
The rehabilitation interventions attempted to increase the overall structural response by preventing local collapse mechanisms. Specifically, the belfry was repaired differently, depending on the severity of the damage. The use of mortar injections allowed the repair of the more superficial cracks. The parts with extensive damage were replaced with new bricks. Stone diatons reinforced the wider cracks, by connecting the rupture surfaces, and improved the friction resistance among the masonry units. Expectedly, the reinforcement enhanced the global structural behaviour of the tower, primarily due to the contribution of the steel rods which connected the walls between each other. Furthermore, the grout injections improved the overall mechanical performance of the masonry. The brief descriptions of the interventions on the belfry are depicted in Figure 18.
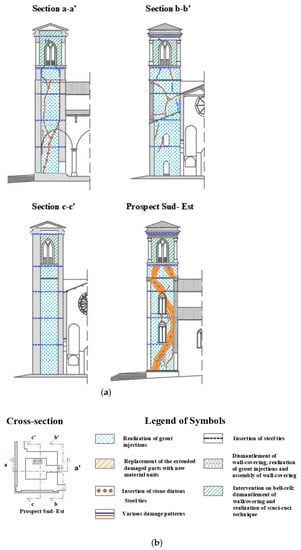
Figure 18.
Restoration of the St.Silvestro belfry: (a) Representation of the restoration measure; (b) Cross-section and legend.
3. Dynamic Identification of the St.Silvestro Belfry: Description and Results
On 2 December 2019, the authors carried out the dynamic investigations using Operational Modal Analysis (OMA) [36,40,41].
A set of 10 Force-Balance mono-axial accelerometers (SARA Instruments SA10) was used, see Figure 19. The accelerometers are characterized by a dynamic range higher than 165 dB in the frequency interval 0.1–20 Hz and a 5 V/g sensitivity. The authors used two measurements chains for the acquisition system, each one driven by a master recorder unit, synchronized by a GPS sensor.
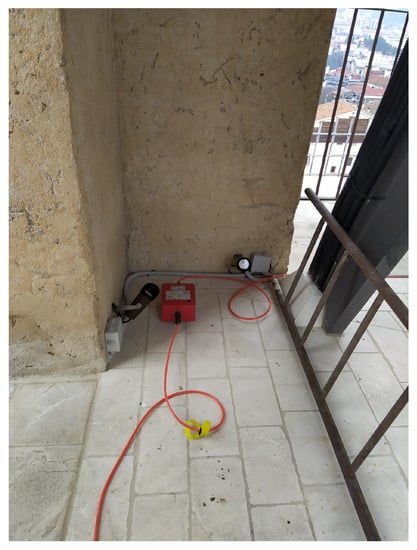
Figure 19.
Accelerometer placed on the top of the bell tower, at the height of 22.03 m.
Figure 20 shows the four setups used during the test: the disposition of the measurement axes of the accelerometers is indicated by arrows, green and red, respectively for the X and Y directions. In the current setups, the position of two accelerometers remained fixed (at the height of 6.80 m and 10.20 m), providing a reference location in the two orthogonal directions. Their position is highlighted in blue in Figure 20. The remaining eight accelerometers were located in the other levels, as represented in Figure 20, changing the disposition of the measurement axis. The features of the belfry and the impracticality of installing devices to support the accelerometers led to the chosen measurement points.
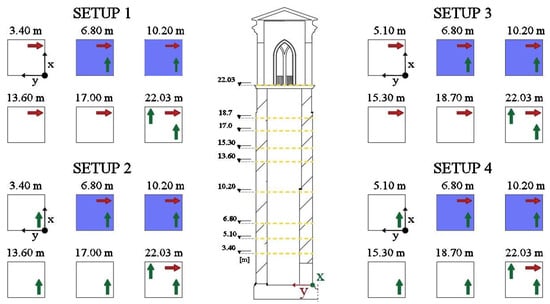
Figure 20.
Illustration of the four experimental setups with the measuring directions: the sections filled in blue indicate the accelerometers with the same disposition for each setup.
The data were sampled at a rate of 200 Hz. The cut-off frequency of the anti-aliasing filter was fixed to 20 Hz, and the number of samples was equal to N = 720,000, leading to a measurement time of 48 min. The identification was carried out under environmental conditions. The covariance-driven Stochastic Subspace Identification (SSI) method was used for the estimate of modal parameters from Output Only measurements. The SSI technique is a classical covariance-driven stochastic realization algorithm, namely the Principal Component algorithm [42], also known as covariance-driven SSI algorithm (SSIcov), that was generalized to a reference-based version (SSI-cov/ref) by Peeters and De Roeck [43].
Then, data from multi-setup measurements were merged respecting the approach recalled in [44].
In order to graphically verify the stability of the poles as the order of the system increases, the authors implemented the following stabilization criteria:
where , and are the natural frequency, damping and mode shape registered for each pole of the i-th order, from the i-th iteration; the Modal Assurance Criterion (MAC) threshold value is ; and are the adopted tolerances for the natural frequencies and damping ratios.
Unfortunately, the ambient excitation did not sufficiently excite the upper modes: the complex is located in a traffic-free zone, leading to a low ambient excitation level. Only two modes, described in Table 2, arose clearly from the stabilization diagram, which is reported in Figure 21a. The experimental results were quite satisfactory: the Modal Phase Collinearity values, MPC, were equal to 0.91 and 0.86, respectively.
Table 2.
Results of Operational Modal Analysis (OMA).
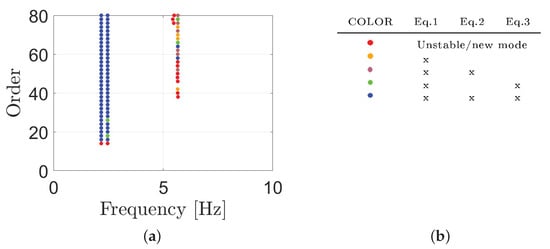
Figure 21.
(a) Stabilization diagram obtained from SSI-cov analysis; (b) Legend of the colors.
The modes are translational in two orthogonal directions, see Figure 22.
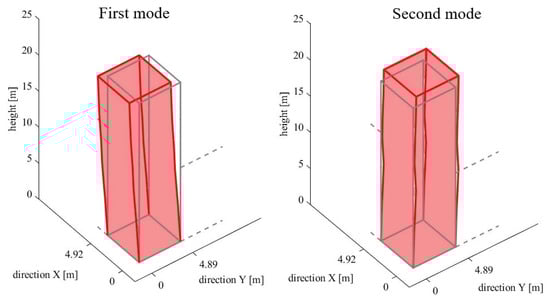
Figure 22.
Experimental mode shapes.
4. Numerical Simulations of the St.Silvestro Belfry
Numerical analyses were carried out to assess the dynamic response of the belfry. Specifically, the authors developed a Finite Element (FE) model, using an equivalent frame model, implemented in SAP2000, a software package user-friendly interface widely used for seismic analysis. The experimental results pointed out a global behaviour of the belfry, justifying the development a global model. The Finite Element model, based on a simplified modelling approach, ensures good results for global analysis of masonry structures in the nonlinear field [45,46], allowing also to reduce the computational costs of nonlinear analyses. The chosen approach consists in modelling each masonry wall with an equivalent frame, connected each other by rigid links. The reliability of this modelling approach was investigated by several scholars, also in the case of historical structures [47,48,49]. The nonlinear mechanical behaviour descends from a so-called lumped plasticity approach [50]. The walls are modeled as elastoplastic with two rocking hinges, located at the ends of each frame, and a shear hinge, located at the mid-height. The masonry elements may exhibit in-plane failure for bending-rocking and shear sliding mechanisms: the constitutive law is represented in Figure 23.
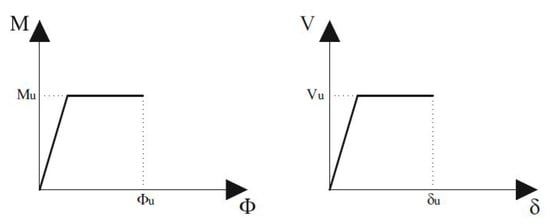
Figure 23.
Plastic hinge law for masonry elements.
The failure criteria follow the Eurocode 8, EC8-1, and the Italian Design Code [20,21,51]. The following relationship evaluated the ultimate moment of the rocking hinges, see Equation (5) [20]:
where is the mean vertical stress for gravitational loading, D and t are the width and the thickness of the wall, respectively, and is the design compression strength. The following relationship Equation (6) [20] evaluates the ultimate strength of shear hinges:
where indicates the design shear strength with no axial force and is a coefficient related to the element geometrical ratio, assumed as H/D, where H is the height of the vertical masonry element.
The ultimate shear displacement is equal to 0.4% of the deformable height of the masonry element and the ultimate rotation, for bending moment, is equal to 0.6%. The mechanical parameters of the un-reinforced and reinforced masonry were assigned according to the Italian Standard Code [21], see Table 3. The correction factor accounts for the effectiveness of the different strengthening interventions on the mechanical characteristics of the masonry: equal to 1.7 for grout injections and equal to 2.55 for grout injections and stone diatons, as suggested by [21]. In detail, the masonry properties of the walls in X-direction were improved by grout injections. Additionally, the walls in Y-direction had consolidations using diatons. These values of the elastic modulus E provided the starting value in the model updating process.
Table 3.
Mechanical parameters of the masonry.
The adjacent church was included in the model by introducing non linear springs to yield a mono-lateral constrain with compression-only reaction. More precisely, the facade and the nave wall were included by a spring distribution with a length equal to 10.25 m and 16.60 m respectively. The authors evaluated the structural bond between the belfry and the adjacent church based on the rotation of the experimental and analytical axes of inertia of the structure [36]. The authors ignored soil-structure interactions: the structure was assumed fixed to the foundation.
Model Updating
Model updating aims to calibrate the Finite Element model of a structure in order to match numerical and experimental results [52]. The resulting updated Finite Element Model could be used to obtain reliable predictions of structural behaviour. The model updating involves the solution of a constrained optimization problem related to an objective function, which is generally expressed as the difference between experimental and numerical natural frequencies and mode shapes of structures. The following objective function measures the distance between the estimated modal parameters and the numerical ones [53]:
where the apex indicates a measured variable, the apex a calculated variable, is the mode shape vector, M is the number of modes, MAC is the Modal Assurance Criterion [54,55], while and are weighting factors, which in this case are set equal to one.
The model updating involved the elastic modulus E of the masonry, with the distinction between x and y directions. An acceptable range for the E value was set and investigated. The minimum values were set, according to the Italian Guidelines, equal to 2091 MPa for and 3136 MPa for . The maximum values were equal to 3660 MPa for and 5448 MPa for , arbitrarily. The numerical frequencies, with reference to the minimum values of the Elastic modulus range, evaluated before the model updating, are equal to 2.100 Hz for the first mode and equal to 2.360 Hz for the second mode, with a discrepancy of −12.7% and −16.48% with the experimental frequencies. The optimization process returned a value of 3540 MPa for and 3360 MPa for : clearly, these values are higher than the dynamic elastic modulus , thanks to the strengthening measures of the masonry. Still, the values are a bit higher than those expected from the Italian Standard Code for the cases of reinforced masonry, see Table 3: and moduli show a discrepancy of 40.93% and 6.66% respectively, with the suggested values by the Code dispositions.
Figure 24 illustrates the translational modes revealed by the numerical analysis after the model updating.
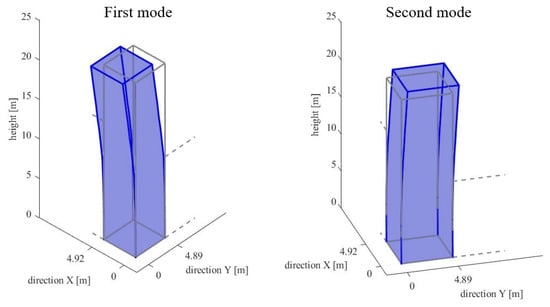
Figure 24.
Numerical shapes after the model updating.
Table 4 reports the comparison between the numerical and experimental frequencies of the structure and their relative discrepancy.
Table 4.
Comparison between numerical and experimental frequencies.
Figure 25 reports the MAC values evaluated between numerical and experimental modes:
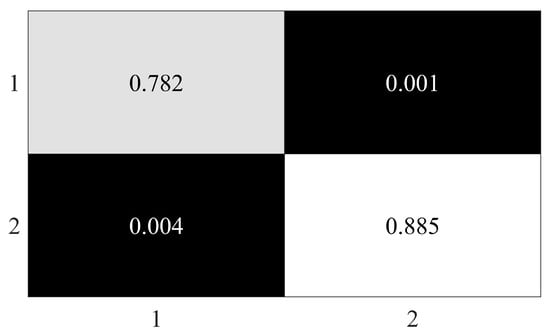
Figure 25.
MAC matrix between experimental and numerical modes.
The diagonal values demonstrate a consistent correspondence. The third experimental mode resulted to be unstable in terms of modal parameters estimation, hence it was not involved in the model updating. Nevertheless, the third numerical frequency falls within an acceptable range around the third experimental one: the experimental frequency was identified at 4.425 Hz, while the numerical was found at 4.721 Hz, with a discrepancy of 6.37%.
5. Fragility Curve Estimate
5.1. Theoretical Background
A fragility function (Figure 26) specifies the probability of collapse of a structure, or the probability to attain other limit states of interest, depending upon a certain ground motion Intensity Measure IM [56], which, in this paper, is the Peak Ground Acceleration PGA. For a given set of ground motion and dynamic structural analysis results, the occurrence or non occurrence of collapse is defined by the exceed of a given displacement.
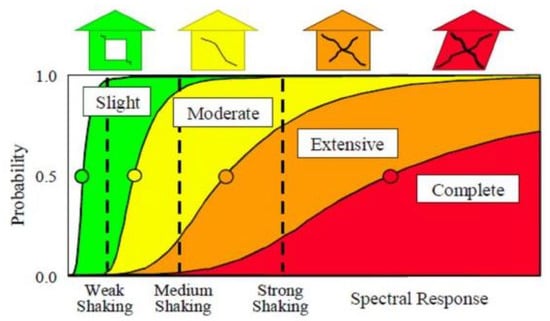
Figure 26.
Example of a fragility functions, as reported in FEMA.
According to FEMA [57], the damage limit states, , are given by the expression in Equation (8).
where and are the yielding and the ultimate displacements, defined in accordance with the legislation indications [20,58]. A log-normal cumulative distribution function is used to fit the fragility function with data collected from Non Linear Dynamic Analysis, NLDA [56,59]:
where is the probability of structure collapse due to a ground motion ; indicates the standard normal cumulative distribution function (CDF); is the median of the fragility function (the IM level with 50% probability of collapse); and is the standard deviation of ln IM.
A truncated incremental dynamic analysis were carried out. Whereupon the parameters and were estimated, following an alternative procedure [56], by varying the parameters until a certain likelihood function is maximized.
Specifically, the estimation of the parameter was performed by maximizing the logarithm of the following likelihood function:
where the superscript indicates an estimated parameter, the standard normal distribution PDF, n the number of ground motion used in the Non Linear Dynamic Analysis, m the number of ground motions that caused collapse at levels lower than , the standard normal distribution CDF.
5.2. Fragility Curve
The parameters of Equation (10) were estimated using a standard set of earthquakes listed in Table 5.
Table 5.
List of the earthquakes adopted in the analysis.
The resulting two parameters of the fragility function, for all considered seismic scenarios, were revealed by taking the mean of all the couples of parameters, estimated from each truncated Non Linear Dynamic Analysis.
Figure 27 shows the fragility curves obtained from the above procedure. The X-direction is more vulnerable than the Y-direction. The earthquake action yields significant drifts in each direction of application, see Figure 27a,b. Conversely, the drifts are negligible in the perpendicular direction and give lower failure probabilities, see Figure 27c,d. As already discussed, the restoration works not affected the walls homogeneously, leading to different mechanical parameters of the masonry of the wall in the two directions. Moreover, the openings are different in terms of position and size in the two directions, influencing the in-plane capacity of the walls. Conclusively, the horizontal restrain offered by the surrounding building is not the same for the facade and nave wall. This evidence lead to the difference of collapse probabilities in the two directions.
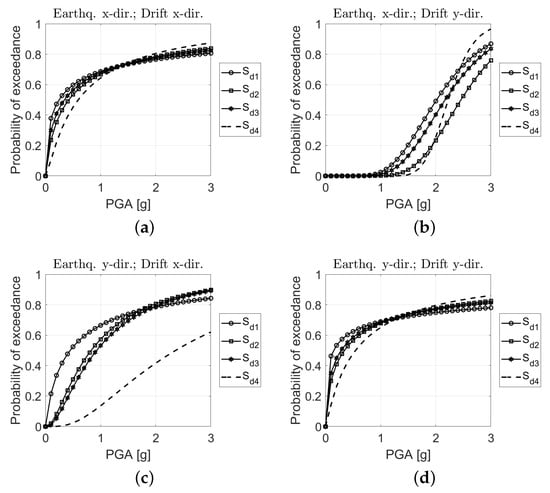
Figure 27.
Fragility curves of the masonry tower based on numerical results: (a) Earthquake in X direction, drift in X direction; (b) Earthquake in X direction, drift in Y direction; (c) Earthquake in Y direction, drift in X direction; (d) Earthquake in Y direction, drift in Y direction.
6. Concluding Remarks
The occurred damage of MTs, after a seismic event, highlight their vulnerabilities and the low seismic safety level, requiring in-depth knowledge of the structure to determine appropriate strengthening measure. The cultural and historical value with the uncertainties inherent in Mts leads to the need for an experimental diagnostic campaign that reveals valuable information of the structure which are challenging to detect from visual inspection. Thus, dynamic experimental data allow to refine and update a numerical model in order to estimate the real structural behaviour. The authors present the results obtained from an experimental investigation, which has allowed to estimate the first modal parameters of the St.Silvestro belfry, in L’Aquila (Italy), after the rehabilitation works following the 2009 earthquake. The modal updating technique led to the calibration of a Finite Element model using the experimental model parameters. The obtained elastic modulo, = 3540 MPa and = 3360 MPa, fall into a satisfactory range of values, corroborating the effectiveness of the strengthening measure carried out. The diagonal Modal Assurance Criterion values evaluated between numerical and experimental modes were equal to 0.782 and 0.885 respectively, demonstrating the reliability of the numerical model to grasp the seismic performance of the structure. The refined model was used to derive fragility functions from nonlinear dynamic analyses. The fragility estimation highlighted different probabilities of collapse in the two directions of the earthquake. The most vulnerable direction is the X direction. Additionally the fragility curves revealed peculiar evidences: the earthquake action yields significant drifts in each direction of application. Conversely, the drifts are negligible in the perpendicular direction and give lower failure probabilities.
The knowledge of the actual dynamic properties and the probabilities of collapse could be used to predict the possible damage, during the service conditions or after a future earthquake.
Author Contributions
Conceptualization, I.C., R.C. and A.A.; methodology, R.A. and F.D.F.; software, I.C., R.C., A.A., R.A. and F.D.F.; validation, R.A., F.D.F., and M.F.; writing—original draft preparation, I.C.and A.A.; writing—review and editing, R.A. and M.F.; supervision, R.A., F.D.F. and M.F. All authors have read and agreed to the published version of the manuscript.
Funding
This research received no external funding.
Institutional Review Board Statement
Not applicable.
Informed Consent Statement
Not applicable.
Data Availability Statement
The data presented in this study are available on request from the corresponding author.
Acknowledgments
The authors would like to thank the Fine Art Authority for providing the geometric survey of the monumental complex of St.Silvestro, the photos taken after the damage due to the 2009 earthquake, the results of the diagnostic campaign and some additional information.
Conflicts of Interest
The authors declare no conflict of interest.
Sample Availability
Samples of the compounds are available from the authors.
References
- Torelli, G.; D’Ayala, D.; Betti, M.; Bartoli, G. Analytical and numerical seismic assessment of heritage masonry towers. Bull. Earthq. Eng. 2020, 18, 969–1008. [Google Scholar] [CrossRef]
- Azzara, R.; Girardi, M.; Padovani, C.; Pellegrini, D.; Robol, L. Fe Model Updating of Masonry Towers: Modeling and Numerical Issues. 2020. Available online: https://openportal.isti.cnr.it/data/2020/436119/2020_%20436119.published.pdf (accessed on 16 March 2021).
- Pena, F.; Lourenco, P.; Mendes, N.; Oliveira, D. Numerical models for the seismic assessment of an old masonry tower. Eng. Struct. 2010, 32, 1466–1478. [Google Scholar] [CrossRef]
- Ferrante, A.; Clementi, F.; Milani, G. Dynamic Behavior of an Inclined Existing Masonry Tower in Italy. Front. Built Environ. 2019, 5, 16. [Google Scholar] [CrossRef]
- Facchini, L.; Gusella, V.; Betti, M. Non-Linear Dynamic Analysis for Collapse Probability Assessment of Historic Masonry Towers; Springer: Cham, Switzerland, 2020; pp. 1376–1386. [Google Scholar] [CrossRef]
- Ferraioli, M.; Lavino, A.; Abruzzese, D.; Avossa, A.M. Seismic Assessment, Repair and Strengthening of a Medieval Masonry Tower in Southern Italy. Int. J. Civ. Eng. 2020, 18, 967–994. [Google Scholar] [CrossRef]
- Milani, G.; Shehu, R.; Valente, M. A kinematic limit analysis approach for seismic retrofitting of masonry towers through steel tie-rods. Eng. Struct. 2018, 160, 212–228. [Google Scholar] [CrossRef]
- Silva, L.; Mendes, N.; Lourenco, P.; Ingham, J. Seismic Structural Assessment of the Christchurch Catholic Basilica, New Zealand. Structures 2018, 15, 115–130. [Google Scholar] [CrossRef]
- Preciado, A.; Bartoli, G.; Budelmann, H. Fundamental aspects on the seismic vulnerability of ancient masonry towers and retrofitting techniques. Earthquakes Struct. 2015, 9, 339–352. [Google Scholar] [CrossRef][Green Version]
- Preciado, A.; Bartoli, G.; Ramirez-Gaytan, A. Earthquake Protection of the Torre Grossa Medieval Tower of San Gimignano, Italy by Vertical External Prestressing. Eng. Fail. Anal. 2017, 71, 31–42. [Google Scholar] [CrossRef]
- García-Macías, E.; Ubertini, F. Seismic interferometry for earthquake-induced damage identification in historic masonry towers. Mech. Syst. Signal Process. 2019, 132, 380–404. [Google Scholar] [CrossRef]
- Azzara, R.; Girardi, M.; Iafolla, V.; Padovani, C.; Pellegrini, D. Long-Term Dynamic Monitoring of Medieval Masonry Towers. Front. Built Environ. 2020, 6. [Google Scholar] [CrossRef]
- Invernizzi, S.; Lacidogna, G.; Lozano-Ramírez, N.; Carpinteri, A. Structural monitoring and assessment of an ancient masonry tower. Eng. Fract. Mech. 2019, 210, 429–443. [Google Scholar] [CrossRef]
- Barsocchi, P.; Bartoli, G.; Betti, M.; Girardi, M.; Mammolito, S.; Pellegrini, D.; Zini, G. Wireless Sensor Networks for Continuous Structural Health Monitoring of Historic Masonry Towers. Int. J. Archit. Herit. 2020, 1–23. [Google Scholar] [CrossRef]
- Capanna, I.; Aloisio, A.; Di Fabio, F.; Fragiacomo, M. Sensitivity Assessment of the Seismic Response of a Masonry Palace via Non-Linear Static Analysis: A Case Study in L’Aquila (Italy). Infrastructures 2021, 6, 8. [Google Scholar] [CrossRef]
- Ministero dei beni e delle attività culturali e del turismo, C.n. Linee Guida per la Valutazione e Riduzione del Rischio Sismico del Patrimonio Culturale Allineate alle Nuove Norme Tecniche per le Costruzioni (D.M. 14 Gennaio 2008); Gangemi Editore spa: Roma, Italy, 2010. [Google Scholar]
- Lagomarsino, S.; Podesta, S. Damage and Vulnerability Assessment of Churches after the 2002 Molise, Italy, earthquake. Earthq. Spectra 2004, 20, S271–S283. [Google Scholar] [CrossRef]
- Doglioni, F.; Moretti, A.; Petrini, V. Le Chiese e il Terremoto [Churches and Earthquake]; Edizioni Lint: Trieste, Italy, 1994. [Google Scholar]
- Sorrentino, L.; Liberatore, L.; Decanini, L.D.; Liberatore, D. The performance of churches in the 2012 Emilia Earthquake. Bull. Earthq. Eng. 2014, 12, 2299–2331. [Google Scholar] [CrossRef]
- Ministerial Decree of Public Works. Updating of Technical codes for constructions. M.D. 17/01/2018. Official Gazzette of the Italian Republic n.42, 20 February 2018. (In Italian) [Google Scholar]
- Ministerial Decree n.7. Instructions for the Application of the Updating. Technical Codes for Constructions. M.D. 17/01/2018. Official Gazzette of the Italian Republic, n.7, 17 January 2019. (In Italian) [Google Scholar]
- Diaferio, M.; Foti, D.; Potenza, F. Prediction of the fundamental frequencies and modal shapes of historic masonry towers by empirical equations based on experimental data. Eng. Struct. 2018, 156, 433–442. [Google Scholar] [CrossRef]
- Ranieri, C. On the Estimation of the Fundamental Modal Properties of Italian Historical Masonry Towers. 2014. Available online: https://iris.unimol.it/handle/11695/48344 (accessed on 16 March 2021).
- Gentile, C.; Saisi, A. Radar-based vibration measurement on historic masonry towers. In Emerging Technologies in Non-Destructive Testing V-Proceedings of the 5th Conference on Emerging Technologies in NDT; CRC Press: Boca Raton, FL, USA, 2012; pp. 51–56. [Google Scholar] [CrossRef]
- Ramos, L.F.; Marques, L.; Lourenço, P.B.; De Roeck, G.; Campos-Costa, A.; Roque, J. Monitoring historical masonry structures with operational modal analysis: Two case studies. Mech. Syst. Signal Process. 2010, 24, 1291–1305. [Google Scholar] [CrossRef]
- Rainieri, C.; Fabbrocino, G. Predictive correlations for the estimation of the elastic period of masonry towers. In Proceedings of the 4th International Conference on Experimental Vibration Analysis for Civil Engineering Structures–EVACES, Varenna, Italy, 3–5 October 2011. [Google Scholar]
- Alaggio, R.; Aloisio, A.; Antonacci, E.; Cirella, R. Two-years static and dynamic monitoring of the santa maria di collemaggio basilica. Constr. Build. Mater. 2021, 268, 121069. [Google Scholar] [CrossRef]
- Aloisio, A.; Di Battista, L.; Alaggio, R.; Antonacci, E.; Fragiacomo, M. Assessment of structural interventions using Bayesian updating and subspace-based fault detection methods: The case study of S. Maria di Collemaggio basilica, L’Aquila, Italy. Struct. Infrastruct. Eng. 2020, 17, 141–155. [Google Scholar] [CrossRef]
- Diaferio, M.; Foti, D.; Mongelli, M.; Giannoccaro, N.I.; Andersen, P. Operational modal analysis of a historic tower in Bari. In Civil Engineering Topics; Springer: Berlin/Heidelberg, Germany, 2011; Volume 4, pp. 335–342. [Google Scholar]
- Ferraioli, M.; Miccoli, L.; Abruzzese, D.; Mandara, A. Dynamic characterisation and seismic assessment of medieval masonry towers. Nat. Hazards 2017, 86, 489–515. [Google Scholar] [CrossRef]
- Gentile, C.; Saisi, A.; Cabboi, A. Structural identification of a masonry tower based on operational modal analysis. Int. J. Archit. Herit. 2015, 9, 98–110. [Google Scholar] [CrossRef]
- Milani, G.; Clementi, F. Advanced Seismic Assessment of Four Masonry Bell Towers in Italy after Operation Modal Analysis Identification. Int. J. Archit. Herit. 2019. [Google Scholar] [CrossRef]
- Pavlovic, M.; Trevisani, S.; Cecchi, A. A Procedure for the Structural Identification of Masonry Towers. J. Nondestruct. Eval. 2019, 38, 1–12. [Google Scholar] [CrossRef]
- Ranieri, C.; Fabbroncino, G. Operational modal analysis for the characterization of heritage structures. Geofizikal 2011, 28, 109–126. [Google Scholar]
- Gavini, I.C. Storia Dell’Architettura in Abruzzo; Studio bibliografico Adelmo Polla; University Park: State College, PA, USA, 1983; Volume 1. [Google Scholar]
- Aloisio, A.; Capanna, I.; Cirella, R.; Alaggio, R.; Di Fabio, F.; Fragiacomo, M. Identification and model update of the dynamic properties of the San Silvestro Belfry in L’Aquila and Estimation of Bell’s Dynamic Actions. Appl. Sci. 2020, 10, 4289. [Google Scholar] [CrossRef]
- Ceci, A.; Contento, A.; Fanale, L.; Galeota, D.; Gattulli, V.; Lepidi, M.; Potenza, F. Structural performance of the historic and modern buildings of the University of L’Aquila during the seismic events of April 2009. Eng. Struct. 2010, 32, 1899–1924. [Google Scholar] [CrossRef]
- Kaplan, H.; Bilgin, H.; Yilmaz, S.; Binici, H.; Öztas, A. Structural damages of L’Aquila (Italy) earthquake. Nat. Hazards Earth Syst. Sci. 2010, 10, 499–507. [Google Scholar] [CrossRef]
- Monaco, P.; Totani, G.; Totani, F.; Grasso, S.; Maugeri, M. Site Effects in the Urban Area of L’Aquila Damaged by the April 6, 2009 Earthquake. In Earthquake-Soil Interaction; WIT Press: Ashurst, UK, 2014; p. 71. [Google Scholar]
- Capanna, I.; Cirella, R.; Aloisio, A.; Di Fabio, F.; Fragiacomo, M. The St. Silvestro belfry in L’Aquila: From the rehabilitation works to the actual performance in terms of dynamic properties and fragility functions estimation. In Proceedings of the XI International Conference on Structural Dynamics, EURODYN2020, Athens, Greece, 23–26 November 2020. [Google Scholar]
- Aloisio, A.; Pasca, D.; Tomasi, R.; Fragiacomo, M. Dynamic identification and model updating of an eight-storey CLT building. Eng. Struct. 2020, 213, 110593. [Google Scholar] [CrossRef]
- Arun, K.; Kung, S. Balanced approximation of stochastic systems. SIAM J. Matrix Anal. Appl. 1990, 11, 42–68. [Google Scholar] [CrossRef]
- Peeters, B.; De Roeck, G. Reference-based stochastic subspace identification for output-only modal analysis. Mech. Syst. Signal Process. 1999, 13, 855–878. [Google Scholar] [CrossRef]
- Döhler, M.; Reynders, E.; Magalhaes, F.; Mevel, L.; De Roeck, G.; Cunha, A. Pre-and post-identification merging for multi-setup OMA with covariance-driven SSI. In Dynamics of Bridges; Springer: Berlin/Heidelberg, Germany, 2011; Volume 5, pp. 57–70. [Google Scholar]
- Magenes, G.; Calvi, G. In-plane seismic response of brick masonry walls. Earthq. Eng. Struct. Dyn. 1997, 26, 1091–1112. [Google Scholar] [CrossRef]
- Formisano, A.; Massimilla, A. A Novel Procedure for Simplified Nonlinear Numerical Modeling of Structural Units in Masonry Aggregates. Int. J. Archit. Herit. 2018, 12, 1162–1170. [Google Scholar] [CrossRef]
- Quagliarini, E.; Maracchini, G.; Clementi, F. Uses and limits of the Equivalent Frame Model on existing unreinforced masonry buildings for assessing their seismic risk: A review. J. Build. Eng. 2017, 10, 166–182. [Google Scholar] [CrossRef]
- Betti, M.; Galano, L.; Vignoli, A. Comparative analysis on the seismic behaviour of unreinforced masonry buildings with flexible diaphragms. Eng. Struct. 2014, 61, 195–208. [Google Scholar] [CrossRef]
- Plevris, V.; Asteris, P. Handbook of Research on Seismic Assessment and Rehabilitation of Historic Structures (2 Volumes); IGI Global: Hershey, PA, USA, 2015. [Google Scholar] [CrossRef]
- Pasticier, L.; Amadio, C.; Fragiacomo, M. Non-linear seismic analysis and vulnerability evaluation of a masonry building by means of the SAP2000 V. 10 code. Earthq. Eng. Struct. Dyn. 2008, 37, 467–485. [Google Scholar] [CrossRef]
- European Union. Design of the Structures for Earthquake Resistance—Part 1: General Rules, Seismic Actions and Rules for Buildings EC-1; European Committee for Standardization: Brussels, Belgium, 2004. [Google Scholar]
- Girardi, M.; Padovani, C.; Pellegrini, D.; Porcelli, M.; Robol, L. Finite element model updating for structural applications. J. Comput. Appl. Math. 2020, 370, 112675. [Google Scholar] [CrossRef]
- Friswell, M.; Mottershead, J.E. Finite Element Model Updating in Structural Dynamics; Springer Science & Business Media: Berlin/Heidelberg, Germany, 2013; Volume 38. [Google Scholar]
- Allemang, R.J.; Brown, D.L. A correlation coefficient for modal vector analysis. In Proceedings of the 1st international modal analysis conference. SEM, Orlando, FL, USA, 8–10 November 1982; Volume 1, pp. 110–116. [Google Scholar]
- Pastor, M.; Binda, M.; Harčarik, T. Modal assurance criterion. Procedia Eng. 2012, 48, 543–548. [Google Scholar] [CrossRef]
- Baker, J.W. Efficient analytical fragility function fitting using dynamic structural analysis. Earthq. Spectra 2015, 31, 579–599. [Google Scholar] [CrossRef]
- FEMA. Multi-hazard loss estimation methodology. In Earthquake Model/Technical Manual; The National Institute of Building Sciences (NIBS): Washington, DC, USA, 2010. [Google Scholar]
- Aloisio, A.; Alaggio, R.; Fragiacomo, M. Fragility functions and behavior factors estimation of multi-story cross-laminated timber structures characterized by an energy-dependent hysteretic model. Earthq. Spectra 2020, 37. [Google Scholar] [CrossRef]
- Aloisio, A.; Fragiacomo, M. Reliability-based overstrength factors of cross-laminated timber shear walls for seismic design. Eng. Struct. 2021, 228, 111547. [Google Scholar] [CrossRef]
Publisher’s Note: MDPI stays neutral with regard to jurisdictional claims in published maps and institutional affiliations. |
© 2021 by the authors. Licensee MDPI, Basel, Switzerland. This article is an open access article distributed under the terms and conditions of the Creative Commons Attribution (CC BY) license (http://creativecommons.org/licenses/by/4.0/).