
Numerical Investigation on Energy Efficiency of Heat Pump with Tunnel Lining Ground Heat Exchangers under Building Cooling


Abstract
:1. Introduction
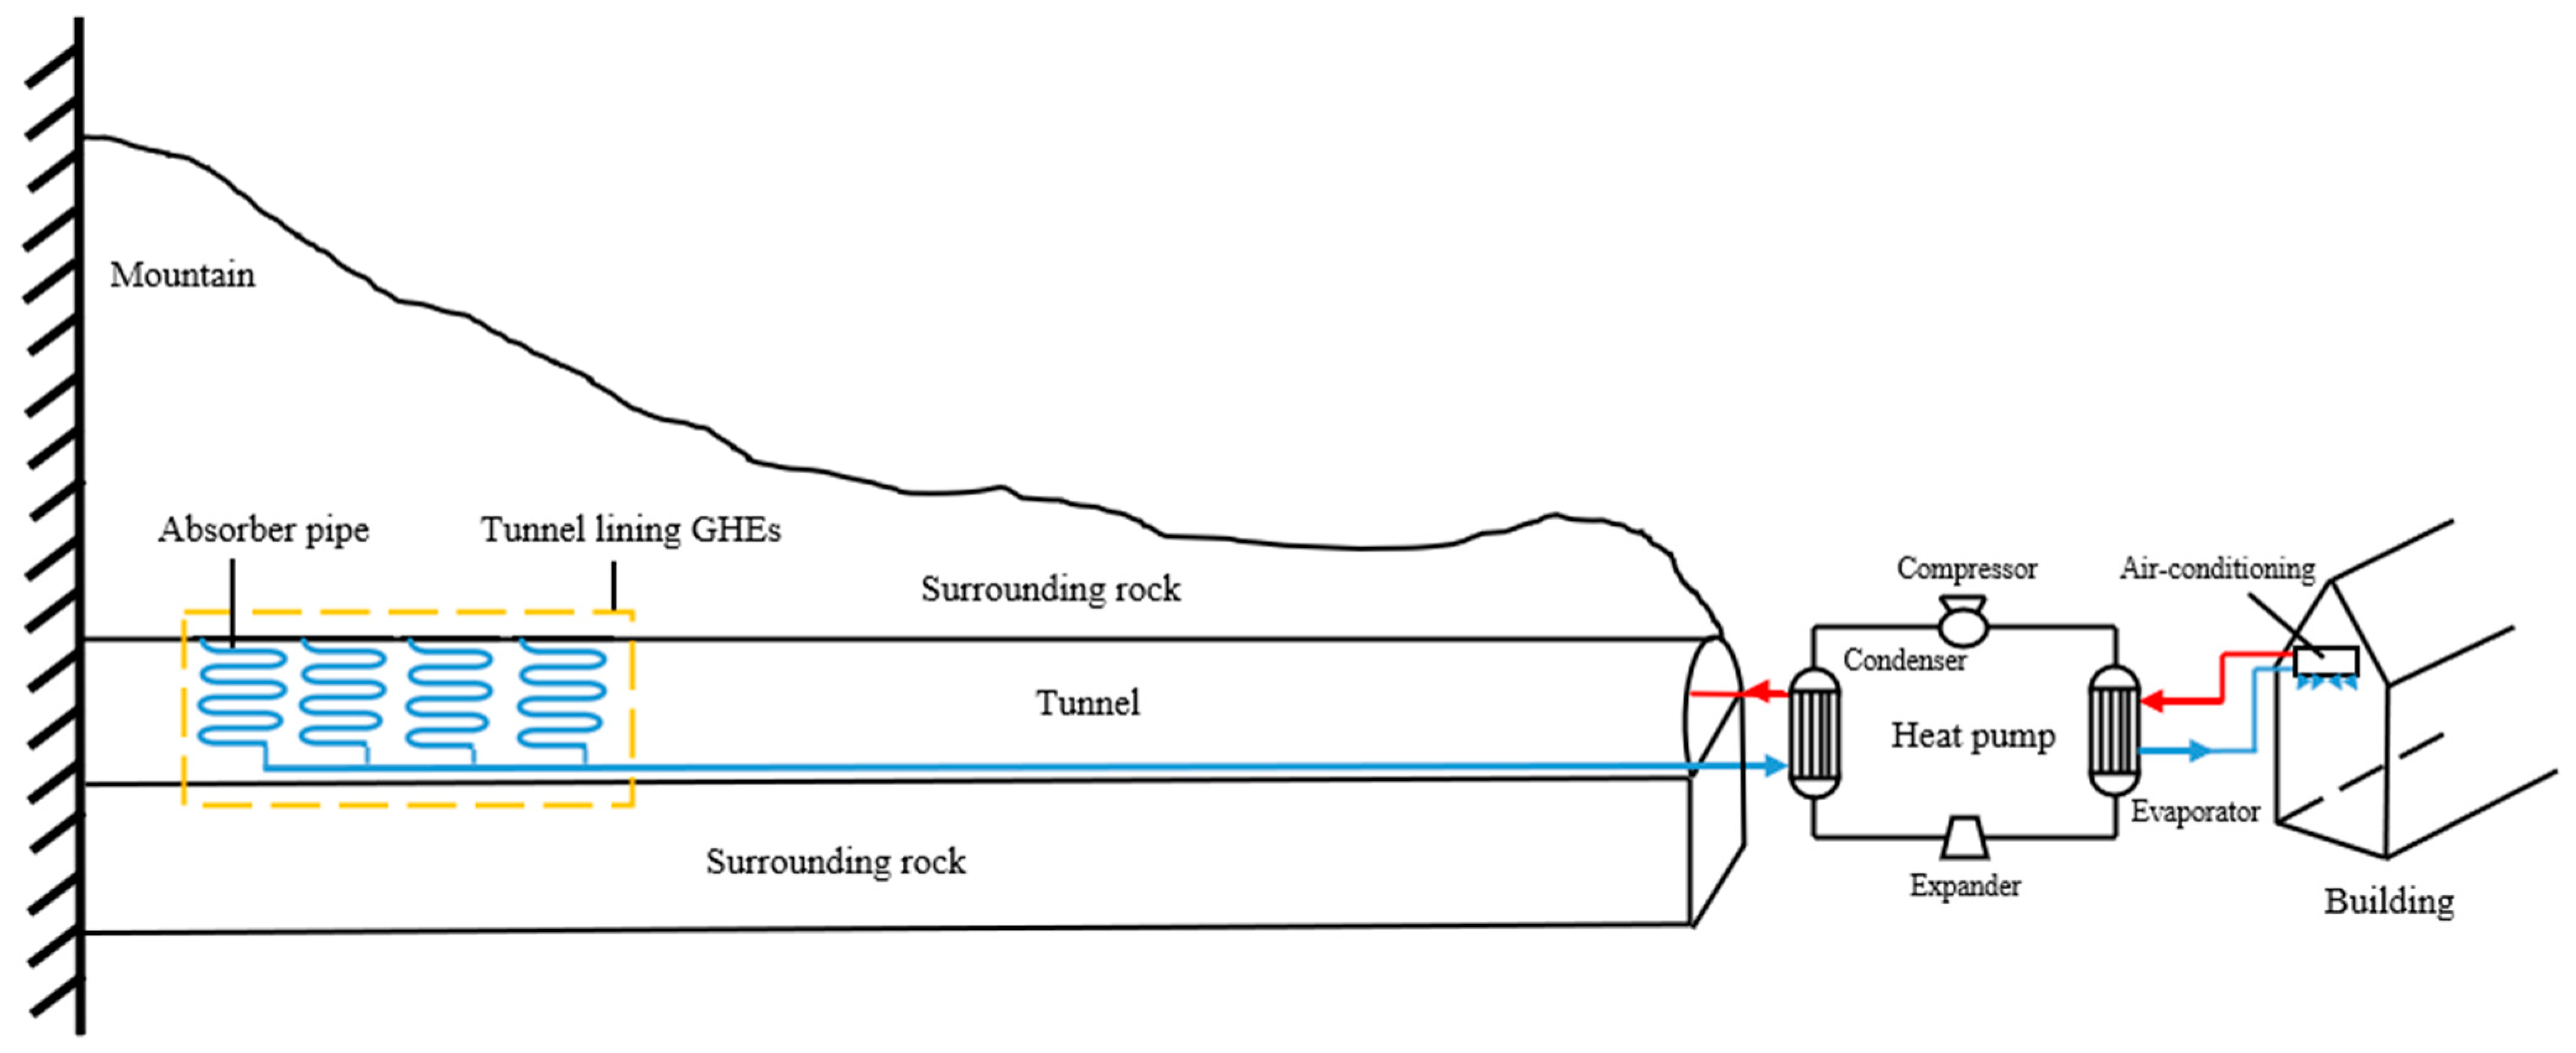
2. Methodology
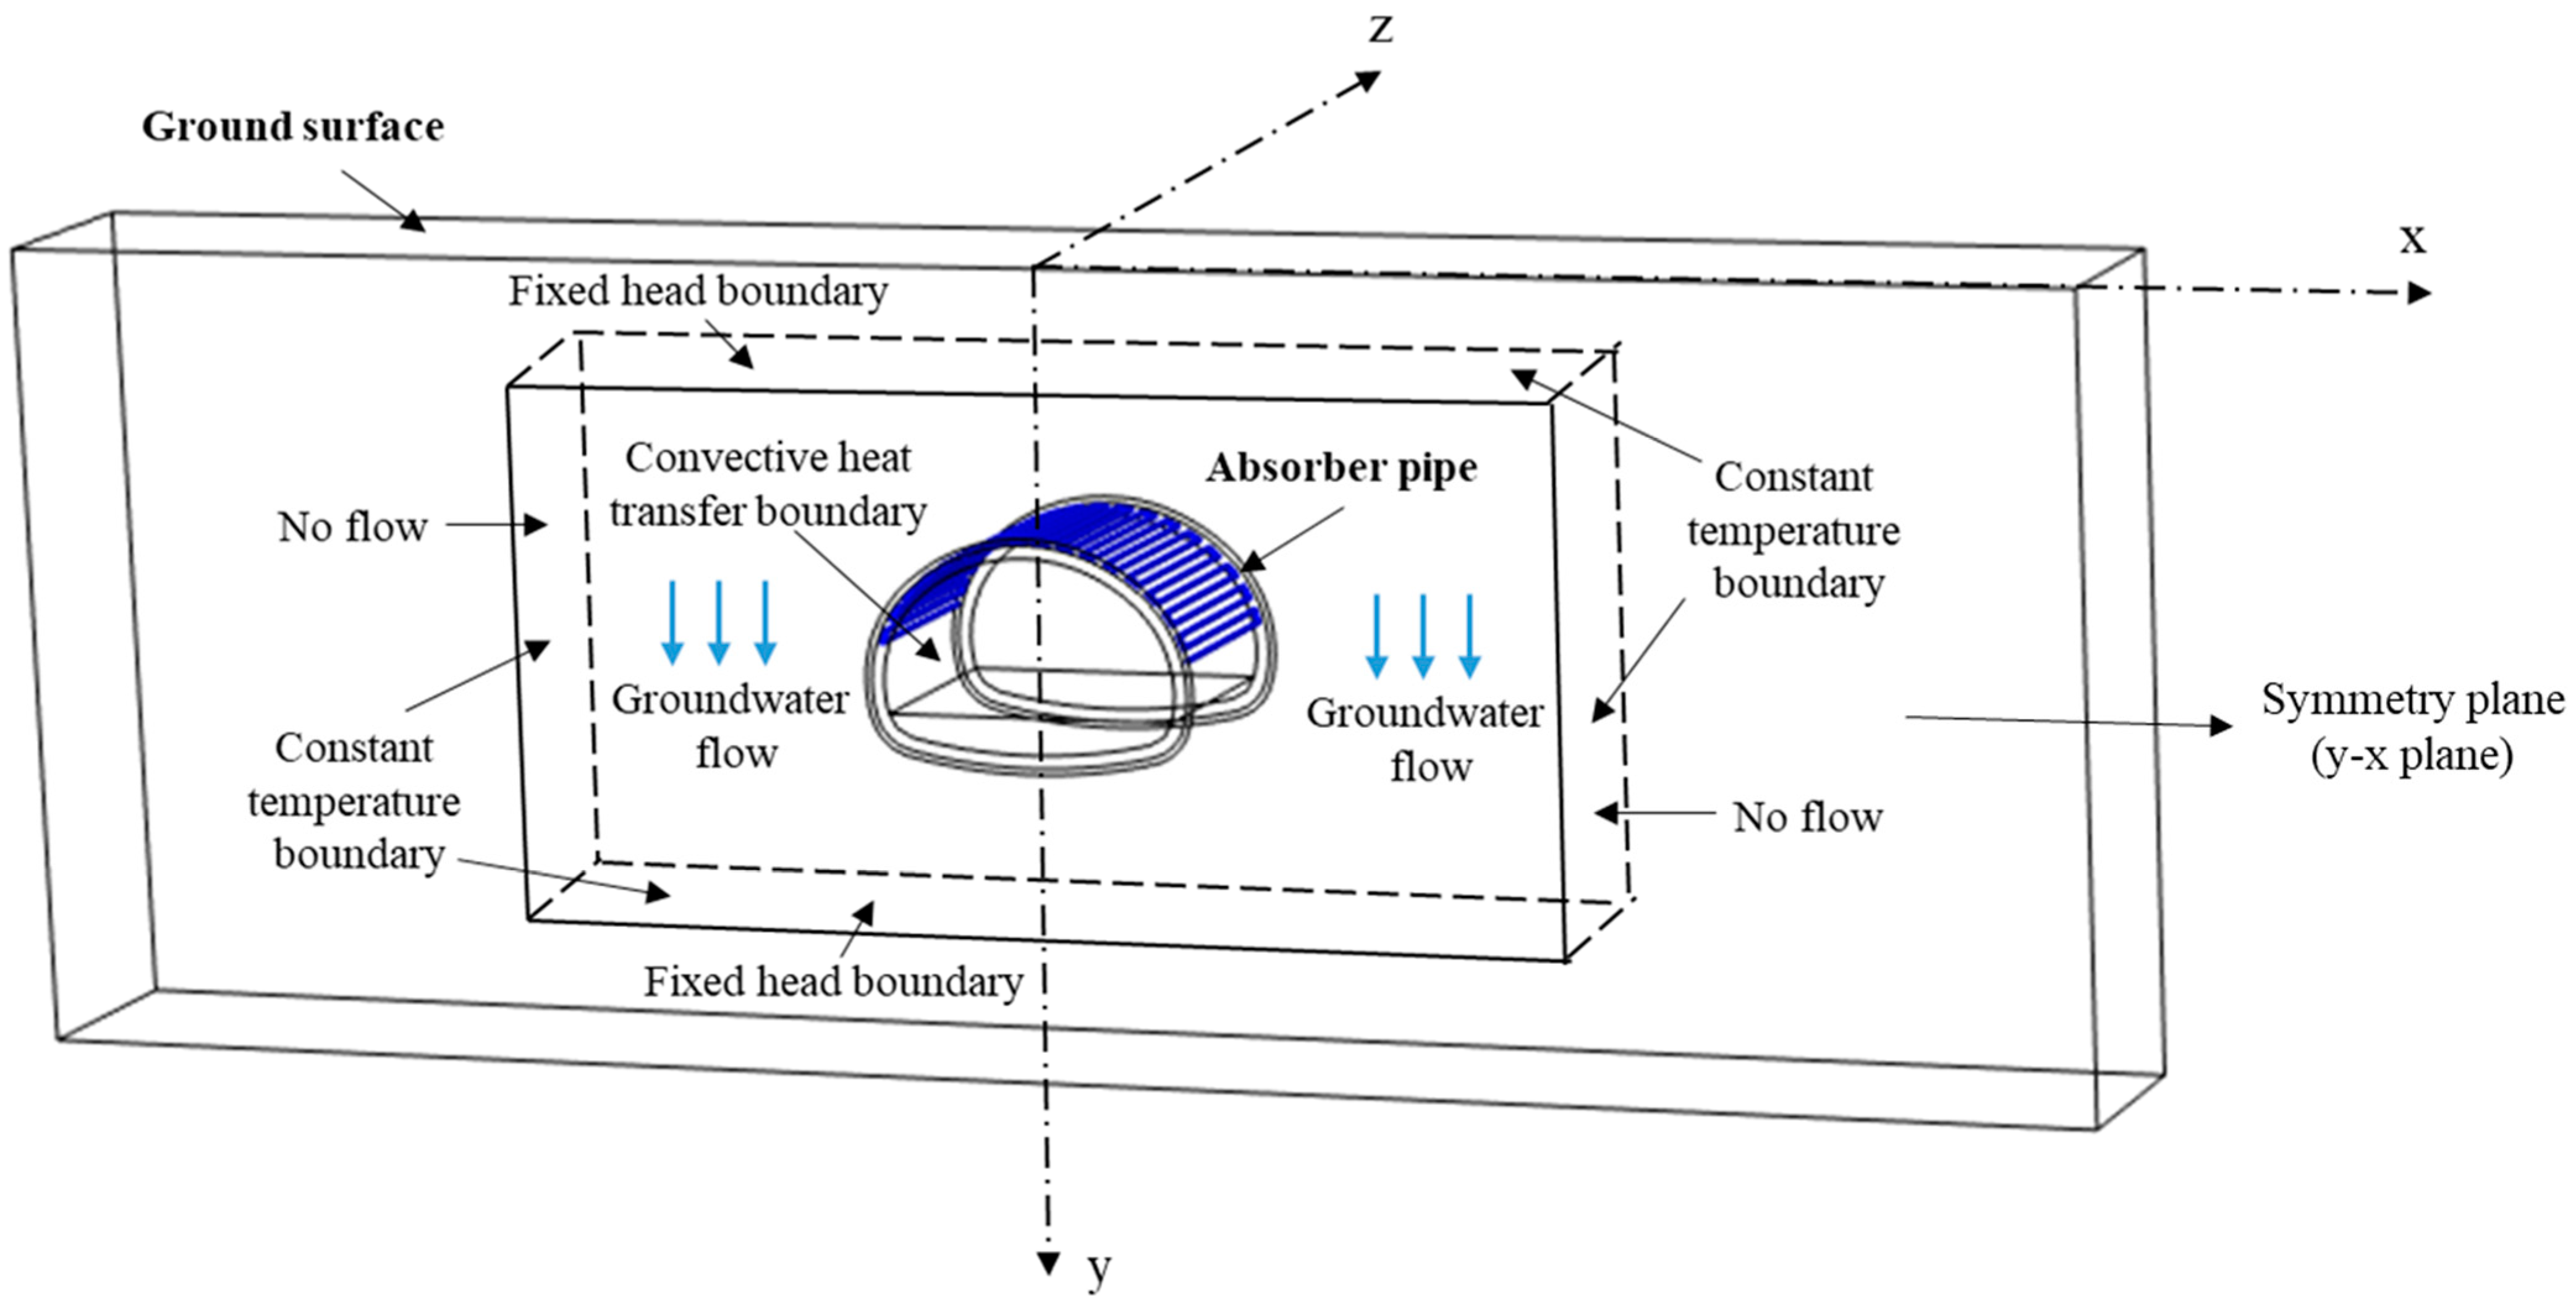
2.1. Mathematical Formulation
2.2. Initial and Boundary Conditions
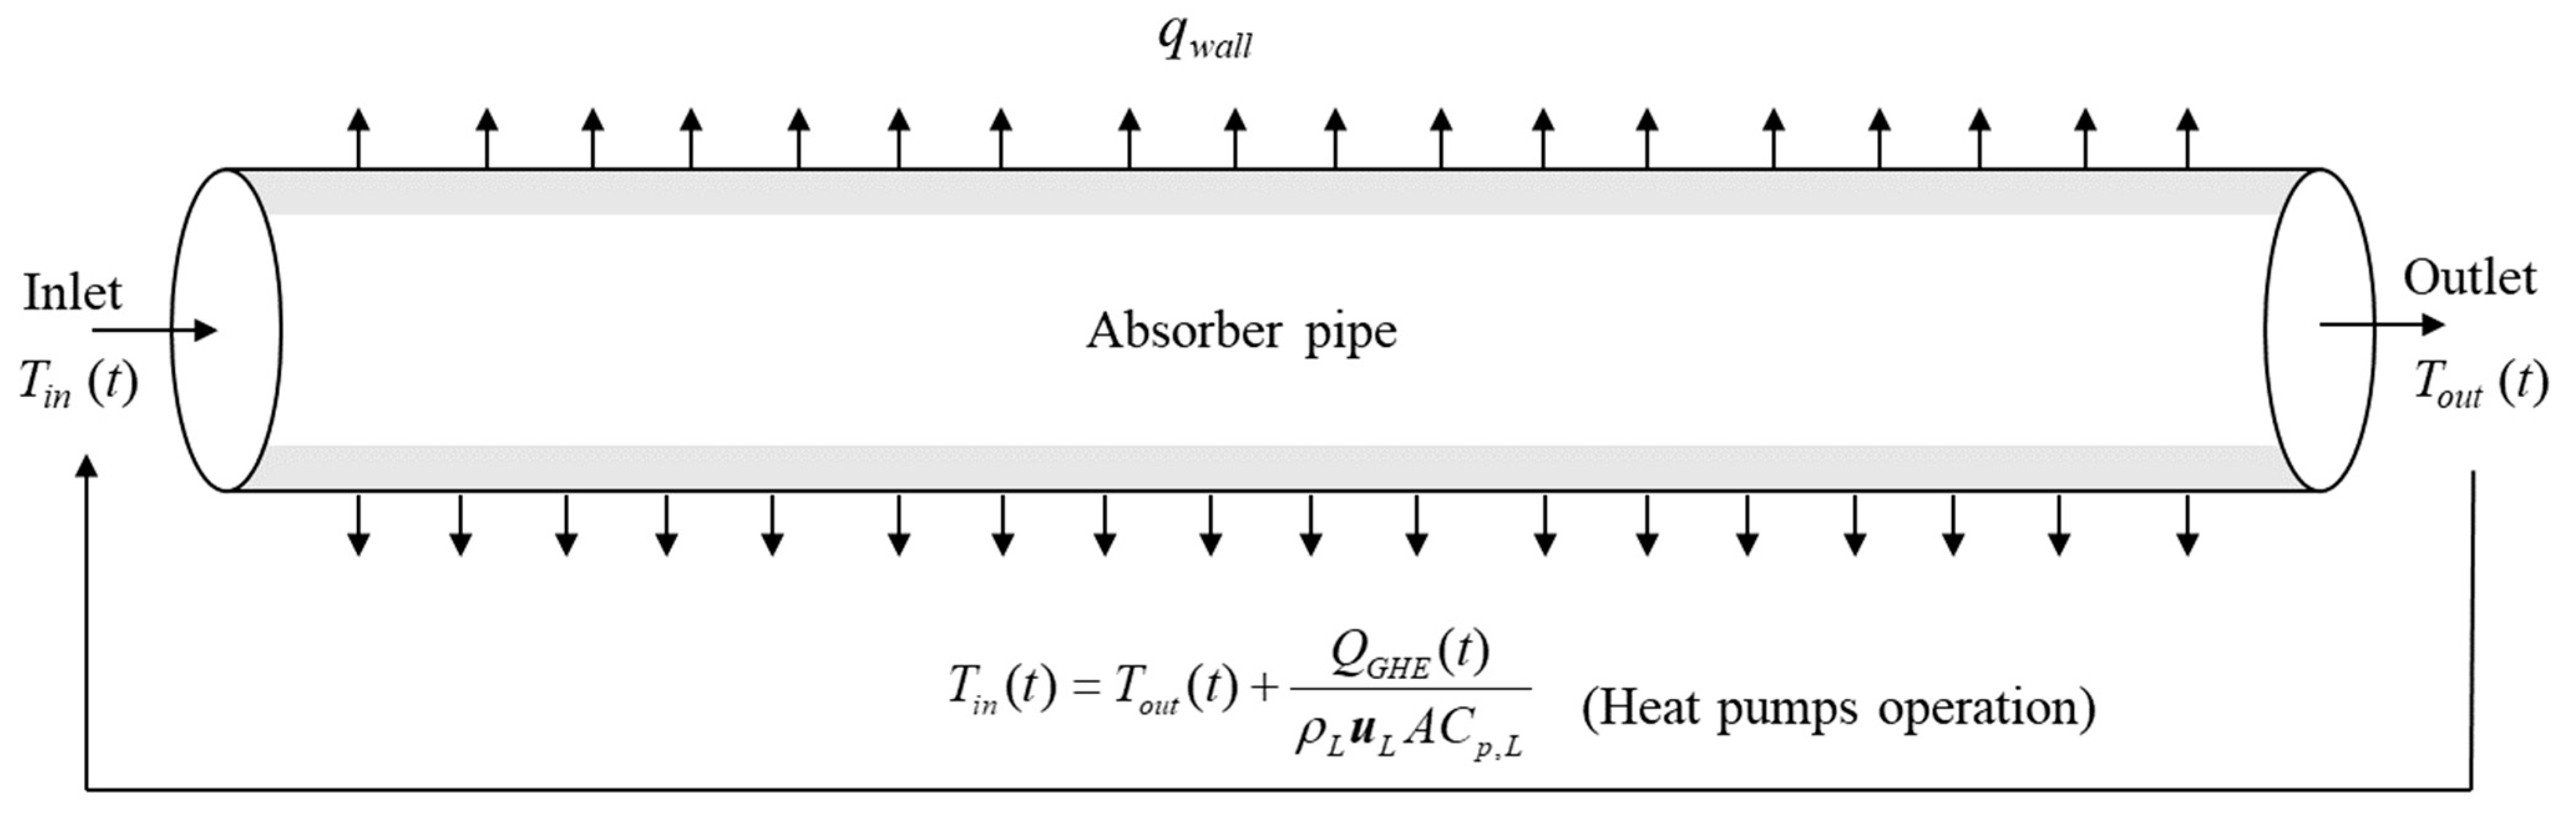
2.3. Heat Pump Integration
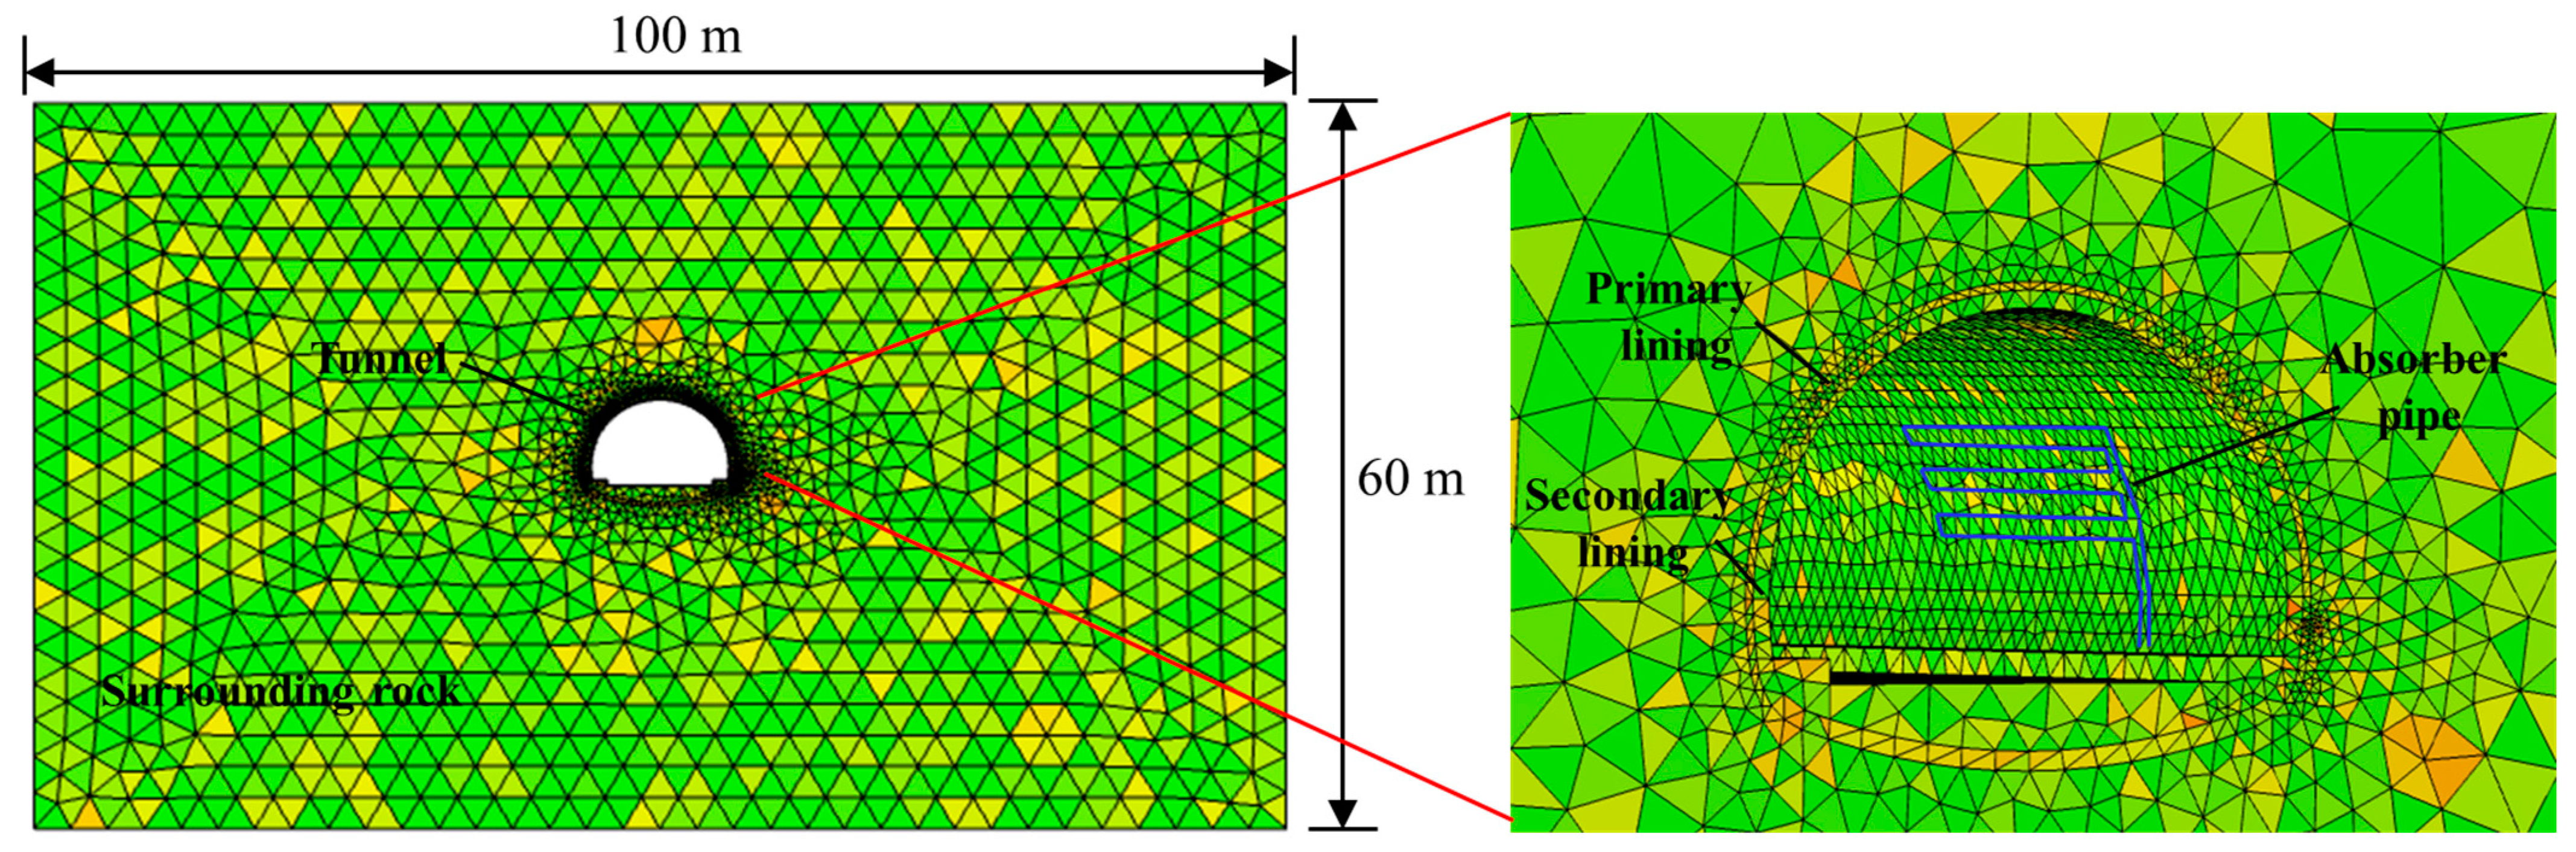
3. Numerical Model
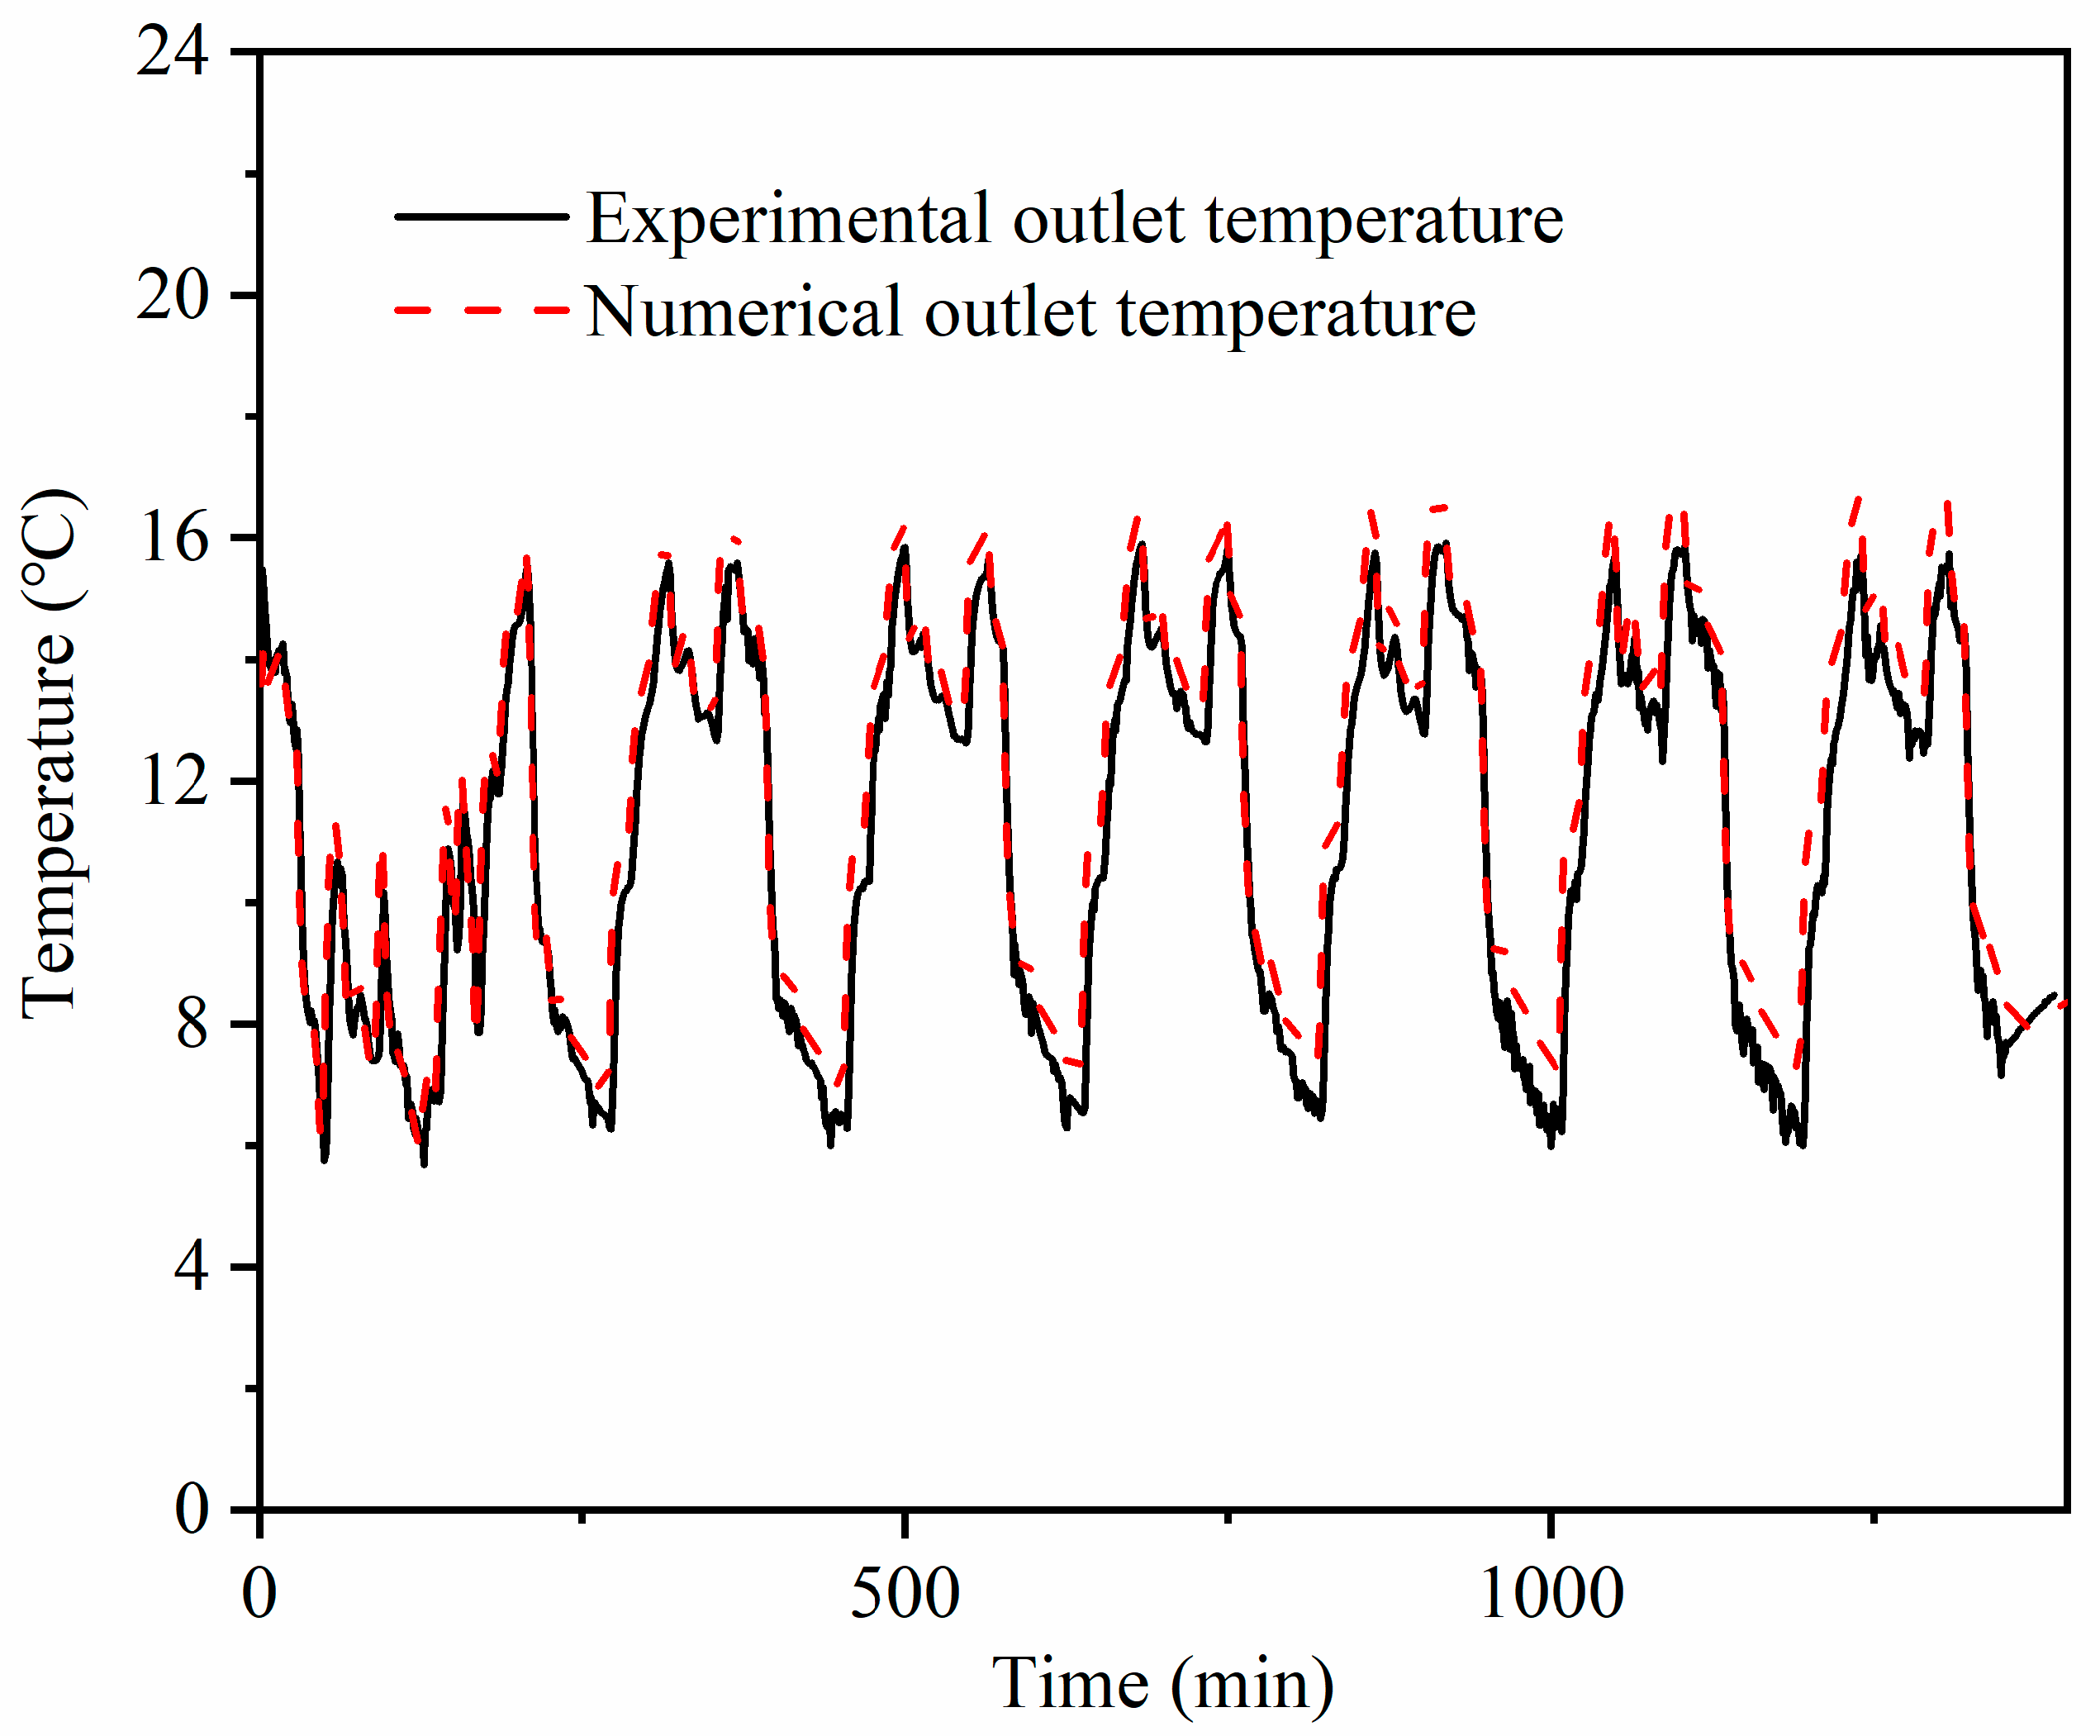
3.1. Model Validation
3.2. Parametric Numerical Study
4. Energy Efficiency of Heat Pump with Tunnel Lining GHEs
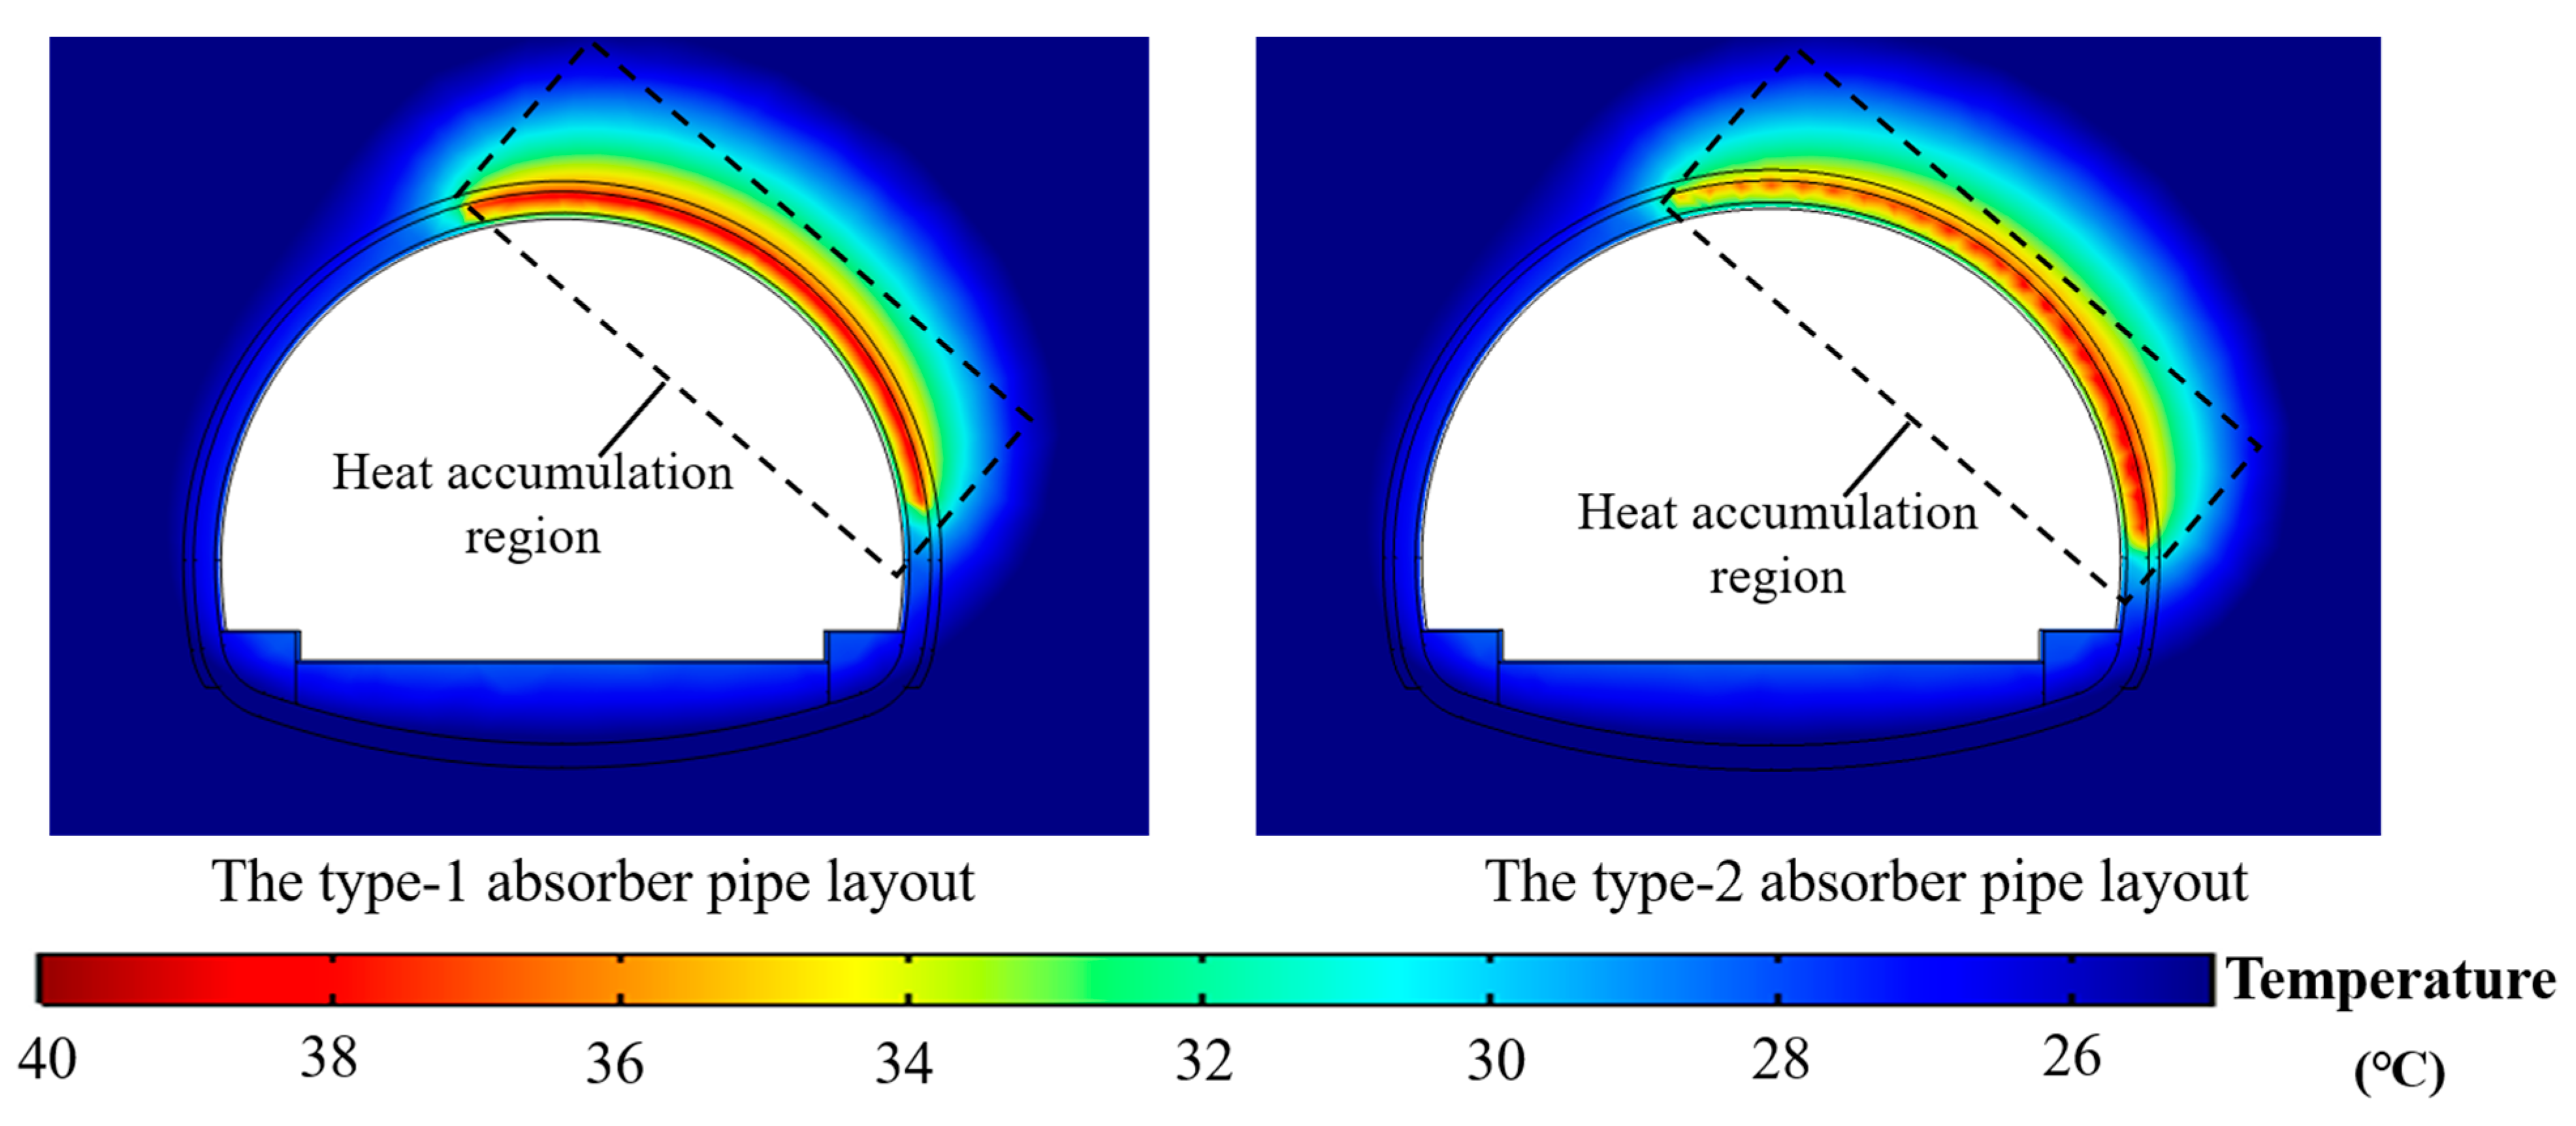
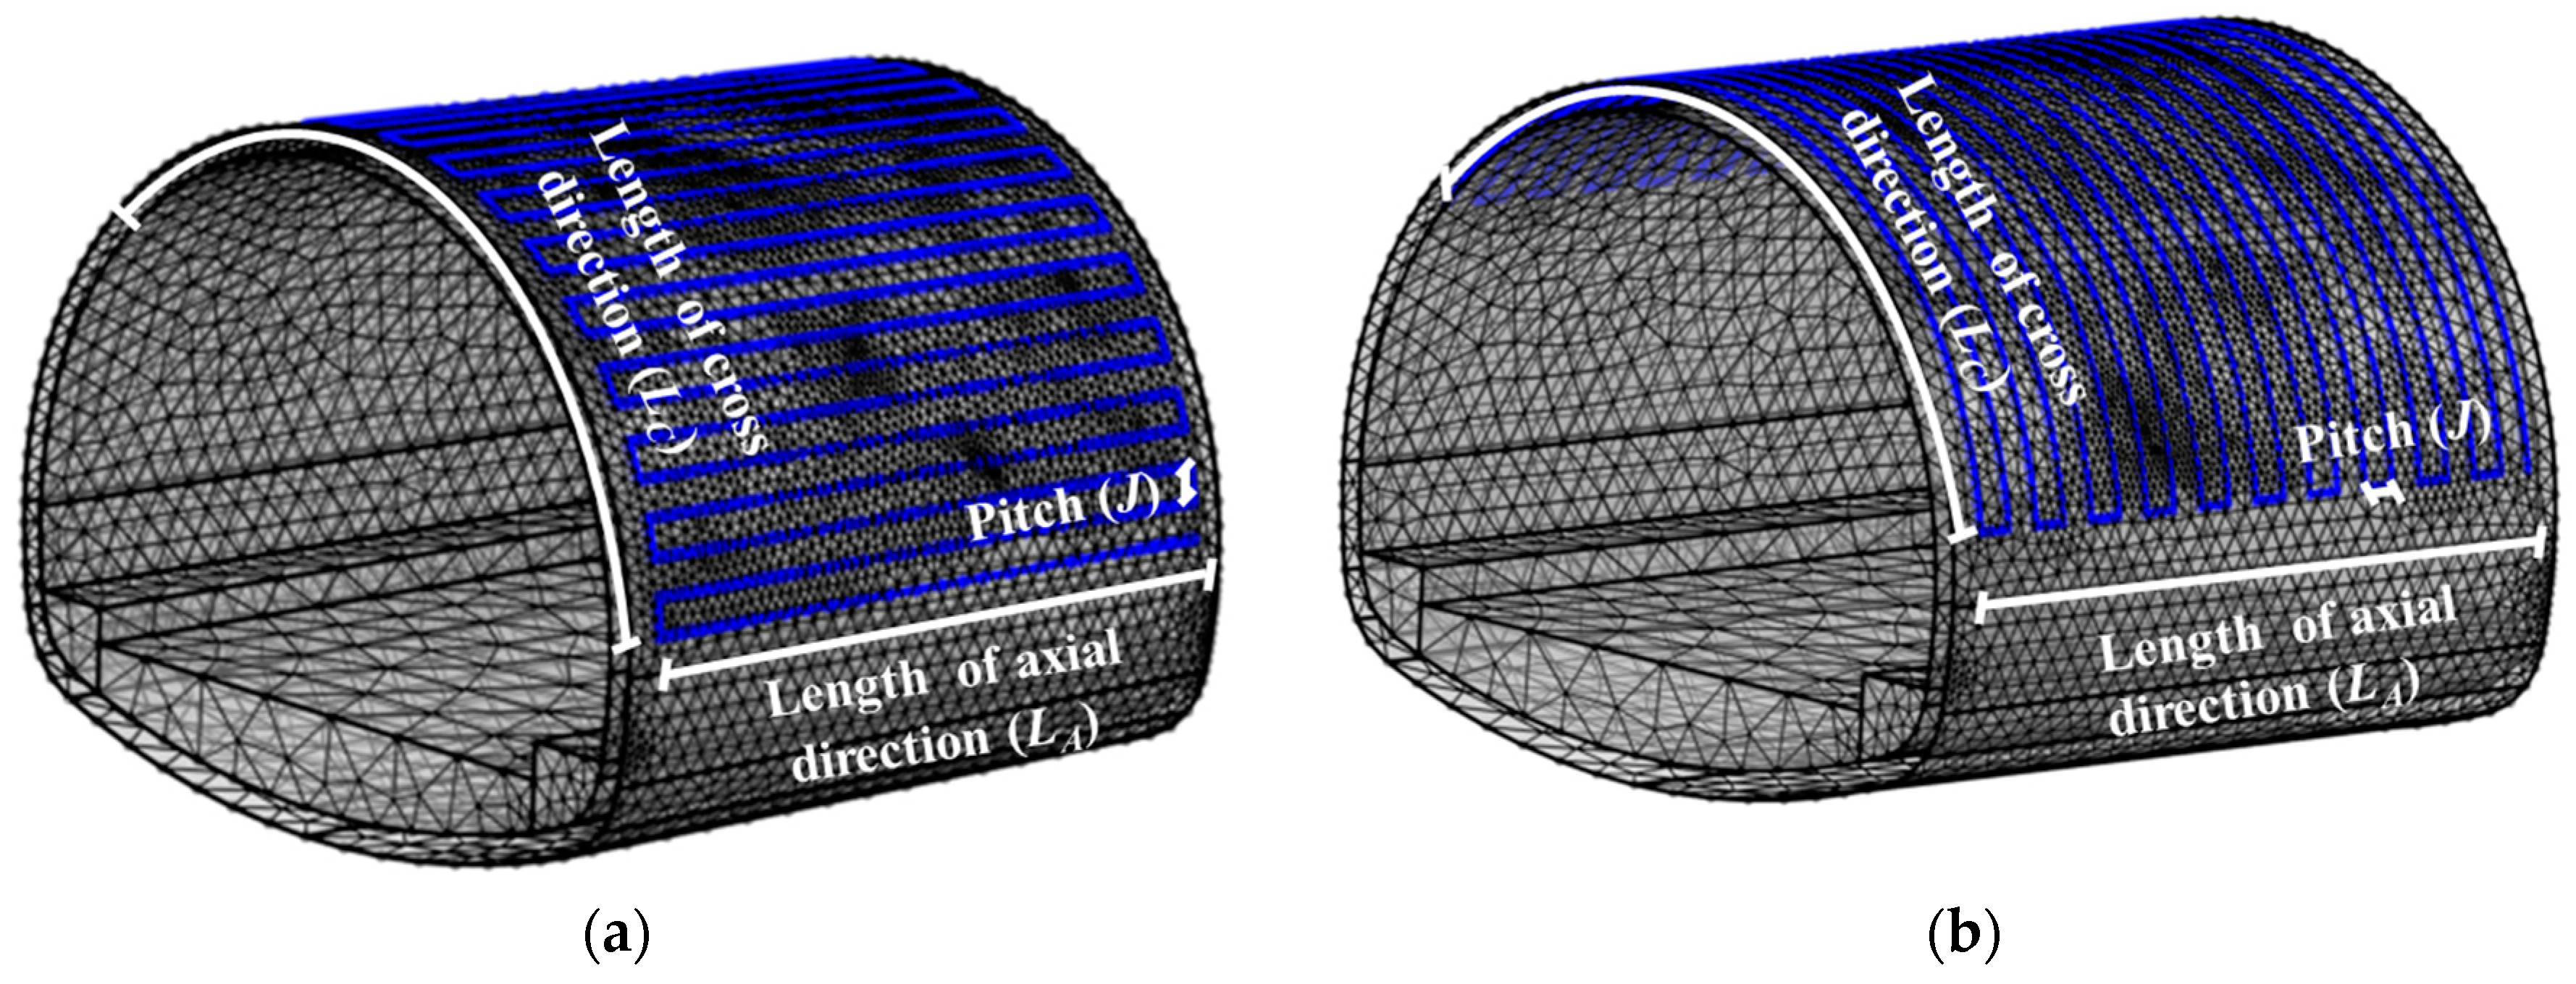
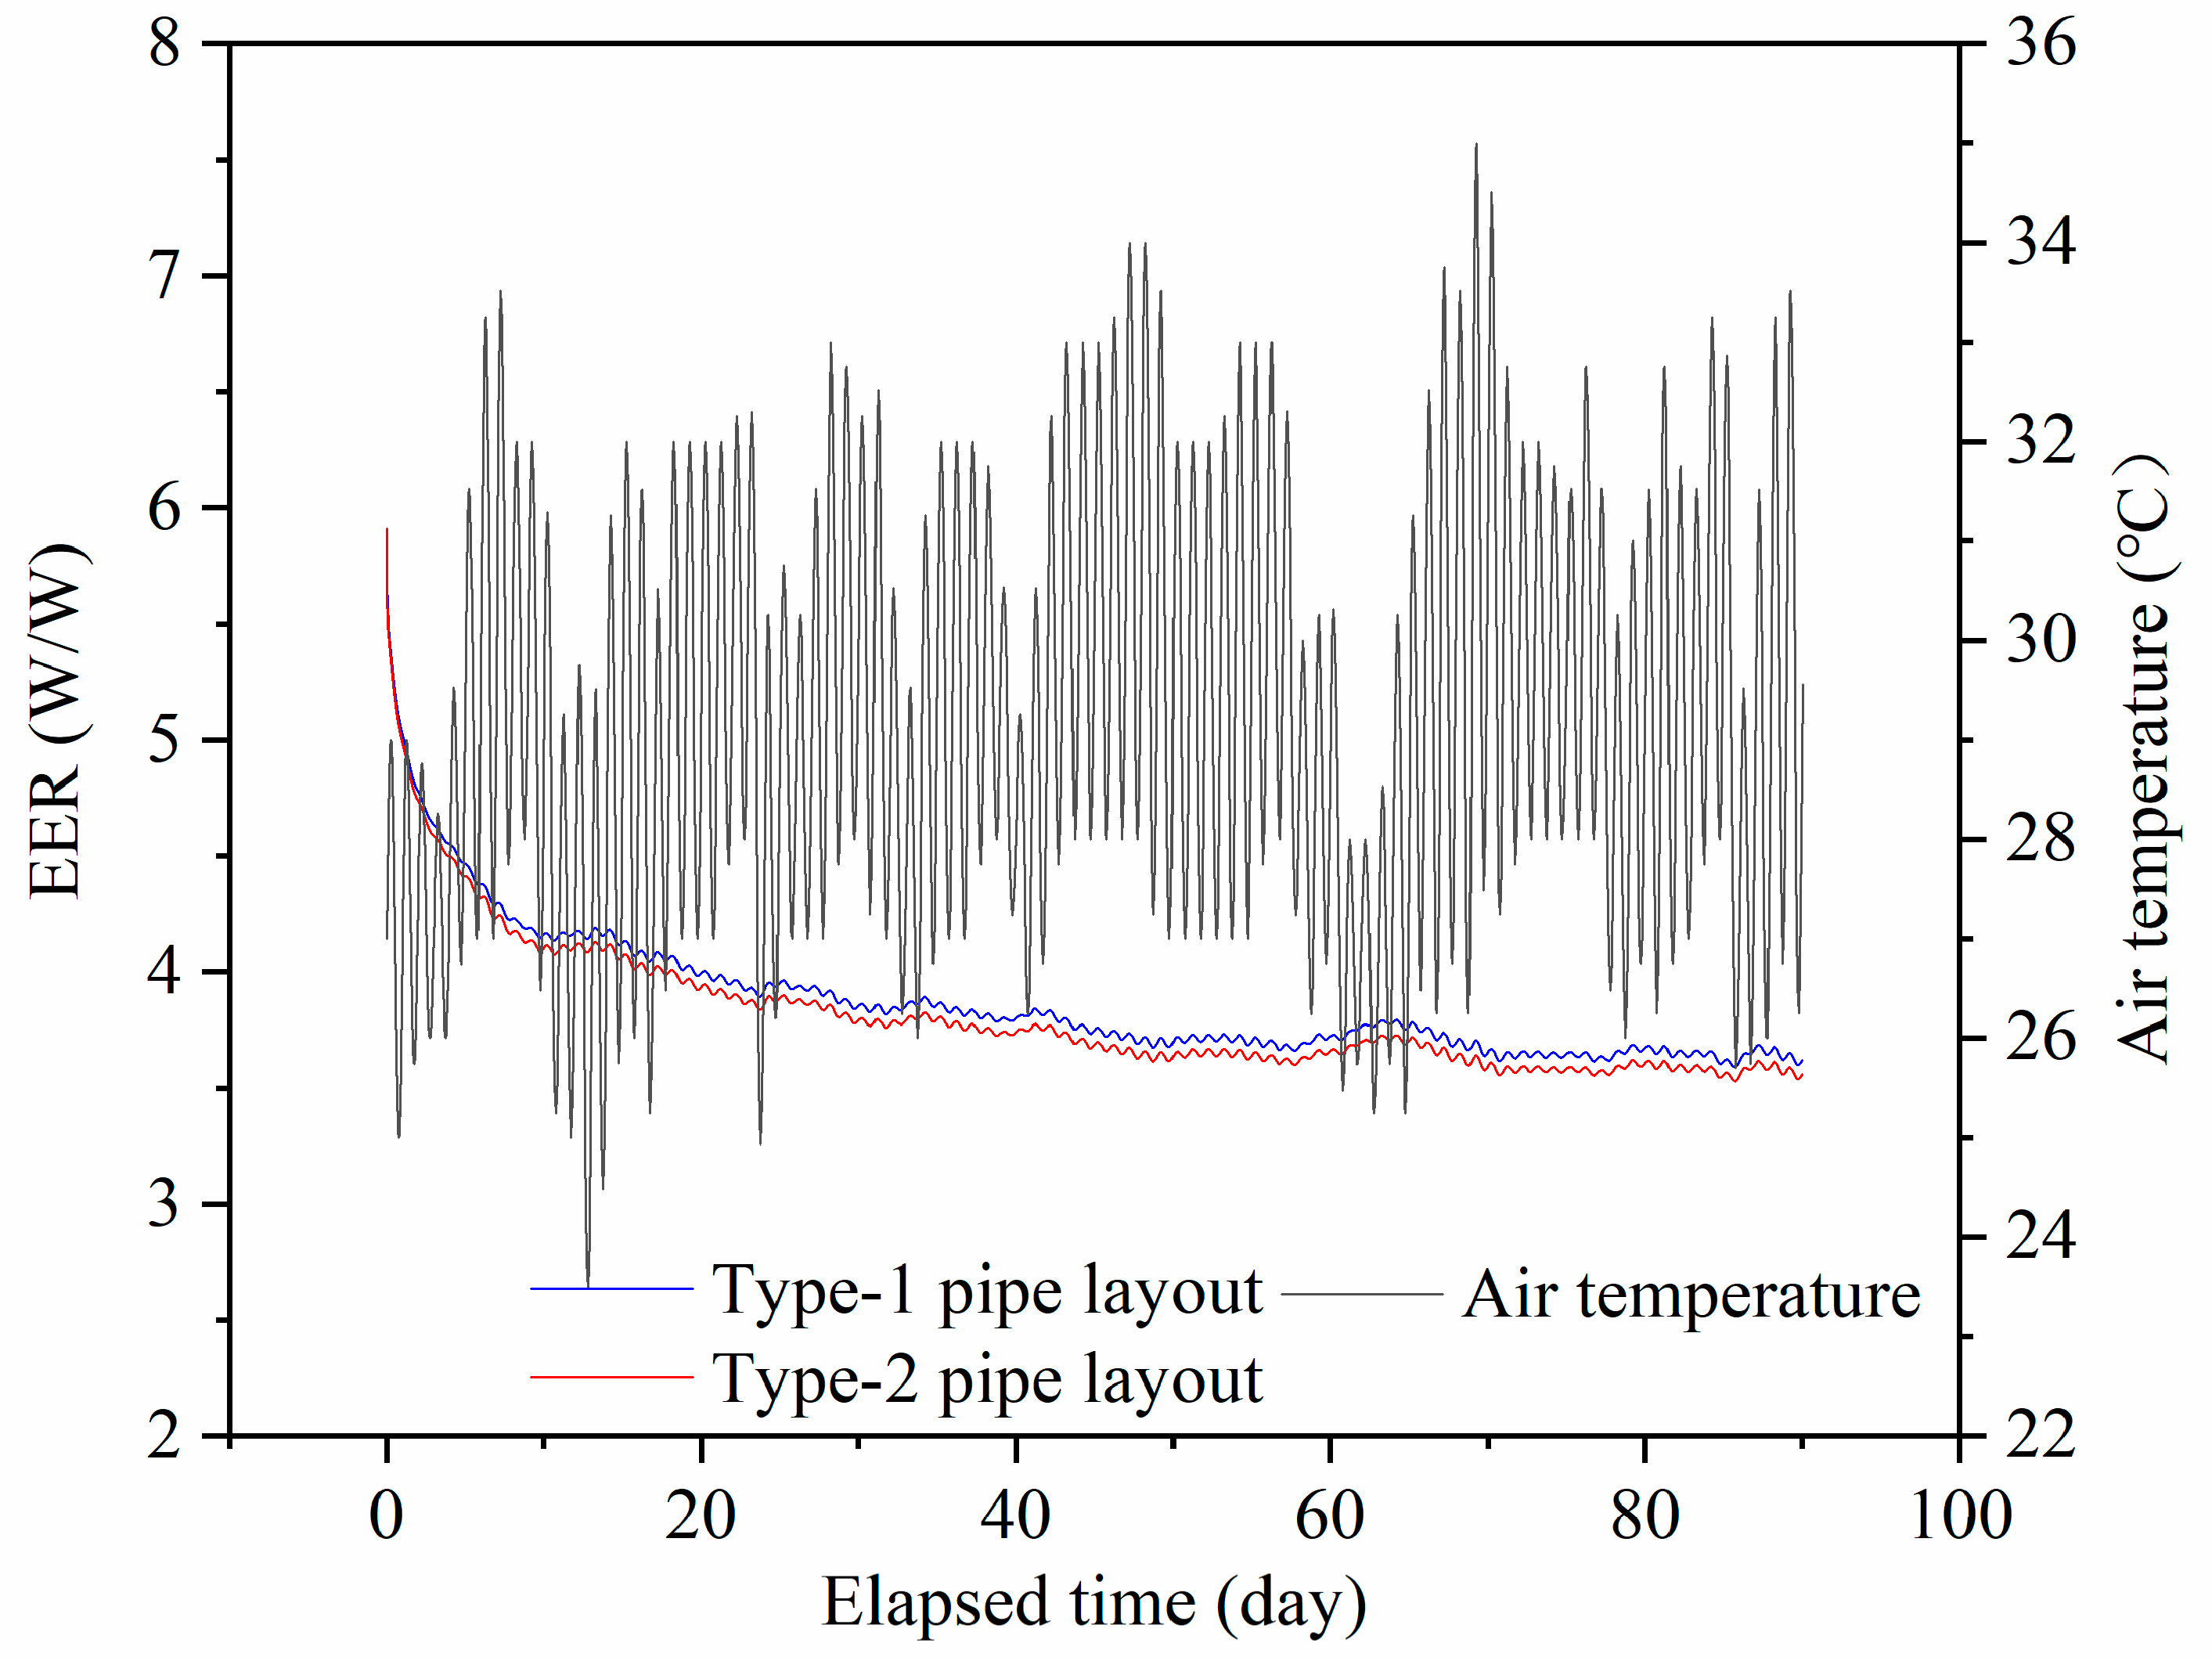
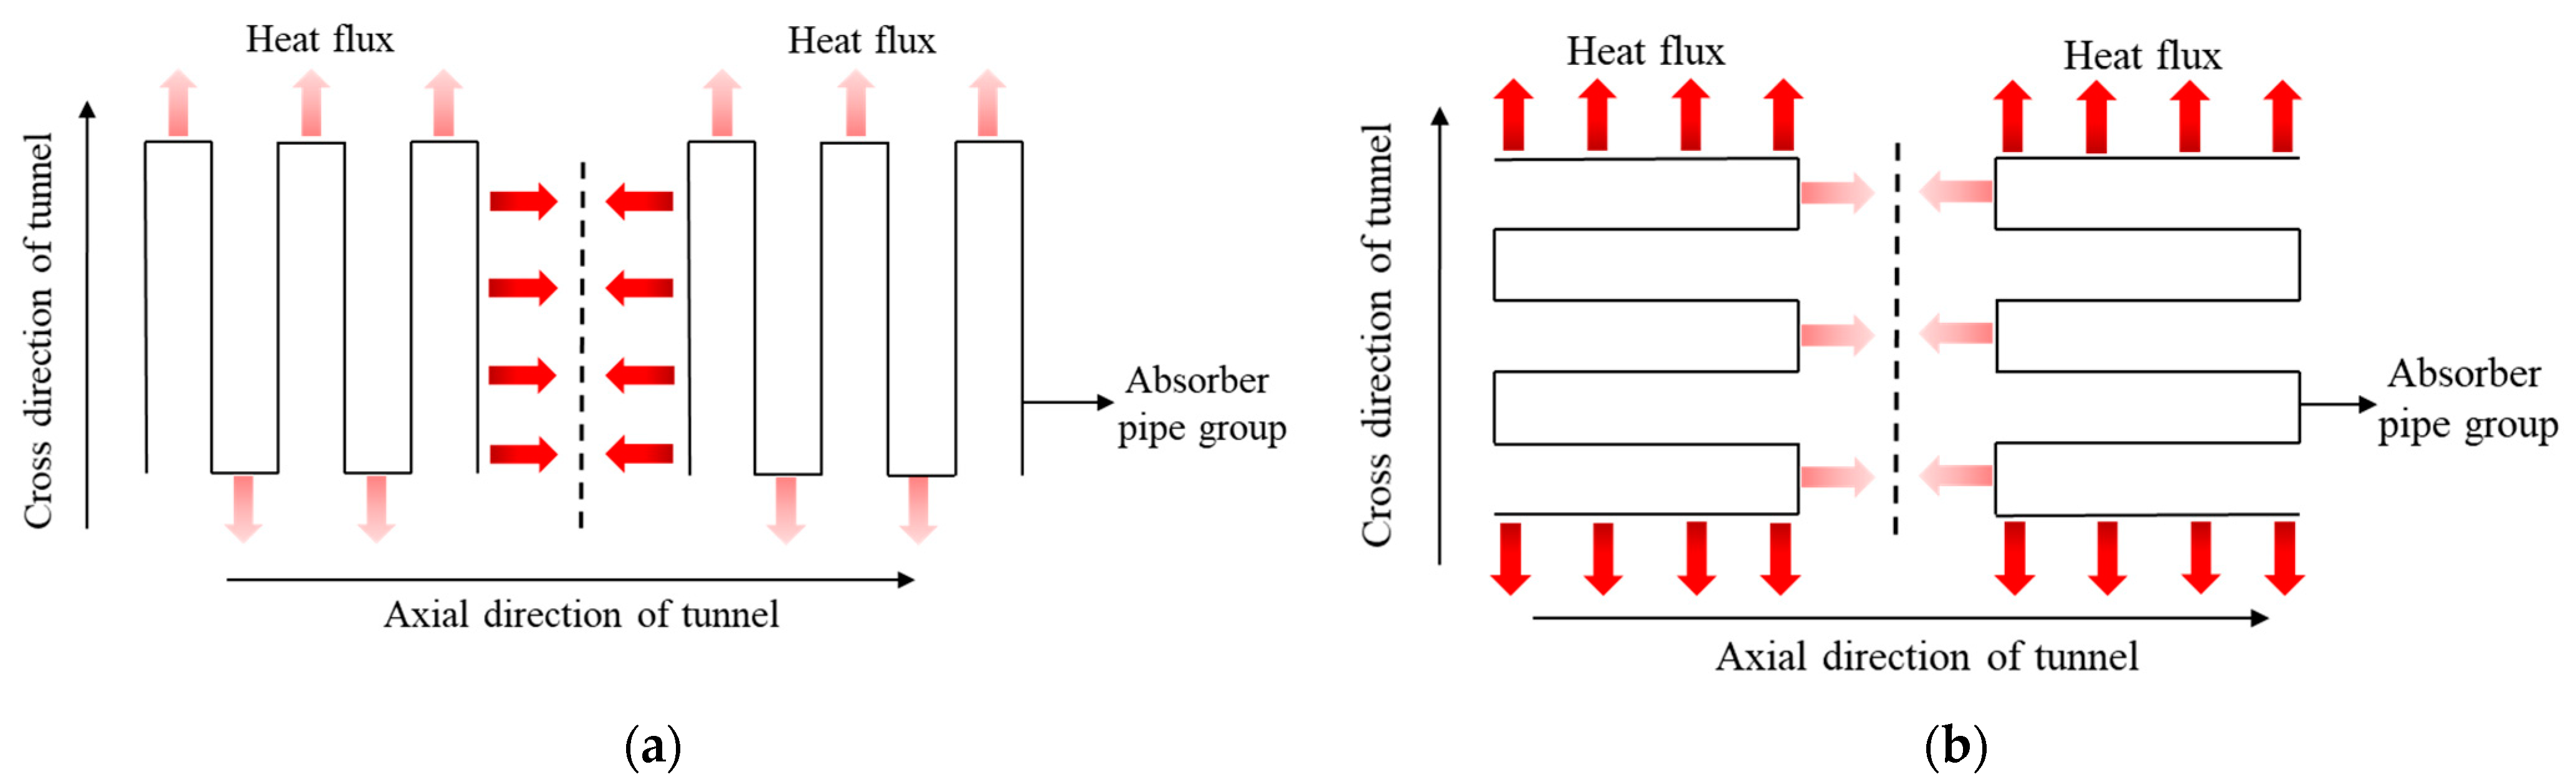
4.1. Effect of GHEs Absorber Pipe Layout Types on Heat Pump Energy Efficiency
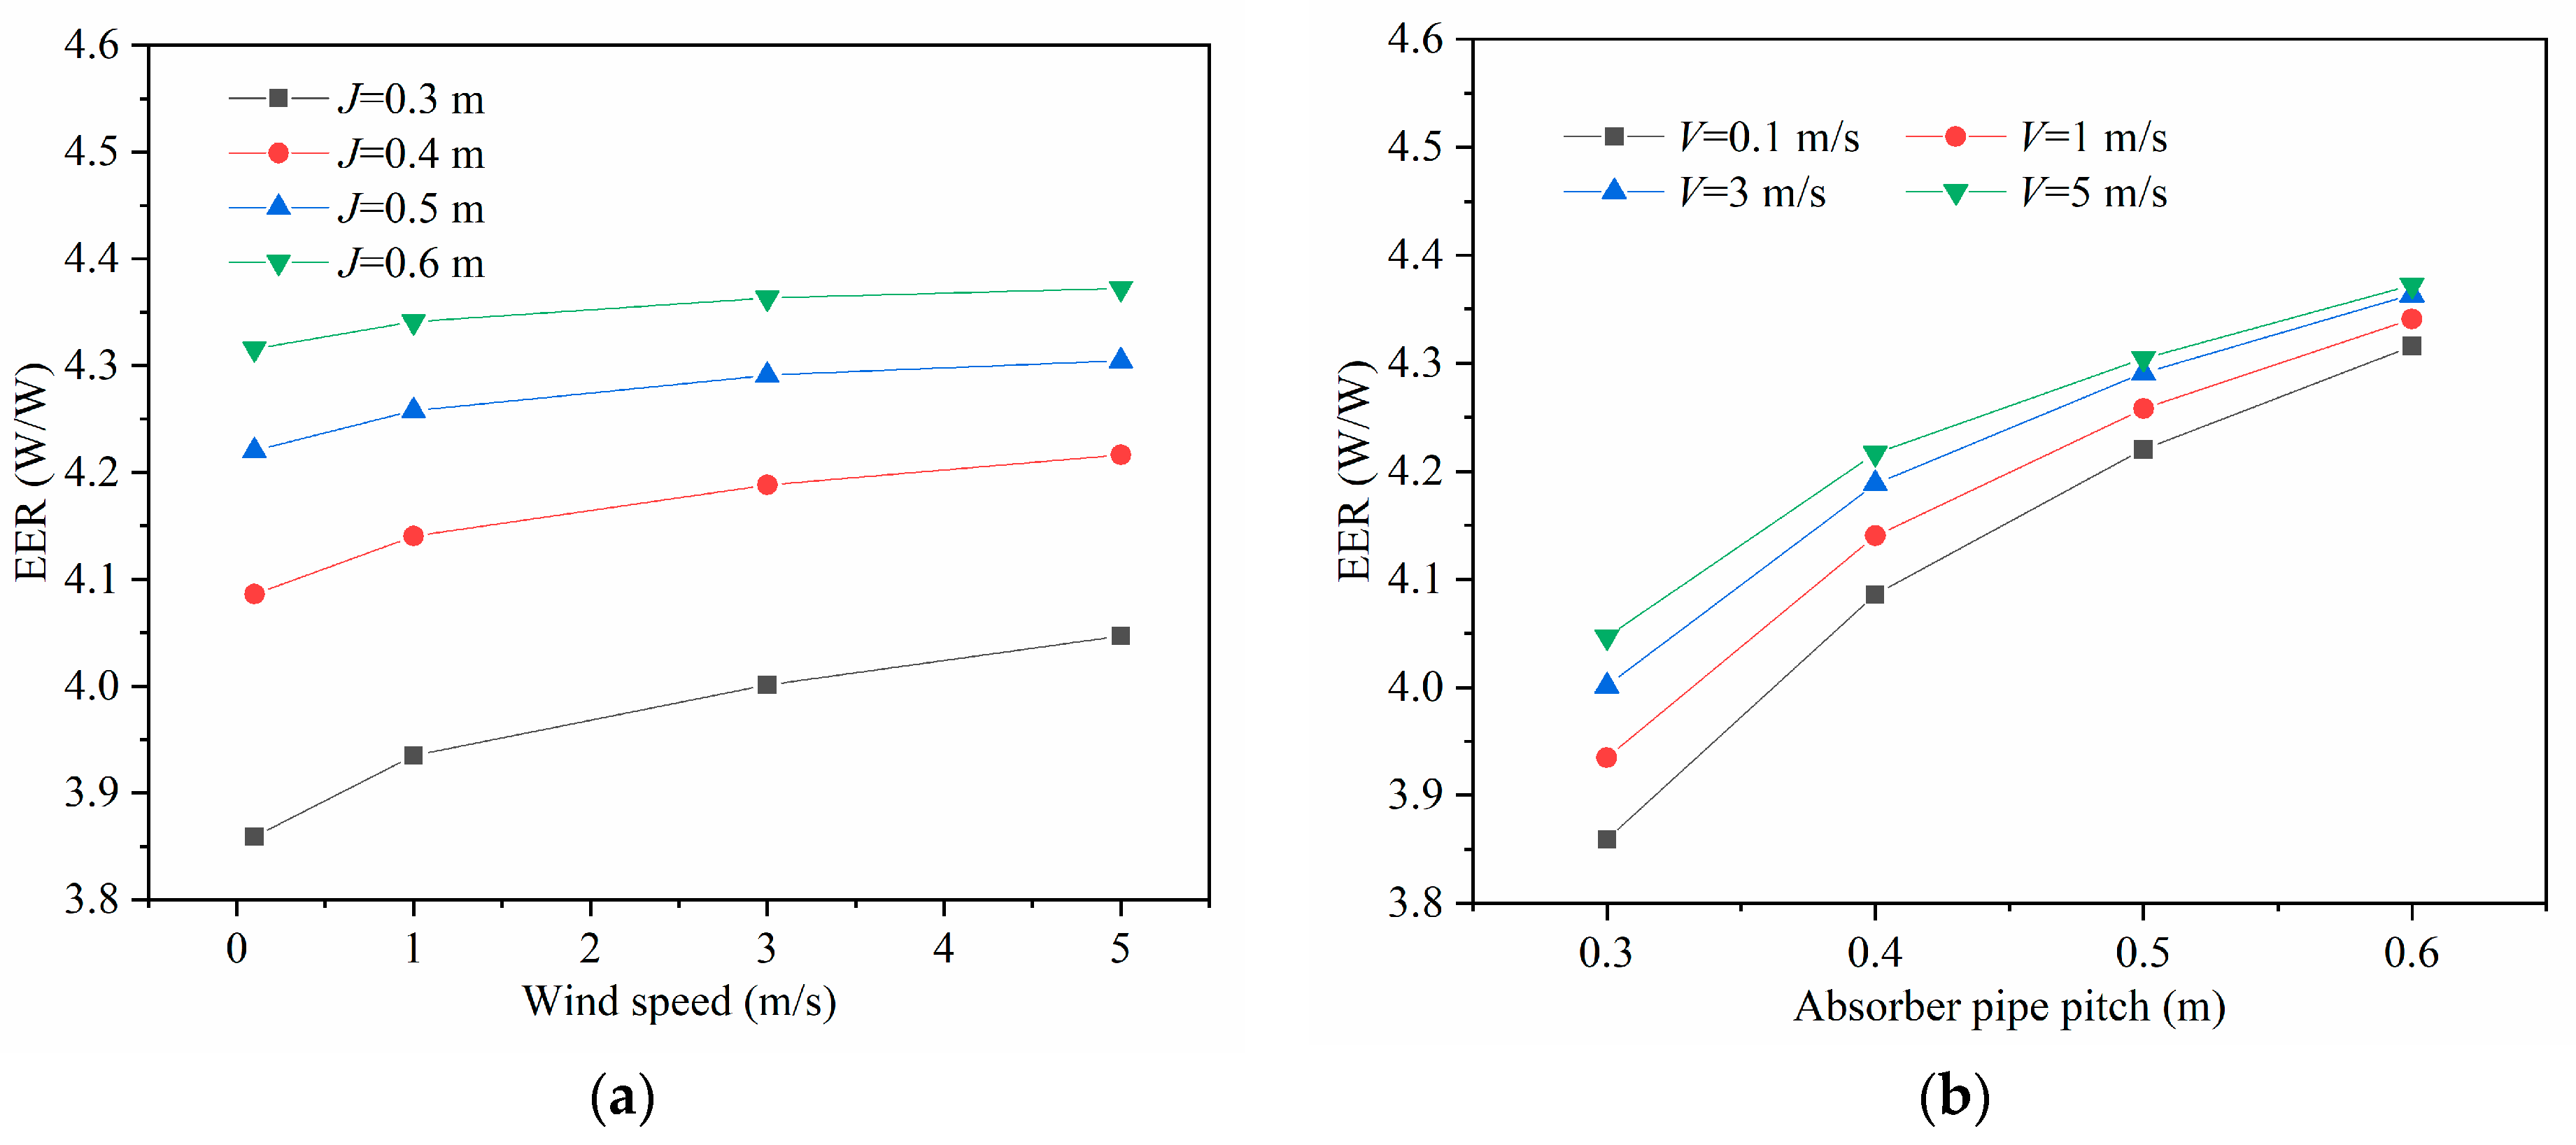
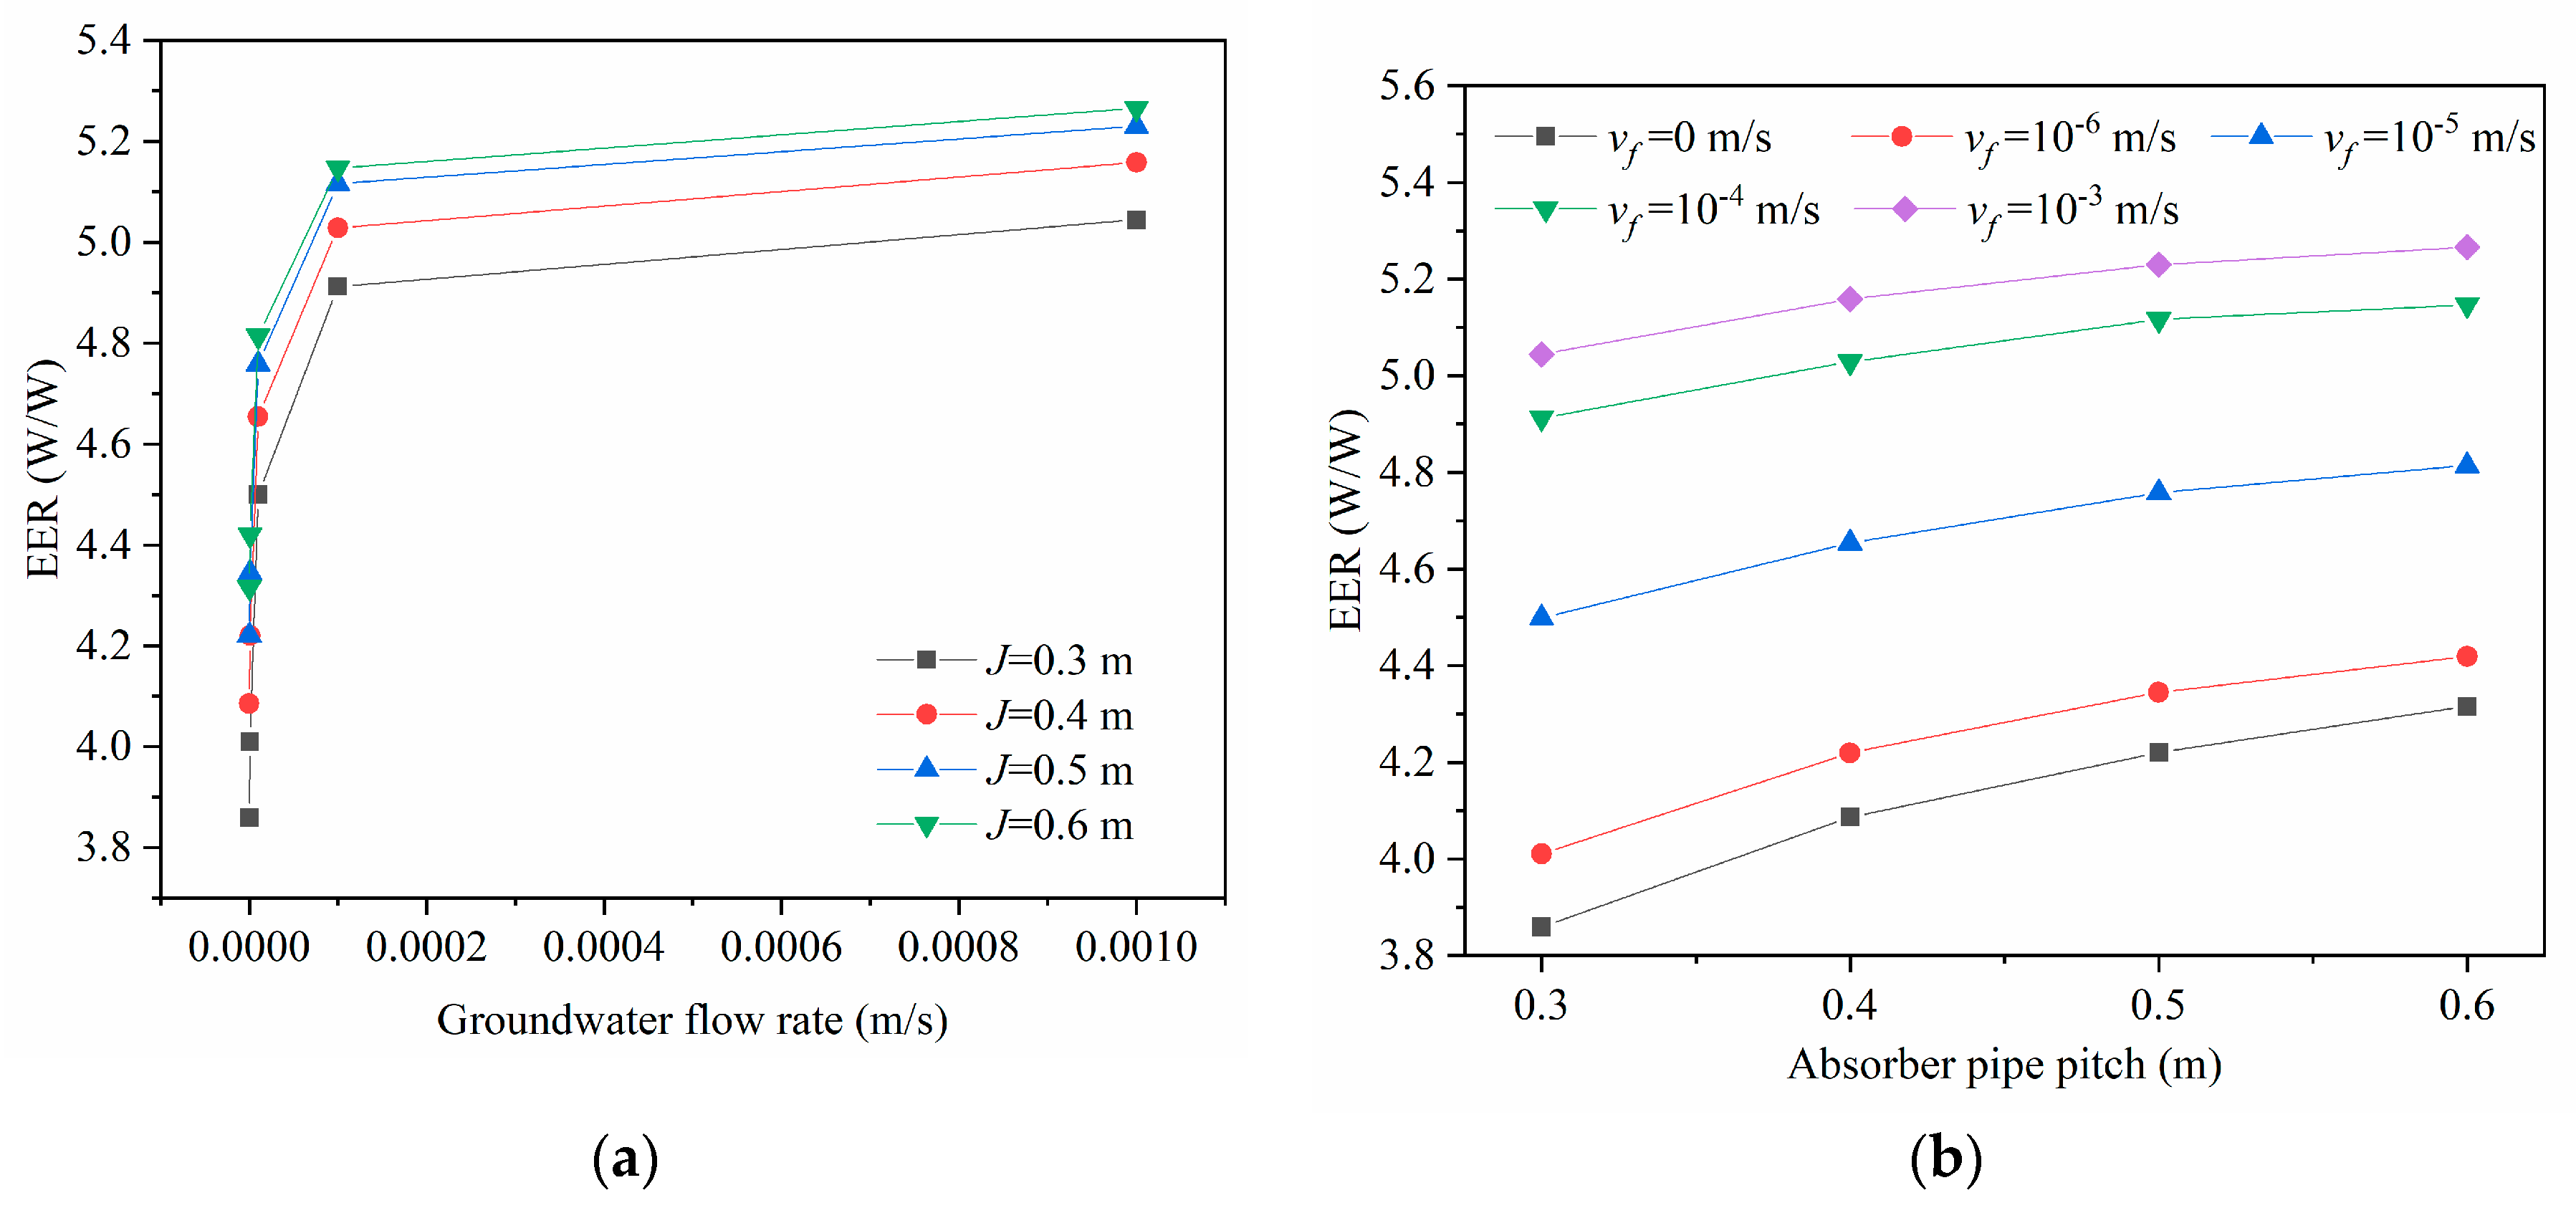
4.2. Effect of GHEs Absorber Pipe Pitch on Heat Pump Energy Efficiency
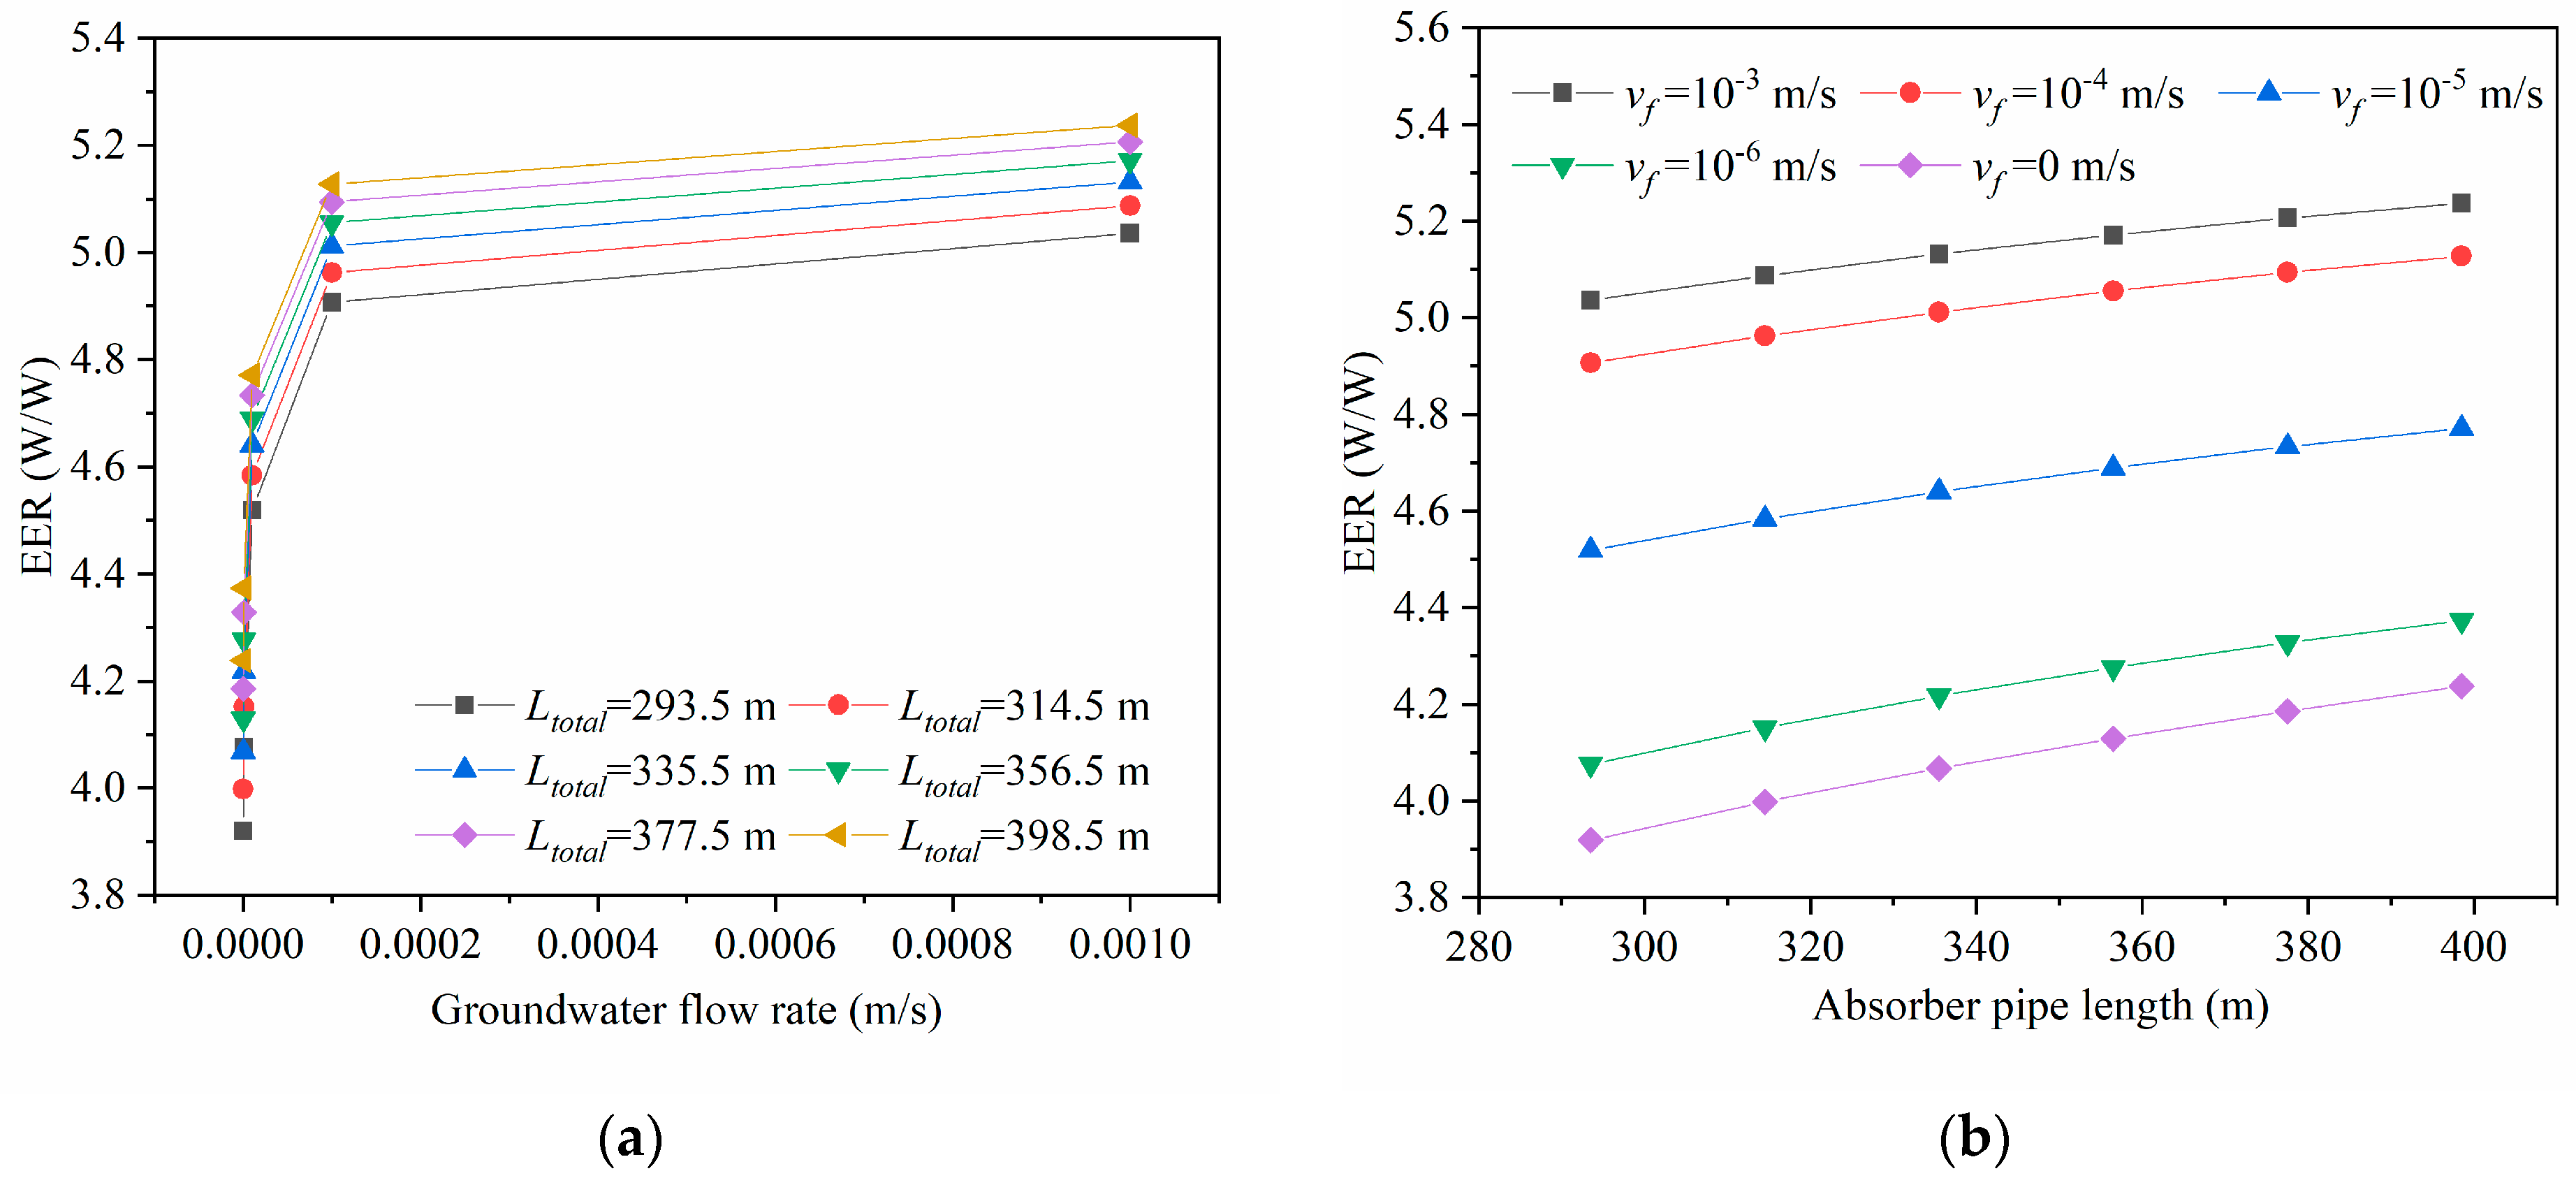
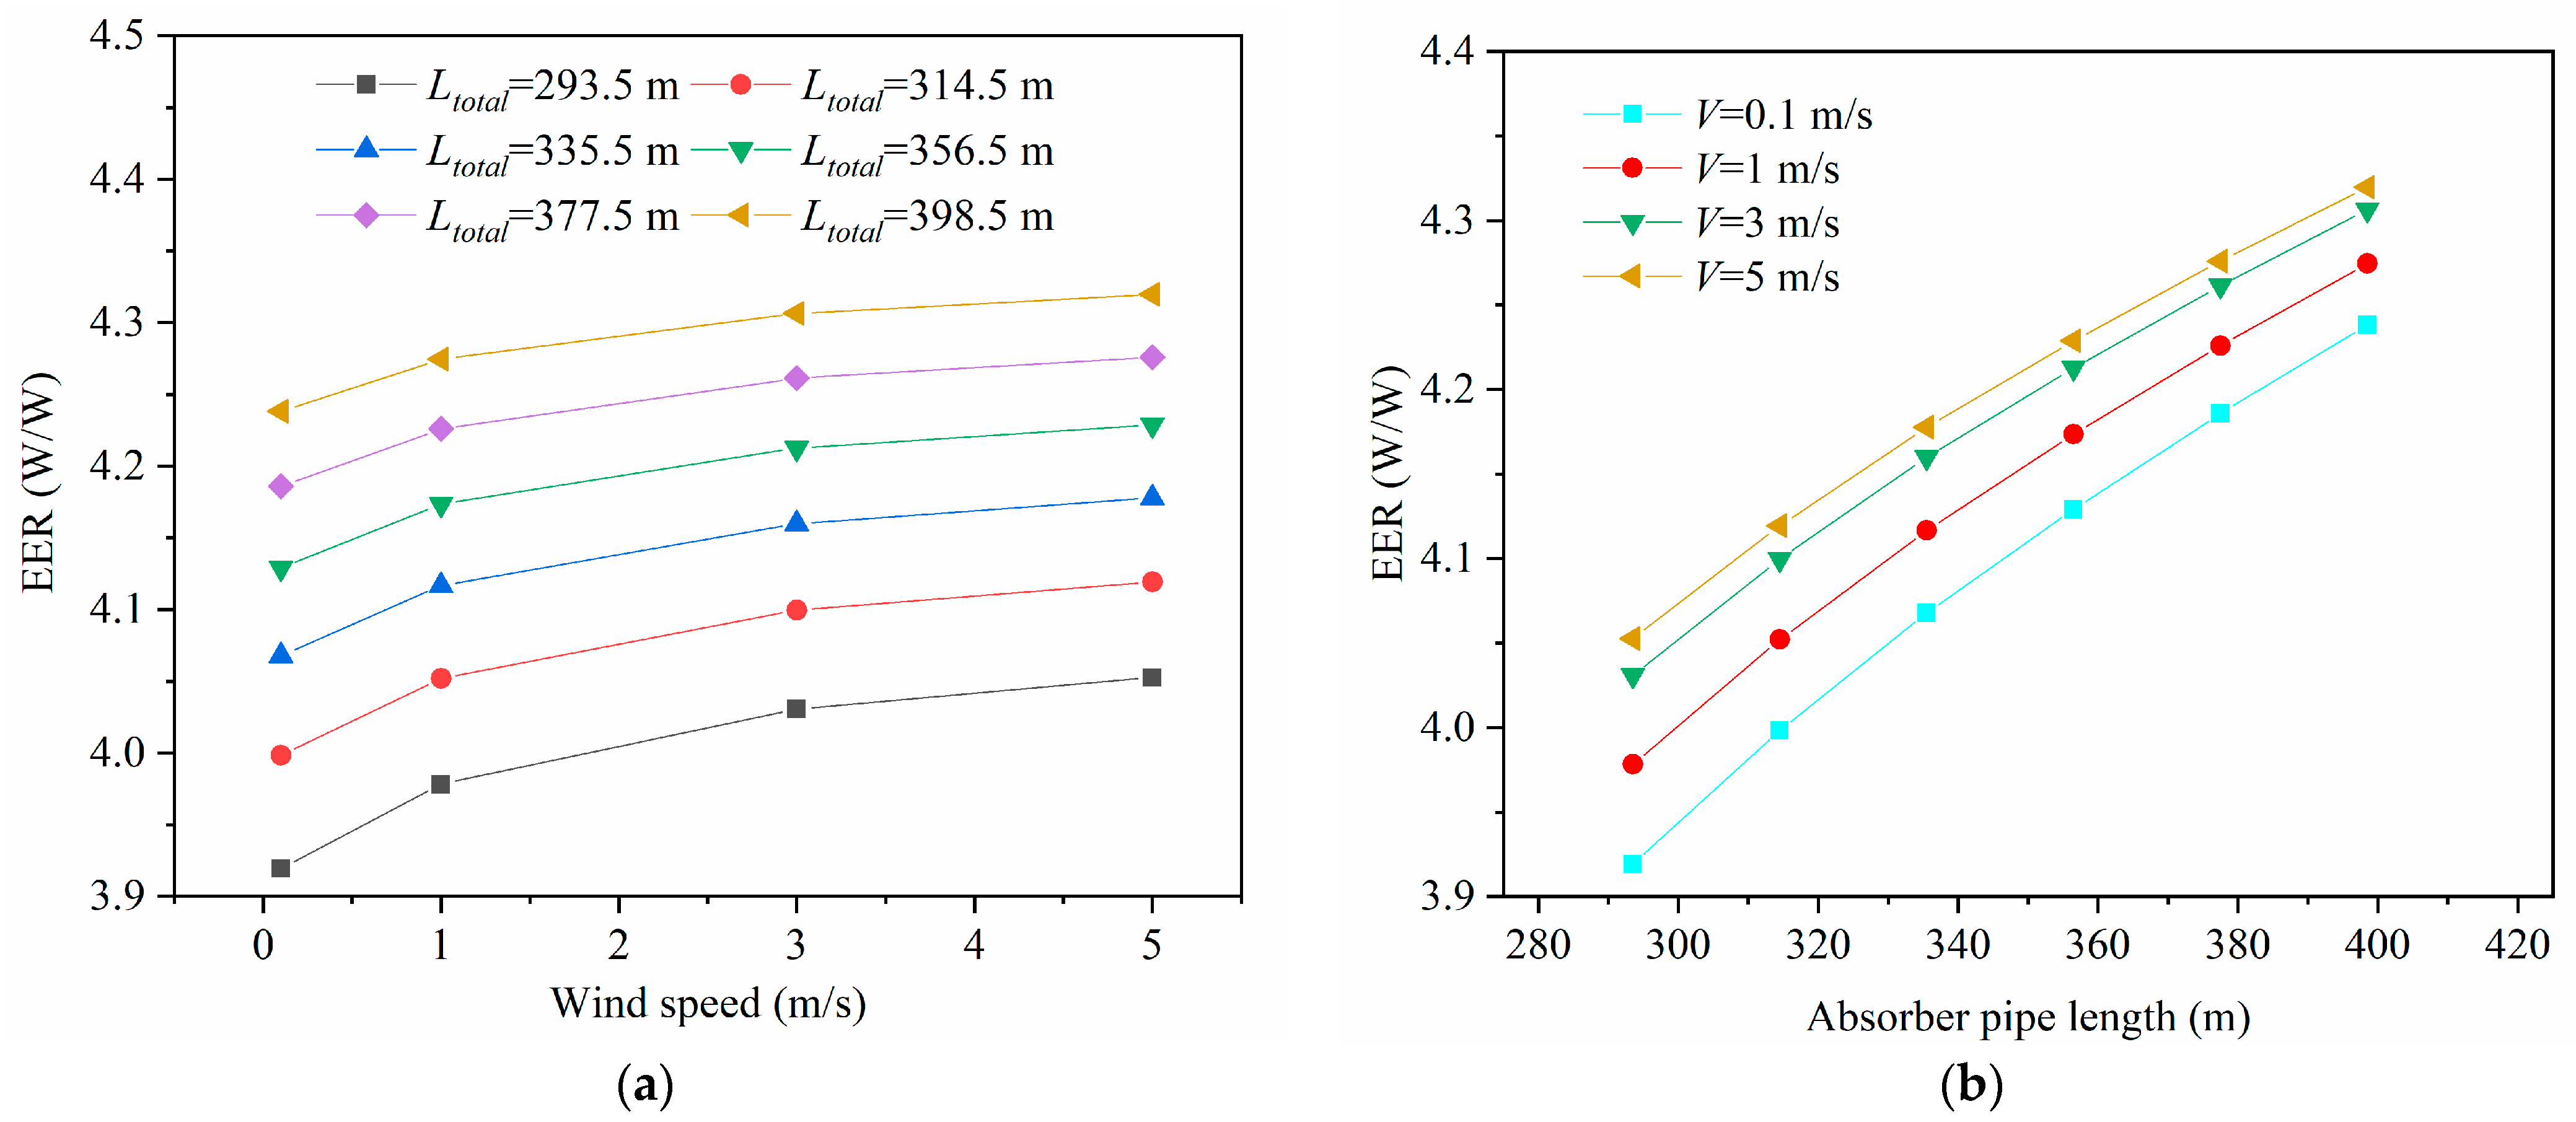
4.3. Effect of GHEs Absorber Pipe Length on Heat Pump Energy Efficiency
4.4. Discussion
5. Conclusions
- (1)
- For the mountain tunnel, the absorber pipe arranged along the axial direction of the tunnel exhibits a higher energy efficiency for the heat pump with tunnel lining GHEs compared with the absorber pipe arranged along the cross direction of the tunnel.
- (2)
- The EER increases exponentially with increasing absorber pipe pitch and length. The influences of pipe pitch and length on the growth rate of EER show a diminishing trend as the wind speed and groundwater flow rate increase.
- (3)
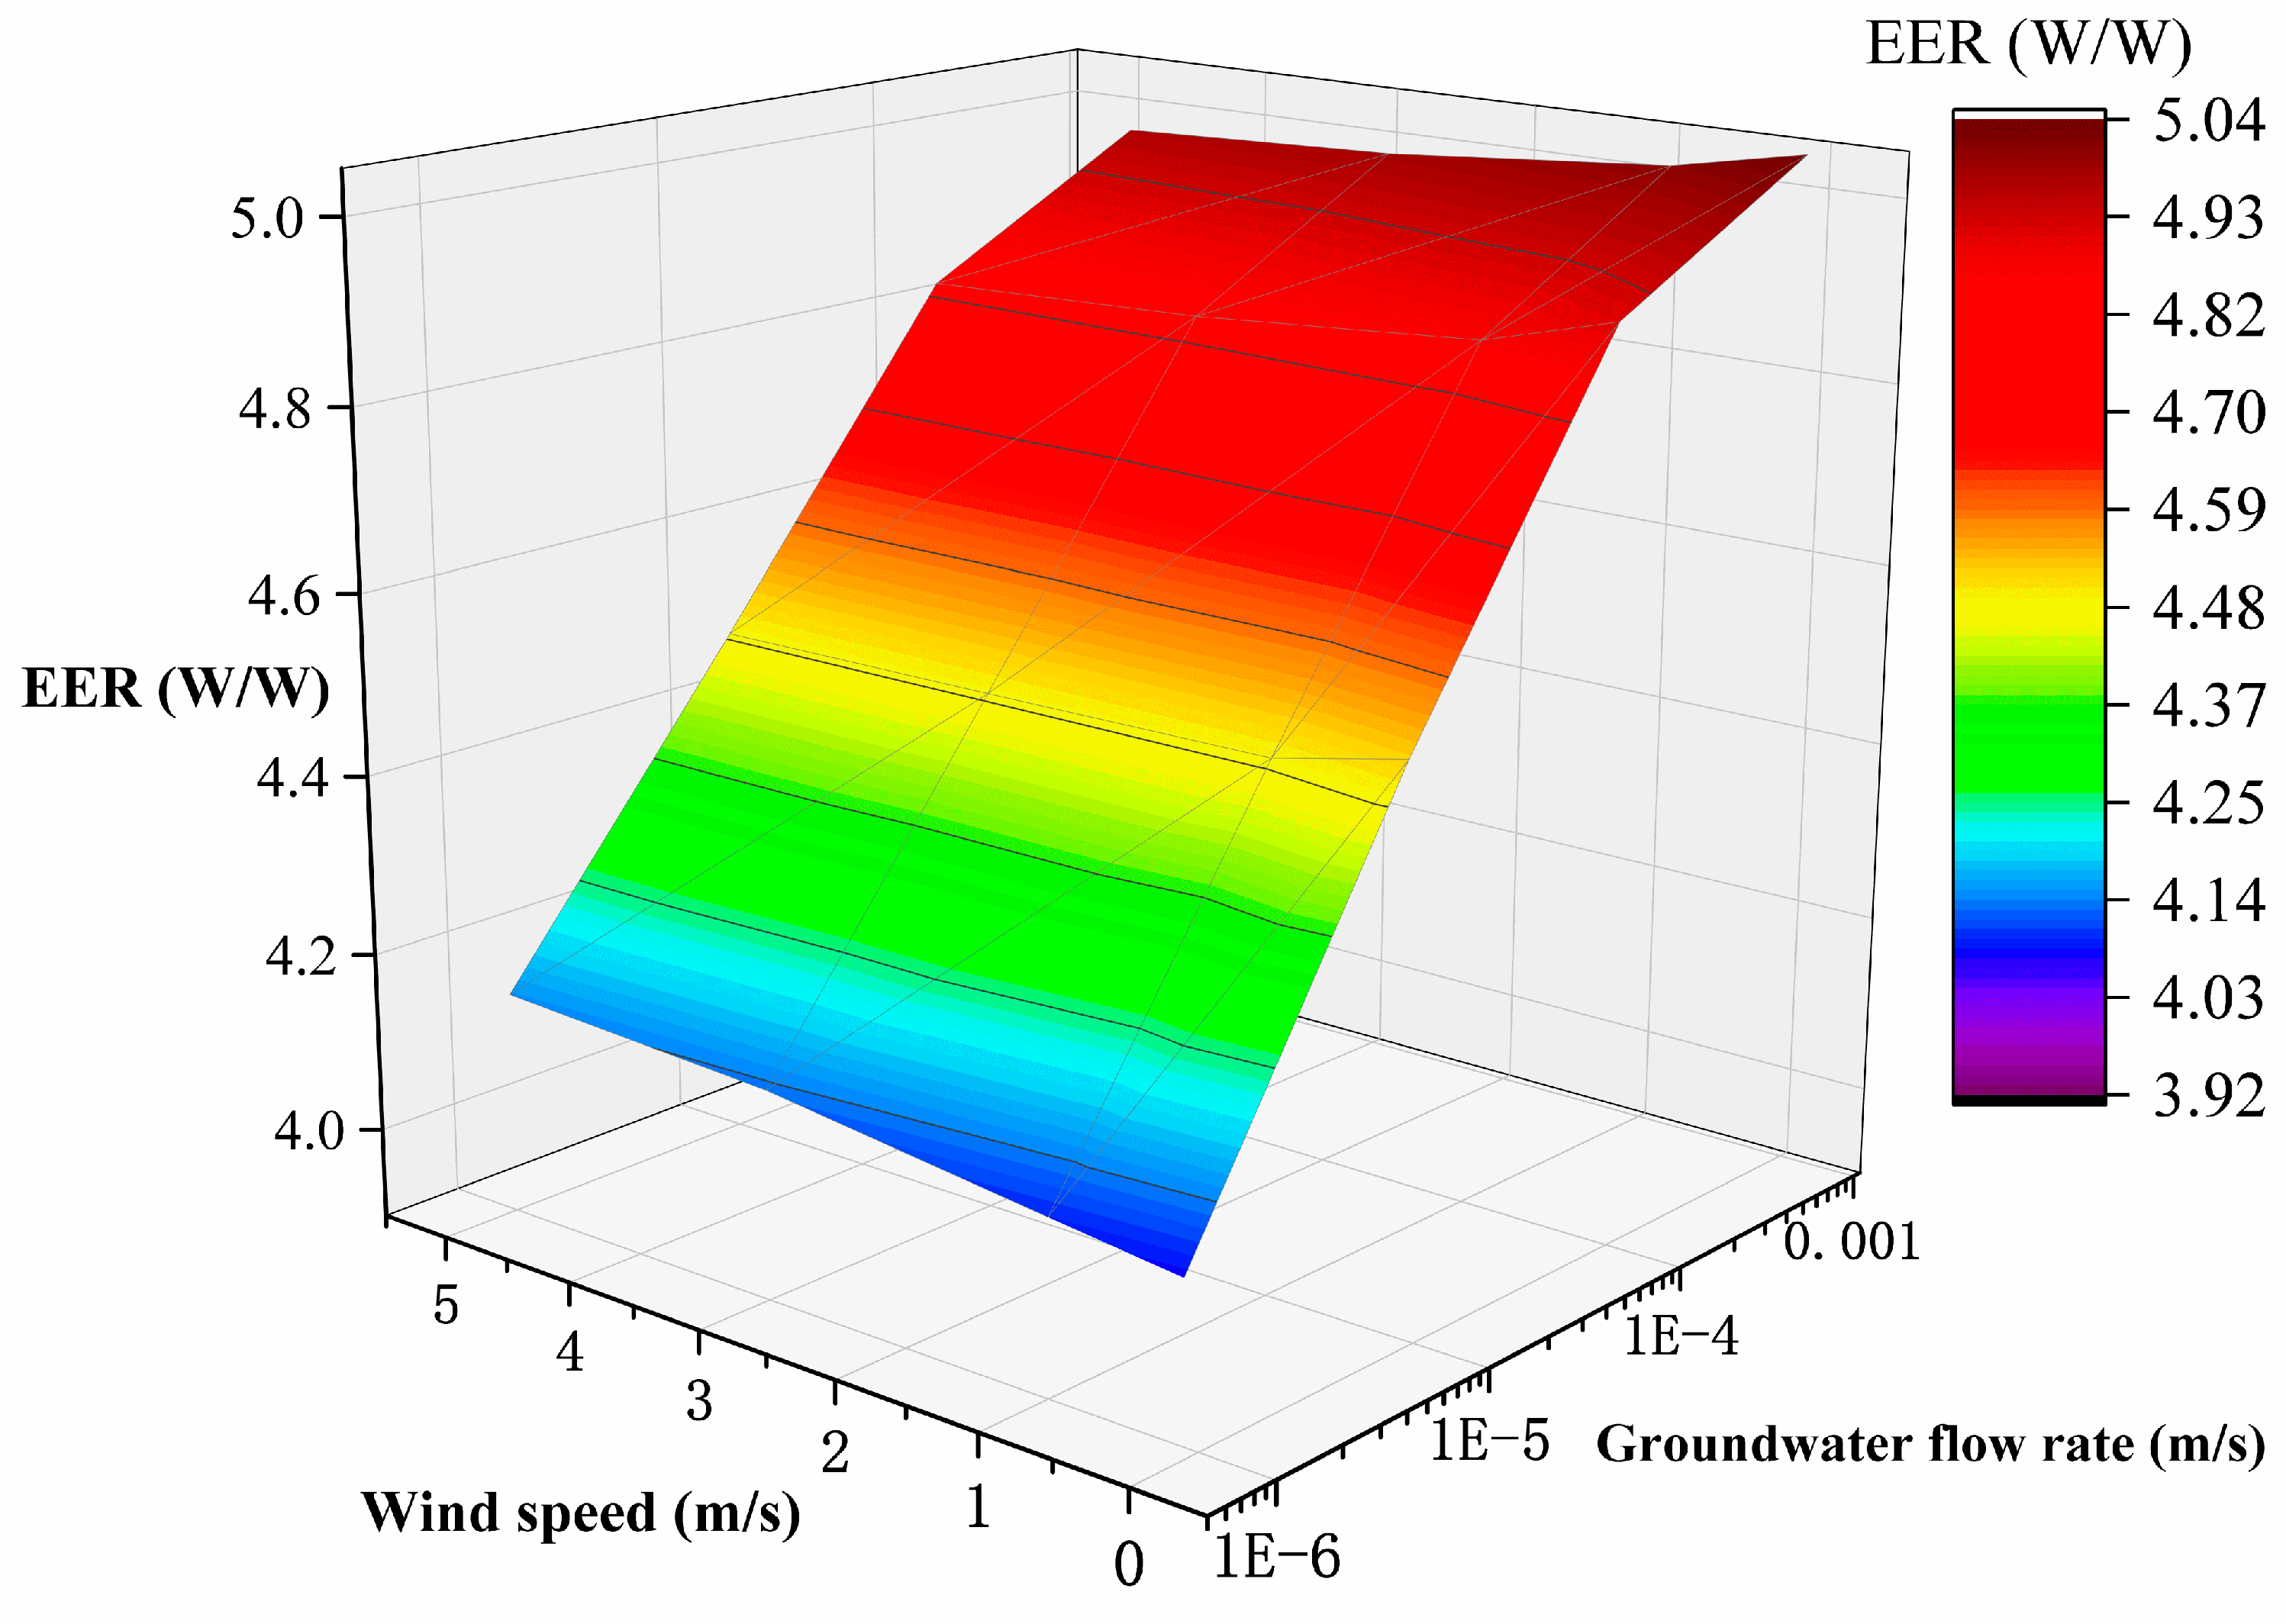
- The influence of groundwater flow on the heat pump energy efficiency is more remarkable than that of tunnel ventilation. Moreover, abundant groundwater may lead to a negative effect of ventilation on the heat pump energy efficiency. Hence, the coupling effect of ventilation and groundwater flow needs to be considered for the tunnel lining GHEs design.
Author Contributions
Funding
Institutional Review Board Statement
Informed Consent Statement
Data Availability Statement
Conflicts of Interest
References
- Building Energy Conservation Research Center of Tsinghua University. Annual Report on China Building Energy Efficiency, 2019 ed.; China Building Industry Press: Beijing, China, 2019. [Google Scholar]
- Huang, S.F.; Xie, L.Y.; Lu, L.; Zhang, X.S. Design method for heating towers used in vapor-compression heat pump systems. Build Environ. 2021, 189, 107532. [Google Scholar] [CrossRef]
- Lund, J.W.; Boyd, T.L. Direct utilization of geothermal energy 2015 worldwide review. Geothermics 2016, 60, 66–93. [Google Scholar] [CrossRef]
- Jiang, G.; Lin, C.; Shao, D.; Huang, M.; Lu, H.; Chen, G.; Zong, C. Thermo-mechanical behavior of driven energy piles from full-scale load tests. Energy Build. 2021, 233, 110668. [Google Scholar] [CrossRef]
- Yang, W.B.; Lu, P.F.; Chen, Y.P. Laboratory investigations of the thermal performance of an energy pile with spiral coil ground heat exchanger. Energy Build. 2016, 128, 491–502. [Google Scholar] [CrossRef]
- Rui, Y.; Yin, M. Thermo-hydro-mechanical coupling analysis of a thermo-active diaphragm wall. Can. Geotech. J. 2018, 55, 720–735. [Google Scholar] [CrossRef] [Green Version]
- Brandl, H. Energy foundations and other thermo-active ground structures. Geotechnique 2006, 56, 81–122. [Google Scholar] [CrossRef]
- Tinti, F.; Boldini, D.; Ferrari, M.; Lanconelli, M.; Kasmaee, S.; Bruno, R.; Egger, H.; Voza, A.; Zurlo, R. Exploitation of geothermal energy using tunnel lining technology in a mountain environment. A feasibility study for the Brenner Base tunnel—BBT. Tunn. Undergr. Space Technol. 2017, 70, 182–203. [Google Scholar] [CrossRef]
- Adam, D.; Markiewicz, R. Energy from earth-coupled structures, foundations, tunnels and sewers. Geotechnique 2009, 59, 229–236. [Google Scholar] [CrossRef]
- Zhang, G.Z.; Xia, C.C.; Yang, Y.; Sun, M.; Zou, Y.C. Experimental study on the thermal performance of tunnel lining ground heat exchangers. Energy Build. 2014, 77, 149–157. [Google Scholar] [CrossRef]
- Barla, M.; Di Donna, A.; Perino, A. Application of energy tunnels to an urban environment. Geothermics 2016, 61, 104–113. [Google Scholar] [CrossRef]
- Insana, A.; Barla, M. Experimental and numerical investigations on the energy performance of a thermo-active tunnel. Renew. Energy 2020, 152, 781–792. [Google Scholar] [CrossRef]
- Di Donna, A.; Barla, M. The role of ground conditions on energy tunnels’ heat exchange. Environ. Geotech. 2016, 3, 214–224. [Google Scholar] [CrossRef]
- Bidarmaghz, A.; Narsilio, G.A. Heat exchange mechanisms in energy tunnel systems. Geomech. Energy Environ. 2018, 16, 83–95. [Google Scholar] [CrossRef]
- Zhang, G.Z.; Xia, C.C.; Zhao, X.; Zhou, S. Effect of ventilation on the thermal performance of tunnel lining GHEs. Appl. Therm. Eng. 2016, 93, 416–424. [Google Scholar] [CrossRef]
- Li, C.; Zhang, G.; Xie, Y.; Liu, X.; Cao, S. Numerical investigation of energy tunnel lining ground heat exchangers in a mountain environment. IOP Conf. Ser. Earth Environ. Sci. 2021, 861, 072127. [Google Scholar] [CrossRef]
- Dornberger, S.C.; Rotta Loria, A.F.; Zhang, M.; Bu, L.; Epard, J.-L.; Turberg, P. Heat exchange potential of energy tunnels for different internal airflow characteristics. Geomech. Energy Envirion. 2020, 100229. [Google Scholar] [CrossRef]
- Zhang, G.Z.; Liu, S.Y.; Zhao, X.; Ye, M.; Chen, R.F.; Zhang, H.L.; Yang, J.D.; Chen, J.W. The coupling effect of ventilation and groundwater flow on the thermal performance of tunnel lining GHEs. Appl. Therm. Eng. 2017, 112, 595–605. [Google Scholar] [CrossRef]
- Ogunleye, O.; Singh, R.M.; Cecinato, F.; Chan Choi, J. Effect of intermittent operation on the thermal efficiency of energy tunnels under varying tunnel air temperature. Renew. Energy 2020, 146, 2646–2658. [Google Scholar] [CrossRef]
- Ogunleye, O.; Singh, R.M.; Cecinato, F. Assessing the thermal efficiency of energy tunnels using numerical methods and Taguchi statistical approach. Appl. Therm. Eng. 2021, 185, 116377. [Google Scholar] [CrossRef]
- Ma, C.J.; Donna, A.D.; Dias, D.; Zhang, J.M. Numerical investigations of the tunnel environment effect on the performance of energy tunnels. Renew. Energy 2021, 172, 1279–1292. [Google Scholar] [CrossRef]
- Defraeye, T.; Blocken, B.; Carmeliet, J. Convective heat transfer coefficients for exterior building surfaces: Existing correlations and CFD modelling. Energy Convers. Manag. 2011, 52, 512–522. [Google Scholar] [CrossRef] [Green Version]
- Liu, J.; Heidarinejad, M.; Gracik, S.; Srebric, J. The impact of exterior surface convective heat transfer coefficients on the building energy consumption in urban neighborhoods with different plan area densities. Energy Build. 2015, 86, 449–463. [Google Scholar] [CrossRef]
- Zhang, L.F.; Chen, J.Y.; Wang, J.Q.; Huang, G.S. Estimation of soil and grout thermal properties for ground-coupled heat pump systems: Development and application. Appl. Therm. Eng. 2018, 143, 112–122. [Google Scholar] [CrossRef]
- Zhang, L.F.; Huang, G.S.; Zhang, Q.; Wang, J.G. An hourly simulation method for the energy performance of an office building served by a ground-coupled heat pump system. Renew. Energy 2018, 126, 495–508. [Google Scholar] [CrossRef]
- Zhang, C.X.; Hu, S.T.; Liu, Y.F.; Wang, Q. Optimal design of borehole heat exchangers based on hourly load simulation. Energy 2016, 116, 1180–1190. [Google Scholar] [CrossRef]
- Ministry of Housing and Urban-Rural Development of the People’s Republic of China. Design Code for Heating Ventilation and Air Conditioning of Civil Buildings; GB50736-2012; China Architecture & Building Press: Beijing, China, 2012. [Google Scholar]


| Material | Parameters | Unit | Value |
|---|---|---|---|
| Rock | Mass density (ρr) | kg/m3 | 2530 |
| Thermal conductivity (kr) | W/m °C | 3.22 | |
| Specific heat capacity (Cp,r) | J/kg °C | 1670 | |
| Tunnel lining | Mass density (ρ1, ρ2) | kg/m3 | 2400 |
| Thermal conductivity (k1, k2) | W/m °C | 1.85 | |
| Specific heat capacity (Cp,1, Cp,2) | J/kg °C | 970 | |
| Inner diameter (dt,in) | m | 5.7 | |
| Primary lining thickness (б1) | m | 0.17 | |
| Secondary lining thickness (б2) | m | 0.35 | |
| Absorber pipe | Thermal conductivity (kp) | W/m °C | 0.32 |
| Inner diameter (dp,in) | mm | 23 | |
| Outer diameter (dp,out) | mm | 32 | |
| Flow velocity (uL) | m/s | 0.6 | |
| Pipe pitch (J) | m | 0.5 | |
| Pipe length (L) | m | 70 | |
| Carrier liquid | Thermal conductivity (kL) | W/m °C | 0.56 |
| Specific heat capacity (Cp,L) | J/kg °C | 4200 | |
| Mass density (ρL) | kg/m3 | 1000 |
| Elements Number | Temperature (°C) |
|---|---|
| 1,362,852 | 8.46 |
| 1,662,152 | 8.42 |
| 1,971,699 | 8.38 |
| 2,326,849 | 8.36 |
| 2,666,951 | 8.36 |
| Characteristic | Unit | Value |
|---|---|---|
| Pipe pitch (J) | m | 0.3, 0.4, 0.5 S, 0.6 |
| Pipe length (L) | m | 250–400 |
| Wind speed (V) | m/s | 0.1 S, 1, 3, 5 |
| Groundwater flow rate (vf) | m/s | 0 S, 10−6, 10−5, 10−4, 10−3 |
Publisher’s Note: MDPI stays neutral with regard to jurisdictional claims in published maps and institutional affiliations. |
© 2021 by the authors. Licensee MDPI, Basel, Switzerland. This article is an open access article distributed under the terms and conditions of the Creative Commons Attribution (CC BY) license (https://creativecommons.org/licenses/by/4.0/).
Share and Cite
Liu, X.; Li, C.; Zhang, G.; Zhang, L.; Wei, B. Numerical Investigation on Energy Efficiency of Heat Pump with Tunnel Lining Ground Heat Exchangers under Building Cooling. Buildings 2021, 11, 611. https://doi.org/10.3390/buildings11120611
Liu X, Li C, Zhang G, Zhang L, Wei B. Numerical Investigation on Energy Efficiency of Heat Pump with Tunnel Lining Ground Heat Exchangers under Building Cooling. Buildings. 2021; 11(12):611. https://doi.org/10.3390/buildings11120611
Chicago/Turabian StyleLiu, Xiaohua, Chenglin Li, Guozhu Zhang, Linfeng Zhang, and Bin Wei. 2021. "Numerical Investigation on Energy Efficiency of Heat Pump with Tunnel Lining Ground Heat Exchangers under Building Cooling" Buildings 11, no. 12: 611. https://doi.org/10.3390/buildings11120611
APA StyleLiu, X., Li, C., Zhang, G., Zhang, L., & Wei, B. (2021). Numerical Investigation on Energy Efficiency of Heat Pump with Tunnel Lining Ground Heat Exchangers under Building Cooling. Buildings, 11(12), 611. https://doi.org/10.3390/buildings11120611