1. Introduction
By combing the research status of asphalt stabilized materials with permeable function at home and abroad, it is found that the asphalt pavement with a permeable function at its base has better effect on the prevention and control of urban stormwater than asphalt pavement with a permeable surface only [
1]. Presently, the most commonly used permeable base materials include large pore cement stabilized macadam, large particle size permeable asphalt mixture LSPM (large stone permeable mixture), etc. [
2]. Among these, the flexible base material LSPM can not only meet the needs of permeable function, but also meet the current trend of long-life development of asphalt pavement [
3]. It also has broad application prospects. For permeable base materials, there must be a certain voidage to ensure their water permeability. However, an increase of voidage will lead to the decrease of road use and mechanical properties of the mixture [
4,
5]. Therefore, voidage is the key design and control index in the overall design process.
In the process of obtaining the expected target void ratio, the existing gradation design of permeable asphalt stabilized base material requires a large number of tests to establish the relationship between the void ratio and the key sieve holes (and then to control the pass rate of one or several key sieve holes through the expected void ratio). Not only is the process test large, but also the filling effect of asphalt on the voids of mineral aggregate is often ignored in the gradation calculation process, creating a situation that the target void ratio cannot be obtained. Relevant scholars have also proposed some design methods of mixture ratio of significance. The representative ones are the Bailey method adopted by Shang Fulu and Wu Junfeng et al. [
6,
7] and the variable i method adopted by Fu Qilin. The Bailey method [
8,
9] is a gradation design method proposed by Robert Bailey of the Illinois Department of Transportation in the United States. The basic idea is to fill the voids formed by coarse aggregates with fine aggregates. The key to this design is the selection of design density. The variable i method was first proposed by Lin Xiuxian of Tongji University [
10]. This method combines the Superpave aggregate composition design method and the Bailey design method, and proposes the design formula for the variable i method. With the help of Superpave and Bailey method, the range of the pass rate reduction coefficient i in the formula is given. Based on the variable i method, Fu Qilin [
11,
12] used the variable i method designed separately for coarse and fine aggregates, and furthermore used the Bailey method to determine the coarse and fine aggregates to divide the key sieve holes. After trial calculation, the value range of coarse and fine aggregate i values were given, respectively. Xiao Xin et al. [
13] introduced the CAVF method into the mix design of drainage asphalt mixture based on the CAVF (course aggregate void filling) method proposed by Professor Zhang Xiaoning. The core idea of the CAVF method is that the main skeleton void VCA
DRC (percent voids in coarse mineral aggregate in the dry rodded condition) formed by coarse aggregate is equal to the sum of the fine aggregate volume, asphalt volume, filler volume, and void volume [
14,
15].
Therefore, based on the CAVF method, we introduce a step-by-step filling test and asphalt content calculation formula to determine the skeleton structure of coarse aggregate in the mixture and the initial asphalt content and determine the molding method and the optimal asphalt content, so as to optimize the mix proportion design method of LSPM and complete the optimization large stone permeable asphalt mixture OLSPM (optimize large stone permeable mixture) with the target void ratio design and control index,. Our aim in this paper was to further study its performance and judge the rationality of this method.
2. Materials and Methods
Optimization Design Method of Mix Proportion
On the basis of combing the existing design methods of open gradation at home and abroad, this paper selects the CAVF method as the basic theory of gradation design. The core idea of the CAVF method is that the main skeleton void VCA
DRC formed by coarse aggregate is equal to the sum of fine aggregate volume, asphalt volume, filler volume, and void volume [
14,
15]. The mixture designed by this method not only ensures that the coarse aggregate is fully embedded to form a good skeleton structure, but also ensures that the fine aggregate and asphalt mortar do not interfere with the main skeleton structure. Its design also takes into account the filling effect of asphalt on the void. In summary, it can be seen that the CAVF method can supplement the shortcomings of the existing design methods and provide a theoretical basis for the optimization design of this paper. However, there are also problems in the CAVF method, such as the inability to determine the proportion of coarse and fine components. Based on this, our paper introduces the Bailey method, the step-by-step filling test, and the calculation formula of asphalt content to supplement the CAVF method [
16,
17], and preliminarily forms an optimization design method of mix proportion of large-size permeable asphalt mixtures. The detailed steps are as follows:
- (1)
According to the method proposed by the Bailey method to divide the key sieve hole, 0.22 times D is the first key sieve hole as the index to divide the key sieve hole of coarse and fine aggregate in the mixture.
- (2)
Determination of coarse and fine aggregate, mineral powder, and asphalt density parameters.
- (3)
On this basis, in order to determine the composition proportion of each grade aggregate in the coarse aggregate part, the gradation filling method is adopted to determine the composition proportion of each grade aggregate in the coarse aggregate part and the final tamping coarse aggregate gap rate VCADRC with the minimum gap rate of mixture as the standard.
- (4)
In order to determine the composition ratio of each grade in fine aggregate, the fine aggregate gradation is designed and adjusted according to the i method so as to determine the composition ratio of each grade in fine aggregate.
- (5)
Determine the target porosity of large size permeable asphalt mixture base material.
- (6)
It is initially set that the percentage of coarse aggregate in the mixture is x, the percentage of fine aggregate is y, the proportion of mineral powder is z, the amount of effective asphalt is m, and the amount of mineral absorbing asphalt is n. At this time, the corresponding formula becomes:
At this time, the unknowns in the formula are x, y, z, VV and asphalt content m + n, where VV is the target porosity, which is selected according to the expected value. In addition, according to the relevant research results, the effective asphalt content m and the mineral powder absorption asphalt content n are determined, and the z = 1.2 m is obtained from the powder-binder ratio = 1.2.
According to the estimation formula of effective asphalt content, the relationship between m, n, y, and z can be established as follows:
Formula:
ρb is asphalt density.
P1, P2… Pn are all different kinds of mineral materials accounted for the percentage of total mineral quality. According to the research conclusions of Jinan Shen [
18], the asphalt film thickness SA is 13 μm. Ps is 96 % based on experience (since the Ps value changes little, 1 % of the variation is only 0.001 in the calculation results, so the estimated Ps value has little effect on the m result).
γ1, γ2,… γn are the relative density of mineral materials and are dimensionless.
Here, C is the asphalt absorption coefficient and is also dimensionless. By Formula (8):
Formula: w
x synthetic mineral water absorption, %, by Formula (9):
The apparent relative density of synthesis of
γsa mineral (which is dimensionless) can be defined by Formula (10) as:
where
γ1′, γ2′,…γn′ various mineral apparent relative density and are dimensionless.
- (7)
Finally, Equations (1)–(3) and (5) are solved by EXCLE linear programming, and the corresponding results of x, y, z, m, and n are obtained.
- (8)
According to the above proportion and the content of each grade in coarse and fine aggregate, the gradation is synthesized. Determine the corresponding gradation and oil-stone ratio under the target porosity.
- (9)
Select the appropriate way to form the specimen, and test the asphalt content and porosity.
3. Results
In order to make a detailed description of the above mix design method, the OLSPM-25 mix with the target void ratio of 20% was designed. According to the above, it was divided into two parts, namely the initial mix design and the mix test.
3.1. Design of Initial Mix Proportion
(1) The nominal maximum particle size of aggregate in this design is 26.5 mm. According to the method of coarse and fine aggregate division in the Bailey method, the nominal maximum particle size of 0.22 times is 5.83 mm and is closer to 4.75 mm. Thus, 4.75 mm is the key particle size of coarse and fine aggregate division.
(2) Determination of relevant density parameters. SBS modified asphalt with high viscosity was selected for asphalt, and the measured density of asphalt was 1.027 g/cm
3. The apparent density, apparent relative density, and gross volume relative density of the mineral powder were 2.752 g/cm
3, 2.757, and 2.722, respectively. The density of coarse and fine aggregate is shown in
Table 1 and
Table 2.
(3) LSPM-25 coarse aggregate contains 26.5–31.5 mm, 19–26.5 mm, 16–19 mm, 13.2–19 mm, 9.5–13.2 mm, 4.75–9.5 mm six-grade mixture (i.e., a five-stage filling). According to “Highway engineering aggregate test procedures” (JTG E42-2005) [
19], the tamping filling test was carried out, and the composition ratio of each grade aggregate in the coarse aggregate part and the final tamping coarse aggregate clearance rate VCA
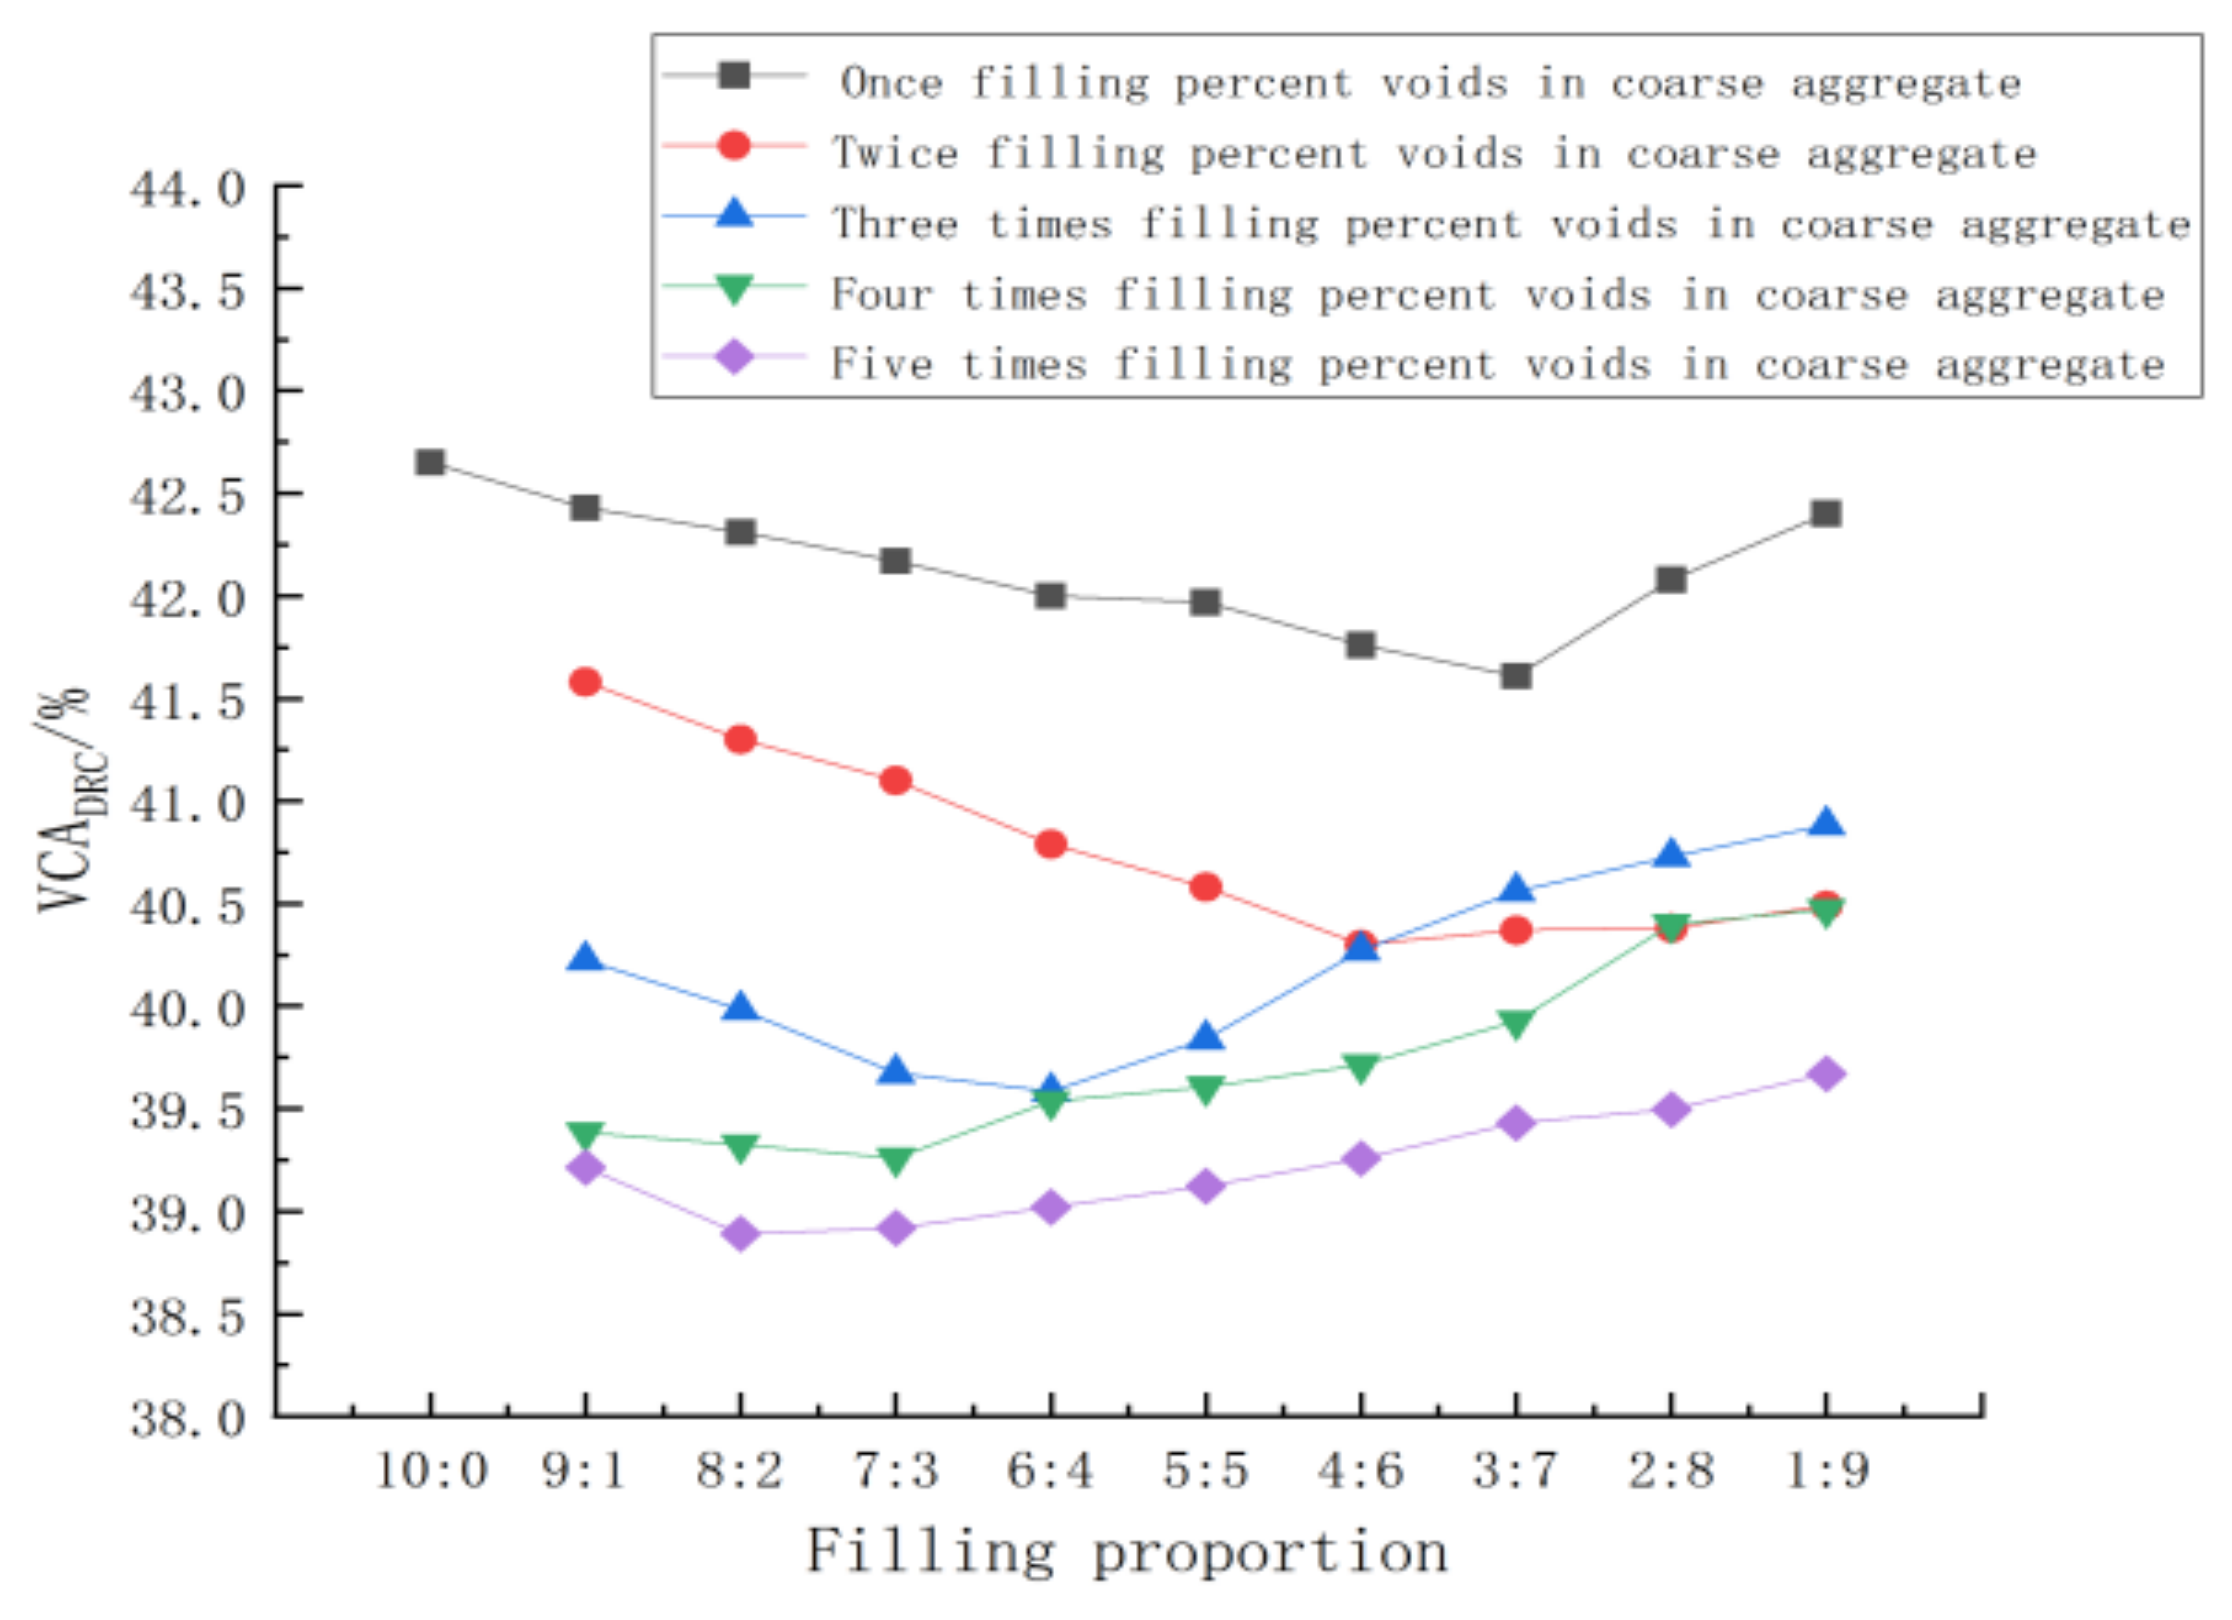
DRC were determined based on the minimum gap rate of the mixture. Changes in filling ratios and clearance rates at all levels are shown in
Figure 1.
In different filling experiments, the relationship between mineral aggregate clearance rate and filling ratio is similar, and there is an appropriate proportion to make the mixture with different composition ratios have the smallest coarse aggregate clearance rate in tamping state. According to this principle, the best composition ratio of 6 coarse aggregates in OLSPM-25 is 4.032:9.408:20.16:22.4:24:20, and the size of VCADRC is 38.89%.
(4) The composition ratio of fine aggregate is calculated by i method; i is 0.73, and the composition ratio of fine aggregate is given in the reference to adjust the calculation results [
11,
12]. The final composition ratio of fine aggregate is shown in
Table 3.
(5) Setting the target air voids, and the target air voids is selected as 20% in this example.
(6) According to Formulas (1)–(10), x, y, and z were calculated as 85.89%, 10.35%, and 3.76%, respectively, according to the powder-binder ratio 1.2. m and n are 3.13% and 1.07%, respectively. According to the percentage of each part obtained above, the proportion of the coarse and fine aggregate composition is given. The asphalt content of OLSPM-25 was calculated to be 4.20%. Final completion of the target void ratio of 20% OLSPM-25 mix calculation. The passing rate of OLSPM-25 aggregate with 20% voidage is shown in
Figure 2.
3.2. Mix Proportion Verification
3.2.1. Asphalt Content Test
This design material is used in the base course of pavement structure and is not directly affected by vehicle load. The binder is SBS modified asphalt with high viscosity. Therefore, when determining the optimal asphalt content, the dispersion test is not considered and the leakage test is the main means to determine the result. The calculated asphalt content is 4.20%, in order to determine the inflection point on the leakage curve (4.20% is the intermediate value, according to the difference of 0.5%). Five groups of asphalt content 3.20%, 3.70%, 4.20%, 4.70%, and 5.20% are taken near the intermediate value to carry out the leakage test. According to the relevant requirements in “Test procedures for asphalt and asphalt mixture in highway engineering” (JTG E20-2011) [
20], the leakage curve of different asphalt content and leakage loss in the leakage test are calculated as shown in
Figure 3. By fitting, the corresponding quartic function equation of the curve is obtained:
By solving, the asphalt content calculated by OLSPM with the target void ratio of 20% is 4.20%, which is less than 4.457% at the inflection point. Therefore, the calculated asphalt content meets the relevant requirements of the leakage test.
3.2.2. Determination of Forming Method
The most representative Marshall compaction method and rotary compaction method were selected to perform the specimen molding according to the gradation and asphalt content of OLSPM-25 with the target porosity of 20%. The suitable molding method was selected by observing the appearance change of the specimen and the related volume parameters in the molding process, so as to provide reference for the subsequent performance test. The volume parameters and mixture appearance of OLSPM-25 under different compaction times in Marshall compaction test and different compaction times in rotary compaction process are shown in
Table 4 and
Table 5.The condition of granular material on the surface of specimen after 25 times compaction is shown in
Figure 4 and the internal condition of mixture during 50 times of rotary compaction is shown in
Figure 5.
Through comparison, it is found that the void ratio is lower than the target void ratio at 25 compaction times. In the compaction process, aggregate fragmentation occurs, and the degree of fragmentation increases with the increase of compaction times, resulting in the degradation of mixture gradation which in turn leads to the destruction of mixture skeleton structure and affects the void ratio and various properties of skeleton-porosity large-size permeable asphalt mixture. Therefore, the Marshall compaction method is not suitable for large size permeable asphalt mixture molding.
Considering that the change between different compaction times and bulk density and height of the mixture can be recorded in the process of rotary compaction, this paper analyzes the data recorded in the first group of 50 compaction times so as to determine the reasonable compaction times of OLSPM. The relevant data are shown in
Figure 6.
It can be seen from the diagram that the mixture is initially in a loose state. With the increase of compaction times, the porosity gradually decreases, the bulk density gradually increases, and the mixture gradually forms a skeleton-void structure.
For this design method, considering that the design idea is the clearance rate formed by fine aggregate, asphalt, and voids filling the coarse aggregate in the tamping state, the above four parts together constitute the total volume of the specimen. Therefore, in the molding process, in order to avoid the crushing of aggregate caused by excessive compaction times and the destruction of the existing skeleton-porosity structure and to avoid the formation of loose asphalt mixture due to insufficient compaction times, this paper proposes to control it according to the target porosity. Accordingly, it can be determined that the compaction times of OLSPM-25 with the target porosity of 20% in this design are about 22.
4. Discussion
4.1. Evaluation of Mix Proportion Design
On the basis of the above mix proportion design, in order to clarify the characteristics of the design gradation, this paper selects two different mix proportions under the same void ratio. One is the OLSPM-25 optimized in this paper, and the other is the median of the LSPM-25 gradation range recommended by “Specification design for permeable asphalt pavement” (CJJT 190-2012) [
21]. The two are compared from the perspective of gradation composition and asphalt content. The porosity of the latter is calculated to be 19.2%. In this section, the OLSPM-25 gradation and asphalt content are calculated according to the target porosity of 19%. The asphalt content corresponding to the two mixture ratios is 4.36% and 3.39%, respectively. The gradation of the two is shown in
Figure 7.
Under the same porosity, the asphalt content of the two is obviously different. The effective asphalt content calculated by the optimized OLSPM-25 is 3.28%, and the specific surface area of the aggregate is 2.705 m2/kg. The effective asphalt content calculated by LSPM-25 is 2.56%, and the calculated specific surface area of aggregate is only 1.989 m2/kg. From the gradation curve, the content of fine aggregate in 0.075–0.6 mm part of OLSPM-25 is more than that of LSPM-25, while the content of fine aggregate in 0.6–4.75 mm part is less than that of LSPM-25. Since the fine aggregate in 0.075–0.6 mm part has a larger specific surface area, it is the reason for the high asphalt content of OLSPM-25 to contain more and finer aggregate. In addition, there are also significant differences between the two in the coarse aggregate part. From the gradation curve, the aggregate content of 9.5–19 mm in OLSPM-25 is higher than that in LSPM-25, while the content of 19–31.5 mm is lower than that in LSPM-25.
4.2. Mixture Performance Evaluation
In order to test the rationality and feasibility of the mix design method proposed in this paper, this paper further takes OLSPM-25 and OLSPM-30 as examples to test. According to the above mix design method, OLSPM with nominal maximum particle size of 26.5 mm and 31.5 mm is selected for the mix design of permeable asphalt stabilized macadam. At the same time, the gradation range of LSPM-25 and LSPM-30 recommended in the “Specification design for permeable asphalt pavement” (CJJT 190-2012) [
21] is introduced, and the median of gradation is taken for performance test as a reference standard for performance comparison research.In order to ensure that the two types of materials have the same void ratio, the void ratio of LSPM-25 is 19.2% and the void ratio of 30 is 19.4%. Therefore, the target void ratio of OLSPM-25 and OLSPM-30 is 19%. According to this standard, the gradation of OLSPM is designed.
4.2.1. Pavement Performance
Considering the service layer and service environment of large particle size permeable asphalt mixture in this design, the water stability, fatigue performance and mechanical properties of large particle size permeable asphalt mixture are mainly explored.
The freeze-thaw splitting test was used to evaluate the water stability of OLSPM-25, OLSPM-30, LSPM-25 and LSPM-30 with a void ratio of 19%. The final splitting strength test results and TSR are shown in
Table 6.
It can be seen from
Table 6 that under the same void ratio, OLSPM has higher splitting tensile strength than LSPM before and after freeze-thaw, and the splitting tensile strength decreases with the increase of nominal maximum particle size. After a freeze-thaw cycle, the TSR of OLSPM-25 and OLSPM-30 are higher than those of LSPM-25 and LSPM-30. Since OLSPM has more asphalt content than LSPM, the splitting tensile strength and TSR of OLSPM are slightly higher than those of LSPM, and OLSPM has relatively better water stability.
Through the optimization of the existing experimental methods of fatigue performance of asphalt mixture [
22,
23], the semi-circular bending test SCB (Semi-Circular Bending Test) [
24,
25] was used to evaluate the fatigue performance of OLSPM-25, OLSPM-30, LSPM-25, and LSPM-30 under the same porosity. The experimental results are shown in
Table 7.
It can be seen from
Table 7 that the failure load of OLSPM is higher than that of LSPM under the same void ratio, and the failure load decreases with the increase of the nominal maximum particle size. For fatigue life, under the same stress ratio, the average fatigue life of OLSPM is higher than that of LSPM, mainly because OLSPM has more asphalt content, so its fatigue life is better. Moreover, the average fatigue life times of the two types of mixtures decrease with the increase of nominal maximum particle size.
4.2.2. Penetrating Quality
Due to the high permeability of large-size permeable asphalt mixture, it is suitable to use the constant head test method [
26]. According to the test method in the “Technical Specification for Design and Construction of Drainage Asphalt Pavement” (JTG T3350-03-2020) [
27], the permeability coefficients of four kinds of permeable asphalt mixtures are measured. By recording the amount of water collected in about 5 s, the corresponding test parameters and the average value of the permeability coefficient results under multiple tests, as shown in
Table 8.
It can be seen from
Table 8 that under the same porosity, the permeability coefficient of LSPM is higher than that of OLSPM, and the difference between the two is small. OLSPM also has good permeability.
4.2.3. Mechanical Property
The dynamic modulus test considering temperature and loading frequency during the test is used as the test method of its mechanical properties. The dynamic modulus is used as the mechanical index to explore the mechanical properties of OLSPM-25, OLSPM-30, LSPM-25, and LSPM-30 under the same void ratio. The results are shown in
Table 9.
It can be seen from
Table 9 that the experimental results of dynamic modulus of OLSPM are relatively higher than those of LSPM, mainly because OLSPM has a good skeleton structure, and with the increase of nominal maximum particle size, the dynamic modulus of the two types of mixtures has a certain increase, among which OLSPM-30 is significantly higher than that of OLSPM-25.
5. Conclusions
Combined with the classification standard of coarse and fine aggregates by the Bailey method, the CAVF method was supplemented and optimized by introducing the step-by-step filling test, i-method grading design method, effective asphalt dosage formula, absorbed asphalt dosage formula, and powder-binder ratio. The optimization design method of large particle size permeable asphalt mixture with key parameters of target void ratio was proposed. Furthermore, the calculated asphalt content was tested, and the results showed that the calculated asphalt content could meet the requirements of the optimal asphalt content.
By comparing the volume parameter changes and specimen appearance of Marshall compaction test and rotary compaction test in the forming process, the rotary compaction test is preferred as the specimen forming method of large-size pervious asphalt mixture. Considering the volume composition of large size permeable asphalt mixture and the change of volume parameters in the process of rotary compaction, the target porosity is proposed as the compaction number index to control the large size permeable asphalt mixture.
By comparing the composition of each part of OLSPM and LSPM, it is found that OLSPM has higher asphalt content, better gradation composition, and better skeleton structure. Furthermore, through the road performance experiment, it is found that the water stability and fatigue performance of OLSPM are better than LSPM since OLSPM has more asphalt content. Since the coarse aggregate composition of OLSPM constitutes a more stable skeleton structure, its mechanical properties are better than those of LSPM; although the permeability coefficient of LSPM is relatively high, the difference between them is small, and OLSPM also has good water permeability. The above results show that the optimal design method obtained by using the target voidage as the key design parameters in the mix proportion calculation and the key control parameters in the forming process is both reasonable and feasible.
Author Contributions
Data curation and analysis, X.B. and Q.Y.; writing—original draft preparation, X.B.; writing—review and editing, X.B., Z.S. and L.N.; supervision, Z.S. and K.Q. All authors have read and agreed to the published version of the manuscript.
Funding
This research was funded by the National Natural Science Foundation of China under the project numbers (51778037) and (52078024).
Data Availability Statement
The data presented in this study are provided by third author Yan Qiang.
Acknowledgments
The authors are grateful for Beijing University of Civil Engineering and Architecture for providing laboratory facilities and equipment.
Conflicts of Interest
The authors declare no conflict of interest.
References
- Qiu, B. The connotation, approach and prospect of sponge city (LID). Constr. Sci. Technol. 2015, 1, 11–18. [Google Scholar]
- Yi, L. Urban Road Slow System Structure Design and Ecological Effect Research; Chang’an University: Xi’an, China, 2016. [Google Scholar]
- Gang, Z.; Ying, Z.; Qi, W. Flexible base long-life asphalt pavement life cycle cost analysis. Road Traffic Technol. 2009, 06, 60–64. [Google Scholar]
- Xie, H.; Yao, Z.; Zhuang, S.; Tian, S. Compressive resilient modulus of asphalt stabilized macadam drainage layer materials. Highw. Transp. Technol. 2001, 04, 4–7. [Google Scholar]
- Wei, J.; Aimin, S.; Jianzhong, P. Experimental study on fatigue characteristics of porous asphalt mixture. J. Build. Mater. 2012, 15, 513–517+543. [Google Scholar]
- Shang, F. Study on ATPB Base Material and Pavement Structure of Cement Concrete Pavement; Yantai University: Yantai, China, 2011. [Google Scholar]
- Wu, J.; Yin, S.; Chu, W.; Hu, G. Research on gradation design method of large size permeable asphalt mixture. Highway 2015, 60, 214–218. [Google Scholar]
- William, R.V.; William, J.P.; Samuel, H. C1 Bailey Method for Gradation Selection in HMA Mixture Design; Transportation Research Circular Number E2C044: Washington, DC, USA, 2002. [Google Scholar]
- William, R.V.; William, J.P.; Samuel, H. C1 Aggregate blending for asphalt mix design Bailey method. Transp. Res. Rec. 2001, 1789, 146–1531. [Google Scholar]
- Lin, X. Calculation Formula for Reasonable Aggregate Composition of Asphalt Concrete. East China Highw. 2003, 01, 82–84. [Google Scholar]
- Fu, Q. Composition Design and Road Performance Study of Open Graded Large Size Asphalt Macadam; Chang’an University: Xi’an, China, 2008. [Google Scholar]
- Fu, Q. Study on Design Parameters and Methods of Open Graded Large-Size Asphalt Macadam Composition; Chang’an University: Xi’an, China, 2011. [Google Scholar]
- Xin, X.; Xiaoning, Z. Composition design of drainage asphalt mixture based on CAVF method. Highw. Traffic Technol. 2016, 33, 7–12. [Google Scholar]
- Research status and development trend of mineral aggregate gradation design theory. Highway 2008, 01, 170–175.
- Jin, S. Question of determining optimum asphalt content in asphalt mixture mix design. Highway 2001, 11, 1–5. [Google Scholar]
- Zhang, X.; Guo, Z.; Wu, K. Design asphalt mixture by volume method. J. Harbin Univ. Archit. 1995, 02, 28–36. [Google Scholar]
- Zhang, X.; Wang, S.; Wu, K.; Wang, D. CAVF method for asphalt mixture composition design. Highway 2001, 12, 17–21. [Google Scholar]
- Tu, S. Study on the Structure and Performance of High-Performance Graded Crushed Stone Base Based on the Interaction between Particles; Chang’an University: Xi’an, China, 2013. [Google Scholar]
- Institute of Highway Science, Ministry of Transport. Highway Engineering Aggregate Test Procedure (JTG E42-2005); People’s Transportation Publishing House: Beijing, China, 2005. [Google Scholar]
- Ministry of Transport Road Science Research Institute. Test Specification for Asphalt and Asphalt Mixtures in Highway Engineering (JTG E20-2011); People’s Transportation Press: Beijing, China, 2011. [Google Scholar]
- Chang’an University. Specification for Design of Permeable Asphalt Pavement: CJJ/T 190-2012; China Construction Industry Press: Beijing, China, 2012. [Google Scholar]
- Yi, W. Study on Meso Fatigue Mechanism and Fatigue Prediction Model of Asphalt Mixture; Chang’an University: Xi’an, China, 2015. [Google Scholar]
- Jun, X.; Wenhao, L. Comparative analysis of three fatigue test methods for asphalt mixture. Chin. Foreign Highw. 2018, 38, 197–202. [Google Scholar]
- AASHTO, TP. 105-13 (2013) Standard Method of Test for Determining the Fracture Energy of Asphalt Mixtures Using the Semicircular Bend Geometry (SCB); American Association of State and Highway Transportation Officials (AASHTO): Washington, DC, USA, 2013. [Google Scholar]
- AASHTO, TP. 124-16 (2016) Standard Method of Test for Determining the Fracture Potential of Asphalt Mixtures Using the Semicircular Bend Geometry (SCB) at Intermediate Temperature; American Association of State and Highway Transportation Officials (AASHTO): Washington, DC, USA, 2016. [Google Scholar]
- China Road and Bridge Technology Co., Ltd. Specification for Design of Highway Asphalt Pavement (JTG D50-2017); People’s Transportation Press: Beijing, China, 2007. [Google Scholar]
- Ministry of Transport Institute of Highway Sciences. Technical Specification for Design and Construction of Drainage Asphalt Pavement (JTG/T3350-03-2020); People’s Transportation Press: Beijing, China, 2020. [Google Scholar]
| Publisher’s Note: MDPI stays neutral with regard to jurisdictional claims in published maps and institutional affiliations. |
© 2021 by the authors. Licensee MDPI, Basel, Switzerland. This article is an open access article distributed under the terms and conditions of the Creative Commons Attribution (CC BY) license (https://creativecommons.org/licenses/by/4.0/).


