1. Introduction
The existing buildings in Bosnia and Herzegovina and the Western Balkan region are traditionally built as clay brick or stone masonry buildings. Brick masonry prevails among various residential buildings from the last century, while a lot of older historic buildings were made of stone masonry. Large-scale reconstruction after World War II introduced the massive application of reinforced concrete structures in newly erected buildings, but masonry structures are still built applying new technologies and materials [
1]. Most of the existing masonry buildings were built before the introduction of modern seismic codes, most commonly as unreinforced masonry without any confinement. As a consequence, compared with the buildings designed in accordance with contemporary technical codes, the existing buildings are more vulnerable when exposed to earthquake motions. Their structure is rather stiff and they exhibit relatively brittle behavior. Even earthquakes of moderate intensity are sufficient to cause the first cracks. Several strong earthquakes hit the region of the Western Balkans in the last 50 years (Skopje 1963, Banja Luka 1969 and Montenegro Coast 1979), causing significant human losses and heavy damage to building structures, including partial and total collapse of some buildings [
2,
3]. This underlines the importance of seismic vulnerability assessment, which can lead to strengthening and retrofit measures, applied not only on load-bearing structures [
4,
5,
6], but also in soil and infrastructure [
7,
8]. The latest relatively moderate earthquakes that hit Croatia in 2020 resulted in heavy damage on the older masonry buildings in Zagreb and especially Petrinja, many of which have already been demolished [
9,
10].
In order to estimate the seismic vulnerability of the existing masonry buildings, the classification given within European Macroseismic Scale (EMS) could be implemented [
11]. Depending on the structural system and material, the buildings are grouped into vulnerability classes from A to F, where class A represents the weakest seismic structures and class F represents those structures expected to exhibit very good seismic performance. Typical unreinforced masonry structures belong to classes B and C, meaning that heavy and very heavy damage, including partial or even total collapse, can be expected in stronger earthquakes.
A series of experiments on full and reduced scaled masonry walls, followed by a detailed numerical analysis were conducted at the Institute for Materials and Structures of the Faculty of Civil Engineering, University of Sarajevo, in close cooperation with the Institute for Lightweight Structures and Conceptual Design, University of Stuttgart [
12]. The goal was to inspect the seismic performance of masonry walls, typical for multi-story unreinforced masonry buildings built in the 1950s and the beginning of the 1960s in the city of Sarajevo, Bosnia and Herzegovina. Similar masonry wall structures were common for the whole region, which belongs to the seismically active area of Southeast Europe.
The experimental part of the research started with the tests on masonry constituents, brick, mortar, and their interface [
13]. This was followed by tests on full- and half-scale unreinforced masonry walls exposed to constant gravity load and horizontal in-plane forces applied at the top of the wall. The third phase included walls strengthened with reinforced jacketing. Horizontal forces were applied as a static cyclic load, which increased incrementally.
Results of compressive strength and modulus of elasticity tests performed on prismatic samples (l/h/t = 51.4/64.6/12 cm) are presented first. Then, experimental investigation on two plain full-scale walls (l/h/t = 233/241/25 cm) under cyclic lateral and gravity load is discussed. The walls are not vertically confined, which was typical for structural walls before the introduction of seismic codes in the mid-1950s. Finally, two-sided jacketing was applied to strengthen the walls and analyze response in comparison to the unreinforced specimens. Different concepts and methodologies for strengthening are given in the literature, where experimental investigation is essential for the assessment of structural behavior [
14,
15,
16,
17]. Typical techniques used to reinforce the masonry structure include mortar injections, reinforced drilling, and reinforced concrete plaster (jacketing). In many cases, less invasive strengthening methods, such as fiber-reinforced matrix system with lime-based mortar or fiber reinforced polymer grids, are preferred [
18,
19,
20]. In this research program, two reinforced concrete jacketing approaches to strengthen the full-scale walls were applied: one with the reinforcement mesh inclined to 45° (135°) and the other with an orthogonal mesh position. Depending on the test performed, the results obtained from different wall specimens are presented as hysteretic and pushover curves. Load bearing and deformability parameters related to characteristic limit states (crack limit, maximum resistance, and ultimate limit state) are also given.
2. Testing of Elastic Modulus and Compressive Strength of Masonry
The tests were performed according to EN 1052-1 [
21] on six prismatic single-wythe samples (wallets) l/h/t = 51.4/64.6/12 cm labeled with P1–P6 (
Figure 1). The smallest possible specimen size was chosen with respect to EN 1052-1 (thickness of wallet equal to unit thickness) because of ease of sample manipulation. Samples P1 and P2 were made with mortar that has an average strength of 4.29 N/mm
2, while others were made with mortar of 2.3 N/mm
2 compressive strength. It is noted that the hardening conditions of mortar in a mold and a prism are very different because bricks absorb water from mortar. Horizontal and vertical joints are 1.4 cm thick on average. Compression was applied monotonically using an Amsler 5 MN press at a speed of approximately 0.20 N/mm
2/min and deformations were monitored by eight axial LVDTs. Secant modulus of elasticity was determined from the stress and deformation ratio at 1/3 of the compressive strength (E
m = F
max/3εA
w).
The resulting mechanical properties are presented in
Table 1.
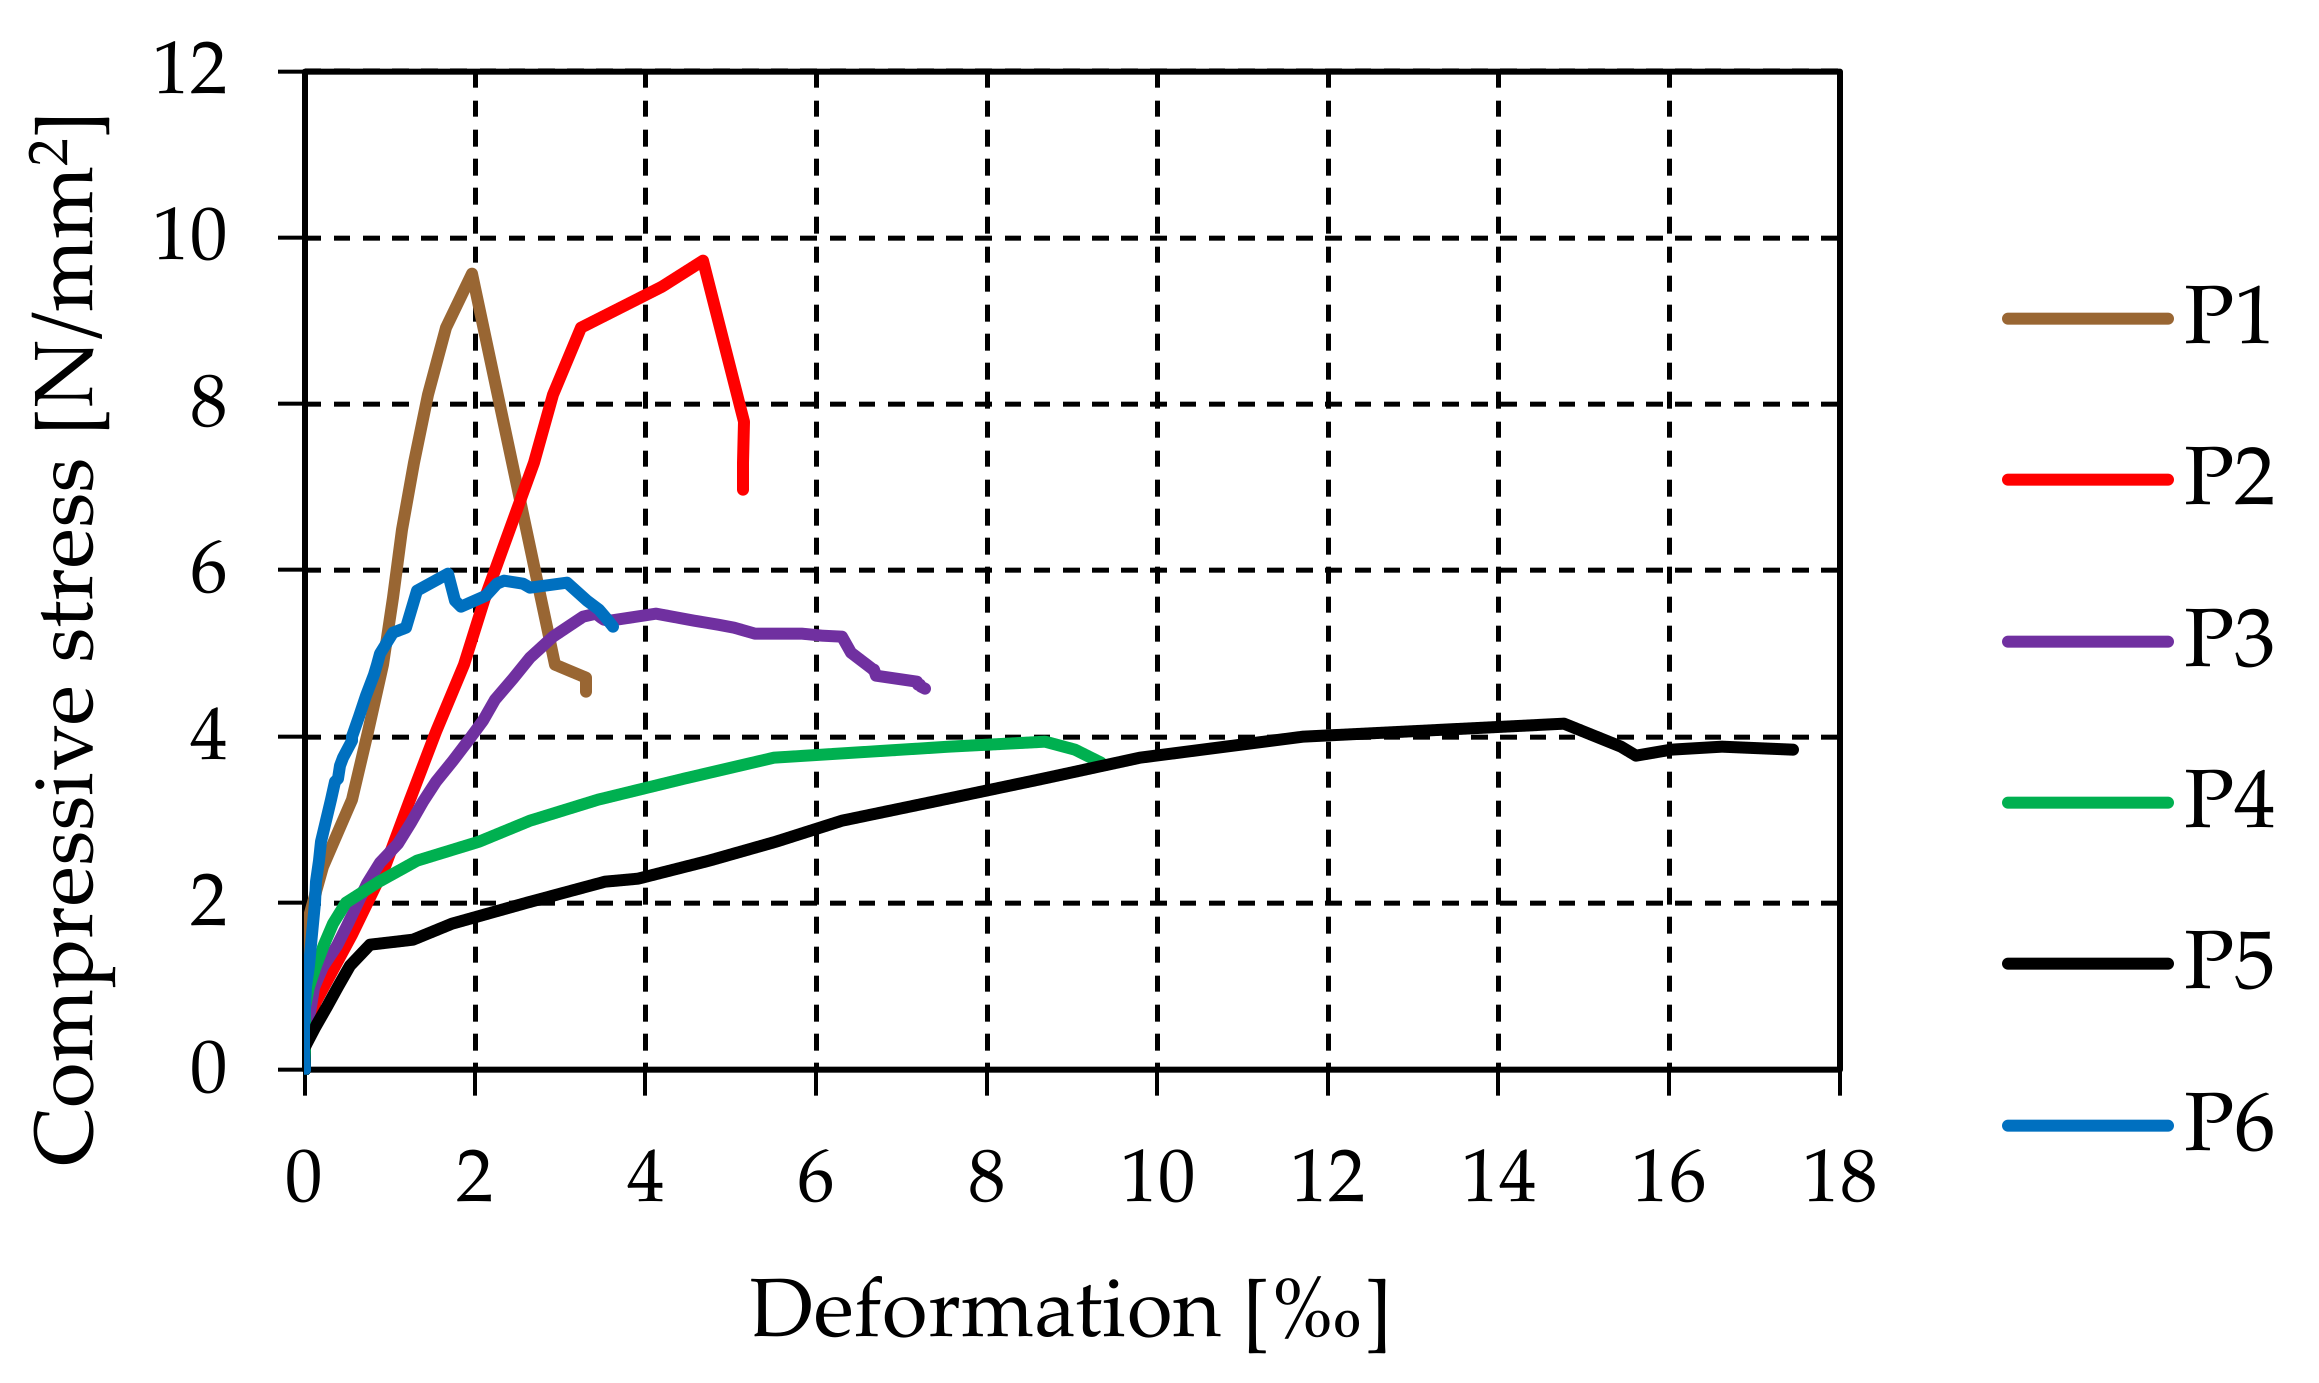
Figure 2 shows the experimentally determined stress-deformation diagrams for six masonry prisms. Vertical displacement of each prism is defined as the average displacement of all LVDTs. The compressive stress is defined as the relationship of the vertical load and the initial prism surface, despite the joints not being completely filled. The compressive strength amounted to 6.48 N/mm
2 on average. The coefficient of variation (COV) was quite large and it was equal to 36%. The mean value of Young’s modulus was 4024 N/mm
2, with a COV of 46%. If experimentally obtained values of the modulus of elasticity are compared with the recommendation given in EC 6, according to which E
m = 1000 f
k [
22], one can conclude that the test yielded significantly lower Young’s moduli. However, according to Tomaževič [
23], the elastic modulus can vary in the range of 100 f
k ≤ E
m ≤ 1000 f
k.
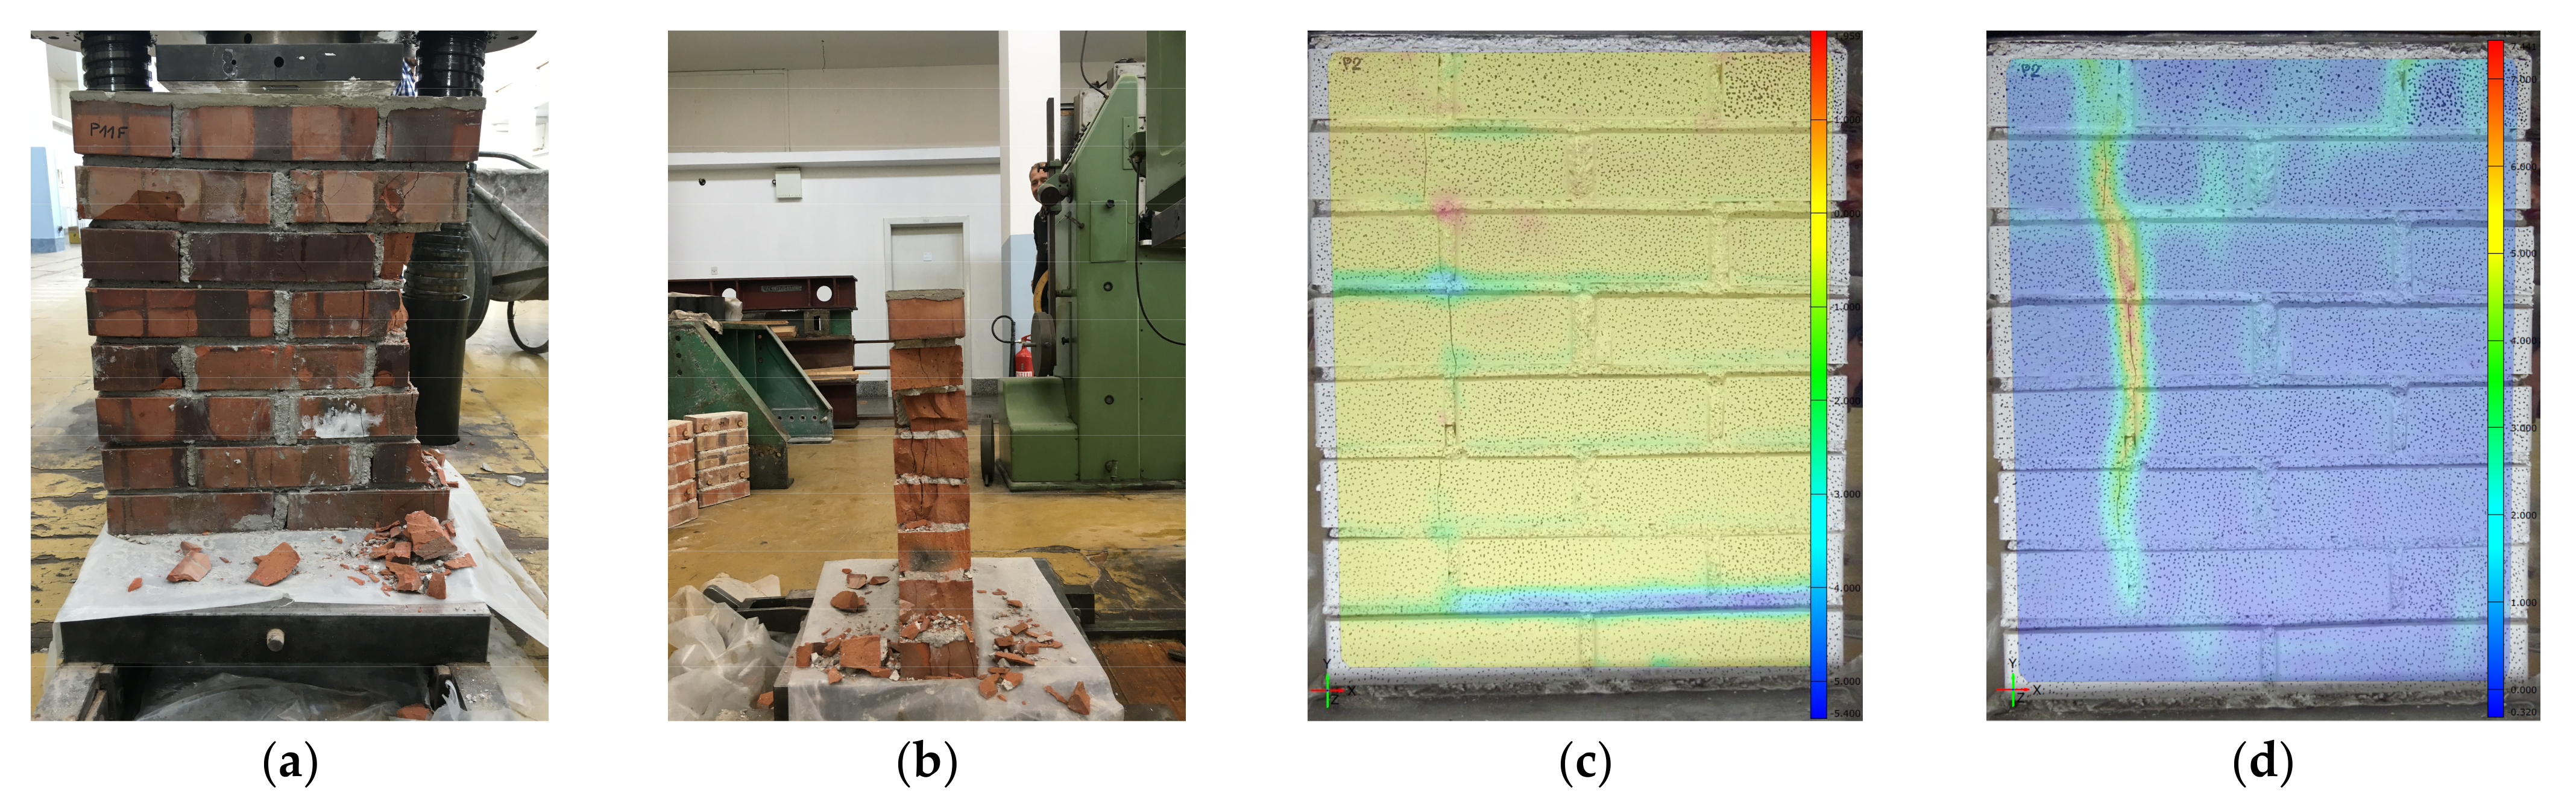
A typical failure pattern characterized as multiple-axial splitting of the masonry prism is shown in
Figure 1a,b. Localization of vertical cracks was performed using digital image correlation in GOM Correlate (
Figure 1c,d) [
24].
3. Experimental Analysis of Full-Scale Walls
The program of experimental investigations of the wall behavior refers to tests under constant vertical precompression applied at the free upper edge and cyclic horizontal in-plane static load. The intensity of the vertical stress is approximately equal to the serviceability stress of a real masonry wall. A total of four walls were examined: two unreinforced (marked as W1 and W2) and two strengthened with reinforced concrete jackets (W3 and W4). The experimental results which include failure mode, force-displacement curve, degradation of load-bearing capacity under repeated loading, characteristic limit state, degradation of stiffness, and energy dissipation capacity are presented for each wall separately.
3.1. Overview
3.1.1. Materials and Wall Geometry
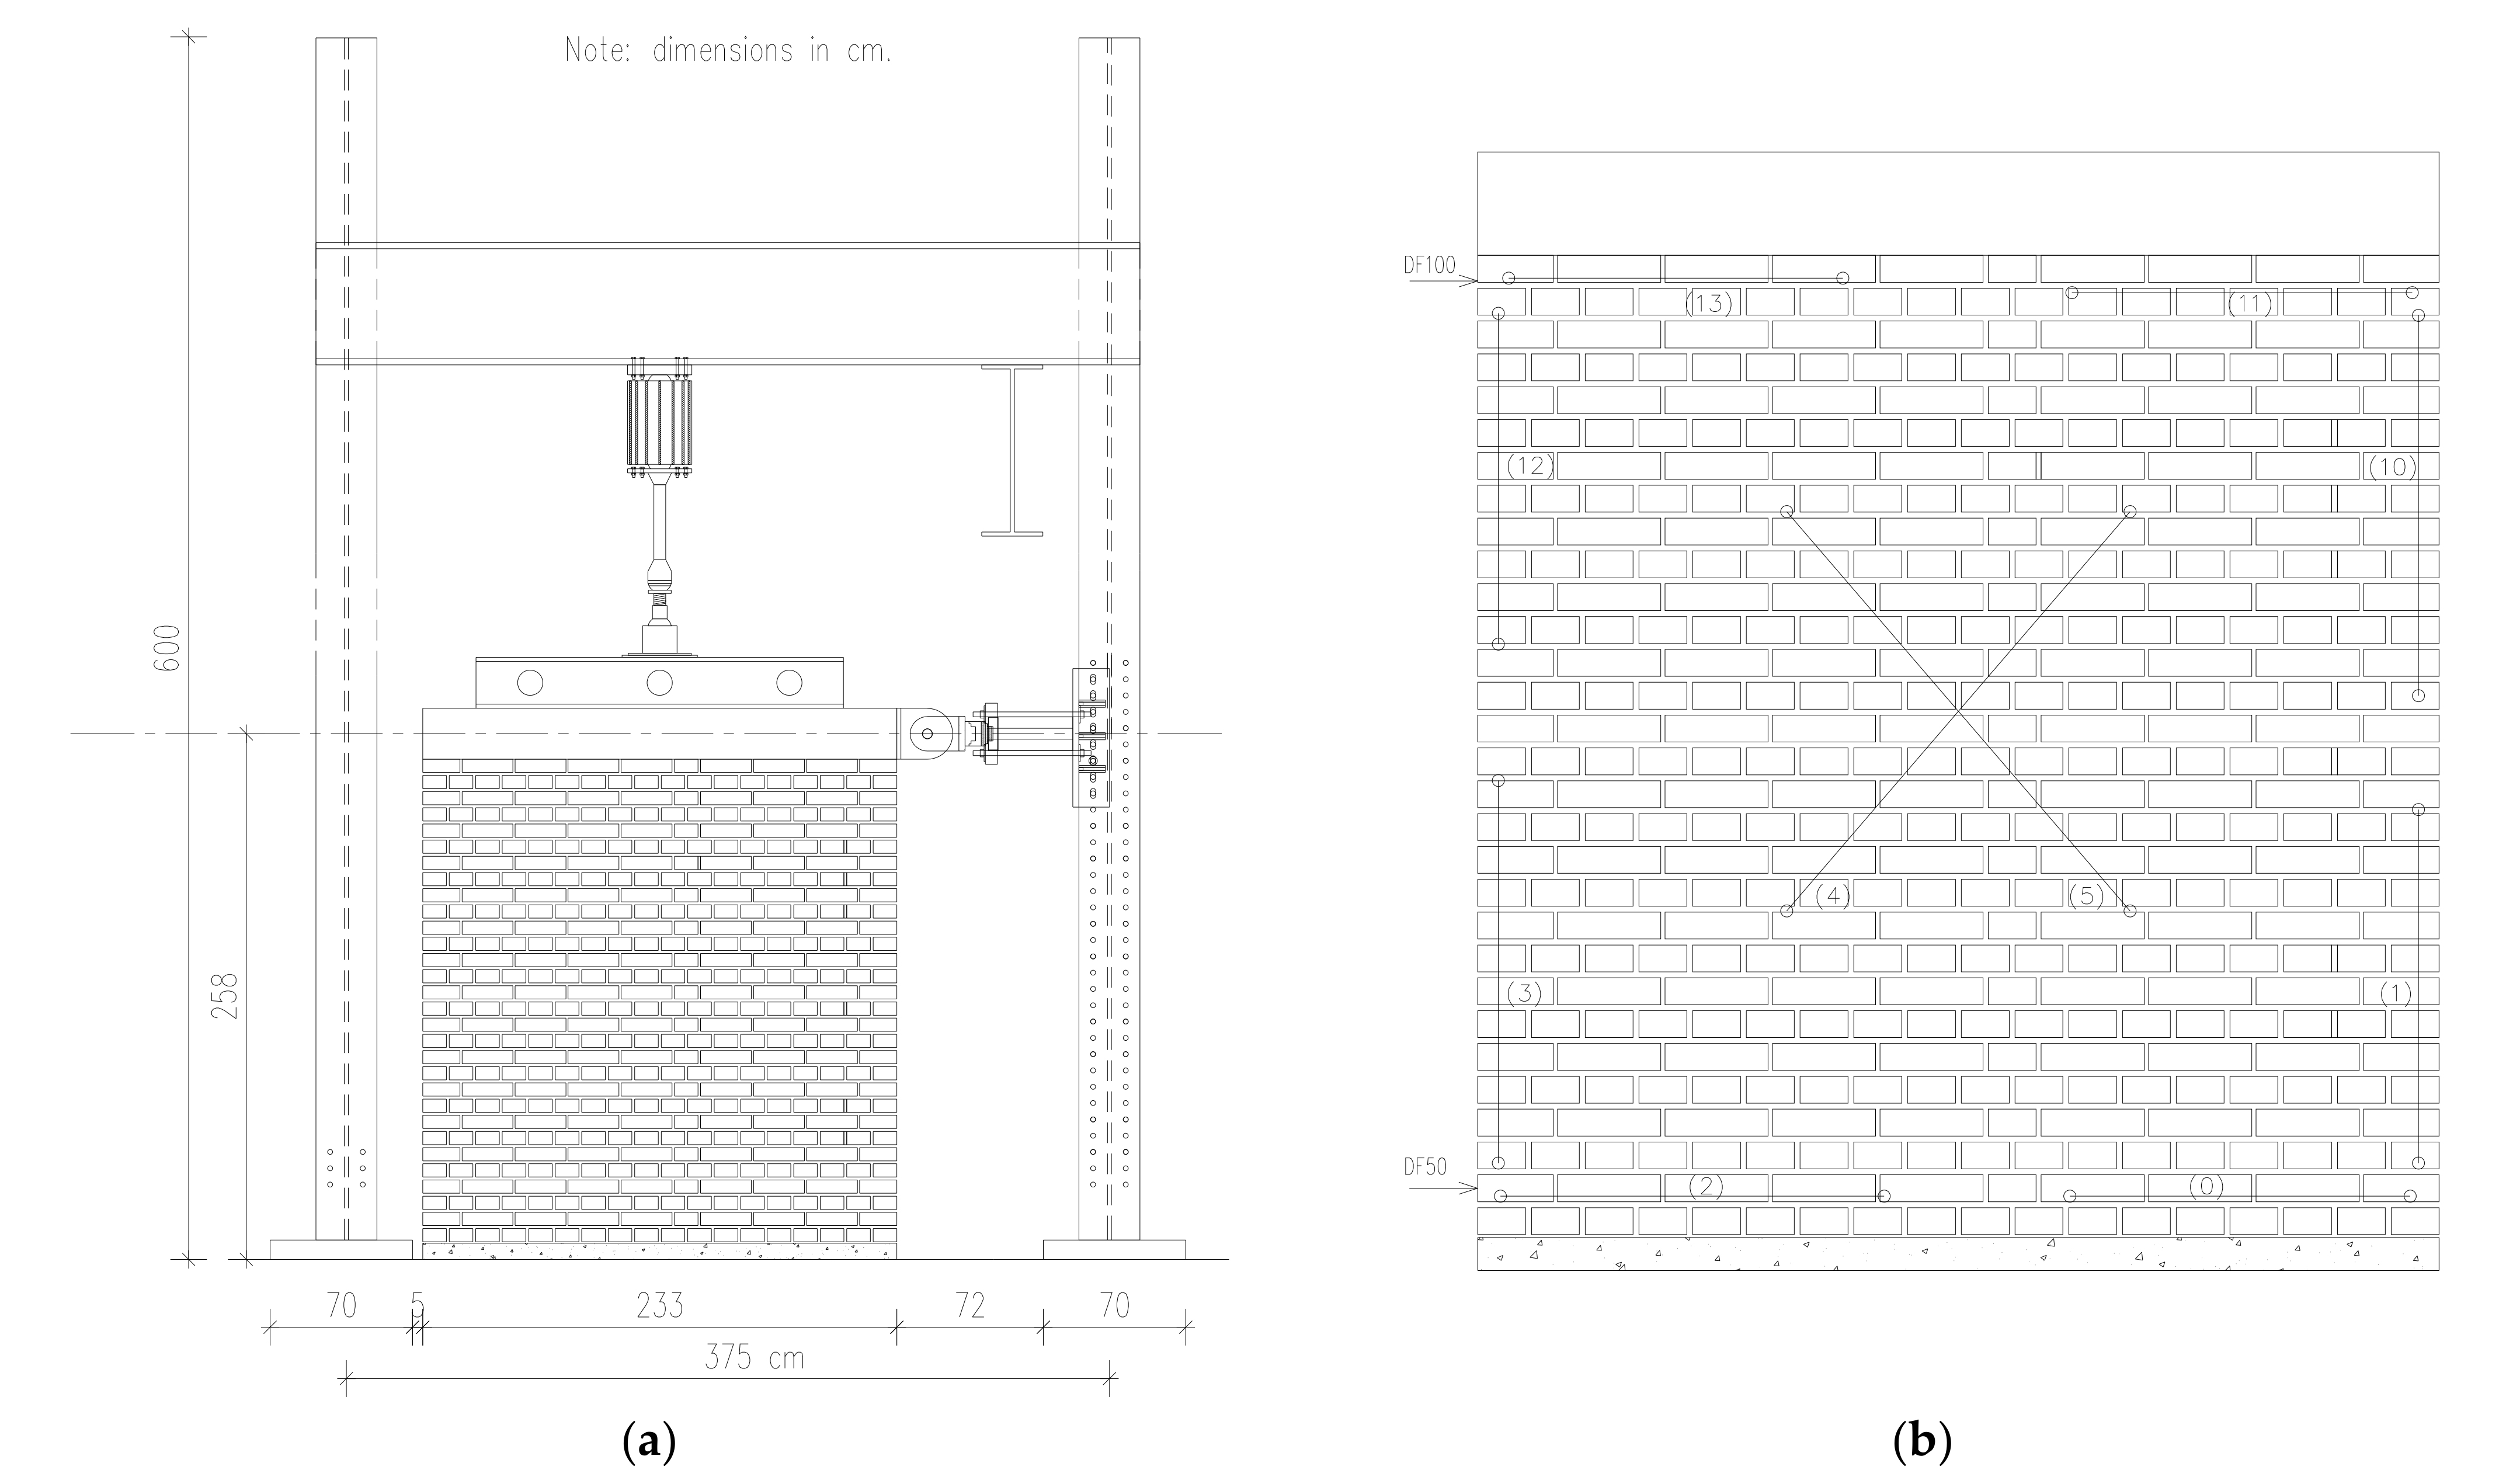
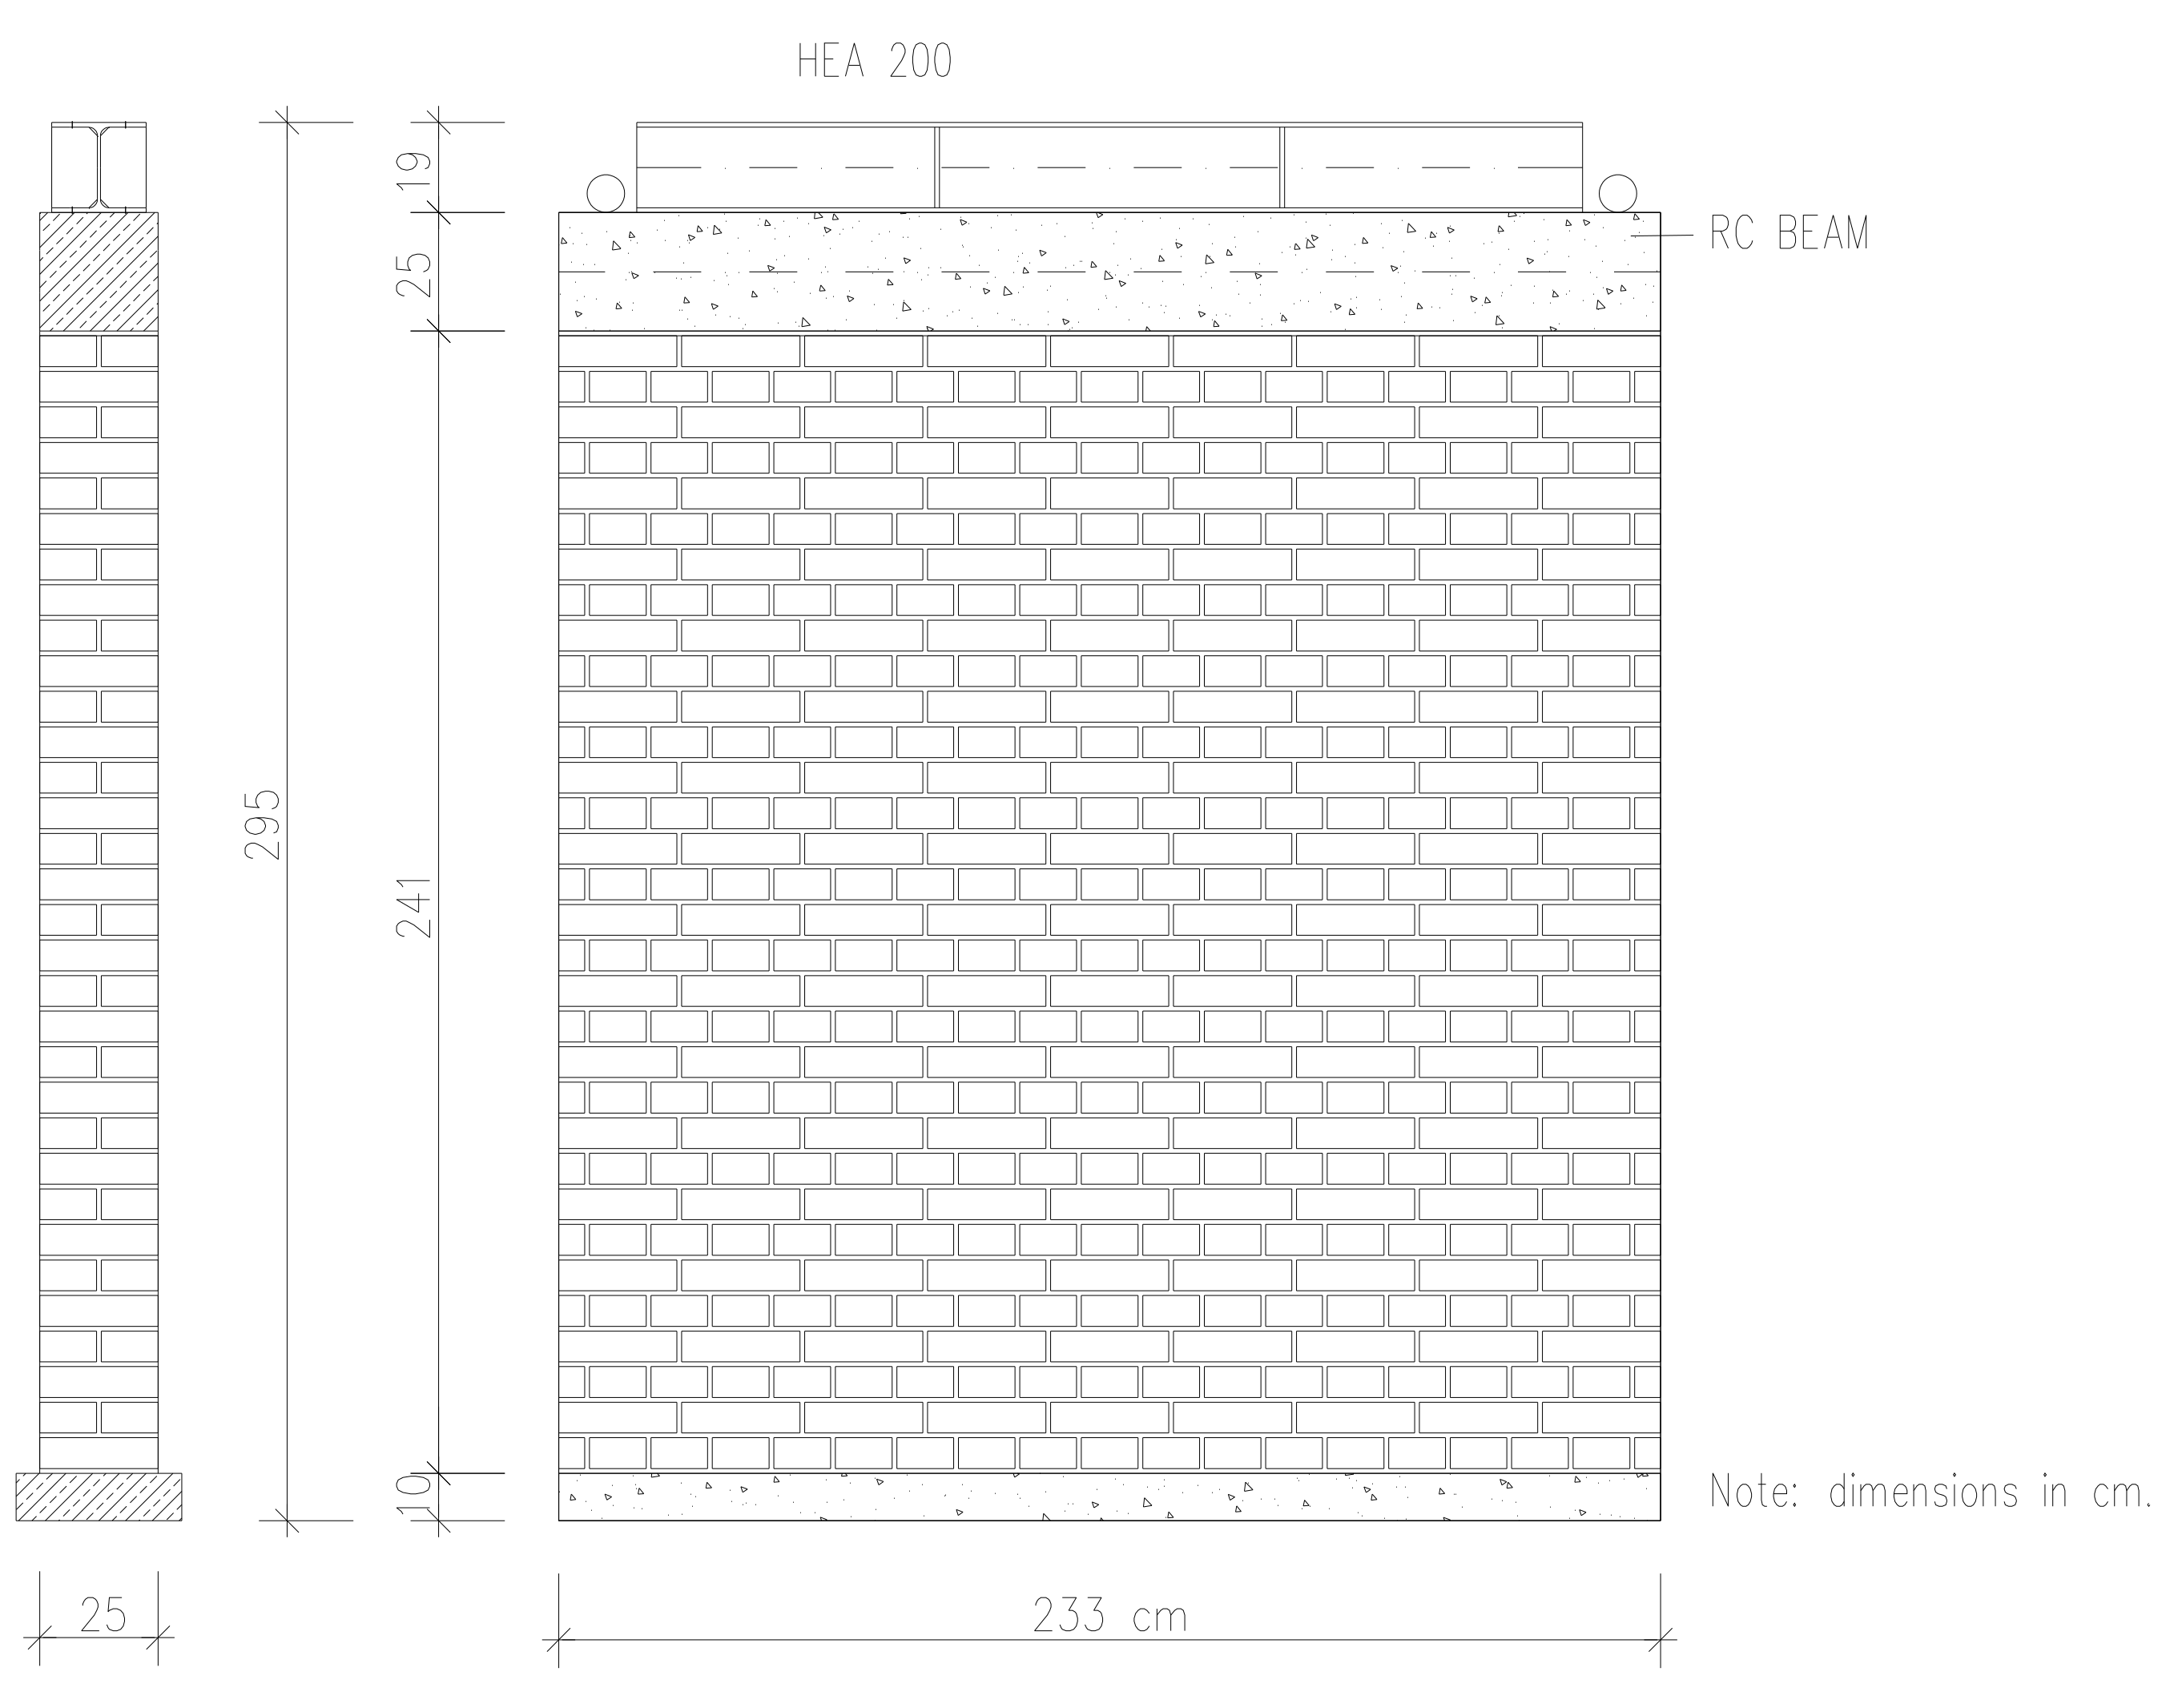
The geometry of the URM wall was adapted to the available test equipment with additional restraining elements. It corresponds to a wall in an existing building typical for the period after World War II. All samples were built in the structural laboratory of the Institute for Materials and Structures, Faculty of Civil Engineering in Sarajevo. Dimensions of the unstrengthened walls (W1 and W2) are l/h/t = 233/241/25 cm (
Figure 3). The height-over-length ratio of the walls is approximately 1:1, so the specimens do not belong to either slender or long walls. They are mounted on a beam consisting of a UNP400 steel profile filled with concrete. A thin mortar layer was installed at the top of the beam to level the first row of bricks. Before placing mortar, bricks were immersed in water to achieve better bond and prevent early drying of mortar. All vertical joints are filled with mortar. Horizontal joints were made using spacers to ensure constant thickness of the joints.
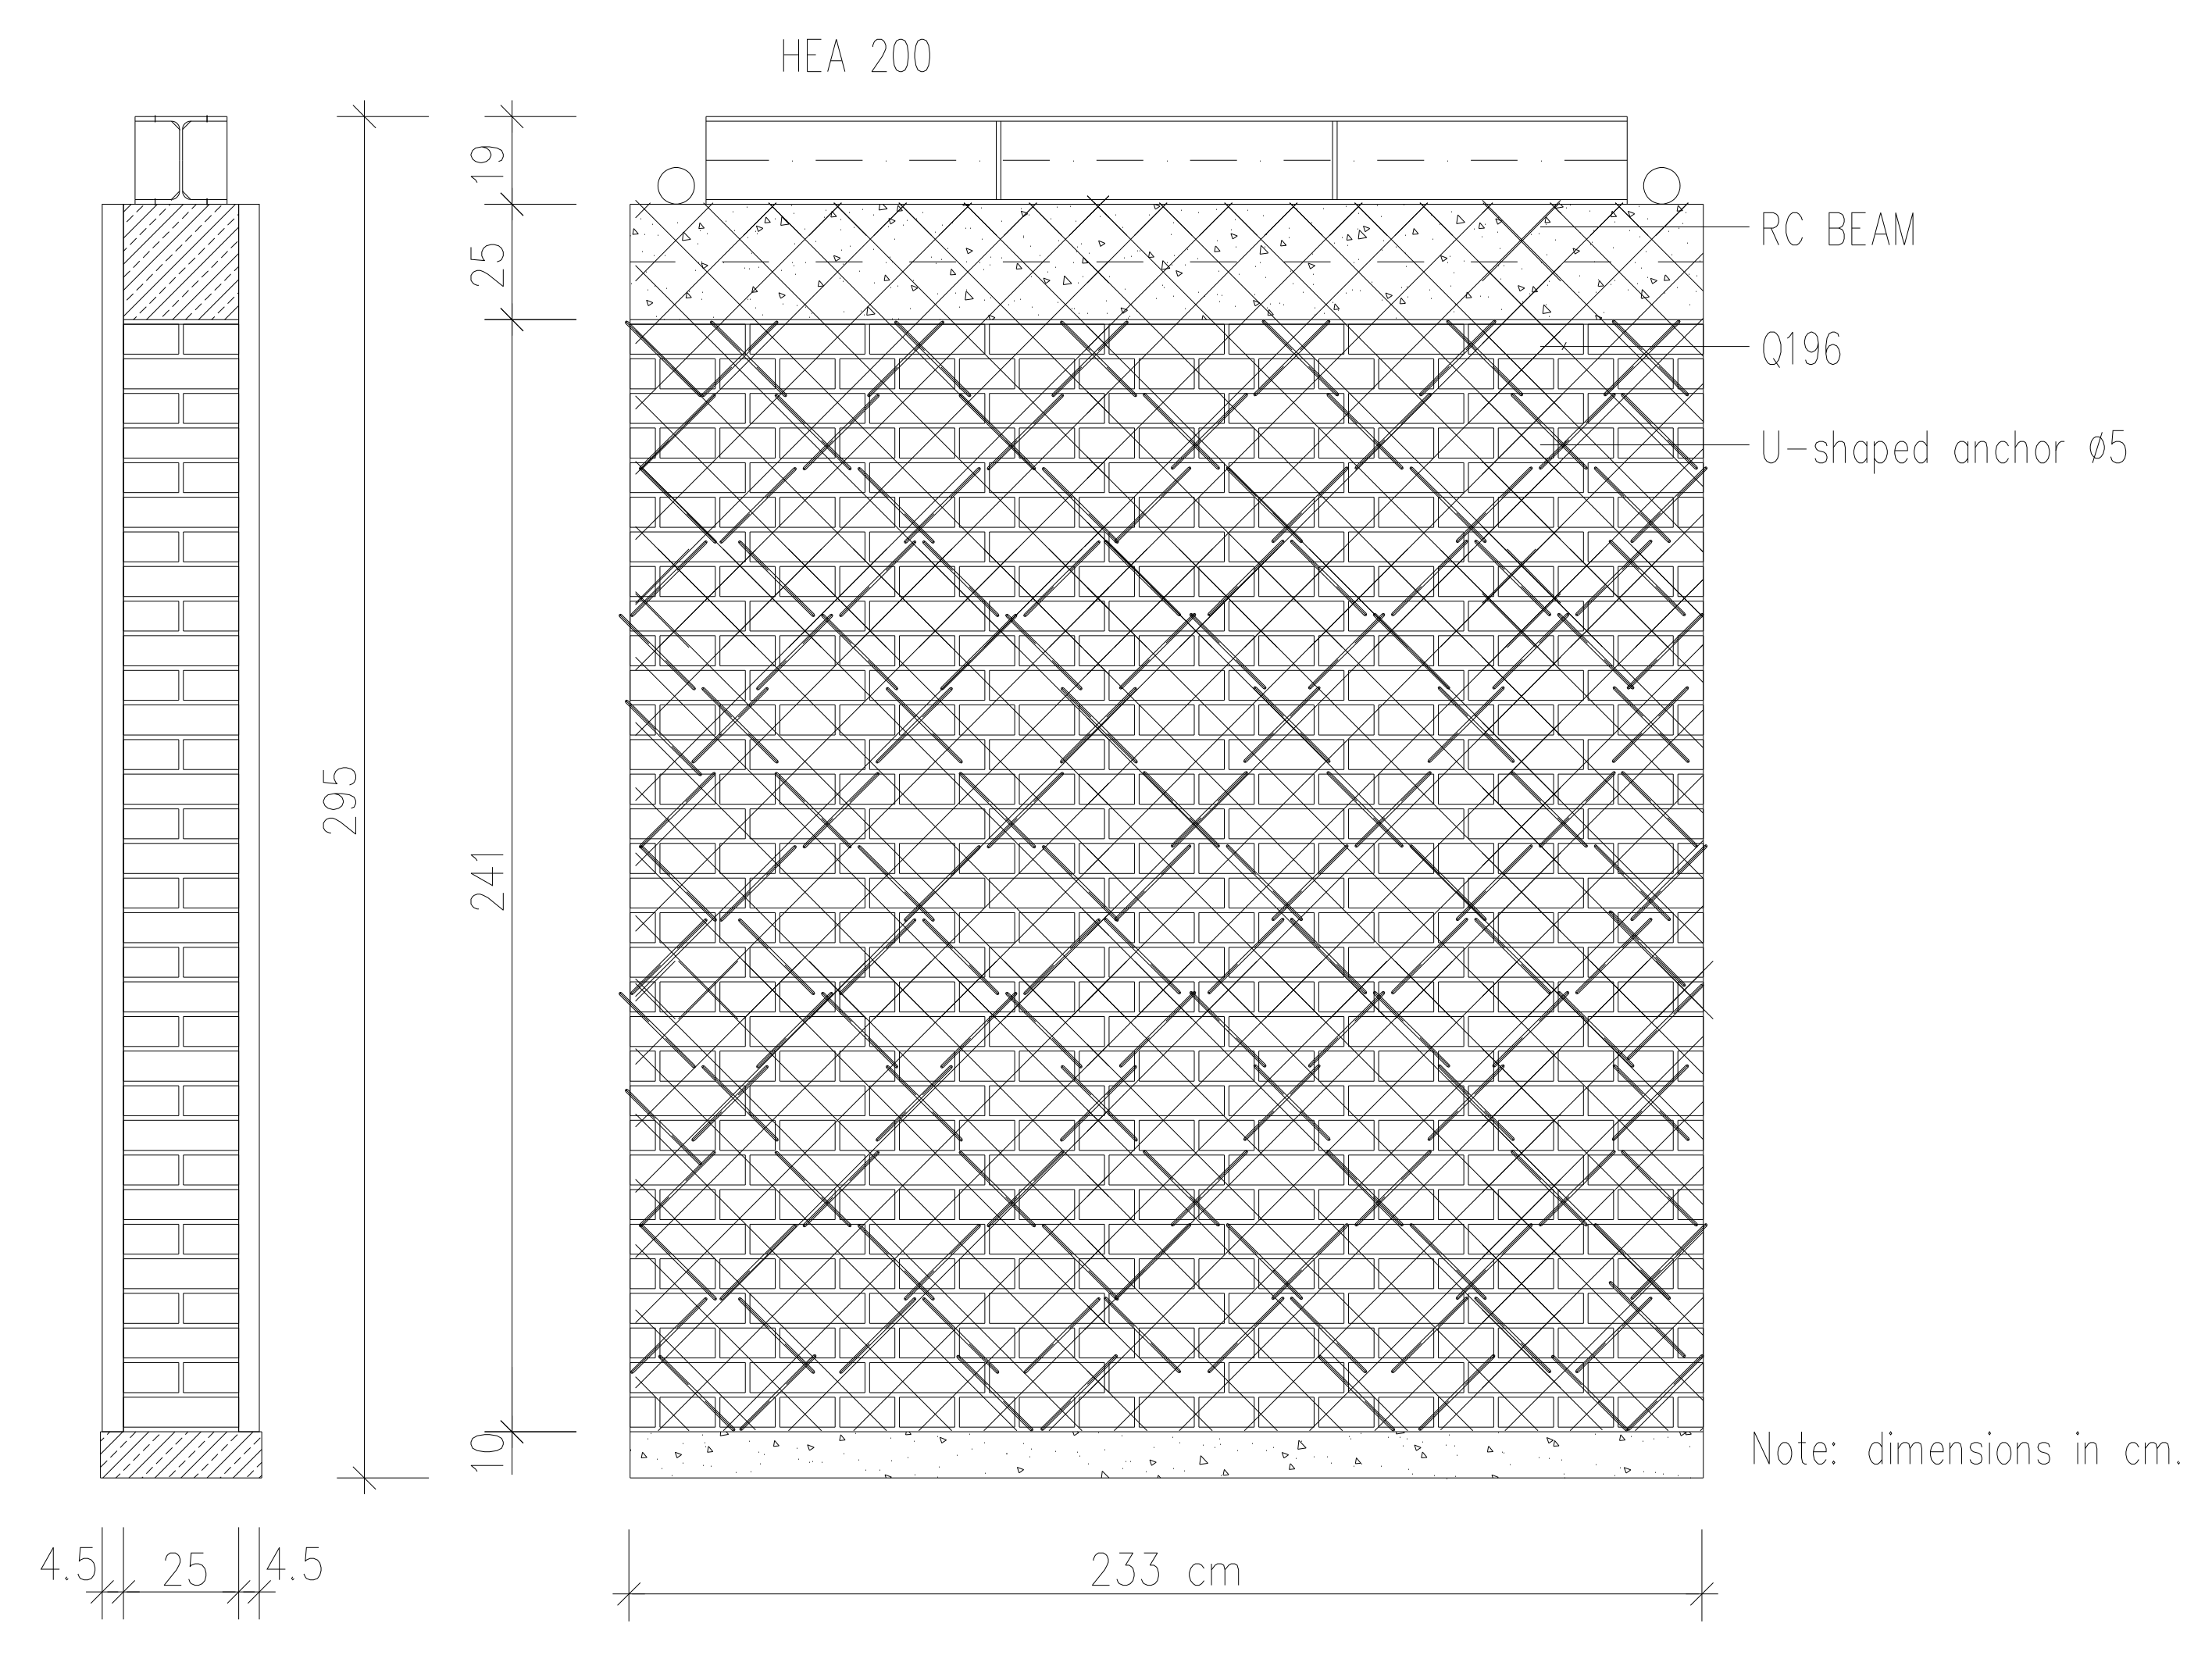
Unlike the plain wall, the strengthened wall has additional reinforced concrete jacketing 4–5 cm thick over both wall faces. With the exception of concrete C35/45 (maximum grain size 16 mm) and reinforcement B500S, they are constructed of the same materials whose mechanical properties are shown in the previous chapter and in [
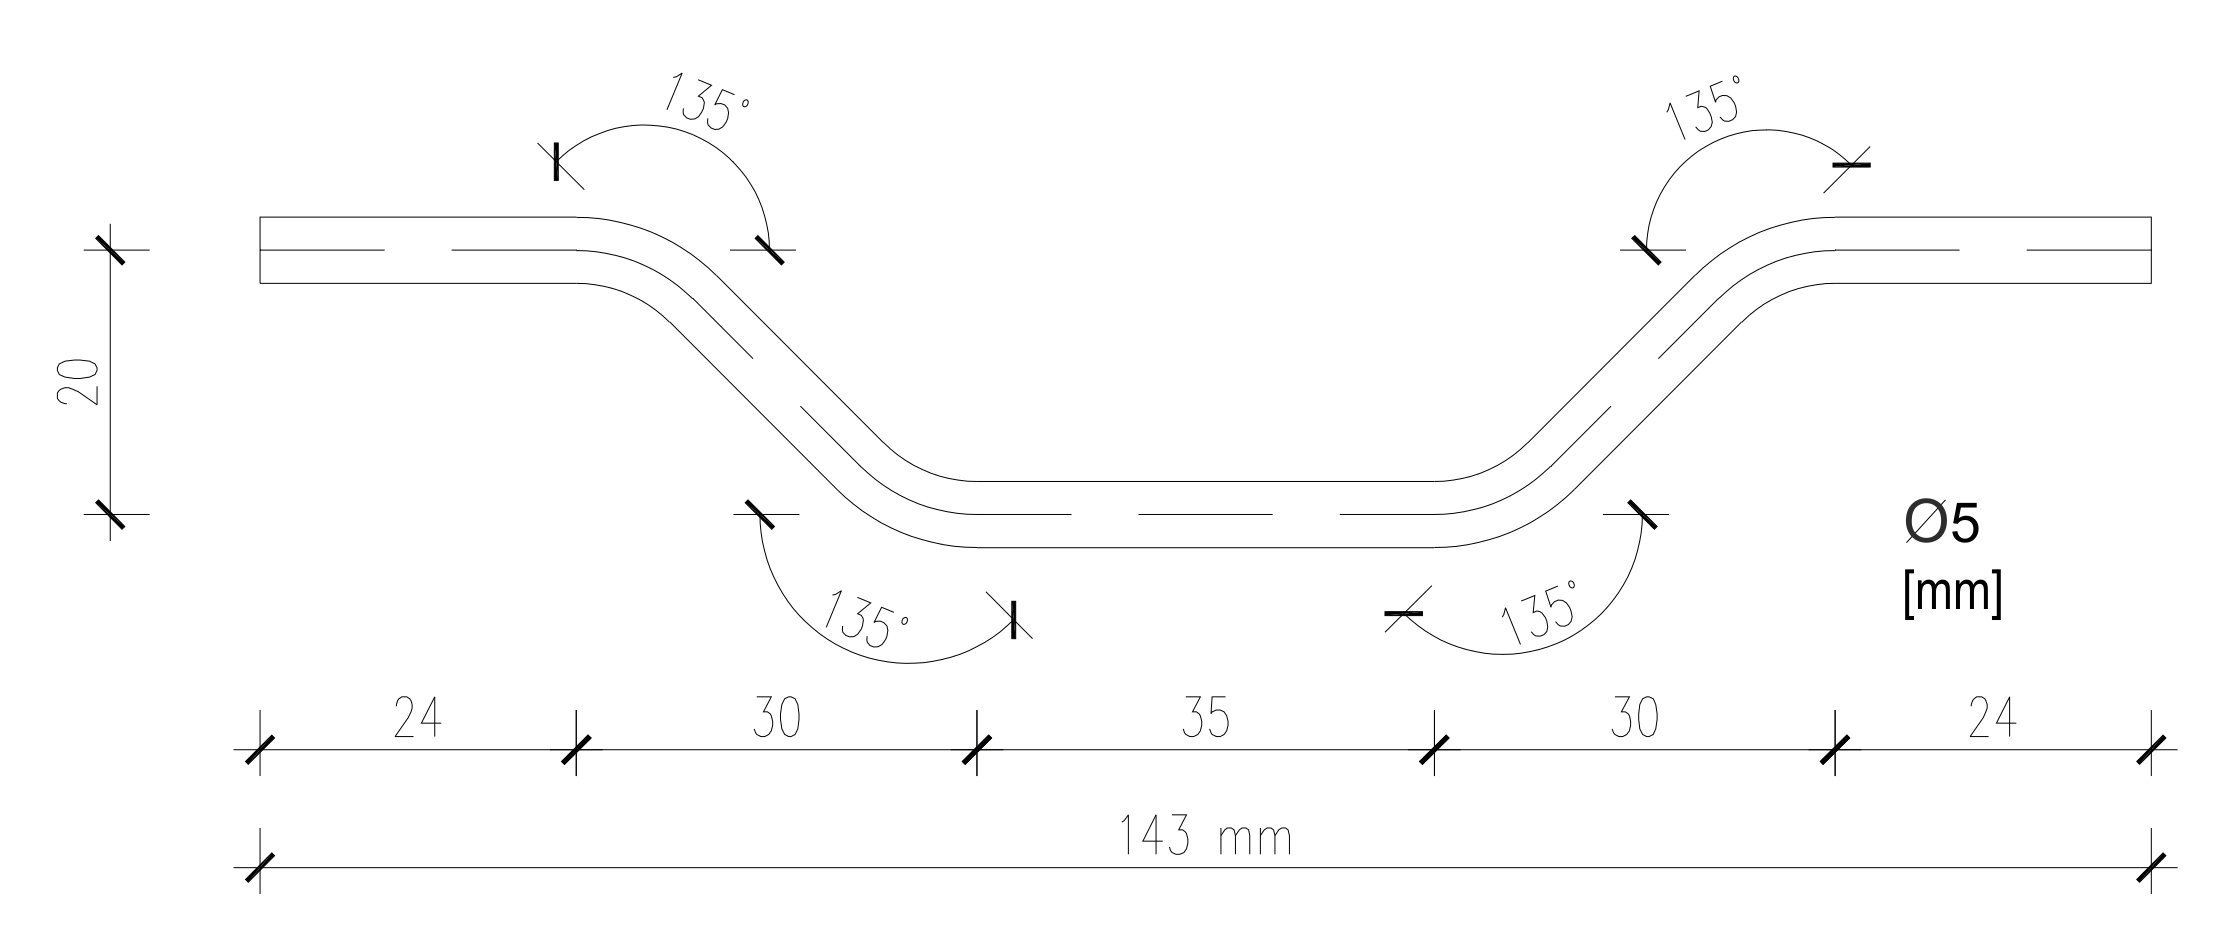
13]. Strengthened walls were built in several stages. After the bricks were laid, Q196 (Ø5/10 cm) reinforcement mesh was installed on both sides. The mesh was placed in the direction of principal stress trajectory at an angle of 45° (135°) on the first wall (W3) and attached to the wall utilizing U-shaped anchors Ø5mm (
Figure 4) (strengthening Type I). The anchors were also inclined and placed into pre-drilled holes grouted with cement mortar. In order to ensure the full bond, there were approx. 25 connectors/m
2 on one side of the wall. The number of anchors is significant, which might be unrealistic in practical cases.
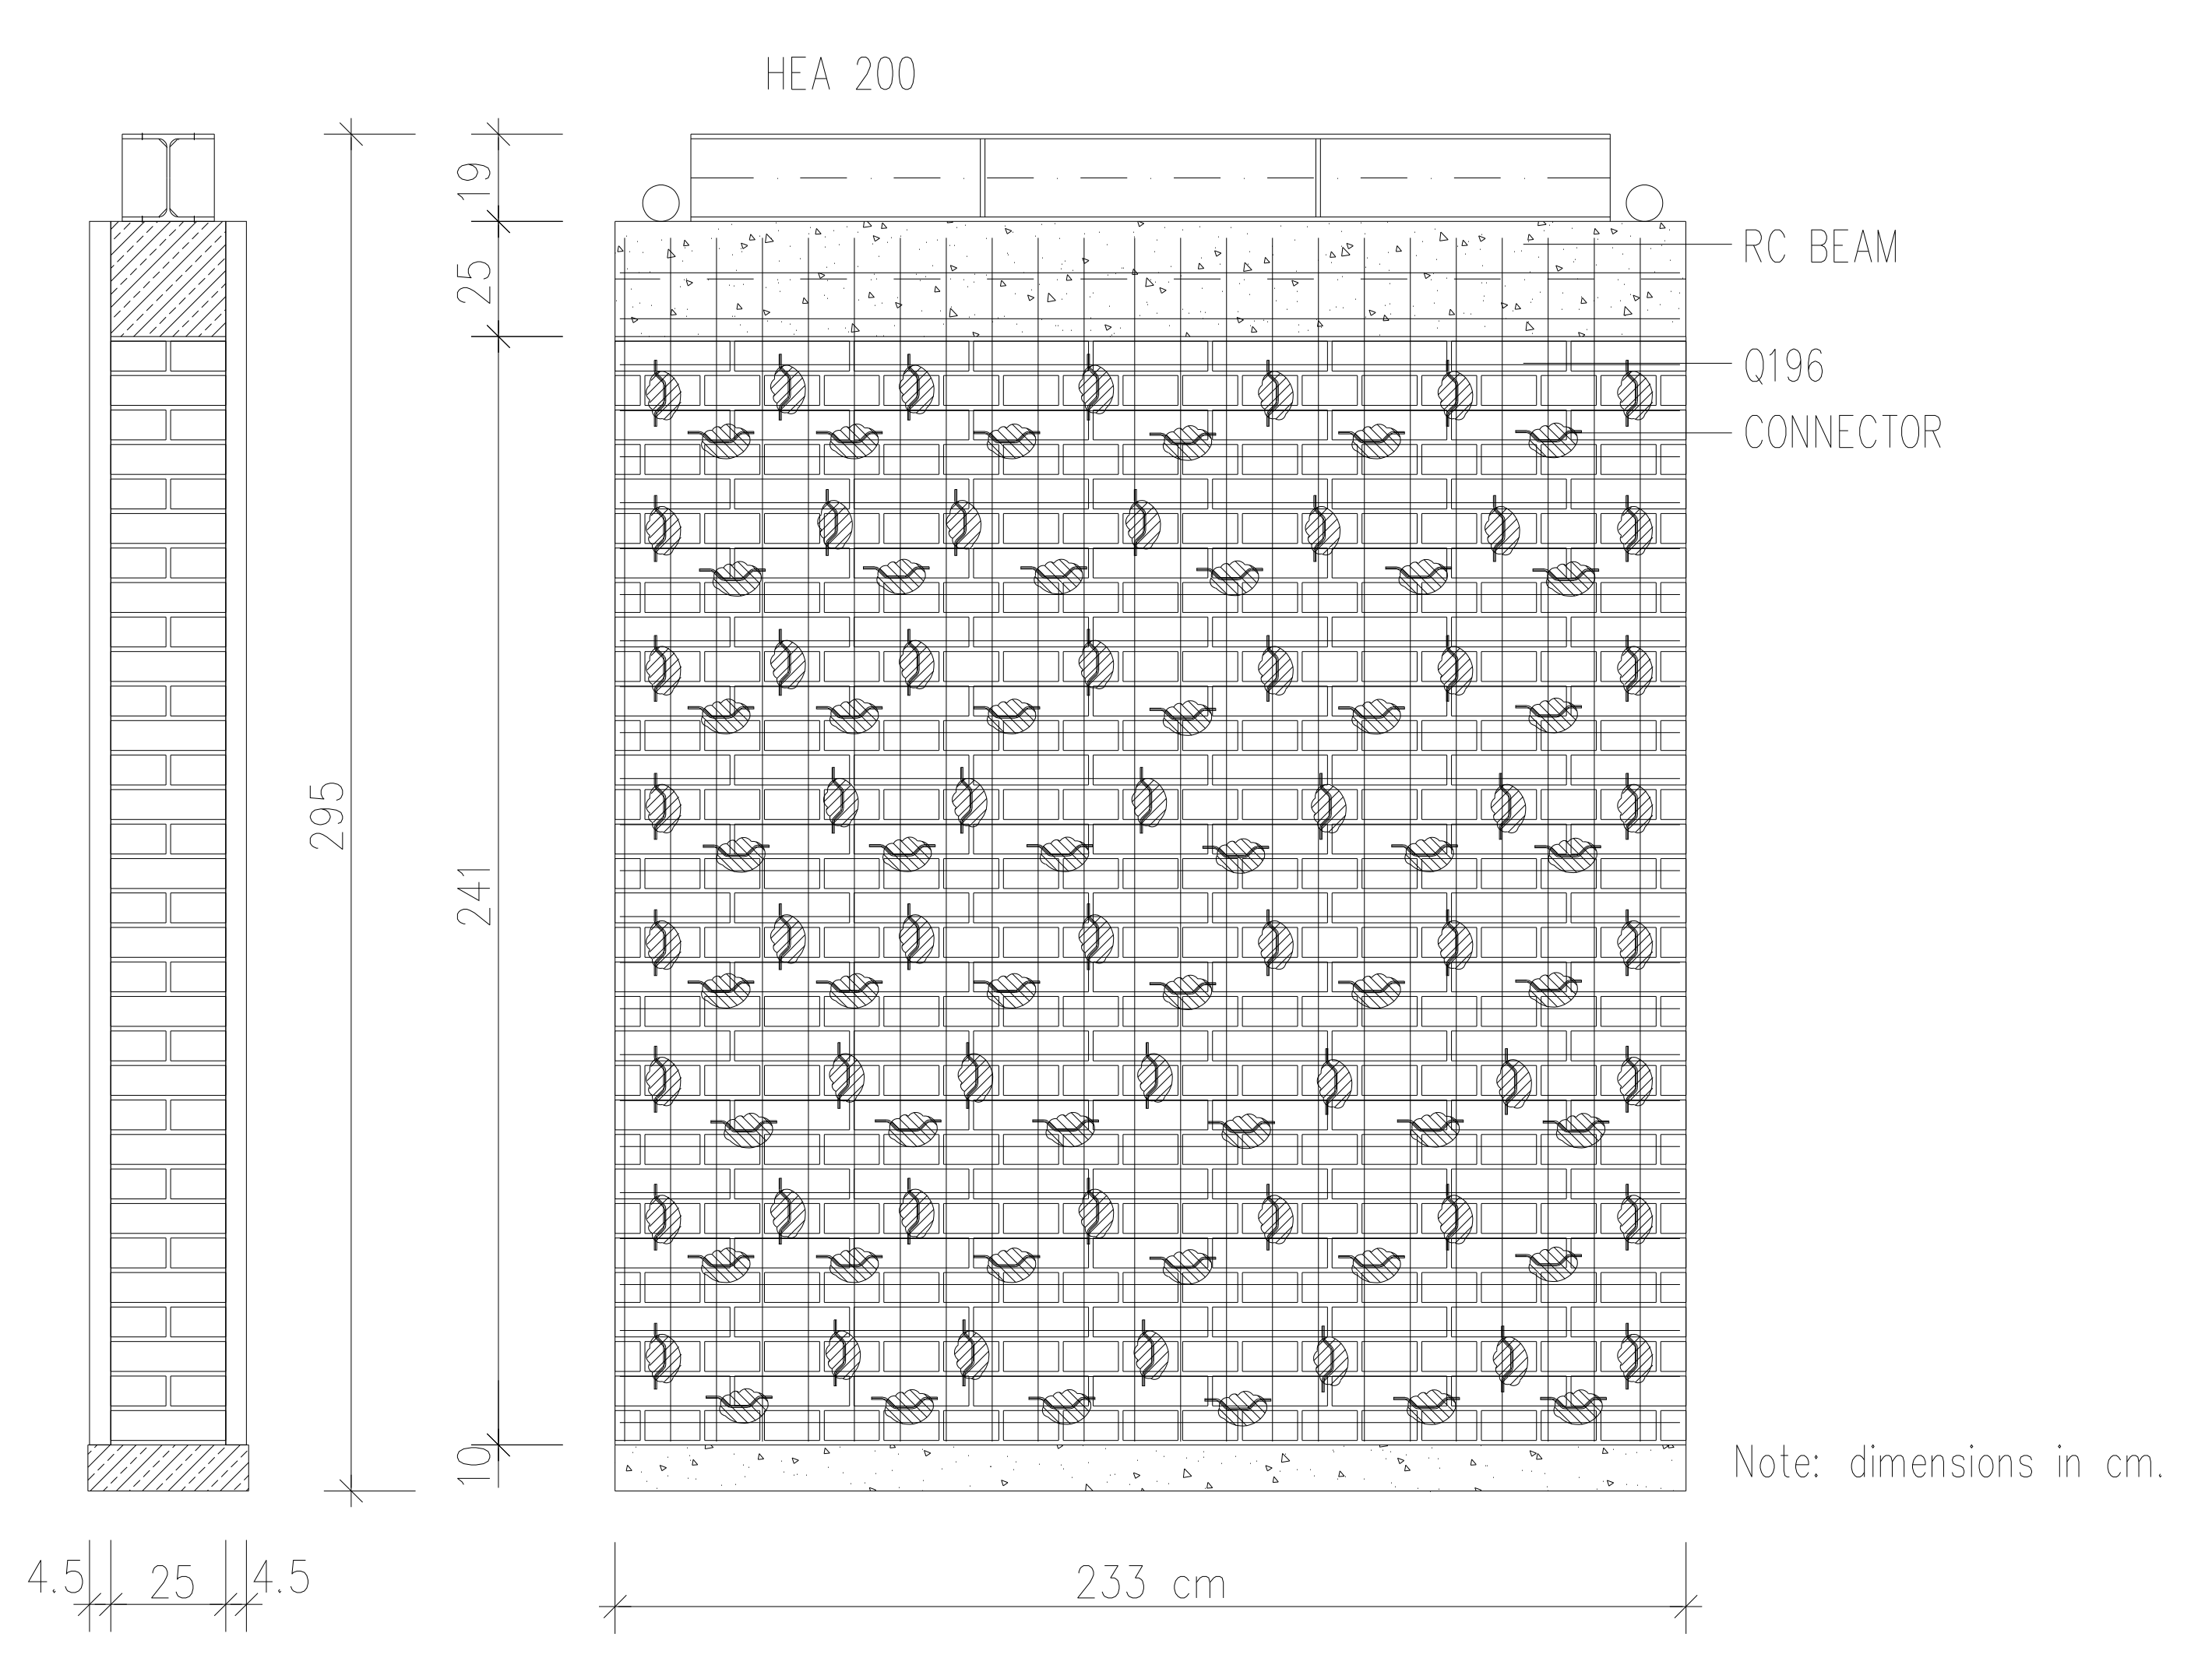
The mesh was placed vertically on the second wall (W4), but with the use of a specially developed reinforcement detail (connector), which was inserted into horizontal and vertical joints and thus connects the concrete to the wall (
Figure 5 and
Figure 6) (strengthening Type 2). The connector was glued to the wall using a high-strength quick hardening mass, and there were approx. 100 pieces on one face of the wall.
3.1.2. Test Configuration and Loading Program
To transmit horizontal and vertical force, a beam of concrete quality class C25/30 measuring 25/25/233 cm was concreted on top of the wall. The beam was reinforced with B500S steel, longitudinally with ± 3Ø16 and transversely with Ø8/10. Steel sheets with an oval hole used to transmit horizontal force were welded to the longitudinal bars. After placing the wall in the test position, the lower UNP 400 beam was anchored to the rigid floor slab in order to prevent sliding and uplifting. A rigid steel profile was placed along the upper concrete beam to enable uniform distribution of the vertical force. Below the hydraulic actuator, in the middle of the wall, there was a Teflon bearing that allowed horizontal movement (
Figure 7a). The layout of displacement transducers is shown in
Figure 7b. Walls in buildings are usually exposed to low compressive stresses. The normal stress in a typical wall between windows is about 0.4 N/mm
2. Therefore, this magnitude of the vertical stress (force equal to 230 kN) was prescribed in the tests. Jacketed walls were also tested under stress of 0.8 N/mm
2 (force equal to 460 kN) because failure did not occur for the lower stress level. The intensity of the vertical force was limited by the capacity of the Amsler press, which is equal to 500 kN.
The testing procedure can be divided into two steps:
3.1.3. Bilinear Idealization of Experimental Results
Earthquake loading causes significant bending and shearing of walls and stresses typically go beyond the elastic limit of material behavior. In order to meet the requirement to avoid brittle (unannounced) failure, walls should have plastic deformation and energy dissipation capacity. Since masonry is an orthotropic and heterogeneous material, investigation of the response of masonry structures in the nonlinear range is a challenging task. To simplify analysis and sizing of the walls, it was assumed that masonry is an elastic, homogeneous, and isotropic material, and that forces and stresses are based on the wall gross cross-section. Experimental hysteretic behavior of walls exposed to vertical and cyclic lateral forces is most often represented by idealized diagrams. The actual cyclic response can be simplified by a multi-linear relationship that represents the envelope of the hysteretic curve (backbone curve). Bilinear idealization was used in this paper, employing three characteristic limit states observed during the examination: crack limit, maximum resistance, and the ultimate state [
25]. For each limit state, characteristic displacement and lateral force were identified and shown in a table.
The initial slope of the idealized envelope was determined as the secant stiffness when the first cracks appear. It is given in Equation (1) as the ratio of lateral resistance H
cr at the onset of cracking and the corresponding displacement d
cr:
The ultimate load of an idealized envelope (H
u) was evaluated using the principle of equivalent energy dissipation of a real and an idealized wall [
25]. Assuming that the areas under the envelope and the idealized curve are identical, the ultimate resistance is calculated as (Equation (2)):
where A
env is the area below the experimentally determined resistance curve. The elastic displacement (d
e) was found using the ultimate resistance (H
u) and the elastic stiffness (K
e) (Equation (3)):
The ultimate displacement (d
u) and the relative displacement (θ
u) were defined for displacement at which the horizontal line H = 0.8 H
max intersects the descending branch of the experimentally determined envelope [
25]. Finally, ductility was found using Equation (4):
3.1.4. Analytical Expressions for Tensile Strength and Load-Bearing Capacity
If masonry is considered homogeneous and the isotropic material whose response is elastic until the load-bearing capacity (resistance) H
max is reached, the principal tensile stress in the wall subjected to H
max is equal to the tensile strength f
t of the wall [
25,
26]. Based on the theory of elasticity, the principal tensile stress is equal to (Equation (5)):
where σ
v is the average vertical stress due to compression force V (σ
v = V/A
w), A
w is the area of the wall’s horizontal cross-section, b is the shear stress distribution coefficient (b = 1 for h/l ≤ 1) and τ
Hmax is the average shear stress in the wall at H
max. If tensile strength is known (e.g., from an experiment), the lateral capacity of the wall can be expressed using Equation (6):
3.1.5. Degradation of Stiffness and Development of Damage
Degradation of stiffness is an important parameter of structural behavior because the load is distributed to the walls depending on stiffness. For example, after the failure of one wall, load redistribution occurs depending on the residual stiffness of the other walls. Stiffness degradation is expressed through the ratio of the secant stiffness K and the initial stiffness K
e,i (or K and the idealized elastic stiffness K
e). It can be calculated for any displacement, or only for characteristic limit states, which was carried out here. Characteristic limit states can be described by damage index I
d given by [
25]:
Id = 0.00—initial state without cracks;
Id = 0.25—occurrence of the first significant cracks (crack limit);
Id = 0.50—appearance of a mesh of diagonally oriented cracks (usually, the attainment of maximum resistance);
Id = 0.75—an increase of the width of existing cracks, crushing of bricks in the wall’s central zone, splitting of bricks, and mortar at the compressed edges;
Id = 1.0—heavy damage (beyond repair) or wall collapse.
The relationship between the damage index and the horizontal resistance is described in [
27]. Instead of the damage index I
d, the displacement ratio d
max,i/d
Hmax can also be plotted on the abscissa so that the stiffness reduction is displayed depending on the normalized horizontal displacement. Obviously, with increasing damage index (displacement), the secant stiffness decreases. After reaching the maximum resistance, stiffness decreases.
If a wall is exposed to cyclic horizontal force, due to the occurrence of damage, there is also a decrease in load-bearing capacity under repeated loading. The consequence of load-bearing degradation is that, for the same displacement, the wall has less resistance to cyclic loads than to monotonic ones.
3.1.6. Energy Dissipation and Hysteretic Damping
Based on experiments conducted under static cyclic loading, hysteresis curves that represent the relationship between horizontal force and displacement were obtained. Energy dissipation capacity is an important parameter in seismic analysis, and it can be determined by analyzing hysteresis loops. The coefficient of equivalent viscous damping ξ can be used to indicate energy dissipation by equating dissipative energy of the actual structure and the equivalent viscous system in one vibration cycle [
28]. It is generally used to model energy dissipation in the elastic phase of material response, but it can also be used for inelastic deformations. Equivalent viscous damping can be divided into two parts according to Equation (7):
where ξ
0 is the initial damping related to the elastic phase and ξ
hyst is the damping resulting from nonlinear deformations under cyclic loading.
Initial viscous damping can be assessed by testing a structure in a laboratory and measuring the decrease in vibration amplitude. It usually lies between 2% and 5%. This coefficient includes various sources of energy dissipation related to the elastic phase of materials behavior, which will not be considered in the paper. It is assumed that the initial viscous damping is equal to zero and that the total damping depends only on the hysteretic behavior.
To approximate the equivalent viscous damping for hysteretic behavior, the notions of input energy (E
inp) and dissipative energy (E
hyst) are used [
28]. The energy dissipated by an equivalent viscous damper in a single cycle of harmonic vibrations (or approximately static displacements) can be expressed using the input mechanical energy (E = 4πξ E
inp).
The input (potential) energy is represented by the area under the Hd curve in one cycle, and the energy dissipated on deformation for the same load cycle is enclosed by the hysteresis. By equating the energies, the equivalent viscous damping for the load cycle was found according to Equation (8):
where E
hyst,i is the dissipative energy for cycle i (equal to the area inside the hysteresis curve for cycle i) and E
inp,i is the input deformation energy in cycle i (equal to the work done by a piston of an actuator, necessary to push the wall to the maximum displacement in cycle i).
3.2. Plain Walls W1 and W2
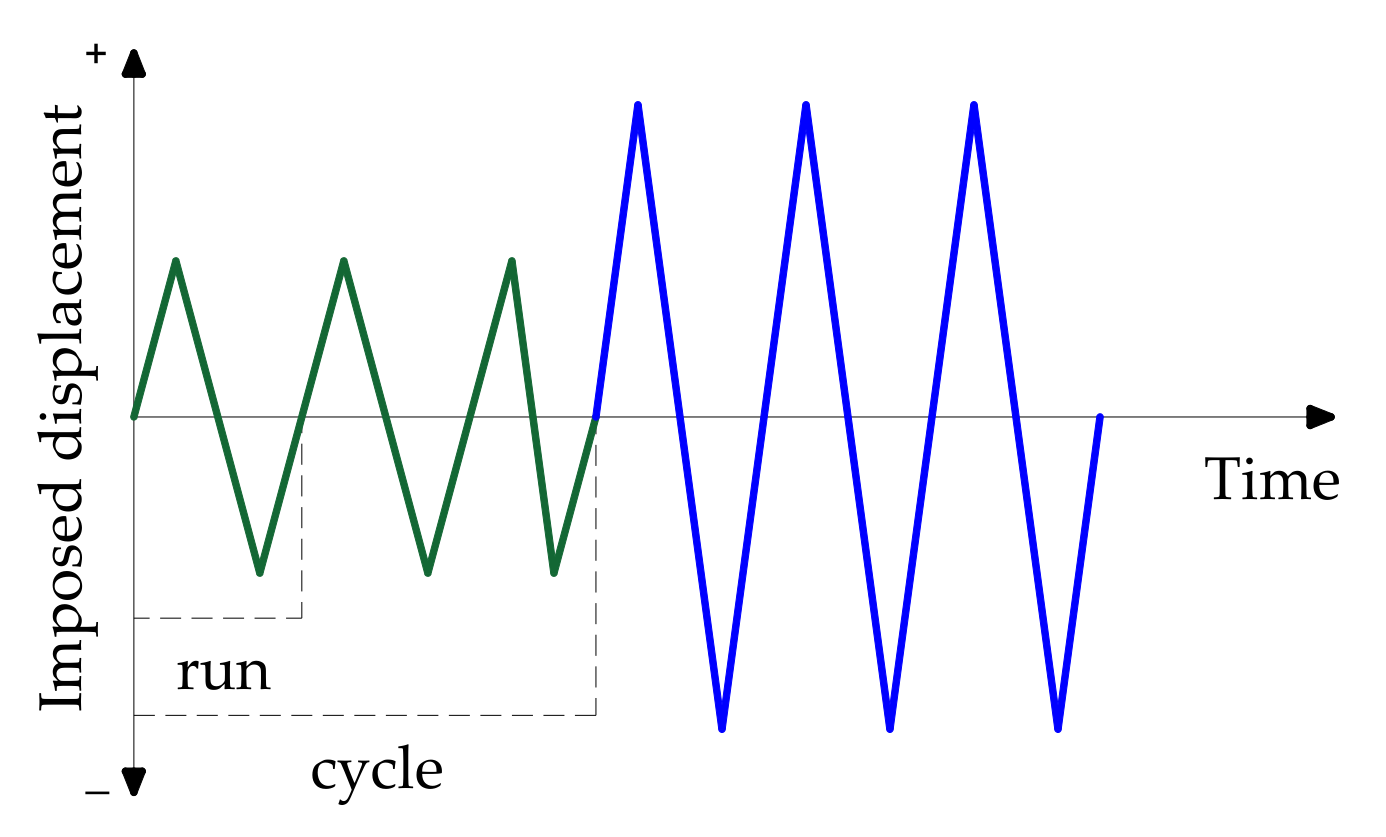
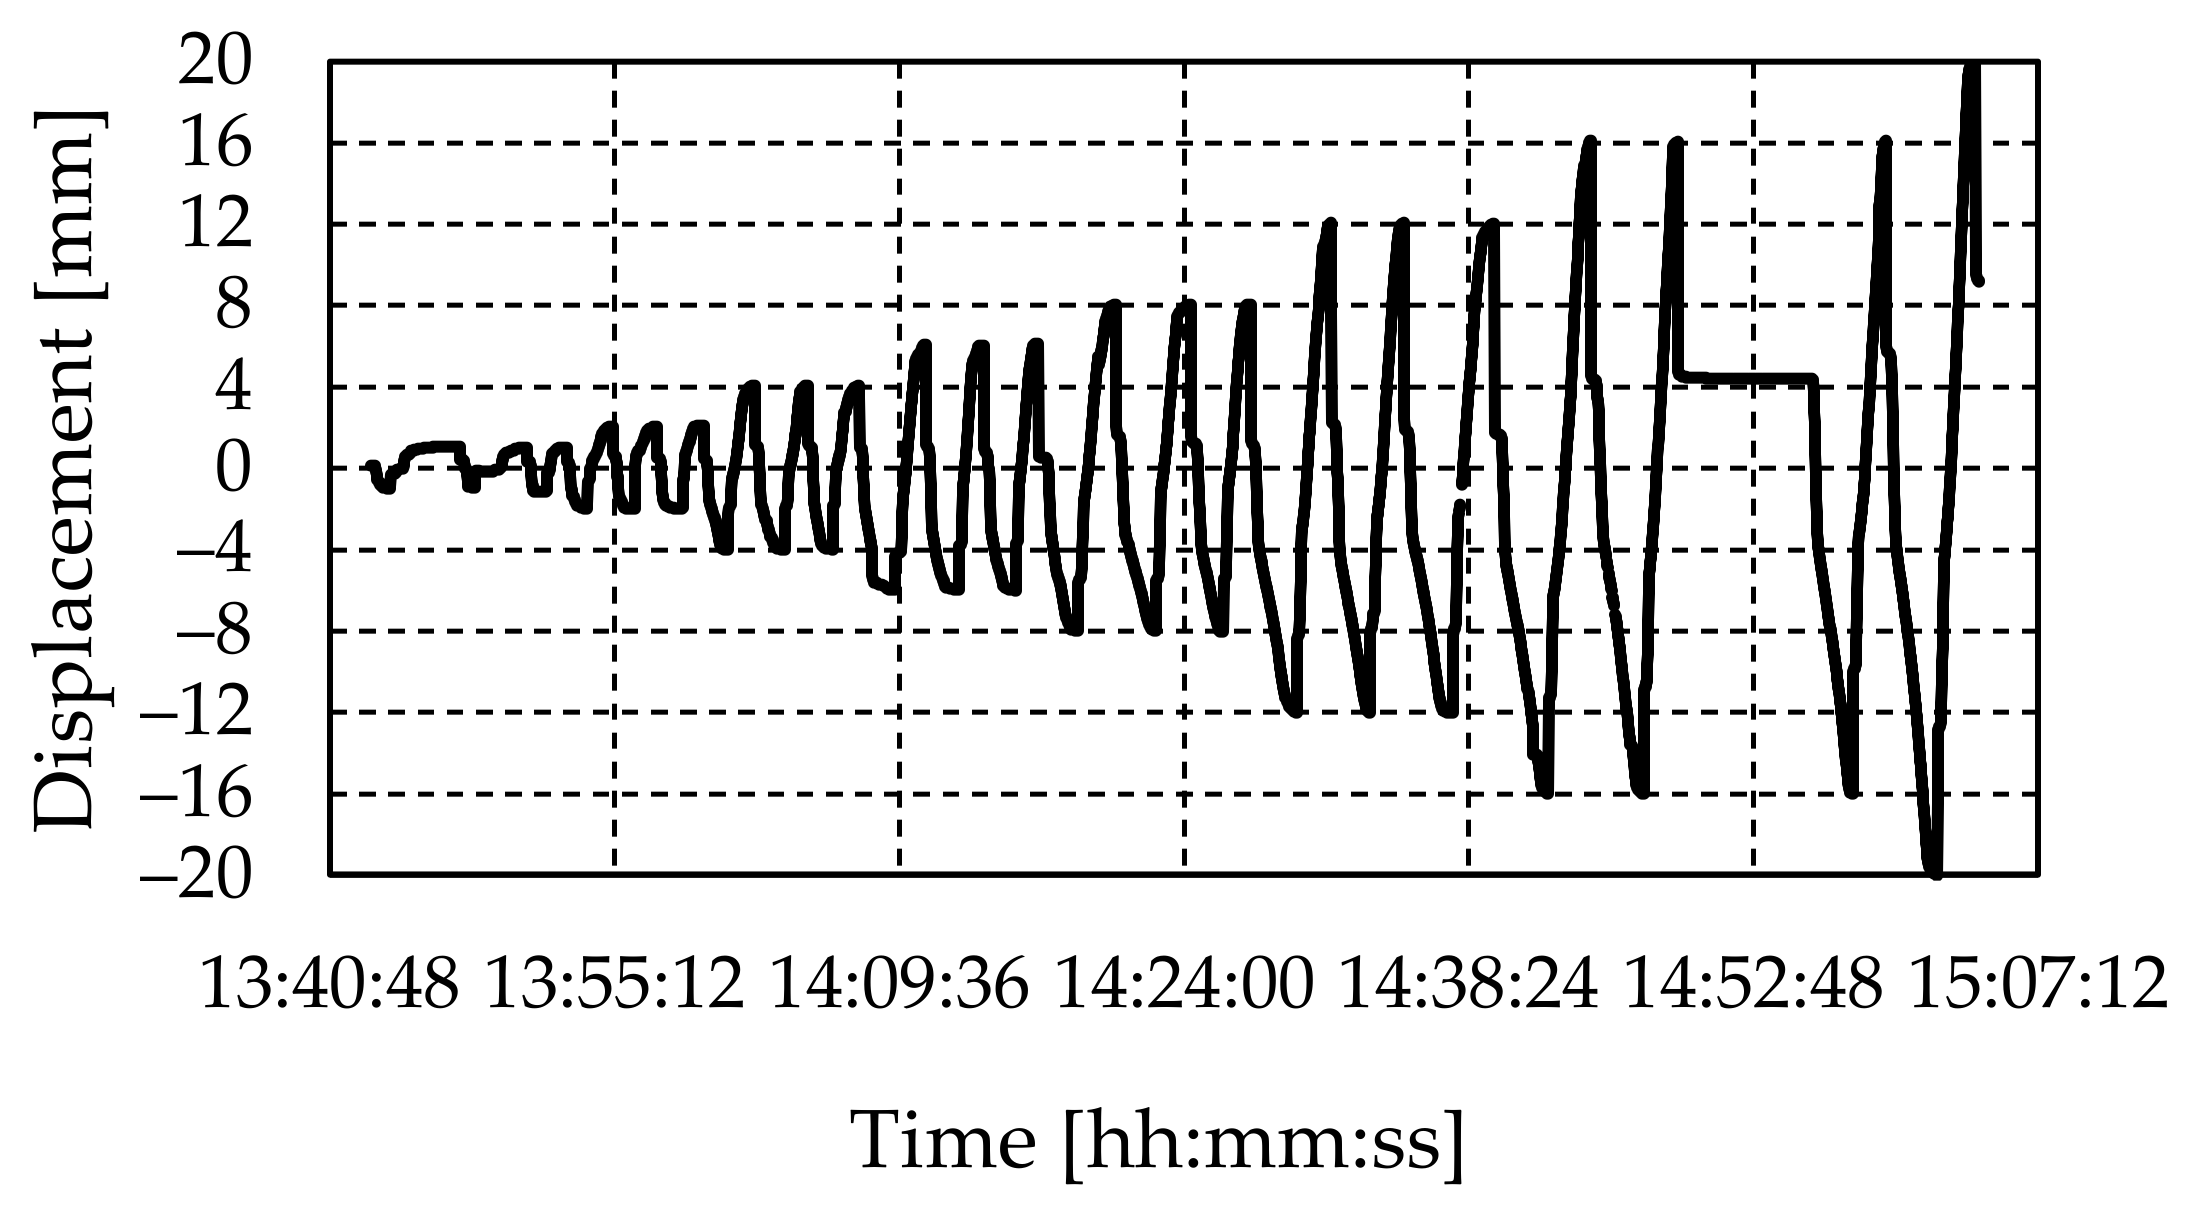
Cyclic horizontal in-plane load was applied by imposing displacements over the RC beam at the top of the wall. Typical variation of displacements over time is shown in
Figure 9 for W1. Each load cycle consisted of three runs, except at a displacement of 20 mm when the experiment was interrupted. To protect measuring instruments in the event of a possible wall collapse, the test was paused at a displacement of 16 mm when most of the recording devices were removed. The experiment lasted approximately 90 min.
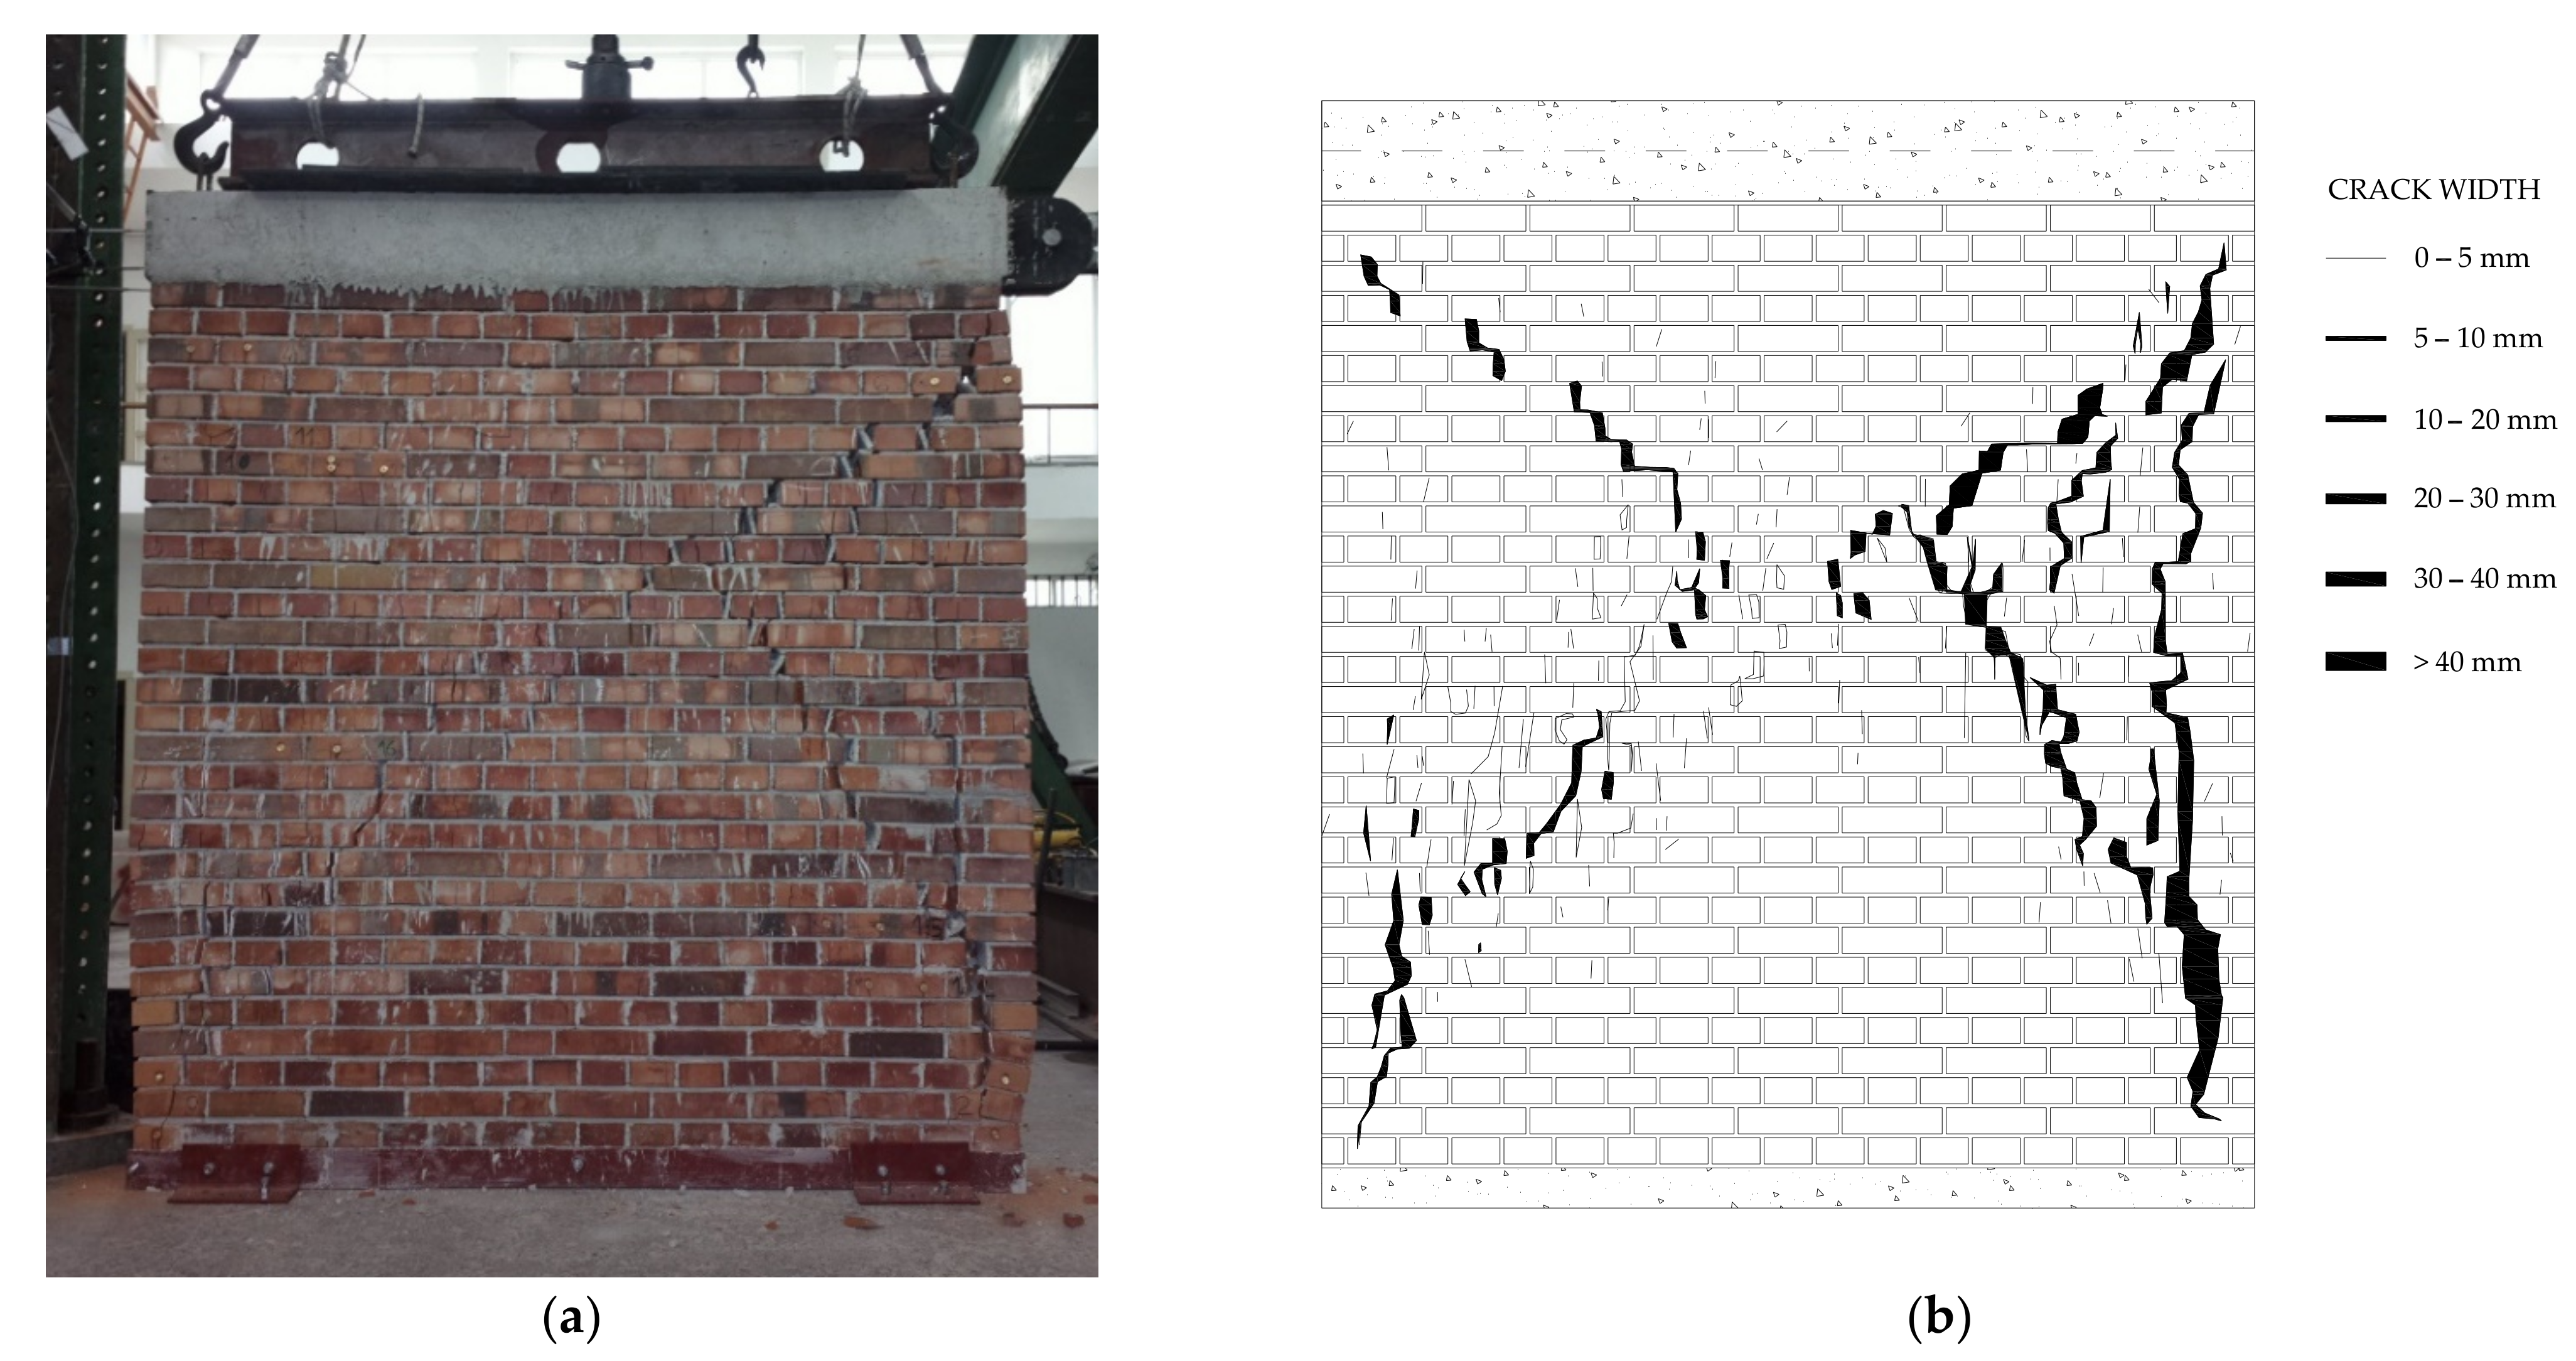
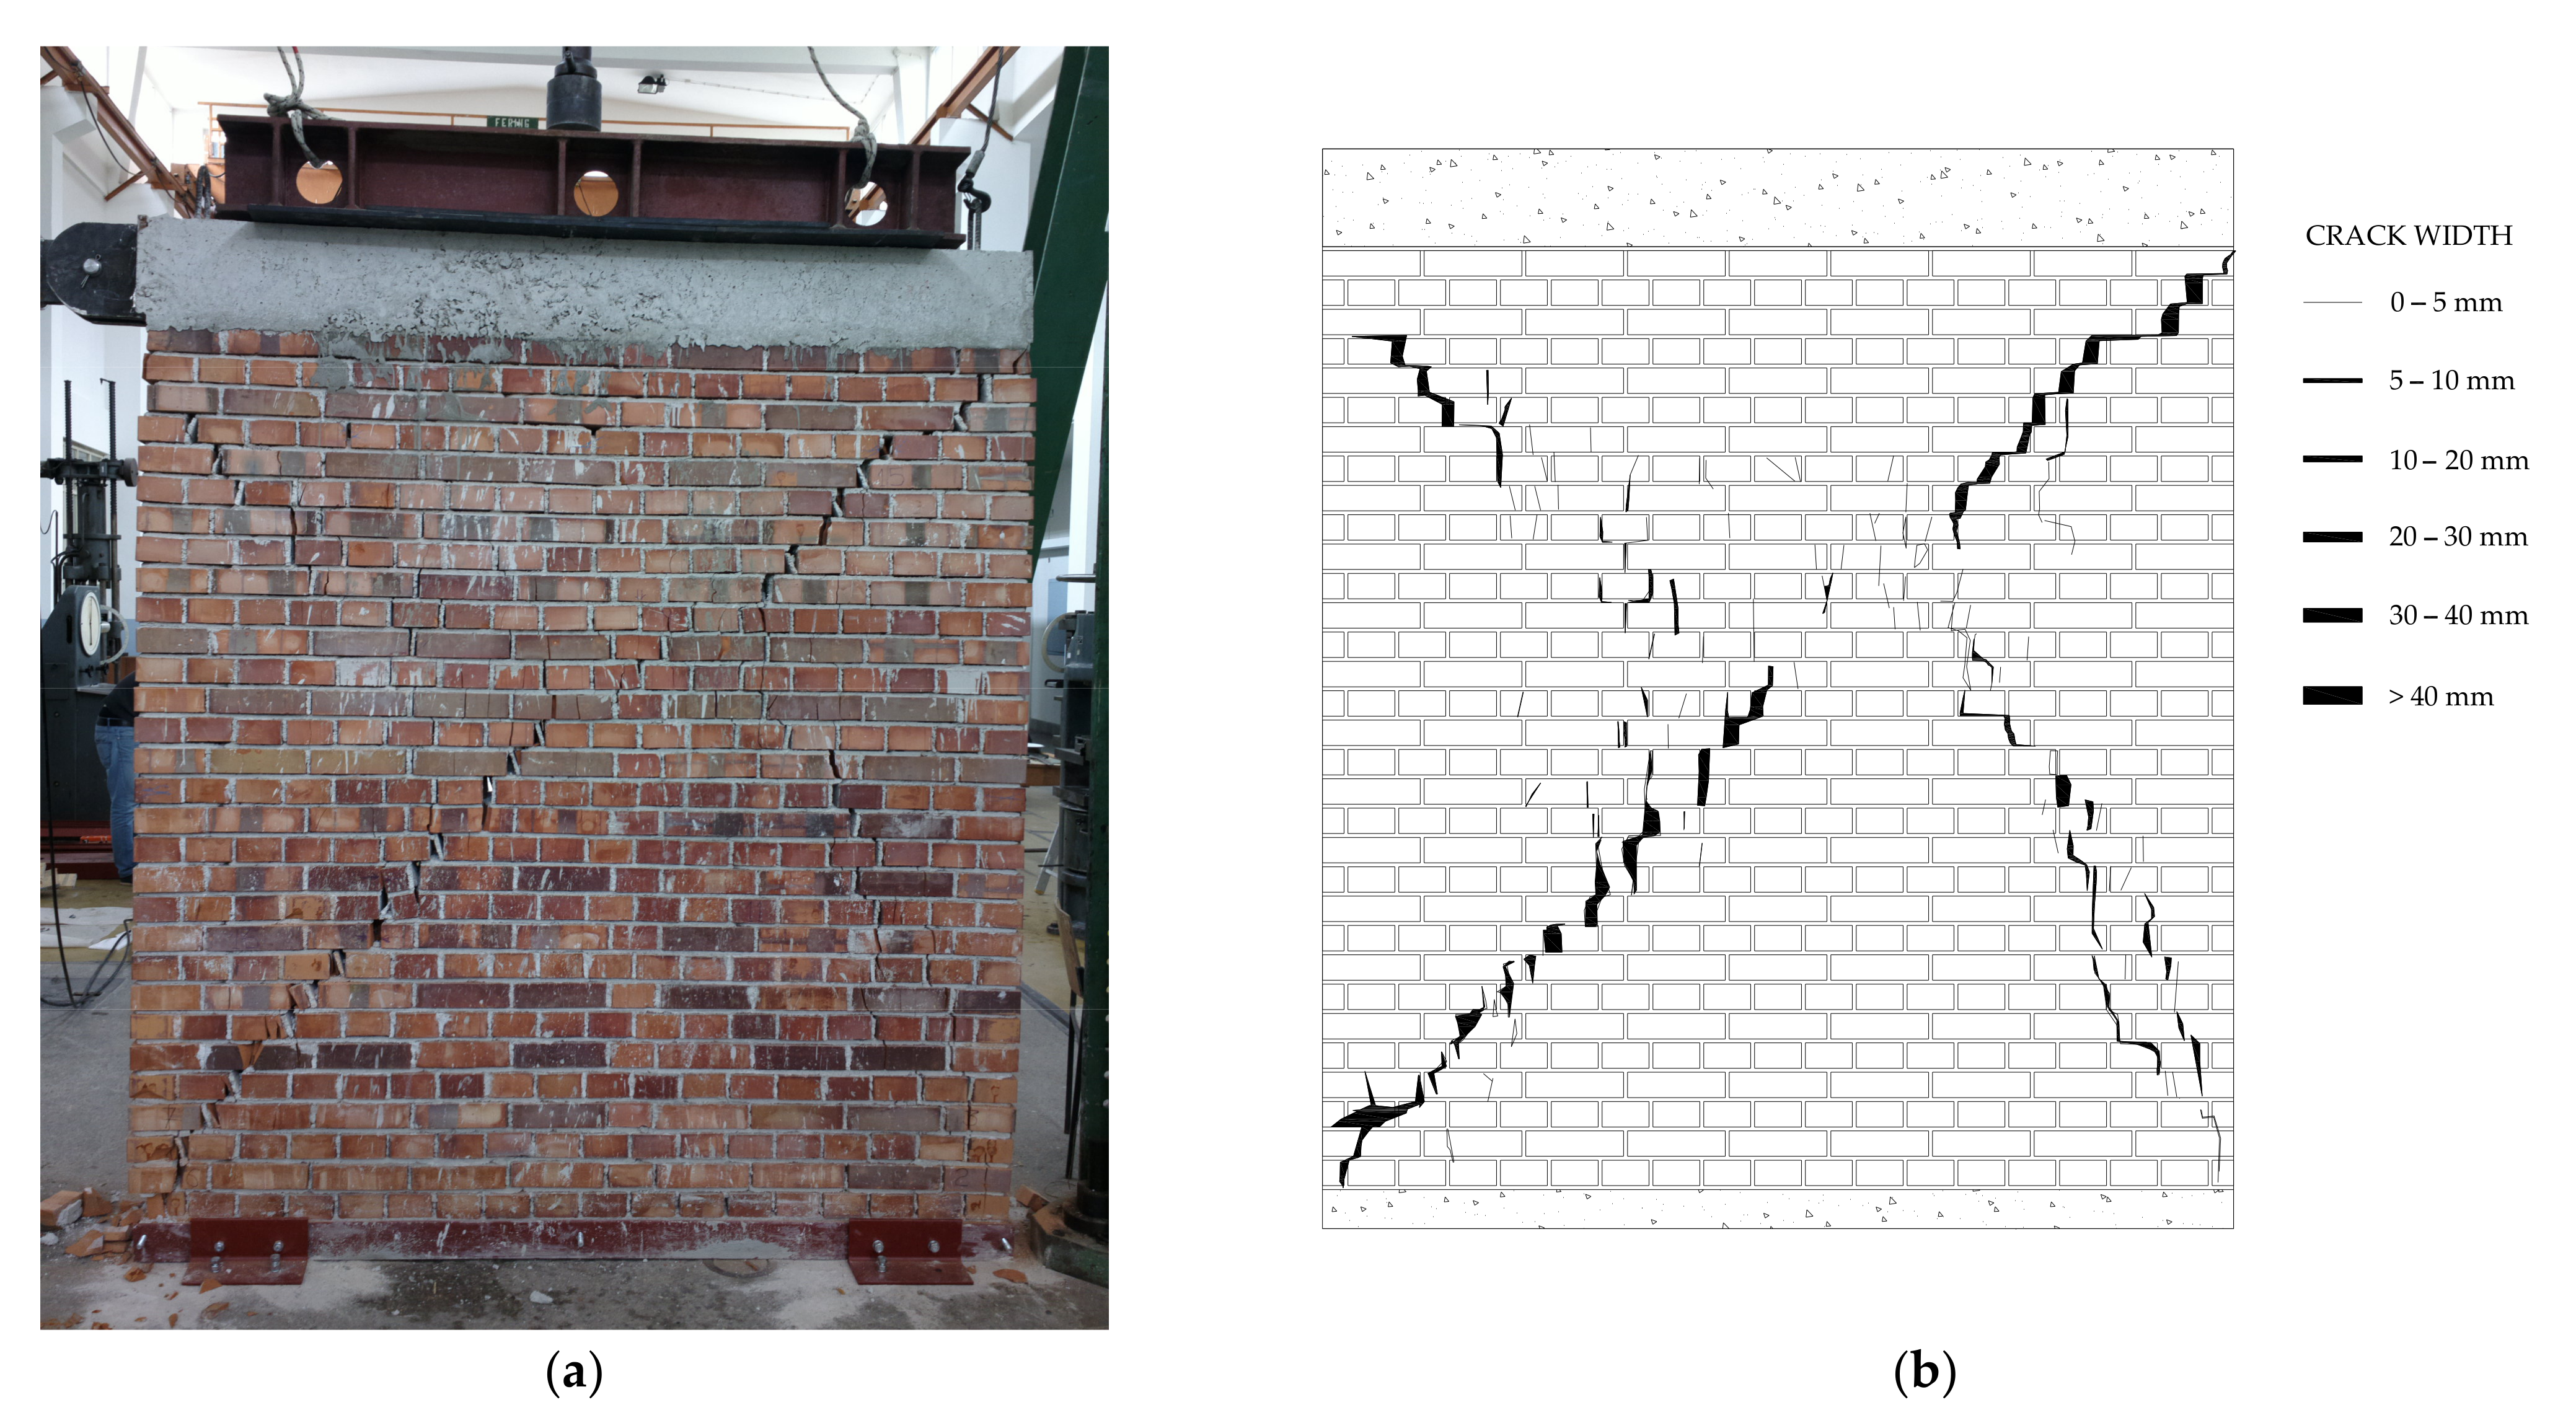
As expected, plain walls W1 and W2 failed in shear. The failure was characterized by cross-diagonal cracks that ran through the brick or brick-mortar contact. A generally stair-shaped cracking pattern for W1 and W2 is shown in
Figure 10 and
Figure 11. Crushing and local buckling were observed in the corners. Fissures first began to appear in the wall center, and cracks over 40 mm in width were recorded at the final stage. The final crack width was twice as large as the imposed displacement which was caused by the accumulation of plastic deformation (slip) along the main diagonal cracks. Unlike W1, due to high local pressure, a vertical crack (brick splitting) formed and almost separated the column at the right side of W2 (
Figure 11).
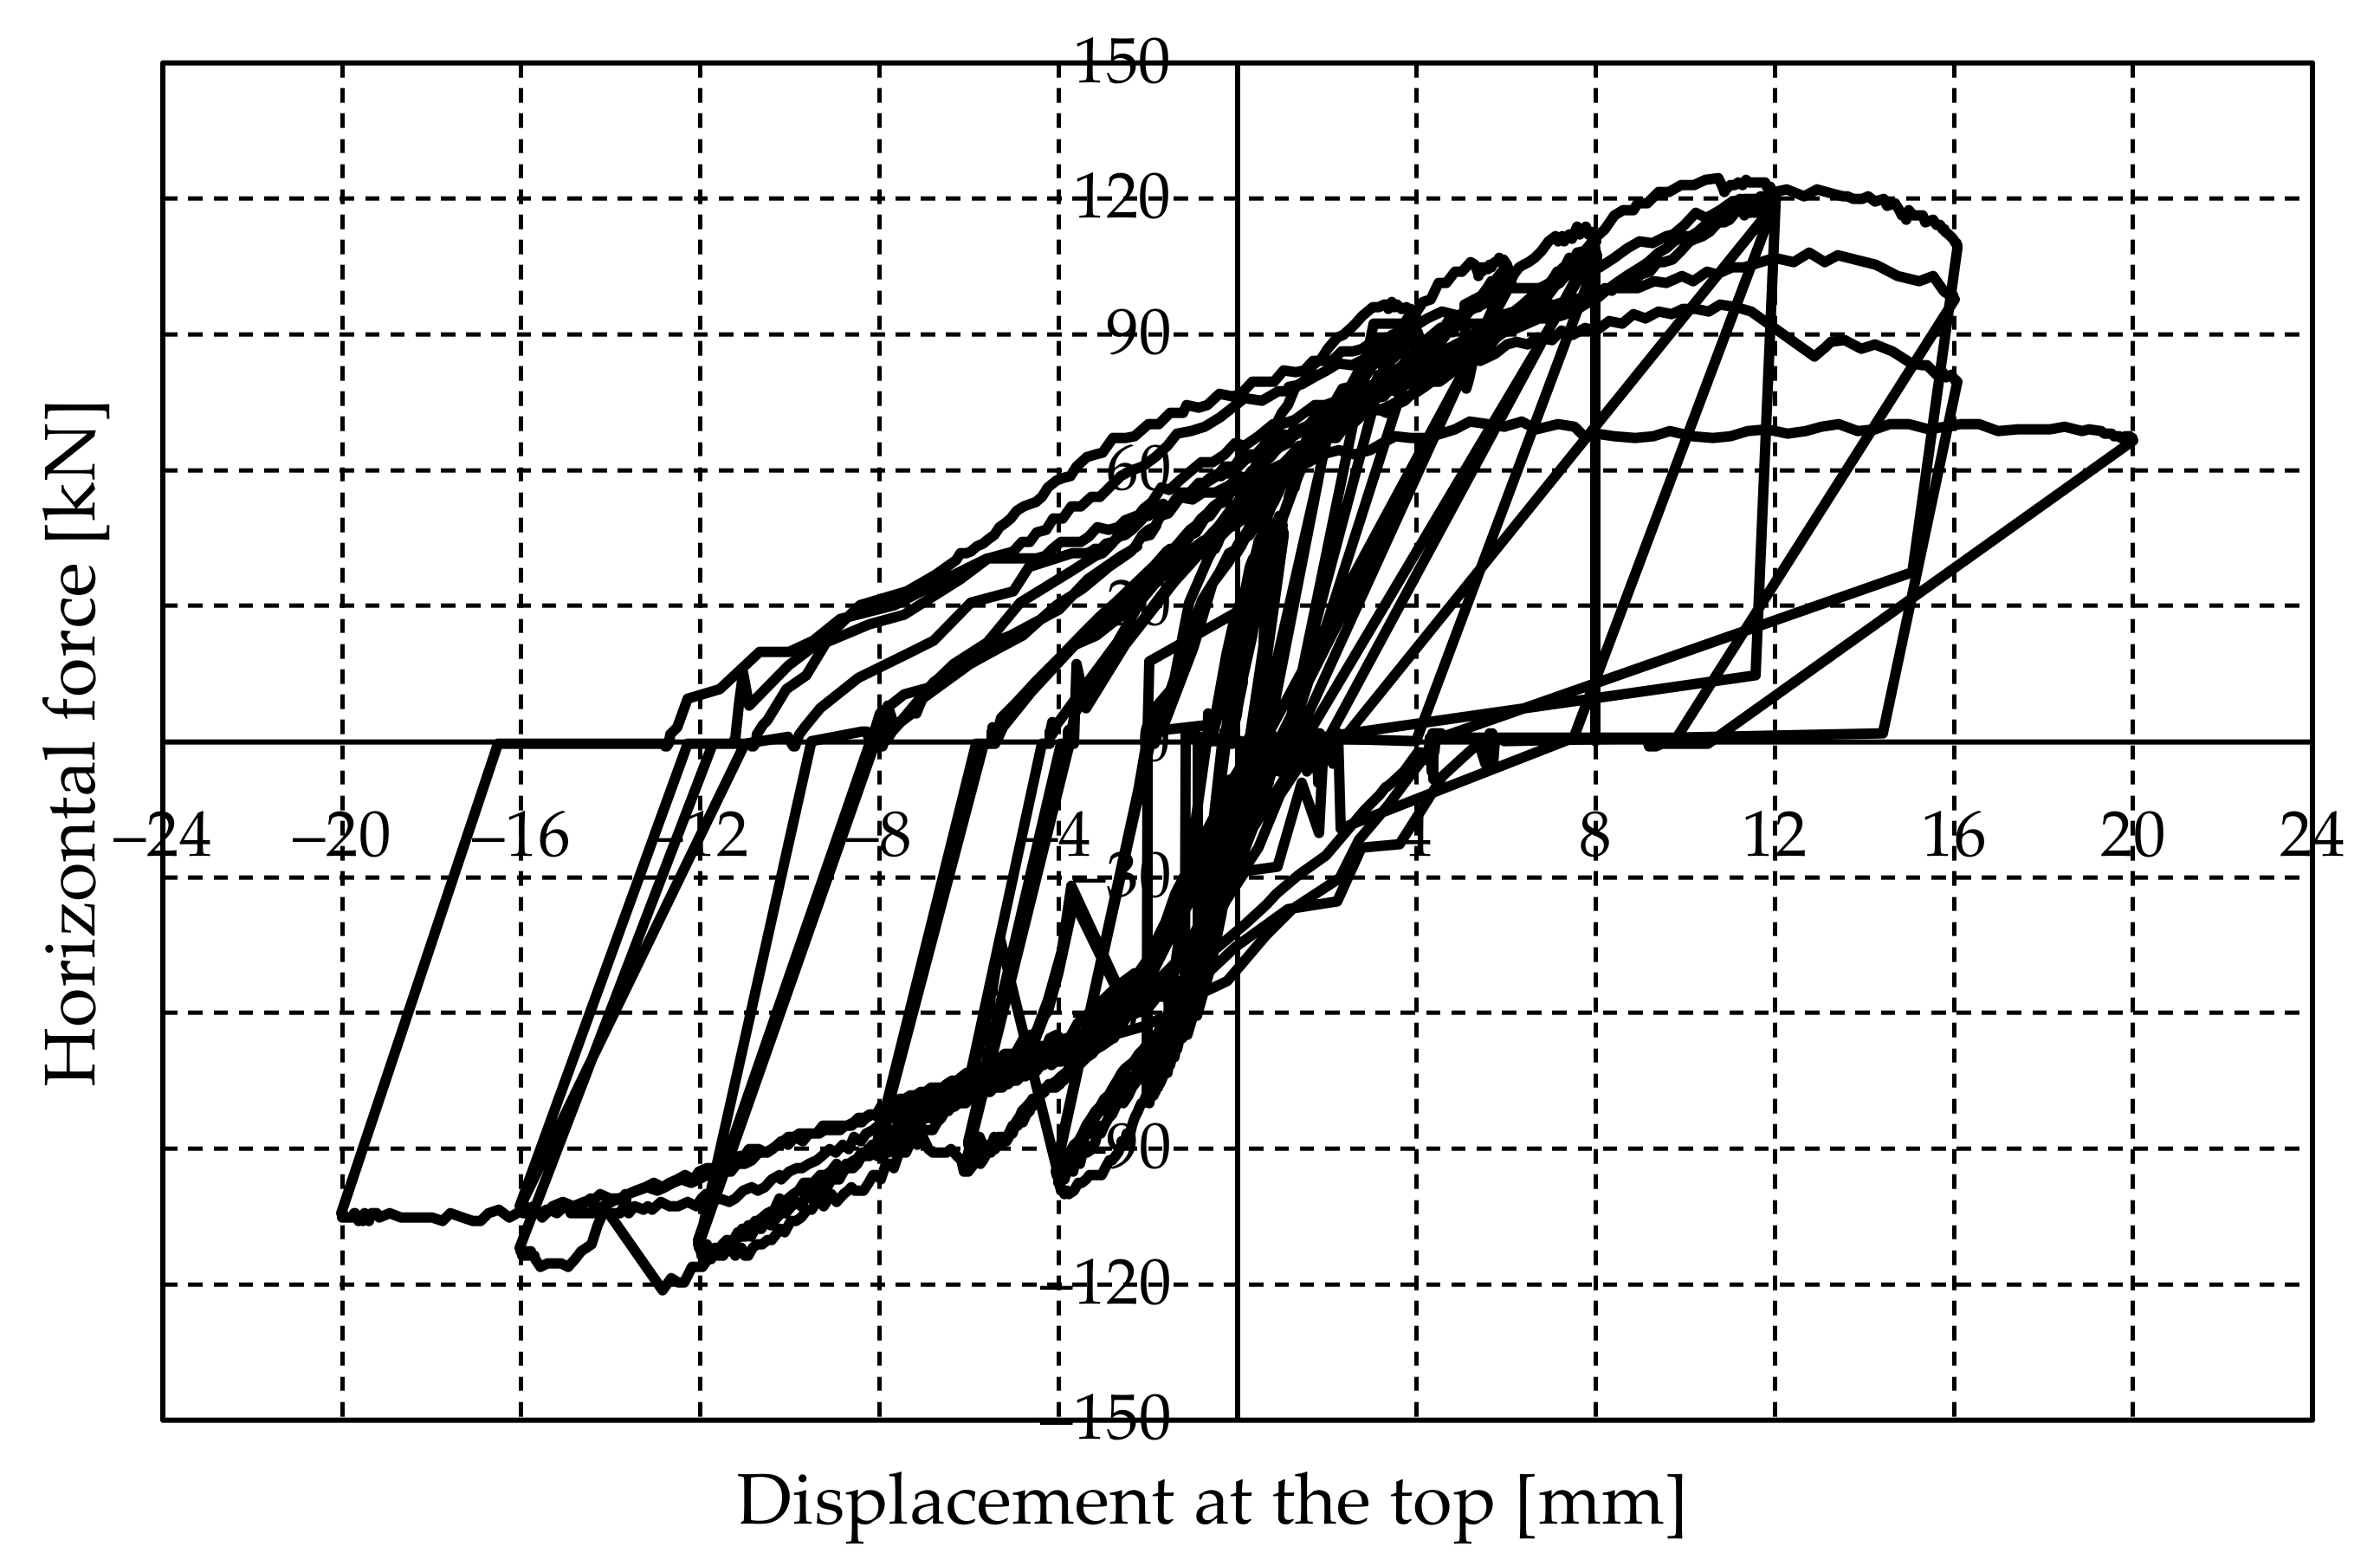
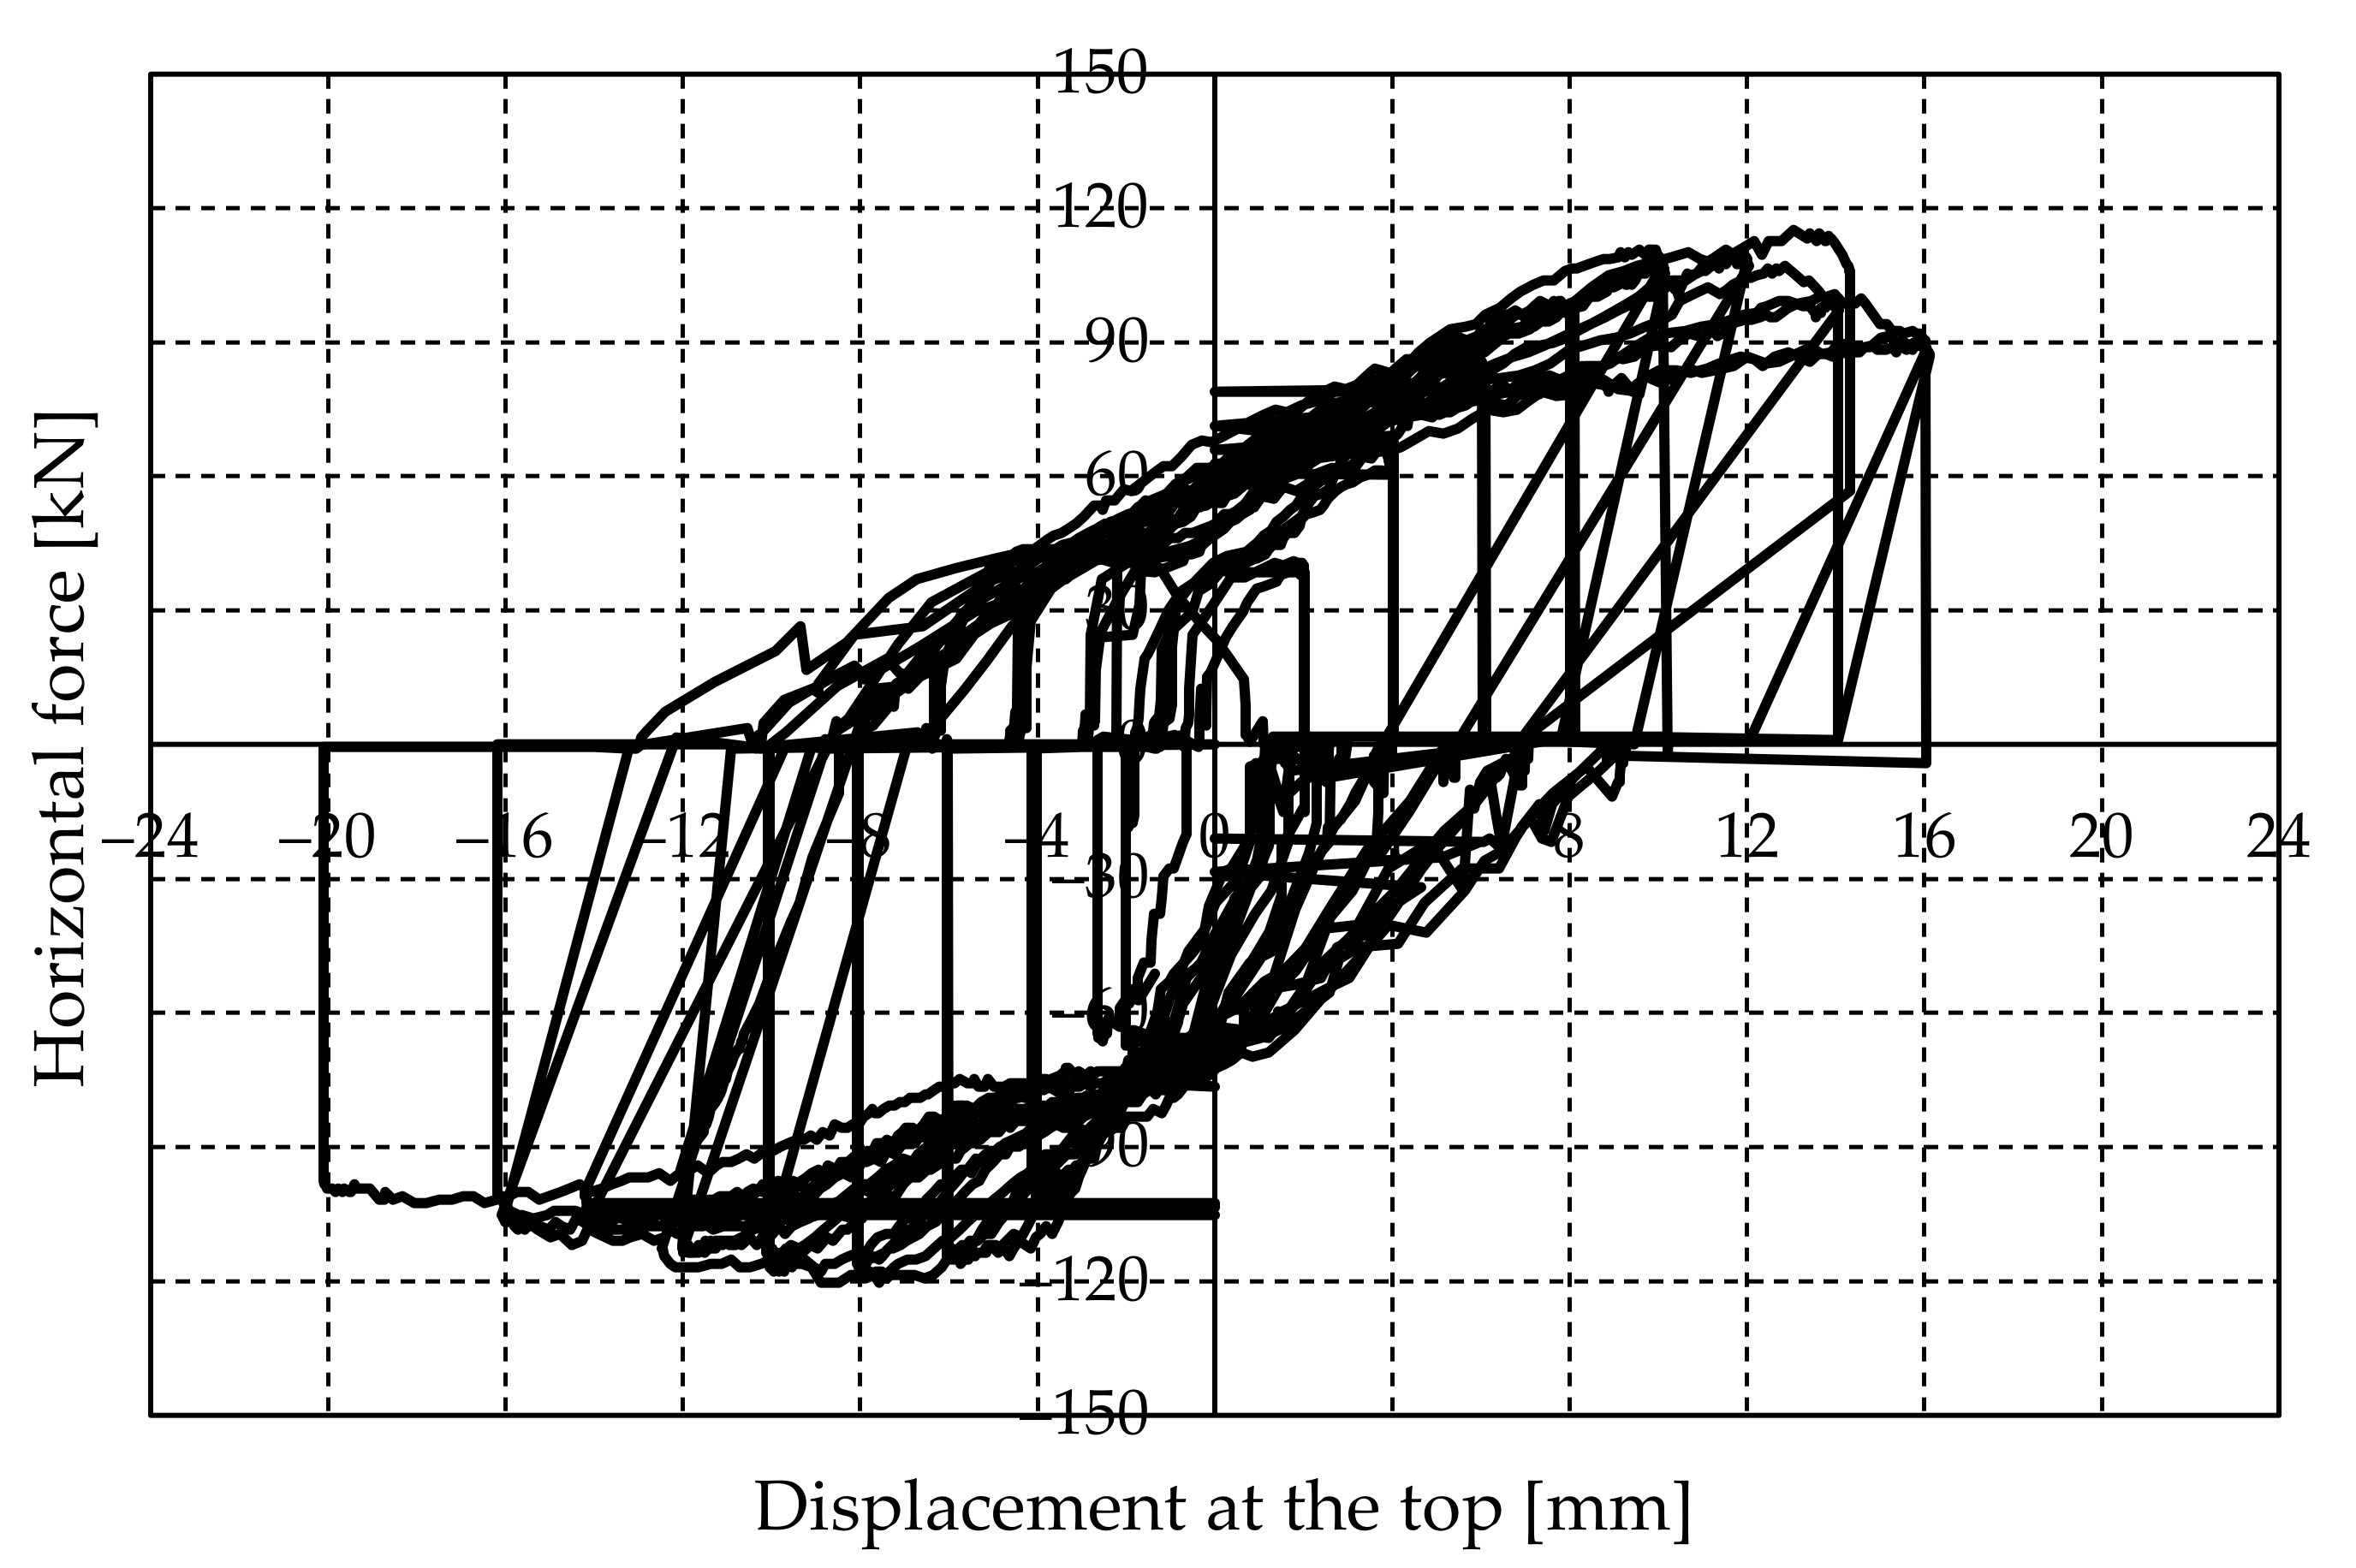
Experimentally obtained hysteretic loops are given in
Figure 12 (W1) and
Figure 13 (W2). Hysteretic curves of plain walls are generally symmetric and full, meaning that energy is dissipated through non-elastic deformations. The slope of the hysteretic curve decreases during unloading, which means that, besides the plastic behavior caused by friction, there are cracks that lead to a decrease of the initial stiffness (damage). A sharp vertical drop in force was registered during several load reversals. This was caused by the loss of contact between the bolt and the eyebar when the force changed direction (there was a gap of cca. 5 mm between the bolt and the hole). Additionally, the load reversal on the horizontal press should have been performed gradually (rather than instantly as was the case in our experiment) to obtain higher resolution of the measured data points and hence less evident force decline.
Resistance and deformability parameters for plain walls are listed in
Table 2. Based on the observed failure mechanism, three limit states can be used to describe the behavior of the tested walls [
25]:
Crack limit—the state is determined by displacement dcr and resistance Hcr when first major cracks occur either through bricks or at the brick-mortar contact;
Maximum resistance—the state is determined by maximum resistance Hmax which is registered during the test and corresponding displacement dHmax;
Ultimate limit state—the state is determined by maximum displacement dmax attained during the test and corresponding resistance (limit load) Hdmax.
Where Ke,i is the initial elastic stiffness (also called effective stiffness), Kcr is the secant stiffness at the formation of cracks, KHmax is the secant stiffness at the maximum horizontal force, and Kdu is the secant stiffness at the maximum displacement.
The results of bilinear idealization of hysteretic curves are given in
Table 3.
The ratio H
u/H
max was very close to 0.9, a value recommended in [
25]. Therefore, if the seismic analysis is performed, the lateral bearing capacity of the wall should be reduced by 10%. By idealizing the experimentally determined envelope, a significant ductility of the wall was obtained, as much as 9.4 for W1. However, for practical application, ductility was kept within certain limits to limit wall damage. Although the experimental results indicated higher values, Tomaževič [
25] recommended that the ultimate ductility factor be adopted in the range μ
u = 2.0–3.0 for unstrengthened unreinforced walls.
The tensile strength ft determined according to Equation (5) was equal to 0.088 N/mm2. The shear resistance according to Equation (6) was equal to 109 kN, which fits well with the experimentally obtained maximum force Hmax = 120 kN.
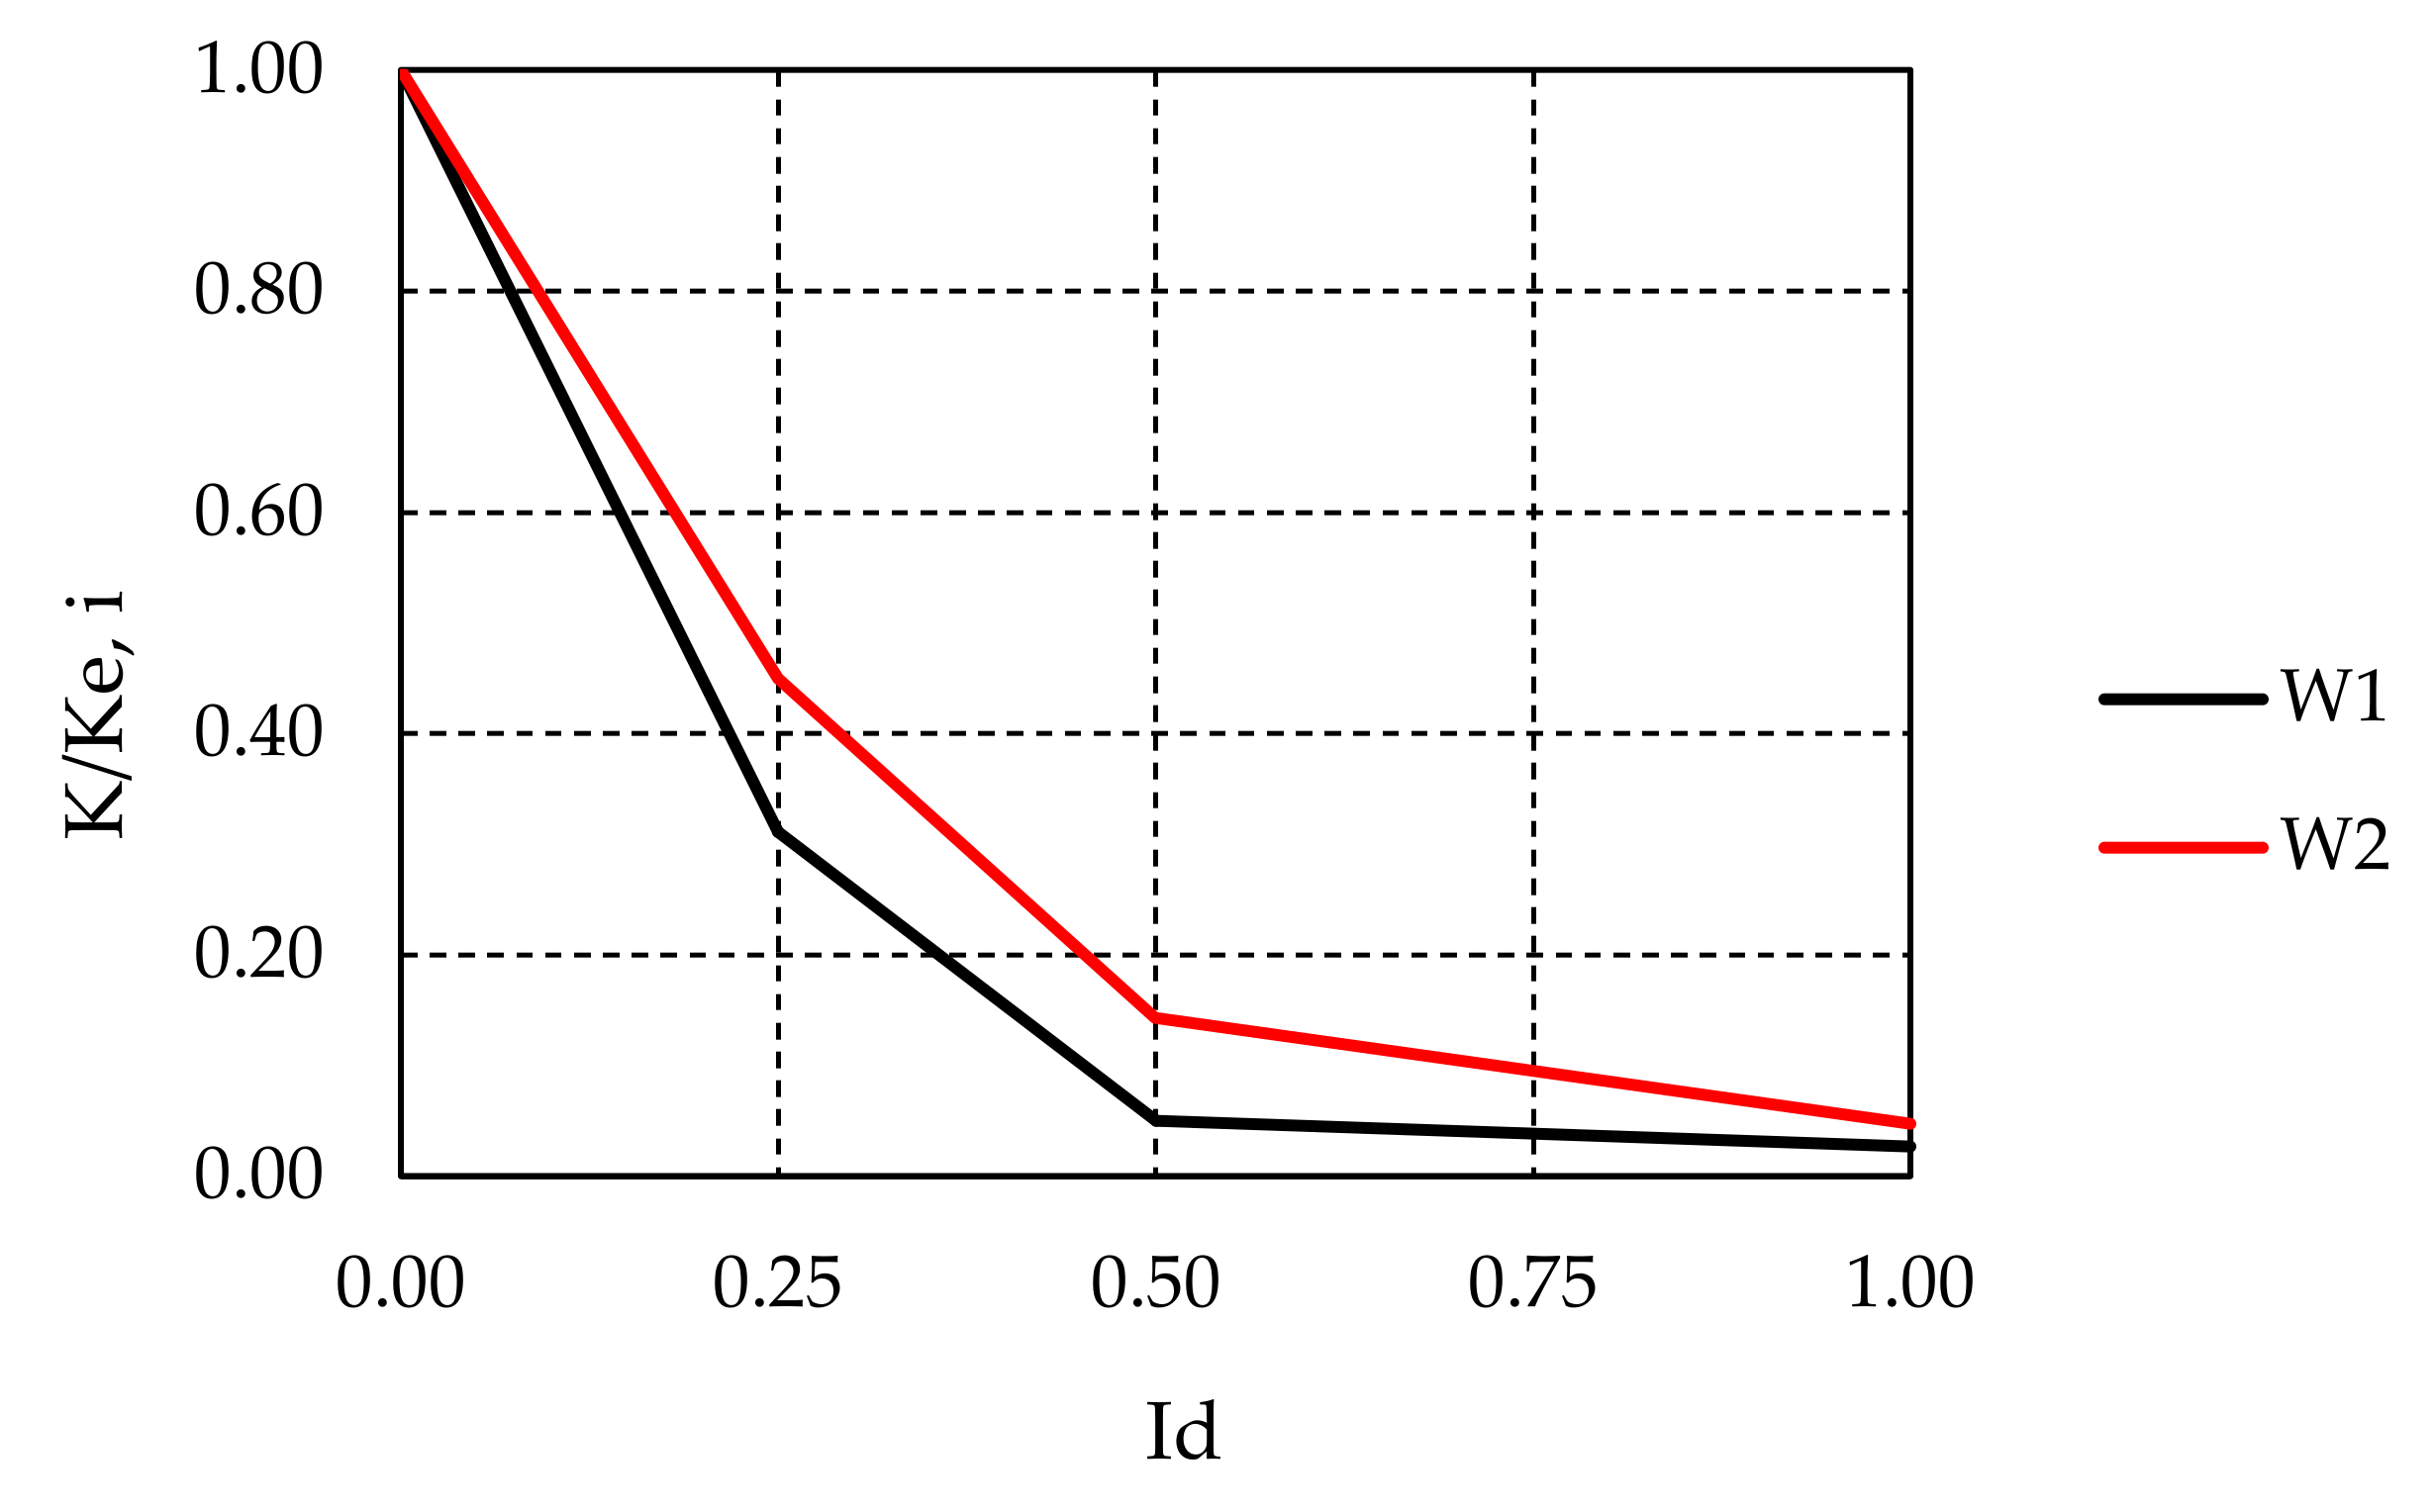
The damage index is related to the limit states, so the previous results can be used for analysis (
Table 2). The stiffness drop shown in
Figure 14 can be modeled by a power function regardless of which variable is selected on the abscissa. Obviously, with increasing damage index (displacement), the secant stiffness decreases. After reaching the maximum resistance, the decrease in stiffness is practically constant.
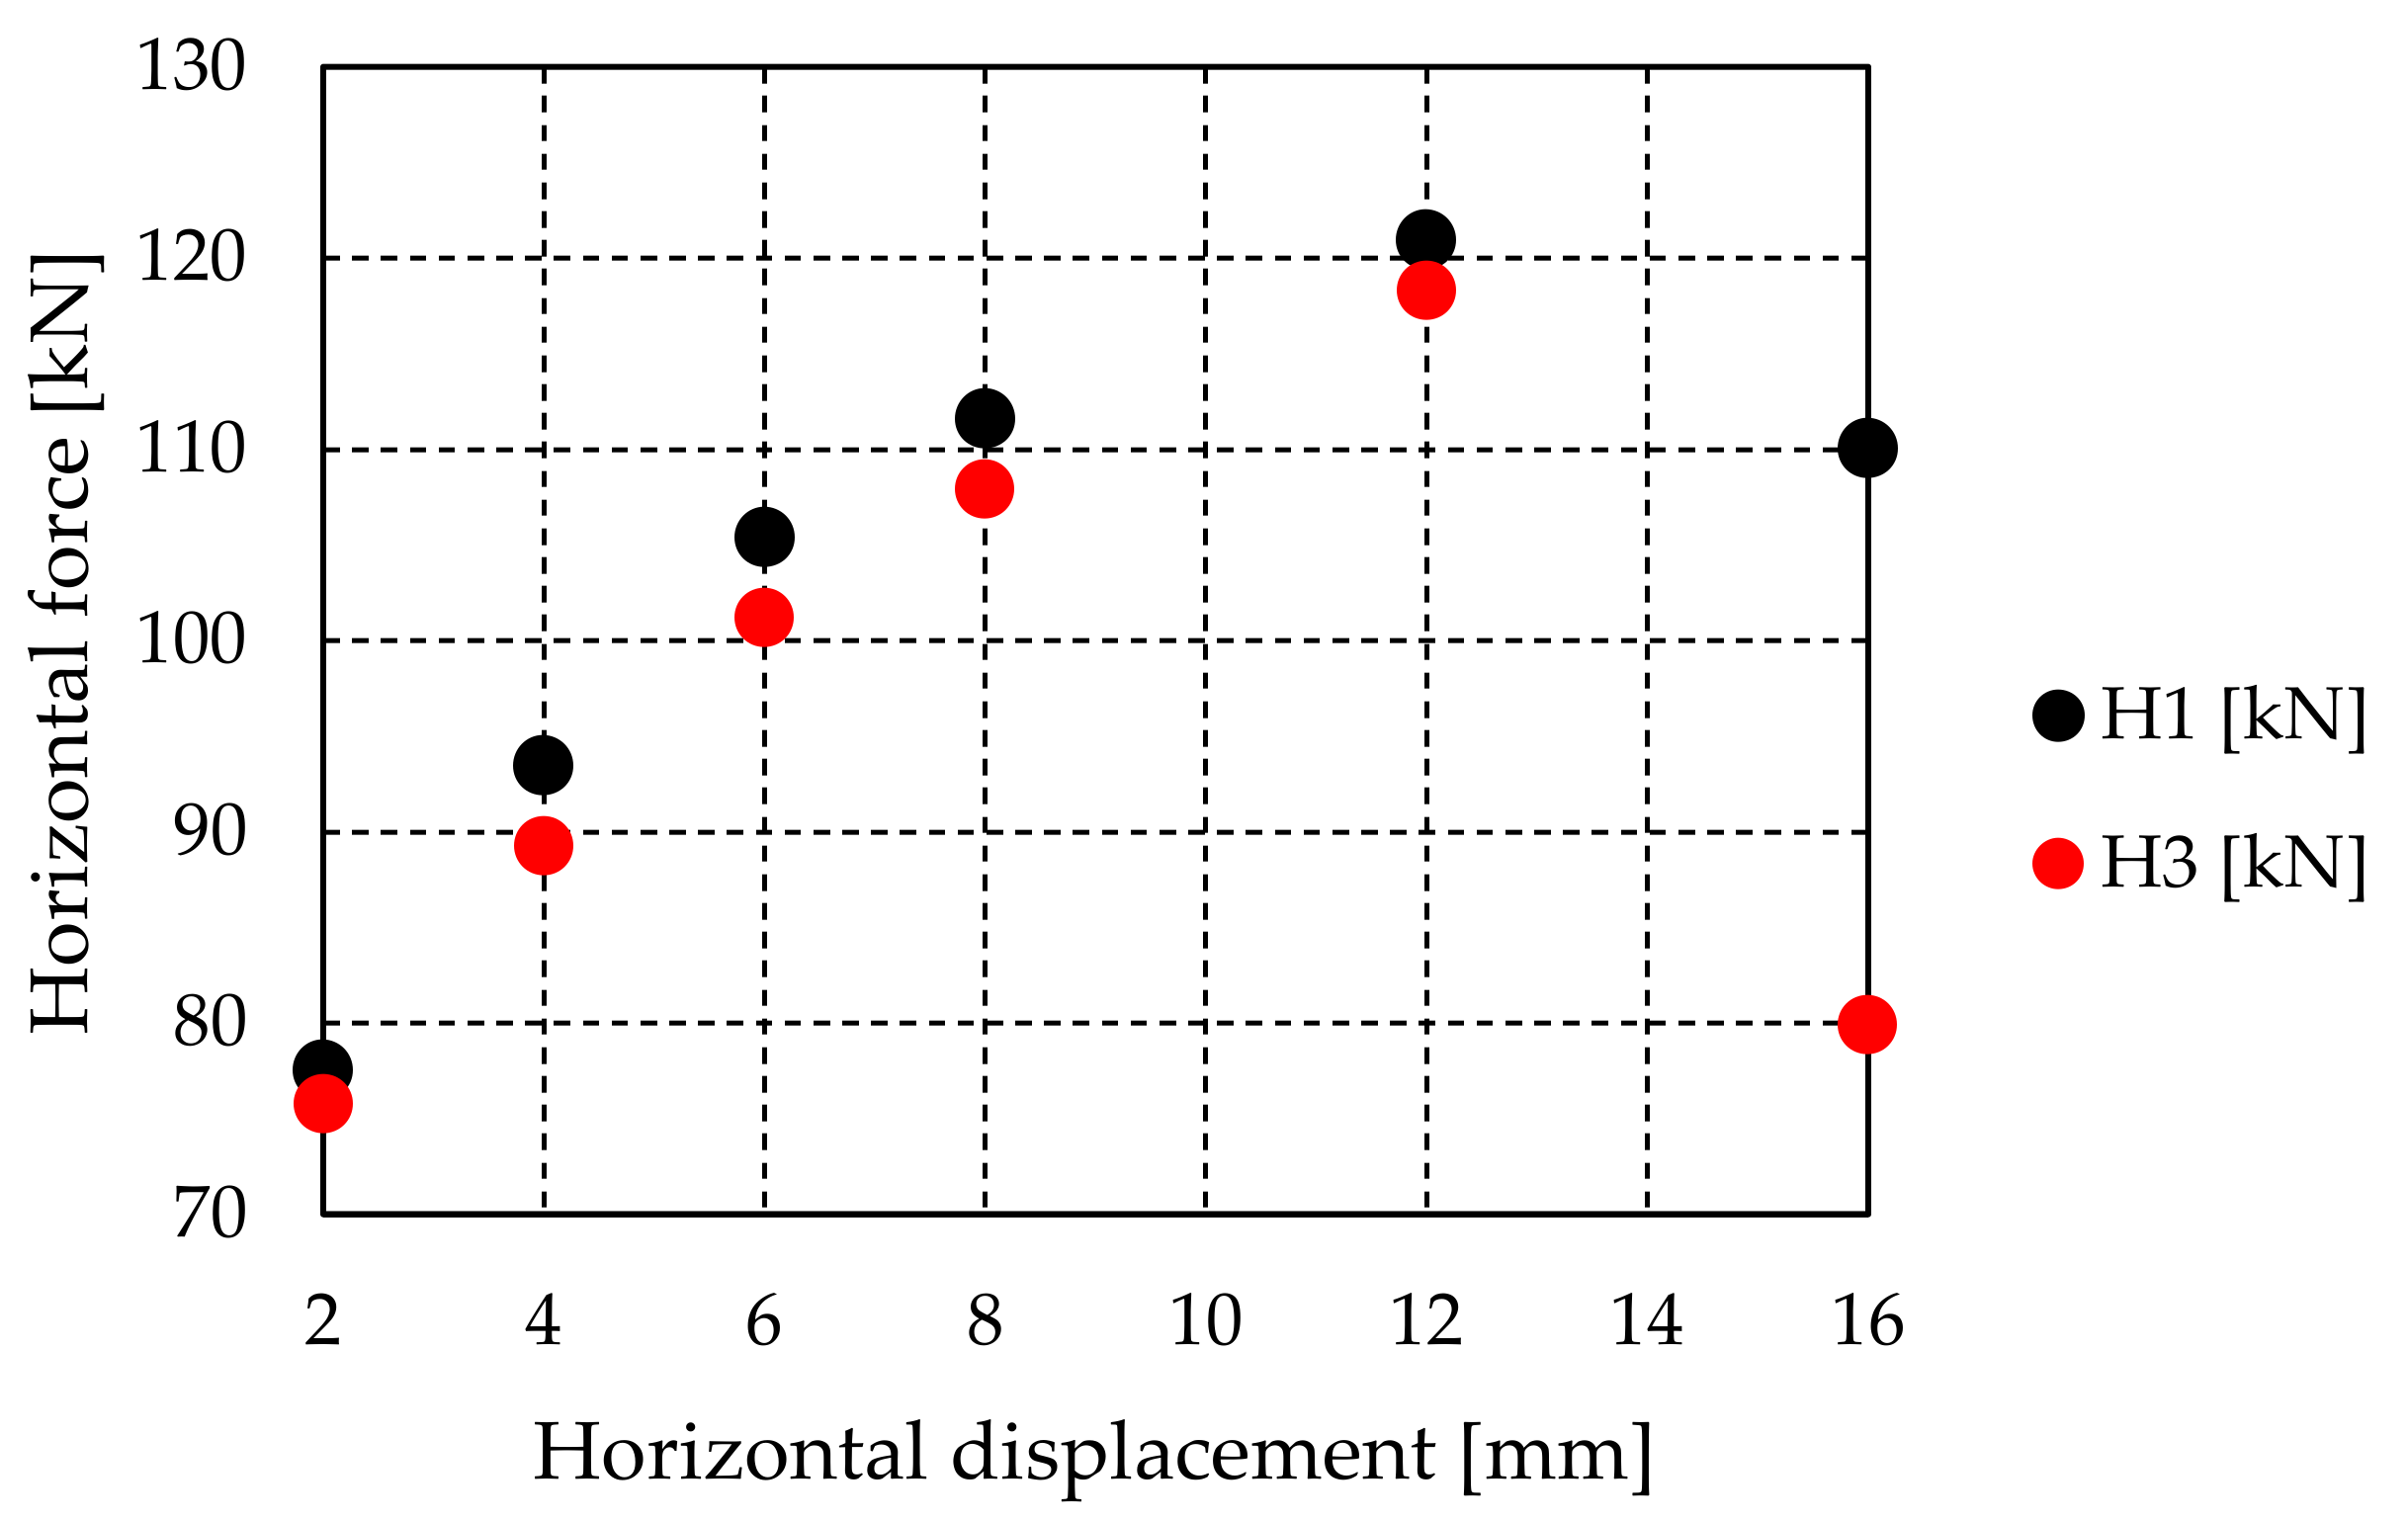
Degradation of shear resistance between the first and the third step within the characteristic cycle is shown in
Table 4 (W1 and W2) and in
Figure 15 (for W1). It can be concluded that the reduction of resistance was not significant except at large displacements (16 mm).
The measured values of equivalent viscous (hysteretic) damping are shown in
Table 5. It is characteristic that the damping increases from the appearance of the first cracks to the maximum bearing capacity and then grows very slightly up to the ultimate resistance. The values were obtained for the first load run at d
cr, d
Hmax, and d
max.
Where H1 is the resistance in the first run, H3 is the resistance in the third run (for the same displacement as H1), and (H1–H3)/H1 is the relative decrease of resistance in relation to resistance in the first run.
3.3. Jacketed Walls W3 and W4
To compare the results, the jacketed walls W3 and W4 were tested under the same vertical load as the unstrengthened walls (σ
v = 0.4 N/mm
2 or V = 230 kN) (
Figure 16). Since cracking was not registered, the walls were additionally tested under double the precompression load (σ
v = 0.8 N/mm
2 or V = 460 kN). It was not possible to apply higher vertical force due to the limited capacity of the hydraulic actuator. In both cases, the experiment was conducted in two ways: under cyclic and monotonic (pushover) action of horizontal force.
Motivation for the pushover tests is twofold. It serves for comparison with the envelope of the hysteresis curve obtained by cyclic testing. Analysis of the hysteresis loops for walls W3 and W4 revealed asymmetry caused by the rigidity of the testing device when imposing displacements in the “+” direction, so the pushover curve serves to control the cyclic test results. Another reason for monotonic load tests lies in the fact that the horizontal displacement is limited to approx. 20 mm in the case of cyclic loading. In the pushover test, it is possible to impose larger displacements and thus check the ductility of the wall.
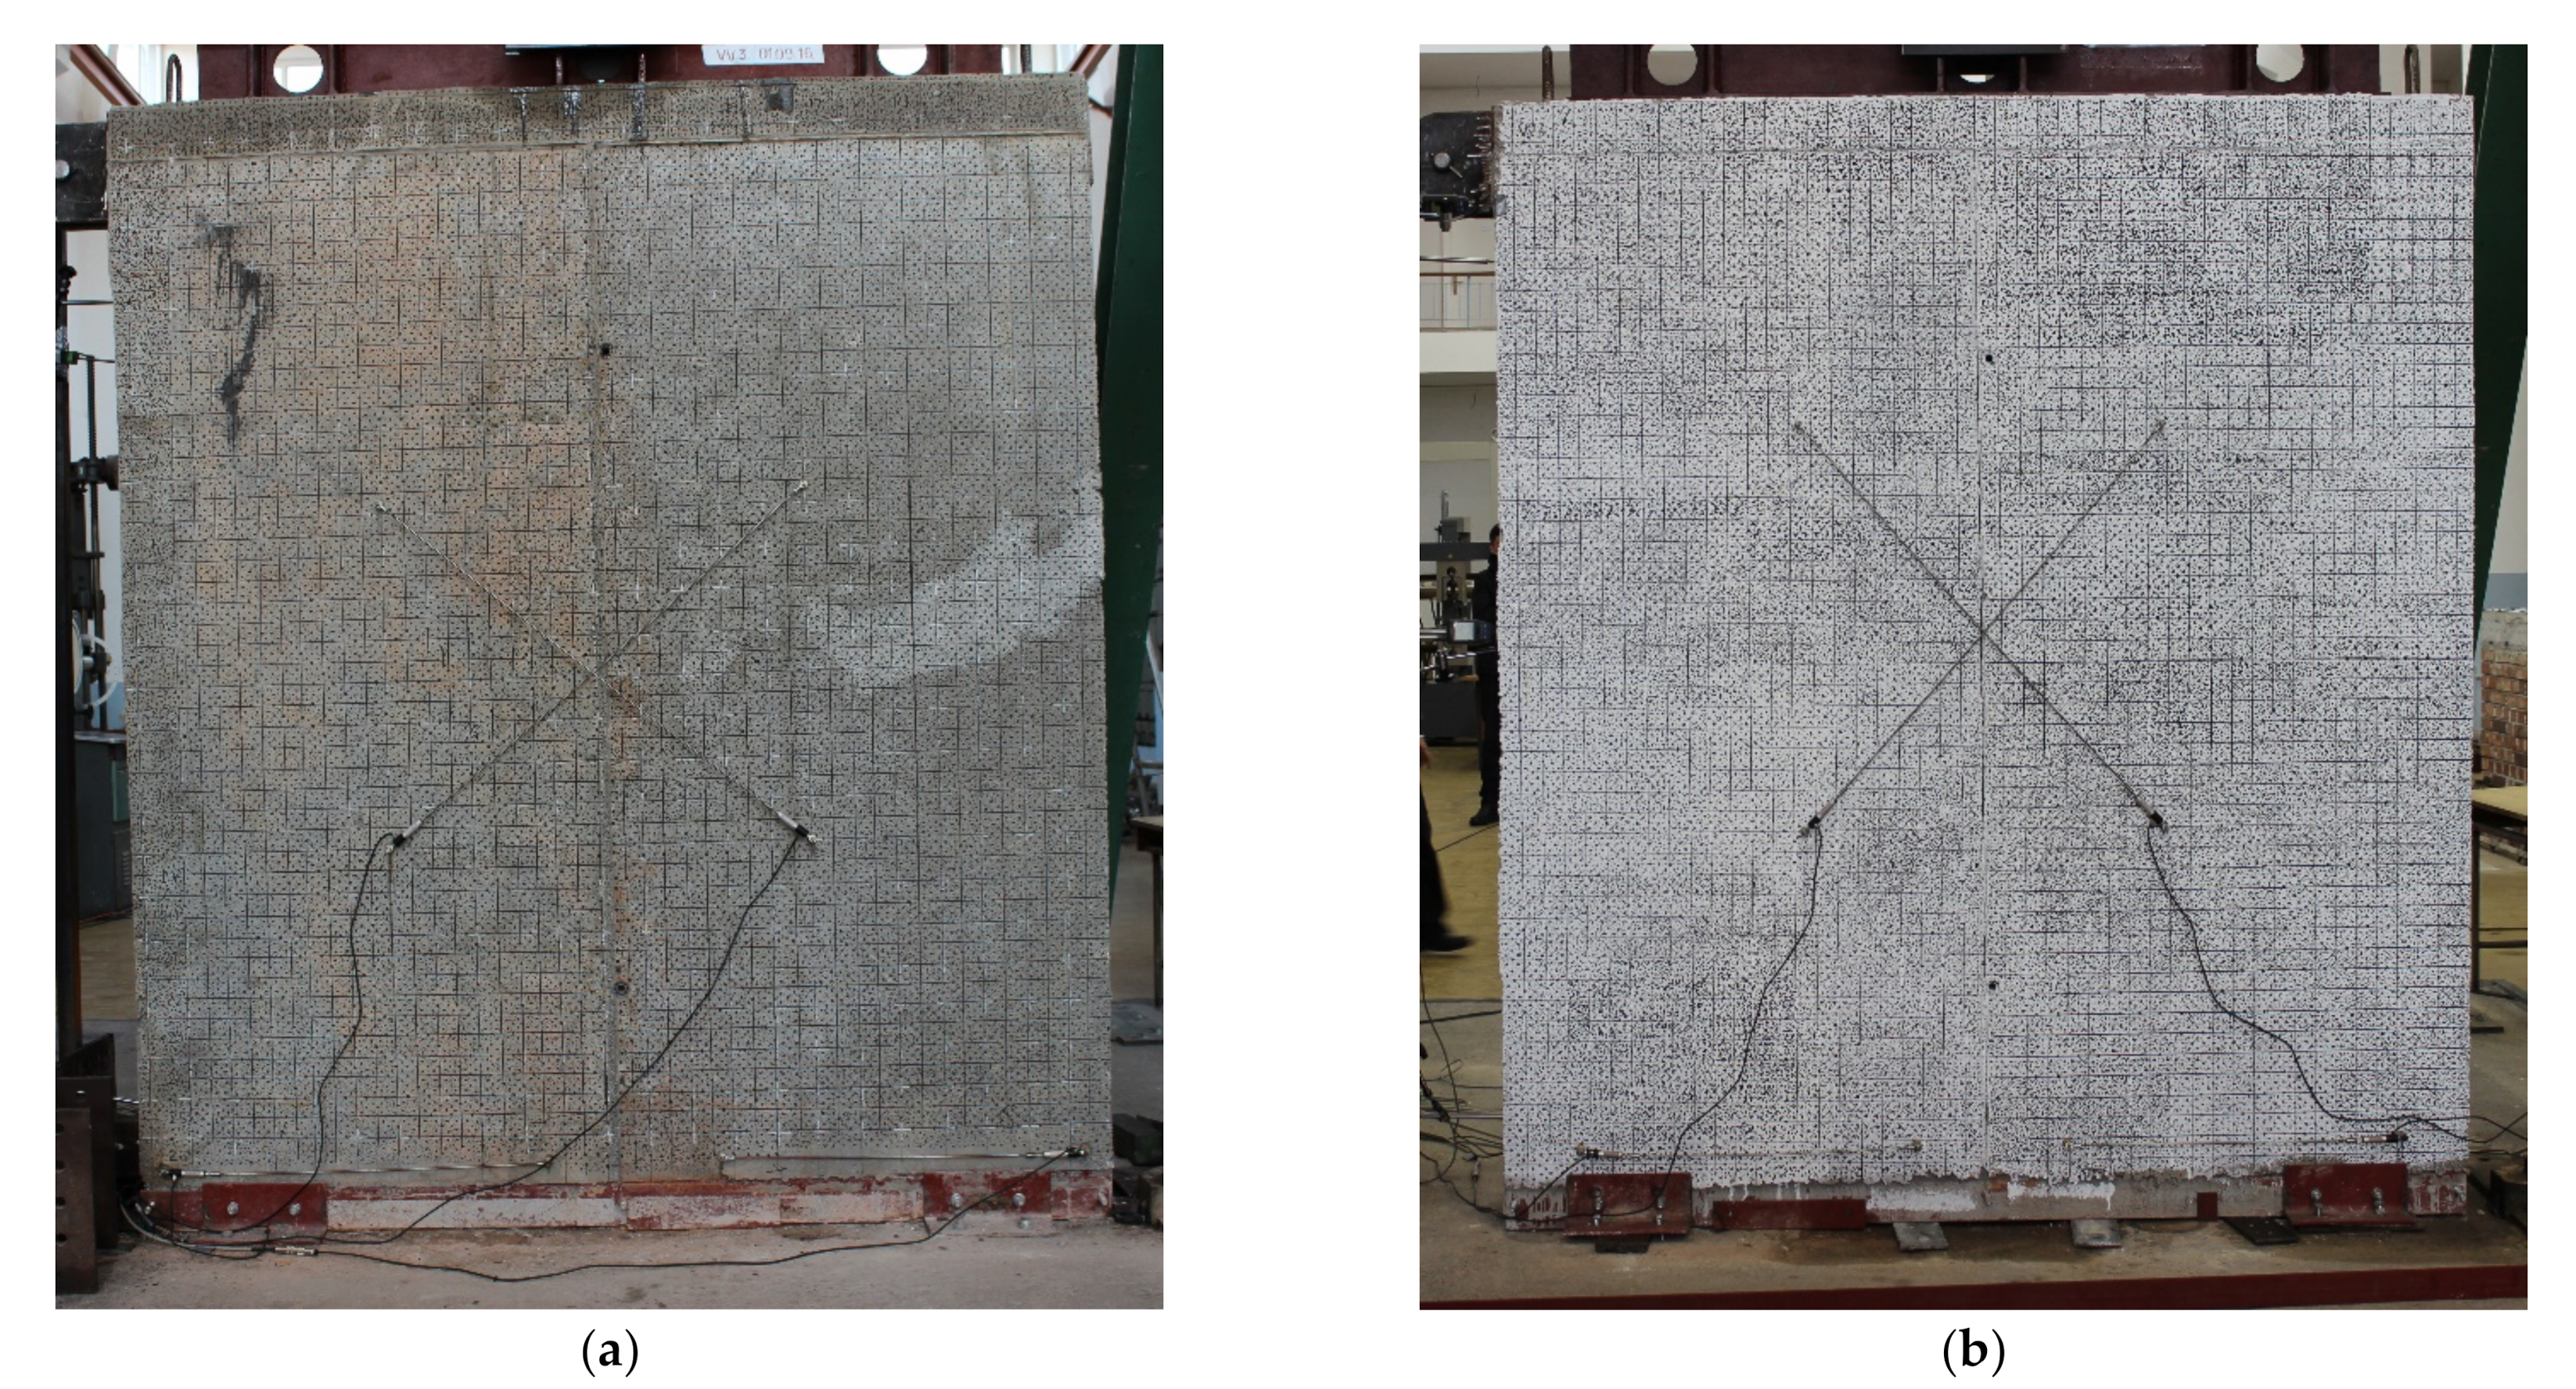
By jacketing the wall, the failure mode fundamentally changes in relation to the previous walls. Specimens W1 and W2 failed in shear with a typical diagonal cracking pattern while the strengthened walls behave like a rigid body that rotates around the compressed edge (rocking). The walls were prepared for recording with a digital camera so that the wall faces were marked with dots of different thickness and stochastic arrangement (
Figure 16). After the processing of digital photographs, degradation was not observed on the jackets. There were no cracks caused by compressive stresses at the edges of the wall, and no loss of bond between the jacket and the wall (delamination) was noticed.
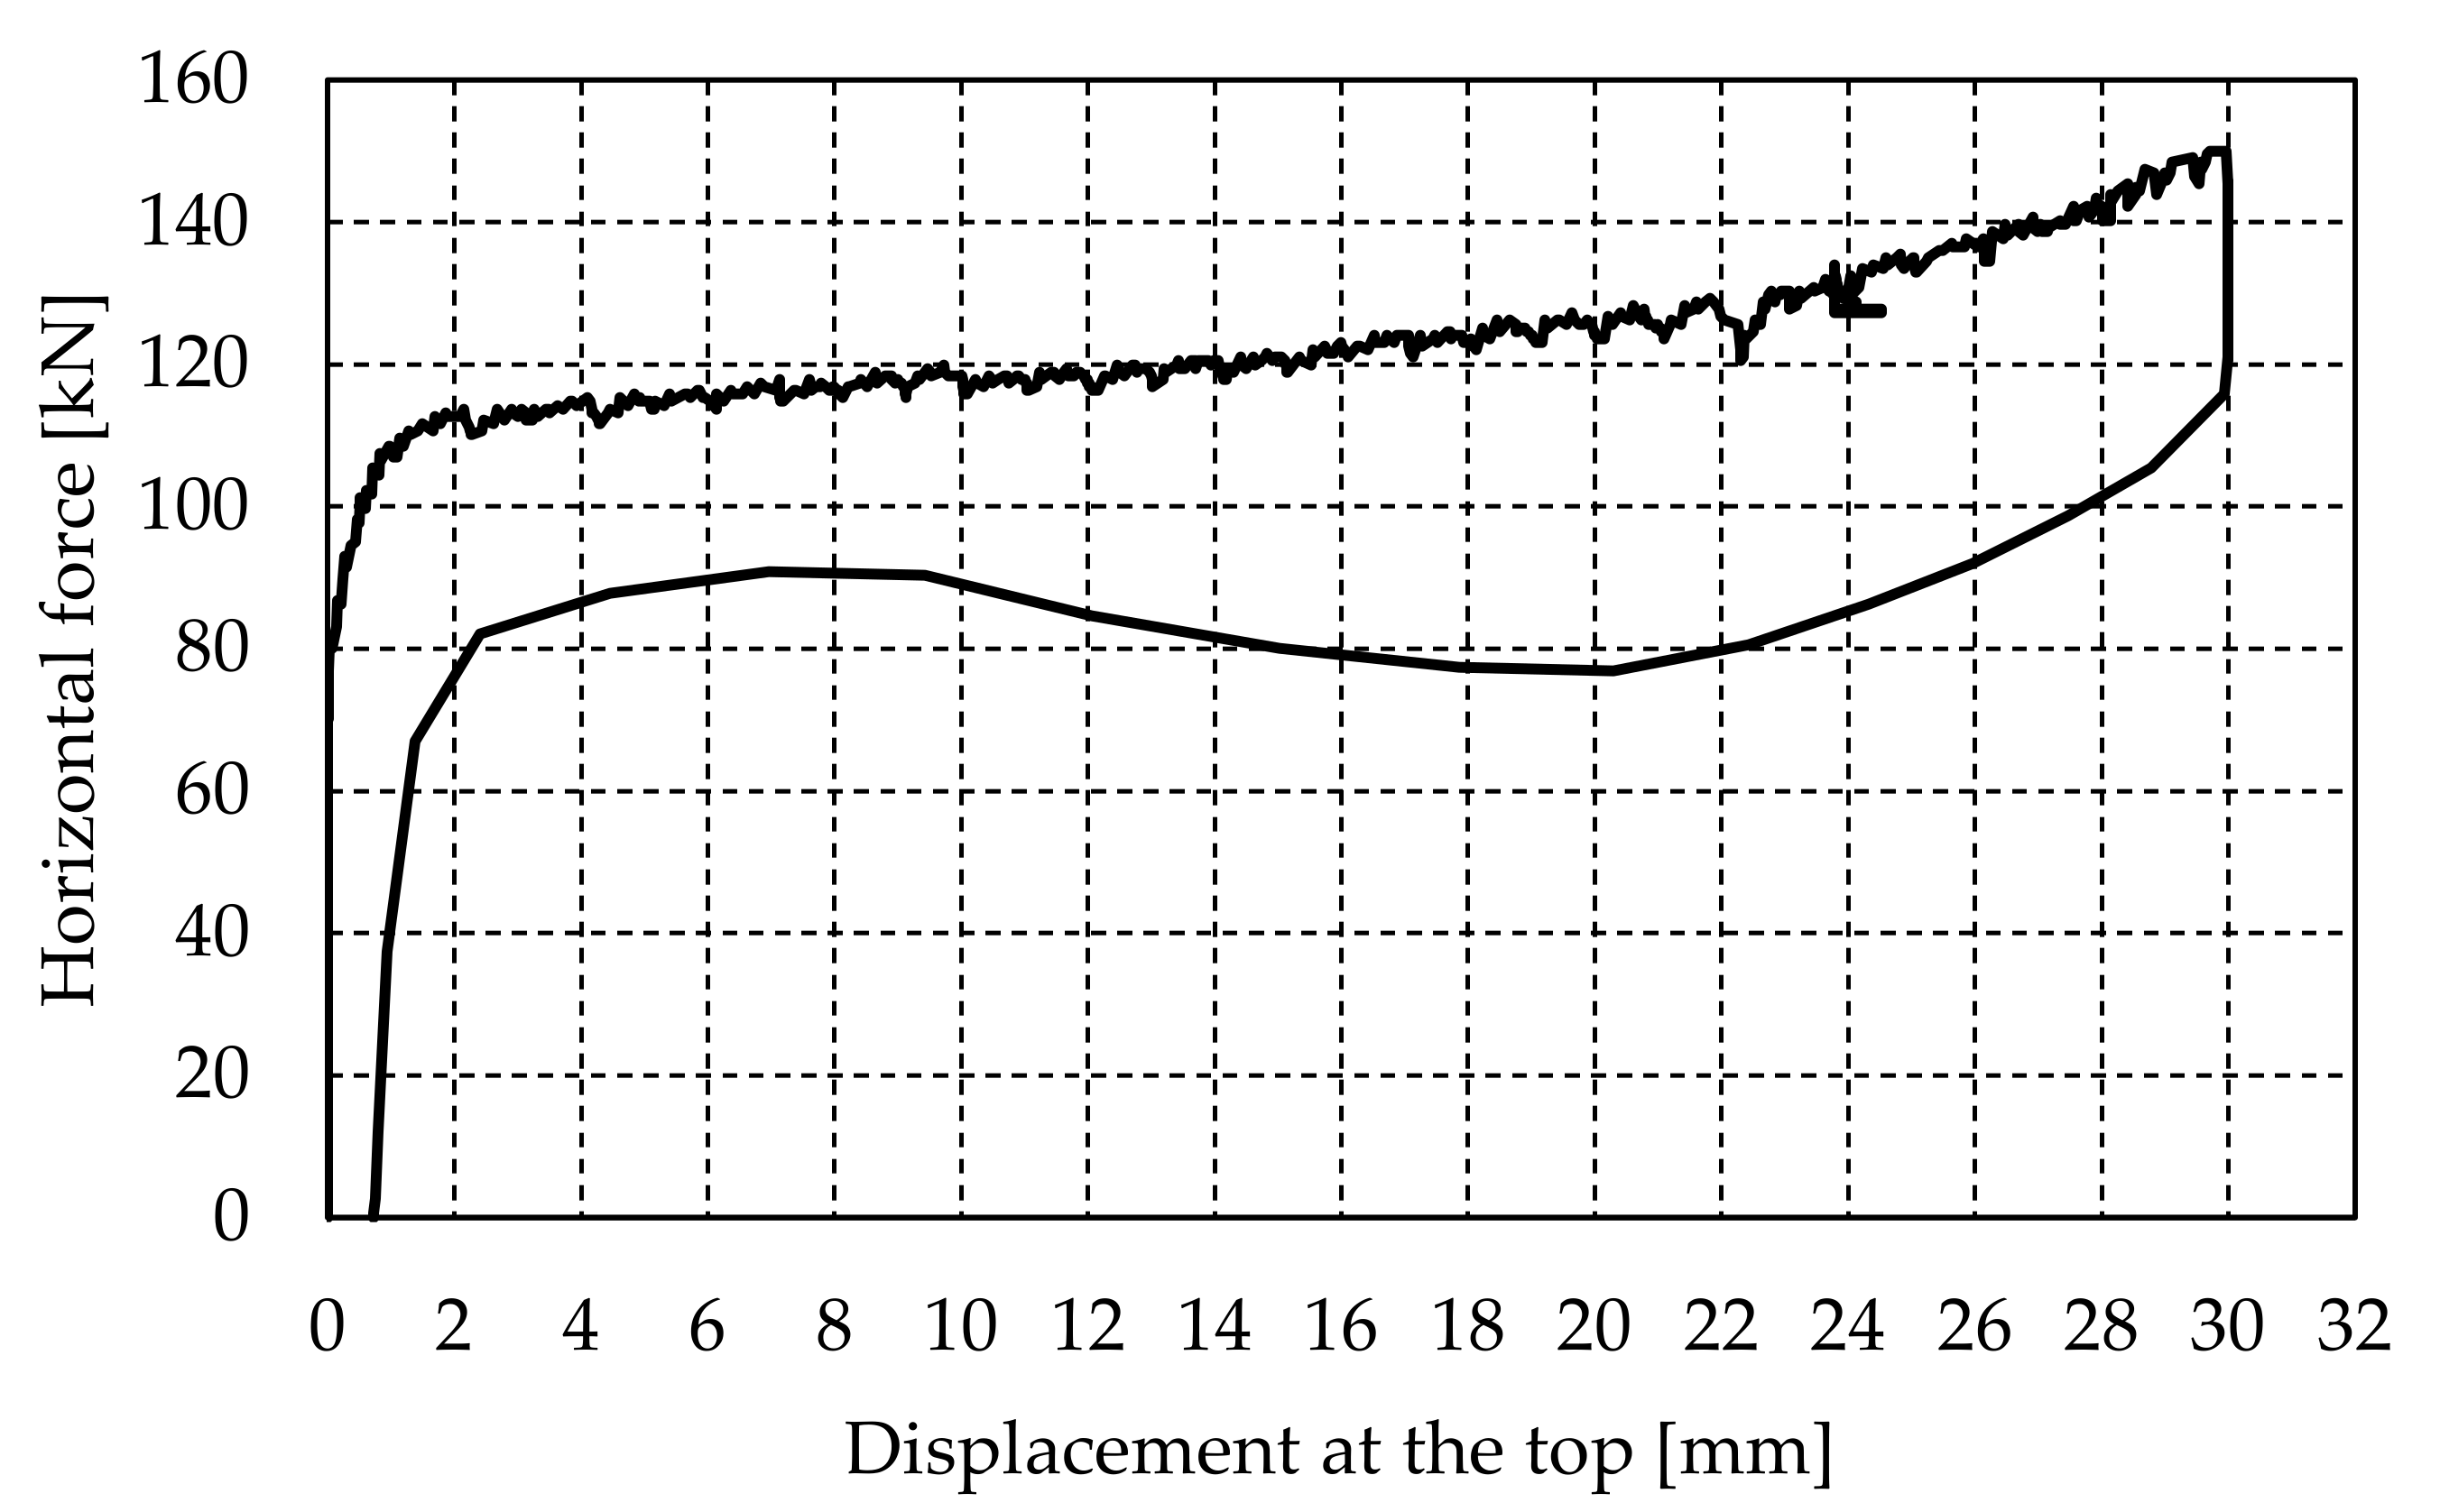
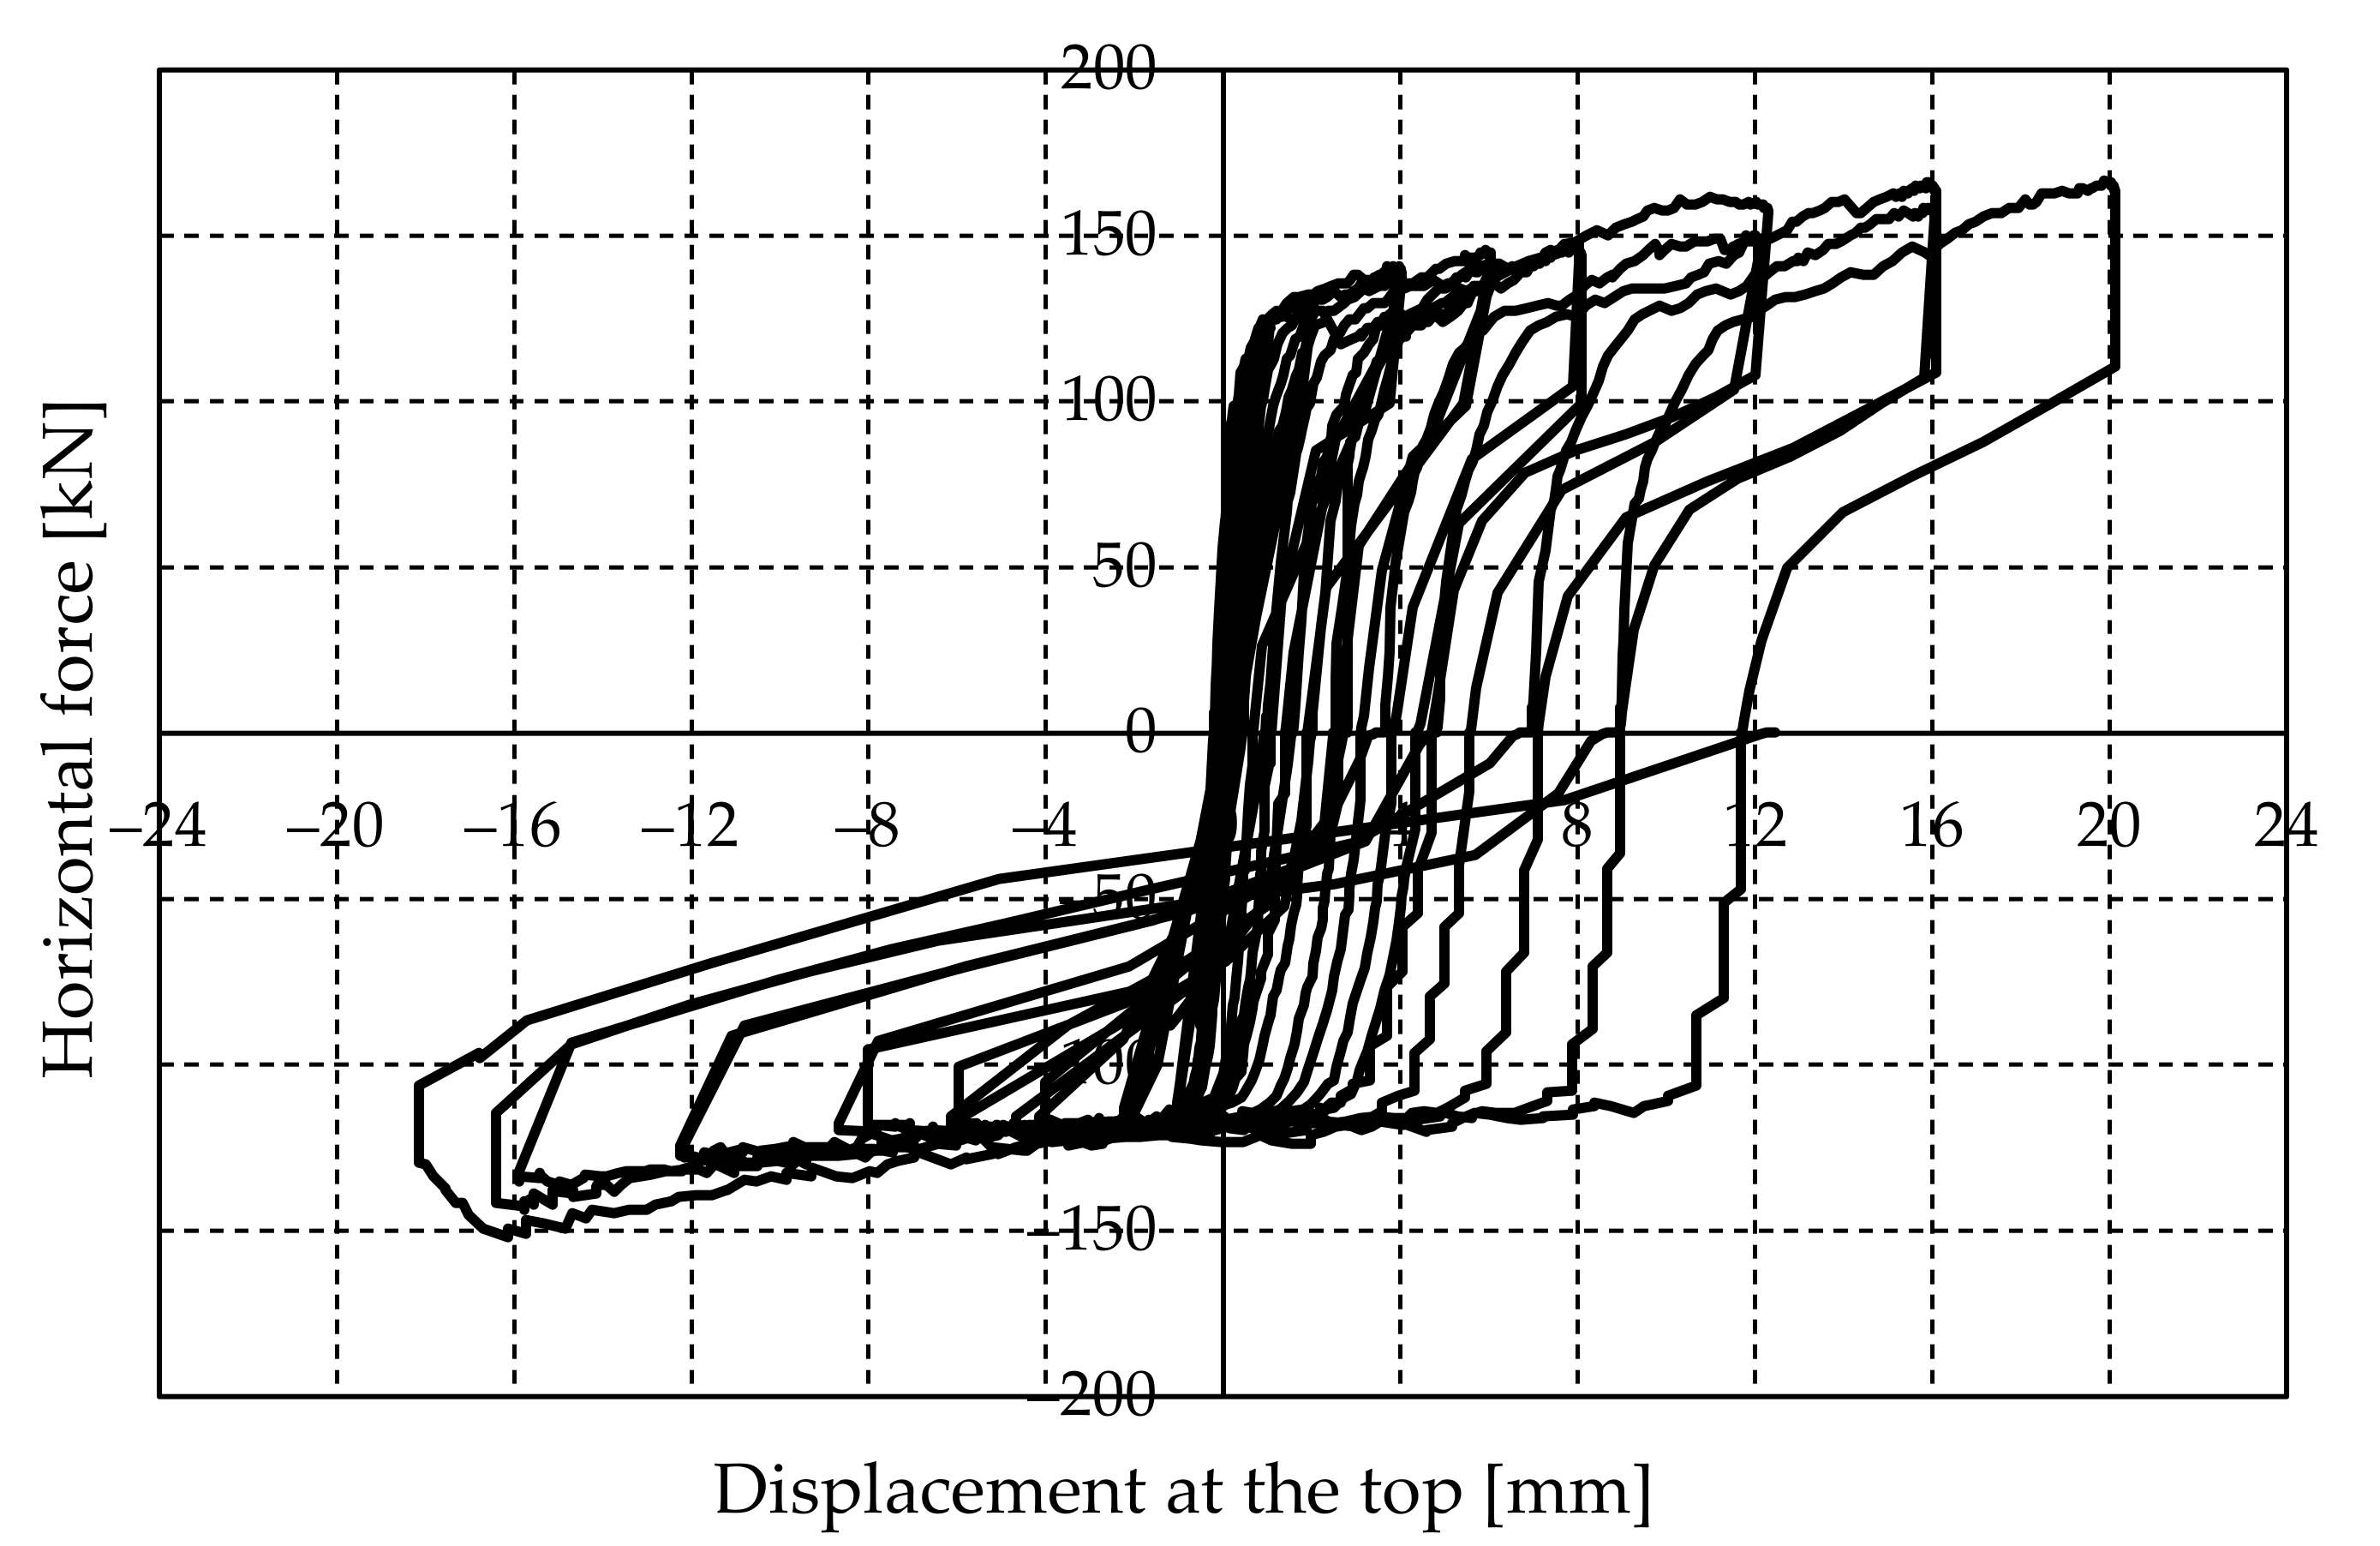
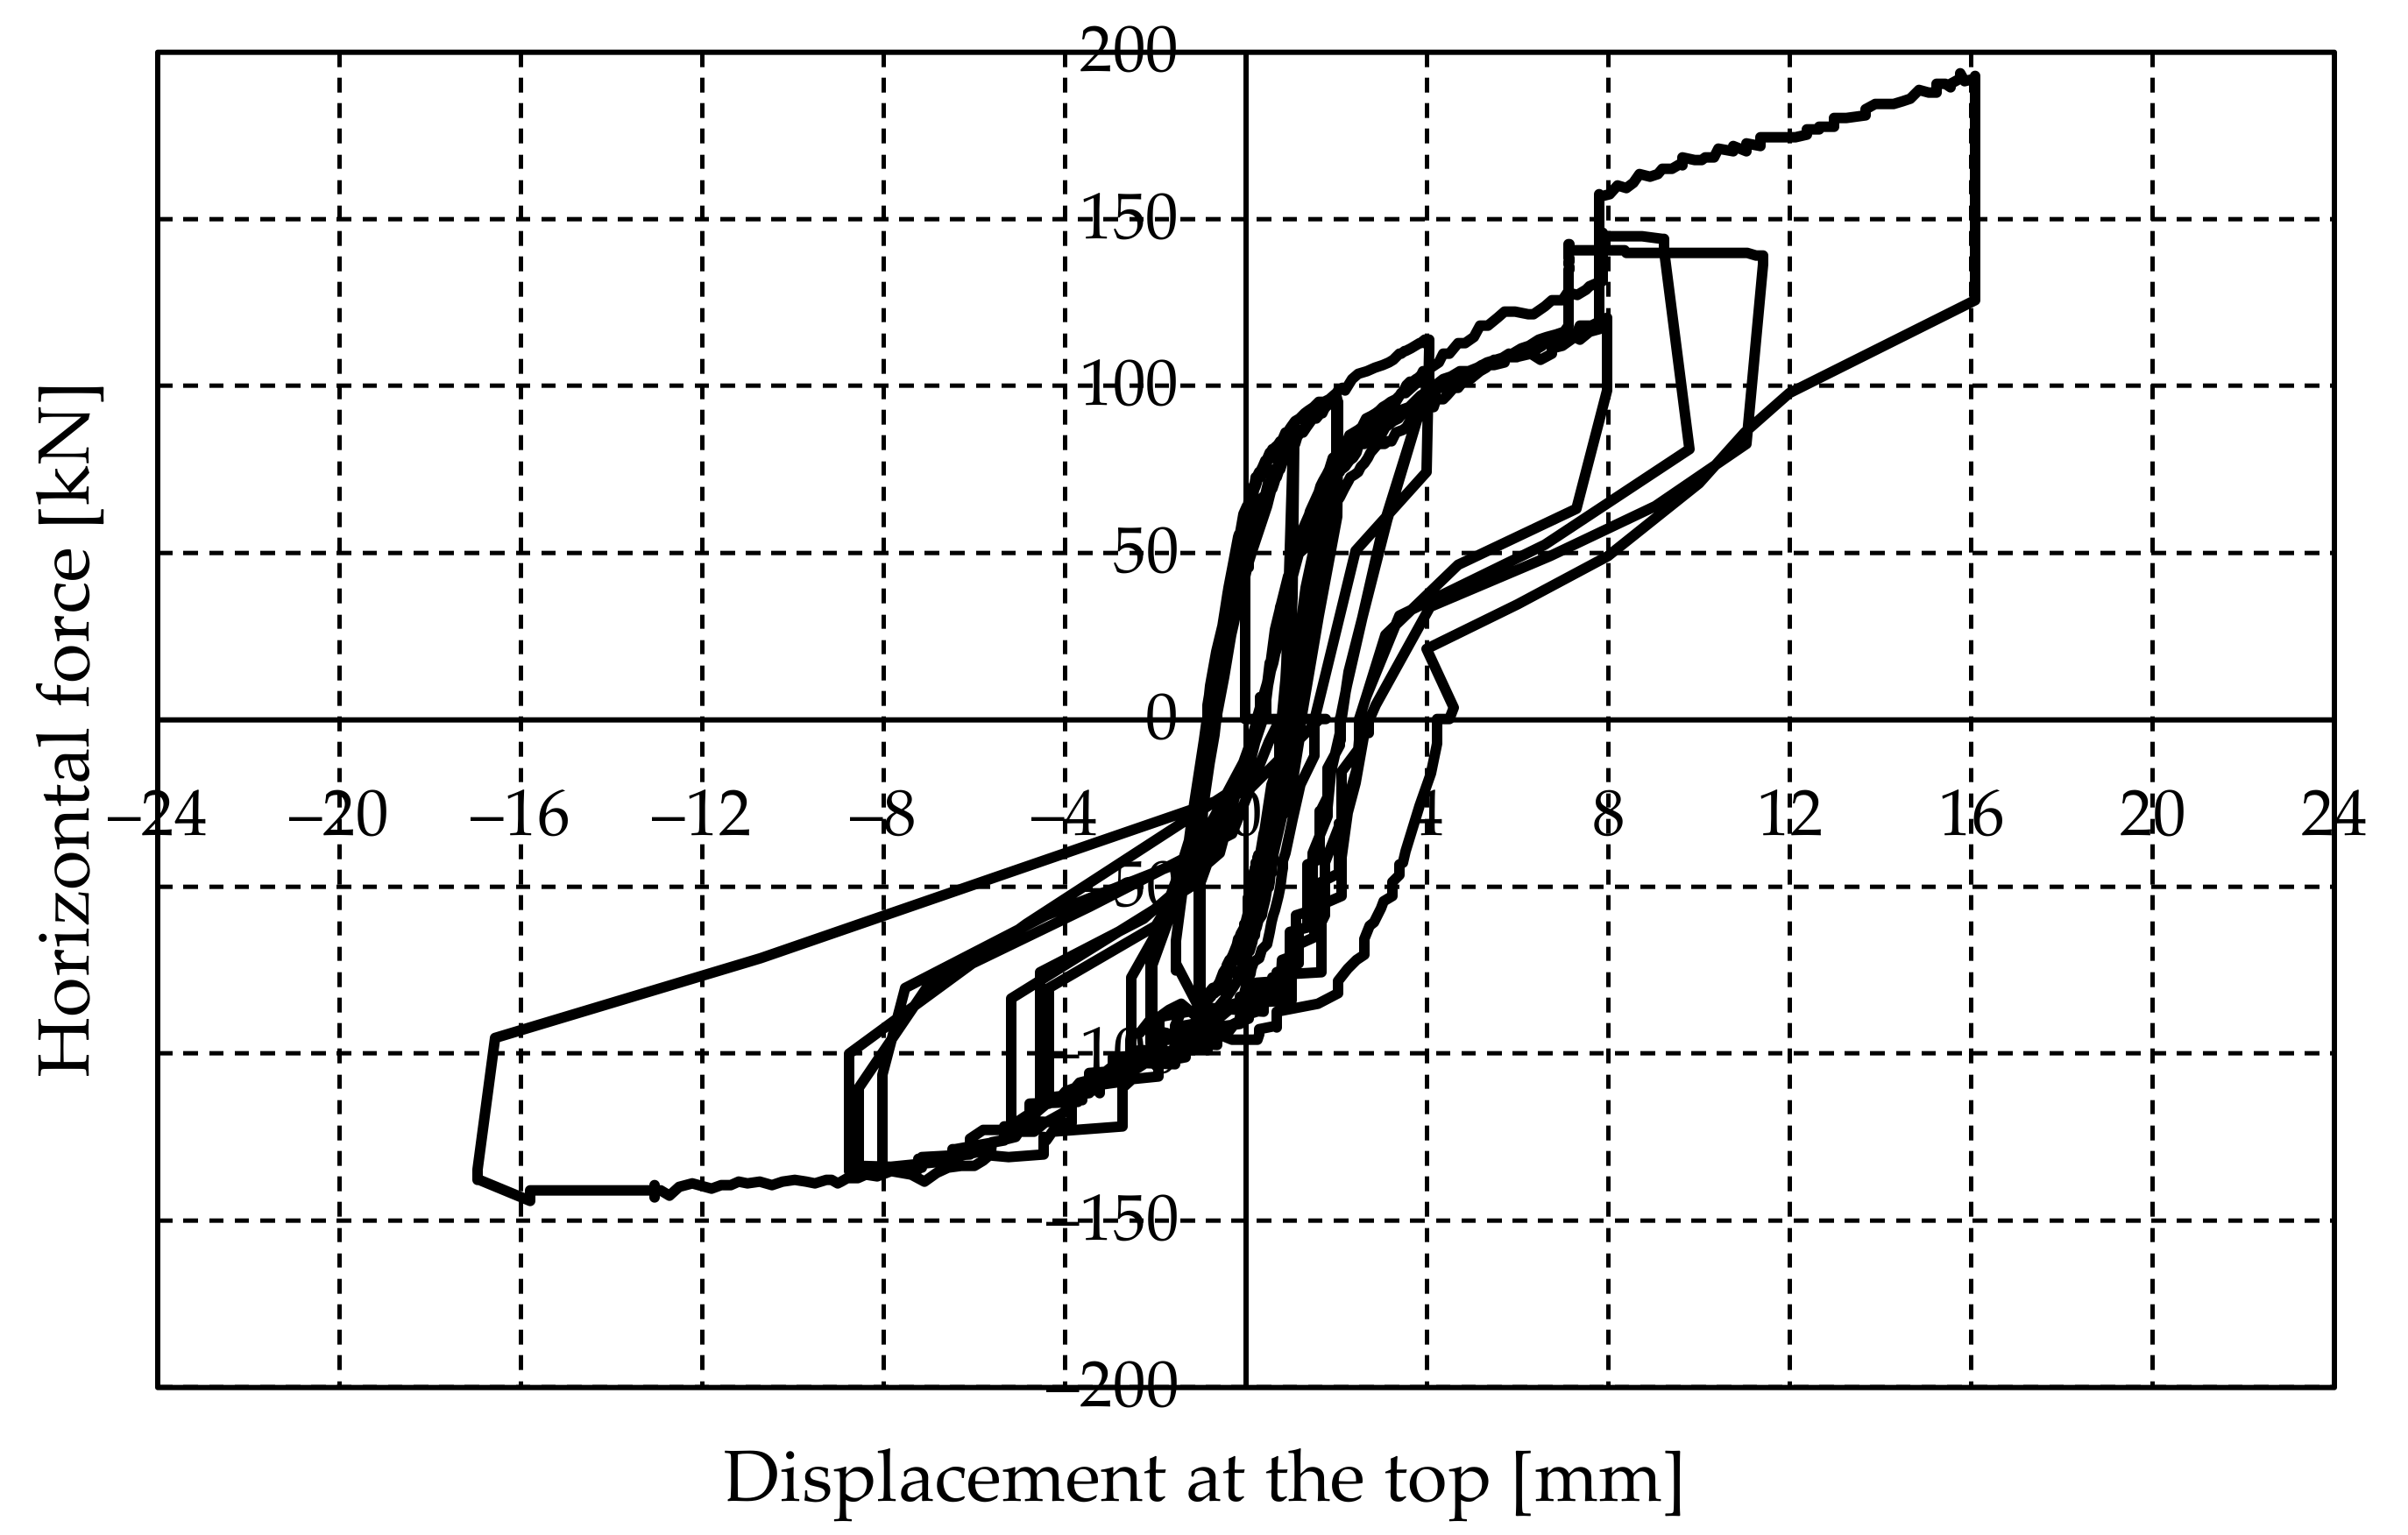
Hysteretic curves for W3 and W4 are given in
Figure 17 and
Figure 18 (vertical stress intensity σ
v = 0.4 N/mm
2). After the initial increase in force, the stiffness decreased, and an almost horizontal yield plateau appeared. However, the nonlinear response was not a consequence of cracking but of the reduction of the compressed zone on the wall-foundation contact (decompression).
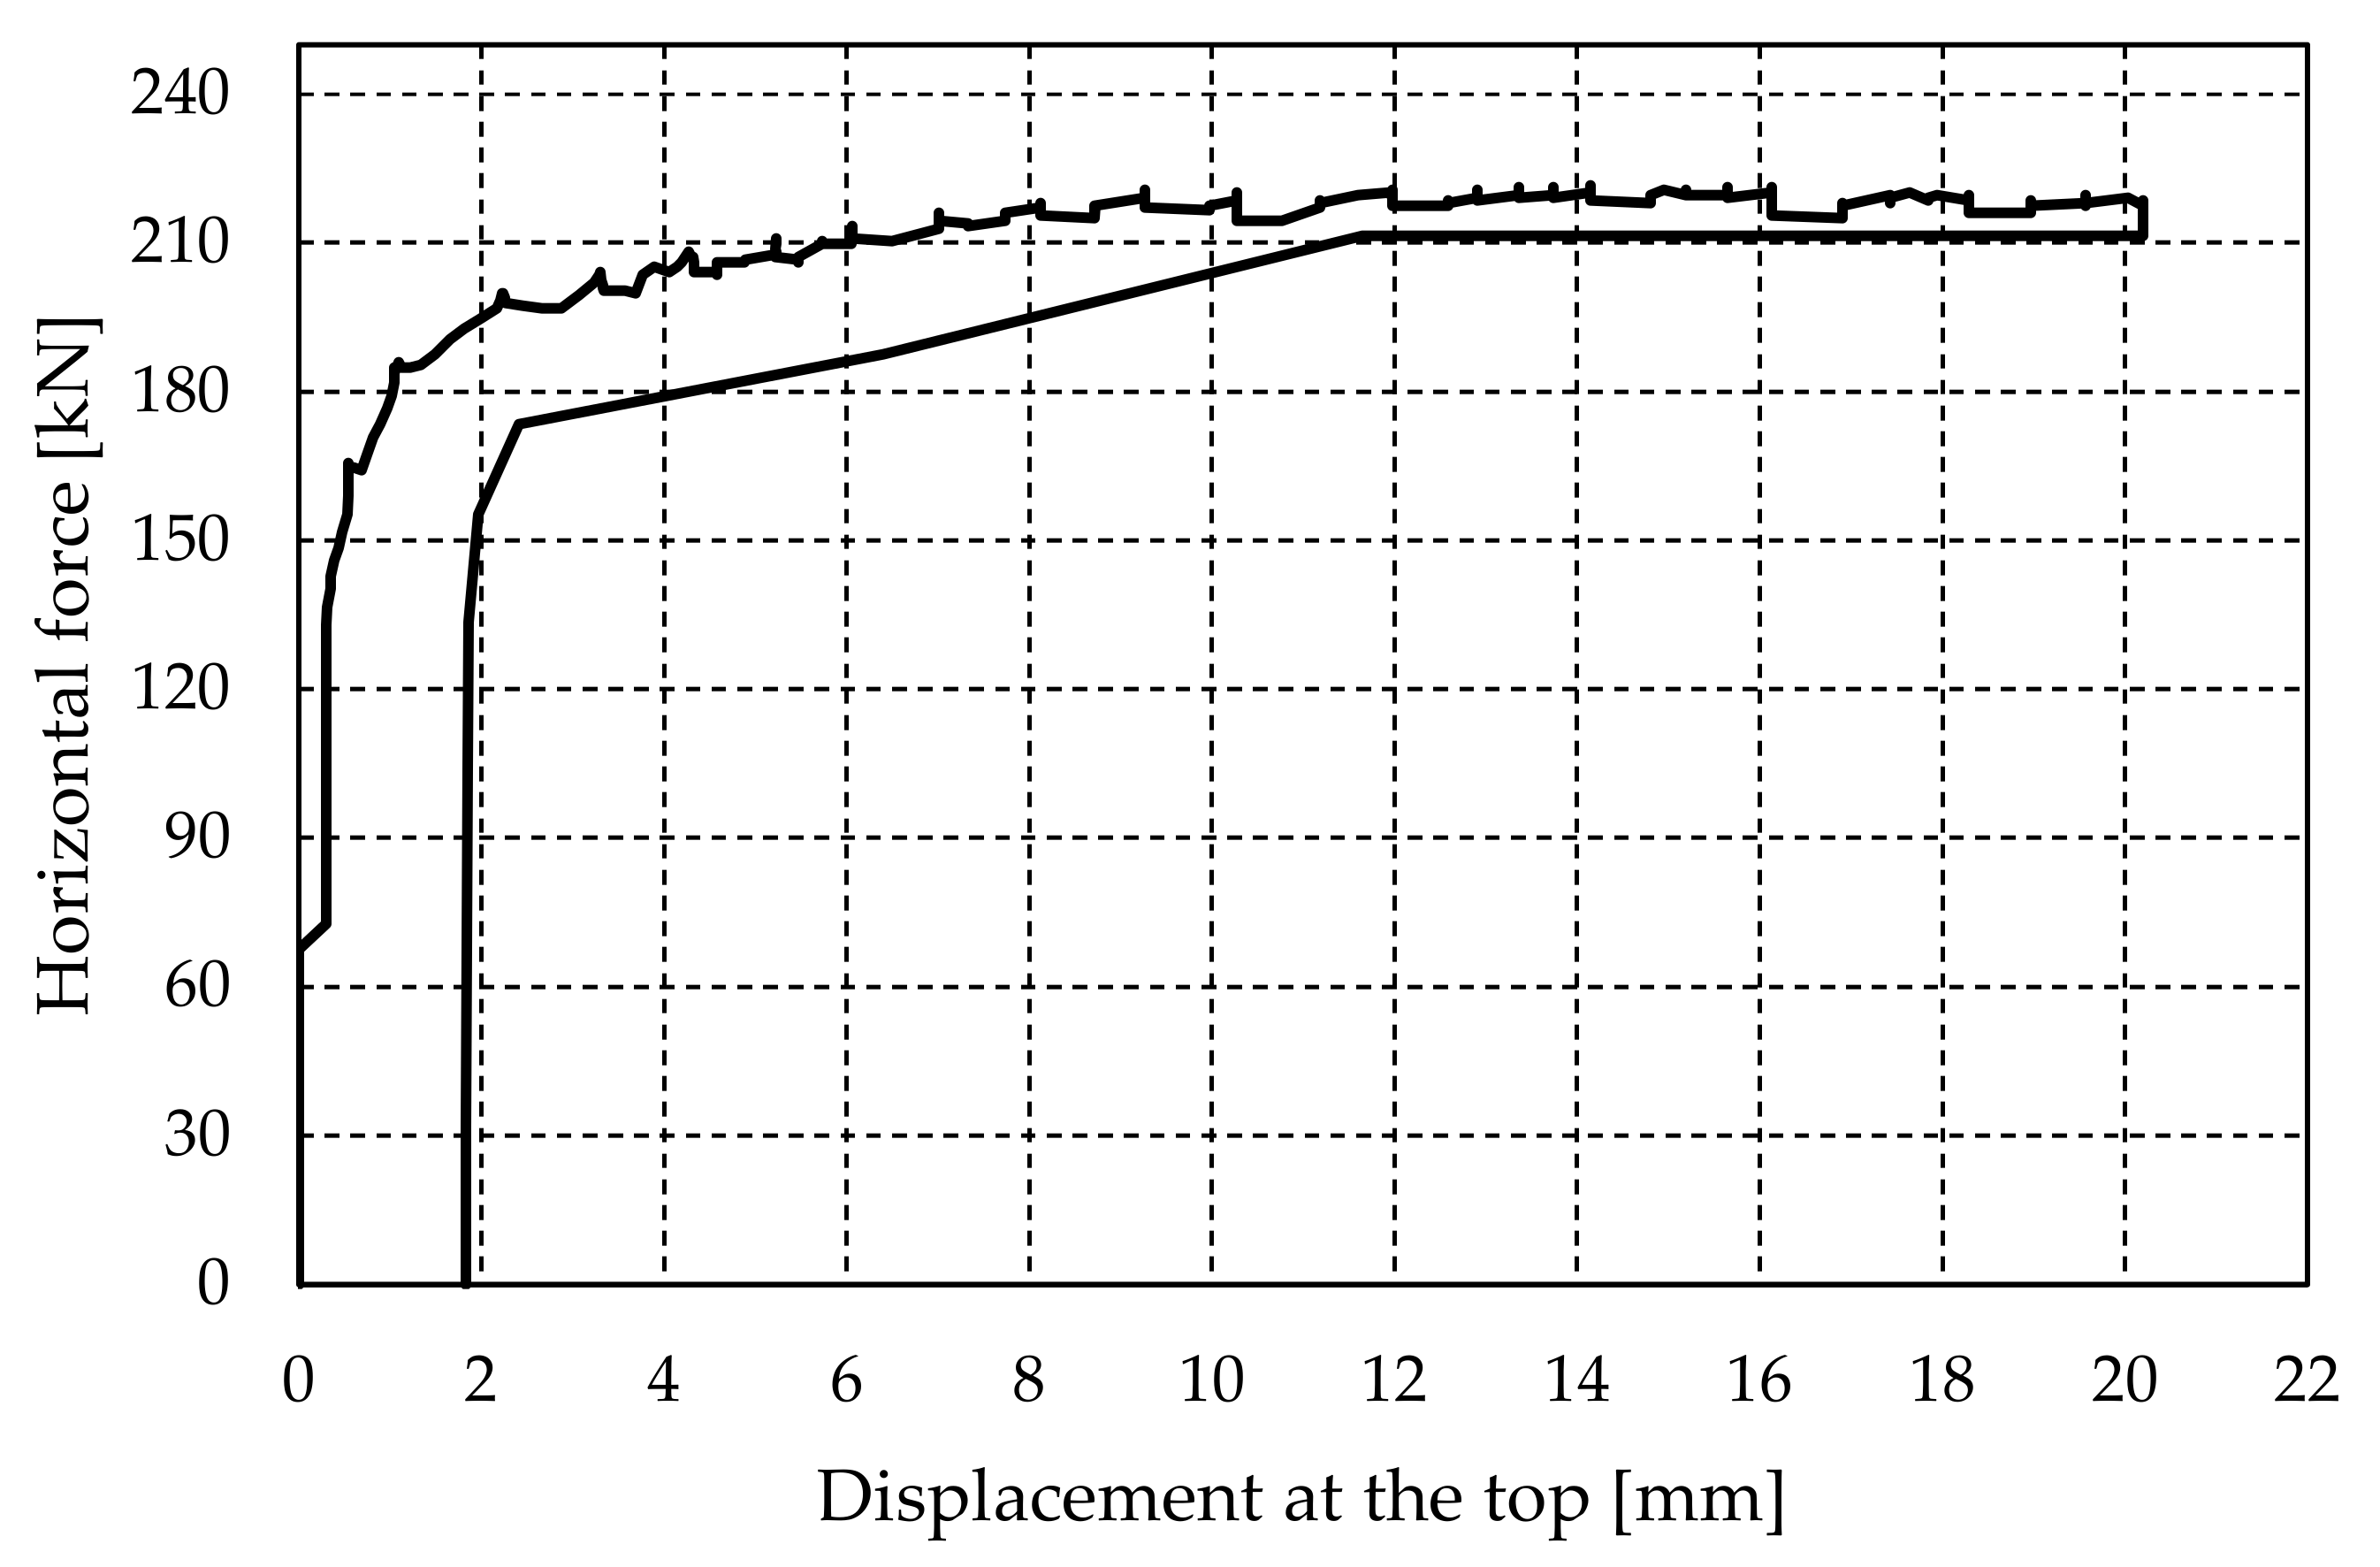
To correlate the response of jacketed walls with previous results, it was considered that the force causing the first crack is equal to the force at which rocking occurs. The maximum force and the force at the maximum displacement were approximately equal and amounted to approx. 125 kN. These values were also confirmed by the pushover curve shown in
Figure 19. The pushover curve also showed that the wall has a maximum displacement of 30 mm without damage, which is 50% more than the displacement in the cyclic test. During unloading, the force-displacement curve returned to the origin along almost the same path (there were no residual deformations).
Assuming that the wall is a rigid body, the force H causing overturning can be determined from Equation (9):
where H is the lateral force that causes uplift, h is the lever arm of H, G
wall is the weight of the wall, V is the force in the vertical actuator, and L is the wall length. Equation (9) yielded H = 125 kN, which matches well with the experimentally measured force.
In real structures, walls cannot rotate [
29] except possibly in higher stories. Since each wall is a part of a larger structural system, free rotation is mostly prevented (due to the constraining effects of RC slabs and other walls), and an additional force is diagonally applied, which can cause crushing of the wall toe or the appearance of diagonal cracks. In the experiments conducted so far, it was not possible to model the influence of the rest of the structure on the observed wall. To accomplish this, it is necessary to examine the model of the building as a whole. Rotation of the wall can be prevented by anchoring the reinforcement to the base beam, which is recommended when reinforcing the real structure. In this manner, the strength of steel can be fully utilized. However, the goal of this research was to examine the seismic behavior of the “composite” material obtained by coupling the masonry wall with the jackets, rather than the influence of anchored reinforcement on the response of the strengthened masonry.
Resistance and deformability parameters of the strengthened walls W3 and W4 for compressive stress level of σ
v = 0.4 N/mm
2 are given in
Table 6 (negative part of hysteretic curves considered). The characteristic limit states of the wall are the uplift (equivalent to crack limit), the maximum resistance, and the ultimate resistance. The results of bilinear idealization of hysteretic curves are listed in
Table 7. Energy dissipation is shown through the equivalent viscous damping coefficient in
Table 8. Since there were no cracks, the hysteresis damping was very small.
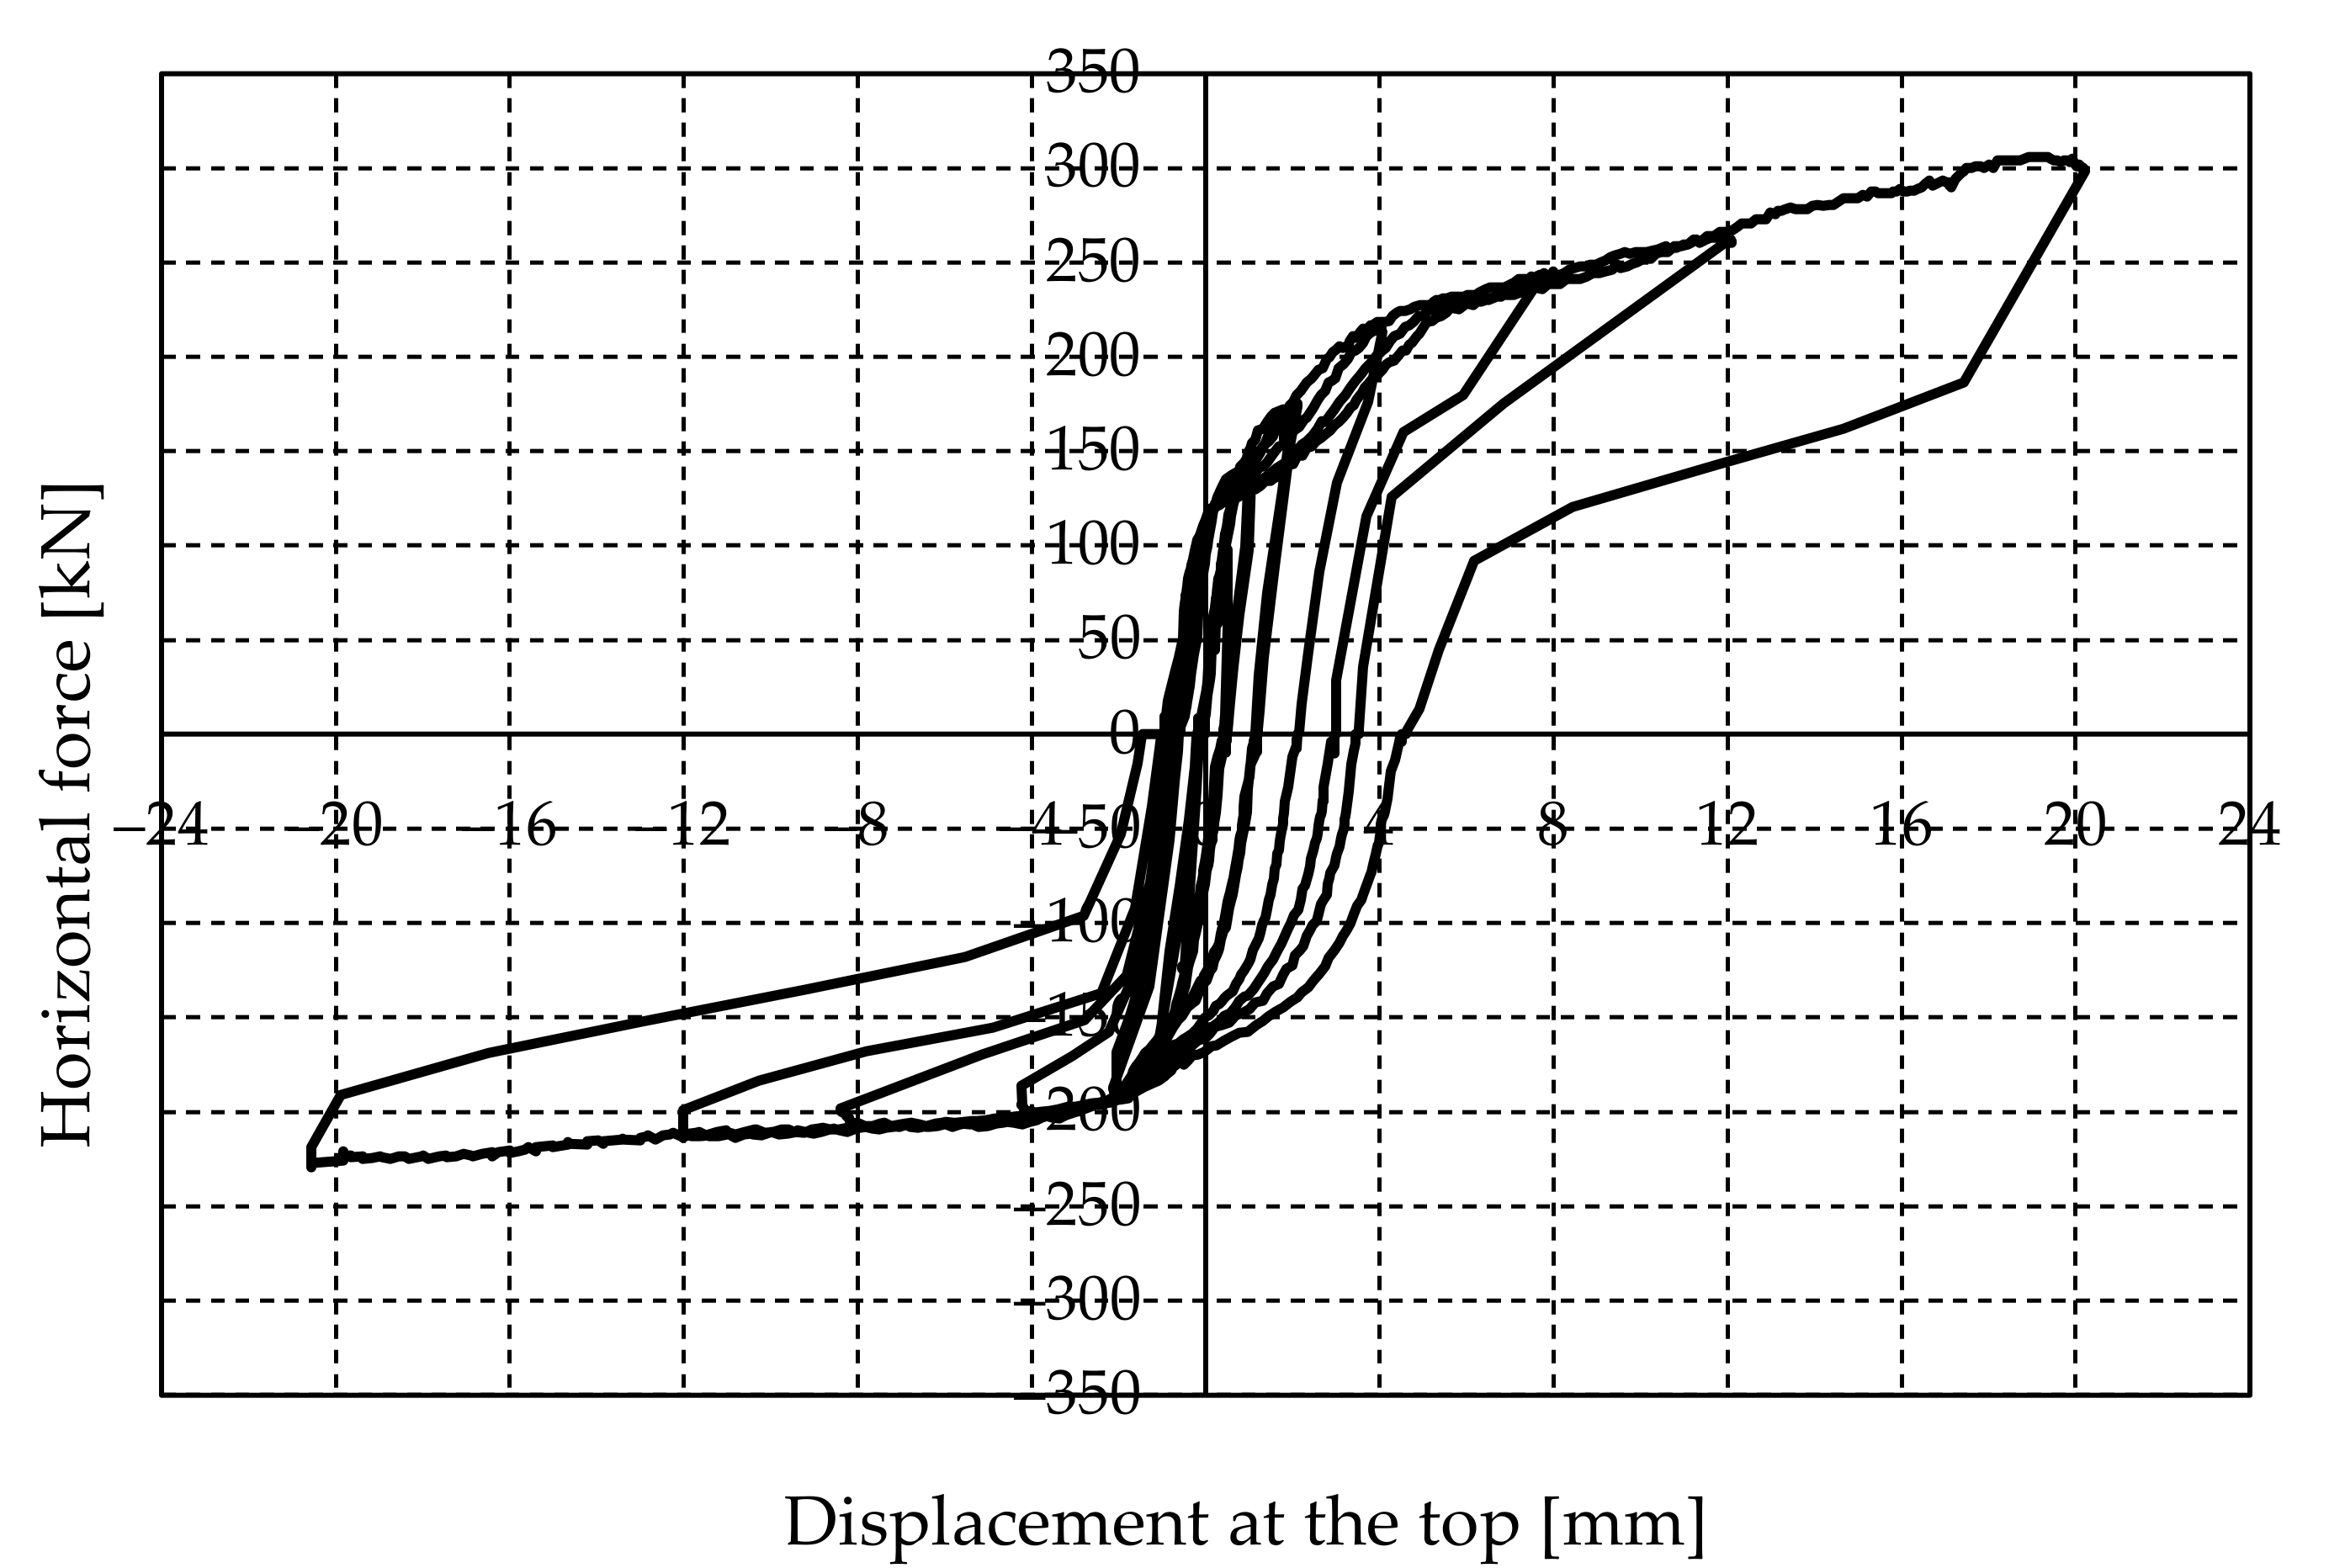
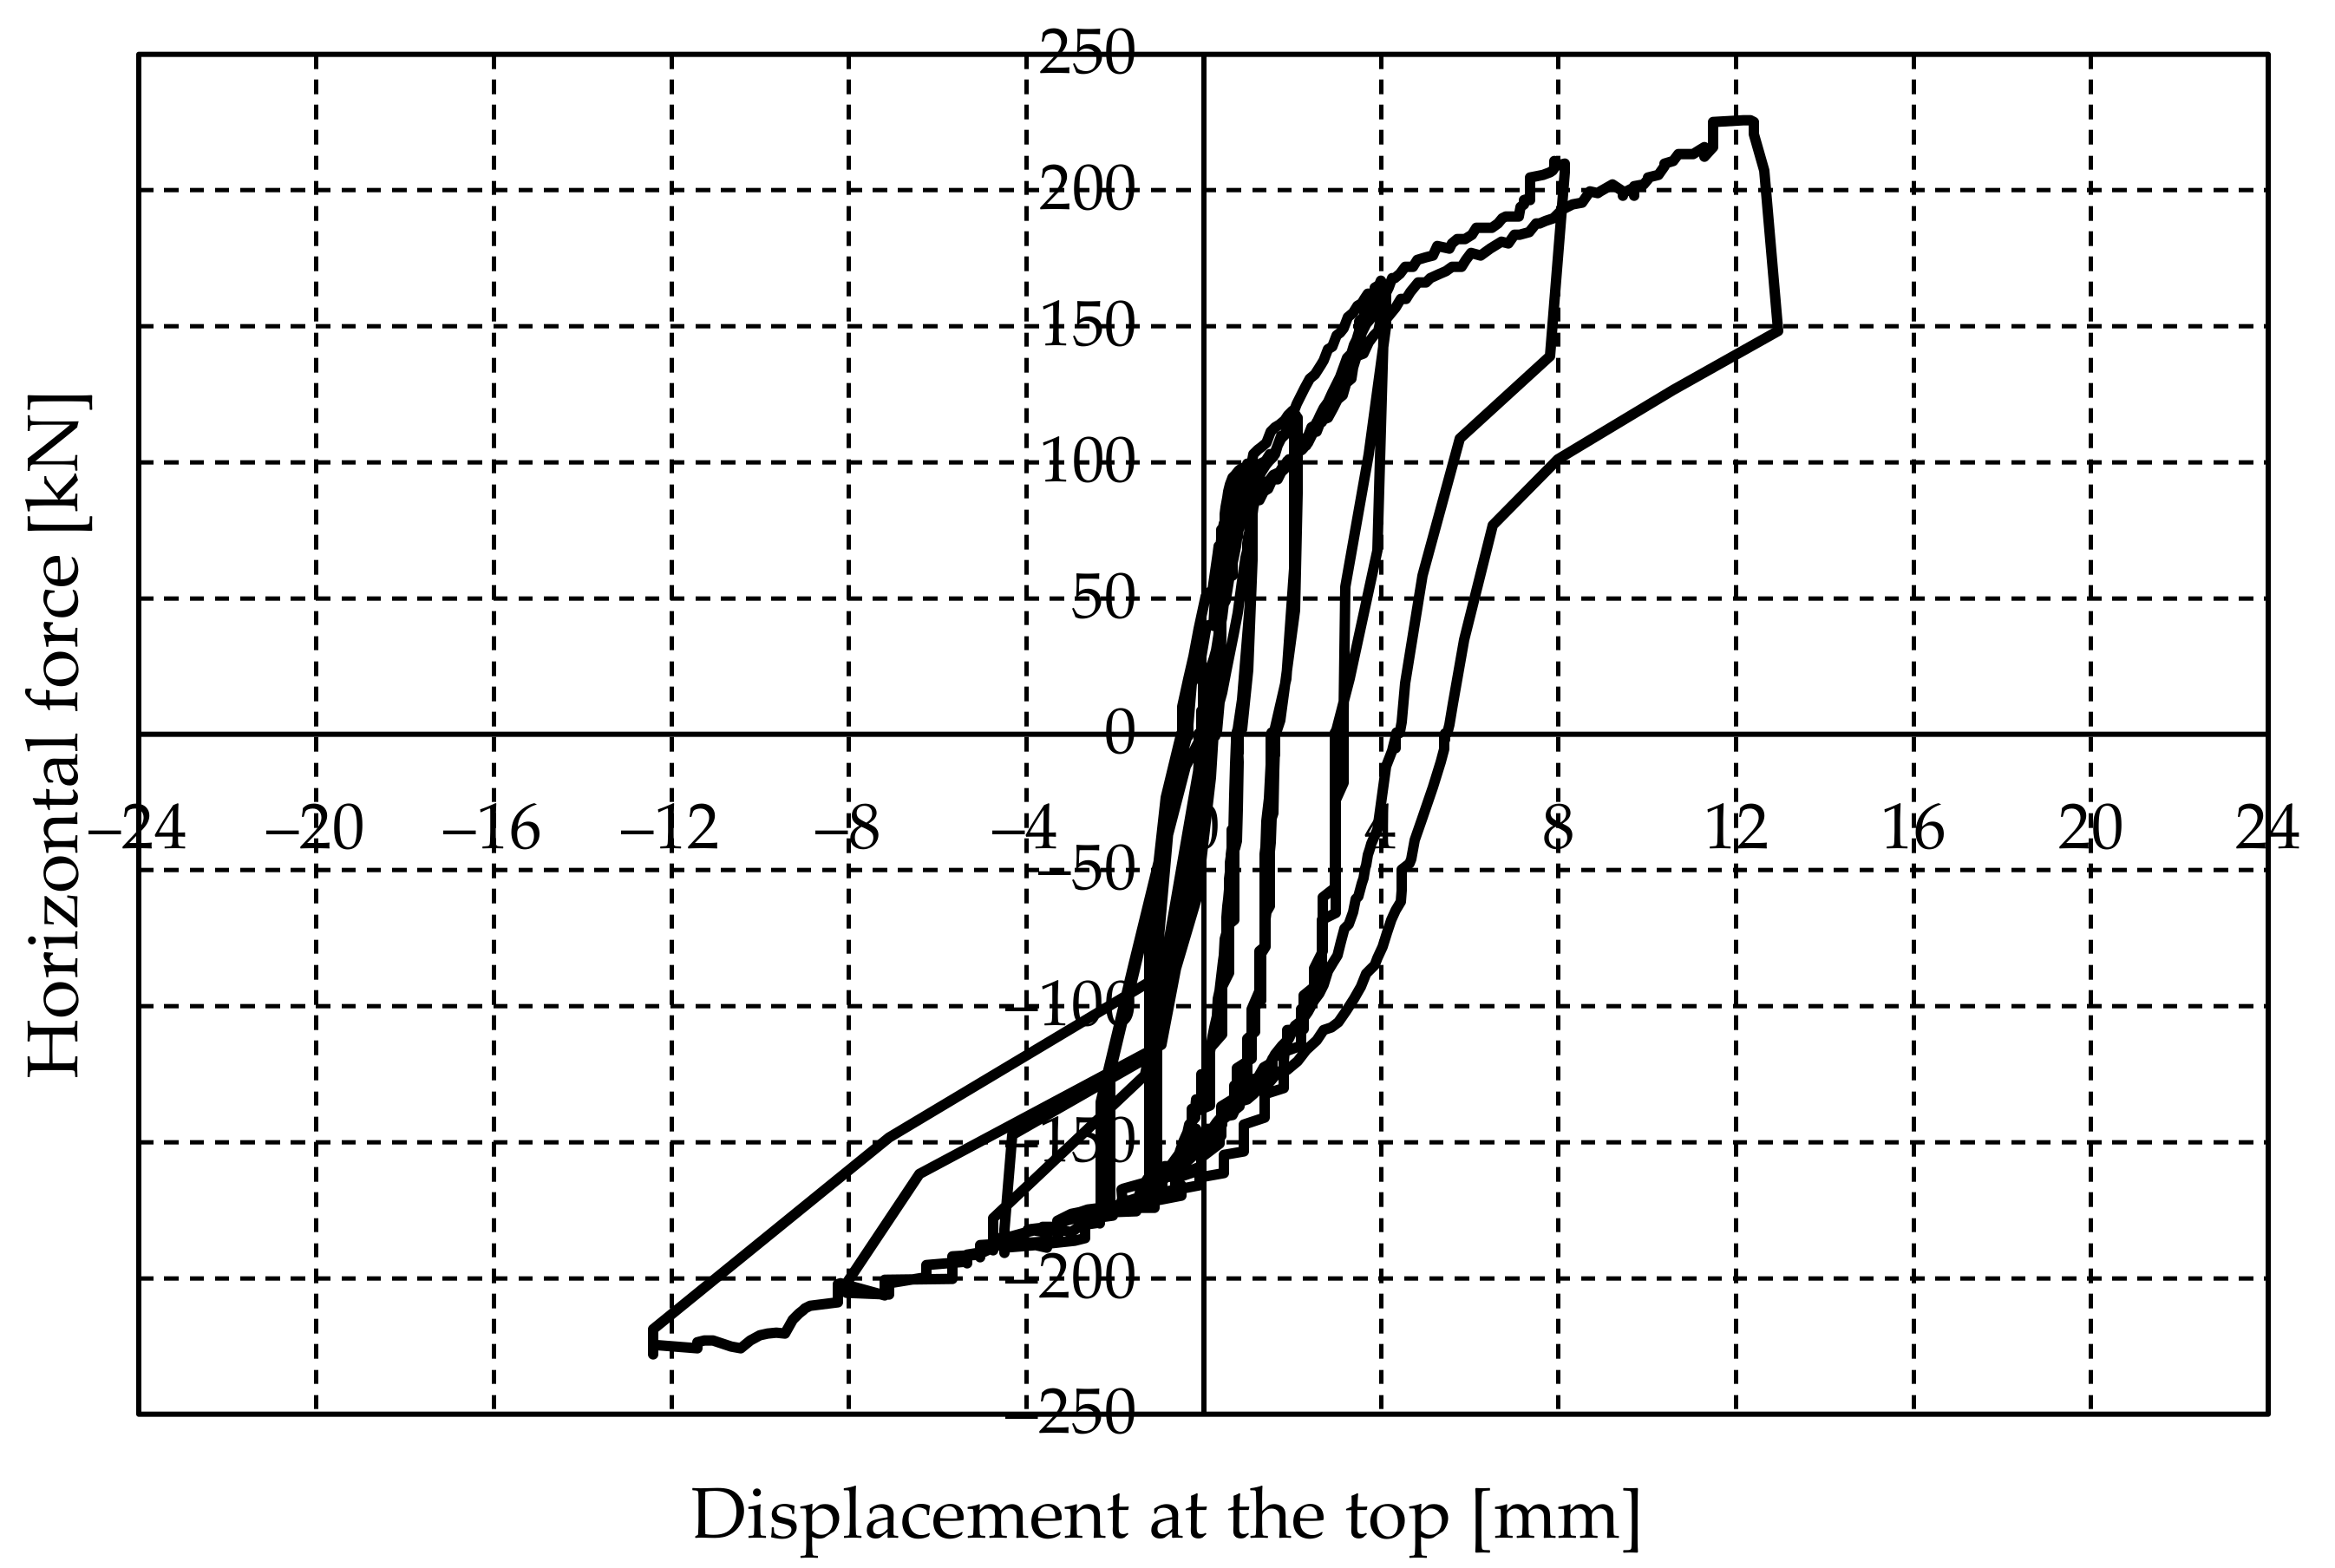
Since shear failure did not occur for vertical precompression equal to σ
v = 0.4 N/mm
2, the jacketed walls were tested under the increased vertical force of V = 460 kN (σ
v = 0.8 N/mm
2). The loading program was simplified so that the cycle consisted of only one run. As in the previous case, there was no shear failure with the appearance of diagonal cracks. The walls rock as a rigid body. The experimentally obtained hysteresis curves are shown in
Figure 20 (W3) and
Figure 21 (W4). The pushover curve for W4 is given in
Figure 22. The maximum force and the force at the maximum displacement were approximately equal and amounted to 215 kN. The wall was equally ductile regardless of the increase in vertical compressive stress.
Assuming that the walls are rigid, Equation (9) yields H = 230 kN, which is approximately equal to the measured decompression force. Resistance and deformability parameters of the strengthened walls W3 and W4 for precompression level of σ
v = 0.8 N/mm
2 are presented in
Table 9. The results of bilinear idealization of hysteretic curves are listed in
Table 10. Energy dissipation is shown through the equivalent viscous damping coefficient in
Table 11.
4. Discussion
Constitutive behavior of heterogeneous and anisotropic masonry is complex and, even for small deformations, is not linear. It is quite difficult to replicate the actual walls of real buildings in a laboratory, which especially refers to the properties of mortar, boundary conditions, etc. However, valuable data on the mechanical characteristics and behavior of solid brick walls typical of URM buildings erected after World War II were obtained from the conducted experimental research.
Results of masonry compressive strength and Young’s modulus tests showed considerable variation. Although all samples were built in laboratory conditions, the large scatter of results and the unreliable response of the prism to compression are indicative of the global behavior of masonry in real structures, both in terms of ultimate load and ductility. For prisms constructed with the same mortar, the strengths varied up to 50% (approx. 6 N/mm2 for samples P3 and P4, approx. 4 N/mm2 for samples P5 and P6), while the limit deformation for sample P4 was approx. 4‰, and for P5 approx. 18‰.
The outcome of experiments on masonry prisms under far-field compression can be analyzed from two other aspects. The result of the wallet experiment is rather interesting when the compressive strengths of brick and mortar are compared with the strength of the heterogeneous prism. The average strength of the prism was considerably larger than the uniaxial mortar strength. The lateral deformation of the compliant mortar was prevented by the mortar being triaxially confined by stiffer bricks, which increased the internal friction and the load-bearing capacity under far-field compression. The second aspect refers to the significant ductility of the masonry prism in relation to the brick itself, which is very brittle. It can be concluded that mortar had a crucial influence on prism deformations, where the reduction of strength is most often compensated by stable post-peak behavior, which was also found by Oliveira in [
30].
All samples of masonry prisms with lower compressive strength and weaker mortar (samples P3–P6) had a more ductile response than samples with higher strength and stronger mortar (P1 and P2), which is consistent with results found in the literature [
31]. Finally, from the digital image correlation of a series of photographs of masonry prisms exposed to compressive stresses, a conclusion can be drawn that failure of the prism was not caused by the crushing of the soft mortar. Due to material mismatch related to Poisson’s ratio, the weaker mortar layer attempts to move out laterally, which introduces lateral tension in the brick unit in exchange for lateral confinement of the mortar layer. Hence, the weak mortar does not fail in compression, but the brittle brick fails in bilateral tension with characteristic multiple axial splitting failure mode [
32]. This is in accordance with conclusions reached by Hilsdorf as early as 1965 [
33].
The program of full-scale experimental investigations refers to tests under constant vertical force V = 230 kN (σv = 0.4 N/mm2) and in-plane cyclic lateral static force. Based on the boundary conditions, the walls can be modeled as cantilevers. As expected, plain (unstrengthened) walls denoted as W1 and W2 failed in shear at a horizontal force of Hmax = 120 kN, which agrees well with the values of the maximum force obtained according to Equation (6) (Hmax = 109 kN). The failure was characterized by cross-diagonal cracks that ran through the bricks or brick-mortar contact. Hysteresis curves of plain walls are generally symmetric and full, which means that energy is dissipated through inelastic deformations. It is evident that the slope decreased during unloading. This implies that, in addition to the plastic behavior due to friction in the wall, cracking in the units causes a decrease in the initial stiffness (damage).
Unlike plain walls, the strengthened walls with 4–5 cm thick RC jackets are characterized by a pure flexural response. Samples W3 and W4 rotated as a rigid body (rocking) without diagonal or vertical cracks due to local compression of the wall toe, both for vertical stress σ
v = 0.4 N/mm
2 and σ
v = 0.8 N/mm
2. The horizontal force capacity at the vertical stress σ
v = 0.4 N/mm
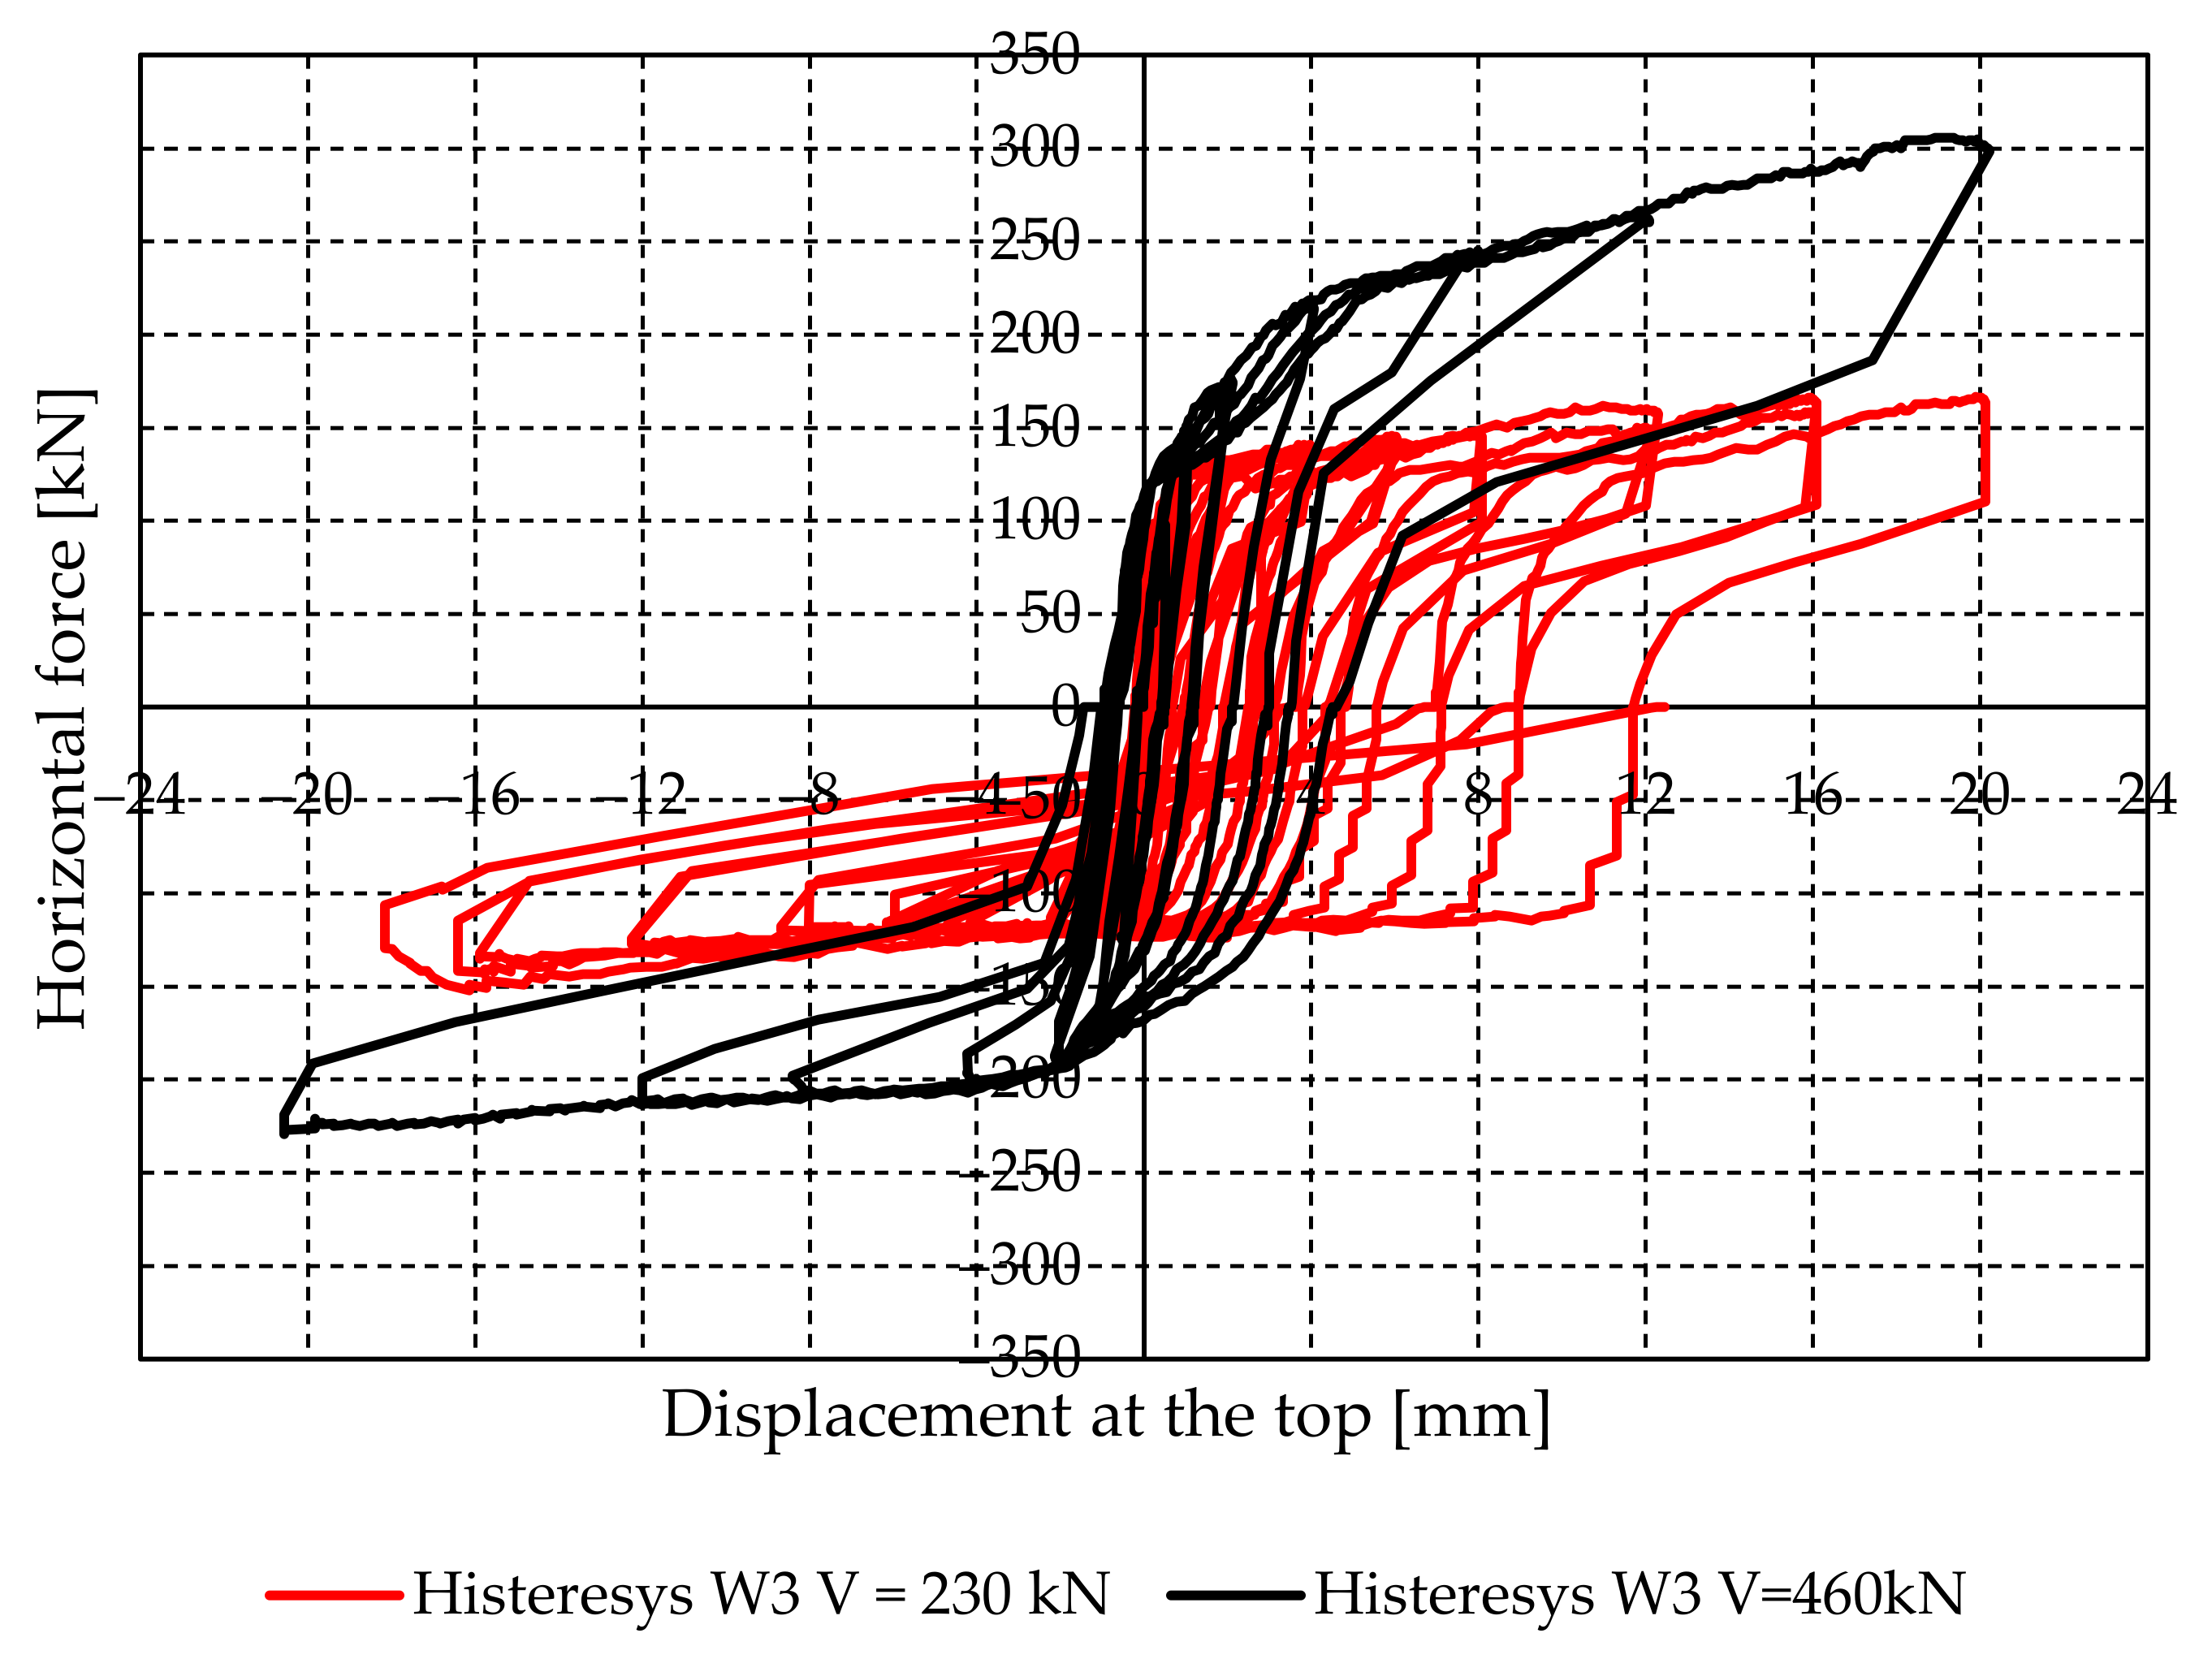
2 was approximately equal to 125 kN, which is close to the shear resistance of the URM wall. However, the plain wall reached the load-bearing capacity with the appearance of cracks (width greater than 4 cm), and the strengthened wall behaved like a rigid body without cracking. Separation of jackets from the wall (debonding) was not observed for both types of strengthening. Double-sided and strongly reinforced jacketing provided sufficient confinement of masonry and prevented biaxial splitting of units caused by transverse tensile stresses at the compressed edge. The stresses at the most stressed corner of the wall did not attain the compressive strength of the jacketed wall. Hence, the masonry panel stayed intact. After the initial increase in force, there was a decrease in stiffness and an almost horizontal yield plateau where the horizontal force increased slightly. However, in the case of rocking, yielding is not caused by material degradation but the reduction of the compressed zone and the formation of horizontal cracks at the tension side as imposed displacement increases. Rocking is an explicit consequence of the no tension behavior of masonry. The hysteresis had an S-shape, characteristic of a flexural response, with an almost nonlinear elastic behavior, regardless of the imposed vertical compressive stress (
Figure 23). The displacements which can be reached in a rocking response can be limited only by a decrease in strength due geometrical nonlinearity (P-Δ effects) associated with overturning [
34]. This limit was not attained in the experiments.
Figure 23 illustrates that the load-bearing capacity of the wall rises with increasing vertical compressive stress, and the maximum load-bearing capacities are given in
Table 12. When unloading, the curve returned to the origin. However, unlike plain walls, hysteresis curves show asymmetry for different load directions which can be caused by the influence of the testing device.
In order to idealize the experimentally determined envelope of the hysteresis curve with a bilinear model, three characteristic limit states were observed during the investigation of the walls: the appearance of cracks, the maximum resistance, and the ultimate limit state. If the experimentally determined envelope is idealized for seismic analysis, the maximum resistance of unstrengthened (plain) walls should be reduced by 10%. An overview of the resistance and deformability parameters of the examined walls and the results of bilinear idealization are presented in
Table 12 and
Table 13. By investigating the plain walls, significant ductility was measured (μ
u ≈ 9), which is also true for jacketed walls where the ultimate displacement capacity was not attained due to limitations of the testing apparatus (μ
u ≈ 20). For practical applications, ductility was maintained at certain limits in order to limit damage to the wall. The vertical stress intensity affected the behavior of the wall. The rise of the vertical stress increased the lateral load-bearing capacity.
Degradation of wall stiffness expressed through the ratio of the instantaneous secant stiffness K and the initial stiffness Ke,i is an important parameter because the load is distributed to the walls depending on their stiffness. Stiffness reduction can be modeled by the power function of the horizontal displacement. In general, with increasing displacement, the stiffness decreases, and after reaching the ultimate resistance, the secant stiffness is approx. 5% of the initial elastic stiffness, both for unstrengthened and for jacketed walls.
If the wall is exposed to cyclic horizontal force, shear resistance may drop with repeated loading. The consequence of load-bearing degradation is that for the same displacement the wall has less resistance for cyclic loads than for monotonic ones. Based on the conducted experimental investigation, the capacity reduction for repeated loading was negligible for all tested samples.
In the experiments, the measured values of equivalent viscous (hysteresis) damping for plain walls W1 and W2 were approx. 4% at the appearance of the first cracks, and up to approx. 7% in the ultimate state. Such results are expected because the dissipated energy is higher in the ultimate state than when cracks appear. For jacketed walls W3 and W4 that fail in bending by rotating around the compressed edge, the energy dissipation was small and there were no inelastic deformations. The coefficient of equivalent viscous damping at the largest experimentally achieved displacement was equal to approx. 1.5%. The experimentally determined damping of the examined walls is summarized in
Table 14.
5. Conclusions
The presented experimental campaign examined the complex response of plain and jacketed masonry walls under cyclic lateral loading. It is a valuable contribution to the assessment of the in-plane behavior of masonry walls without vertical RC-confining elements, typical for low-rise masonry buildings in Bosnia and Herzegovina and the Balkan region.
Important mechanical properties of masonry, compressive strength, and modulus of elasticity indicate large dispersion of results. Weak mortar has a crucial impact on the response of the masonry prism under far-field compression where the reduction of strength is compensated by the stable post-peak response.
Based on the acquired results from the small-scale experimental investigation, it can be concluded that the governing failure mode of unreinforced masonry is shear, and accompanied by cross-diagonal cracking and local crushing. Hysteretic curves of unstrengthened masonry walls were full, which is typical for significant dissipation of energy. Plain masonry is regarded as a rather brittle structure, with poor ductile behavior. However, the experimental results of the walls subjected to lateral cyclic loading imply that the ductile response of unreinforced masonry is underestimated.
Jacketed masonry walls rotate as a rigid body about the compressed edge without delamination of the RC jackets. By increasing the vertical precompression, the lateral capacity of these walls is enhanced without loss of ductility. The presented jacketing technique can be used for the strengthening of seismically vulnerable and potentially endangered buildings erected after World War II.
The obtained experimental results regarding lateral capacity fit well with the analytical expressions and they can be exploited to properly calibrate complex numerical models.


