Article

Monitoring and Predicting Occupant’s Sleep Quality by Using Wearable Device OURA Ring and Smart Building Sensors Data (Living Laboratory Case Study)

1
Department of Energy Technology, Royal Institute of Technology KTH, 100 44 Stockholm, Sweden
2
Department of Electrical Engineering and Computer Science, Royal Institute of Technology, KTH, 100 44 Stockholm, Sweden
*
Author to whom correspondence should be addressed.
Buildings 2021, 11(10), 459; https://doi.org/10.3390/buildings11100459
Submission received: 1 August 2021 / Revised: 27 September 2021 / Accepted: 27 September 2021 / Published: 7 October 2021
(This article belongs to the Special Issue New Approaches to Modelling Occupant Comfort)

Abstract

:
Today’s commercially-off-the-shelf (COST) wearable devices can unobtrusively capture several important parameters that may be used to measure the indoor comfort of building occupants, including ambient air temperature, relative humidity, skin temperature, perspiration rate, and heart rate. These data could be used not only for improving personal wellbeing, but for adjusting a better indoor environment condition. In this study, we have focused specifically on the sleeping phase. The main purpose of this work was to use the data from wearable devices and smart meters to improve the sleep quality of residents living at KTH Live-in-Lab. The wearable device we used was the OURA ring which specializes in sleep monitoring. In general, the data quality showed good potential for the modelling phase. For the modelling phase, we had to make some choices, such as the programming language and the AI algorithm, that was the best fit for our project. First, it aims to make personal physiological data related studies more transparent. Secondly, the tenants will have a better sleep quality in their everyday life if they have an accurate prediction of the sleeping scores and ability to adjust the built environment. Additionally, using knowledge about end users can help the building owners to design better building systems and services related to the end-user’s wellbeing.

1. Introduction

Information and communication technology (ICT) has many applications nowadays, and it plays a significant role in enhancing people’s lives. It has considerable contributions in many fields, such as education, medicine, transportation, and agriculture. ICT also contributes to the building sector. A building’s life cycle can be automated with ICT devices by integrating leading technologies in the systems and operations that make up the entire building. These types of buildings are typically referred to as “Smart Buildings’’. A building generally requires many technologies to attain the “Smart Building” property; such technologies include human-computer algorithms, big data analytics, sensors, and cloud computing [1].
Furthermore, a building is built to perform spatial and physical functionalities that hold social values. The physical relates to the shaping and decorations, and the other relates to the spatial arrangement of activities and relationships [2]. Taking that in mind, one can use the human–building interaction (HBI) to design the appropriate building. HBI refers to the interface between tenants and their surrounding buildings’ spaces by focusing on the functionalities, interactions, and interconnections [3]. So, the human-building interaction study provides interactive opportunities for tenants to form spatial, physical, and social functionalities in their built environment [4,5].
Nowadays, the importance of maintaining comfortable indoor thermal environments (not only at daytime, but also at nighttime) in spaces such as the bedrooms of residences, guest rooms in hotels and wards in hospitals, is growing significantly. Current thermal comfort theories and standards are mainly concerned with people in a waking state. However, many problems regarding the thermal environment are found within a few studies [6,7], pushing out the need to investigate the thermal environment and thermal comfort for sleeping people. Many factors, such as health states, emotional states, bedding conditions, and thermal environments affect sleep quality, with the thermal environment being one of the most important factors [8,9]. Some physiological parameters such as skin temperature and heart rate variability are found to be related to thermal comfort in waking people [10,11].
An increasing proportion of the population is tracking their health using wearable technology, with sleep being a prime parameter of interest. Part of the motivation behind tracking sleep is due to the recognition of sleep as an essential aspect of physical health (e.g., weight control, immune health, blood sugar regulation) [12,13], as well as of mental and cognitive brain health (e.g., learning, memory, concentration, productivity mood, anxiety, depression) [14,15]. As such, wearable devices offer the promise of a daily feedback tool guiding personal health insights and, thus, behavioral change that could contribute to a longer health span and lifespan. However, for wearable devices to become broadly adopted, the correct form factor becomes key to maintain adherence [16,17]. This is similarly true of the utility of the type and accuracy of sensory data that such devices provide to the user, and whether that data is real-world meaningful to them [18,19].
In [20] authors correctly highlighted that an individual approach to study the indoor comfort is required and could be explored within the three primary categories of variables: (1) environmental information, (2) occupant behavior, and (3) physiological signals. This makes it necessary to connect data from both wearable devices and built environment sensors. Recent attempts [21,22] applied commercial wearable sensors together with environmental sensors (e.g., temperature, air speed) to predict the comfort of each individual occupant and highlighted a few important limitations in such studies. Subjects involved in the studies were restrained in a climate-controlled laboratory environment for a short period of time, usually within hours [23,24], and the feasibility and accuracy of personal thermal comfort models developed under real-life conditions are still unclear due to very complex end users’ behaviors. From the literature review, we can see that the models developed directly from lab data [25,26] usually have higher prediction power as compared to those from the real environment [27,28], resulting in ~90% vs. ~70%. Thus, the first problem we are trying to approach in our explorative case study is to conduct the study in a real-life context environment.
Several studies [27,28] also suggest there exists a high potential for developing new models to predict human thermal sensation using artificial neural networks and additional factors that can be individually, unobtrusively, and dynamically measured using wearables. A number of additional studies were conducted to investigate the use of wearable devices, wireless sensors, and mobile applications for identifying thermal comfort of building occupants and their location over time. Despite existing off the shelf, wearables providing some sleep indicators (such as the sleep duration, the number of awakenings or the time to fall asleep) the specialized scientific sleep literature uses other indicators that feature sleep and sleep behavior in a more precise way [29]. For example, heart rate [30], respiration [31] or temperature [32] are very well correlated to sleep and can be collected by off-the-shelf wearables.
The current popularity of wearables for tracking physical activity and sleep, including actigraphy devices, can foster the development of new advanced data analytics, and evaluate the feasibility of predicting sleep quality. However, the availability of sensors in wearables does not necessarily mean that the corresponding data can be collected from them, because quite frequently the wearable vendors constrain or limit the access to raw data. For example, in some of the Fitbit devices, accelerometer and altimeter raw data are not available for developers, but only for the vendor to calculate indicators of the start and end of the sleep periods. In [33], there were identified other issues to collect data from off-the-shelf wearables: battery duration, differences on data models, the duration of tokens to authorize the collection of data, etc. In addition to raw sensor data, wearable vendors also provide more elaborated information.
Focusing on sleep, there are some indicators provided by vendors, currently. The more common ones are obtained from accelerometer raw data values using actigraphy techniques [34]. Standard actigraphy is a well-established measure of an individual’s sleep–wake patterns [35]. Although not measuring brain sleep states, actigraphy has the advantage of being relatively low cost, nonintrusive, and easy to use [34], which allows for the tracking of individuals’ sleep patterns over prolonged periods of time in non-laboratory settings. The wearable raw accelerometer data are collected and transferred to a smartphone that processes the data to estimate the time slept by a certain user [36,37]. Furthermore, the use of actigraphy techniques and accelerometer data in smartphones is not new. Apps such as “Sleep as Android” [38] already provided this functionality using the smartphone accelerometer data directly. Instead, wearables are directly worn by the person and, as a result, they may register user movements in a better way. The main wearable vendors also use actigraphy techniques and algorithms to provide a sleep efficiency indicator.
A novel, multisensory device that claims to be able to distinguish sleep stages, including REM sleep, has recently come on the market. The OURA ring is a scientifically validated, wearable sleep tracker which objectively estimates go-to-bed time and sleep stages based on nocturnal PPG (250 Hz), 3-D accelerometer (50 Hz) and min by-min skin temperature [39]. The associated OURA App also displays an optimal bedtime window for those users that are considered very good sleepers according to the OURA Sleep Score metrics.

2. Research Goals and Objectives

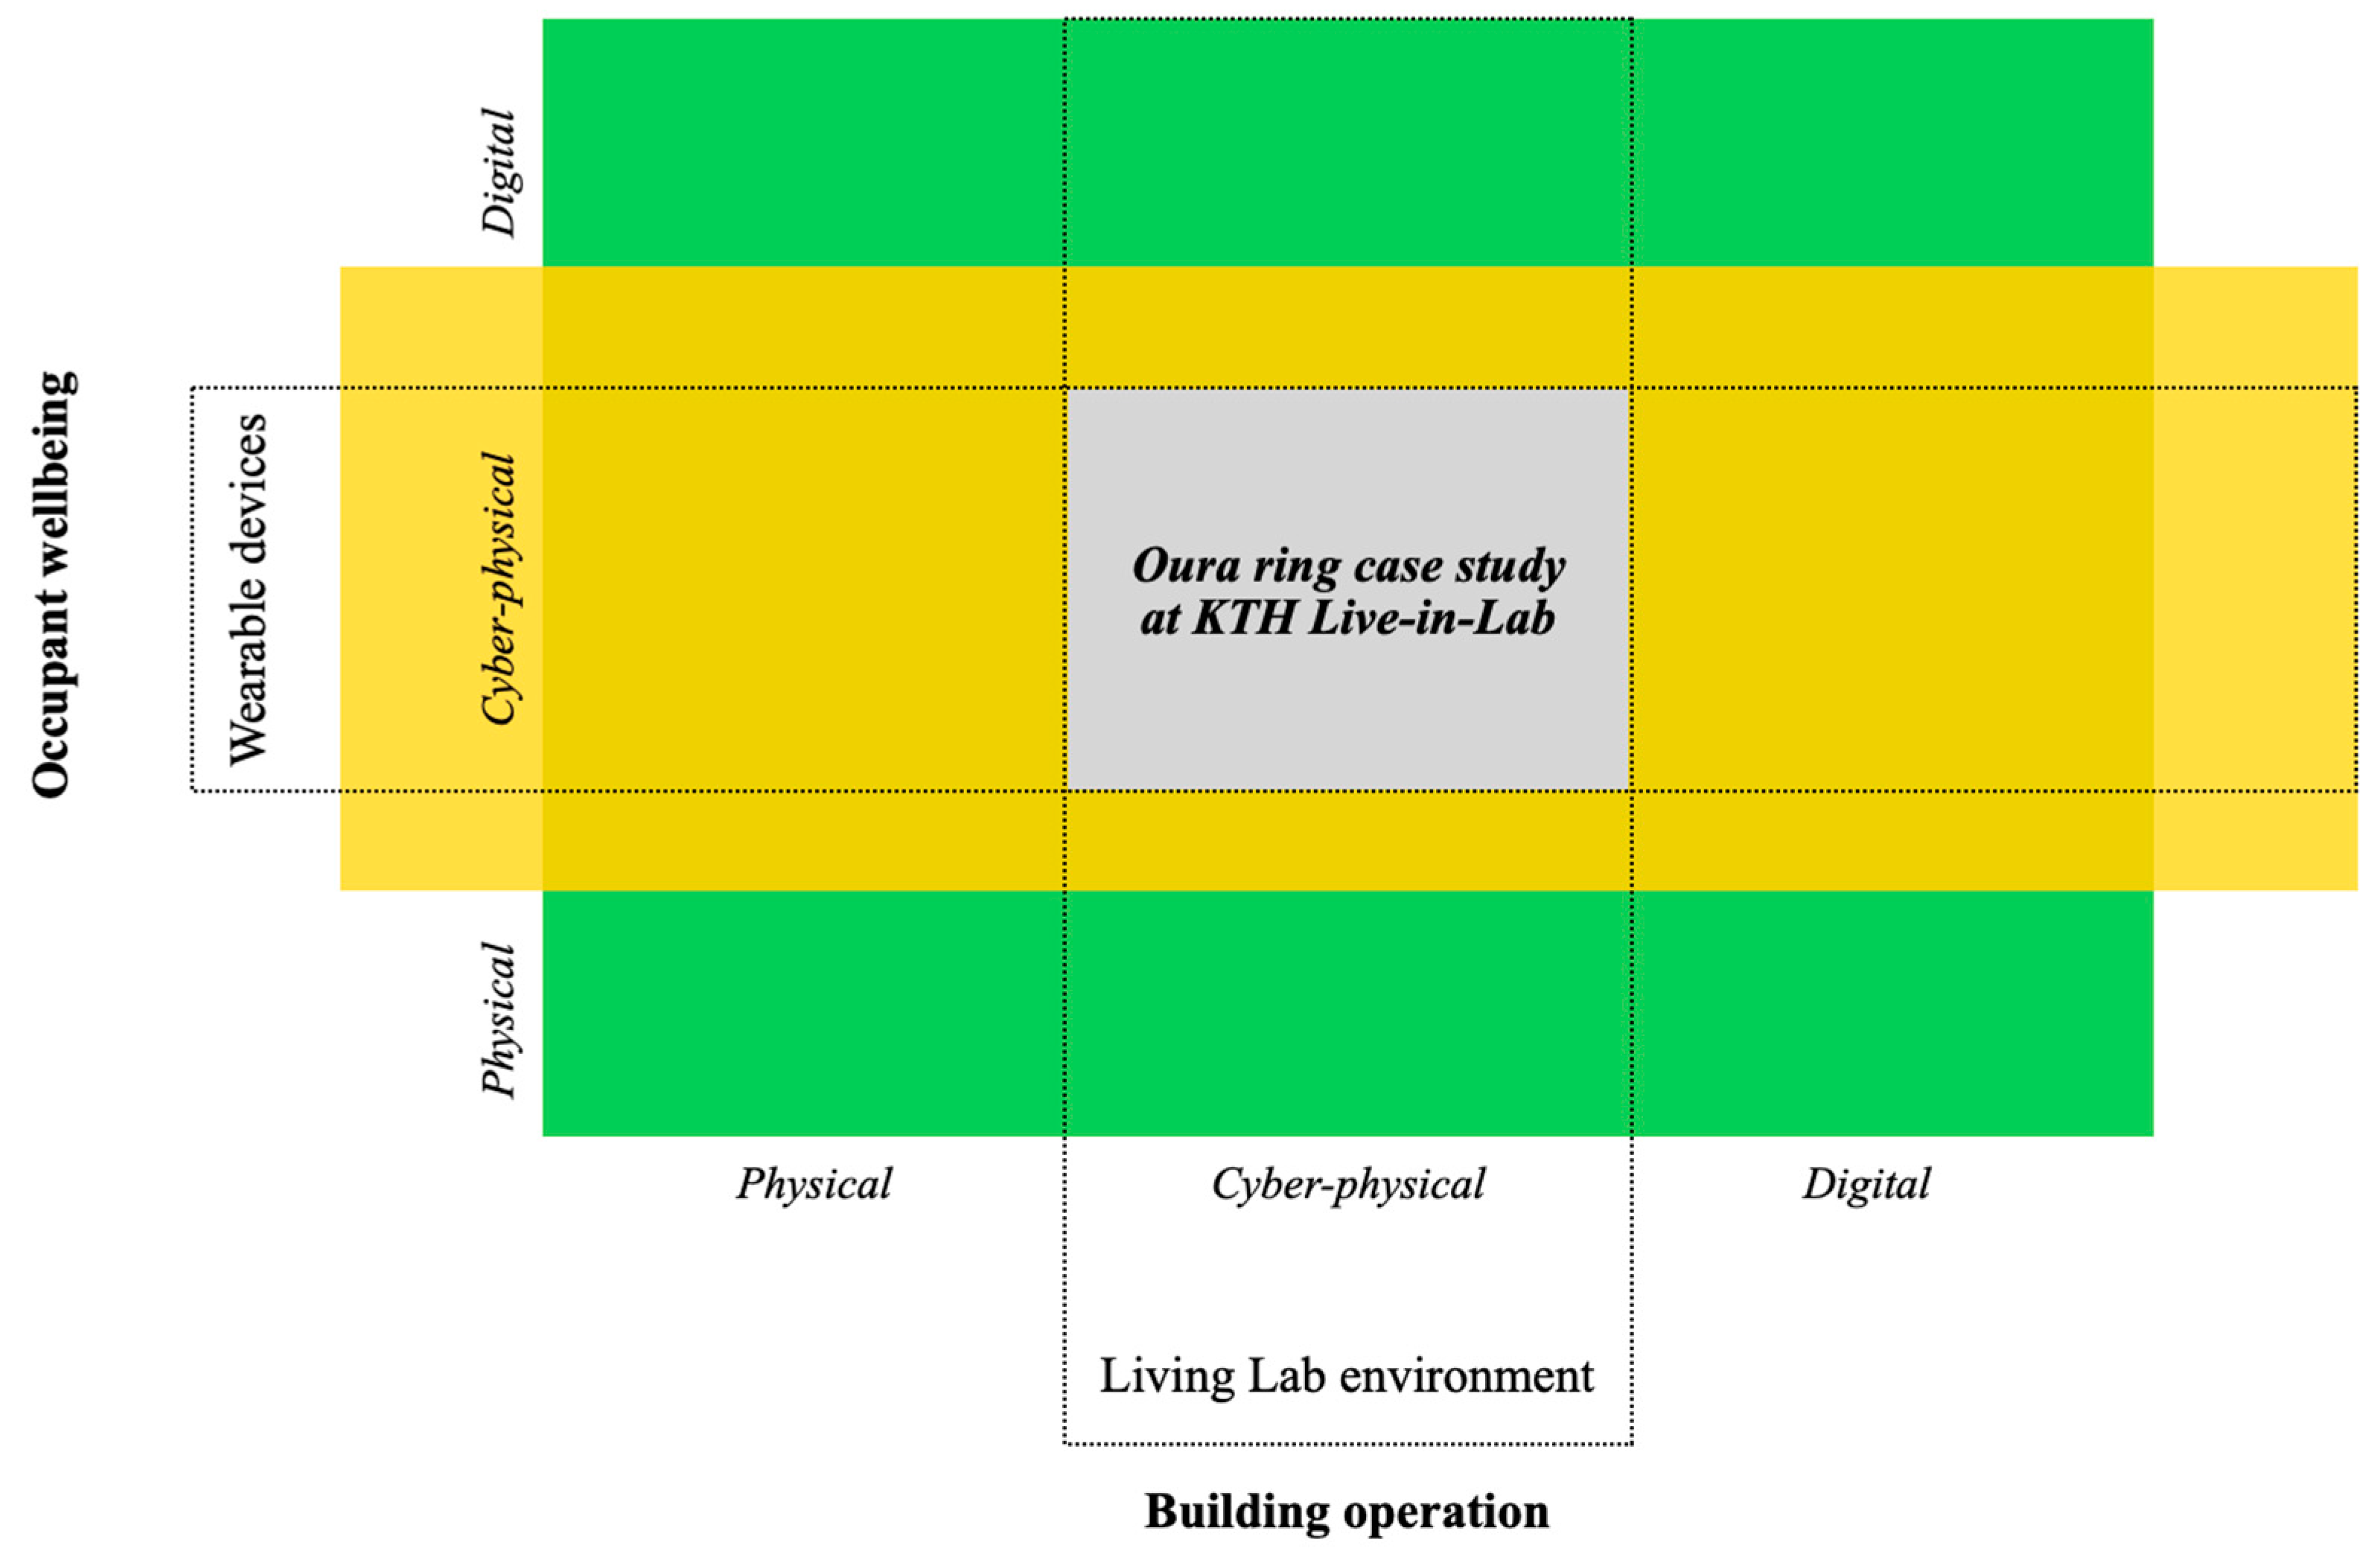
2.1. Research Big Picture: Human-Building Interaction

KTH Live-in-Lab (LiL) performs human-building interaction studies to explore the growing potential of how the built environment can influence humans in their everyday lives. It uses smart buildings to create testbeds that accelerate innovation in the construction sector and reduce the lead time between research results and market introduction. KTH LiL places the occupants in the center of its focus when implementing new testbeds, which allows it to study the end users and their surroundings’-built environment. The occupants’-built environment at the living laboratory are measured by using multiple smart building sensors. However, when trying to thrive for the occupants’ well-being and comfort, access to their body signals is essential. That is where ICT-enabled wearable devices come into play. The schematic representation of the intersection between occupant wellbeing and building operation studies is represented at Figure 1. The explorative case study presented in this paper is placed on the overlap between two specific domains: wearable devices and cyber-physical analysis of ICT system and living lab environment, which combines cyber and physical components as well.

2.2. Research Goal and Objectives

The main goal of the study is to explore the non-intrusive way monitoring personal body-related information about tenants while sleeping and to explore the correlations between physiological data and the built environment in a real-life environment. This knowledge can lead us to better monitoring and predicting of an occupant’s sleep quality by using commercially-off-the-shelf wearable devices and smart building sensors data. The objective of this study is to address the following research questions:
  • What are the possibilities and limitations of measuring sleep quality from built environments and a commercially-off-the-shelf wearable device (OURA ring) in a real-life context?
  • Can the data from the OURA ring and smart meters be used for providing personalized instructions for its users to increase their sleep quality?
The purpose of this paper is to work as an explorative study for the real-context-driven research of sleep quality at a living laboratory using the OURA ring. This study will benefit future researchers working on physiological measurement-based approaches for human-centered sleep quality by giving them a head start on what the data collected from the OURA ring can provide and the potential limitations. This project will also serve different stakeholders in the real estate industry and the smart buildings industry. For example, this will help building owners by providing better thermal comfort solutions and will provide enough information about energy consumption inside the building in the future. It will also serve the occupant as a stakeholder by maintaining sleep quality and as a result, improving their wellbeing in general. However, there are some ethical concerns regarding the data being collected, and there might also be social concerns regarding the impact of those systems on the tenant’s lifestyle.
The objectives of this paper are twofold:
  • Assess the quality of the data collected from the OURA ring.
  • Investigate whether the data from commercially-off-the-shelf wearable device (OURA ring) can be used in combination with the ambient data to create an appropriate model for sleep quality evaluation.
These objectives were divided into the following sub-goals:
  • Data storage: Building a data storage with an appropriate data structure from the OURA ring and smart meters data.
  • Data quality assessment: What are the possibilities and limitations of measuring sleep quality in a real-life context with the use of the OURA ring?
  • Modeling: Building an ANN for improving sleep quality with the OURA ring and smart meters’ data based on the possibilities and limitations concluded about the data from sub-goal 2.

3. System Boundaries and Methodology Overview

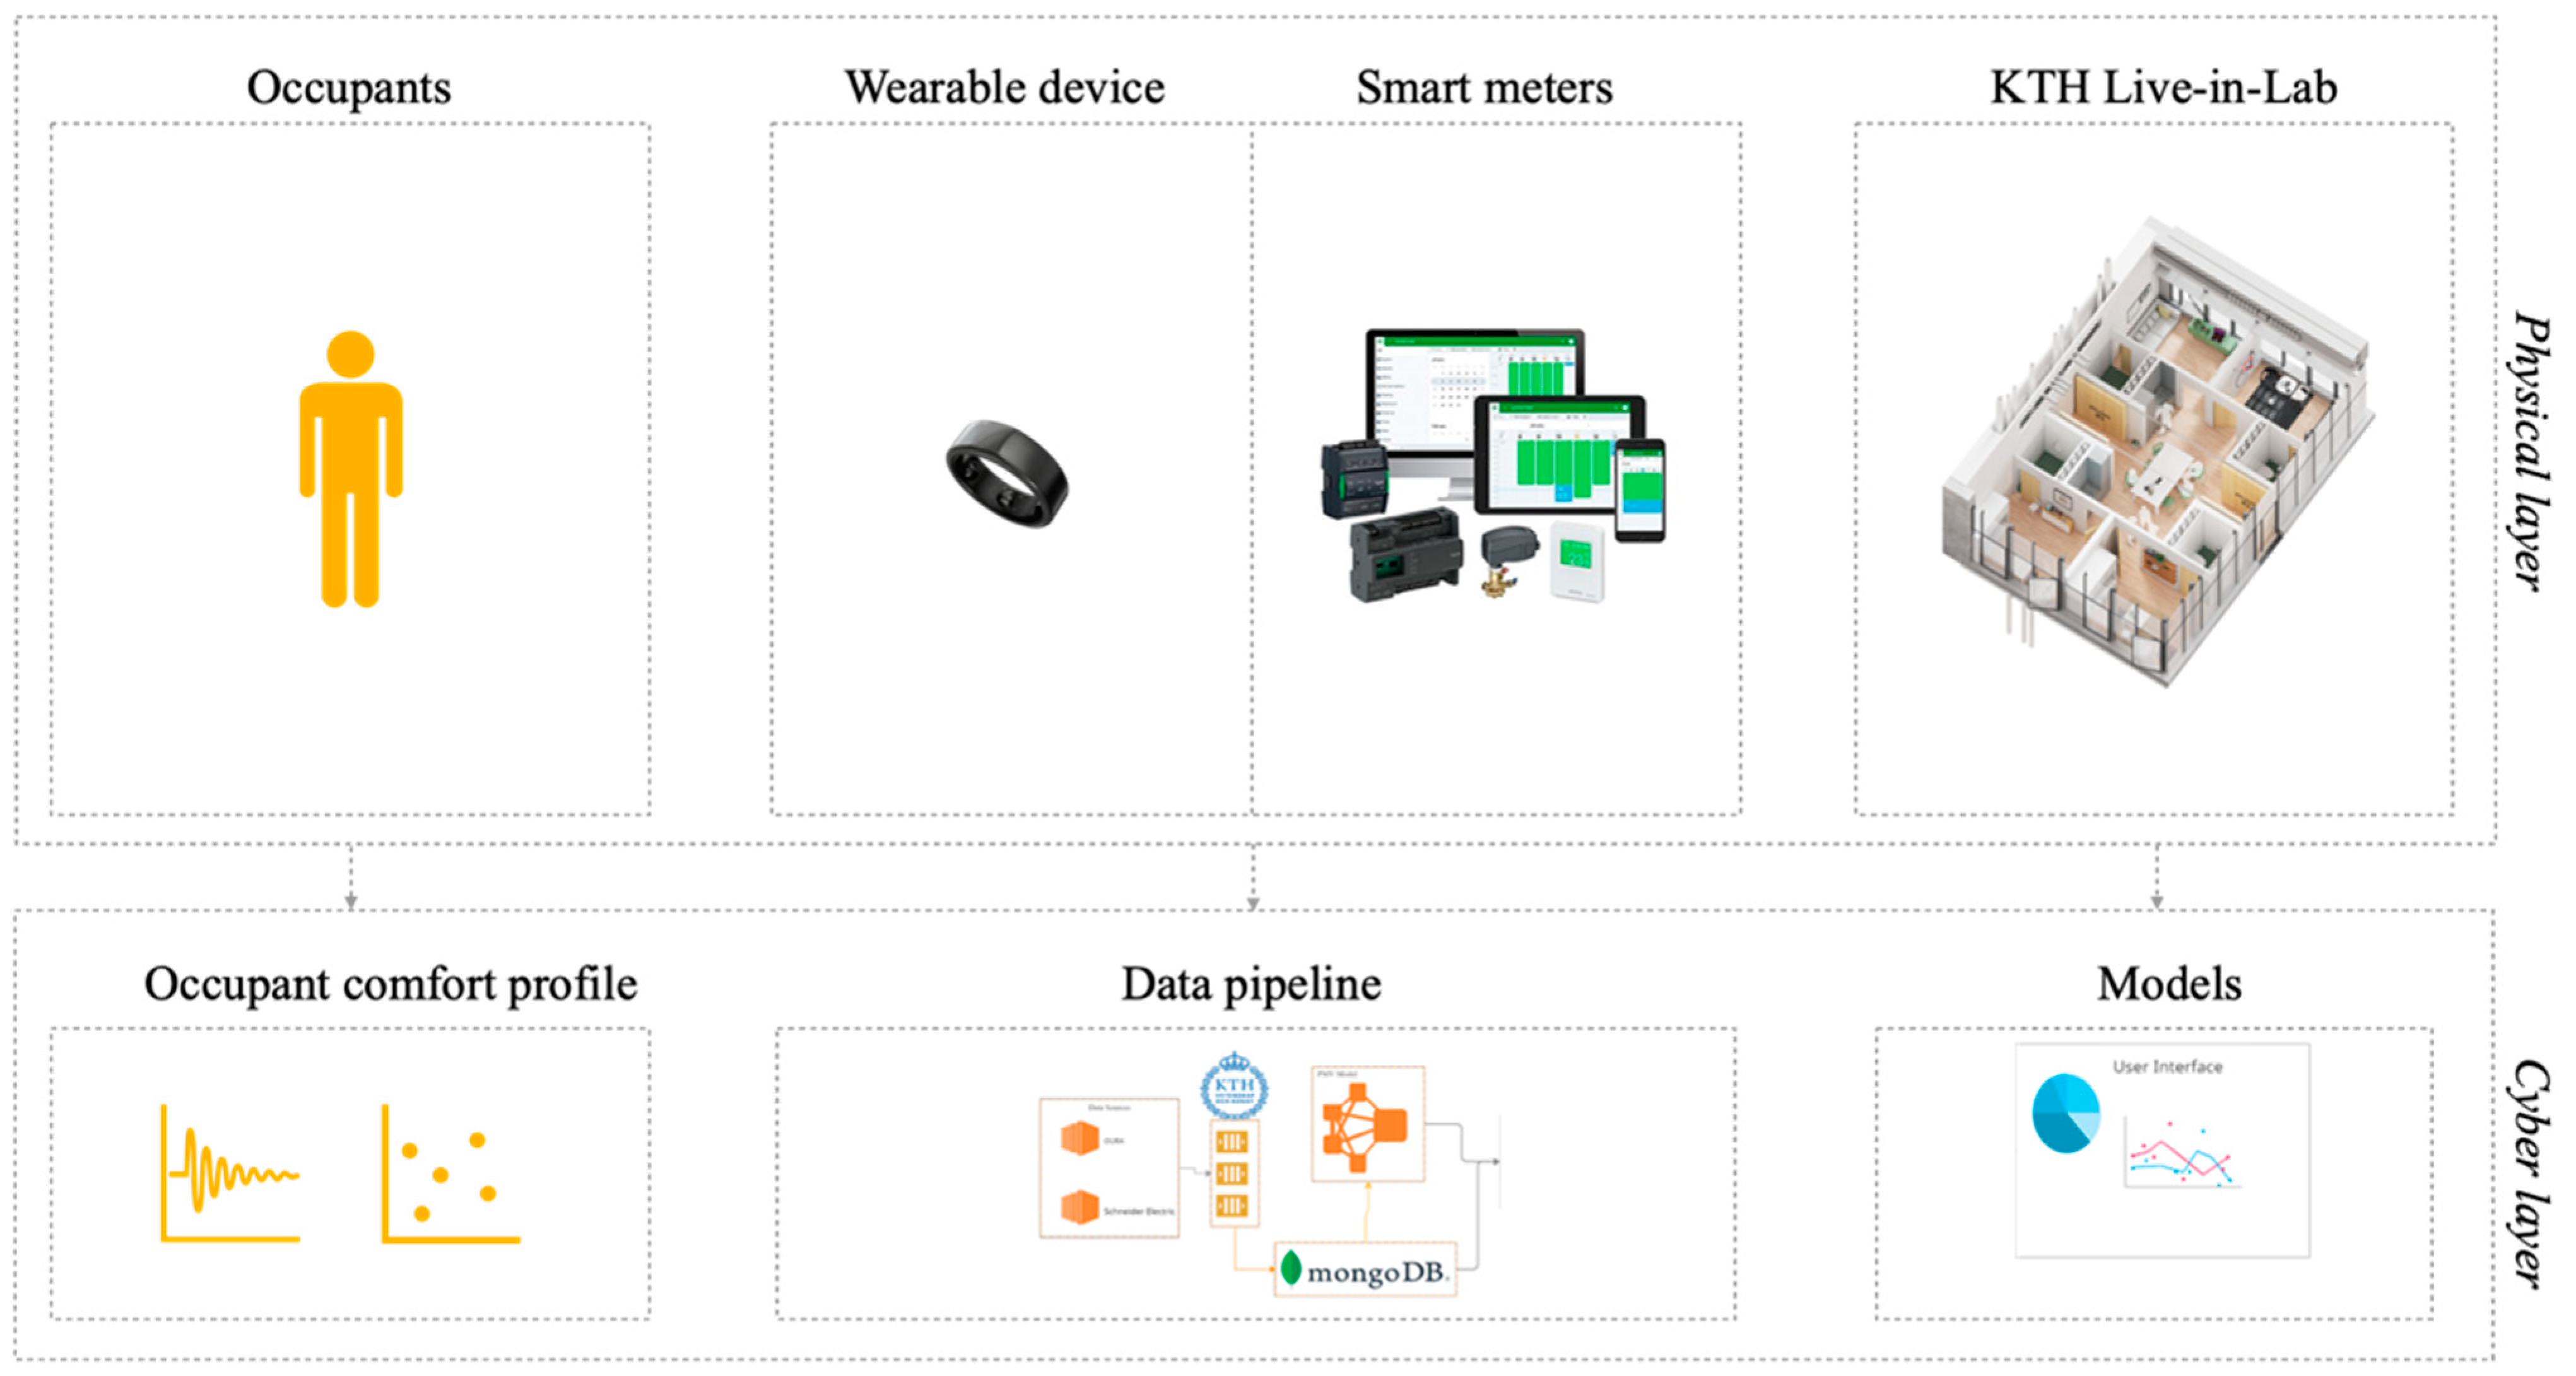
3.1. System Boundaries

As was mentioned in the previous chapter, this study includes several domains and environment overlaps, for instance: human and building environments, and physical and digital infrastructures. The study system boundaries are represented in Figure 2 below.

3.1.1. KTH Live-in-Lab

KTH LiL is a multiple testbed platform that offers a full-scale test environment ranging from buildings and installations to housing and management organizations. It performs as a testbed for products and services by providing the opportunity to conduct tests in actual buildings. In addition, it ensures that companies can test their products in real environments and test how different components of their products affect the results. KTH Live-in-Lab offers a comprehensive infrastructure, with a seamless integration between the physical and the digital. A full-scale test environment comprising everything from buildings and installations to housing, users, and a management organization, combined with a portal for research data from test beds and research results.

3.1.2. Wearable Device OURA Ring

The OURA ring is a smart ring that mainly aims to maintain personal health through sleep monitoring. It has a regular ring shape, and the following sensors:
  • NTC Temperature Sensors: this sensor is responsible for measuring the body temperature directly from the skin. OURA claims that by using these sensors they are able to produce accurate measurements of the person’s body temperature. According to OURA, this is a better approach than estimating it from the surroundings;
  • OURA uses a 3D accelerometer to measure different activity- and movement-related parameters, and they combine these parameters with the profile information that the user provided to perform accurate analysis and provide accurate data about energy expenditure and movement (steps, miles);
  • Infrared light sensor: this sensor measures the respiratory rate, and the reason that OURA uses this sensor is due to its higher accuracy compared to other sensors such as green light LEDs.
The OURA ring detects pulse rate, variation in interbeat intervals (IBIs) and pulse amplitude from the finger optical pulse waveform. The ring also measures motion and body temperature. OURA ring manufactures claim to use these physiological signals (a combination of motion, heart rate, heart rate variability, and pulse wave variability amplitude) in combination with sophisticated machine-learning-based methods to calculate deep (PSG N3), light (PSG N1 + N2) and rapid-eye-movement (REM) sleep in addition to sleep–wake states [40]. The detailed structure of the OURA ring is presented in Figure 3.
In terms of this research, the measure of sleep quality that we used is the one provided by OURA API (sleep score). We selected sensors for this study based on three criteria:
(1)
The diversity of bio signals;
(2)
Raw data access for research support;
(3)
Convenience to wear 24/7, especially while sleeping.
OURA analyzes the body dynamics such as resting heart rate (RHR), respiration rate, different sleep cycles (light, deep, and REM), and other factors to determine sleep quality. OURA uses this metric to guide people toward better health and mental conditions; the higher this score is, the more energetic and ready the person is for the next day. In general, a sleep score that is above 70 is considered a good score. However, OURA does not provide any information about how the person should adjust their surrounding environmental parameters for achieving better sleep scores. The only information provided by their app and algorithm to increase one’s sleep score is to set a consistent sleeping time and sleep duration for the ring wearer.

3.1.3. Smart Meters by SE

KTH Live in Lab’s Building Management System (BMS) for building automation, data collection and data storage are based on Schneider Electric’s StruxureWare Building Operation. The system enables real-time monitoring and the operation of all systems, such as heating, water, ventilation, levels of carbon dioxide and window opening. It also enables operational diagnostics, fault detection, maintenance and graphical visualization of data. The OURA ring provided the physiological data about the users, and the SE sensors provided the building’s environmental data.

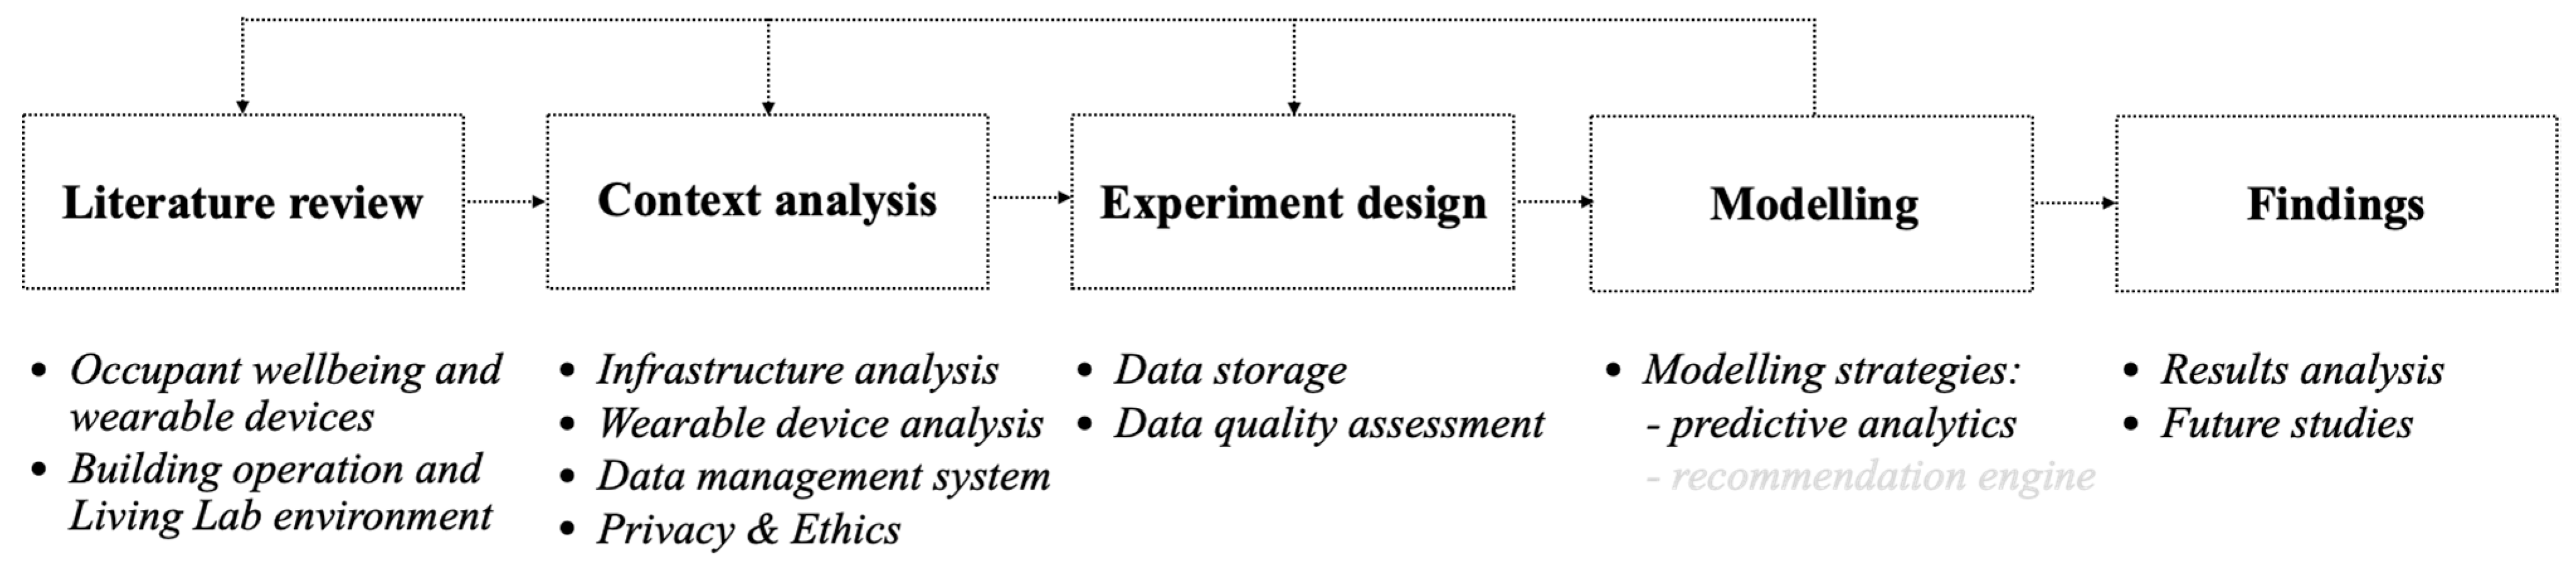
3.2. Research Process

The methodology of this study involved several steps: (1) relevant literature screening and problem identification; (2) the context analysis of living laboratory infrastructure and wearable device usability; (3) the collection of wearable device data with regards to physical activity and sleep patterns; (4) data storing and processing; (4) data modeling; and (4) performance evaluation. The research process is represented in Figure 4 below.

4. Implementation and Analysis
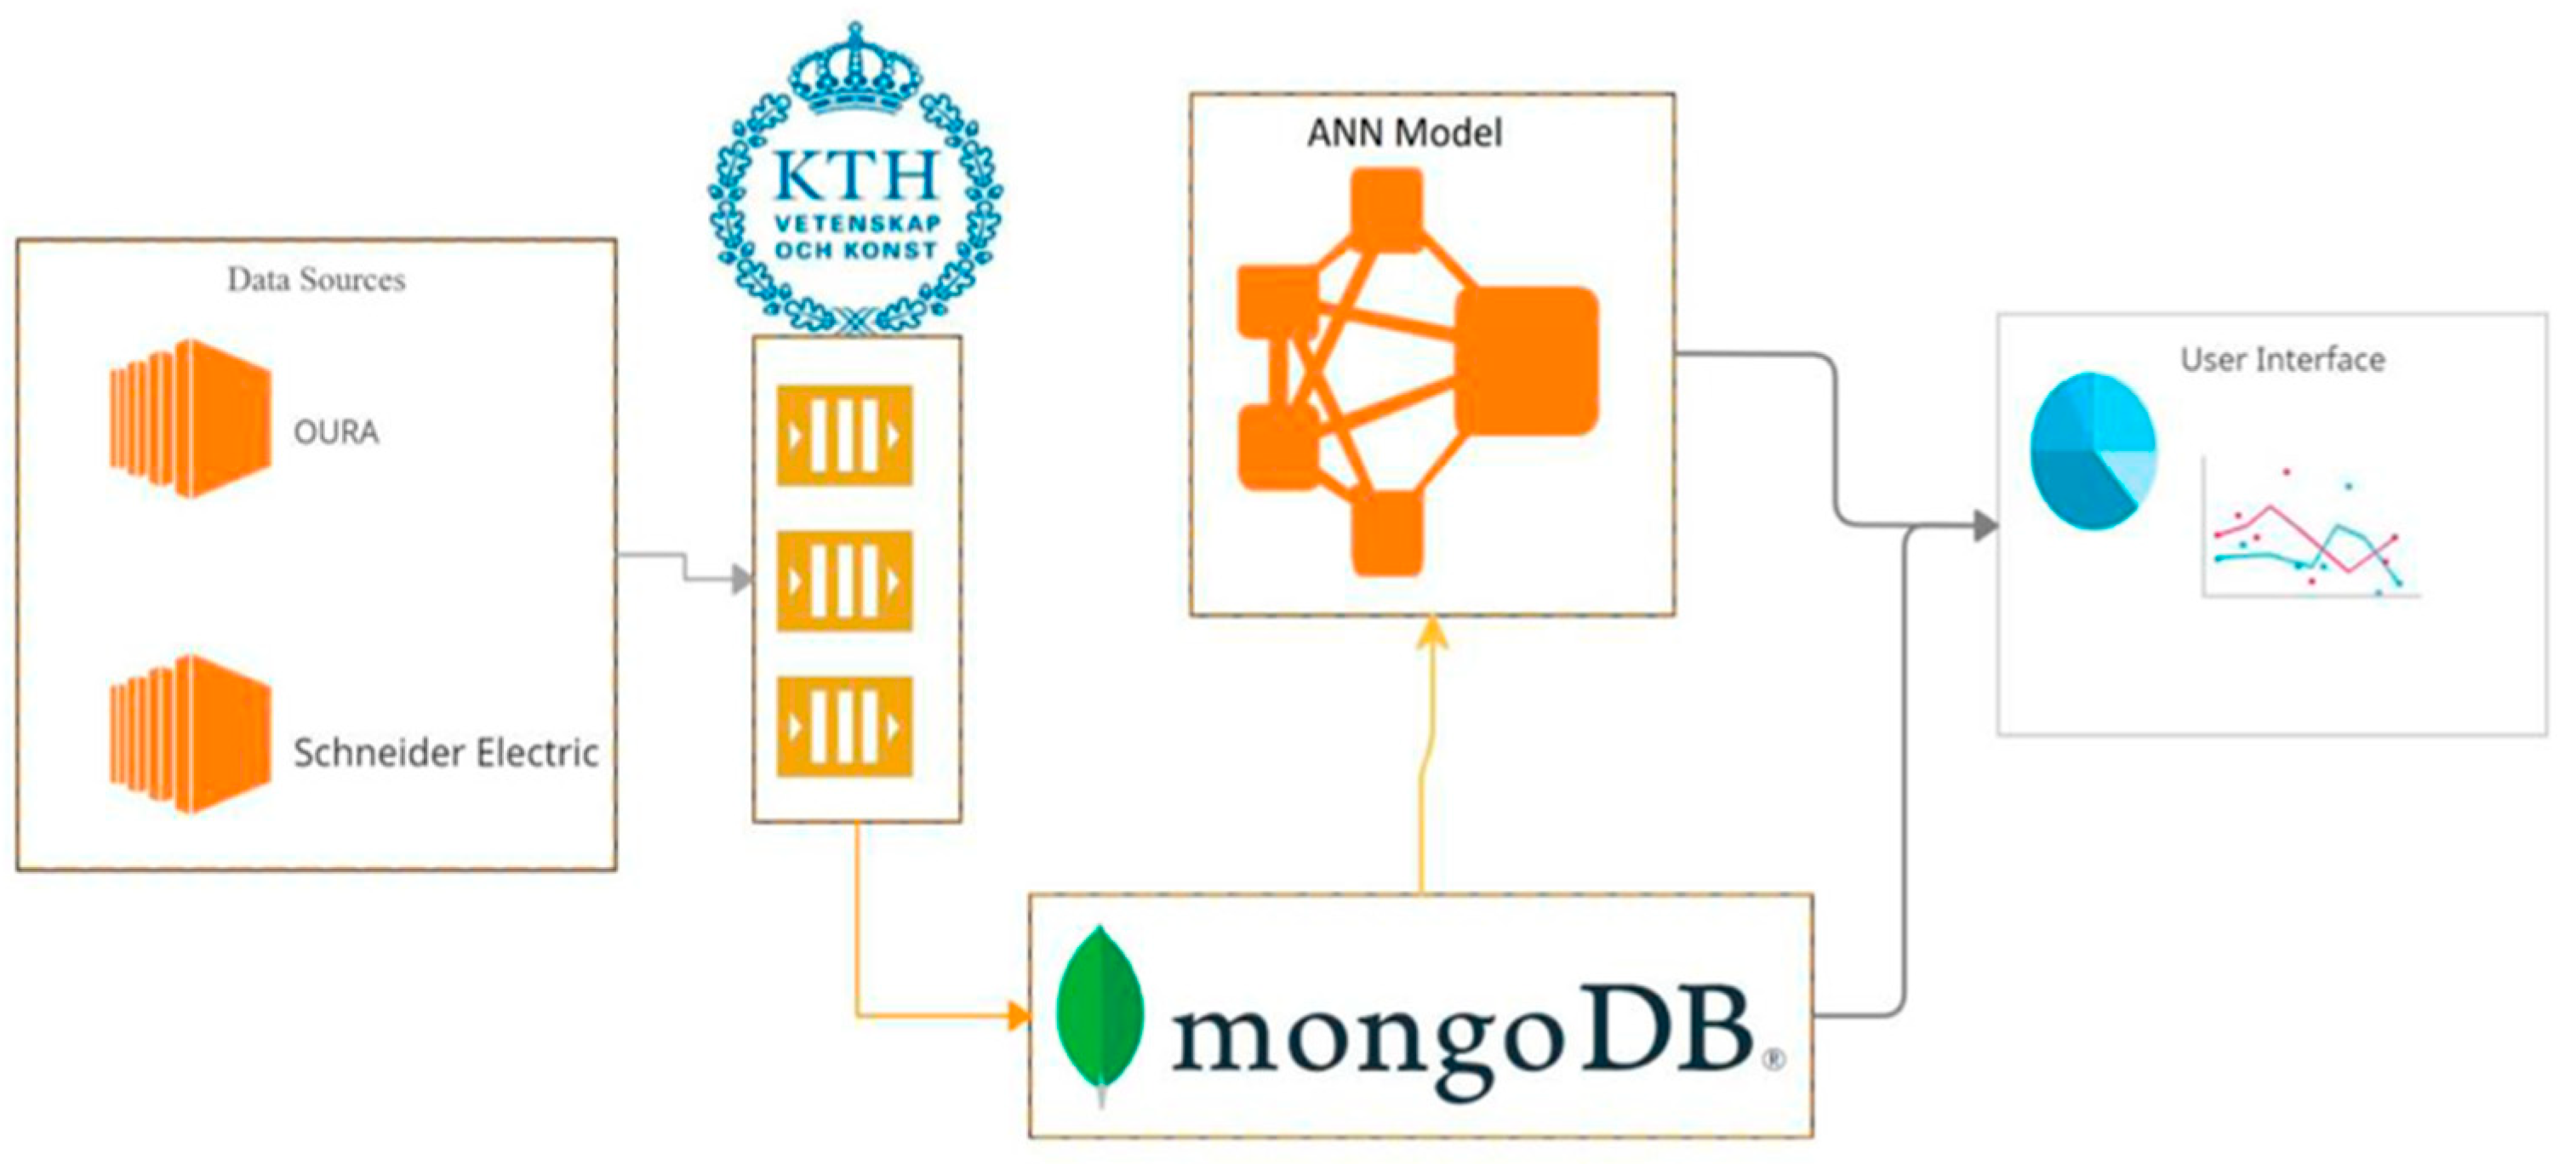
4.1. Database

Two types of data are collected in this case study. The first is building environment data collected from SE sensors in KTH LiL building in the form of xlsx sheets. The second is physiological data collected from the OURA rings of KTH LiL apartments’ tenants in the form of csv sheets. To follow the GDPR data protection rules, the tenants agreed in a signed form to use their data for a specified number of months, eliminating any possibilities of ethical or social violations. Furthermore, the data was being collected passively, which means there were no physical monitoring and/or tests performed on the tenants. Thus, it does not have any impact on their normal lives. When implementing the database, we decided on using a NoSQL database, specifically “MongoDB”. MongoDB stores data in JSON-like documents, which means the fields can vary between documents, and their structure is flexible and can be changed at any time. This structure allows for horizontal scalability. That helps in accommodating large databases, which are convenient when working with large amounts of users and building data. The documents consist of pairs of fields and values. The values can be of any type (string, number, Booleans, and arrays). Those documents are stored in collections such as tables in relational databases (e.g., SQL). Since the collected data was in csv and xlsx sheets, creating a database with an appropriate data structure was essential. Creating the database at the beginning of the project helped to facilitate the important fields and made them more easily accessible in the other stages of the project. The data structure was chosen to implement two properties: (1) separating tenants from each other, and (2) the days of each tenant are separated from each other. This implementation allowed for the straightforward storage and/or retrieval of data. This stage can be viewed as an extract, transform, and load (ETL) pipeline, and it was mainly done in Node.js and MongoDB. The overview of the ETL pipeline can be found in Figure 5 below:
The data was extracted from SE sensors in the form of multiple xlsx sheets. Each sheet contains ~1–2 months of a specific building parameter (humidity, temperature, and CO2 levels). As for the data extracted from the OURA rings, they are in the form of csv sheets. Each sheet contains ~1–2 months of physiological information of a tenant. The retrieved sheets were then saved on our private computers and were ready for the transform phase. This phase consisted of transforming the data to follow our desired data structure and manually checking/analyzing the transformed data for any errors. The data structure is in the form of collections that hold multiple documents. A collection was made in association with each tenant. Each collection holds data related to the tenant in the form of JSON documents. Each of those documents holds one day’s worth of information about the tenant.
The Mongoose schema was used to define the documents’ structure and their default values. MongoDB will automatically generate an ObjectId for every document in a collection. Although ObjectIDs were not necessarily useful for our research, we used them to keep track of critical or issue-generating days/documents. The transformed data was loaded in our MongoDB database, which is being hosted on our private computers. For security reasons, no one was allowed to view this database except for project members and supervisors. After creating a database with a suitable data structure, we moved to the data quality assessment and data modelling stages. Those are the main stages for our explorative study. We assessed the quality of the data, defined limitations and boundaries, built hypotheses, and suggested a deep artificial neural network model.

4.2. Data Quality Assessment

The methodology selected for data quality assessments of the OURA ring, and the SE sensors is TDQM. This methodology is considered a result of the idea of “fitness for use” [41]. This method looks at the data as a product. All products have life cycles, and so do the data. The following basic processes can summarize it:
-
Define: This process identifies the quality of information requested by information consumers. It also analyses the information life cycle that characterizes the production process. In our assessment, this process will identify the metrics and desired information that could potentially be used for the modeling stage of our research;
-
Measure: In this phase, we will measure the different data we have according to the metrics and desired information we identified in the previous process. That allows us to analyze and confirm what parts of our data can be used and what cannot;
-
Analyze: This is a fundamental part of the assessment process. In this step, we analyze the results we got from the previous steps. In addition, this phase helps us to identify the reasons behind the different data errors, which is essential for the improvement process;
-
Improve: This prioritizes the wrong data and starts by developing a plan to improve and correct these parts of the data. Thus, TDQM is a methodology that focuses both on data quality assessment and data improvement [42].
This method starts by defining the metrics and dimensions that are important for the later stages (measuring, analysing). These dimensions will be the same for both data sources. As for the measuring stage, the process was different for the two data sources, so each will be discussed separately.
  • From the OURA: To collect data (measuring), we distributed sample rings to students living in KTH LIL apartments. The students wore their rings for the agreed-on period. The measurement was taken entirely by using the ring’s sensors, and they were not manually manipulated.
  • From SE sensors: This data is automatically measured by the different sensors placed inside the KTH Live-in-Lab buildings.
The next step was to analyze the data. Each data sample was analyzed separately by examining and studying examples. The analysis and examination were achieved by applying the different definitions to the different dimensions we have. The dimensions then were categorized into the following assessments:
  • Approved: This indicates that the data passed the dimension according to the established definition.
  • Rejected: This indicates that the data did not pass the test, and it must be modified if the parameter is to be used in the modeling stage.
  • NA: this means that not enough information was found for assessing the dimensions, but it is OK to proceed with using this data without any further improvements.
The method we chose for our data assessment is TDQM, the method aims to validate many aspects of the data such as the validity, quality, believability, security, etc. When assessing each dimension, we had to follow different approaches on different dimensions.
Believability: When assessing the believability of the data, we had to take into consideration many things, whether the data values are reasonable, have the values been manipulated before we got them or not. In the case of data from the OURA ring, the data was extracted directly from the OURA database, and since the study is about the OURA ring, we had to approve the believability of the data coming from OURA. The other source of data we had is the data from the SE sensors. This data was measured and stored inside KTH servers, and the data was sent to us by one of the main supervisors on this project. Thus, it is trustworthy, and we approved the believability of the data from SE as well.
Accuracy: to assess this dimension, our main sources for information were the official websites provided by both companies OURA and SE. OURA in their website provides plenty of information about the accuracy of their sensors and how accurate the value for each parameter is. However, after assessing the accuracy of each parameter individually, we were able to identify which parameter is accepted and which is not.
  • Sleep Score: OURA states on their website that the sleep score is calculated based on many parameters, including your resting heart rate (RHR), heart rate variability (HRV), body temperature, respiratory rate, and movement. These parameters are directly measured from the three sensors that the company has installed on the ring. As this metric is OURA specific, we do not have actual data to compare its accuracy with, but in comparing the accuracy of the other parameters that the ring manufacturer uses for calculating this parameter, we found that RHR and HRV are 99.6% and 98% accurate [43].
  • Temperature: This parameter is measured by a SE sensor that is installed inside the KTH LiL buildings, and according to SE, all their sensors provide accurate measurements up to +0.2/−0.2 degrees. So, the temperature is considered accurate [44].
  • Activity: There is no defined measure for activity to assess whether it is accurate or not, however the approach that OURA uses is to take data from the 3D accelerometer which seems a common approach to measure activity. This sensor is considered a reliable tool for measuring different activity related parameters, and that is because it delivers accurate results [45].
  • Readiness: This parameter measures how well your overall health is, and how prepared you are for the day following. OURA also calculates the readiness of a person based on data from the sensors such as the RHR and HRV, as proven before. Since those parameters are accurate enough, we could also consider the readiness to be accurate enough for this project [46].
  • Humidity: This parameter follows the same approach as the temperature. And according to SE, the humidity sensors are accurate up to +2%/−2% in the ranges from 0–80% relative humidity measurements. So, the humidity is considered accurate [47,48].
  • Restfulness: It is a measure of how soundly you slept through the night. Wakeups, excessive movement, and getting up from bed during the night will all take away from your overall restfulness. However, in this simple definition of restfulness, we cannot approve this parameter since any small hand move, in-bed rotation can decrease this score and thus give a misleading result [49].
  • Sleep Latency: This parameter is defined to be the amount of time it took a person to fall asleep after they went to bed, according to OURA the optimal time for a person to fall asleep is 10–20 min, if a person falls asleep in less than 5 min, this can indicate that the person is over tired, and if the person struggles to sleep within 20 min, it indicates that this person is having some anxiety. However, OURA does not provide any information about the accuracy of this parameter, so it is not assessed.
  • Total Burn: This parameter refers to the total number of calories burned throughout the day, OURA does not provide enough information about the accuracy of this parameter, but they claim it to be accurate enough, or slightly bounced if the person did not wear the ring when exercising. In an experiment that was performed to compare different wearables, OURA was the most consistent wearable device in the activity measuring [50].
  • Total Sleep Time: OURA analyzes your sleep by measuring the dynamics of your resting heart rate, body temperature, movement. Again, we cannot determine the accuracy of sleep time since we have no access to the algorithm, and we think that there were no actual tests performed to test the accuracy of the algorithm [51].
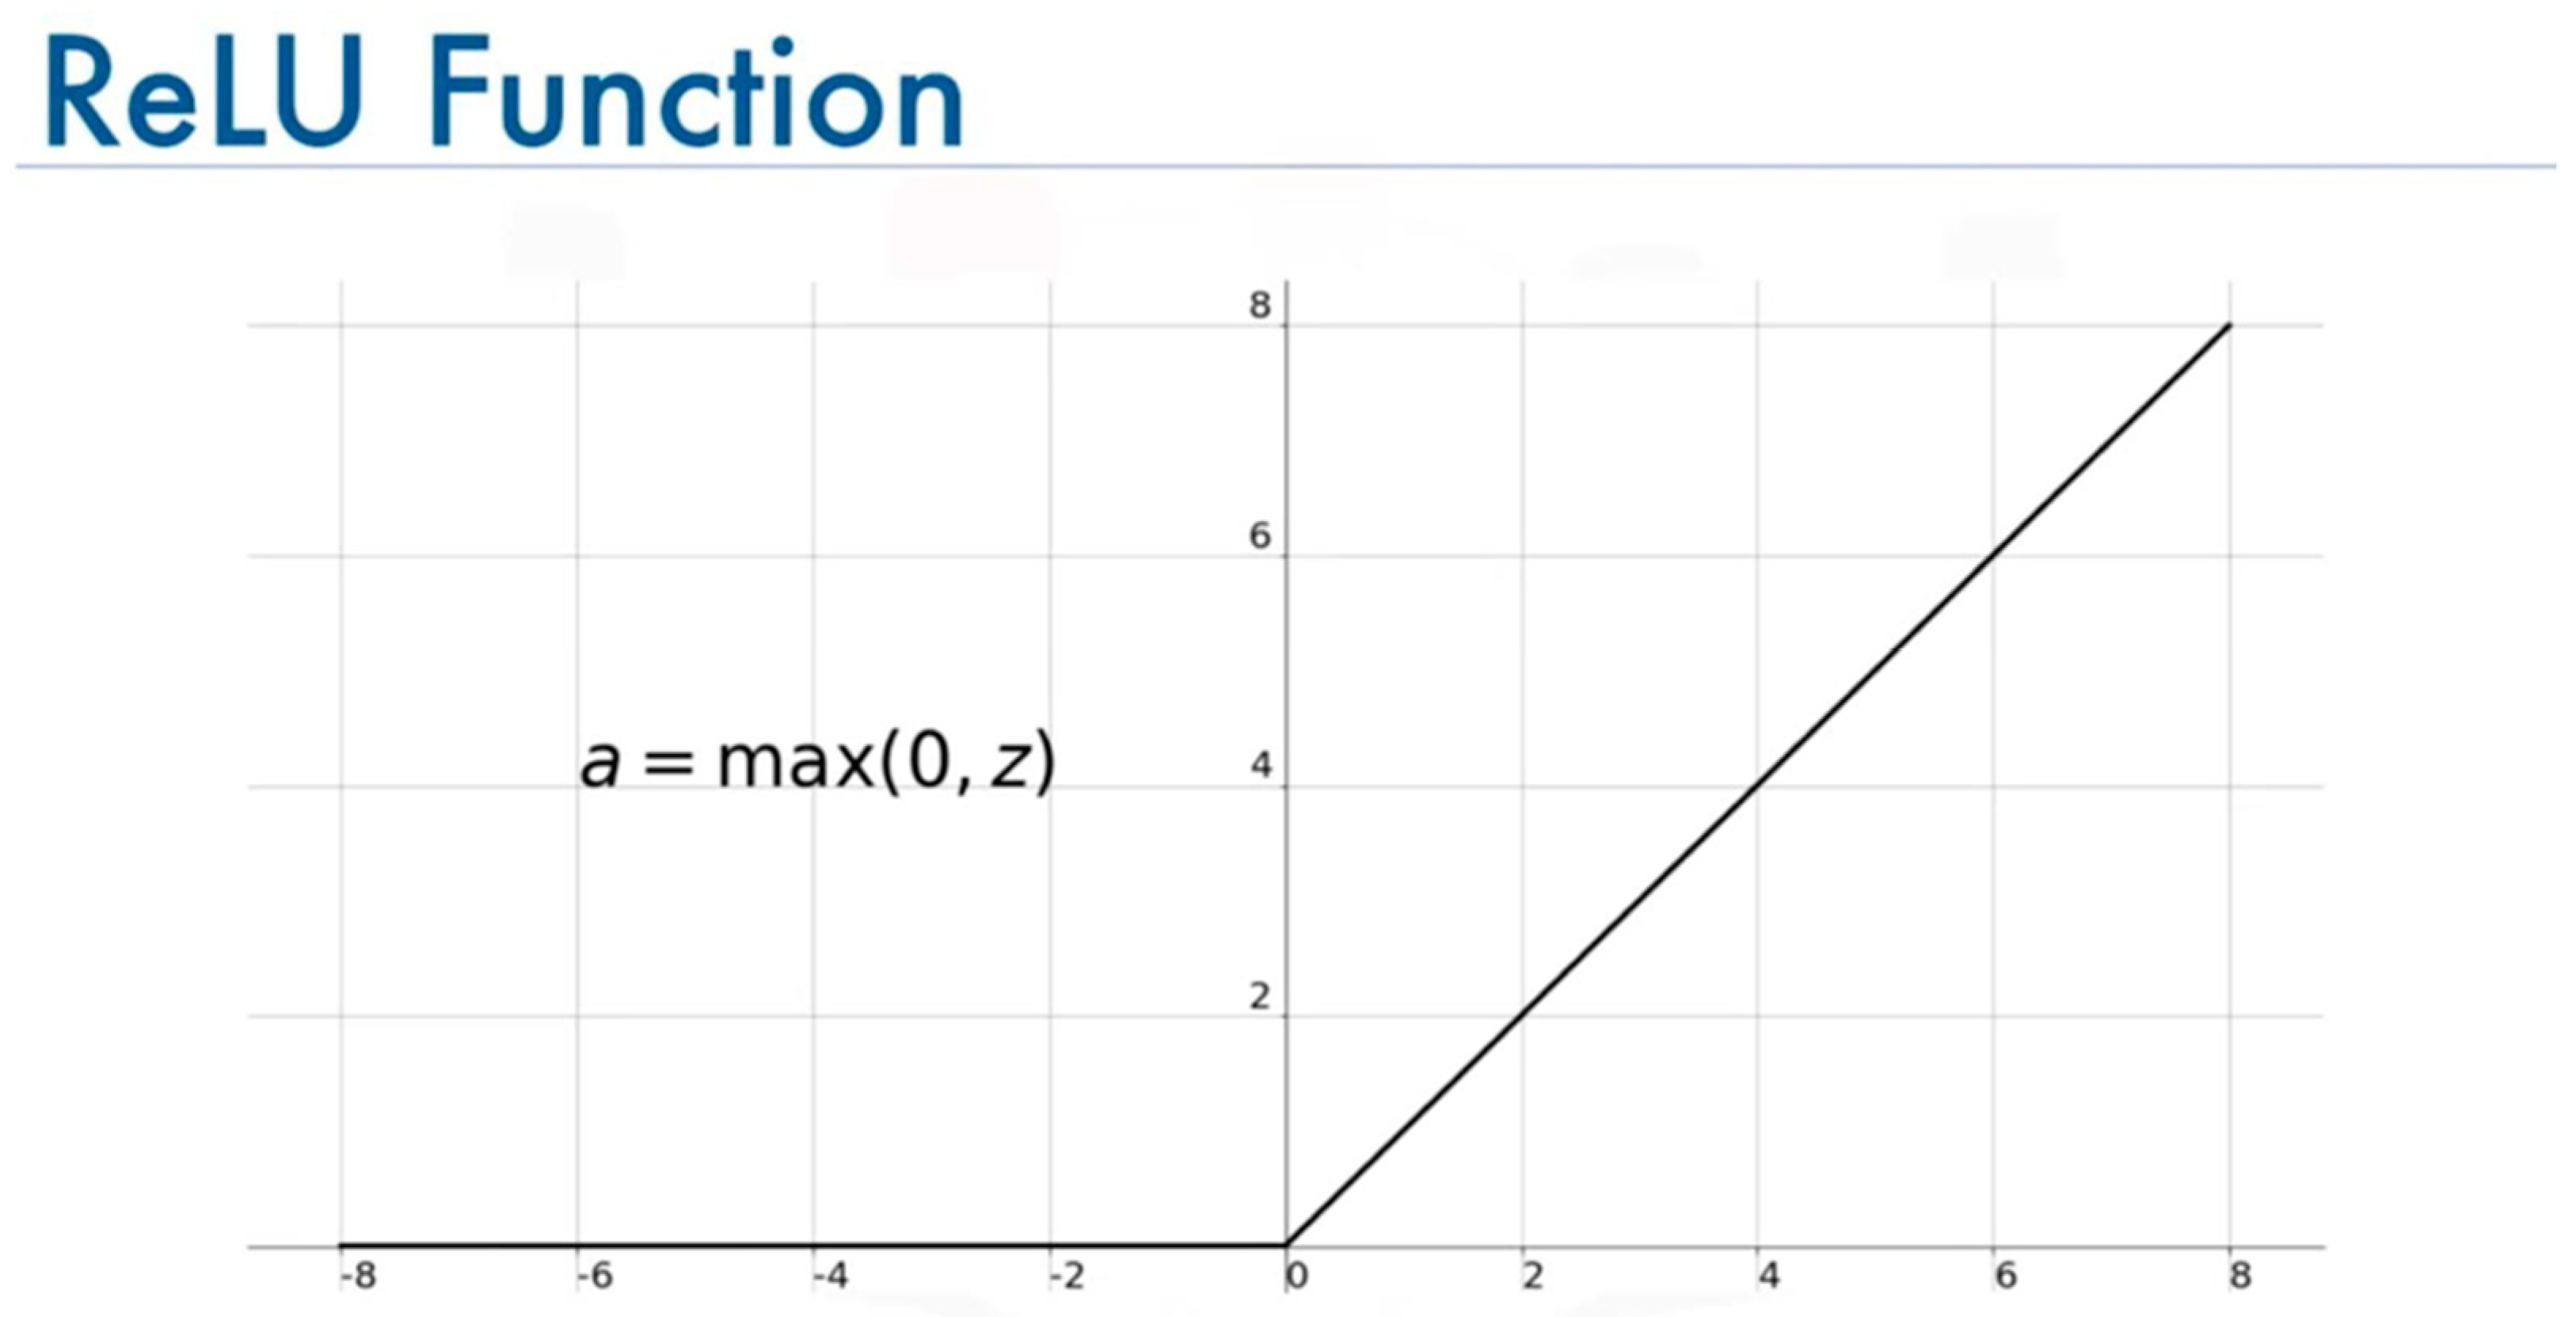
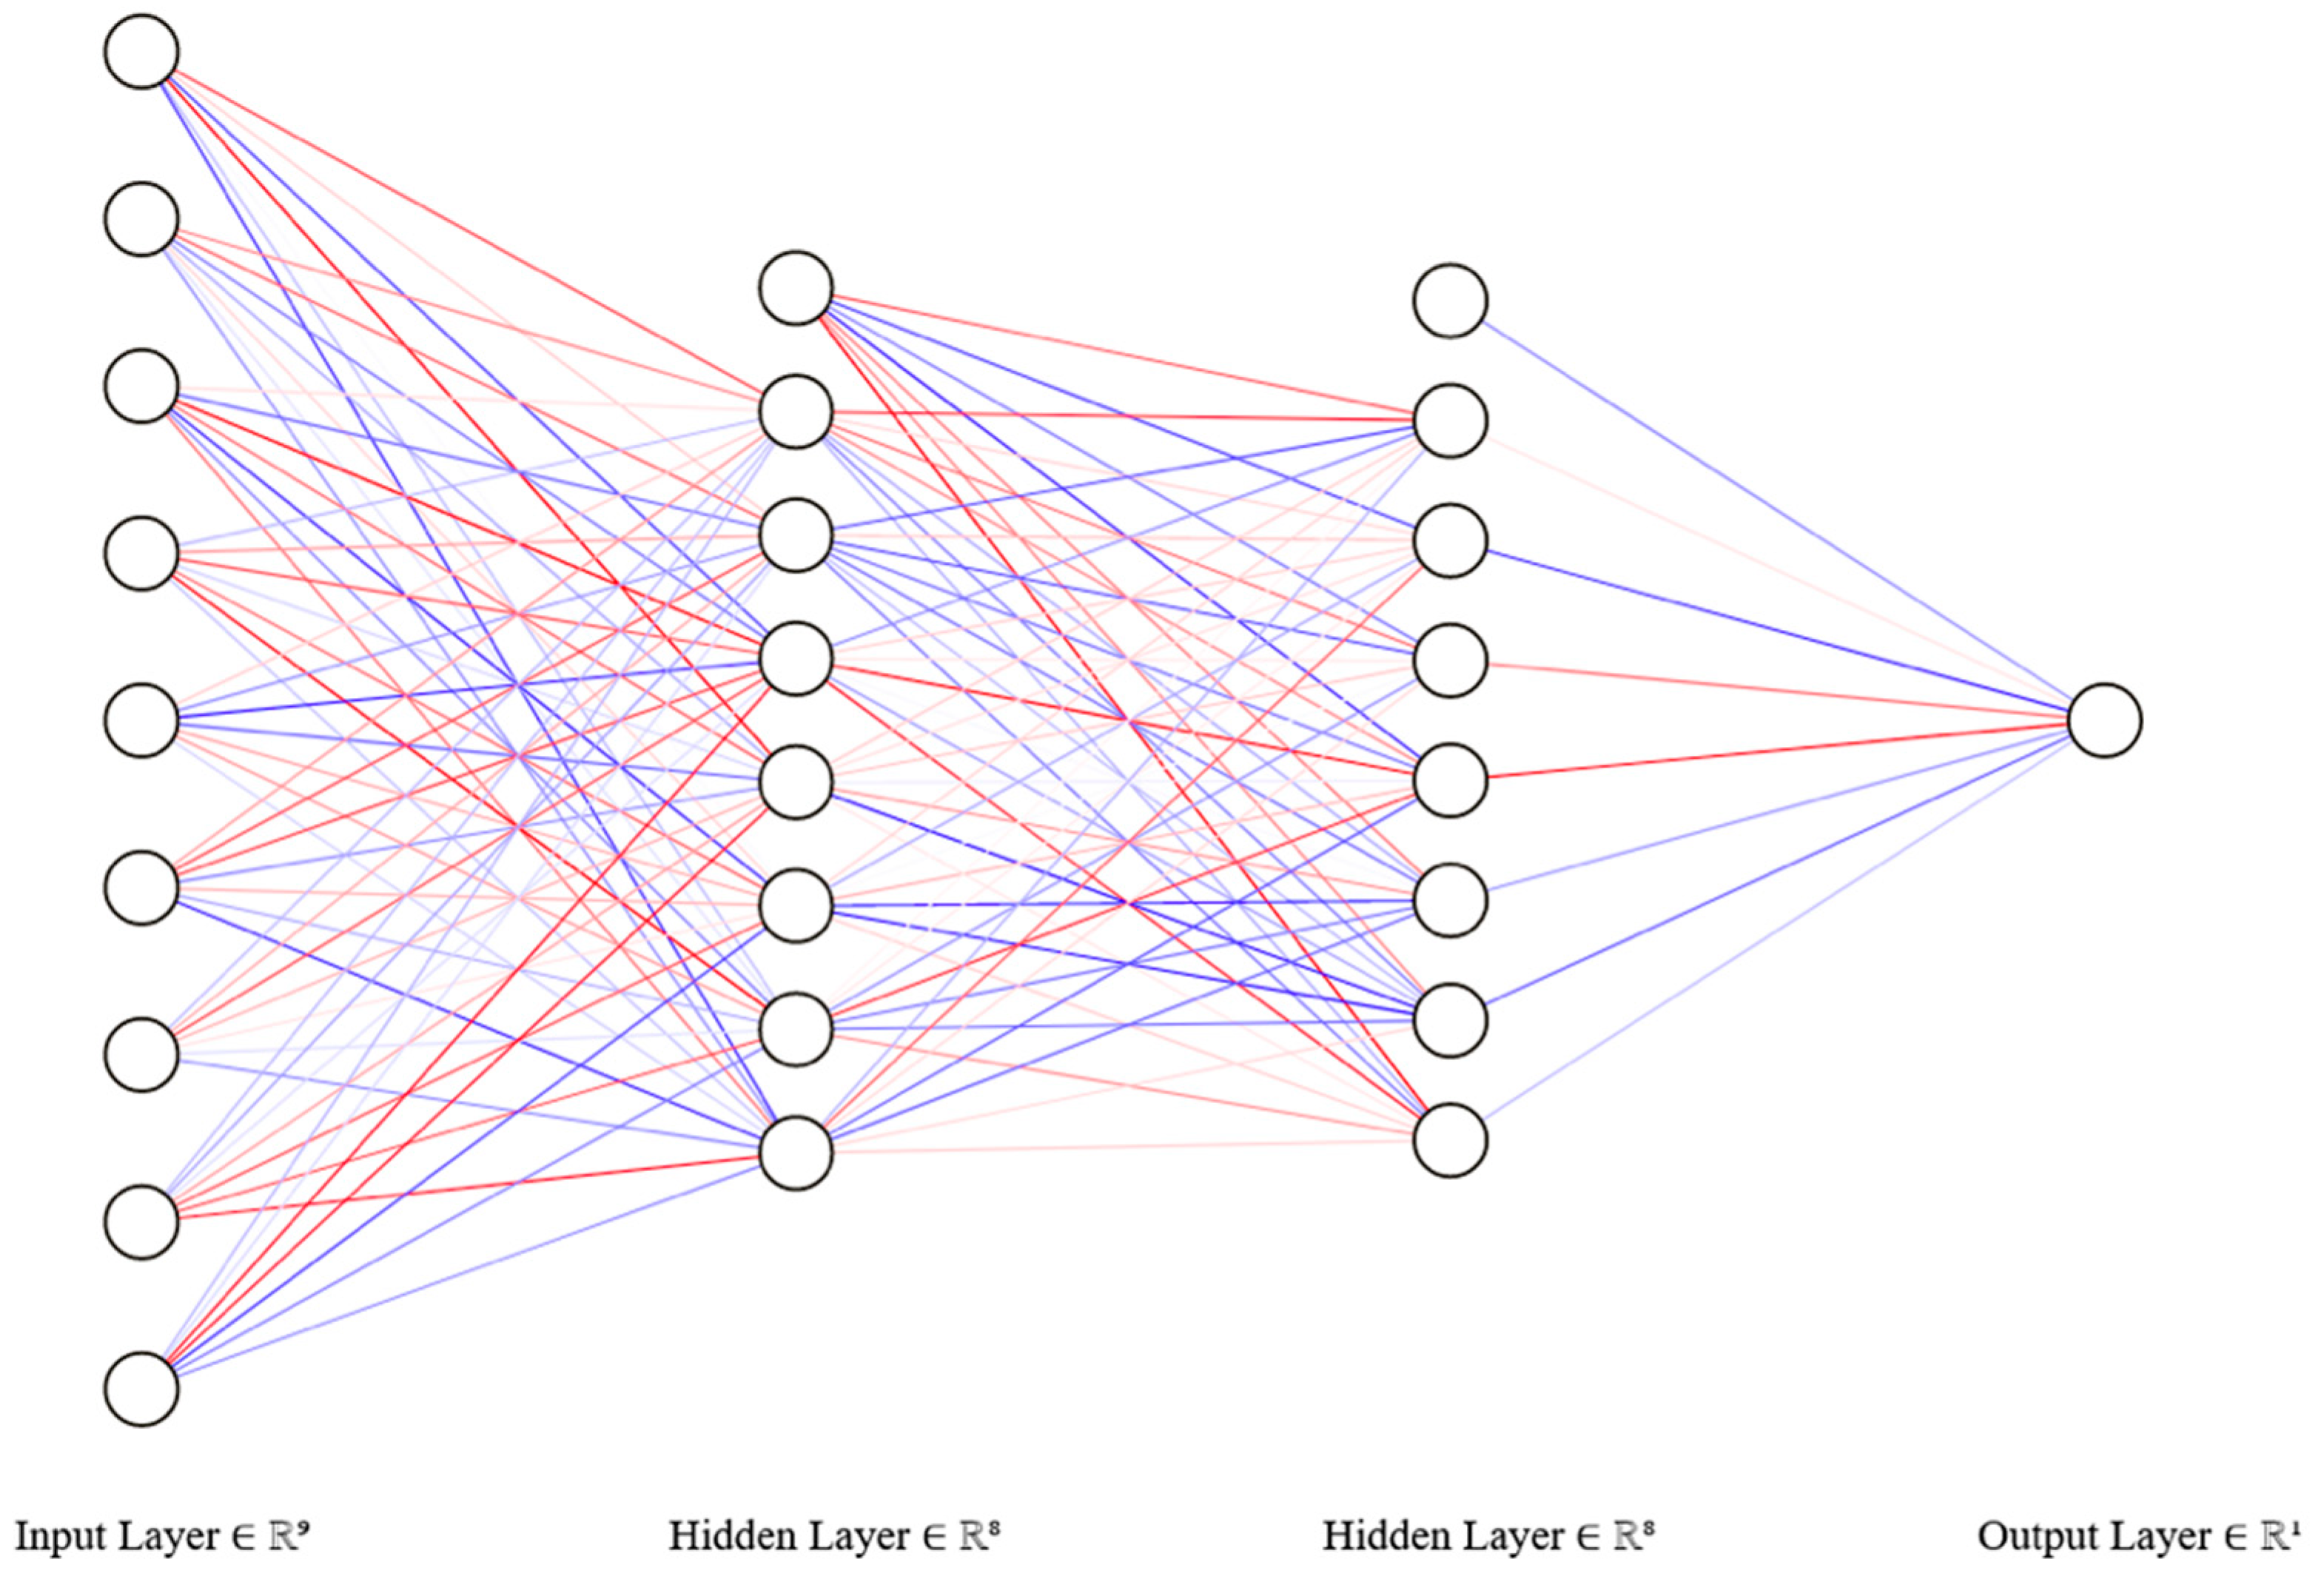
Objectivity: Since all collected data is from the sensors of the OURA ring, we can safely assume that it is completely unbiased, impartial, and unprejudiced, since it is qualitative data [39].
Reputation: The source of the data is from the ring, which means our only source is considered “trust-worthy”. Additionally, we are aware that the data never modified, edited, or manipulated, and also data is used by OURA to monitor sleep patterns for users, so OURA cannot manipulate the data, or they will risk losing their clients. All of this ensures that our data holds a good reputation and thus we approve this dimension [52].
Relevancy: The data set we received from OURA contains 55 entries for each day, and in our modelling process, we are using 10 parameters, which are 8 from OURA and 2 from SE. This means that the dataset we have covers 100% of our needs. Thus, this dimension is approved.
Timeliness: Time is not an important factor in our project; in fact, we have data ranging from multiple months (May 2020, December 2020, February 2021, March 2021). So, we have a wide range of the year covered by the dataset. We also have samples from winter/summer times which ensure that the program is trained on different patterns. Additionally, this project was conducted from January 2021 to May 2021, so the data is considered up-to-date. Thus, the timeliness dimension is approved.
Completeness: The data from OURA has some missing entries, for example, those which can be owed to the user forgetting to charge their ring, or to contactless moments between the wearer’s finger and the ring. However, we removed the days that contain the missing entries from our training sample, so it would not affect the model. The data from SE was 100% complete. In summary, the data we used in the training and testing was 100% complete, and this dimension is also approved.
Appropriate amount of data: There is no specific rule for deciding the sample size when training artificial neural networks (ANN); however, there are some theoretical calculations and assumptions that help to decide the appropriate amount of data needed for the desired ANN. It is alluded to that the more parameters the network consumes, the more data it will need. Additionally, there is a well-known dimension that is often used for deciding the complexity of the learning model, in our case of an ANN, this dimension is the Vapnik–Chervonenkis (VC dimension). The most significant outcomes in this regard are that the discrepancy between training and generalization error is bounded from above by a quantity that grows as the model’s VC dimension grows and shrinks as the number of training examples increases [53]. However, the difficulty in quantifying the VC dimension has led to hardly any application in practice. Therefore, scientists and practitioners tend to use a dominant rule which can be summarized in the following:
  • The VC dimension of ANNs is approximately the same as the number of weights [54].
  • The sample size required to train the ANN is roughly ten times the VC dimension [55].
In summary, the amount of data that is appropriate and meaningful for training the model is approximately ten times the number of weights. For calculating the number of weights (NW), we used the following formula:
NW = (I + 1) × H1 + (H1 + 1) × H2 + (H2 + 1) × O
I = Number of inputs (Parameters)
Hi = Number of neurons in Hidden layer number i
O = Number of outputs
This simple calculation suggests that the appropriate amount of data, we need 161 ∗ 10 = 1610 days. Unfortunately, the number of complete days we managed to collect from the dataset we received was 141 days. So, we cannot approve this dimension.
Interpretability: This dimension is not hard to assess, as both OURA and SE provide well-formatted definitions for the data they provide. Both companies also provide numerical values for the different parameters. Most of the OURA values are, however, scores ranging from 0–100 but they also include the number of seconds for the total time and degrees of deviation in skin temperature. In terms of SE, the same applies, and they provide percentages ranging from 0–100 for the relative humidity, and degrees for temperature. This dimension is approved.
Understandability: Similarly, to the previous dimension, this one is also easy to assess. The data came to us in excel sheets, which means that the data is structured by days and values for each day, and we received different datasets for each tenant and then combined them together in the project’s database. This means that the data is understandable and thus this dimension is also approved.
Consistency representation: The data like those mentioned earlier, was formatted into days and each day contains the values specific for that day. In terms of SE data, it was a bit different, that the data was divided into 24 entries per day (that is, a value for each hour), so we had to go through each day and select the values for the time which the tenant went to sleep. This ensures that we selected the value that had the most effect on the sleep of the tenants. Thus, this dimension is approved.
Concise representation: The data were compactly represented, and this dimension is approved.
Accessibility: The data were accessible to all parties that have the right to look at it and those who signed the agreement with the users. This dimension is approved.
Security: The data were shared with us through secure communication channels that belong to KTH, and this means that no third parties were involved. The data were also stored offline in our laptops and thus no cloud services are used. This ensures both the security of the participants and the security of the data from being lost or corrupted. This dimension is approved.

4.3. Modelling

The third sub-goal of this project, described in Section 2.2 was to create a model and an algorithm for improving the tenant’s sleep quality by adjusting the built environment parameters. For that reason, we decided that we would not personalize the model, which means our model is trained on a combination of all the data from all tenants. For the training stage, we merged the data into one set, which gave us a big enough dataset to train the model on. Moreover, after conducting a heavy literature review on this matter, we found that the best and most suitable model choice is the deep learning model “Multilayer perceptron” (MLP). MLP is a feed-forward deep artificial neural network, and it is applied to supervised learning. The uses of MLP are pattern classification, recognition, prediction, and approximation. It consists of three layers: an input layer, hidden layers, and an output layer. The hidden layers’ number is arbitrary, and they are the computational engine for MLP. As for the output layer, it is responsible for performing the required tasks signaled in the input layer. The model trains each neuron with a backpropagation algorithm. MLP was chosen for a few reasons. First, MLP can learn the training data’s representation and how to best relate it to the output variables. Second, it is said that MLP can produce useful predictions from relatively small training data (≤100) [20]. Third, it is one of the simpler machine learning models to use. Furthermore, given our limited time in this project, we appreciated uncomplicated algorithms [56,57]. For preparation, we had to split the data into two types of NumPy arrays: input and output variables. Both types were then be fed into the model. The variables are summarized as follows:
Input variables: 1. The temperature of the room; 2. The relative humidity of the room; 3. Total time spent sleeping; 4. Activity score; 5. Readiness score; 6. Restfulness score; 7. Sleep latency score; 8. Total burn.
Output variable: 1. Sleep score.
The model maps the input variables to the output variable, which can be summarized as y = f(x).
Modelling was achieved in three stages: defining, compiling, and fitting (training) the model. [58]. The first step was deciding the shape and identity of our model; by this, we mean the number of layers, the number of neurons inside each layer, and the activation functions. Based on the literature review we conducted, there was no specific approach for deciding how deep the model should be, i.e., the number of hidden layers. The ideal approach adopted by many developers is the trial–error procedure [59]. After we conducted many trials with different numbers of activation layers, we found that choosing two hidden layers is ideal for our problem, and it gave us the best results. As for the neurons, their quantity differs from layer to layer. First, the input layer takes in rows of input data with nine variables. Then, the first and second hidden layers have eight neurons (nodes) each. Finally, the output layer has only one neuron; the predicted sleep score. Furthermore, the activation function for the input and hidden layers was the rectified linear activation function (ReLU). ReLU is a simple function that returns the input directly if it is positive and returns 0.0 otherwise. This simplicity makes a model easier to train and achieve better performance. In addition, ReLU is linear for positive inputs, and it is nonlinear for negative or 0.0 inputs (all nonpositive inputs are mapped to 0.0). This property is desirable when training a neural network model using stochastic gradient descent with backpropagation of errors, as it allows the model to learn more complex relationships in the data [60]. The visual representation of the ReLU activation function is presented at the next chapter.
Next, the defined model was compiled. A few parameters need to be specified when compiling a model. These parameters are the loss function, optimizer, and metrics. Firstly, the loss function chosen was the mean absolute error. Mean Absolute Error is a type of regression loss function, which is appropriate in this case because the model is ultimately trying to find the relationship between the input and output to predict a real-valued quantity [61]. It is calculated as the average of the absolute difference between the actual and predicted values. Secondly, the optimizer chosen was Adam’s version of stochastic gradient descent (SGD). When training the neurons’ weights iteratively, this version of SGD uses moving averages of both the gradients and their second moments. Adam’s optimizer was chosen for our model because it is computationally efficient, requires little memory, and it works well with very noisy and sparse gradients [62]. Thirdly, in order to judge the accuracy performance of our model, we chose the accuracy metric. The accuracy metric’s values are viewed when fitting the data and evaluating the model, but they are not used during the training [63].
Finally, fitting (or training) is the last step required before evaluating the model to predict the sleep scores. Other than the validation set used for testing, sizes for epoch and batch needed to be set in this step. Training the model happens over epochs, which are divided into batches. An epoch refers to one passing through all days in our dataset, while a batch refers to a number of samples that the model works through before updating its internal parameters. As with the number of hidden layers, choosing the appropriate number of epochs and batches is a trial–error procedure. For the epochs, we kept increasing their size until we found the range in which the model got overfitted. Overfitting occurs when the model by-hearts the dataset, which means the model memorized the data instead of learning it. That range is noticeable by plotting the validation and training loss and looking for when the validation loss starts to slightly increase instead of decrease. For our case, that range was around >100 [64]. As for the batch size, we came to choose a low size. Generally, a large batch size is recommended for high learning rates, and small batch size is recommended for lower learning rates. Since we are using the default k-eras learning rate of 0.01, we decided to use a low batch size of 30 [65]. The Loss/Epoch testing results are presented on the Figure 6 below:

5. Results

5.1. Data Quality Assessment Results

To begin with, we mention that the results of the data quality assessment were satisfying. The results indicated that the data is applicable in this and similar scenarios. The results directly addressed which dimension is accepted and which is not.
Believability: This dimension was approved. Sensors measure the data entirely. Therefore, the values we have for each parameter are realistic and plausible. For example, in a period of 30 days, the total sleep time of one of the participants has ranged from 20,000 to 28,000 s, which is from 5.5 to 8 h of daily sleep, and this is compatible with the results of a study that was done by the University of Georgia. The study results reveal that, on average, university students get 6–6.9 h of daily sleep.
We have some limitations during this initial stage of the project. First, we did not have any feedback from the users. Second, we did not test the modeled algorithm in real-time applications. Third, our modeled algorithm was limited to predicting a user’s upcoming sleep score. Fourth, we had a limited amount of data due to a lack of participants. Furthermore, the delimitations of the study are the psychological and emotional effects on sleep, non-nighttime sleep, and health issues. Psychological, emotional, and health issues have huge effects on sleep quality. Since we did not be take feedback from users, it is hard to notice those effects. Moreover, non-nighttime sleep is of no importance to us since our test subjects follow the regular sleep schedule (nighttime sleep).
Accuracy: When assessing the accuracy of the data, we had to consider the accuracy of different parameters since each of the parameters were measured using different sensors and calculated using different methods. Out of ten total parameters, we had five approved, one rejected, and four parameters that we could not assess their accuracy with the bit of information we had. The first parameter is the sleep score, and this parameter, in particular, is the most important one in our study as it measures whether the tenants are having a good quality sleep. Since this parameter is OURA specific, we could not compare our data to other data sets. However, having an accurate sleep score helps the model to identify the tiny details that could affect the tenant’s wellbeing and sleep quality. Then, we have the ambient temperature; this parameter was also shown to be accurate. The more accurate the measurement of the temperature we have, the better control we can get on the surrounding atmosphere, and thus the better results we can achieve. The activity was also one of the parameters that we could prove to be accurate. It is also a critical parameter since it determines how active a tenant was and how much rest they need. That plays a measure role in determining the predicted sleep score in a single day or the recommended amount of sleep for the following night. Readiness provides a score of how well or prepared a tenant is for the next day. That is also a score that is very important to be as high as possible. For example, having a readiness score between 85–90 indicates that this person is ready and rested for the day and thus needs the regular amount of sleep, but having a low score like 60–65 indicates that the tenant needs extra hours of sleep to rest fully. The humidity indicator is also critical to be accurate in terms of this study. Similar to the TA, it is one of the controllers that the model adjusts to increase the sleep quality. Since the OURA ring uses interpretations from the 3D accelerometer to indicate wakeups and movement during sleep, any hand movements, or in-bed rotation can be interpreted as a wakeup and decreases restfulness. Thus, though we decided to reject its accuracy, this does not mean that we will not use it in our model. However, for future consideration, this can be considered. With the parameter of sleep latency, it is crucial for it to be accurate enough. By having an accurate sleep latency score, the model tells whether this person is overtired or anxious from the day before, and this leads to a more accurate estimation of the sleep score. The inaccuracy of the sleep latency score can be one factor that the prediction results are not as accurate on as of the actual values. Total burn, like sleep latency, tells much information about the previous day’s situation. We approved this parameter’s information based on a comparison performed with other wearables that measure a similar value but having the ability to test its accuracy would increase the model’s overall accuracy. Finally, the total sleep time is one of the most critical parameters in this model. The results have shown that the model recognizes a linear relationship between the total sleep time and the predicted sleep score. Hence, the model gave higher scores for the longest sleep time. That is true in some sense and is compatible with other findings in the literature review and the online search. Furthermore, it is reasonable as the tenants are sleeping more when they are relaxed and having a good sleep.
Objectivity: This is important to be approved since we do not want any data to be biased or modified in order to achieve actual results. Sensors measure the data we are dealing with, and we have no qualitative data.
Relevancy: When assessing the relevancy, many factors were taken into consideration, such as how well this data was suitable for our study, and whether we had all the data we might need or not. The assessment came as an answer to these questions. Since the study was directed to the use of the OURA ring, the data was relevant to the study, and we had all the data we needed, except not in a great enough amount. Although the dataset contains more data than we used, we used only 19% of the overall data we received. All other dimensions were approved, but since they did not affect the results, we have excluded them from the discussion. This ends the discussion in terms of data quality assessment. Through TDQM, we realized that the OURA ring is in fact an appropriate tool to evaluate sleep quality. However, the study of sleep is a challenging study because it is hugely affected by psychological factors. That causes an issue of sleep scores affected by other factors beyond the scope of this study. Some of these values can be affected by psychological factors or other factors related to a specific activity. For example, the restfulness value is easily negatively affected by anxiety, stress, alcohol consumption, and sleep apnea. Since the restfulness value contributes to 0.15 of the sleep score’s value, the overall sleep score will also be negatively affected. A few other values are affected by similar and other factors, making sleep quality a challenging property to measure passively. That is why “traditional” methods, like polysomnography, are better at studying sleep. That is why medical centers still use the “traditional” methods over wearable devices to diagnose sleep disorders. Nevertheless, for our study, this issue can be seen in days with ideal ranges of temperature and humidity that should have contributed to measuring high sleep scores, but they ended up having low sleep scores. This issue can be seen in Figure 7 and Figure 8. In order to mitigate this issue, a monitored study of tenants wearing the OURA ring in their building environment needs to be conducted. Such a study would be able to keep track of sleep scores heavily affected by other factors, like psychological and activity-related, which would lead to a better understanding of the OURA ring, built environment, and sleep quality.

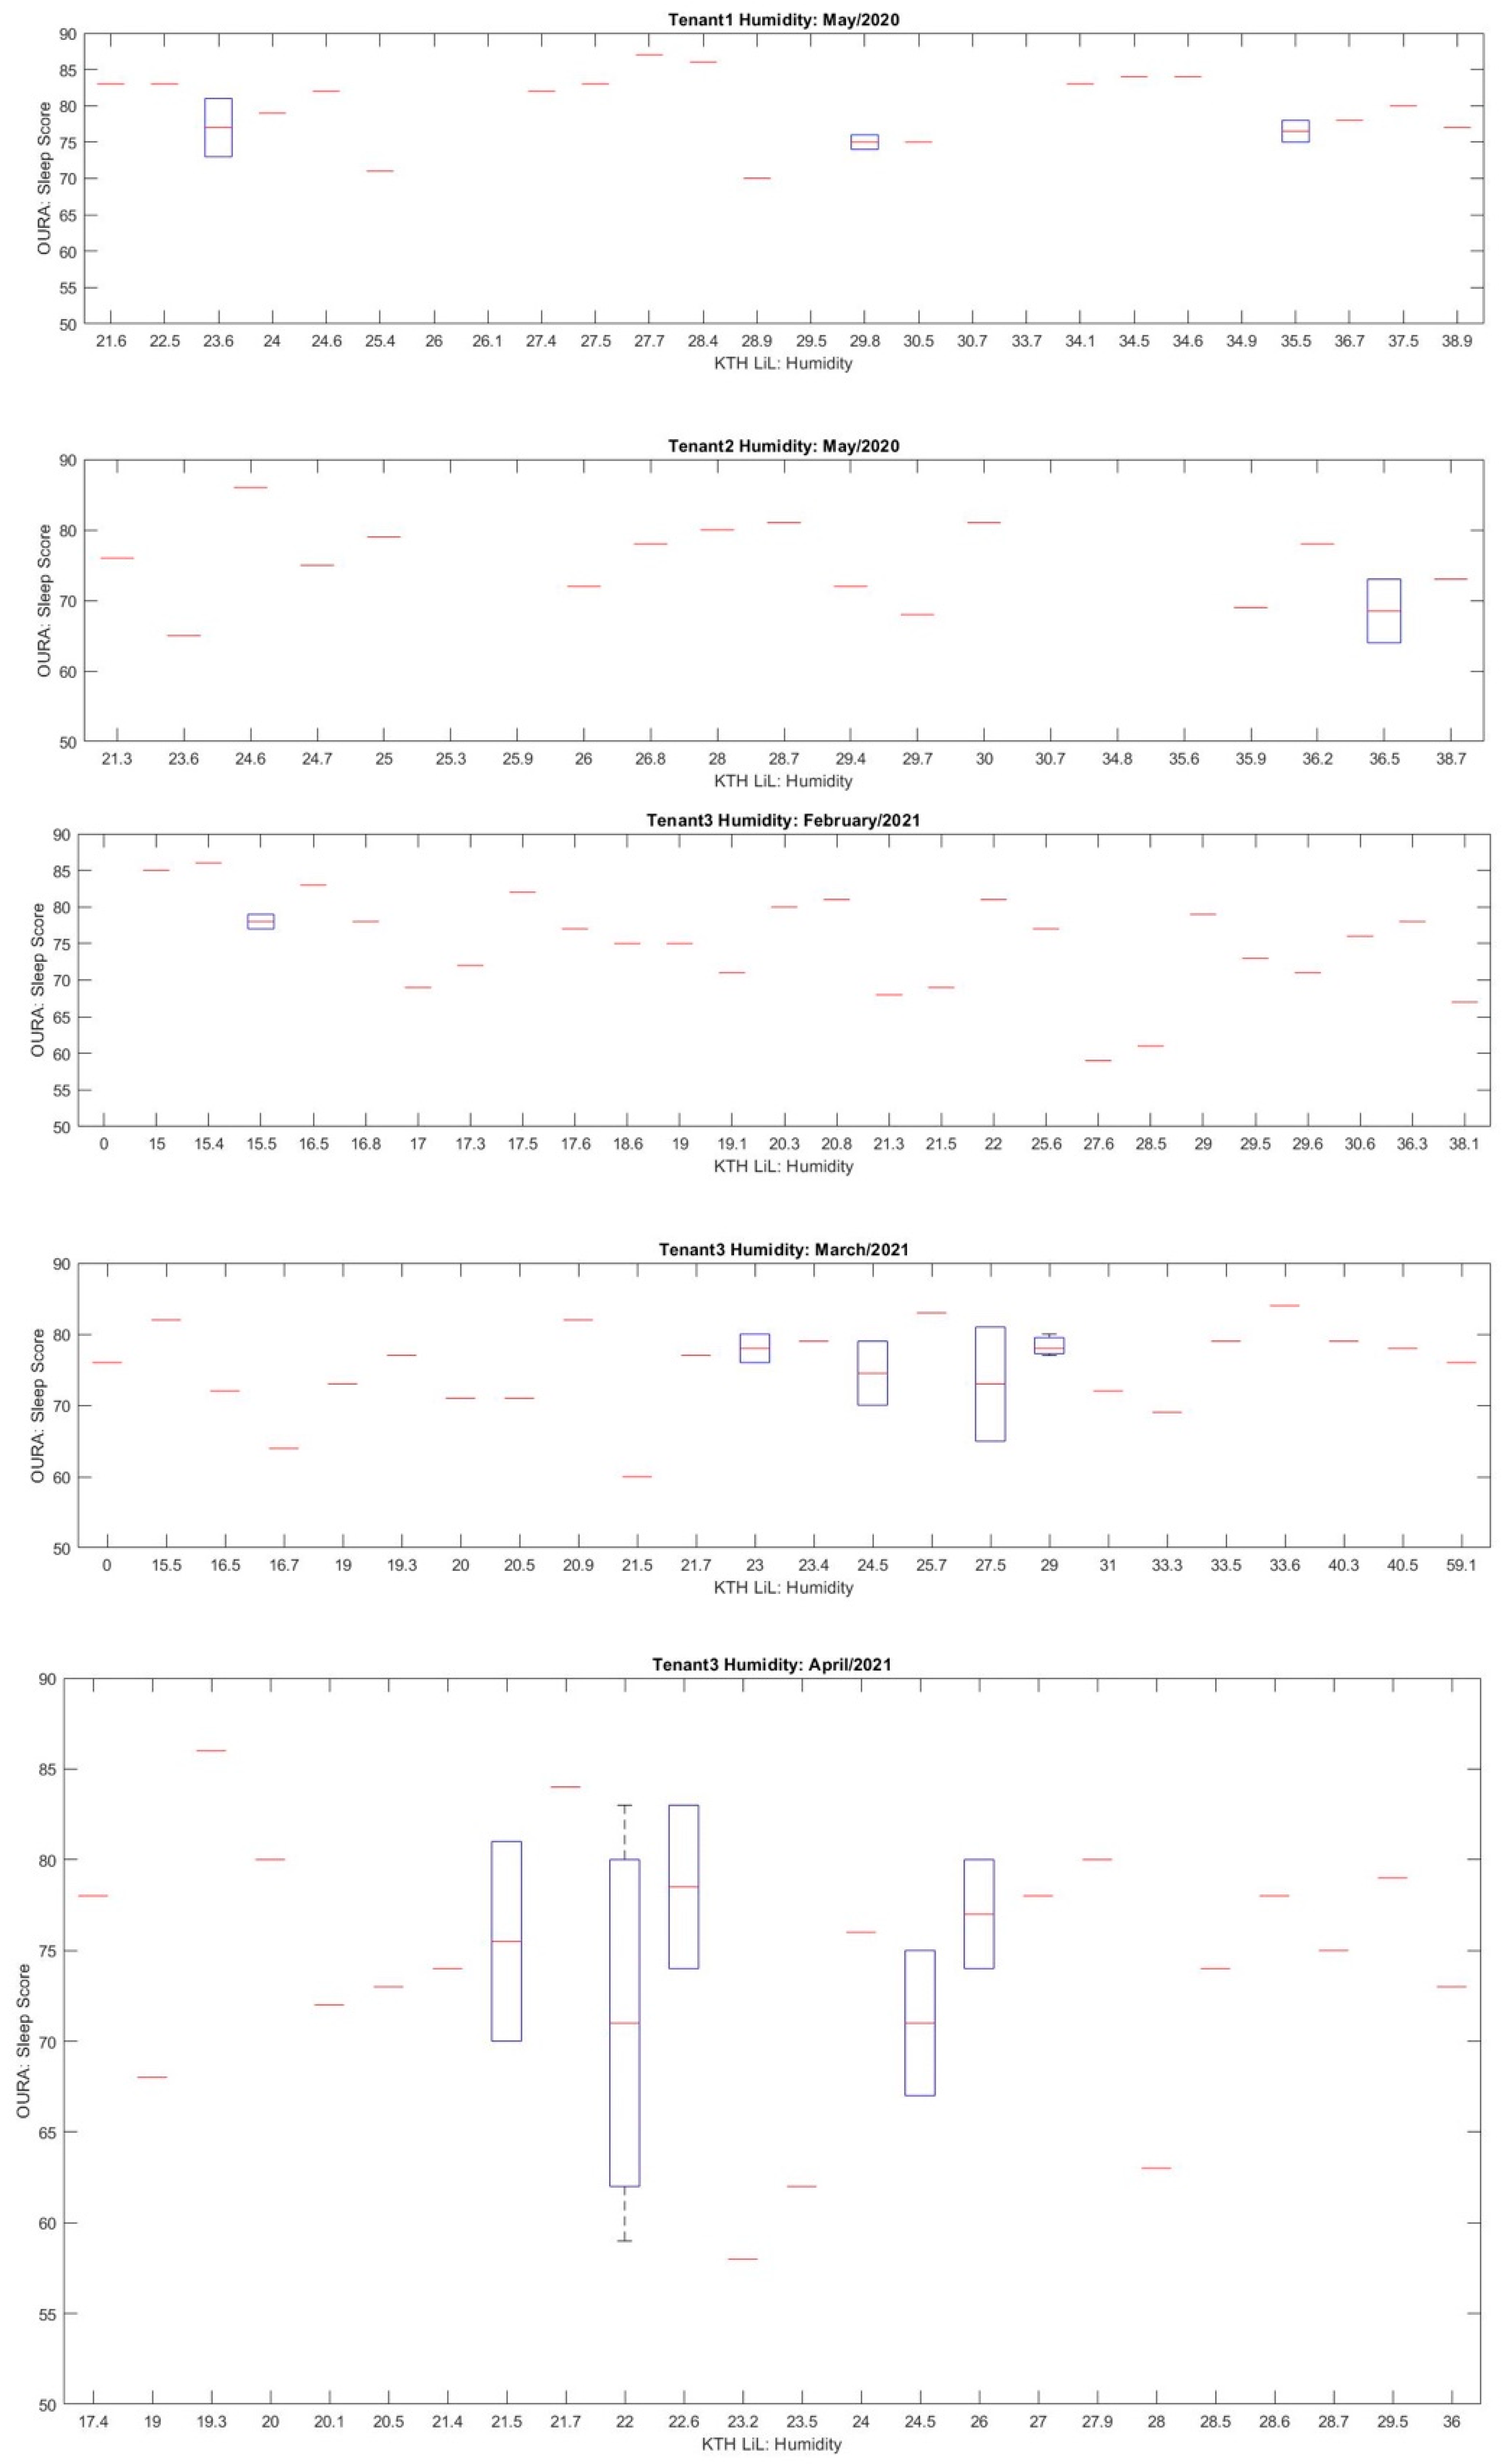
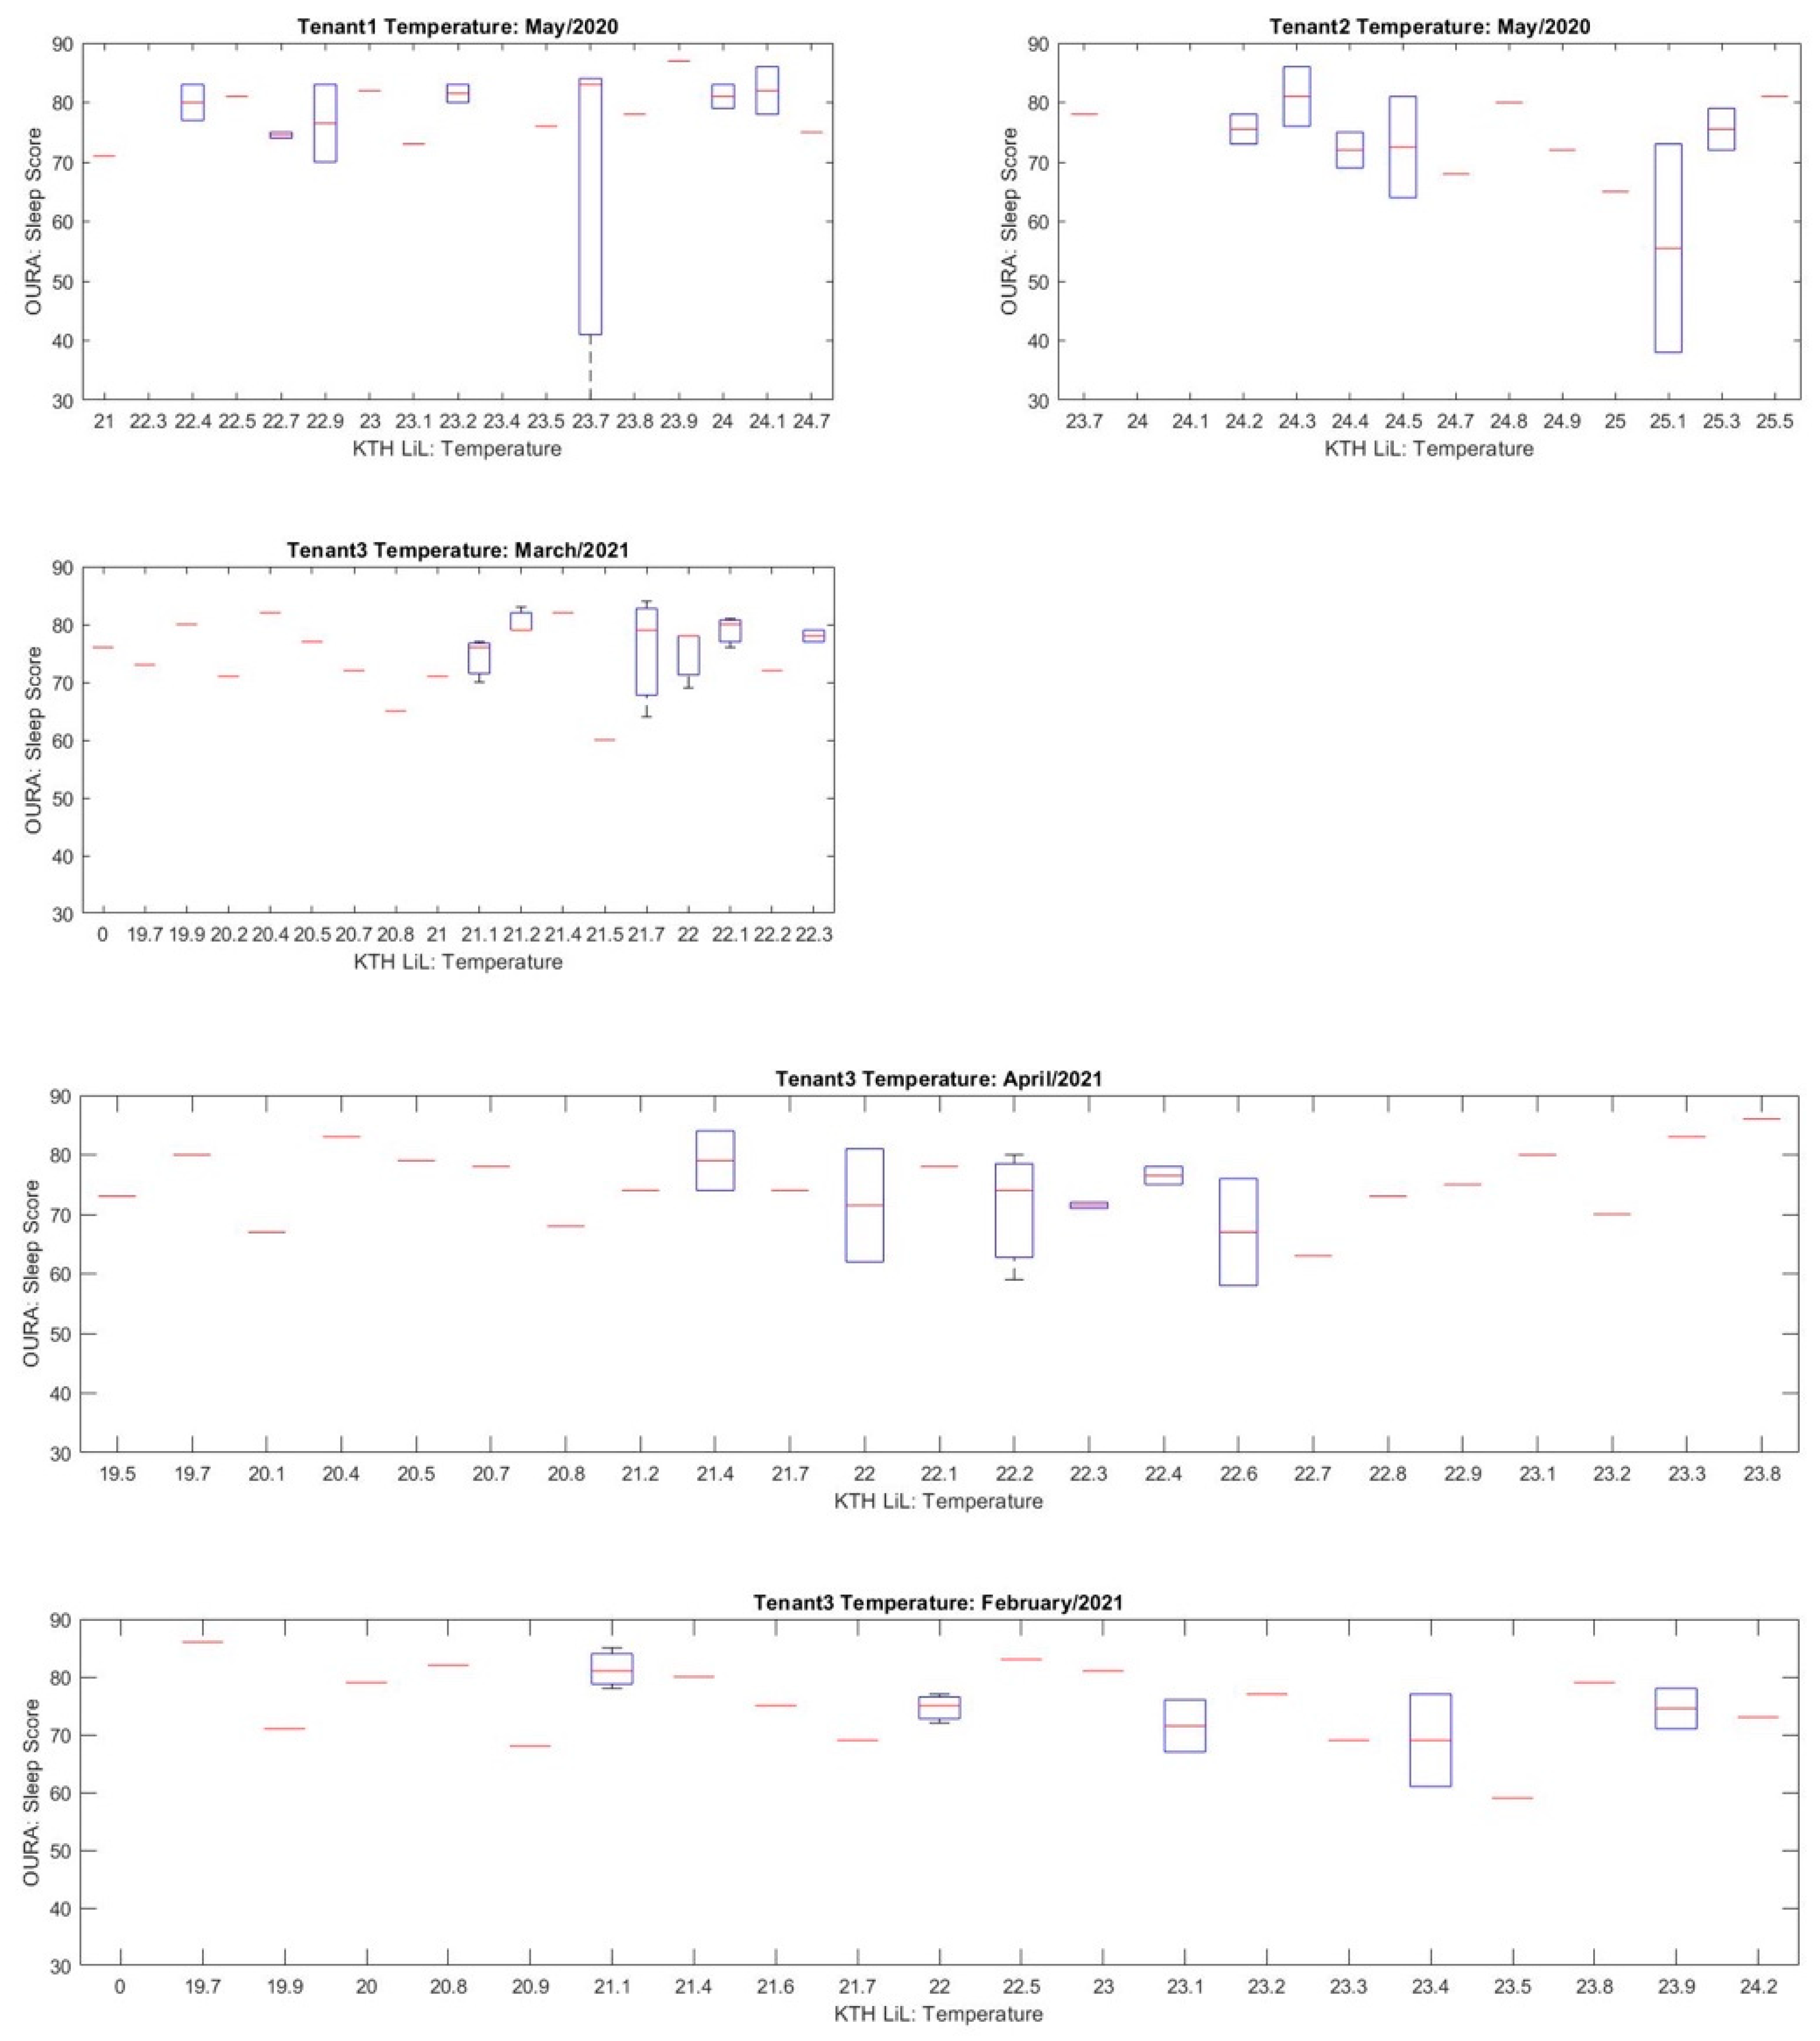
5.2. Sleep Quality and Built Environment Parameters

Multiple boxplots were created to verify the effects of temperature and humidity on the quality of sleep as studied. Figure 9 shows a boxplot of sleep scores and relative humidity for each data sample. There were three tenants in total: Tenant 1 and tenant 2 provided their data during May 2020, while tenant 3 provided data during February–April 2021. These boxplots convey multiple pieces of information about the OURA’s sleep scores at different relative humidity. First, almost all sleep scores are situated around the same range of relative humidity. That is due to KTH LiL controlling the relative humidity of their apartments to keep them around the ideal range for the built environment. Second, the interquartile ranges (lengths of boxes) are longer at higher sleep scores (≥70) than they are at lower scores. This means that the high sleep scores are more dispersed around ideal ranges of humidity than low scores.
Figure 10 shows a boxplot of sleep scores and temperature for each data sample. These boxplots show similar results to the previous figure. All sleep scores are situated around the same range of temperature values, with higher sleep scores (≥70) having larger interquartile ranges than lower scores. This, as before, means that higher sleep scores are more dispersed around ideal ranges of temperature than low scores. The dispersion of OURA’s sleep scores in the two figures agree with the studies about the ideal range of humidity and temperature for a better quality of sleep. However, they also show that even within those ideal ranges, a large amount of sleep scores is still low.

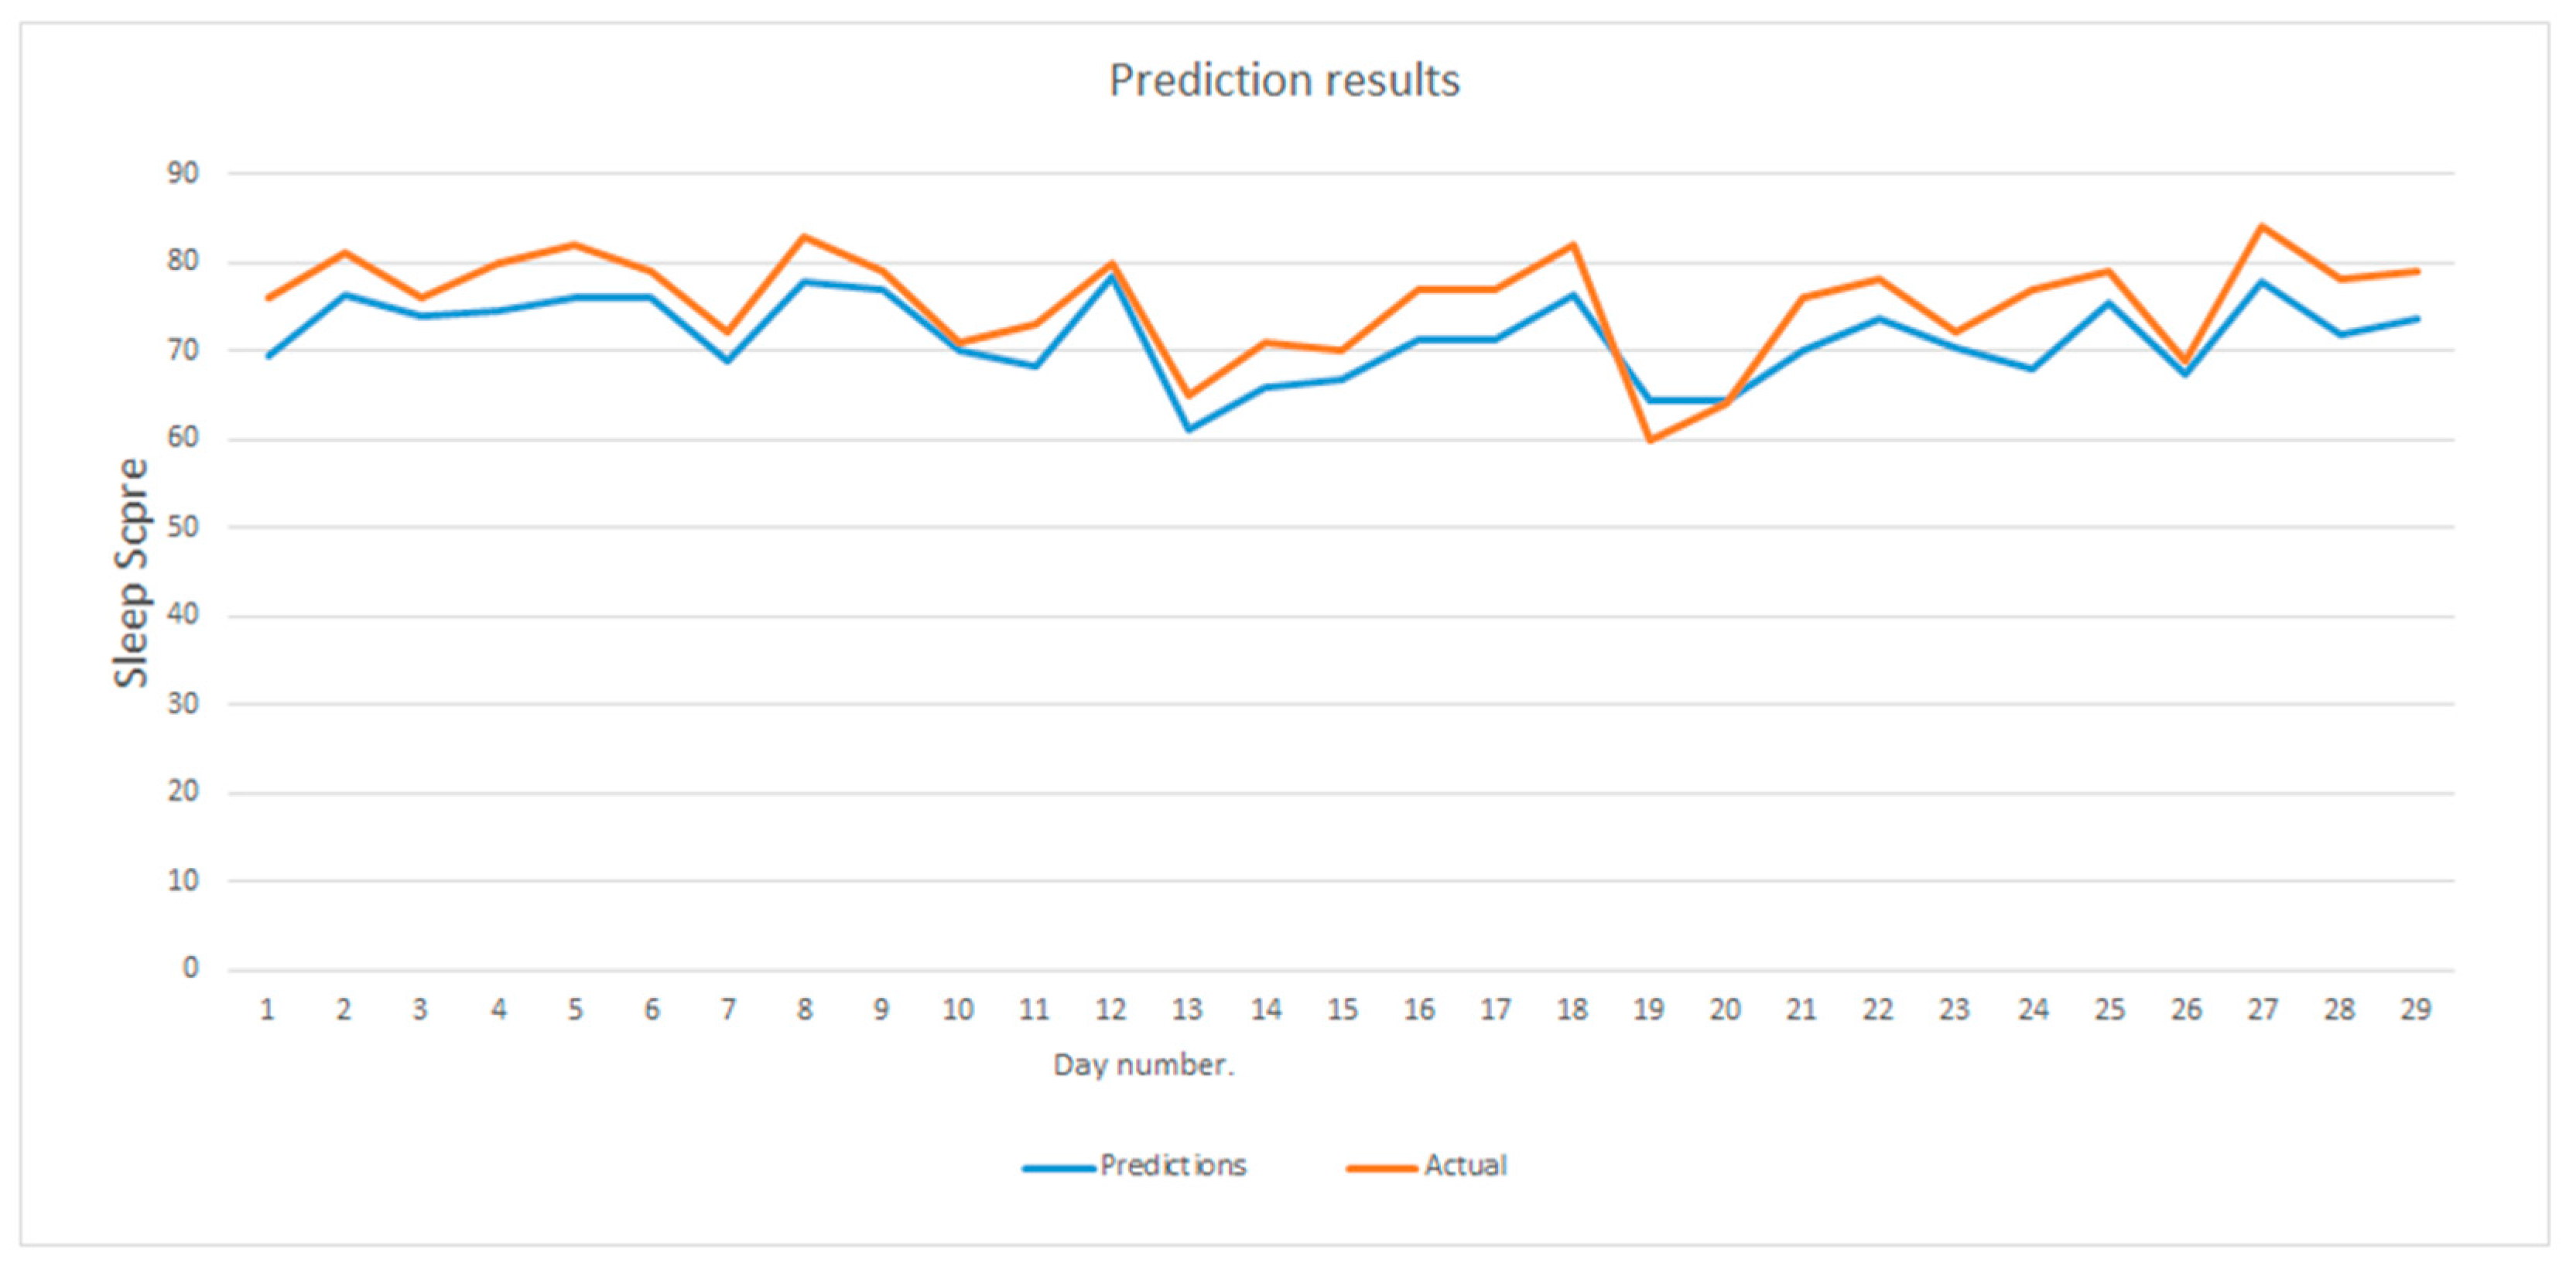
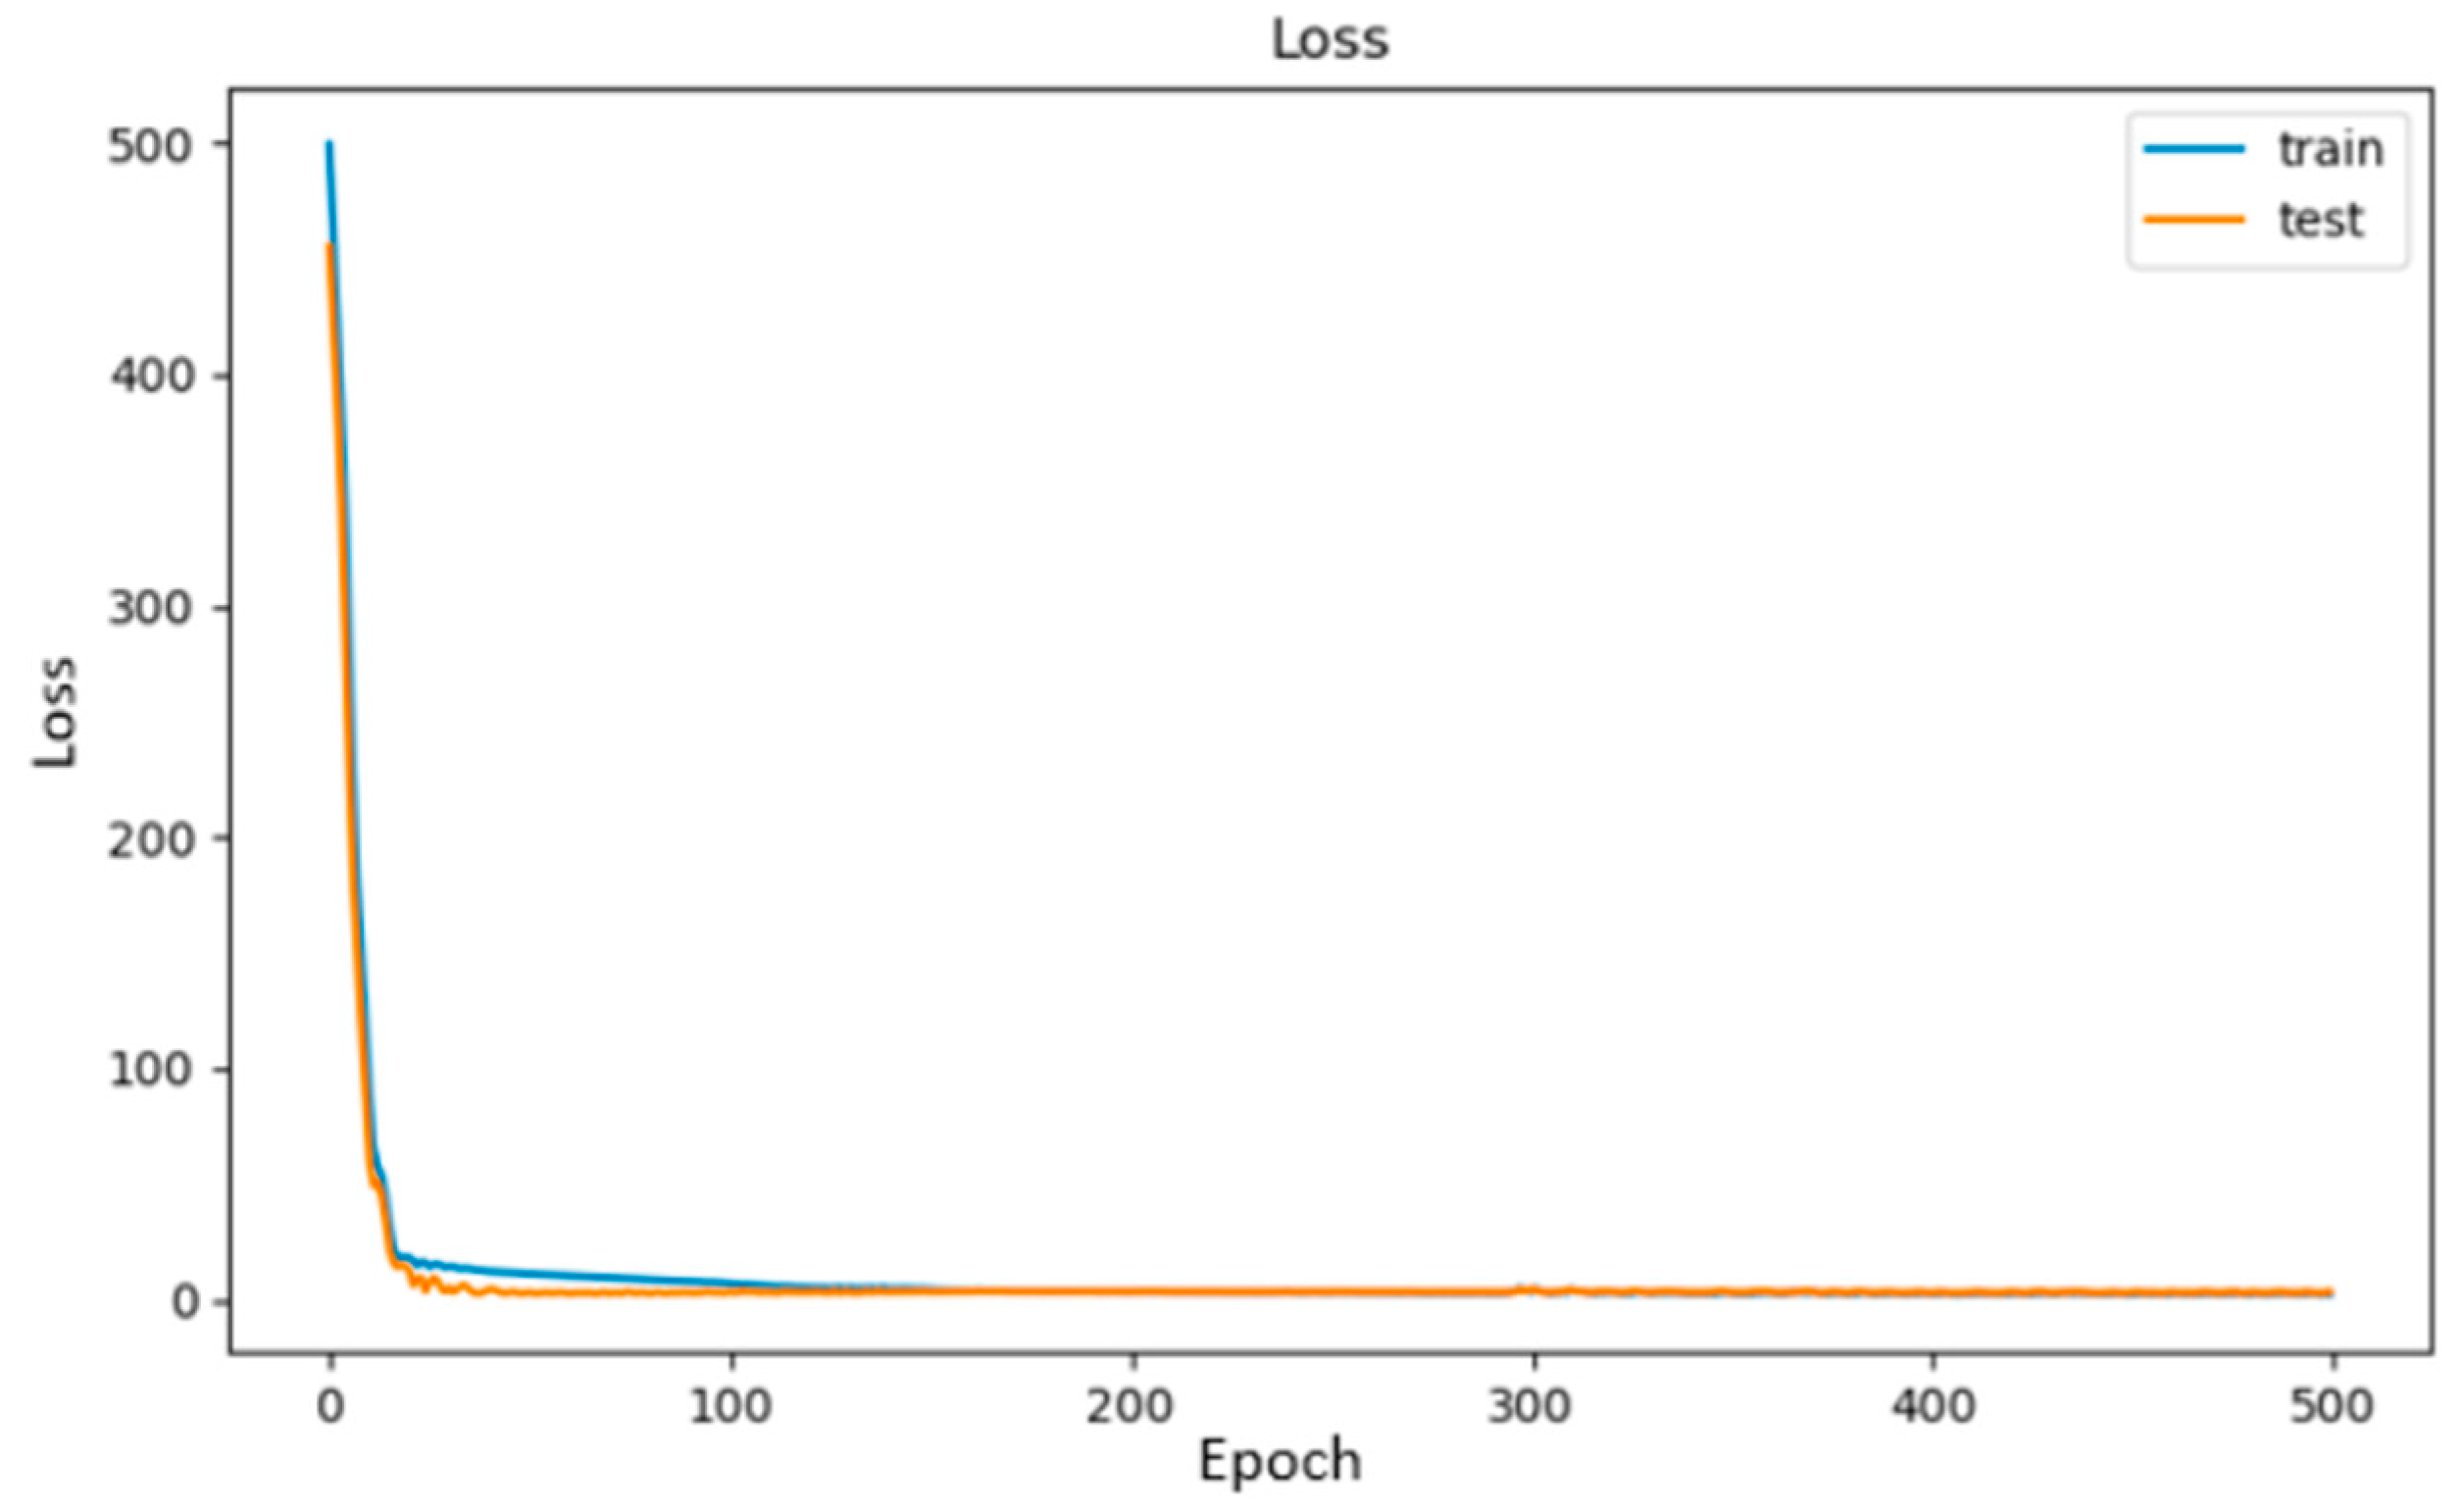
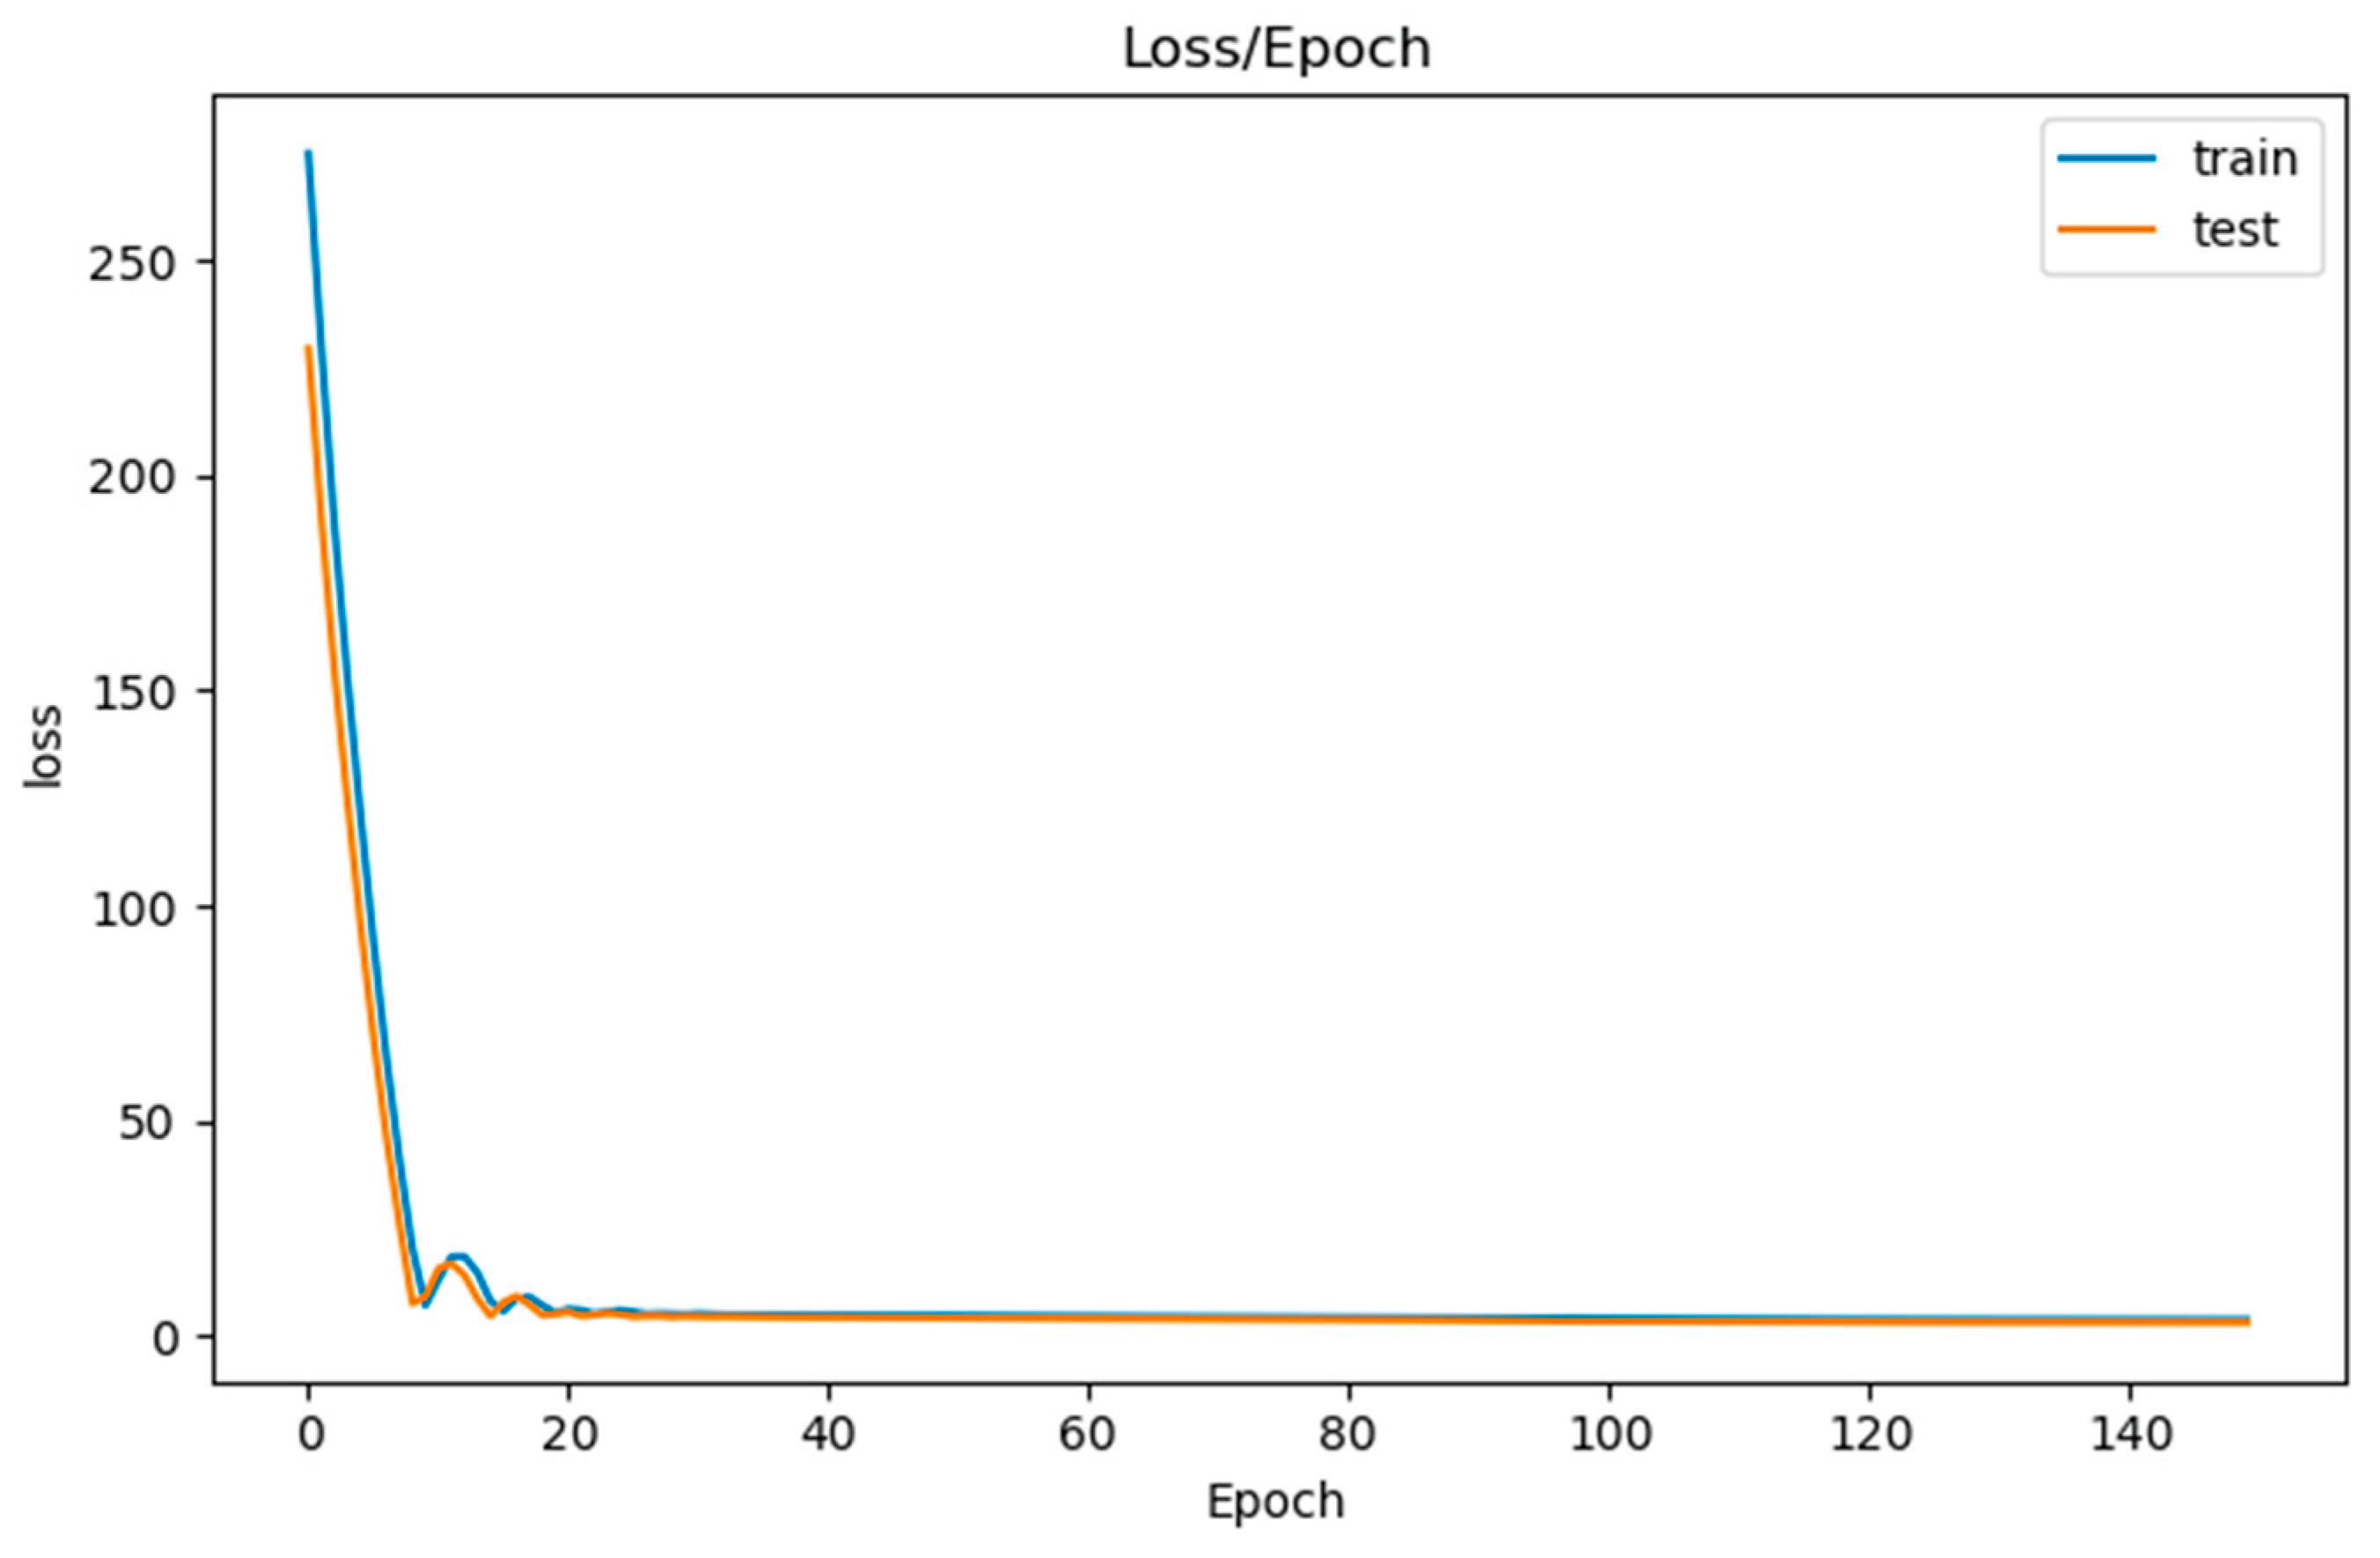
5.3. Modelling Results

The collected 141 training data represent the time periods of: 1 May 2020 and 1 February 2021 to 30 April 2021. Each day holds physiological and built environment values for one of the tenants. Figure 11 shows the results of training (fit) the model with the training data. The figure specifically shows the training loss and the validation loss of the training data and validation data, respectively, over 150 epochs. These two losses are the values of the loss functions, over the training data and the validation data that our model is trying to minimize. Both losses started decreasing exponentially during the first <10 epochs. Then, they decreased slowly and steadily, converging at ~2.00–3.00. Both losses at 50 epochs were at ~4.00–5.00, and, at 150 epochs, they were at ~1.90–2.50. Even though that difference is very small, running the training over 150 epochs still managed to reduce the training and validation losses by almost half of their values at 50 epochs. Having both losses converge ~2.00–3.00, instead of the ideal 0.00, could lead to some issues regarding accuracy of predictions. Ideally, both losses should be converging around 0.00.
Furthermore, it was important to test how well the model could predict the sleep scores. In order to do so, and since our dataset is relatively small, we split the dataset into two sets: training set and testing set. The testing set consisted of 30 days’ worth of data, and the training set consisted of the rest. Training the model over the training set then predicting the testing set’s sleep scores gave us 30 days’ worth of results (predictions). Comparisons between the actual sleep scores and the predicted scores are shown in Figure 12. It can be seen from the figure that the predicted values are close to the actual values, which presents the relationship between the sleep score and the environmental and physiological parameters. It can also be seen that those parameters can be used to model the sleep score by introducing a multilayer perceptron.

6. Discussion

Smart buildings have a significant application of IoT and data. These types of buildings use IoT devices to integrate the various complex units and IT systems that form the whole building. The integration allows the systems and units to communicate over a shared network. This communication and the ability to react to massive amounts of collected data by AI methods and other algorithms provide a better use of the building’s resources. That means, for example, better energy efficiency, lower maintenance costs, and better security. Smart buildings have existed for a while, and there is an interest in seeing how far the advantages of smart buildings can reach. That is where KTH LiL, with its testbeds, comes into play. Moreover, wearable devices have emerged recently as a new application of IoT. OURA ring is a wearable device that explicitly tracks sleep patterns, qualities, and other sleep-related information. One of the problems with wearable devices, including the OURA ring, is how reliable and accurate their information is. KTH LiL needed to use the OURA ring to understand the tenants better to test different scenarios and provide the ideal conditions for its tenants. However, in order to do so, extensive quality assurance needed to be conducted on the ring.
Nowadays, artificial intelligence methods are being introduced to many new fields, and they are becoming part of our everyday lives. AI methods essentially use input information to study, learn and figure out how they can achieve a particular task. One of the essential prerequisites of using an AI method is that people must have a considerable amount of input information. The large input helps the method maximize its success rates of achieving the particular task. However, that is not always the case, as some tasks do not require large inputs to solve. These tasks just require an appropriate AI method with proper initializations, arguments, and training to achieve their tasks with some level of success rates. From our modelling results, we can see that we were able to solve our task of predicting sleep scores by using the multilayer perceptron method. Even though we had an input of small size, we could still achieve a slightly low loss rate of ~2.00 by choosing the appropriate number of training epochs (150) and initialization methods. This loss rate correlates with slightly high success rates of accurately predicting the values of the sleep scores of tenants. In return, this suggests that the sleep scores (quality of sleep), calculated from the OURA ring by tracking tenants’ physiological information during night-time, ultimately depend on built environment values surrounding these tenants. The built environment values this research studied were temperature and humidity.
With that being said, if our dataset were larger (around 1000 entries), then the model could have reached loss rates of nearly 0.00, which is the ideal rate for these types of models. Achieving a loss rate that is not in the ideal range (0.00) means that the predictions will not be very accurate. The predicted values are 5–10 points around the actual values, as seen in the prediction results. This difference between the actual/predicted values can be reasoned with many facts. We are aware that when training the model, we merged the data from different tenants, but this was not an efficient move as OURA considers personal information such as age and weight when calculating different parameters. So, our model was blind to this information since we do not have access to them. However, because of the data shortage, we had to make this compromise.

7. Conclusions

To conclude, we would like to reiterate our research questions. The first question regards exploring the possibilities and limitations of measuring sleep quality from built environments and the OURA ring. Based on the data passing 11 dimensions in TDQM results and the OURA ring’s ability to capture the effects of humidity and temperature on sleep quality through its sleep scores, we can say that the OURA is an appropriate tool for measuring sleep quality passively. However, since measuring sleep quality is very reliant on people’s feedback, further studies need to be conducted that take into account some sort of user feedback. The next question is regarding the possibility to use ANN for predicting sleep qualities for tenants. Based on the modelling loss and prediction results, we can say that multilayer perceptron is an appropriate ANN algorithm for predicting sleep quality by using the ring’s sleep scores. The final question investigates whether the ring and SE can be used to provide personalized instructions to increase users’ sleep scores. Based on the modelling results, the MLP prediction model can be extended into a recommendation model. Such a model would give personalized instructions for users to increase their sleep scores.
This was an explorative study for evaluating sleep quality with a wearable device and built environments of temperature and humidity. Further studies need to be conducted on the effects of using the OURA ring and built environments on the quality of sleep. A study could be done by having multiple tenants use the ring for an extended period, providing around 100–200 days worth of data. The study should have the tenants in a semi-monitored environment where it can take feedback and notes from the tenants about any psychological issues or inconsistencies with the data. Moreover, the study could still use an artificial neural network method to predict future sleep scores and compare them with feedback from the tenants. Another study could be done by using the ring and built environment to recommend ways to increase one’s quality of sleep. A recommendation model can be built based on the ANN prediction model, where the model would notice low sleep score values and investigate how one could increase them. Such a model could be based on the built environments of temperature, humidity, CO2, ventilation, etc., and information from the ring, like, sleep timing and activity rates.

Author Contributions

E.M.—Conceptualization, Funding acquisition, Investigation, Methodology, Project administration, Supervision, Writing—review & editing; A.A.R.—Formal analysis, Software, Visualization, Writing—original draft, O.O.—Formal analysis, Software, Visualization, Writing—original draft, P.L.—Supervision, Writing—review & editing. All authors have read and agreed to the published version of the manuscript.

Funding

This research was funded by Swedish Energy Agency Energimyndigheten, (48097-1) under the “Design for resource efficient everyday life” program.

Institutional Review Board Statement

Not applicable.

Informed Consent Statement

Not applicable.

Data Availability Statement

Data sharing is not applicable to this article.

Conflicts of Interest

The authors declare no conflict of interest.

References

  1. Jia, M.; Komeily, A.; Wang, Y.; Srinivasan, R. Adopting Internet of Things for the development of smart buildings: A review of enabling technologies and applications. Autom. Constr. 2019, 101, 111–126. [Google Scholar] [CrossRef]
  2. Hillier, B. Space Is the Machine; Space Syntax: London, UK, 2007. [Google Scholar]
  3. Shen, L.; Hoye, M.; Nelson, C.; Edwards, J. Human-Building Interaction (HBI): A User-Centered Approach to Energy Efficiency Innovations. In Proceedings of the 19th ACEEE Conference on Energy Efficiency in Buildings, Pacific Grove, CA, USA, 21–26 August 2016; Center for Energy and Environment: Minneapolis, MN, USA, 2016. [Google Scholar]
  4. Alavi, H.; Churchill, E.; Kirk, D.; Nembrini, J.; Lalanne, D.; Moncur, W. Future of Human-Building Interaction. In Proceedings of the 2016 Conference on Human Factors in Computing Systems, San Jose, CA, USA, 7–12 May 2016; pp. 3408–3414. [Google Scholar]
  5. Elena, M.; Lundqvist, P. End-user activities context information management framework for sustainable building operation. J. Phys. Conf. Ser. 2019, 1343, 012151. [Google Scholar]
  6. Lan, L.; Pan, L.; Lian, Z.; Huang, H.; Lin, Y. Experimental study on thermal comfort of sleeping people at different air temperatures. Build. Environ. 2013, 73, 24–31. [Google Scholar] [CrossRef]
  7. Tsang, T.W.; Mui, K.W.; Wong, L.T. Investigation of thermal comfort in sleeping environment and its association with sleep quality. Build. Environ. 2021, 187, 107406. [Google Scholar] [CrossRef]
  8. Zhang, B.; Wing, Y.K. Sex differences in insomnia: A meta-analysis. Sleep 2006, 29, 85–93. [Google Scholar] [CrossRef] [PubMed]
  9. Okamoto-Mizuno, K.; Mizuno, K. Effects of thermal environment on sleep and circadian rhythm. J. Physiol. Anthropol. 2012, 31, 1–9. [Google Scholar] [CrossRef] [PubMed] [Green Version]
  10. Jones, S.G.; Benca, R.M. Sleep and biological rhythms. In Handbook of Psychology, Behavioral Neuroscience; Weiner, I.N., Sheri, R.J.M., Eds.; Wiley Publish: Somerset, NJ, USA, 2012; Chapter 13; pp. 365–394. [Google Scholar]
  11. Carskadon, M.A.; Dement, W.C. Normal human sleep: An overview. In Principles and Practice of Sleep Medicine, 5th ed.; Kryger, M.H., Roth, T., Demen, W.C., Eds.; Elsevier Inc.: Philadelphia, PA, USA, 2011; pp. 16–26. [Google Scholar]
  12. Weitzman, E.D.; Czeisler, C.A.; Zimmerman, J.C.; Ronda, J.M. Timing of REM and stages 3 + 4 sleep during temporal isolation in man. Sleep 1980, 2, 391–407. [Google Scholar] [PubMed]
  13. VanSomeren, E.J.W. More than a marker: Interaction between the circadian regulation of temperature and sleep, age-related changes, and treatment possibilities. Chronobiol Int. 2000, 17, 313–354. [Google Scholar] [CrossRef]
  14. Miller, M.A.; Cappuccio, F.P. Biomarkers of cardiovascular risk in sleep-deprived people. J. Hum. Hypertens. 2013, 27, 583–588. [Google Scholar] [CrossRef] [PubMed] [Green Version]
  15. Nagai, M.; Hoshide, S.; Kario, K. Sleep duration as a risk factor for cardiovascular disease-a review of the recent literature. Curr. Cardiol. Rev. 2010, 6, 54–61. [Google Scholar] [CrossRef]
  16. De Zambotti, M.; Cellini, N.; Goldstone, A.; Colrain, I.M.; Baker, F.C. Wearable sleep technology in clinical and research settings. Med. Sci. Sport. Exerc. 2019, 51, 1538. [Google Scholar] [CrossRef] [PubMed]
  17. Depner, C.M.; Cheng, P.C.; Devine, J.K.; Khosla, S.; de Zambotti, M.; Robillard, R.; Vakulin, A.; Drummond, S.P. Wearable technologies for developing sleep and circadian biomarkers: A summary of workshop discussions. Sleep 2020, 43, zsz254. [Google Scholar] [CrossRef] [Green Version]
  18. Shelgikar, A.V.; Anderson, P.F.; Stephens, M.R. Sleep tracking, wearable technology, and opportunities for research and clinical care. Chest 2016, 150, 732–743. [Google Scholar] [CrossRef]
  19. Berryhill, S.; Morton, C.J.; Dean, A.; Berryhill, A.; Provencio-Dean, N.; Patel, S.I.; Estep, L.; Combs, D.; Mashaqi, S.; Gerald, L.B.; et al. Effect of wearables on sleep in healthy individuals: A randomized crossover trial and validation study. J. Clin. Sleep Med. 2020, 16, 775–783. [Google Scholar] [CrossRef]
  20. Liu, S.; Schiavon, S.; Das, H.P.; Jin, M.; Spanos, C.J. Personal thermal comfort models with wearable sensors. Build. Environ. 2019, 162, 106281. [Google Scholar] [CrossRef] [Green Version]
  21. Abdallah, M.; Clevenger, C.; Vu, T.; Nguyen, A. Sensing occupant comfort using wearable technologies. In Proceedings of the 2016 Construction Research Congress, San Juan, Puerto Rico, 31 May–2 June 2016; American Society of Civil Engineers: Reston, VA, USA, 2016; pp. 940–950. [Google Scholar]
  22. Alsaleem, F.; Tesfay, M.K.; Rafaie, M.; Sinkar, K.; Besarla, D.; Arunasalam, P. An IoT framework for modeling and controlling thermal comfort in buildings. Front. Built Environ. 2020, 6, 87. [Google Scholar] [CrossRef]
  23. Sugimoto, C. Human sensing using wearable wireless sensors for smart environments. In Proceedings of the 7th International Conference on Sensor Technologies and Applications, Barcelona, Spain, 25–31 August 2013; ICST: Saitama, Japan, 2013; pp. 188–192. [Google Scholar]
  24. Jeff, C.-C.; Huang, R.Y.; Newman, M.W. The potential and challenges of inferring thermal comfort at home using commodity sensors. In Proceedings of the 2015 ACM International Joint Conference on Pervasive and Ubiquitous Computing, Osaka, Japan, 7–11 September 2015; ACM: New York, NY, USA, 2015; pp. 1089–1100. [Google Scholar]
  25. Ghahramani, A.; Castro, G.; Becerik-Gerber, B.; Yu, X. Infrared thermography of human face for monitoring thermoregulation performance and estimating personal thermal comfort. Build. Environ. 2016, 109, 1–11. [Google Scholar] [CrossRef] [Green Version]
  26. Nkurikiyeyezu, K.N.; Suzuki, Y.; Tobe, Y.; Lopez, G.F.; Itao, K. Heart rate variability as an indicator of thermal comfort state. In Proceedings of the 56th Annual Conference of the Society of Instrument and Control Engineers of Japan, Kanazawa, Japan, 19–22 September 2017; pp. 1510–1512. [Google Scholar]
  27. Li, D.; Menassa, C.C.; Kamat, V. Personalized human comfort in indoor building environments under diverse conditioning modes. Build. Environ. 2017, 126, 304–317. [Google Scholar] [CrossRef]
  28. Kim, J.; Zhou, Y.; Schiavon, S.; Raftery, P.; Brager, G. Personal comfort models: Predicting individuals’ thermal preference using occupant heating and cooling behavior and machine learning. Build. Environ. 2018, 129, 96–106. [Google Scholar] [CrossRef] [Green Version]
  29. Akane, S.; Phillips, A.J.; Amy, Z.Y.; McHill, A.W.; Taylor, S.; Jaques, N.; Czeisler, C.A.; Klerman, B.E.; Picard, R.W. Recognizing academic performance, sleep quality, stress level, and mental health using personality traits, wearable sensors and mobile phones. In Proceedings of the IEEE 12th International Conference on Wearable and Implantable Body Sensor Networks (BSN), Cambridge, MA, USA, 9–12 July 2015; IEEE: Piscataway, NJ, USA, 2015; pp. 1–6. [Google Scholar]
  30. Bunde, A.; Havlin, S.; Kantelhardt, J.W.; Penzel, T.; Peter, J.-H.; Voigt, K. Correlated and Uncorrelated Regions in Heart-Rate Fluctuations during Sleep. Phys. Rev. Lett. 2000, 85, 3736–3739. [Google Scholar] [CrossRef] [Green Version]
  31. Snyder, F.; Hobson, J.A.; Morrison, D.F.; Goldfrank, F. Changes in respiration, heart rate, and systolic blood pressure in human sleep. J. Appl. Physiol. 1964, 19, 417–422. [Google Scholar] [CrossRef]
  32. Kräuchi, K. How is the circadian rhythm of core body temperature regulated? Clin. Auton. Res. 2002, 12, 147–149. [Google Scholar] [CrossRef]
  33. de Arriba-Pérez, F.; Caeiro-Rodríguez, M.; Santos-Gago, J.M. How do you sleep? Using off the shelf wrist wearables to estimate sleep quality, sleepiness level, chronotype and sleep regularity indicators. J. Ambient. Intell. Humaniz. Comput. 2018, 9, 897–917. [Google Scholar] [CrossRef]
  34. Sadeh, A.; Mindell, J.A.; Luedtke, K.; Wiegand, B. Sleep and sleep ecology in the first 3 years: A web-based study. J. Sleep Res. 2009, 18, 60–73. [Google Scholar] [CrossRef] [PubMed]
  35. Sadeh, A. The role and validity of actigraphy in sleep medicine: An update. Sleep Med. Rev. 2011, 15, 259–267. [Google Scholar] [CrossRef] [PubMed]
  36. Available online: https://www.fitbit.com/global/se/home (accessed on 20 September 2021).
  37. Available online: https://news.microsoft.com/uploads/2016/01/Band-Fact-Sheet.pdf (accessed on 20 September 2021).
  38. Chaudhry, B.M. Sleeping with an Android. mHealth 2017, 3, 7. [Google Scholar] [CrossRef] [PubMed] [Green Version]
  39. Altini, M.; Hannu, K. The Promise of Sleep: A Multi-Sensor Approach for Accurate Sleep Stage Detection Using the Oura Ring. Sensors 2021, 21, 4302. [Google Scholar] [CrossRef]
  40. Zambotti, M.; Rosas, L.; Colrain, I.M.; Baker, F.C. The sleep of the ring: Comparison of the ŌURA sleep tracker against polysomnography. Behav. Sleep Med. 2019, 17, 124–136. [Google Scholar] [CrossRef]
  41. GitHub. 2021. Available online: beamandrew/deep_learning_works (accessed on 20 September 2021).
  42. Francisco, M.M.C.; Alves-Souza, S.N.; Campos, E.G.L.; De Souza, L.S. Total data quality management and total information quality management applied to costumer relationship management. In Proceedings of the 9th International Conference on Information Management and Engineering, Barcelona, Spain, 9–11 October 2017. [Google Scholar]
  43. Team, O. Your Oura Temperature—The Pulse Blog. 2021. Available online: https://ouraring.com/blog/your-body-temperature-and-oura/ (accessed on 20 September 2021).
  44. Team, O. Your Oura Activity Score—The Pulse Blog. 2021. Available online: https://ouraring.com/blog/activity-score/ (accessed on 20 September 2021).
  45. Oura Help. Readiness Scores—The Pulse Blog. 2021. Available online: https://ouraring.com/blog/readiness-score/ (accessed on 20 September 2021).
  46. Oura Help. A Guide to Restfullness. 2020. Available online: https://support.ouraring.com/hc/en-us/articles/360057792293-A-Guide-to-Your-Sleep-Contributors (accessed on 20 September 2021).
  47. Lan, L.; Lian, Z. Ten questions concerning thermal environment and sleep quality. Build. Environ. 2016, 99, 252–259. [Google Scholar] [CrossRef]
  48. SHD100/SHD101 Duct Humidity Sensor with Temperature. 2020. Available online: https://www.se.com/ww/en/download/document/003-00109/ (accessed on 20 September 2021).
  49. Oura Help. Active Calorie Burn vs. Total Burn. 2020. Available online: https://support.ouraring.com/hc/en-us/articles/360025430914-Active-Calorie-Burn-vs-Total-Burn (accessed on 20 September 2021).
  50. Oura Help. An Introduction to Your Sleep Score. 2021. Available online: https://support.ouraring.com/hc/en-us/articles/360025445574-An-Introduction-to-Your-Sleep-Score (accessed on 20 September 2021).
  51. Fogliaroni, P.; D’Antonio, F.; Clementini, E. Data trustworthiness and user reputation as indicators of VGI quality. Geo. Spat. Inf. Sci. 2018, 21, 213–233. [Google Scholar] [CrossRef] [Green Version]
  52. Friedland, G.; Kerll, M. A Capacity Scaling Law for Artificial Neural Networks. arXiv 2018, arXiv:1708.06019. Available online: https://arxiv.org/abs/1708.06019 (accessed on 20 September 2021).
  53. Abu-Mostafa, Y. Hints. Neural Comput. 1995, 7, 639–671. [Google Scholar] [CrossRef]
  54. Baum, E.; Haussler, D. What Size Net Gives Valid Generalization? Neural Comput. 1989, 1, 151–160. [Google Scholar] [CrossRef]
  55. Hervé, B.; Goodrich, M.T. Almost optimal set covers in finite VC-dimension. Discret. Comput. Geom. 1995, 14, 463–479. [Google Scholar]
  56. Marvuglia; Antonino; Messineo, A.; Nicolosi, G. Coupling a neural network temperature predictor and a fuzzy logic controller to perform thermal comfort regulation in an office building. Build. Environ. 2014, 72, 287–299. [Google Scholar] [CrossRef]
  57. Beklemysheva, A. Why Use Python for AI and Machine Learning? 2021. Available online: https://steelkiwi.com/blog/python-for-ai-and-machine-learning/ (accessed on 20 September 2021).
  58. Ortiz-Rodríguez, J.M.; del Rosario Martínez-Blanco, M.; Viramontes, J.M.C.; Vega-Carrillo, H.R. Robust Design of Artificial Neural Networks Methodology in Neutron Spectrometry. In Artificial Neural Networks Architectures and Applications; IntechOpen: London, UK, 2013. [Google Scholar]
  59. Brownlee, J. A Gentle Introduction to the Rectified Linear Unit (ReLU). 2019. Available online: https://machinelearningmastery.com/rectified-linear-activation-function-for-deep-learning-neural-networks/ (accessed on 20 September 2021).
  60. Brownlee, J. How to Choose Loss Functions When Training Deep Learning Neural Networks. 2019. Available online: https://machinelearningmastery.com/how-to-choose-loss-functions-when-training-deep-learning-neural-networks/ (accessed on 20 September 2021).
  61. Kingma, D.P.; Ba, J. Adam: A Method for Stochastic Optimization. In Proceedings of the 3rd International Conference for Learning Representations, San Diego, CA, USA, 7–9 May 2015. [Google Scholar]
  62. Brownlee, J. Gentle Introduction to the Adam Optimization Algorithm for Deep Learning. 2017. Available online: https://machinelearningmastery.com/adam-optimization-algorithm-for-deep-learning/ (accessed on 20 September 2021).
  63. Afaq, S.; Rao, S. Significance Of Epochs On Training A Neural Network. Int. J. Sci. Technol. Res. 2020, 19, 485–488. [Google Scholar]
  64. Kandel, I.; Castelli, M. The effect of batch size on the generalizability of the convolutional neural networks on a histopathology dataset. ICT Express 2020, 6, 312–315. [Google Scholar] [CrossRef]
  65. Uhs.uga.edu. University Health Center, Managing Stress, Sleep. 2021. Available online: https://healthcenter.uga.edu/bewelluga-and-learn-about-managing-stress-sleep/ (accessed on 20 September 2021).
Figure 1. Research domain intersection: occupant wellbeing and building operation.
Buildings 11 00459 g001
Figure 2. Study system boundaries.
Buildings 11 00459 g002
Figure 3. OURA ring detailed image.
Buildings 11 00459 g003
Figure 4. Research process.
Buildings 11 00459 g004
Figure 5. ETL data pipeline during the different stages of this project.
Buildings 11 00459 g005
Figure 6. Loss/Epoch testing results.
Buildings 11 00459 g006
Figure 7. The ANN structure of our model.
Buildings 11 00459 g007
Figure 8. Visual representation of the ReLU activation function.
Buildings 11 00459 g008
Figure 9. Sleep score vs. relative humidity.
Buildings 11 00459 g009
Figure 10. Sleep score vs. temperature.
Buildings 11 00459 g010
Figure 11. Loss/epoch results.
Buildings 11 00459 g011
Figure 12. Predicted/actual sleep scores.
Buildings 11 00459 g012
Publisher’s Note: MDPI stays neutral with regard to jurisdictional claims in published maps and institutional affiliations.

