
Determination of Thermal Comfort Zones through Comparative Analysis between Different Characterization Methods of Thermally Dissatisfied People


Abstract
:1. Introduction
2. Background
3. Materials and Methods
3.1. Selection, Sizing and Characterization of the Sample
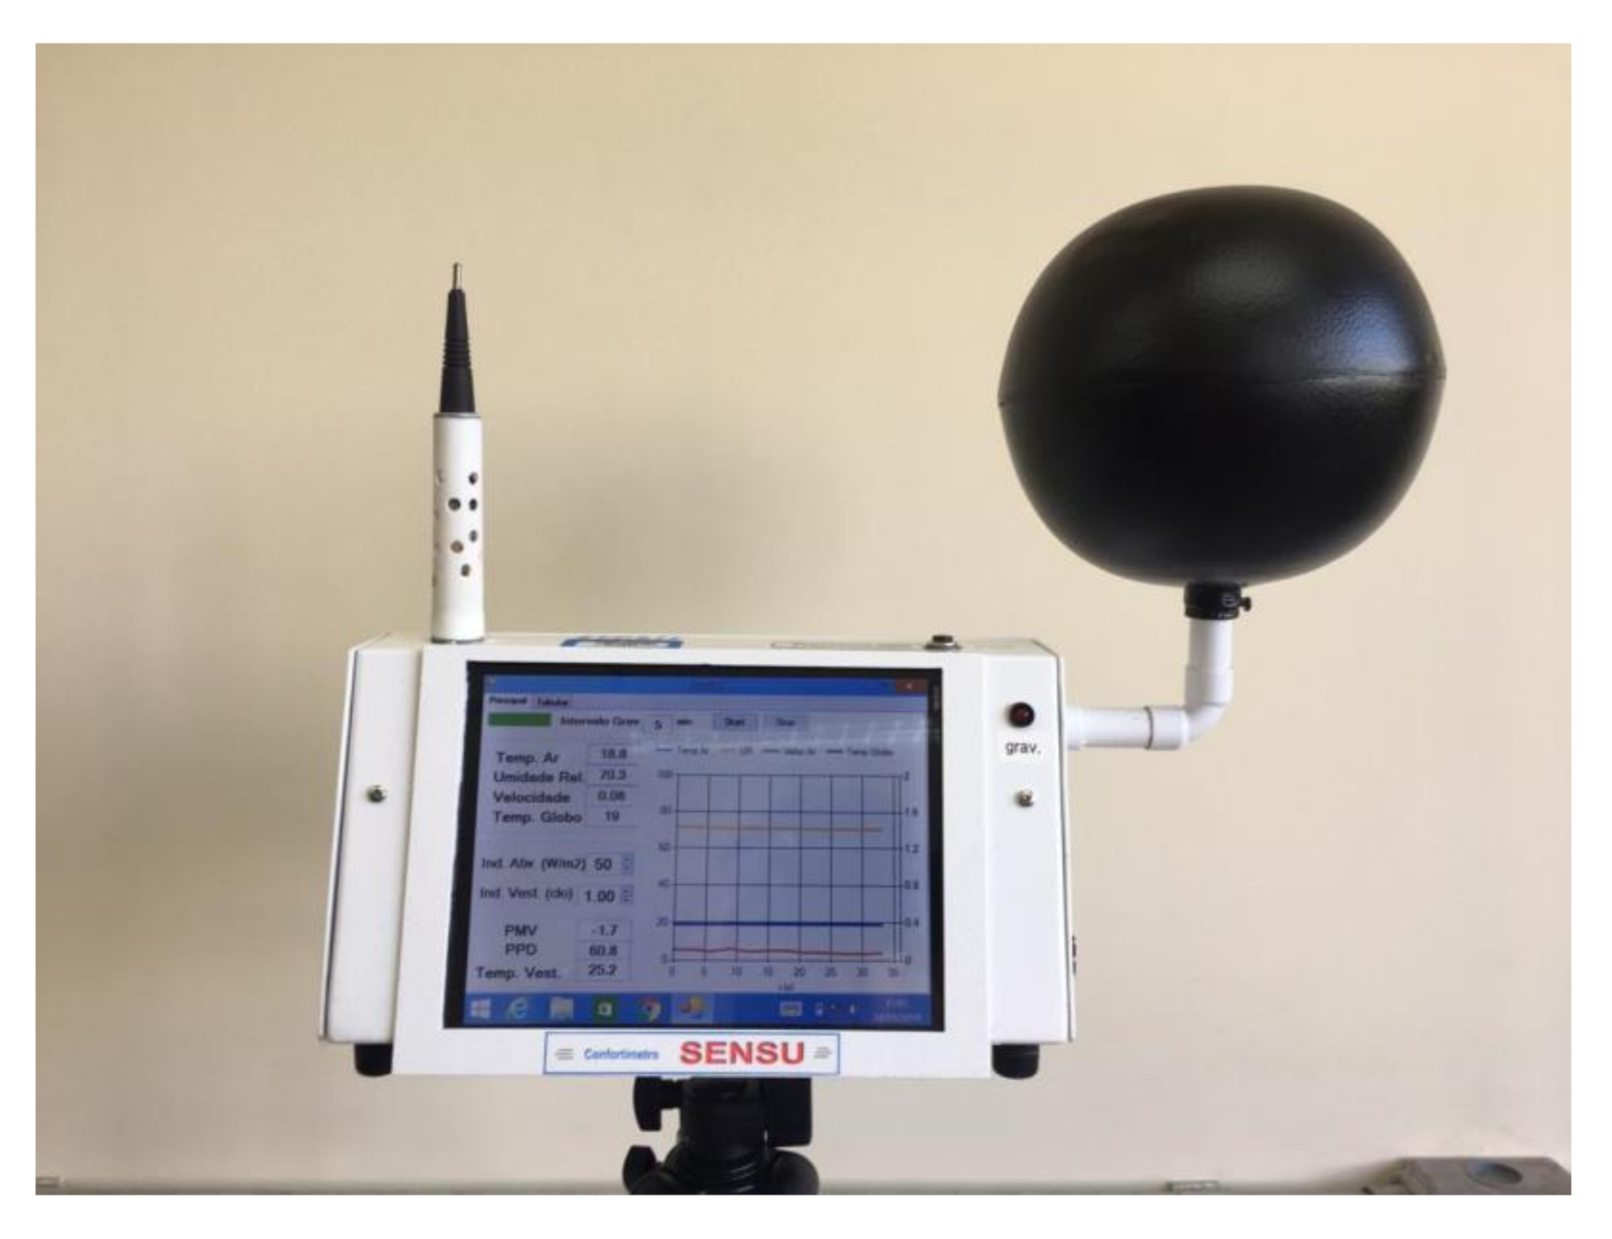
3.2. Experimental Measurement Design
3.3. Comfort Temperature Analysis Using AMV
3.4. Methodology for Predicting the Actual Percentage of Dissatisfied (APD)
3.5. Thermal Comfort Zones Proposition
4. Results
4.1. Preliminary Results
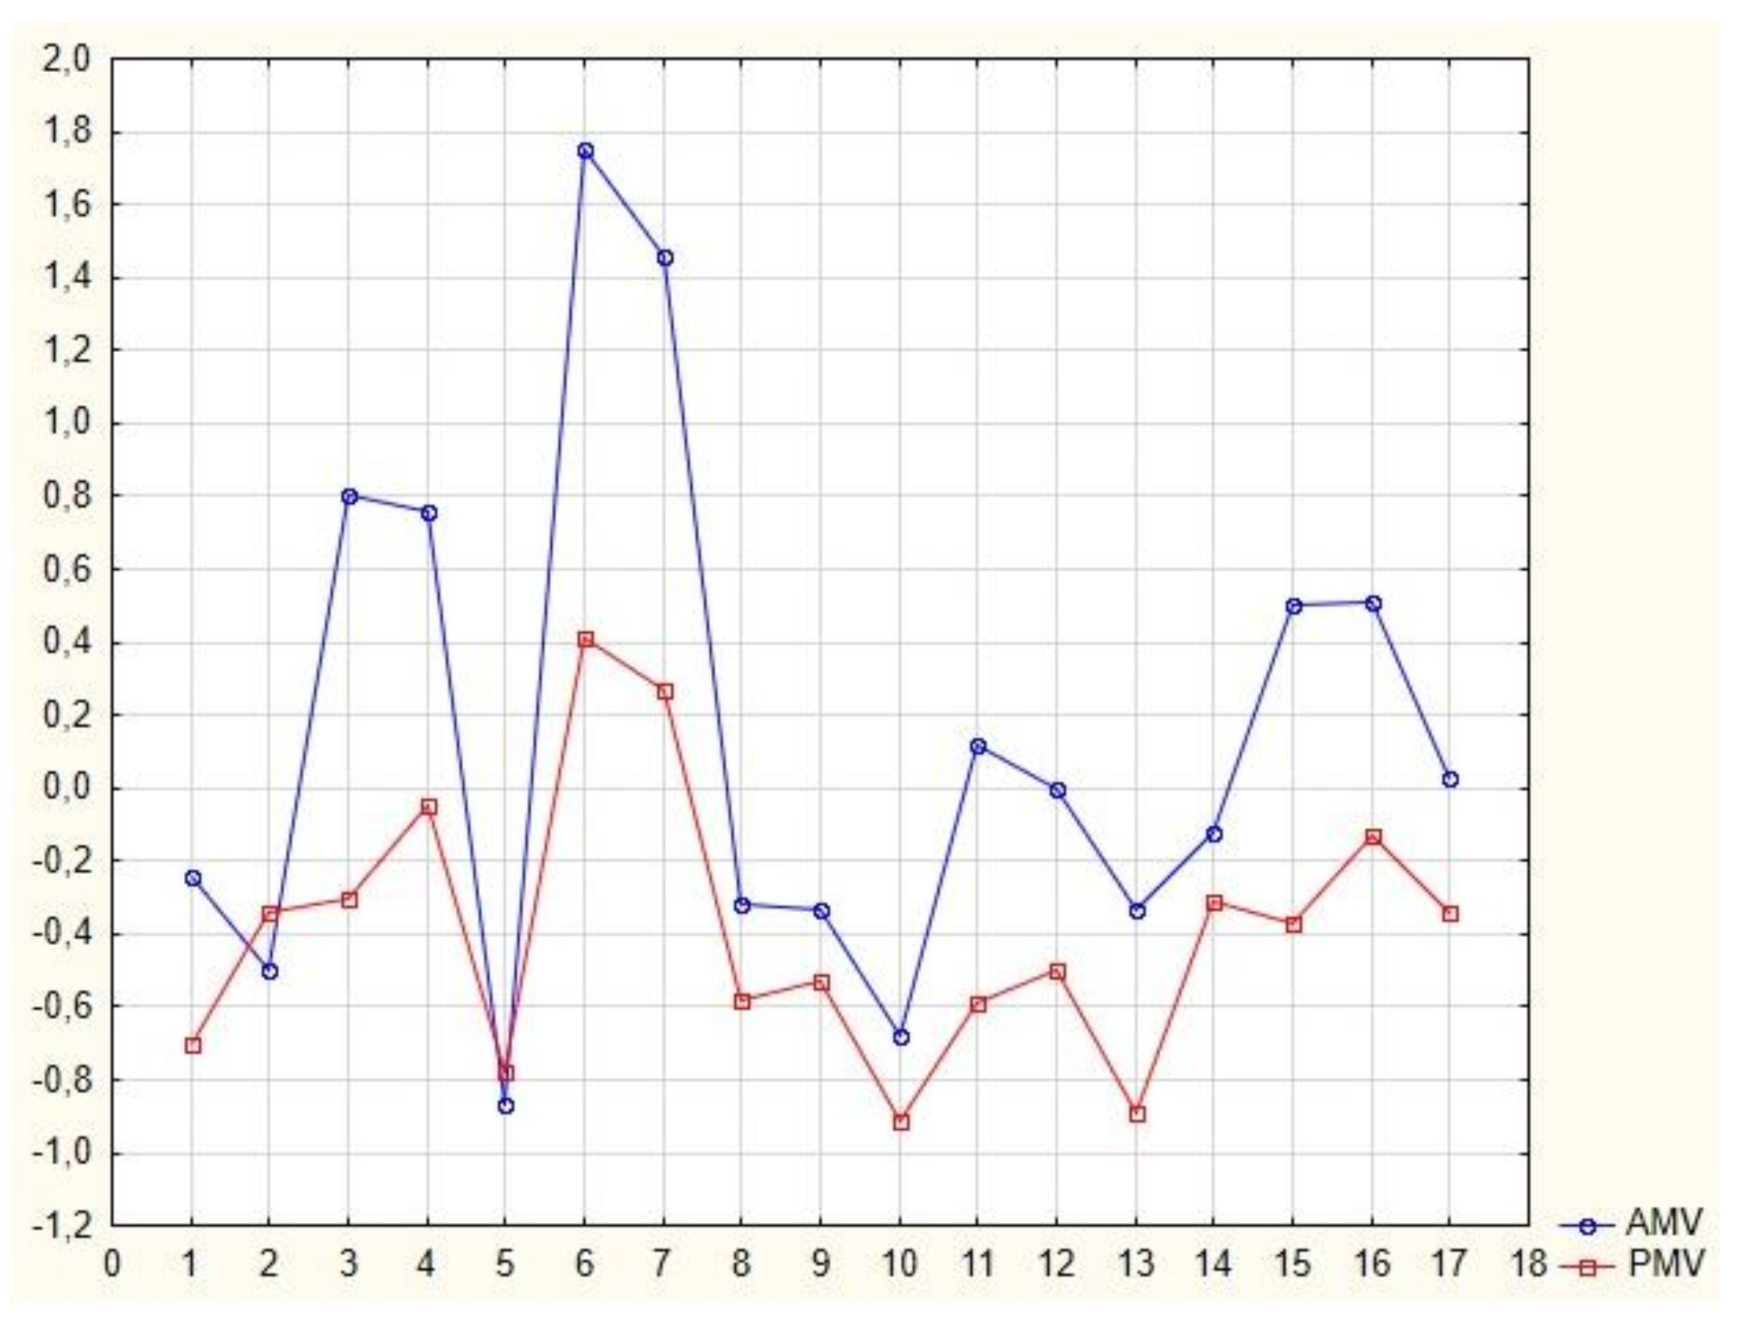
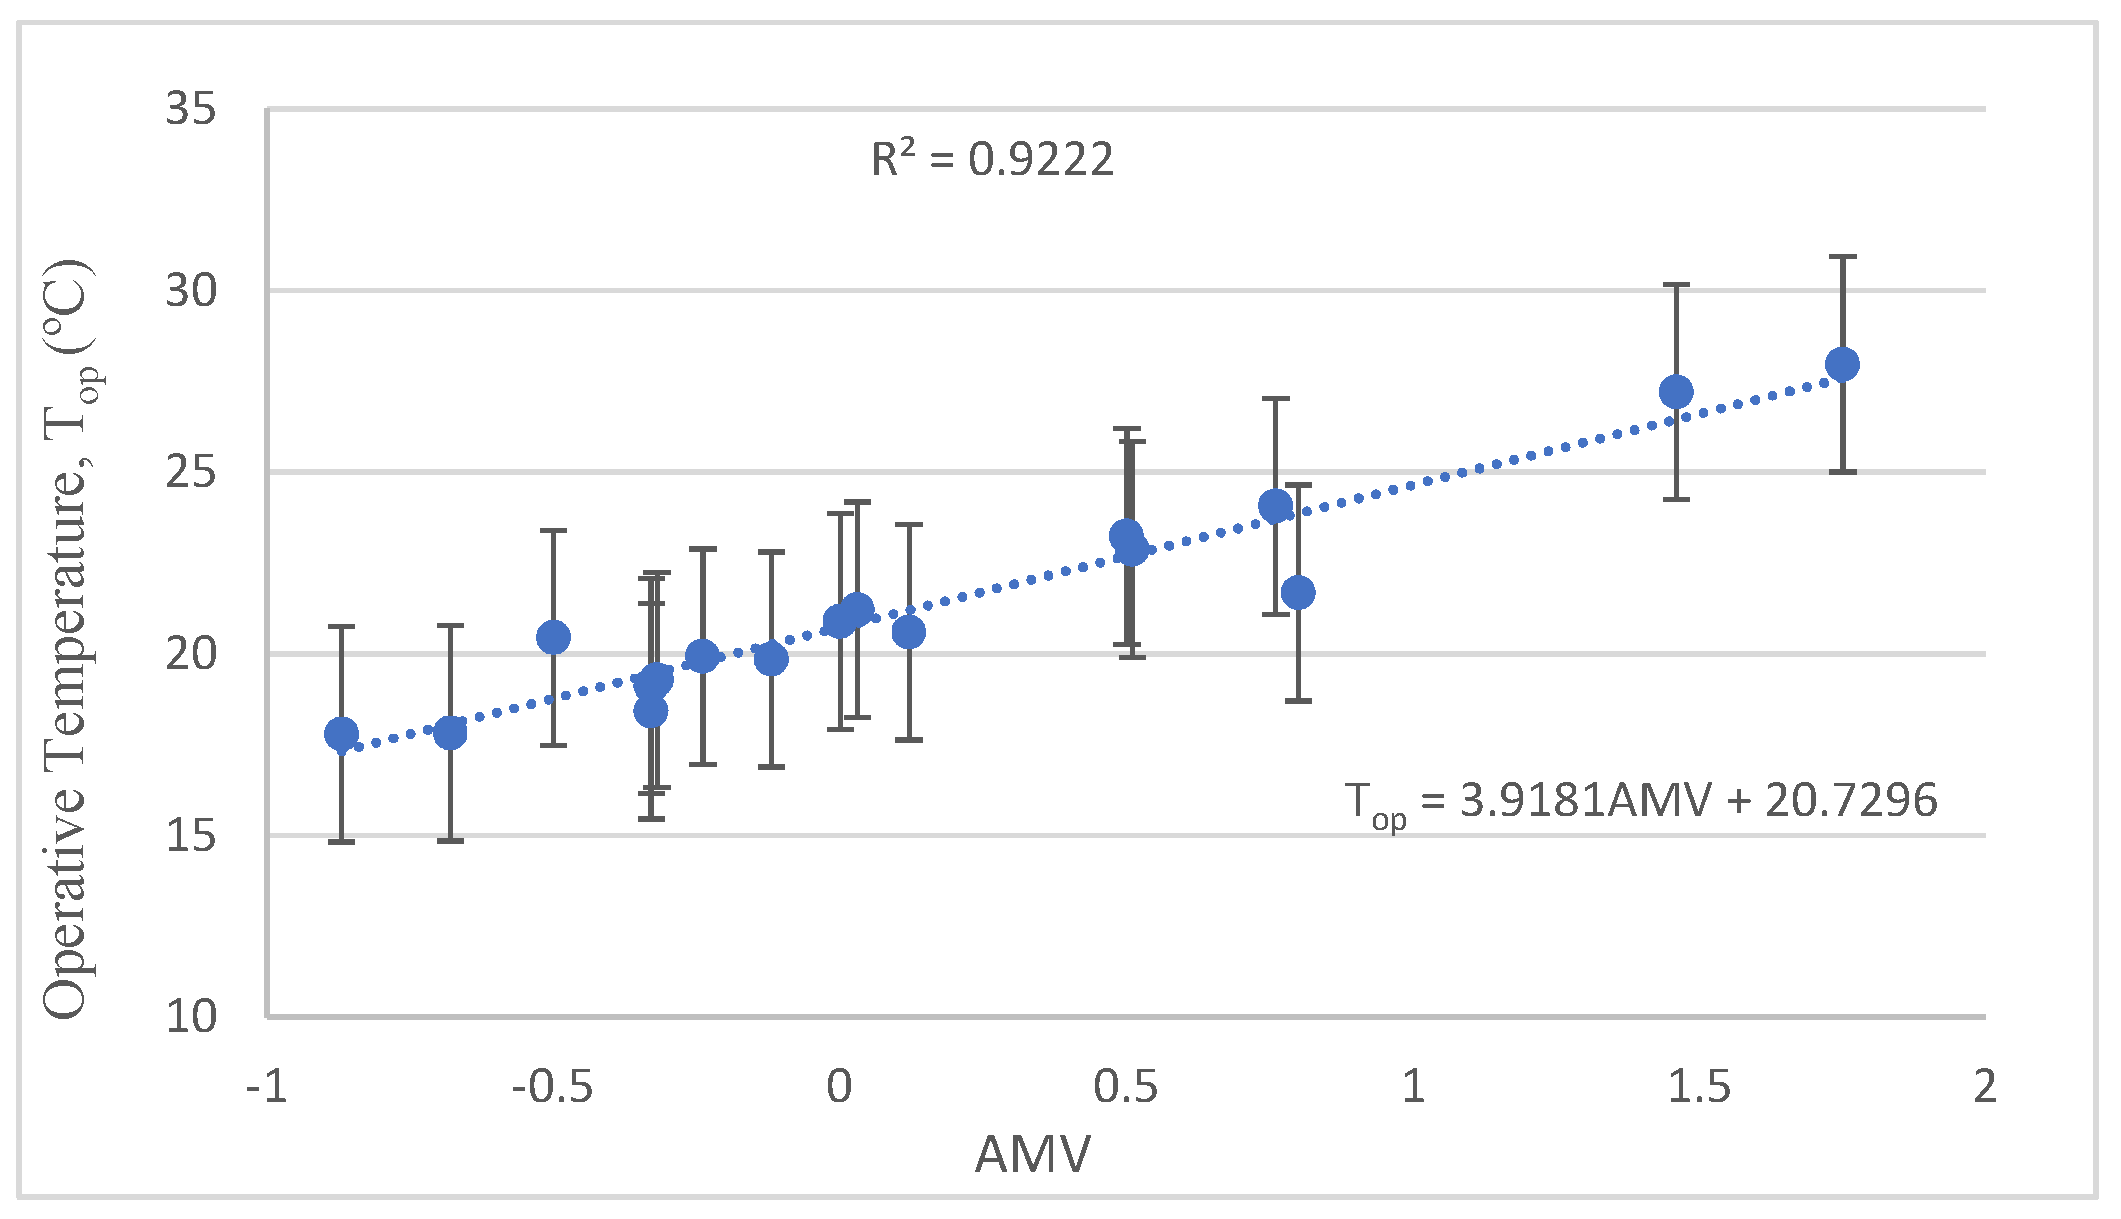
4.2. Comfort Temperature (Neutral Top) Analysis Using AMV
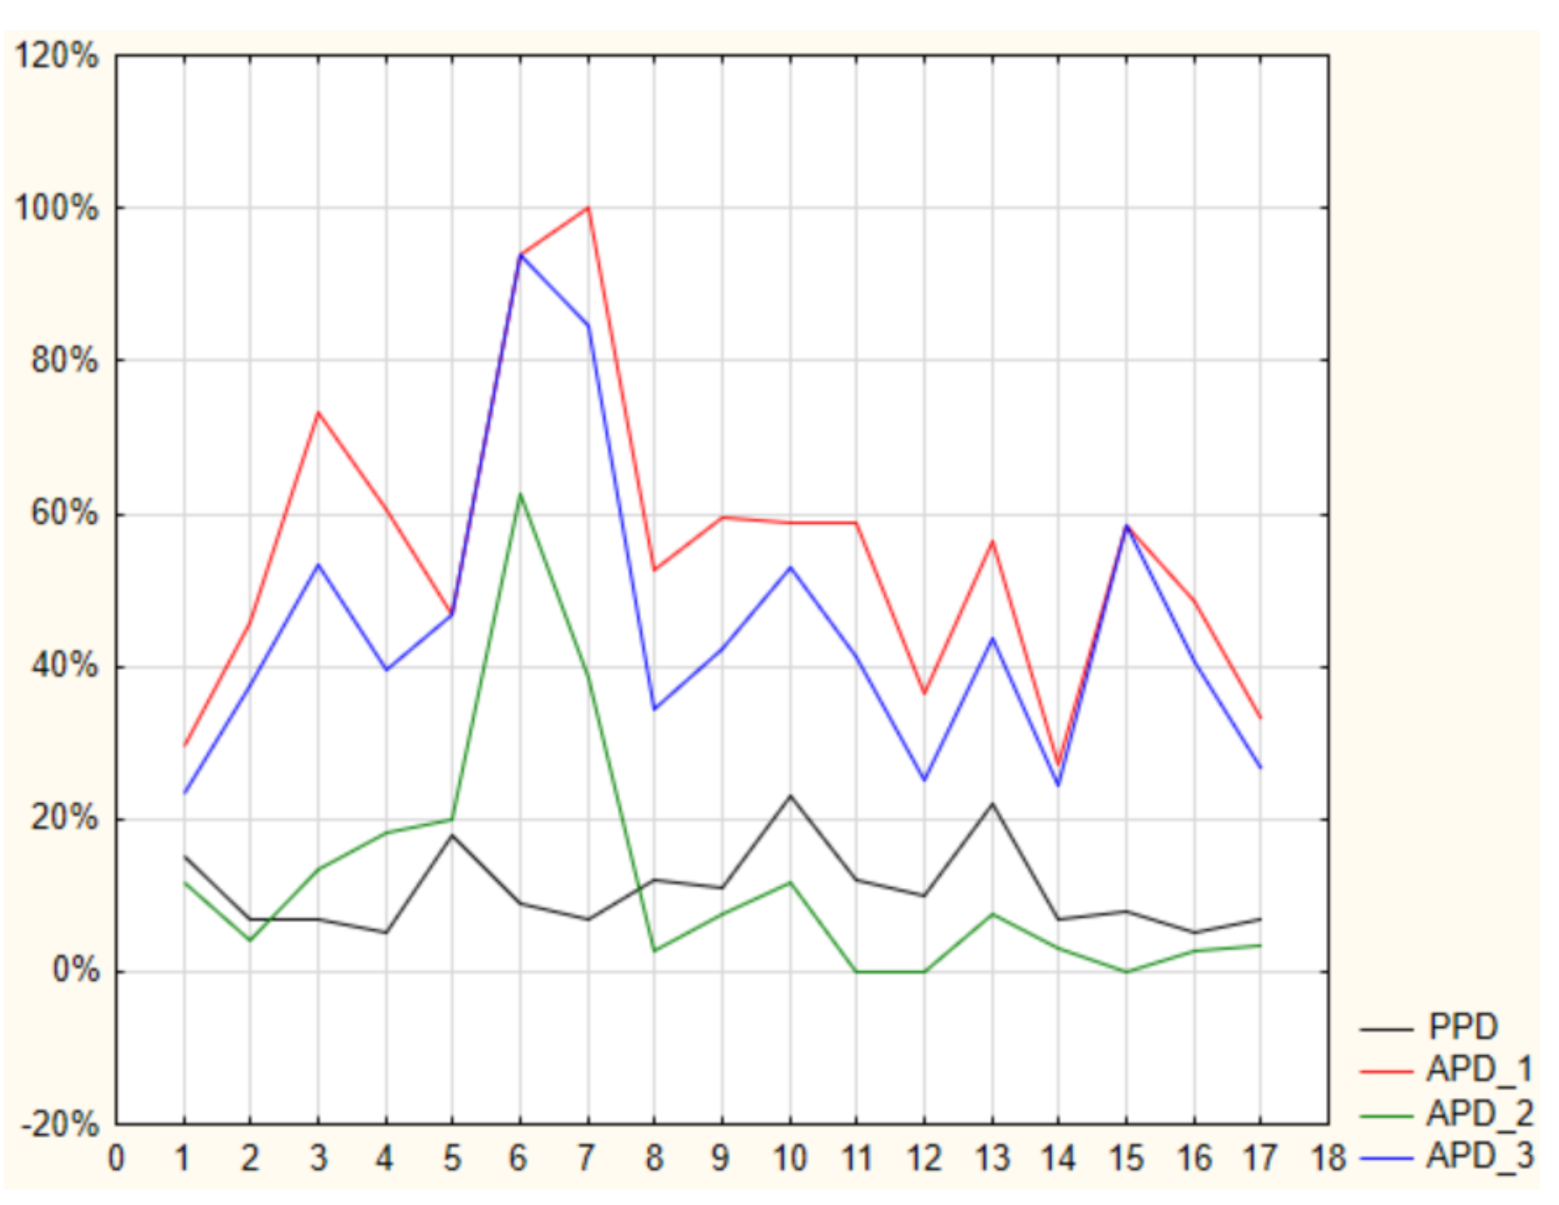
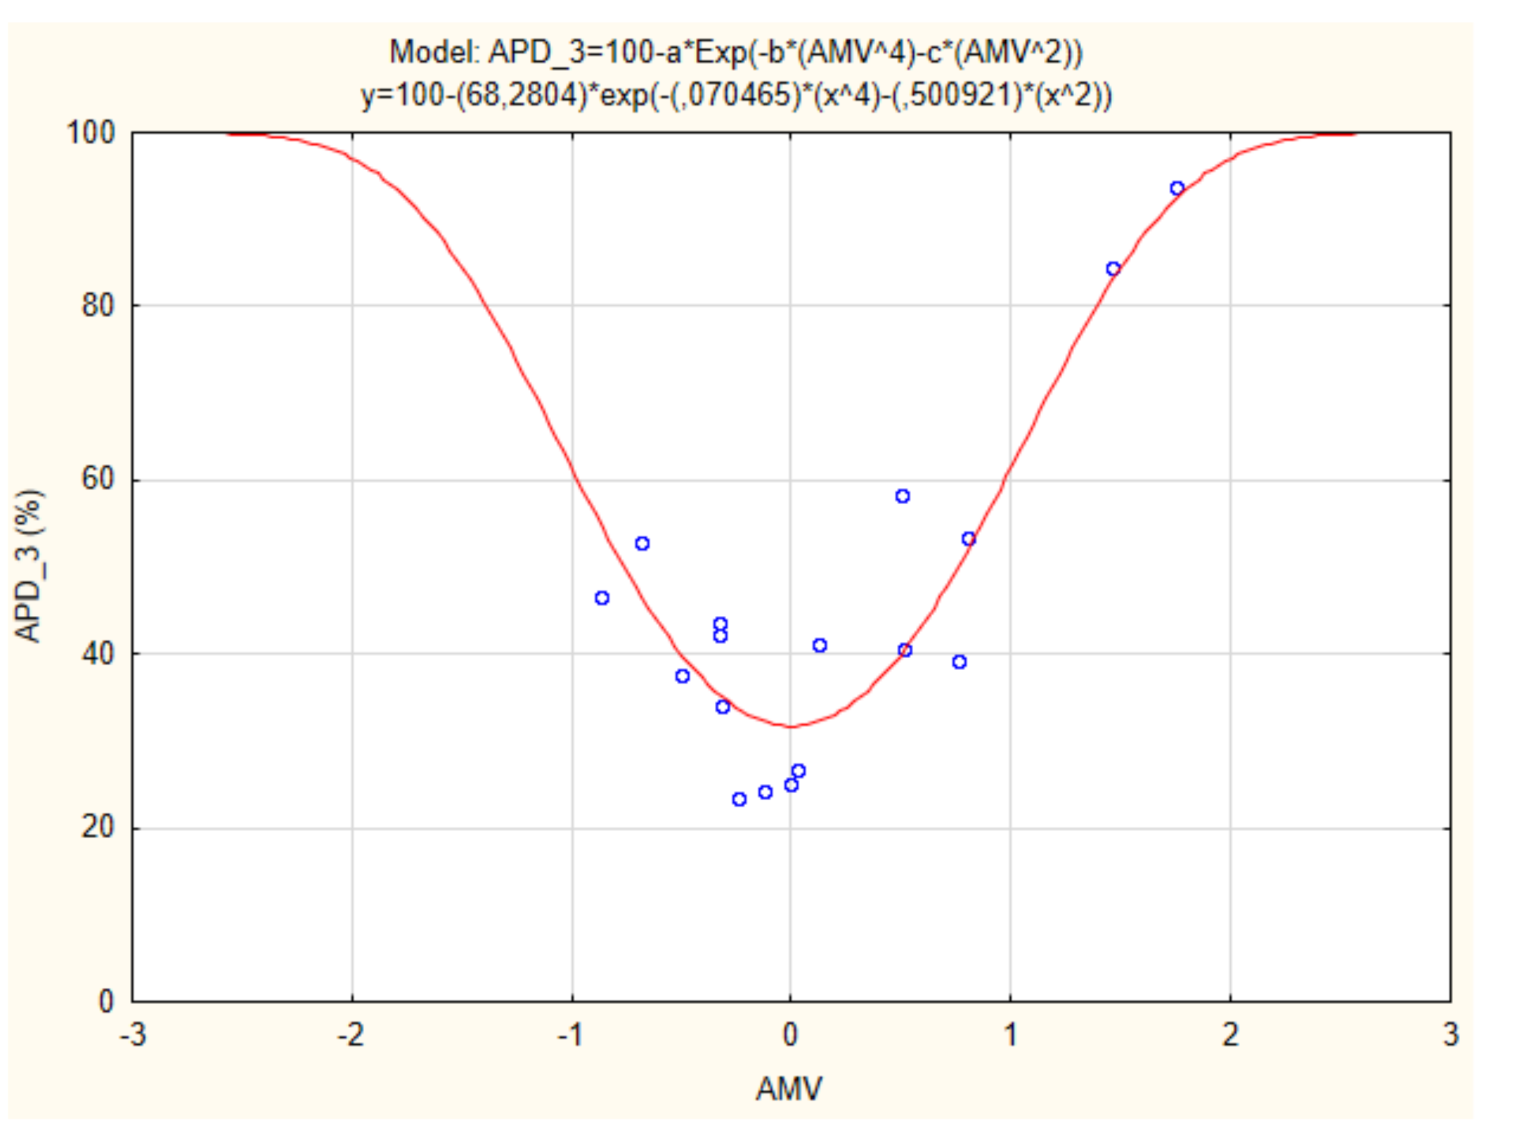
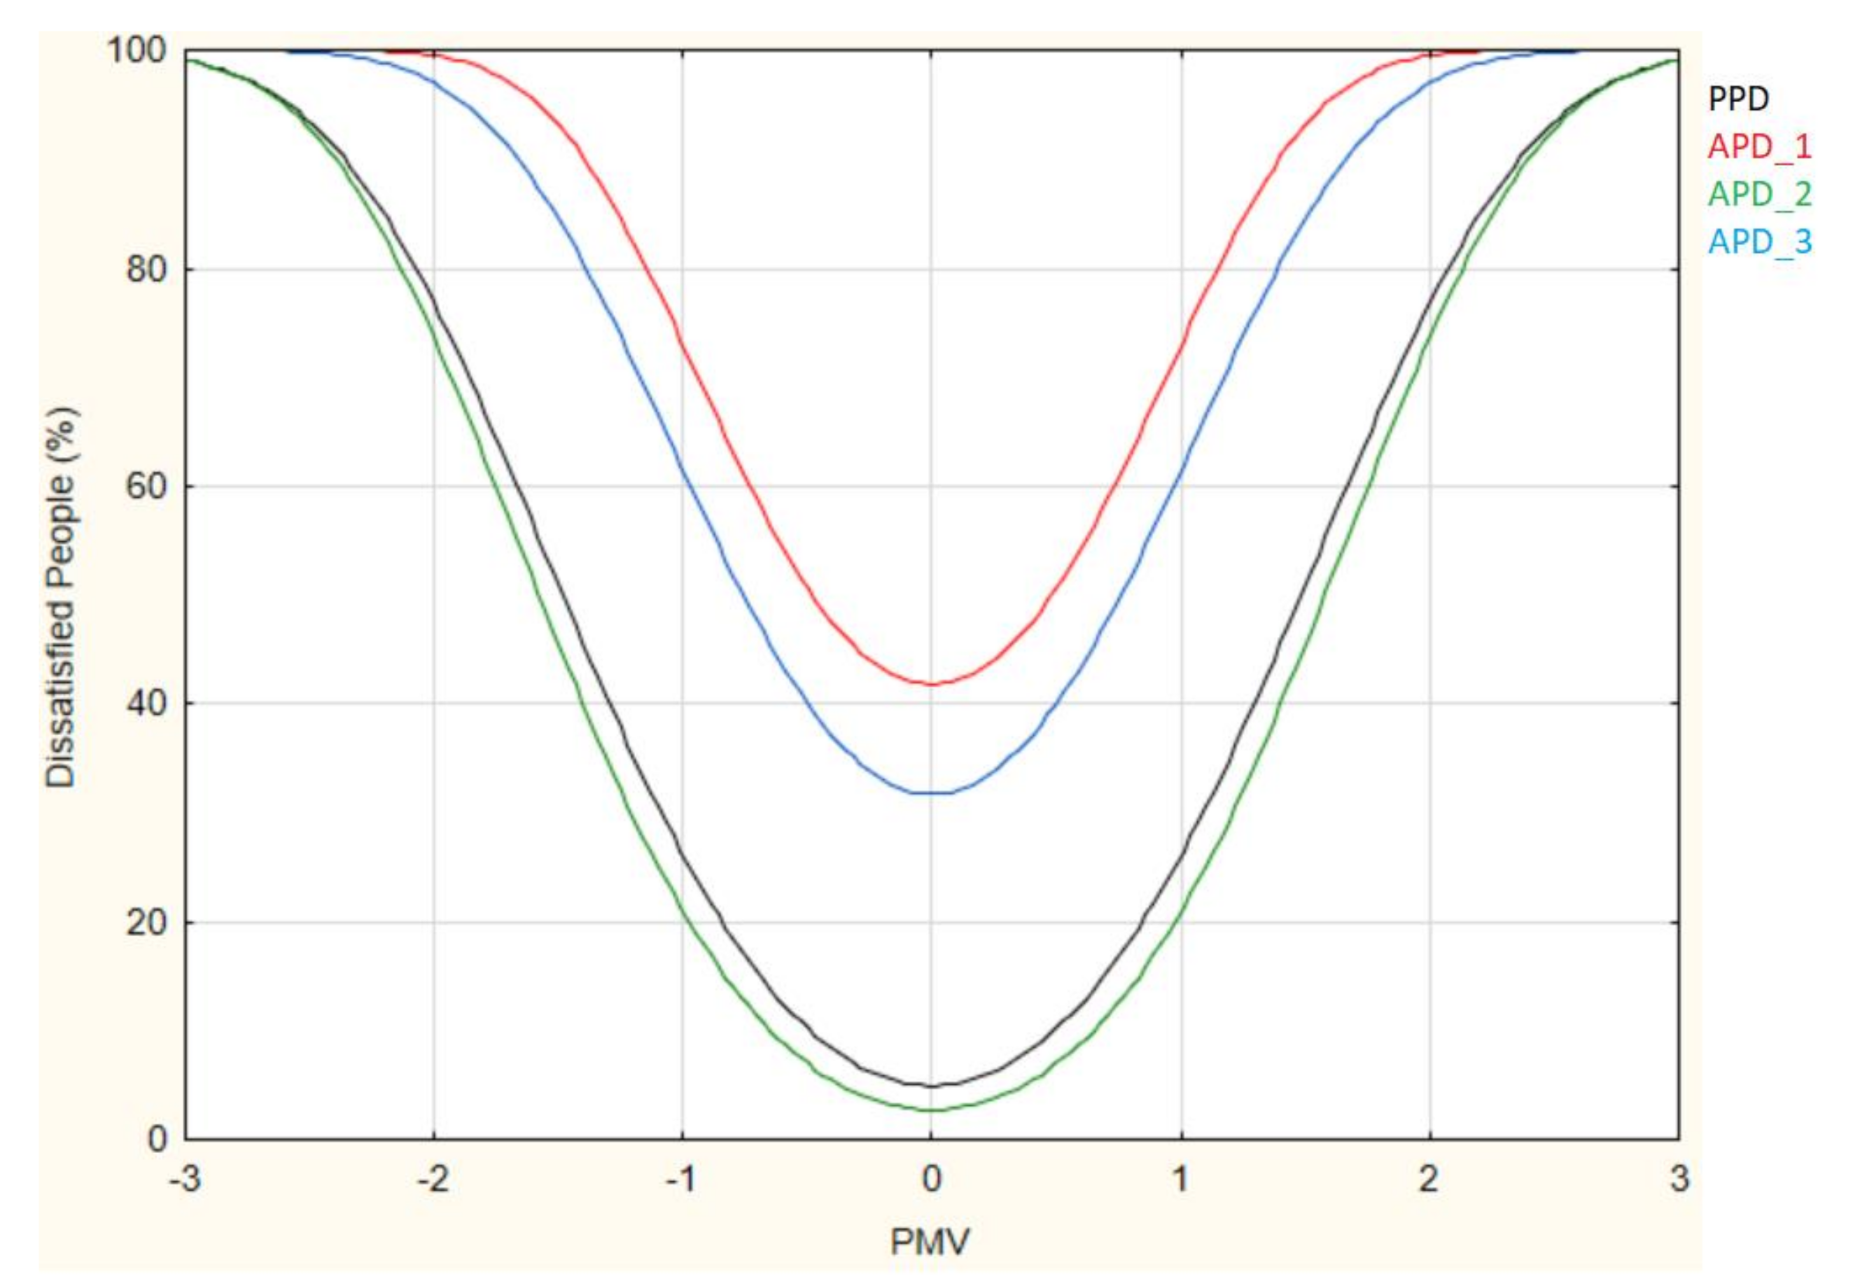
4.3. Determination of APD Curves
4.4. Construction of Thermal Comfort Zones
5. Discussions and Conclusions
6. Study Limitations
Author Contributions
Funding
Institutional Review Board Statement
Informed Consent Statement
Data Availability Statement
Conflicts of Interest
Nomenclature
| AMV | Actual Mean Vote |
| APD | Actual Percentage of Dissatisfied |
| HVAC | Heating, Ventilation and Air-Conditioning |
| IEQ | Indoor Environmental Quality |
| MTS | Mean Thermal Sensation |
| MTS | Mean Thermal Sensation Vote |
| PMV | Predicted Mean Vote |
| PPD/PD/PDacc | Predicted Percentage of Dissatisfied |
| TCZ | Thermal Comfort Zones |
| To/Top | Operative Temperature |
| TSV | Thermal Sensation Vote |
Appendix A. Thermal Comfort Questionnaire
- (1)
- Mark the clothes you are wearing (Adapted from ISO 9920/2007):
Underwear Pants T-shirts, Sweaters and Coats Accessories Leotard Shorts Sleeveless waistcoat Shoes with leather soles Knickers Pants fine material Fine T-shirt Shoes with rubber soles Bra Jeans Thick T-shirt Sneakers Underpants Farming pants Coat Boots Shirts, Blouses Dresses and Skirts Thick jumper Fine sweater Short-sleeved shirt Short skirt Fine blazer Ankle socksBoots Long-sleeved shirt fine material Long skirt Thick blazer Knee-length socks Normal long-sleeved shirt Short-sleeved dress T-shirt GlovesBoots Flannel shirt Long-sleeved dress Tights Fine, light blouse, long sleeves Normal dress Tie/Ribbon - (2)
- Considering your thermal sensation, how are you feeling? (ISO 7730/2005)
+3 Hot +2 Warm +1 Slightly warm 0 Neutral −1 Slightly cool −2 Cool −3 Cold - (3)
- Considering your thermal preference, how would you like to be feeling? (ISO 10551/1995)
+3 Much warmer +2 Warmer +1 A little warmer 0 Neither warmer nor cooler −1 Slightly cooler −2 Cooler −3 Much cooler
References
- Geng, Y.; Ji, W.; Lin, B.; Zhu, Y. The impact of thermal environment on occupant IEQ perception and productivity. Build. Environ. 2017, 121, 158–167. [Google Scholar] [CrossRef]
- Broday, E.E.; Ruivo, C.R.; Gameiro da Silva, M. The use of Monte Carlo method to assess the uncertainty of thermal comfort indices PMV and PPD: Benefits of using a measuring set with an operative temperature probe. J. Build. Eng. 2021, 35, 101961. [Google Scholar] [CrossRef]
- Märzinger, T.; Österreicher, D. Supporting the Smart Readiness Indicator—A Methodology to Integrate A Quantitative Assessment of the Load Shifting Potential of Smart Buildings. Energies 2019, 12, 1955. [Google Scholar] [CrossRef] [Green Version]
- Zaki, S.A.; Damiati, S.A.; Rijal, H.B.; Hagishima, A.; Abd Razak, A. Adaptive thermal comfort in university classrooms in Malaysia and Japan. Build. Environ. 2017, 122, 294–306. [Google Scholar] [CrossRef]
- Zhao, M.; Gu, Z.L.; Kang, W.B.; Liu, X.; Zhang, L.Y.; Jin, L.W.; Zhang, Q.L. Experimental investigation and feasibility analysis on a capillary radiant heating system based on solar and air source heat pump dual heat source. Appl. Energy 2017, 185, 2094–2105. [Google Scholar] [CrossRef]
- Li, B.; Du, C.; Yao, R.; Yu, W.; Costanzo, V. Indoor thermal environments in Chinese residential buildings responding to the diversity of climates. Appl. Therm. Eng. 2018, 129, 693–708. [Google Scholar] [CrossRef]
- Indraganti, M.; Ooka, R.; Rijal, H.B.; Brager, G.S. Adaptive model of thermal comfort for offices in hot and humid climates of India. Build. Environ. 2014, 74, 39–53. [Google Scholar] [CrossRef]
- Kumar, S.; Mathur, J.; Mathur, S.; Singh, M.K.; Loftness, V. An adaptive approach to define thermal comfort zones on psychrometric chart for naturally ventilated buildings in composite climate of India. Build. Environ. 2016, 109, 135–153. [Google Scholar] [CrossRef] [Green Version]
- Buratti, C.; Moretti, E.; Belloni, E.; Cotana, F. Unsteady simulation of energy performance and thermal comfort in non-residential buildings. Build. Environ. 2013, 59, 482–491. [Google Scholar] [CrossRef]
- Li, P.; Parkinson, T.; Brager, G.; Schiavon, S.; Cheung, T.C.T.; Froese, T. A data-driven approach to defining acceptable temperature ranges in buildings. Build. Environ. 2019, 153, 302–312. [Google Scholar] [CrossRef] [Green Version]
- Noversa, R.; Silva, J.; Rodrigues, N.; Martins, L.; Teixeira, J.; Teixeira, S. Thermal Simulation of a Supermarket Cold Zone with Integrated Assessment of Human Thermal Comfort. In Proceedings of the International Conference on Computational Science and Its Applications, Cagliari, Italy, 1–4 July 2020; Springer: Berlin, Germany, 2020; pp. 214–227. [Google Scholar]
- ISO—International Organization for Standardization. Ergonomics of the Thermal Environment–Analytical Determination and Interpretation of Thermal Comfort Using Calculation of the PMV and PPD Indices and Local Thermal Comfort Criteria; ISO 7730; ISO: Genebra, Switzerland, 2005. [Google Scholar]
- American Society Of Heating. ANSI/ASHRAE Standard 55-Thermal Environmental Conditions for Human Occupancy; ASHRAE: Atlanta, Georgia, 2017. [Google Scholar]
- Kumar, S.; Singh, M.K. C Seasonal comfort temperature and occupant’s adaptive behaviour in a naturally ventilated university workshop building under the composite climate of India. J. Build. Eng. 2021, 40, 102701. [Google Scholar] [CrossRef]
- Zavala, V.M. Real-time optimization strategies for building systems†. Ind. Eng. Chem. Res. 2013, 52, 3137–3150. [Google Scholar] [CrossRef] [Green Version]
- Djongyang, N.; Tchinda, R.; Njomo, D. Thermal comfort: A review paper. Renew. Sustain. Energy Rev. 2010, 14, X2626–X2640. [Google Scholar] [CrossRef]
- Mui, K.W.; Tsang, T.W.; Wong, L.T. Bayesian updates for indoor thermal comfort models. J. Build. Eng. 2020, 29, 101117. [Google Scholar] [CrossRef]
- Van Hoof, J. Forty years of Fanger’s model of thermal comfort: Comfort for all? Indoor Air 2008, 18, 182–201. [Google Scholar] [CrossRef] [PubMed]
- Oseland, N.A. Predicted and reported thermal sensation in climate chambers, offices and homes. Energy Build. 1995, 23, 105–115. [Google Scholar] [CrossRef]
- Han, J.; Zhang, G.; Zhang, Q.; Zhang, J.; Liu, J.; Tian, L.; Zheng, C.; Hao, J.; Lin, J.; Liu, Y.; et al. Field study on occupants’ thermal comfort and residential thermal environment in a hot-humid climate of China. Build. Environ. 2007, 42, 4043–4050. [Google Scholar] [CrossRef]
- Schiavon, S.; Melikov, A.K. Energy saving and improved comfort by increased air movement. Energy Build. 2008, 40, 1954–1960. [Google Scholar] [CrossRef] [Green Version]
- Corgnati, S.P.; Filippi, M.; Viazzo, S. Perception of the thermal environment in high school and university classrooms: Subjective preferences and thermal comfort. Build. Environ. 2007, 42, 951–959. [Google Scholar] [CrossRef]
- Yao, R.; Liu, J.; Li, B. Occupants’ adaptive responses and perception of thermal environment in naturally conditioned university classrooms. Appl. Energy 2010, 87, 1015–1022. [Google Scholar] [CrossRef]
- Aghniaey, S.; Lawrence, T.M. The impact of increased cooling setpoint temperature during demand response events on occupant thermal comfort in commercial buildings: A review. Energy Build. 2018, 173, 19–27. [Google Scholar] [CrossRef]
- Hwang, R.-L.; Lin, T.-P.; Cheng, M.-J.; Chien, J.-H. Patient thermal comfort requirement for hospital environments in Taiwan. Build. Environ. 2007, 42, 2980–2987. [Google Scholar] [CrossRef]
- Park, J.Y.; Nagy, Z. Comprehensive analysis of the relationship between thermal comfort and building control research - A data-driven literature review. Renew. Sustain. Energy Rev. 2018, 82, 2664–2679. [Google Scholar] [CrossRef]
- Kim, J.; Song, D.; Kim, S.; Park, S.; Choi, Y.; Lim, H. Energy-saving potential of extending temperature set-points in a VRF air-conditioned building. Energies 2020, 13, 2160. [Google Scholar] [CrossRef]
- Broday, E.E.; de Paula Xavier, A.A. A method for predicting the actual percentage of dissatisfied (APD) through a simple proposition of thermal comfort zones in a working environment. Work 2020, 1–11. [Google Scholar] [CrossRef]
- Mayer, E. A new correlation between predicted mean votes (PMV) and predicted percentages of dissatisfied (PPD). In Proceedingsof the Conference, Heathy Buildings/IAQ ’97: Global Issues and Regional Solutions, Washington, DC, USA, 27 September–2 October 1997. [Google Scholar]
- Yoon, D.W.; Sohn, J.Y.; Cho, K.H. The comparison on the thermal comfort sensation between the results of questionnaire survey and the calculation of the PMV values. Proc Indoor Air 1999, v. 99, 137–141. [Google Scholar]
- Araújo, V.M.D.; Araújo, E.H.S. The applicability of ISO 7730 for the assessment of the thermal conditions of users of the buildings in Natal-Brazil. Proc Indoor Air 1999, 99, 148–153. [Google Scholar]
- De Paula Xavier, A.A.; Lamberts, R. Indices of thermal comfort developed from field survey in Brazil. Trans. Soc. Heat. Refrig. Air Cond. Eng. 2000, 106, 45–58. [Google Scholar]
- Wang, Z. A field study of the thermal comfort in residential buildings in Harbin. Build. Environ. 2006, 41, 1034–1039. [Google Scholar] [CrossRef]
- Hwang, R.-L.; Lin, T.-P.; Liang, H.-H.; Yang, K.-H.; Yeh, T.-C. Additive model for thermal comfort generated by matrix experiment using orthogonal array. Build. Environ. 2009, 44, 1730–1739. [Google Scholar] [CrossRef]
- Hwang, R.L.; Cheng, M.J.; Lin, T.P.; Ho, M.C. Thermal perceptions, general adaptation methods and occupant’s idea about the trade-off between thermal comfort and energy saving in hot-humid regions. Build. Environ. 2009, 44, 1128–1134. [Google Scholar] [CrossRef]
- Hwang, R.L.; Chen, C.P. Field study on behaviors and adaptation of elderly people and their thermal comfort requirements in residential environments. Indoor Air 2010, 20, 235–245. [Google Scholar] [CrossRef] [PubMed]
- Maiti, R. PMV model is insufficient to capture subjective thermal response from Indians. Int. J. Ind. Ergon. 2014, 44, 349–361. [Google Scholar] [CrossRef]
- D’Ambrosio Alfano, F.R.; Ianniello, E.; Palella, B.I. PMV–PPD and acceptability in naturally ventilated schools. Build. Environ. 2013, 67, 129–137. [Google Scholar] [CrossRef]
- Yau, Y.H.; Chew, B.T. Adaptive thermal comfort model for air-conditioned hospitals in Malaysia. Build. Serv. Eng. Res. Technol. 2014, 35, 117–138. [Google Scholar] [CrossRef]
- Zhang, F.; de Dear, R.; Candido, C. Thermal comfort during temperature cycles induced by direct load control strategies of peak electricity demand management. Build. Environ. 2016, 103, 9–20. [Google Scholar] [CrossRef] [Green Version]
- Piasecki, M.; Fedorczak-Cisak, M.; Furtak, M.; Biskupski, J. Experimental Confirmation of the Reliability of Fanger’s Thermal Comfort ModelCase Study of a Near-Zero Energy Building (NZEB) Office Building. Sustainability 2019, 11, 2461. [Google Scholar] [CrossRef] [Green Version]
- Chong, D.; Zhu, N.; Luo, W.; Zhang, Z. Broadening human thermal comfort range based on short-term heat acclimation. Energy 2019, 176, 418–428. [Google Scholar] [CrossRef]
- Wu, Z.; Li, N.; Wargocki, P.; Peng, J.; Li, J.; Cui, H. Field study on thermal comfort and energy saving potential in 11 split air-conditioned office buildings in Changsha, China. Energy 2019, 182, 471–482. [Google Scholar] [CrossRef]
- De Dear, R.; Kim, J.; Candido, C.; Deuble, M. Adaptive thermal comfort in australian school classrooms. Build. Res. Inf. 2015, 43, 383–398. [Google Scholar] [CrossRef]
- Karyono, T.H. Report on thermal comfort and building energy studies in Jakarta - Indonesia. Build. Environ. 2000, 35, 77–90. [Google Scholar] [CrossRef]
- Zhang, G.; Zheng, C.; Yang, W.; Zhang, Q.; Moschandreas, D.J. Thermal comfort investigation of naturally ventilated classrooms in a subtropical region. Indoor Built Environ. 2007, 16, 148–158. [Google Scholar] [CrossRef]
- Mui, K.W.; Wong, L.T. Neutral temperature in subtropical climates-A field survey in air-conditioned offices. Build. Environ. 2007, 42, 699–706. [Google Scholar] [CrossRef]
- Yang, W.; Zhang, G. Thermal comfort in naturally ventilated and air-conditioned buildings in humid subtropical climate zone in China. Int. J. Biometeorol. 2008, 52, 385–398. [Google Scholar] [CrossRef] [PubMed]
- Karyono, T.H. Bandung thermal comfort study: Assessing the applicability of an adaptive model in indonesia. Archit. Sci. Rev. 2008, 51, 60–65. [Google Scholar] [CrossRef]
- Indraganti, M. Behavioural adaptation and the use of environmental controls in summer for thermal comfort in apartments in India. Energy Build. 2010, 42, 1019–1025. [Google Scholar] [CrossRef]
- Indraganti, M.; Rao, K.D. Effect of age, gender, economic group and tenure on thermal comfort: A field study in residential buildings in hot and dry climate with seasonal variations. Energy Build. 2010, 42, 273–281. [Google Scholar] [CrossRef]
- Jung, G.J.; Song, S.K.; Ahn, Y.C.; Oh, G.S.; Im, Y. Bin Experimental research on thermal comfort in the university classroom of regular semesters in Korea. J. Mech. Sci. Technol. 2011, 25, 503–512. [Google Scholar] [CrossRef]
- Ricciardi, P.; Buratti, C. Thermal comfort in open plan offices in northern Italy: An adaptive approach. Build. Environ. 2012, 56, 314–320. [Google Scholar] [CrossRef]
- Yang, L.; Yan, H.; Xu, Y.; Lam, J.C. Residential thermal environment in cold climates at high altitudes and building energy use implications. Energy Build. 2013, 62, 139–145. [Google Scholar] [CrossRef]
- Azizpour, F.; Moghimi, S.; Salleh, E.; Mat, S.; Lim, C.H.; Sopian, K. Thermal comfort assessment of large-scale hospitals in tropical climates: A case study of University Kebangsaan Malaysia Medical Centre (UKMMC). Energy Build. 2013, 64, 317–322. [Google Scholar] [CrossRef]
- Yau, Y.H.; Chew, B.T.; Saifullah, A.Z.A. A field study on thermal comfort of occupants and acceptable neutral temperature at the national museum in malaysia. Indoor Built Environ. 2013, 22, 433–444. [Google Scholar] [CrossRef]
- Yang, W.; Lin, Y.; Wong, N.H.; Zhou, J. Thermal comfort requirements in the summer season in subtropical urban spaces. Intell. Build. Int. 2014, 6, 224–238. [Google Scholar] [CrossRef]
- Mishra, A.K.; Ramgopal, M. A thermal comfort field study of naturally ventilated classrooms in Kharagpur, India. Build. Environ. 2015, 92, 396–406. [Google Scholar] [CrossRef]
- Thapa, S.; Bansal, A.K.; Panda, G.K. Adaptive thermal comfort in the two college campuses of Salesian College, Darjeeling–Effect of difference in altitude. Build. Environ. 2016, 109, 25–41. [Google Scholar] [CrossRef]
- Nematchoua, M.K.; Ricciardi, P.; Buratti, C. Statistical analysis of indoor parameters an subjective responses of building occupants in a hot region of Indian ocean; a case of Madagascar island. Appl. Energy 2017, 208, 1562–1575. [Google Scholar] [CrossRef] [Green Version]
- Ryu, J.H.; Hong, W.H.; Seo, H.C.; Seo, Y.K. Determination of an acceptable comfort zone for apartment occupants in South Korea: An empirical analysis of cooling operation. Build. Environ. 2017, 125, 484–501. [Google Scholar] [CrossRef]
- Jindal, A. Thermal comfort study in naturally ventilated school classrooms in composite climate of India. Build. Environ. 2018, 142, 34–46. [Google Scholar] [CrossRef]
- Udrea, I.; Croitoru, C.; Nastase, I.; Crutescu, R.; Badescu, V. First adaptive thermal comfort equation for naturally ventilated buildings in Bucharest, Romania. Int. J. Vent. 2018, 17, 149–165. [Google Scholar] [CrossRef]
- Wu, T.; Cao, B.; Zhu, Y. A field study on thermal comfort and air-conditioning energy use in an office building in Guangzhou. Energy Build. 2018, 168, 428–437. [Google Scholar] [CrossRef]
- Fang, Z.; Zhang, S.; Cheng, Y.; Fong, A.M.L.L.; Oladokun, M.O.; Lin, Z.; Wu, H. Field study on adaptive thermal comfort in typical air conditioned classrooms. Build. Environ. 2018, 133, 73–82. [Google Scholar] [CrossRef] [Green Version]
- Jindal, A. Investigation and analysis of thermal comfort in naturally ventilated secondary school classrooms in the composite climate of India. Archit. Sci. Rev. 2019, 62, 466–484. [Google Scholar] [CrossRef]
- García, A.; Olivieri, F.; Larrumbide, E.; Ávila, P. Thermal comfort assessment in naturally ventilated offices located in a cold tropical climate, Bogotá. Build. Environ. 2019, 158, 237–247. [Google Scholar] [CrossRef]
- Liu, J.; Yang, X.; Jiang, Q.; Qiu, J.; Liu, Y. Occupants’ thermal comfort and perceived air quality in natural ventilated classrooms during cold days. Build. Environ. 2019, 158, 73–82. [Google Scholar] [CrossRef]
- Kumar, S.; Singh, M.K.; Kukreja, R.; Chaurasiya, S.K.; Gupta, V.K. Comparative study of thermal comfort and adaptive actions for modern and traditional multi-storey naturally ventilated hostel buildings during monsoon season in India. J. Build. Eng. 2019, 23, 90–106. [Google Scholar] [CrossRef]
- Wu, Z.; Li, N.; Wargocki, P.; Peng, J.; Li, J.; Cui, H. Adaptive thermal comfort in naturally ventilated dormitory buildings in Changsha, China. Energy Build. 2019, 186, 56–70. [Google Scholar] [CrossRef]
- Aghniaey, S.; Lawrence, T.M.; Sharpton, T.N.; Douglass, S.P.; Oliver, T.; Sutter, M. Thermal comfort evaluation in campus classrooms during room temperature adjustment corresponding to demand response. Build. Environ. 2019, 148, 488–497. [Google Scholar] [CrossRef]
- Jiang, J.; Wang, D.; Liu, Y.; Di, Y.; Liu, J. A field study of adaptive thermal comfort in primary and secondary school classrooms during winter season in Northwest China. Build. Environ. 2020, 175. [Google Scholar] [CrossRef]
- Munonye, C.; Ji, Y. Evaluating the perception of thermal environment in naturally ventilated schools in a warm and humid climate in Nigeria. Build. Serv. Eng. Res. Technol. 2020. [Google Scholar] [CrossRef]
- Ballantyne, E.R.; Hill, R.K.; Spencer, J.W. Probit analysis of thermal sensation assessments. Int. J. Biometeorol. 1977, 21, 29–43. [Google Scholar] [CrossRef]
- Nicol, F.; Humphreys, M. Maximum temperatures in European office buildings to avoid heat discomfort. Sol. Energy 2007, 81, 295–304. [Google Scholar] [CrossRef]
- Toe, D.H.C.; Kubota, T. Development of an adaptive thermal comfort equation for naturally ventilated buildings in hot-humid climates using ASHRAE RP-884 database. Front. Archit. Res. 2013, 2, 278–291. [Google Scholar] [CrossRef] [Green Version]
- SIMEPAR Boletim Climatológico. Available online: http://www.simepar.br/prognozweb/simepar/timeline/boletim_climatologico (accessed on 6 April 2021).
- ISO—International Organization for Standardization. Determination of Metabolic Heat Production; ISO 8996; ISO: Genebra, Switzerland, 2004. [Google Scholar]
- ISO—International Organization for Standardization. Ergonomics of the Thermal Environment–Estimation of Thermal Insulation and Water Vapour Resistance of a Clothing Ensemble; ISO 9920; ISO: Genebra, Switzerland, 2007. [Google Scholar]
- ISO—International Organization for Standardization. Ergonomics of the Thermal Environment–Instruments for Measuring Physical Quantities; ISO 7726; ISO: Genebra, Switzerland, 1998. [Google Scholar]
- Yang, W.; Wong, N.H.; Jusuf, S.K. Thermal comfort in outdoor urban spaces in Singapore. Build. Environ. 2013, 59, 426–435. [Google Scholar] [CrossRef]
- Kazkaz, M.; Pavelek, M. Operative temperature and globe temperature. Eng. Mech. 2013, 20, 319–325. [Google Scholar]
- Xavier, A.A.P. Predição de Conforto TéRmico em Ambientes Internos Com Atividades Sedentárias—Teoria FíSica Aliada a Estudos de Campo. Ph.D. Thesis, Universidade Federal de Santa Catarina, Florianópolis, Brasil, 2000; 251p. [Google Scholar]
- Triola, M.F. Elementary Statistics; Pearso: London, UK; Addison-Wesley Reading: Boston, MA, USA, 2006; ISBN 0321331834. [Google Scholar]
- Azizpour, F.; Moghimi, S.; Lim, C.H.; Mat, S.; Salleh, E.; Sopian, K. A thermal comfort investigation of a facility department of a hospital in hot-humid climate: Correlation between objective and subjective measurements. Indoor Built Environ. 2013, 22, 836–845. [Google Scholar] [CrossRef]
- Fabbri, K.; Gaspari, J.; Vandi, L. Indoor thermal comfort of pregnant women in hospital: A case study evidence. Sustainability 2019, 11, 6664. [Google Scholar] [CrossRef] [Green Version]
- Hussin, A.; Salleh, E.; Chan, H.Y.; Mat, S. The reliability of Predicted Mean Vote model predictions in an air-conditioned mosque during daily prayer times in Malaysia. Archit. Sci. Rev. 2015, 58, 67–76. [Google Scholar] [CrossRef]
- Teli, D.; Jentsch, M.F.; James, P.A.B. Naturally ventilated classrooms: An assessment of existing comfort models for predicting the thermal sensation and preference of primary school children. Energy Build. 2012, 53, 166–182. [Google Scholar] [CrossRef]
- Al-ajmi, F.F. Thermal comfort in air-conditioned mosques in the dry desert climate. Build. Environ. 2010, 45, 2407–2413. [Google Scholar] [CrossRef]
- Mustapa, M.S.; Zaki, S.A.; Rijal, H.B.; Hagishima, A.; Ali, M.S.M. Thermal comfort and occupant adaptive behaviour in Japanese university buildings with free running and cooling mode offices during summer. Build. Environ. 2016, 105, 332–342. [Google Scholar] [CrossRef]
- Hwang, R.-L.; Lin, T.-P.; Kuo, N.-J. Field experiments on thermal comfort in campus classrooms in Taiwan. Energy Build. 2006, 38, 53–62. [Google Scholar] [CrossRef]
- Jiang, J.; Wang, D.; Liu, Y.; Xu, Y.; Liu, J. A study on pupils’ learning performance and thermal comfort of primary schools in China. Build. Environ. 2018, 134, 102–113. [Google Scholar] [CrossRef]
- Schweiker, M.; André, M.; Al-Atrash, F.; Al-Khatri, H.; Alprianti, R.R.; Alsaad, H.; Amin, R.; Ampatzi, E.; Arsano, A.Y.; Azar, E.; et al. Evaluating assumptions of scales for subjective assessment of thermal environments–Do laypersons perceive them the way, we researchers believe? Energy Build. 2020, 211, 109761. [Google Scholar] [CrossRef]


| Reference | Country | Sample | Type of Ventilation | PPD | PPDmin (%) |
|---|---|---|---|---|---|
| [28] | Portugal | 48 women | HVAC | ] | 52.31 |
| [29] | Germany | n/a | n/a | 16 | |
| [30] | China | n/a | n/a | 18 | |
| [31] | Brazil | n/a | n/a | 47.5 | |
| [32] | Brazil | 1200 | n/a | 25.4 | |
| [33] | China | 120 participants | n/a | 7.5 | |
| [34] | Taiwan | 22 college students | HVAC | 16 | |
| [35] | Taiwan | 968 | HVAC | 9 | |
| [36] | China | 87 elderlies | HVAC | 3 | |
| [37] | India | 40 college students | HVAC | ) | 13.47 |
| [38] | Italy | 4000 students | NV | 15 | |
| [39] | Malaysia | 293 employees | HVAC | n/a | |
| [40] | Australia | 28 college students | HVAC | n/a | |
| [41] | Poland | 50 students | HVAC | 0 | |
| [42] | China | 110 college students | HVAC | 2.26 | |
| [43] | China | 442 | HVAC | 5 |
| Season | Thermal Comfort Zone | Operative Temperature |
|---|---|---|
| Summer | 20–23 °C | 22 °C |
| Winter | 23–26 °C | 24.5 °C |
| Reference | Country | Climate | Season | Construction Type | Type of Ventilation | Sample | TCZ Calculated (°C) | Neutral Temperature (°C) |
|---|---|---|---|---|---|---|---|---|
| [44] | Australia | subtropical | Summer | Classrooms | HVAC and NV | 2850 students | 19.5–26.6 | 22.5 |
| [20] | China | hot-humid | Summer | Residences | HVAC and NV | 111 people (average 41.8 years old) | 22.0–25.9 | 28.6 |
| [28] | Portugal | Mediterranean | Winter | Office | HVAC | 48 women | 19.61–22.61 | 21.1 |
| [33] | China | Dry | Winter | Residential buildings | n/a | 120 people (14–80 years) | 18.0–25.5 | 20.9 (men) 21.9 (women) |
| [34] | Taiwan | hot-humid | n/a | laboratory chamber | HVAC | 22 college students | 23.0–28.0 | n/a |
| [35] | Taiwan | hot-humid | n/a | workplaces and residences | HVAC | 968 data | 20.4–28.4 | 25.9 |
| [36] | China | n/a | Summer and Winter | Residences | HVAC | 87 elderly (average 71 years old) | 23.2–27.1 (summer) | 25.2 (summer) 23.2 (winter) |
| [37] | India | n/a | n/a | conference room and laboratory room | HVAC | 40 college students | 23.25–27.18 | 24.83 |
| [39] | Malaysia | hot and humid climates | n/a | Hospital | HVAC | 293 employees | 19.2–28.5 | 23.8 |
| [42] | China | subtropical | Summer | Climate chamber | HVAC | 110 college students | 23.5–29.1 | n/a |
| [43] | China | Hot summer cold winter (HSCW) | Summer and Winter | Office | HVAC | 442 occupants | 24.6–28.6 | 26.7 |
| [45] | Indonesia | hot-humid tropical | n/a | Office | HVAC and NV | 596 workers (19–53 years) | 23.5–29.9 | 26.7 |
| [46] | China | continental subtropical monsoon humid climate | Spring | Classrooms | NV | 1273 students (average 20 years old) | 17.0–30.0 | 21.5 |
| [47] | China | subtropical | Summer and Winter | Office | HVAC | 422 people | 22.5–24.7 (summer) 20.2–23.6 (winter) | 23.6 (summer) 21.4 (winter) |
| [48] | China | subtropical monsoon humid | Summer | Buildings | HVAC and NV | 229 occupants | 25.0–31.6 (NV) 25.1–30.3 (HVAC) | 28.3 (NV) 27.7 (HVAC) |
| [49] | Indonesia | hot-humid tropical | n/a | Classrooms | NV | 20 students | 23.9–27.0 | 25.4 |
| [50] | India | Composite Climate | Summer and monsoon | Building apartments | NV | 113 occupants (average 42 years old) | 26.0–32.5 | 29.2 |
| [51] | India | Dry | Summer | Residential Buildings | NV | 113 occupants (17–69 years) | 27.3–33.1 | 30.2 |
| [52] | Korea | oceanic temperate climate | Spring and Fall | Classrooms | n/a | 962 students (average 24.3 years old) | 17.0–25.0 | n/a |
| [53] | Italy | n/a | Summer and Winter | Open plan offices | HVAC | 145 subjects | 21.5–24.5 | n/a |
| [54] | China | Dry | Summer and Winter | residential buildings | n/a | 76 subjects | 13.6–32.4 | 18.9 (winter) 23.3 (summer) |
| [55] | Malaysia | Tropical | n/a | Hospital | n/a | 188 subjects | 21.2–25.5 | 23.4 |
| [56] | Malaysia | Tropical | n/a | Museum | HVAC | 28 subjects (average 23.71 years old) | 18.0–22.0 | 22.5 |
| [57] | China | Subtropical | Summer | urban spaces | NV | 2089 subjects (average 25.7 years old) | 25.3–32.3 | 28.6 |
| [58] | India | hot and humid climates | Spring and Fall | Classrooms | NV | 82 students | 22.1–31.5 | 29.0 |
| [59] | India | hot-humid subtropical (1) cold (2) | All seasons | University | NV | 325 subjects (average 20.3 years old) | 12.5–32.3 | 29.7 (1) 21.2 (2) |
| [60] | Madagascar | Tropical | n/a | Hospitals, Shopping center, traditional buildings, schools | HVAC | 1092 people | 22.9–27.2 | n/a |
| [61] | Korea | n/a | Summer | Apartment | HVAC | 50 occupants | 24.7–28.3 | n/a |
| [62] | India | hot summer monsoon with dry winter | Monsoon and winter | Classrooms | NV | 130 students | 15.3–33.7 | 27.1 |
| [63] | Romania | temperate | n/a | Office and residential buildings | NV | 738 subjects | 22.6–26.0 | n/a |
| [64] | China | Subtropical | Summer and Winter | office building | HVAC | 656 questionnaires | 22.1–29.6 | 23.3 |
| [65] | Hong Kong | hot-humid subtropical | Summer | Classrooms | HVAC | 982 students | 21.56–26.75 | 24.0 |
| [66] | India | Composite Climate | Summer and Winter | Classrooms | NV | 1.890 children and teenager (10–18 years) | 16.0–33.7 | 28.2 (Summer) 19.4 (Winter) |
| [67] | Colombia | tropical | n/a | Office | NV | 72 people (20–60 years) | 19.97–26.9 | 23.47 |
| [68] | China | Subtropical | Winter | Classrooms | NV | 992 college students (17–22 years) | 19.5–21.8 | 20.6 |
| [69] | India | monsoon | n/a | Hostel | NV | 470 subjects | 27.2–31.0 | 29.9 |
| [70] | China | hot-humid subtropical | Summer | dormitory buildings | NV | 465 subjects | 25.0–28.7 | 26.2 |
| [71] | USA | hot-humid subtropical | Summer | Classrooms | HVAC | 496 students | 22.0–24.5 | 23.5 |
| [72] | China | Cold semi-arid climates and Cold desert climates | Winter | Classrooms | HVAC e NV | 1206 students | 13.0–18.0 | 14.2 |
| [73] | Nigeria | Tropical | n/a | primary school buildings | NV | 330 children (7–12 years) | 25.2–32.3 | 28.8 |
| Reference | APD Nomenclature | Satisfaction Vote | Dissatisfaction Vote |
|---|---|---|---|
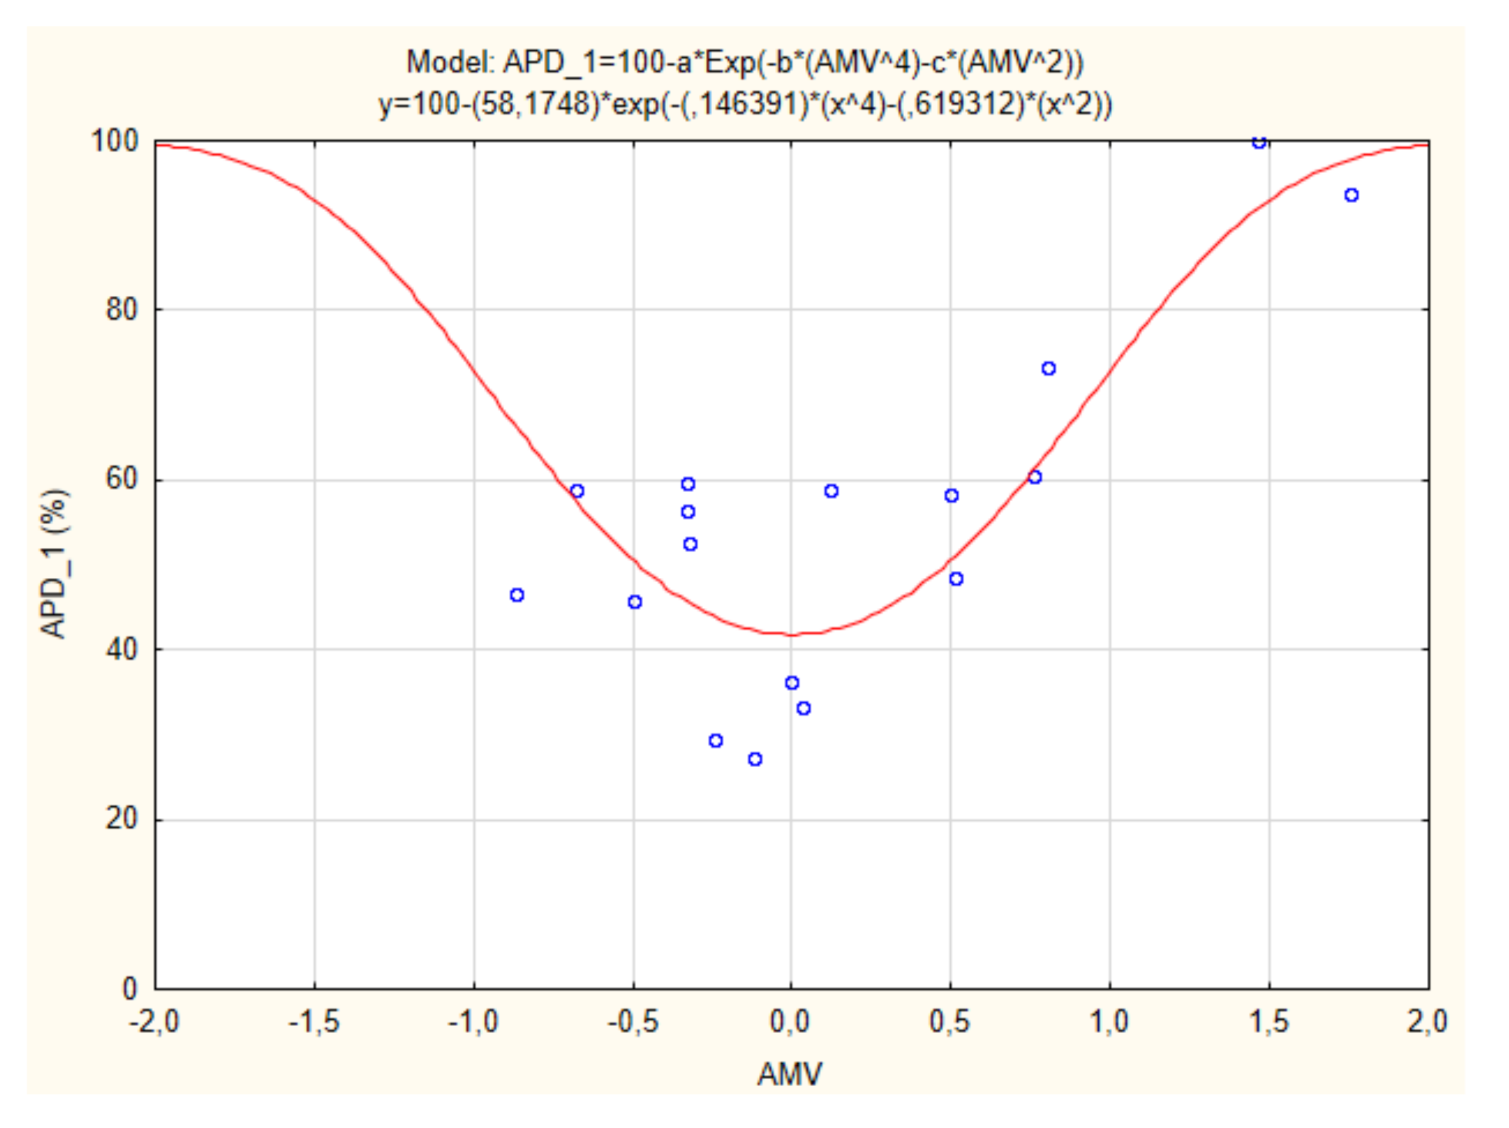
| [31] | APD_1 | 0 | −3, −2, −1, +1, +2, +3 |
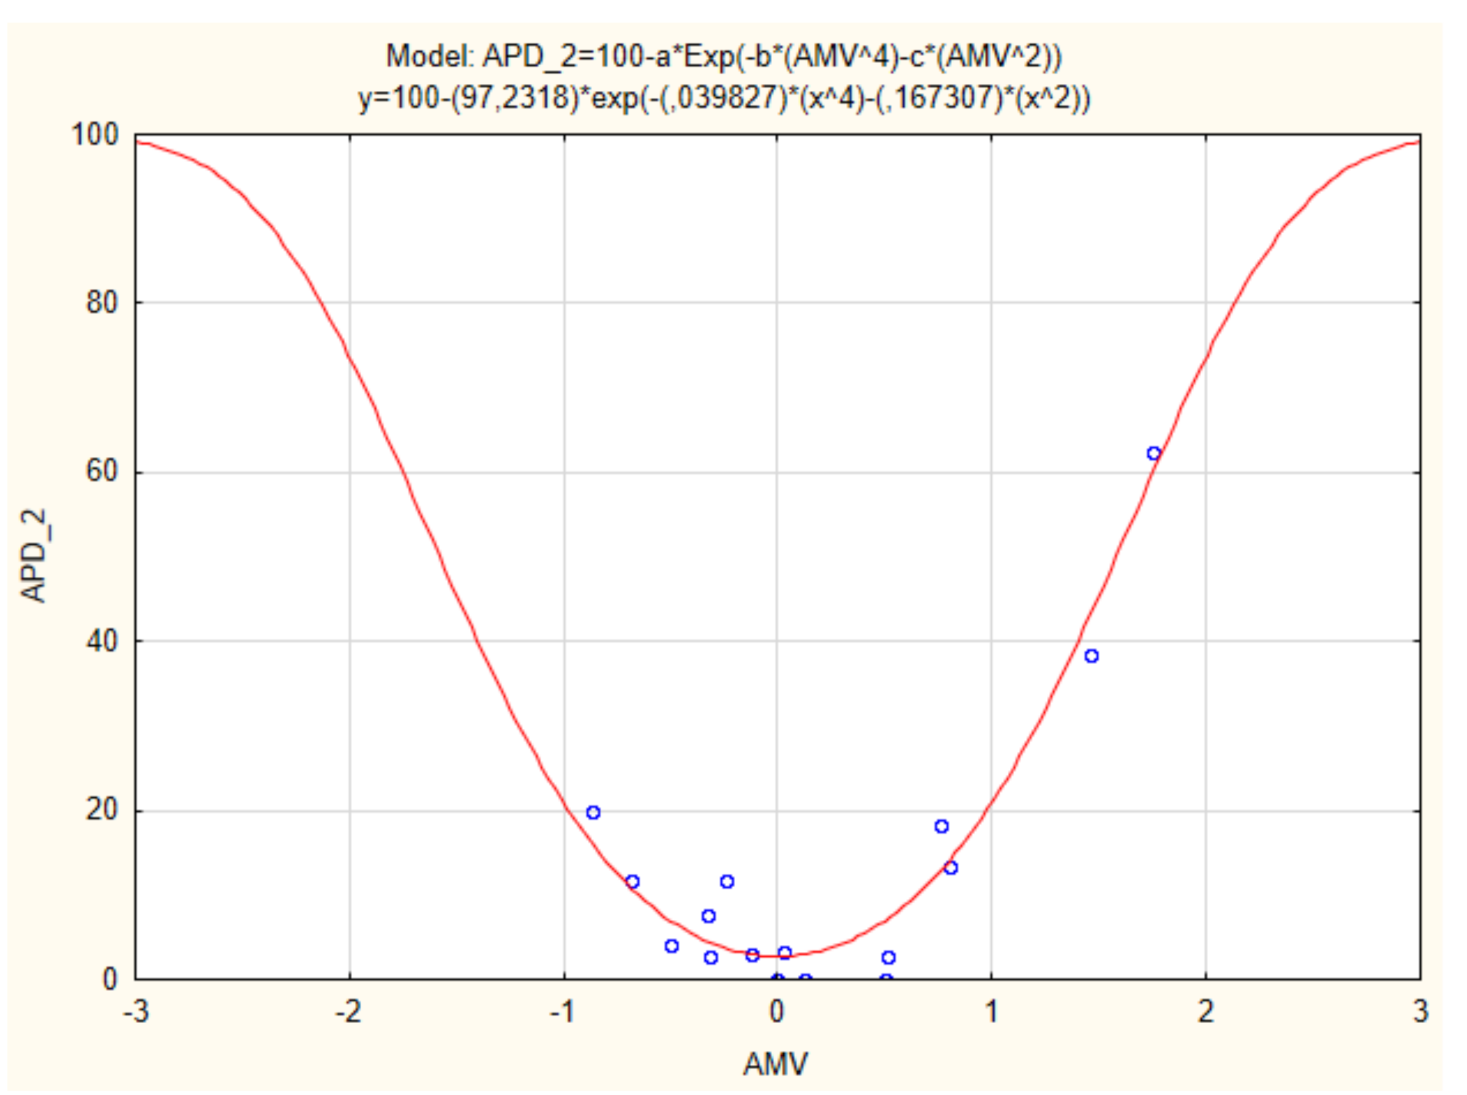
| Category B ISO 7730 [12] | APD_2 | −1, 0, +1 | −3, −2, +2, +3 |
| Proposed in this research by using ISO 10551 [83] | APD_3 | −1 and +1 (considering vote 0 on the thermal preference scale) and 0 | −1 and +1 (considering vote other than 0 on the thermal preference scale); −3, −2, +2 and +3 |
| Male: 346 Female: 135 | Mean | Standard Deviation | Minimum | Maximum |
|---|---|---|---|---|
| Age | 22.03 | 2.86 | 17 | 32 |
| Height (cm) | 174.05 | 8.64 | 152 | 196 |
| Body mass (Kg) | 74.24 | 15.29 | 42 | 130 |
| APD | |||||||||||||
|---|---|---|---|---|---|---|---|---|---|---|---|---|---|
| Tar (°C) | Trm (°C) | Top (°C) | var (m/s) | RH (%) | M (met) | Icl (clo) | AMV | PMV | PPD | APD_1 | APD_2 | APD_3 | |
| 1 | 19.73 | 20.12 | 19.93 | 0.03 | 61.91 | 1.2 | 0.77 | −0.2 | −0.7 | 15% | 29.41% | 11.76% | 23.53% |
| 2 | 20.41 | 20.48 | 20.45 | 0.04 | 61.41 | 1.2 | 0.9 | −0.5 | −0.3 | 7% | 45.83% | 4.17% | 37.50% |
| 3 | 21.71 | 21.64 | 21.68 | 0.04 | 69.44 | 1.2 | 0.72 | 0.8 | −0.3 | 7% | 73.33% | 13.33% | 53.33% |
| 4 | 23.98 | 24.14 | 24.06 | 0.06 | 57.47 | 1.2 | 0.55 | 0.76 | −0.1 | 5% | 60.61% | 18.18% | 39.39% |
| 5 | 17.77 | 17.81 | 17.79 | 0.03 | 64.01 | 1.2 | 0.98 | −0.9 | −0.8 | 18% | 46.67% | 20.00% | 46.67% |
| 6 | 28.26 | 27.67 | 27.97 | 0.15 | 40.03 | 1.2 | 0.38 | 1.75 | 0.41 | 9% | 93.75% | 62.50% | 93.75% |
| 7 | 27.52 | 26.89 | 27.21 | 0.12 | 37.55 | 1.2 | 0.38 | 1.46 | 0.27 | 7% | 100.00% | 38.46% | 84.62% |
| 8 | 19.44 | 19.13 | 19.29 | 0.03 | 66.79 | 1.2 | 0.89 | −0.3 | −0.6 | 12% | 52.63% | 2.63% | 34.21% |
| 9 | 19.12 | 19.12 | 19.12 | 0.03 | 59.62 | 1.2 | 0.96 | −0.3 | −0.5 | 11% | 59.62% | 7.69% | 42.31% |
| 10 | 17.95 | 17.69 | 17.82 | 0.04 | 66.76 | 1.2 | 0.9 | −0.7 | −0.9 | 23% | 58.82% | 11.76% | 52.94% |
| 11 | 20.66 | 20.52 | 20.59 | 0.08 | 65.75 | 1.2 | 0.73 | 0.12 | −0.6 | 12% | 58.82% | 0.00% | 41.18% |
| 12 | 20.64 | 21.14 | 20.89 | 0.06 | 61.63 | 1.2 | 0.75 | 0 | −0.5 | 10% | 36.36% | 0.00% | 25.00% |
| 13 | 18.47 | 18.38 | 18.43 | 0.07 | 68.13 | 1.2 | 0.84 | −0.3 | −0.9 | 22% | 56.41% | 7.69% | 43.69% |
| 14 | 19.89 | 19.81 | 19.85 | 0.04 | 60.34 | 1.2 | 1 | −0.1 | −0.3 | 7% | 27.27% | 3.03% | 24.24% |
| 15 | 23.29 | 23.17 | 23.23 | 0.08 | 60.15 | 1.2 | 0.51 | 0.5 | −0.4 | 8% | 58.33% | 0.00% | 58.33% |
| 16 | 22.73 | 23.01 | 22.87 | 0.06 | 62.06 | 1.2 | 0.67 | 0.51 | −0.1 | 5% | 48.65% | 2.70% | 40.54% |
| 17 | 21.21 | 21.21 | 21.21 | 0.03 | 61.39 | 1.2 | 0.78 | 0.03 | −0.3 | 7% | 33.33% | 3.33% | 26.67% |
| Reference | Equation | Neutral Top (°C) | Type of Environment |
|---|---|---|---|
| [28] | 21.39 | Offices | |
| [46] | 21.5 | Classrooms | |
| [88] | TSV = 0.26Top 5.68 | 21.84 | Classrooms |
| [89] | 26.08 | Mosques | |
| [90] | 26.68 | Offices | |
| This research | 20.73 | Classrooms |
| Nomenclature | Equation | R2 | APDmin | AMV = 0.5 |
|---|---|---|---|---|
| APD_1 | 0.844 | 41.83% | 50.62% | |
| APD_2 | 0.969 | 2.77% | 6.98% | |
| APD_3 | 0.914 | 31.72% | 40.02% |
| APD_1 | Cutoff Line 50.62% | APD_2 | Cutoff Line 6.98% | APD_3 | Cutoff Line 40.02% | ||||||
|---|---|---|---|---|---|---|---|---|---|---|---|
| Dissatisfied by Hot | Dissatisfied by Cold | Hot | Cold | Dissatisfied by Hot | Dissatisfied by Cold | Hot | Cold | Dissatisfied by Hot | Dissatisfied by Cold | Hot | Cold |
| 11.76% | 17.65% | 0 | 0 | 0.00% | 11.76% | 0 | 1 | 5.88% | 11.76% | 0 | 0 |
| 0.00% | 45.83% | 0 | 0 | 0.00% | 4.17% | 0 | 0 | 0.00% | 25.00% | 0 | 0 |
| 66.67% | 6.67% | 1 | 0 | 13.33% | 0.00% | 1 | 0 | 40.00% | 0.00% | 0 | 0 |
| 57.58% | 3.03% | 1 | 0 | 18.18% | 0.00% | 1 | 0 | 33.33% | 0.00% | 0 | 0 |
| 0.00% | 46.67% | 0 | 0 | 0.00% | 20.00% | 0 | 1 | 0.00% | 40.00% | 0 | 0 |
| 93.75% | 0.00% | 1 | 0 | 62.50% | 0.00% | 1 | 0 | 87.50% | 0.00% | 1 | 0 |
| 100.00% | 0.00% | 1 | 0 | 38.46% | 0.00% | 1 | 0 | 61.54% | 0.00% | 1 | 0 |
| 13.16% | 39.47% | 0 | 0 | 0.00% | 2.63% | 0 | 0 | 5.26% | 18.42% | 0 | 0 |
| 17.31% | 42.31% | 0 | 0 | 0.00% | 7.69% | 0 | 1 | 3.85% | 25.00% | 0 | 0 |
| 2.94% | 55.88% | 0 | 1 | 0.00% | 11.76% | 0 | 1 | 2.94% | 41.18% | 0 | 1 |
| 35.29% | 23.53% | 0 | 0 | 0.00% | 0.00% | 0 | 0 | 11.76% | 11.76% | 0 | 0 |
| 18.18% | 18.18% | 0 | 0 | 0.00% | 0.00% | 0 | 0 | 6.82% | 6.82% | 0 | 0 |
| 15.38% | 41.03% | 0 | 0 | 0.00% | 7.69% | 0 | 1 | 10.26% | 28.21% | 0 | 0 |
| 9.09% | 18.18% | 0 | 0 | 0.00% | 3.03% | 0 | 0 | 3.03% | 18.18% | 0 | 0 |
| 54.17% | 4.17% | 1 | 0 | 0.00% | 0.00% | 0 | 0 | 33.33% | 4.17% | 0 | 0 |
| 48.65% | 0.00% | 0 | 0 | 2.70% | 0.00% | 0 | 0 | 27.03% | 0.00% | 0 | 0 |
| 16.67% | 16.67% | 0 | 0 | 3.33% | 0.00% | 0 | 0 | 6.67% | 10.00% | 0 | 0 |
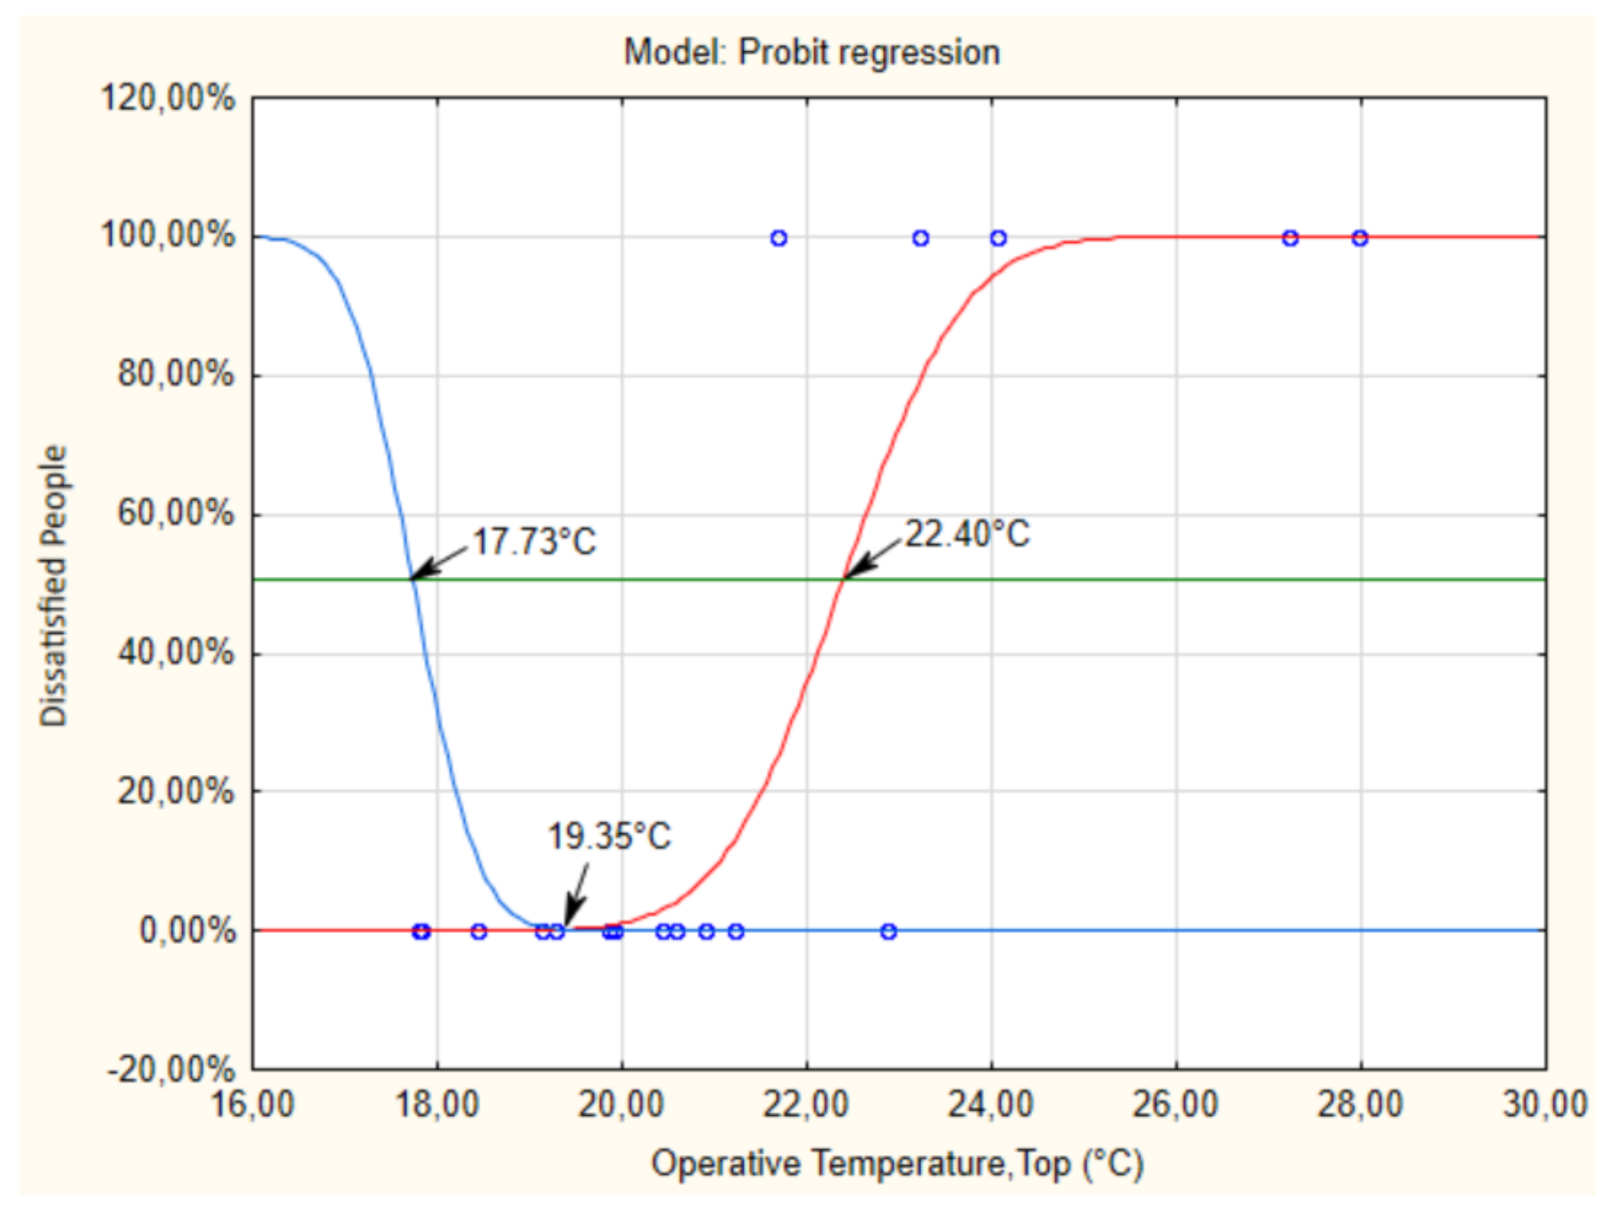
| Nomenclature | Neutral Top | TCZ | Range |
|---|---|---|---|
| APD_1 | 19.35 °C | 17.73 °C–22.4 °C | 4.67 °C |
| APD_2 | 20.75 °C | 20.71 °C–20.93 °C | 0.22 °C |
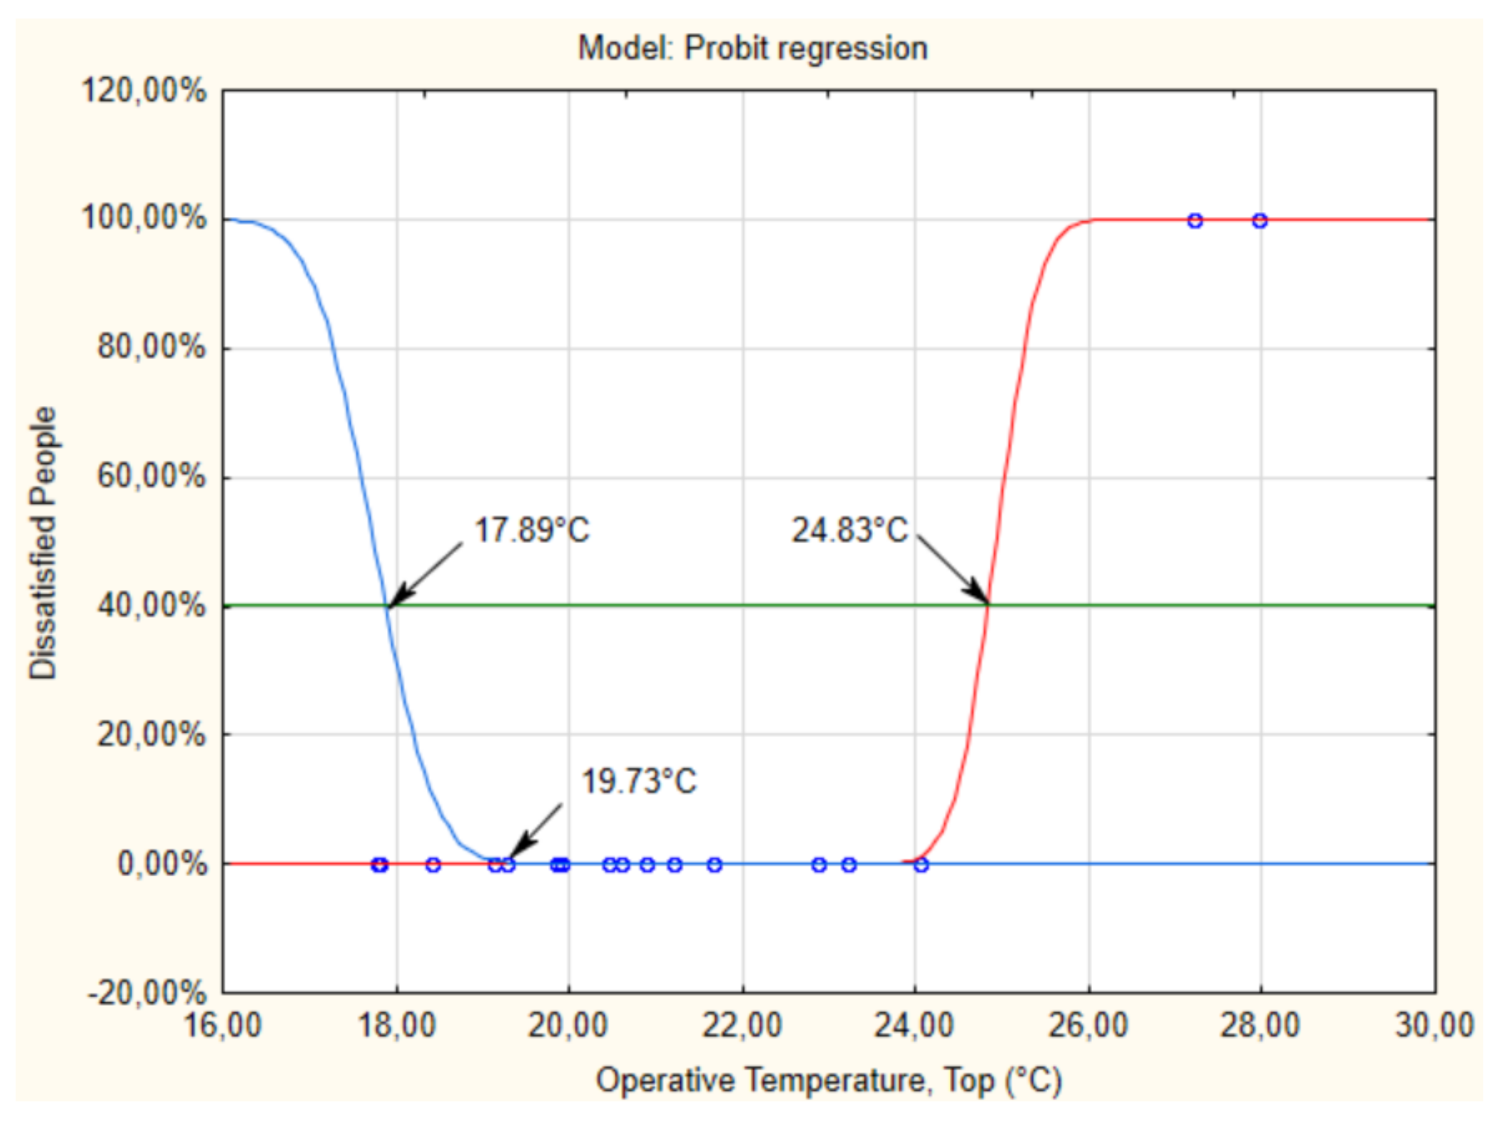
| APD_3 | 19.73 °C | 17.89 °C–24.83 °C | 6.94 °C |
Publisher’s Note: MDPI stays neutral with regard to jurisdictional claims in published maps and institutional affiliations. |
© 2021 by the authors. Licensee MDPI, Basel, Switzerland. This article is an open access article distributed under the terms and conditions of the Creative Commons Attribution (CC BY) license (https://creativecommons.org/licenses/by/4.0/).
Share and Cite
Pereira, P.F.d.C.; Broday, E.E. Determination of Thermal Comfort Zones through Comparative Analysis between Different Characterization Methods of Thermally Dissatisfied People. Buildings 2021, 11, 320. https://doi.org/10.3390/buildings11080320
Pereira PFdC, Broday EE. Determination of Thermal Comfort Zones through Comparative Analysis between Different Characterization Methods of Thermally Dissatisfied People. Buildings. 2021; 11(8):320. https://doi.org/10.3390/buildings11080320
Chicago/Turabian StylePereira, Pedro Filipe da Conceição, and Evandro Eduardo Broday. 2021. "Determination of Thermal Comfort Zones through Comparative Analysis between Different Characterization Methods of Thermally Dissatisfied People" Buildings 11, no. 8: 320. https://doi.org/10.3390/buildings11080320
APA StylePereira, P. F. d. C., & Broday, E. E. (2021). Determination of Thermal Comfort Zones through Comparative Analysis between Different Characterization Methods of Thermally Dissatisfied People. Buildings, 11(8), 320. https://doi.org/10.3390/buildings11080320