The Structural Performance of Reinforced Concrete Members with Monolithic Non-Structural Walls under Static and Dynamic Loads


 , ,
, ,
Abstract
1. Introduction
- The base shear coefficient shall be 0.55 in a case in which the non-structural walls are available. The aim of that is to ensure the serviceability of the building during and after earthquakes. Besides this, a limit of inter-story drift shall be less than 0.33%.
- The base shear coefficient shall be 0.3 in a case in which the non-structural walls are not available due to damage by an earthquake, the aim of which is to ensure the safety of the building after earthquakes.
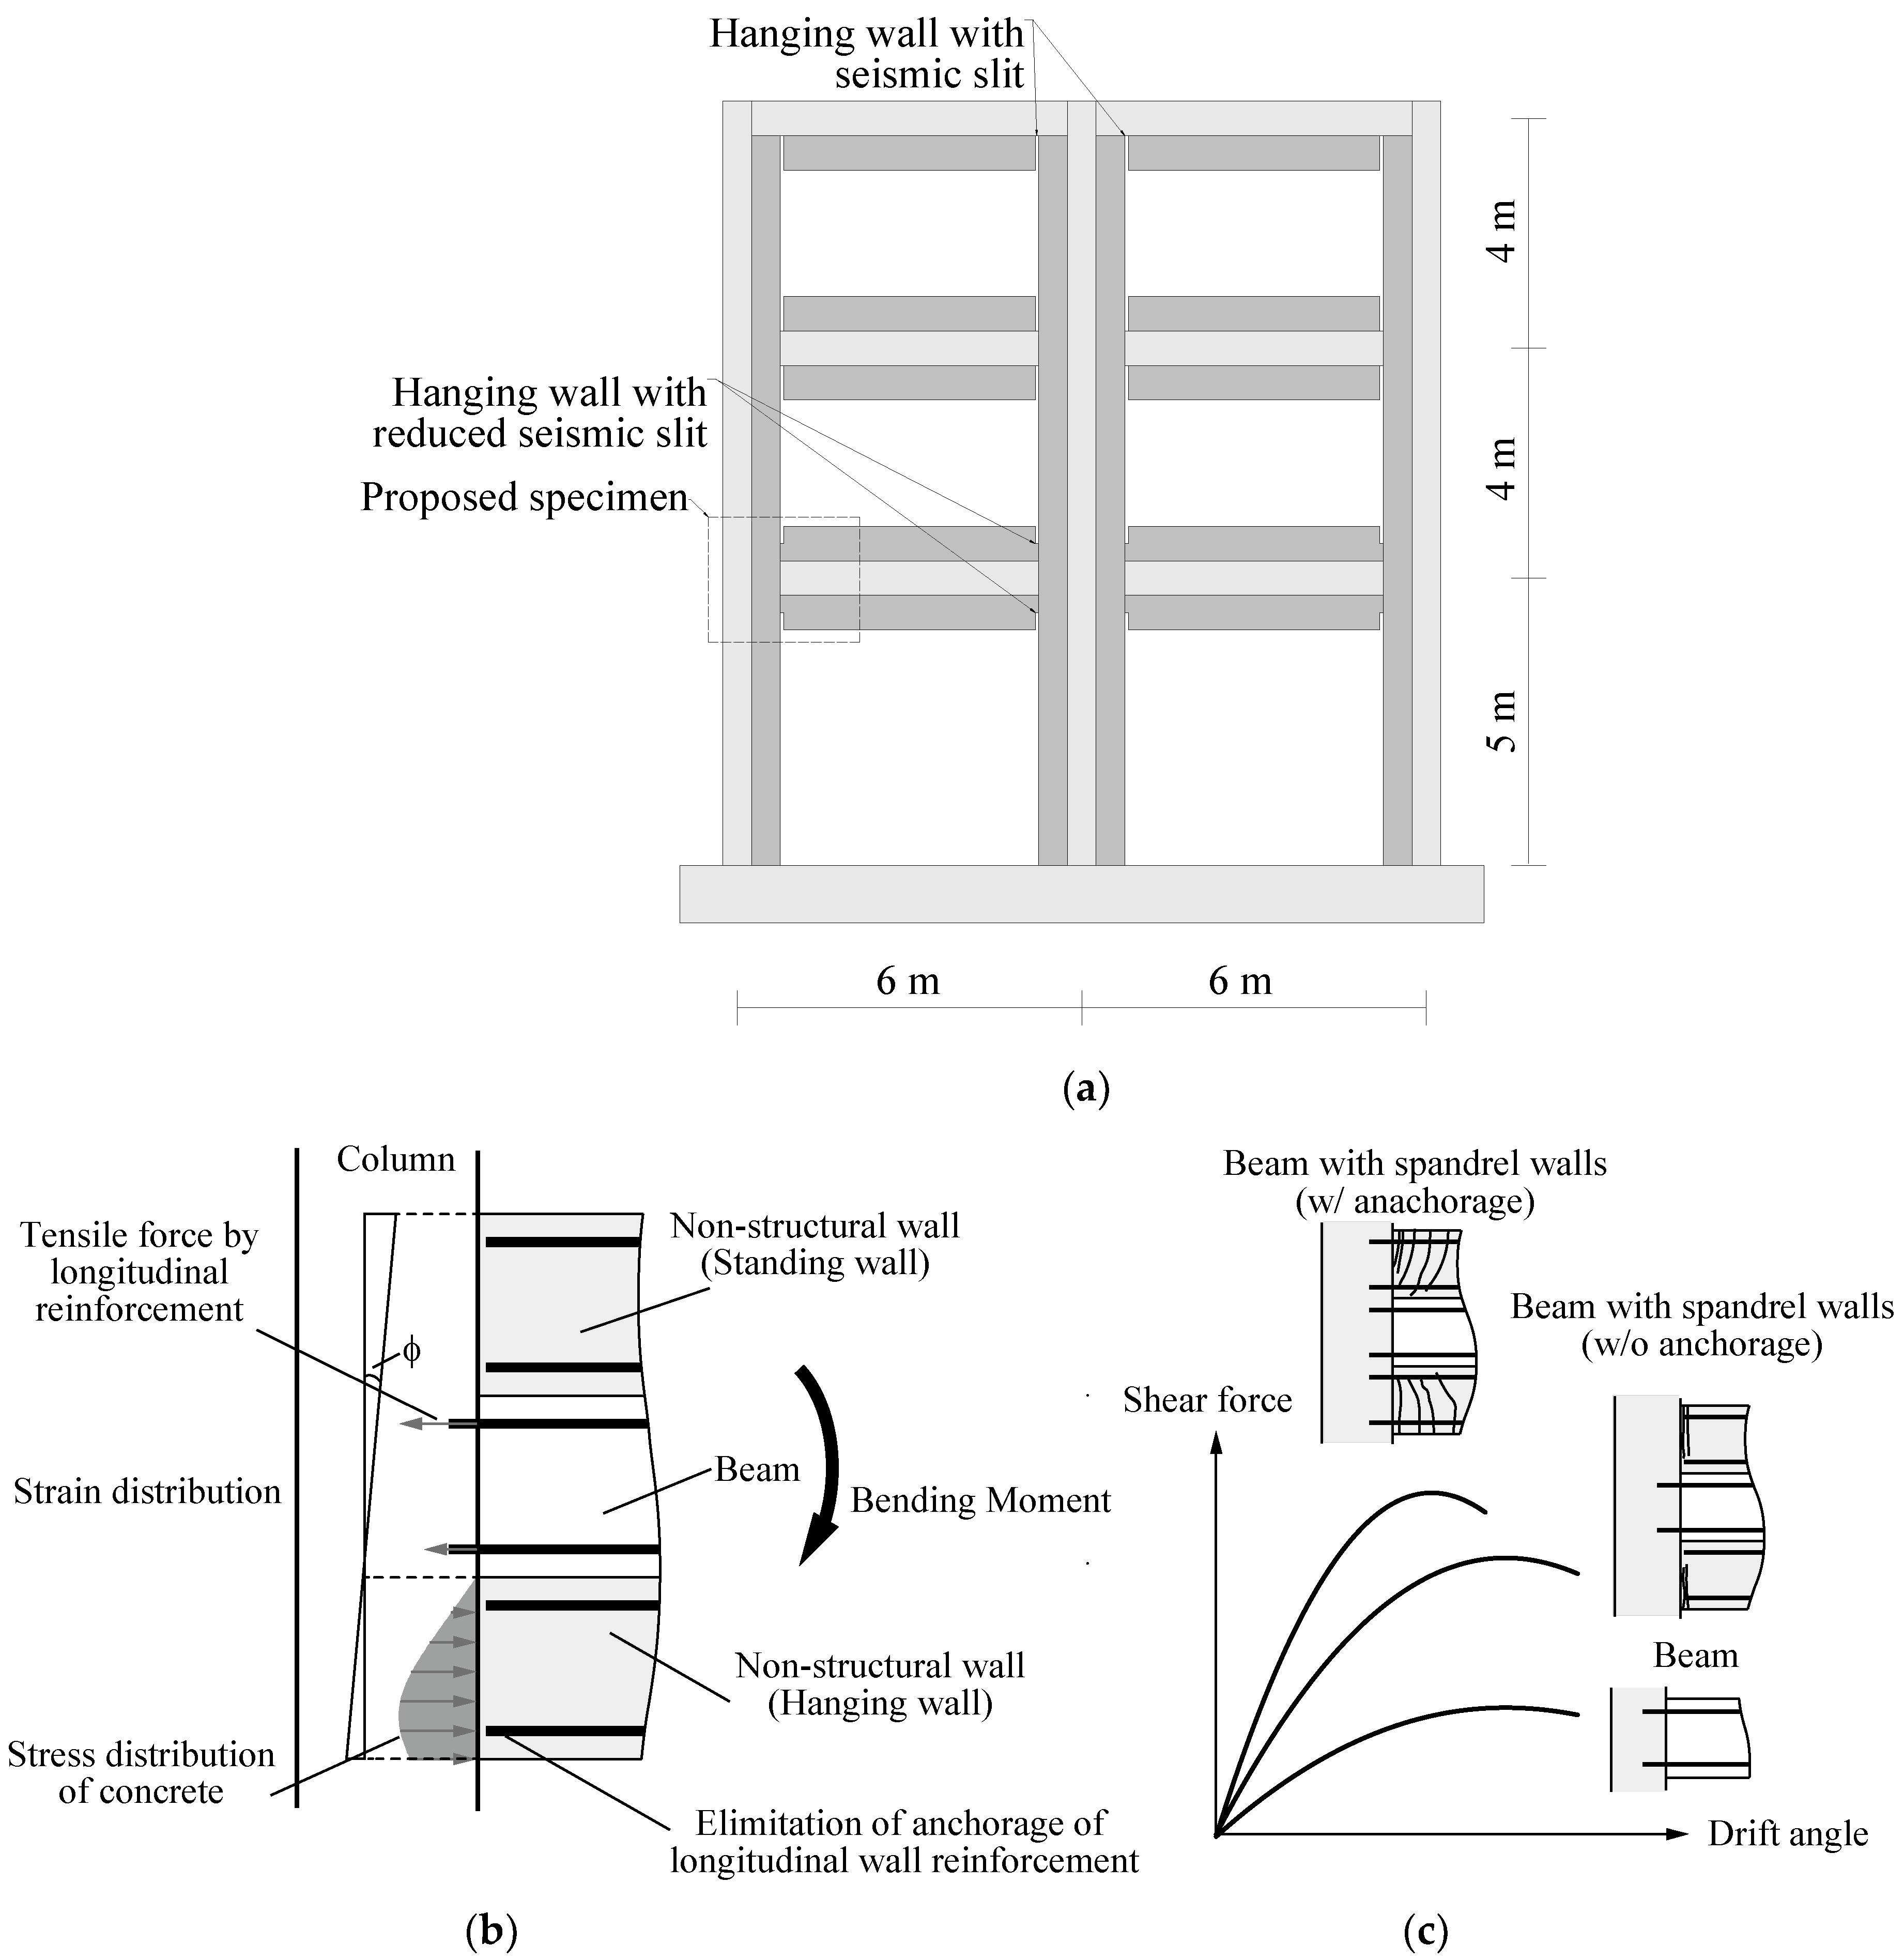
2. Detail of Proposed Method
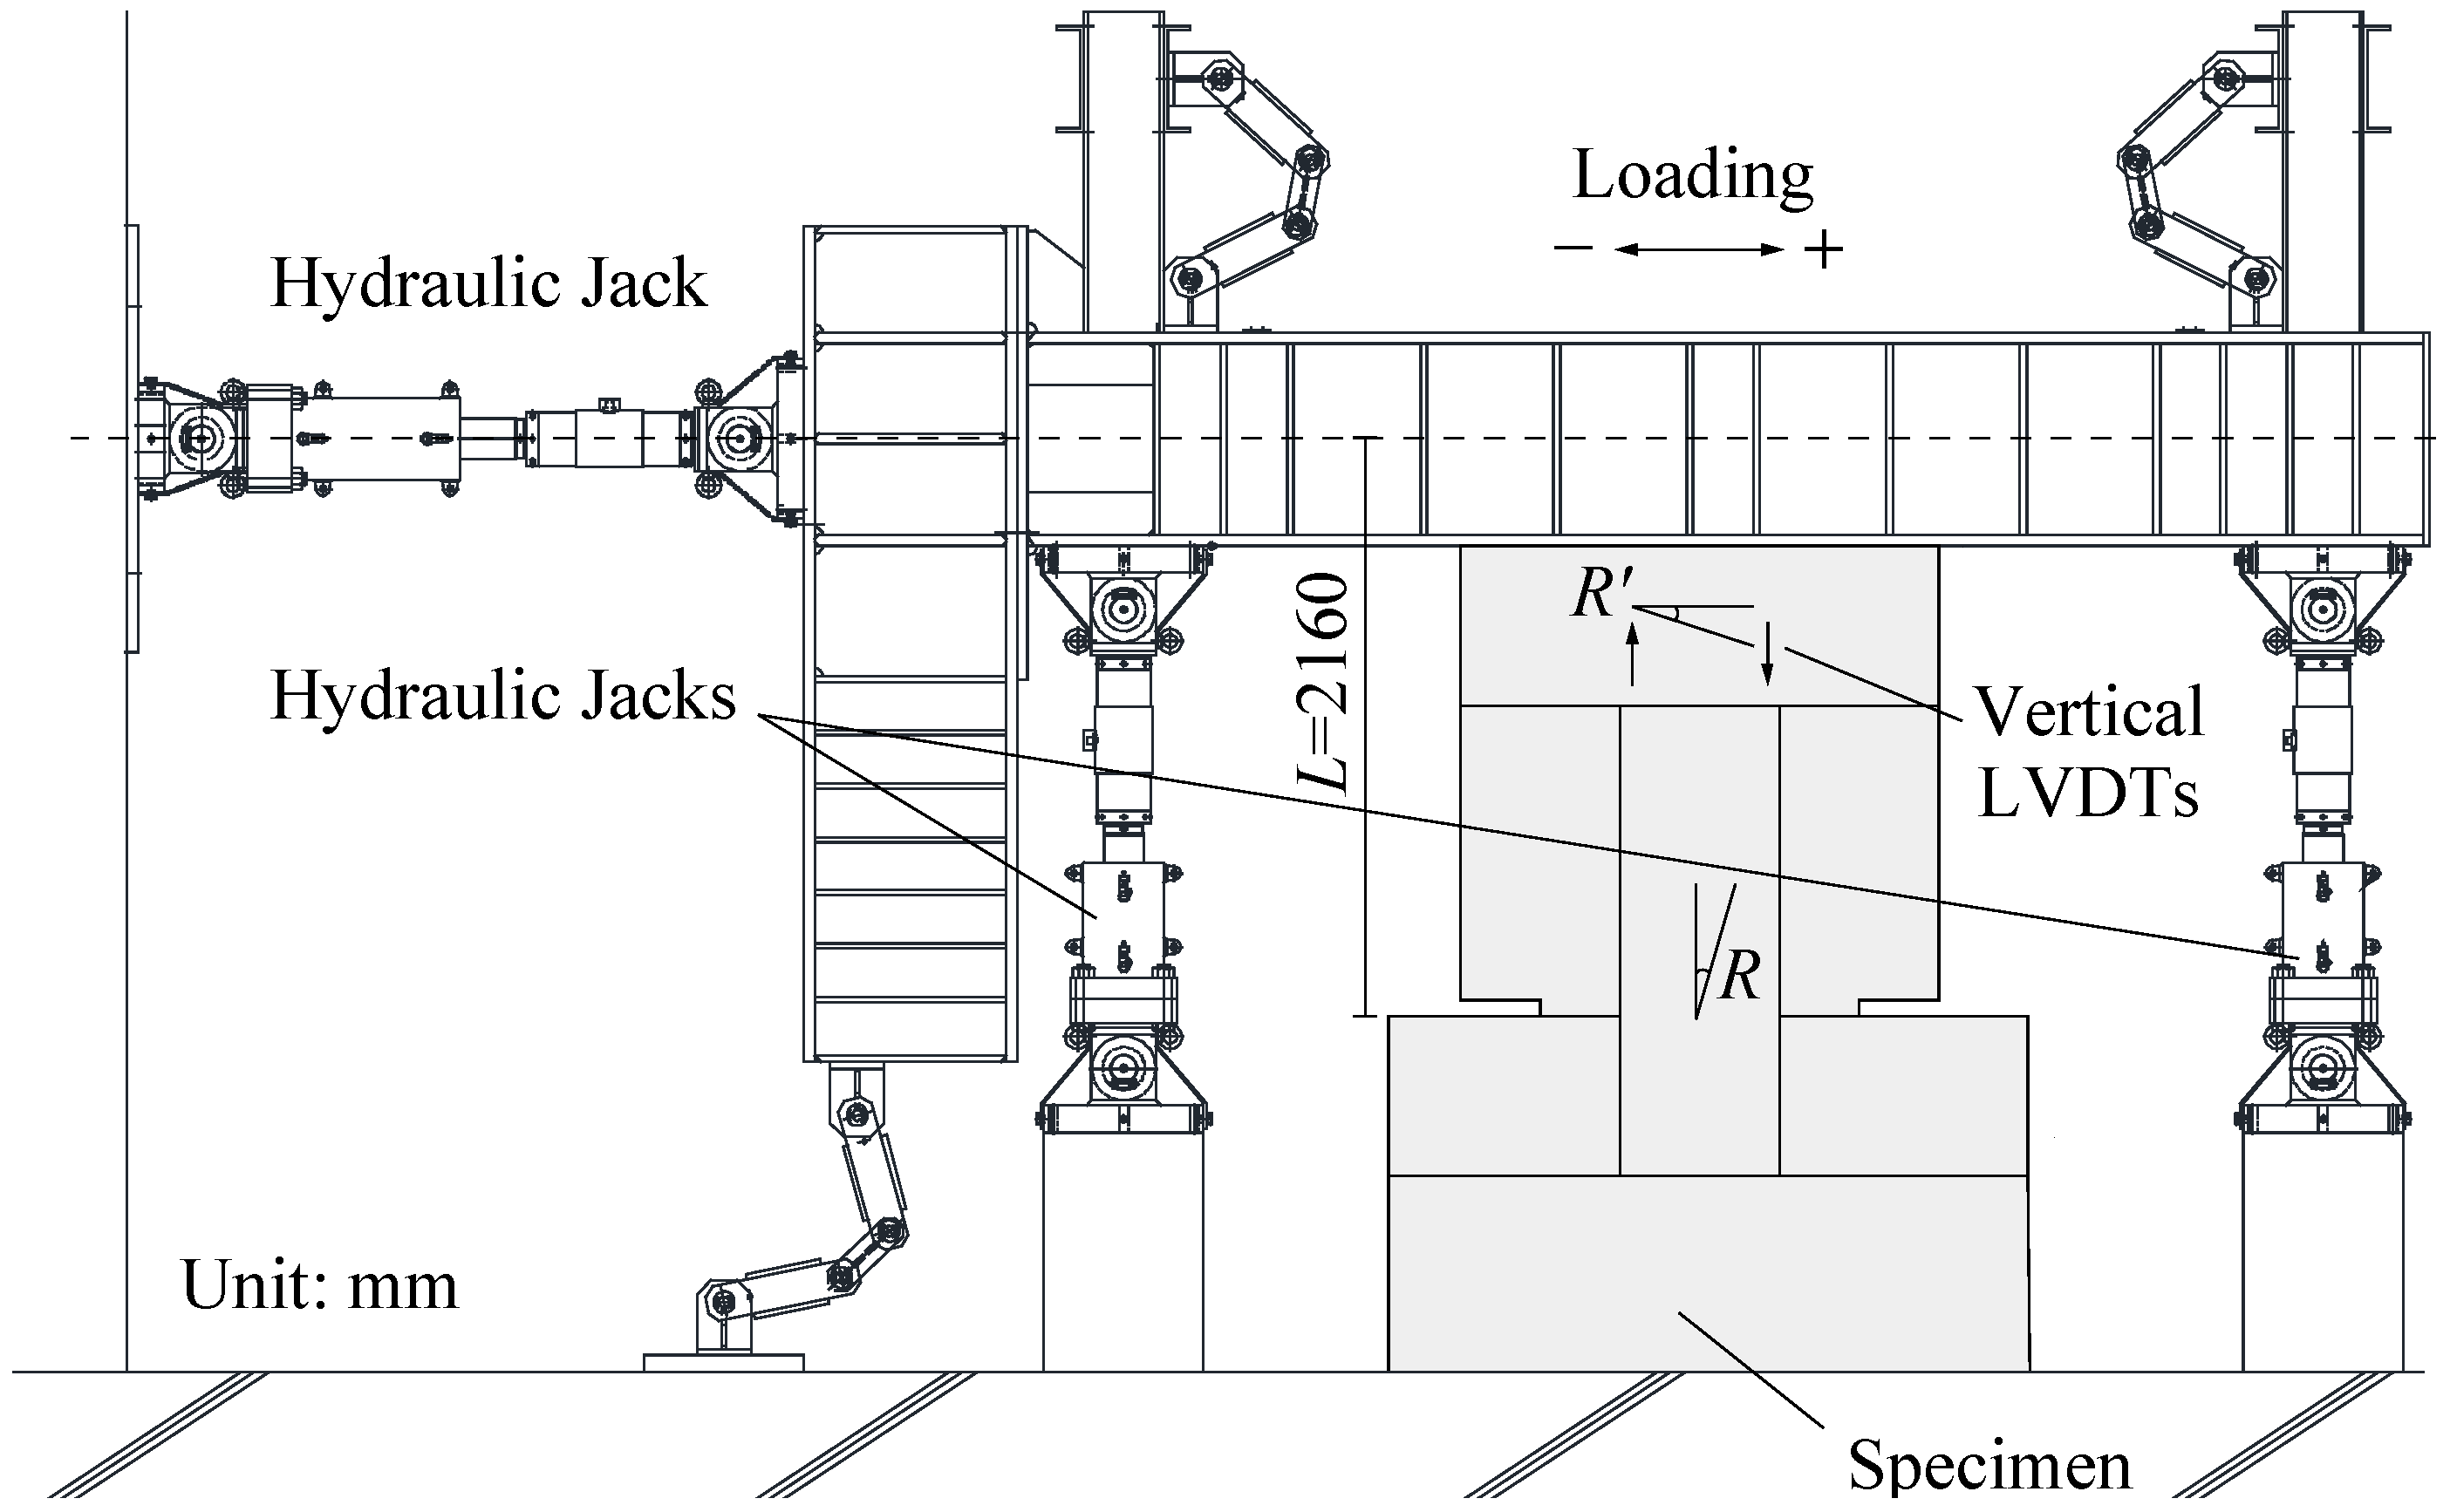
3. Static Evaluation of the Proposed Detailing Method
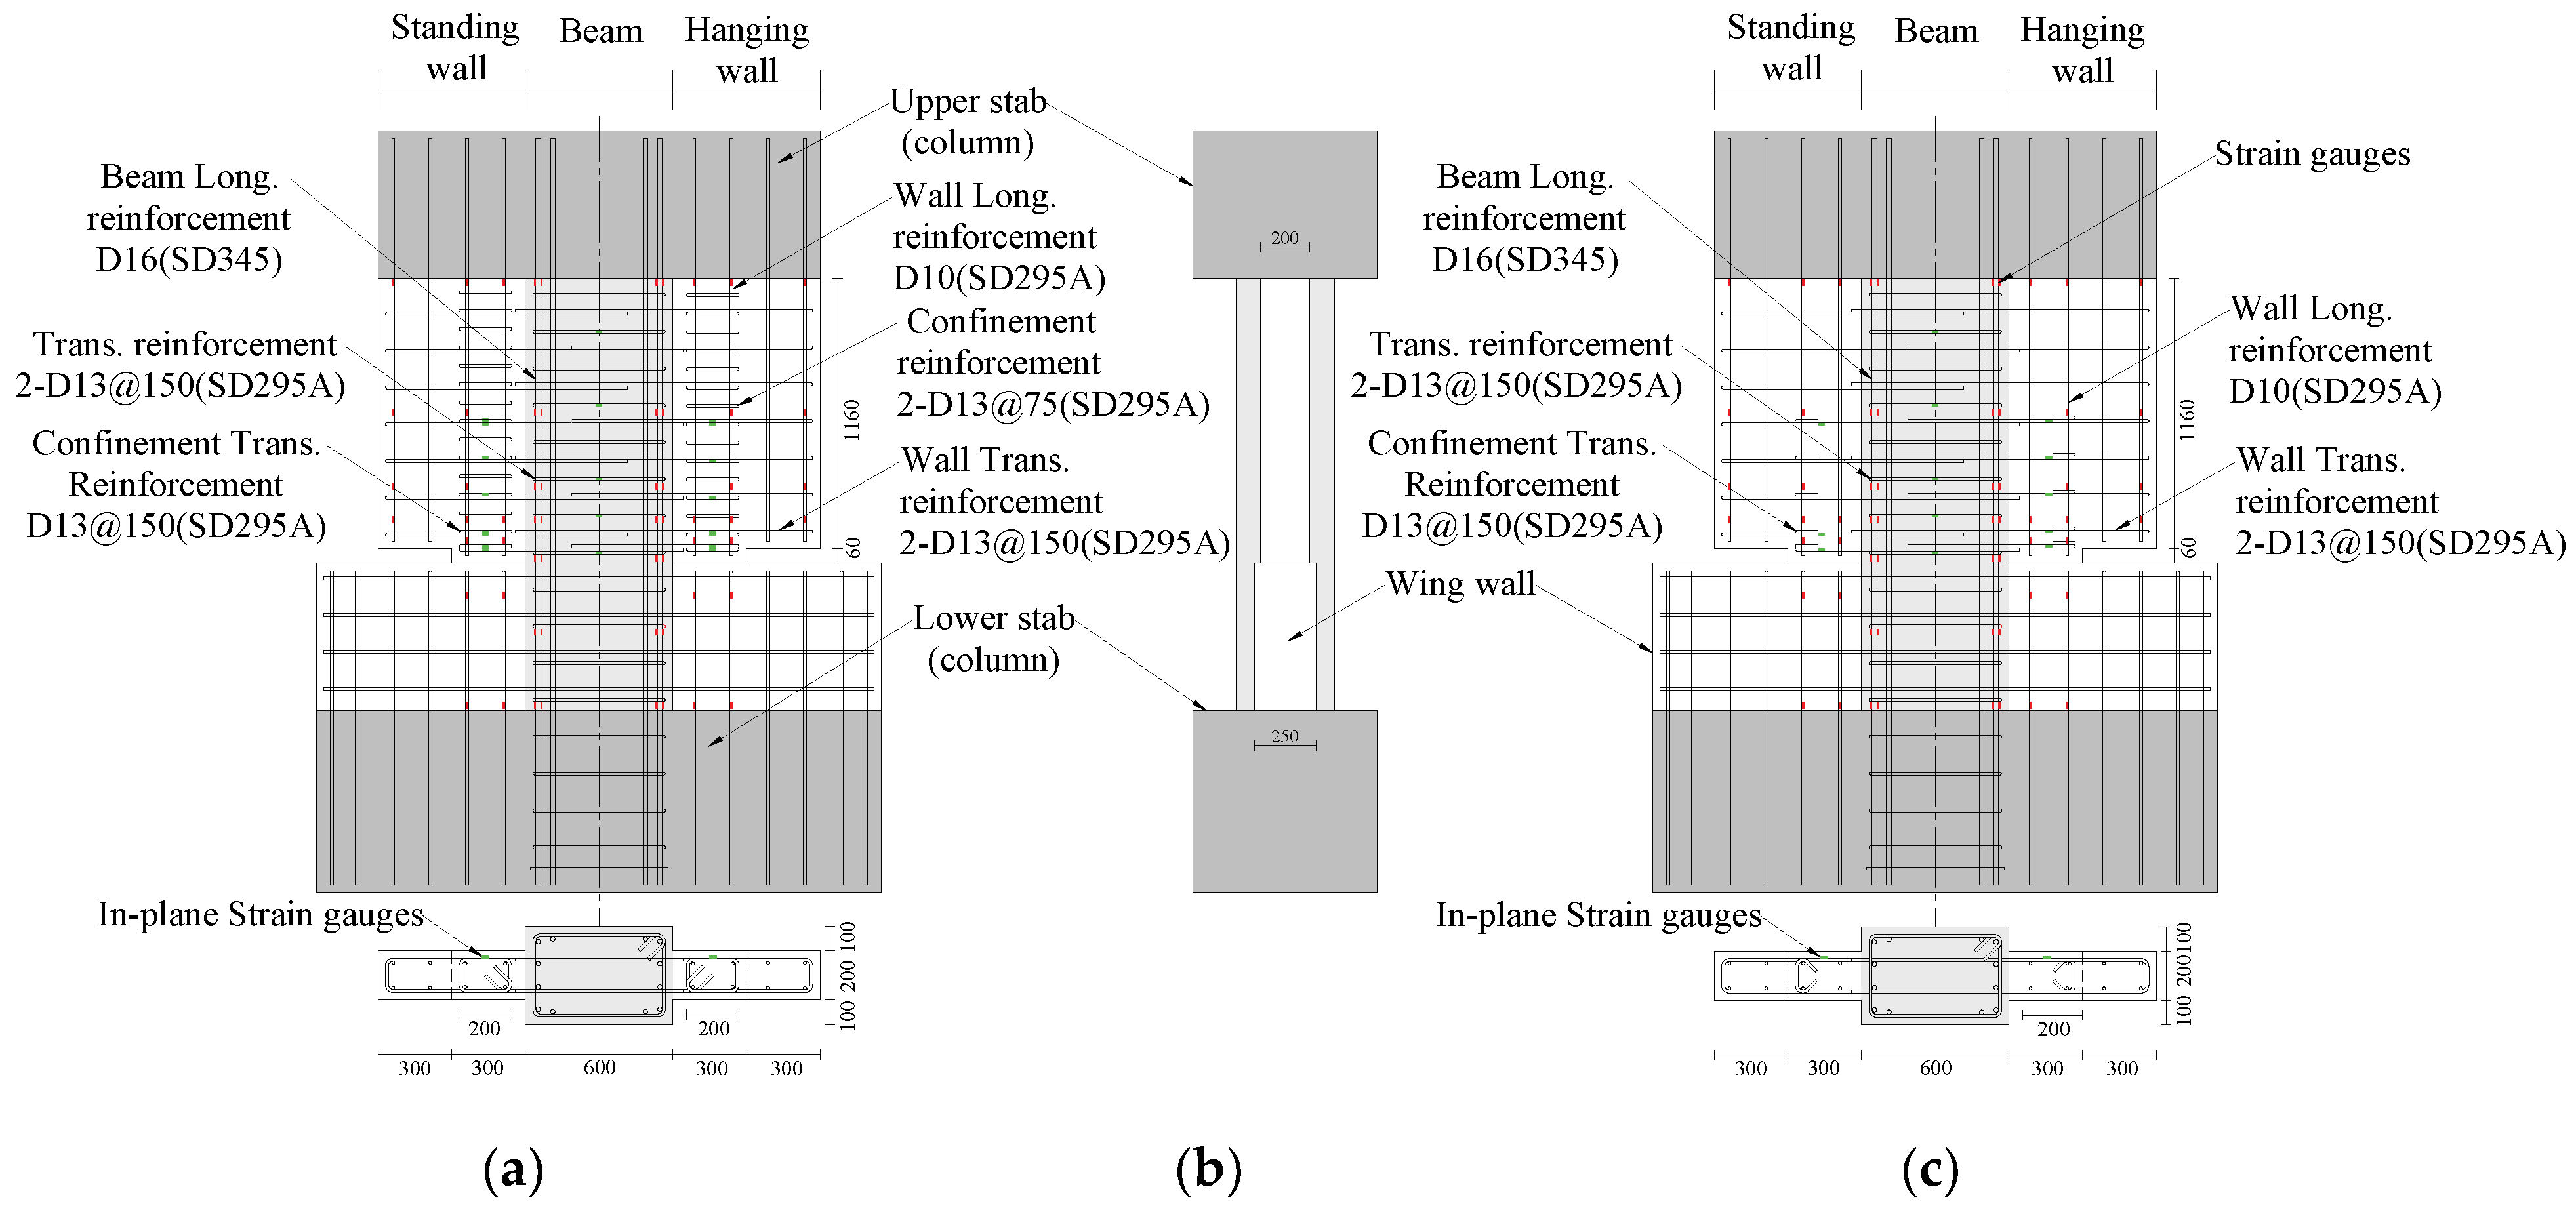
3.1. Test Specimens
3.2. Test Results
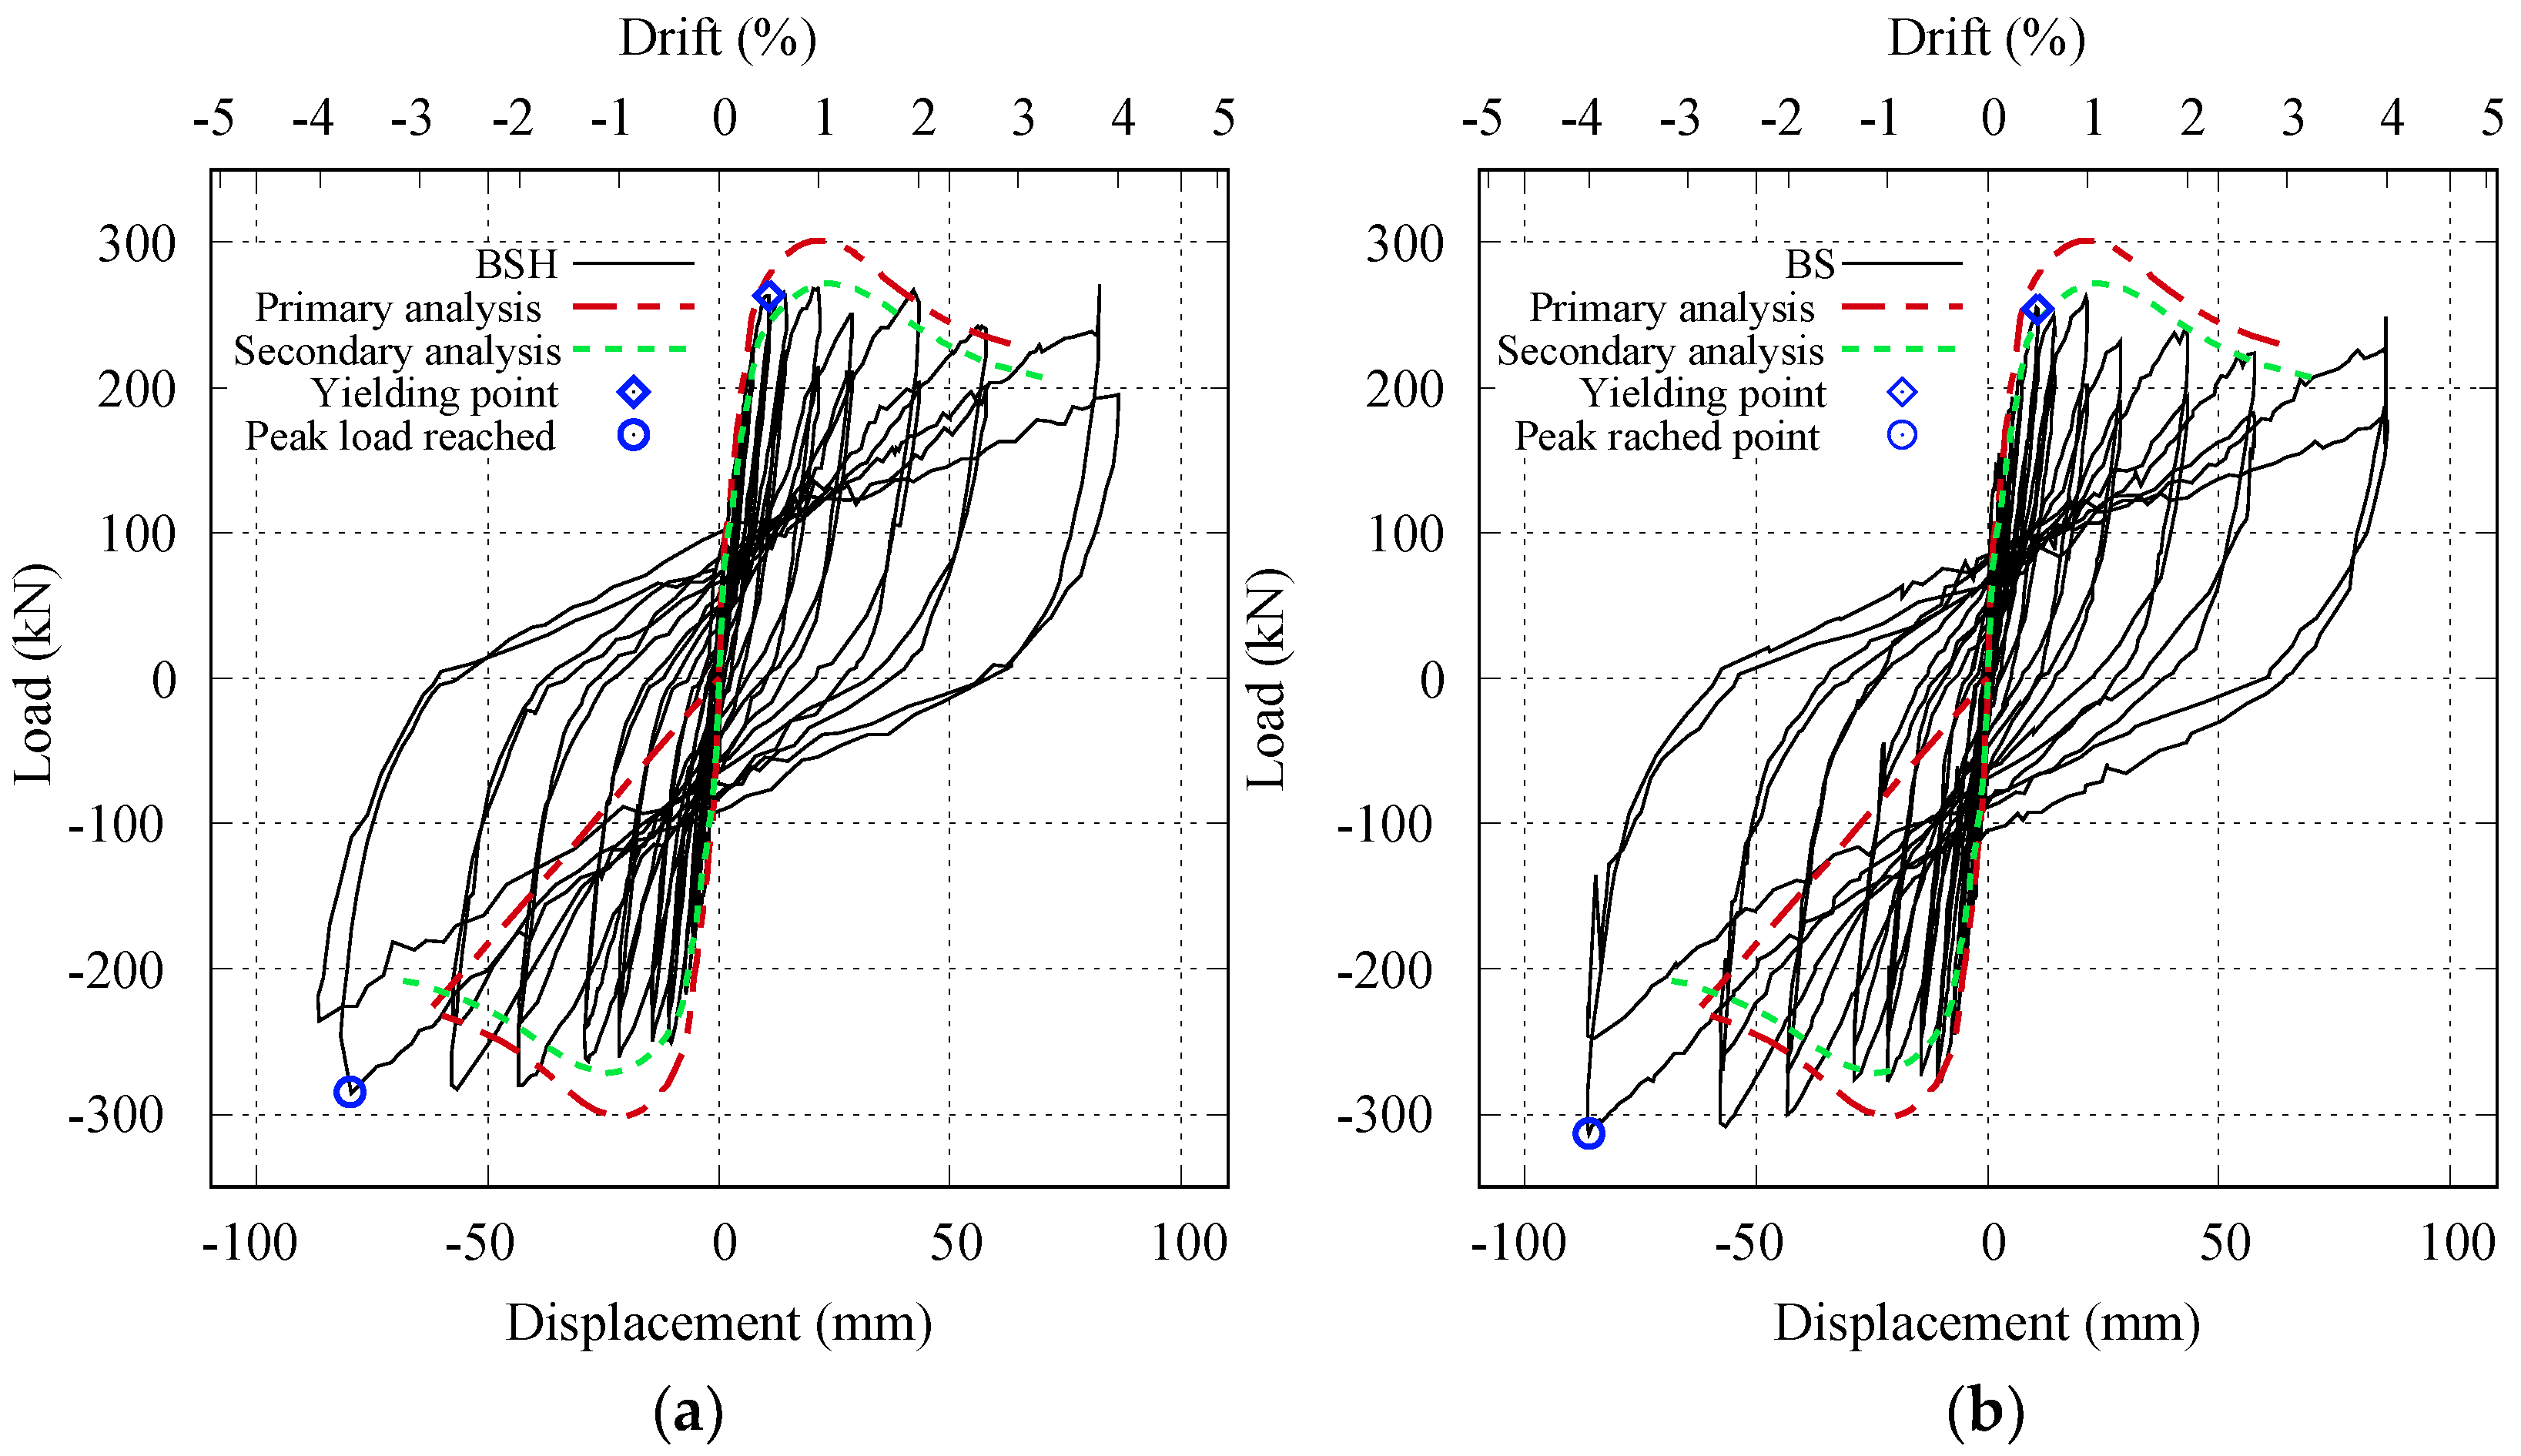
3.2.1. Relationship between Horizontal Load and Drift Angle
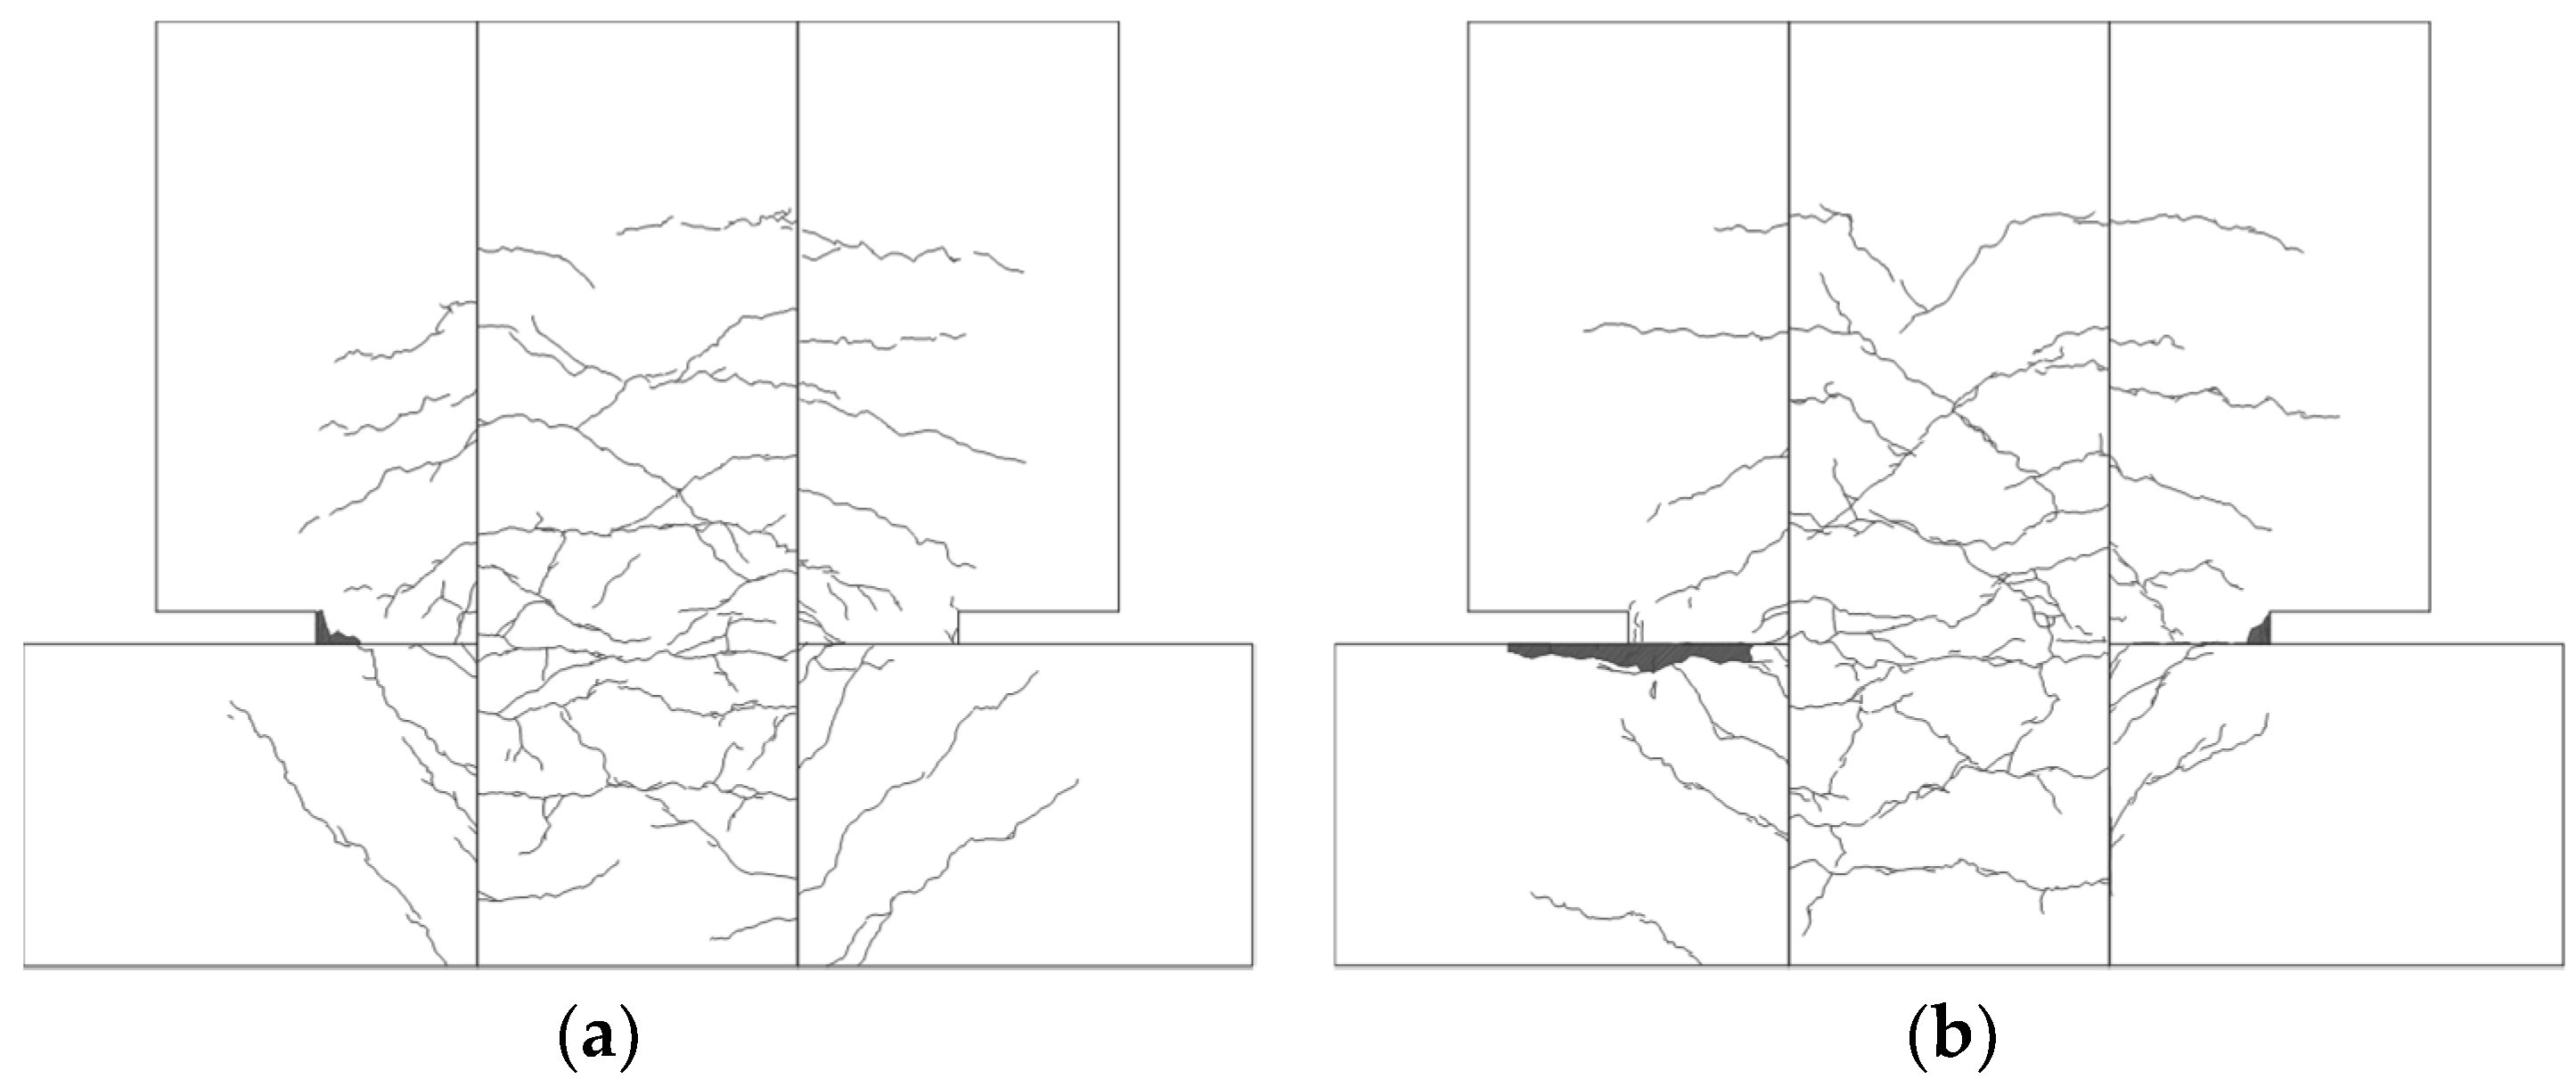
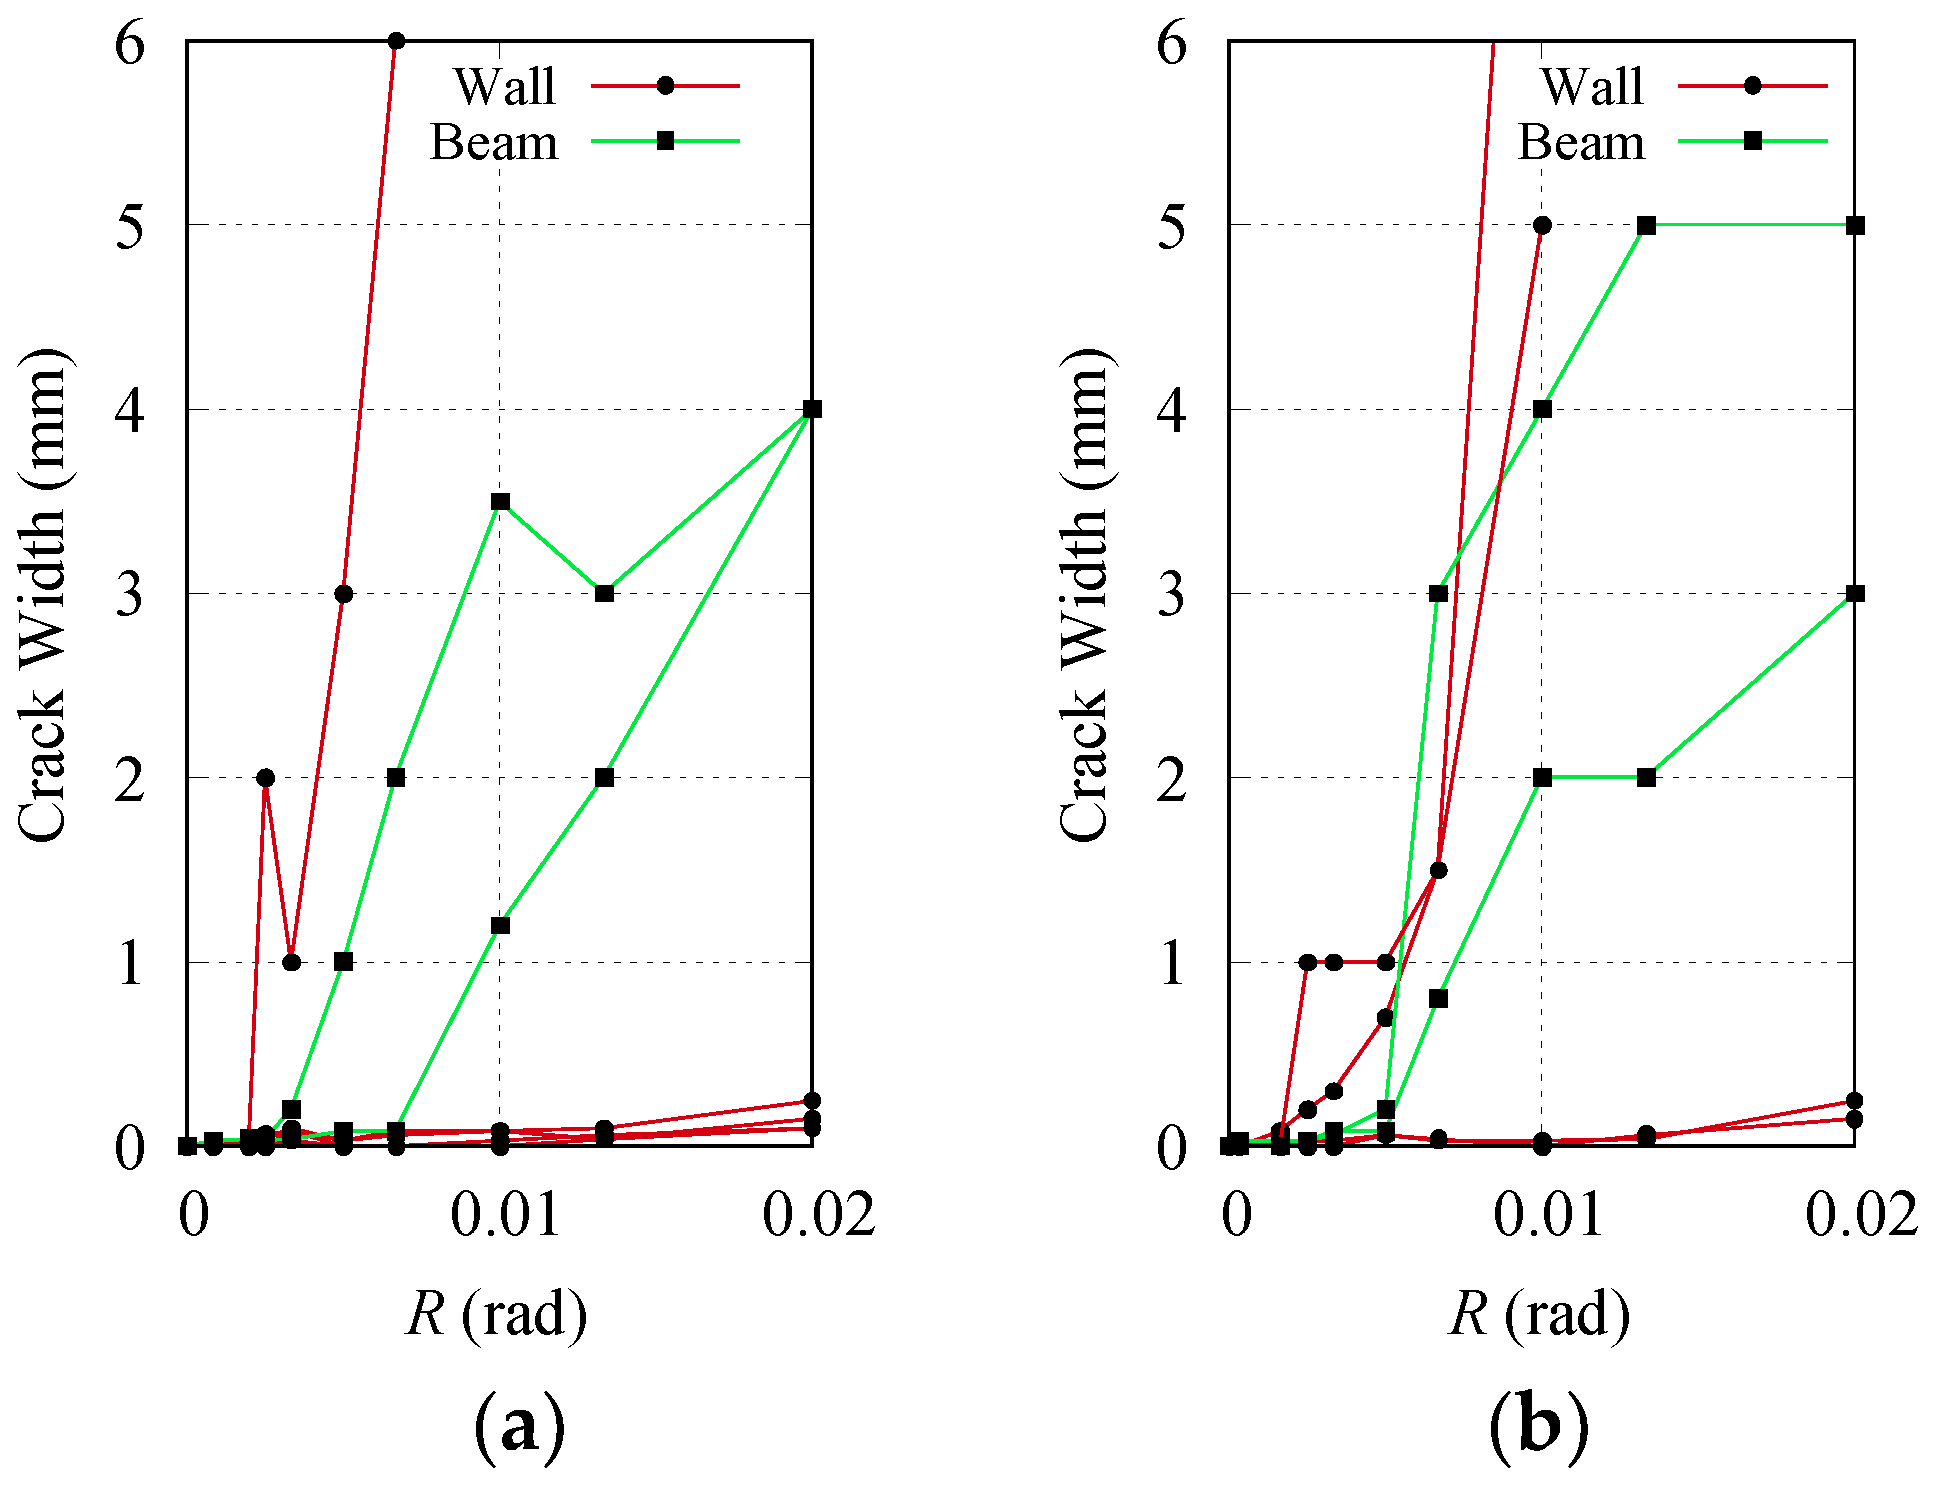
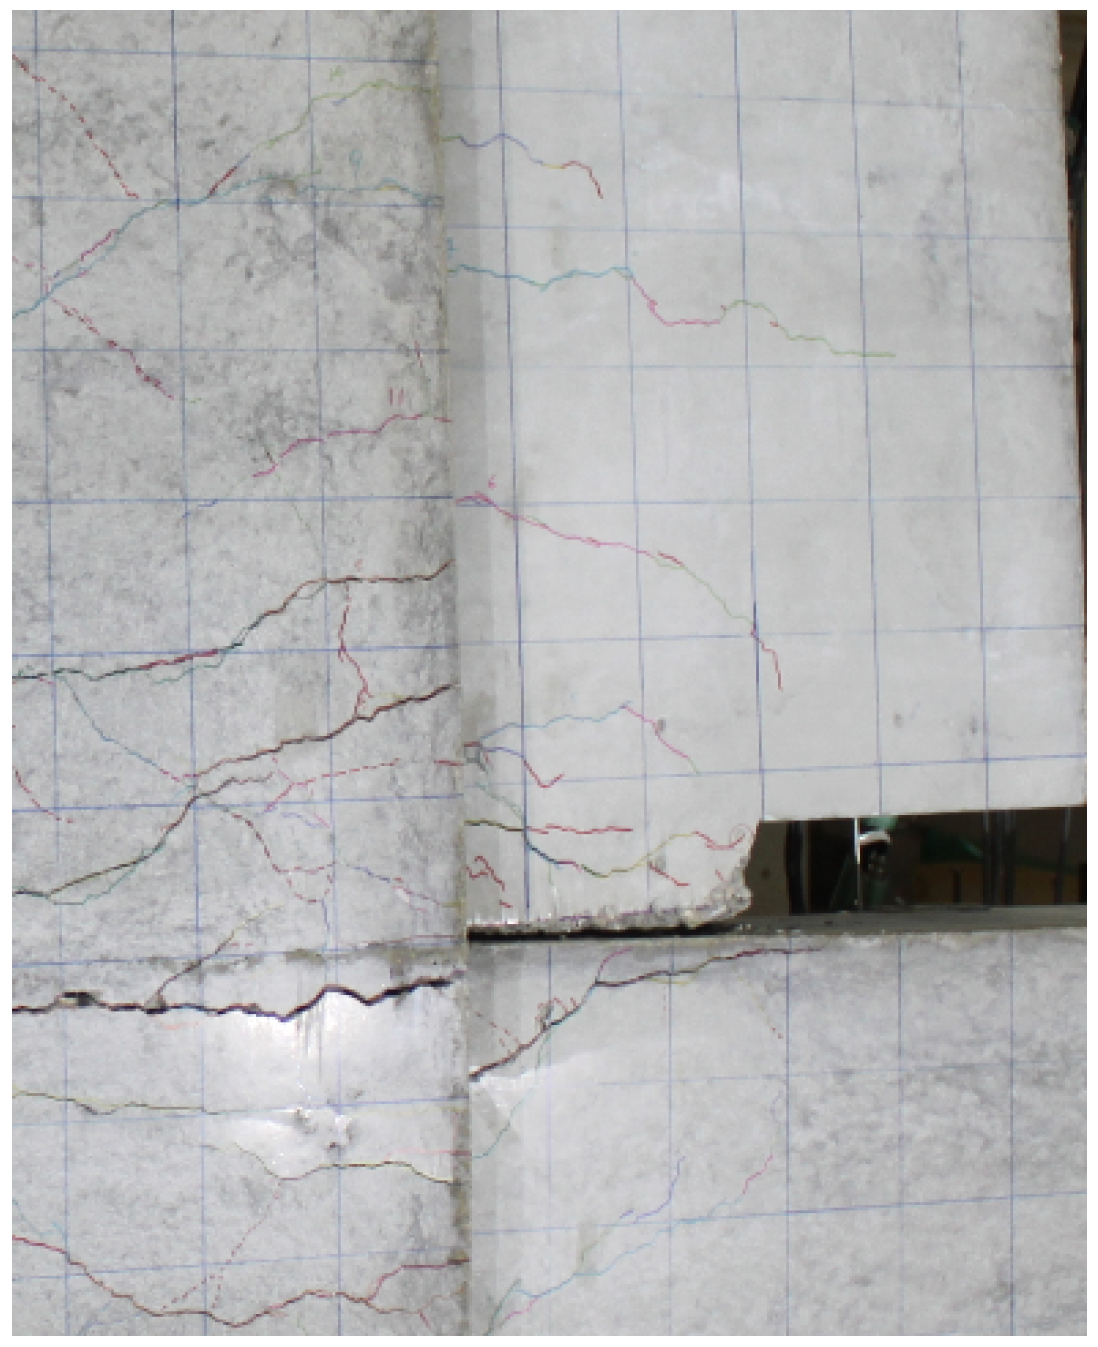
3.2.2. Cracking Behavior
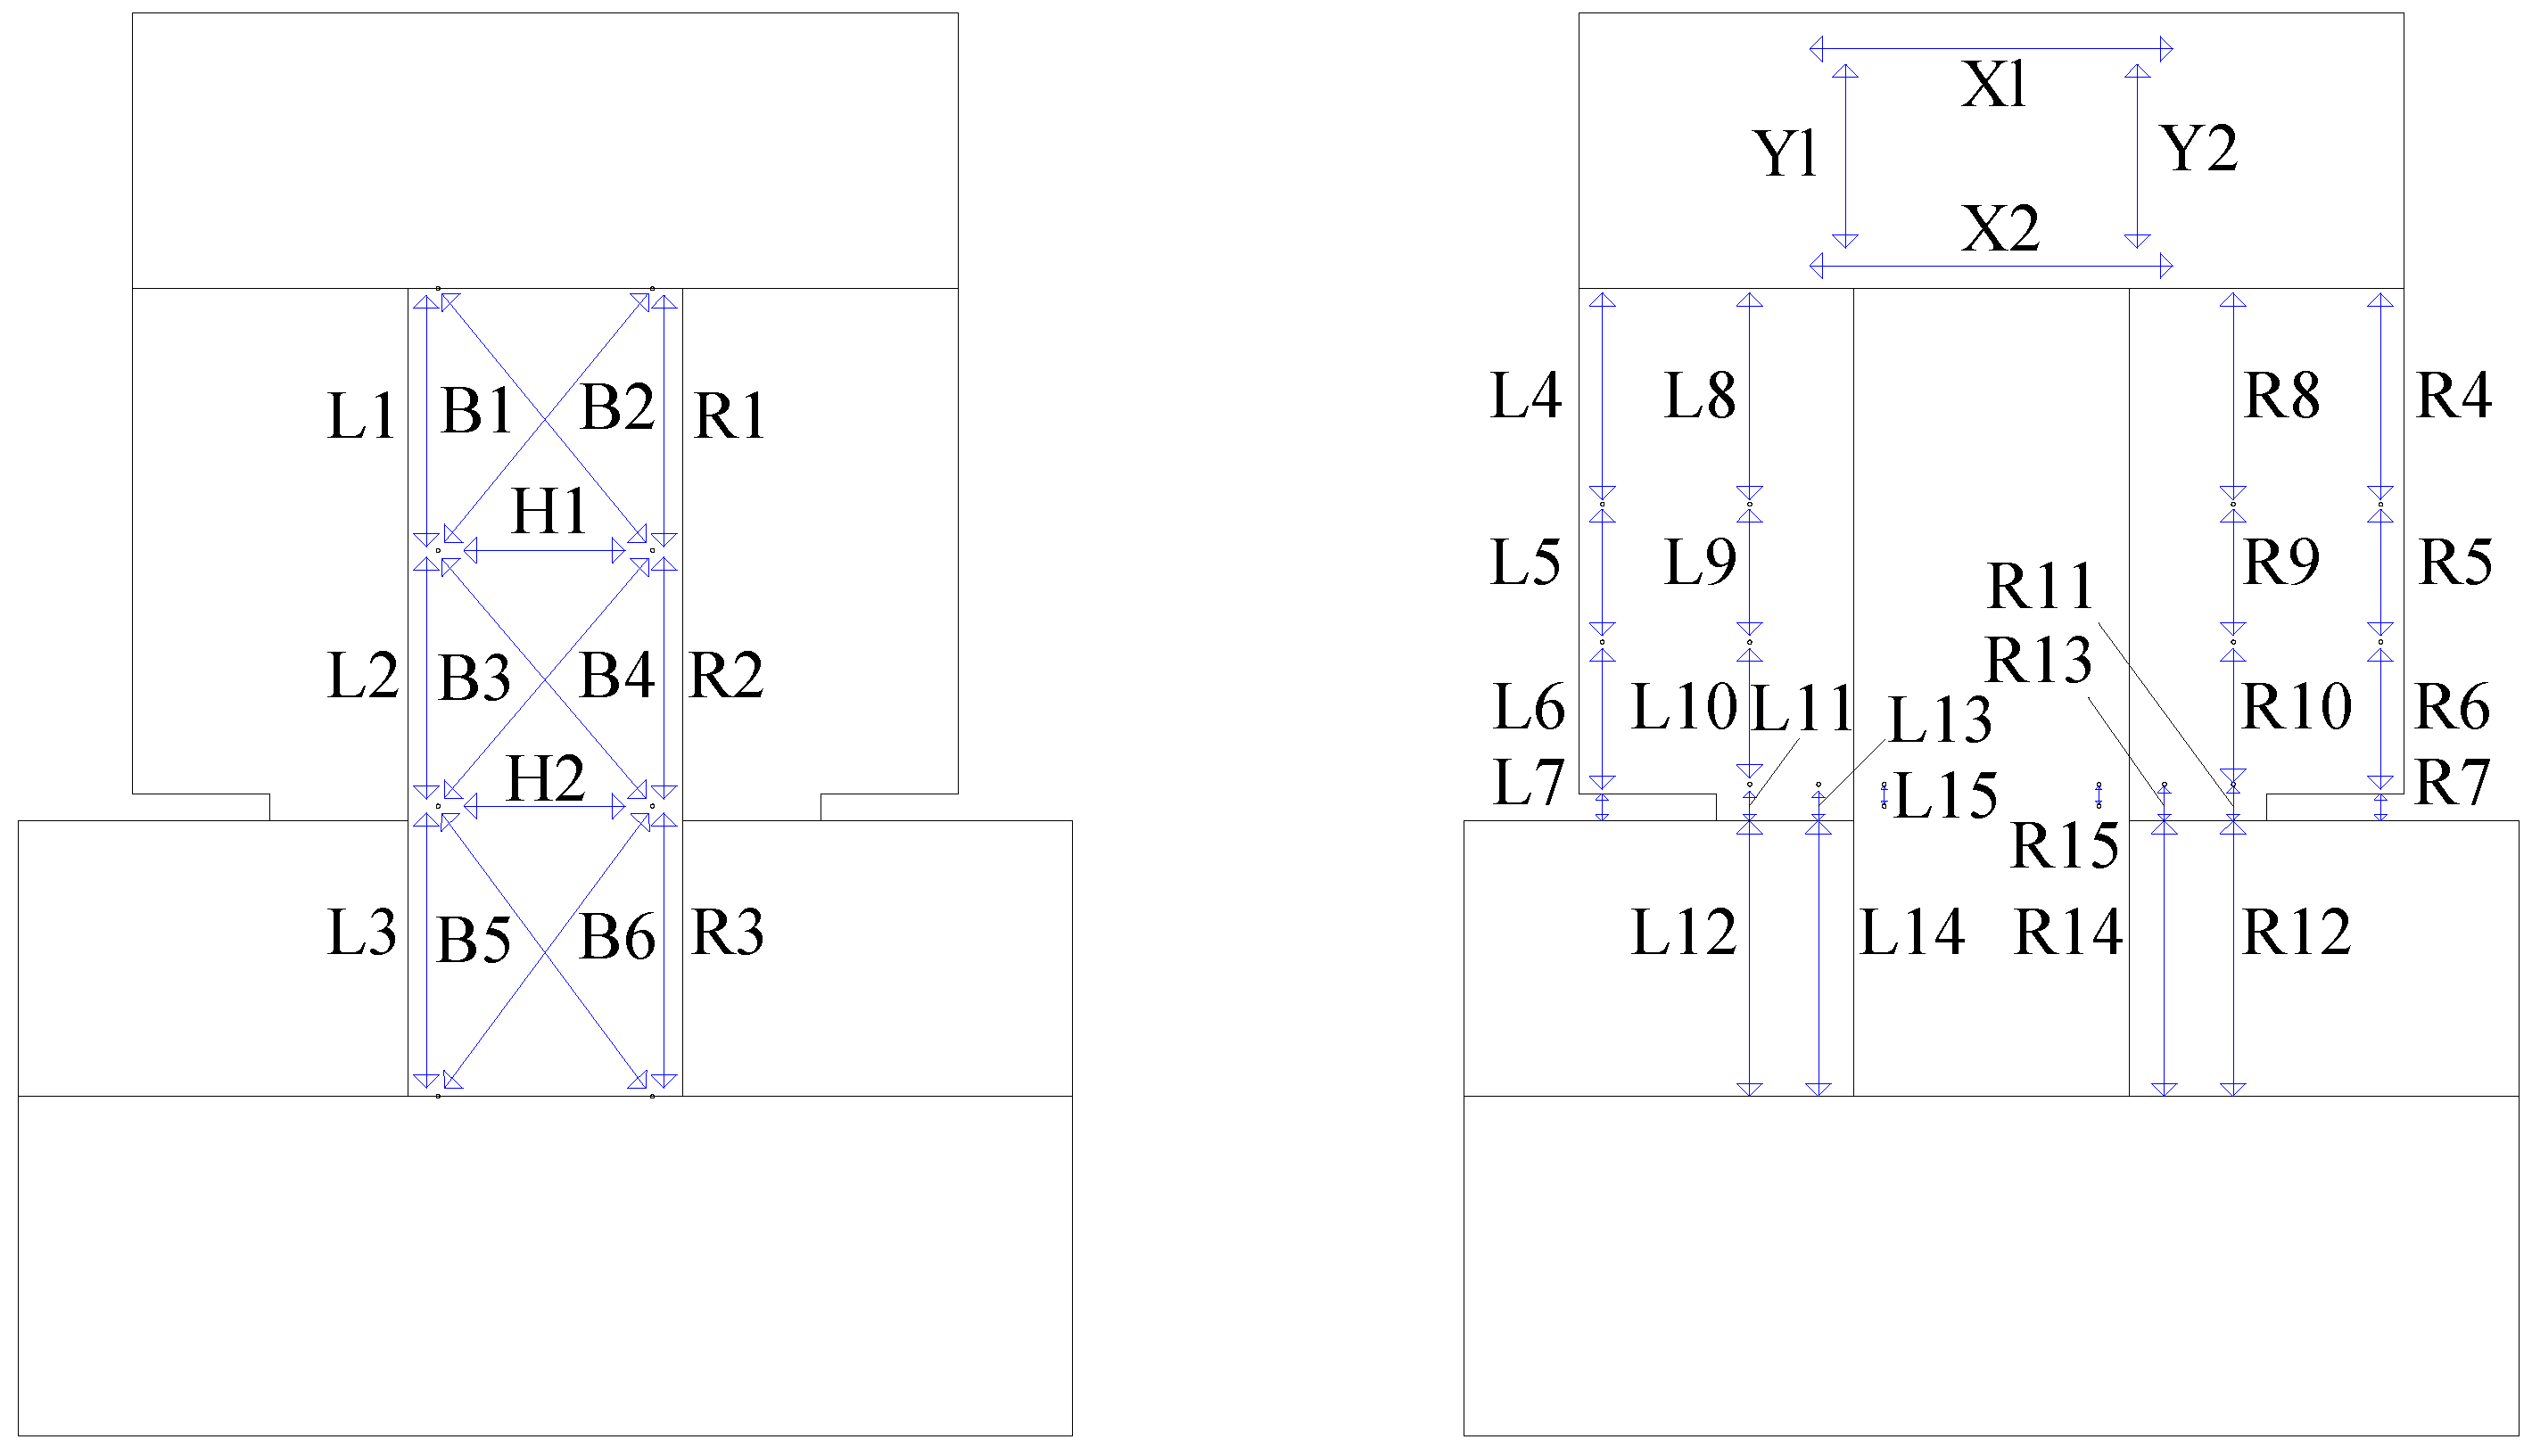
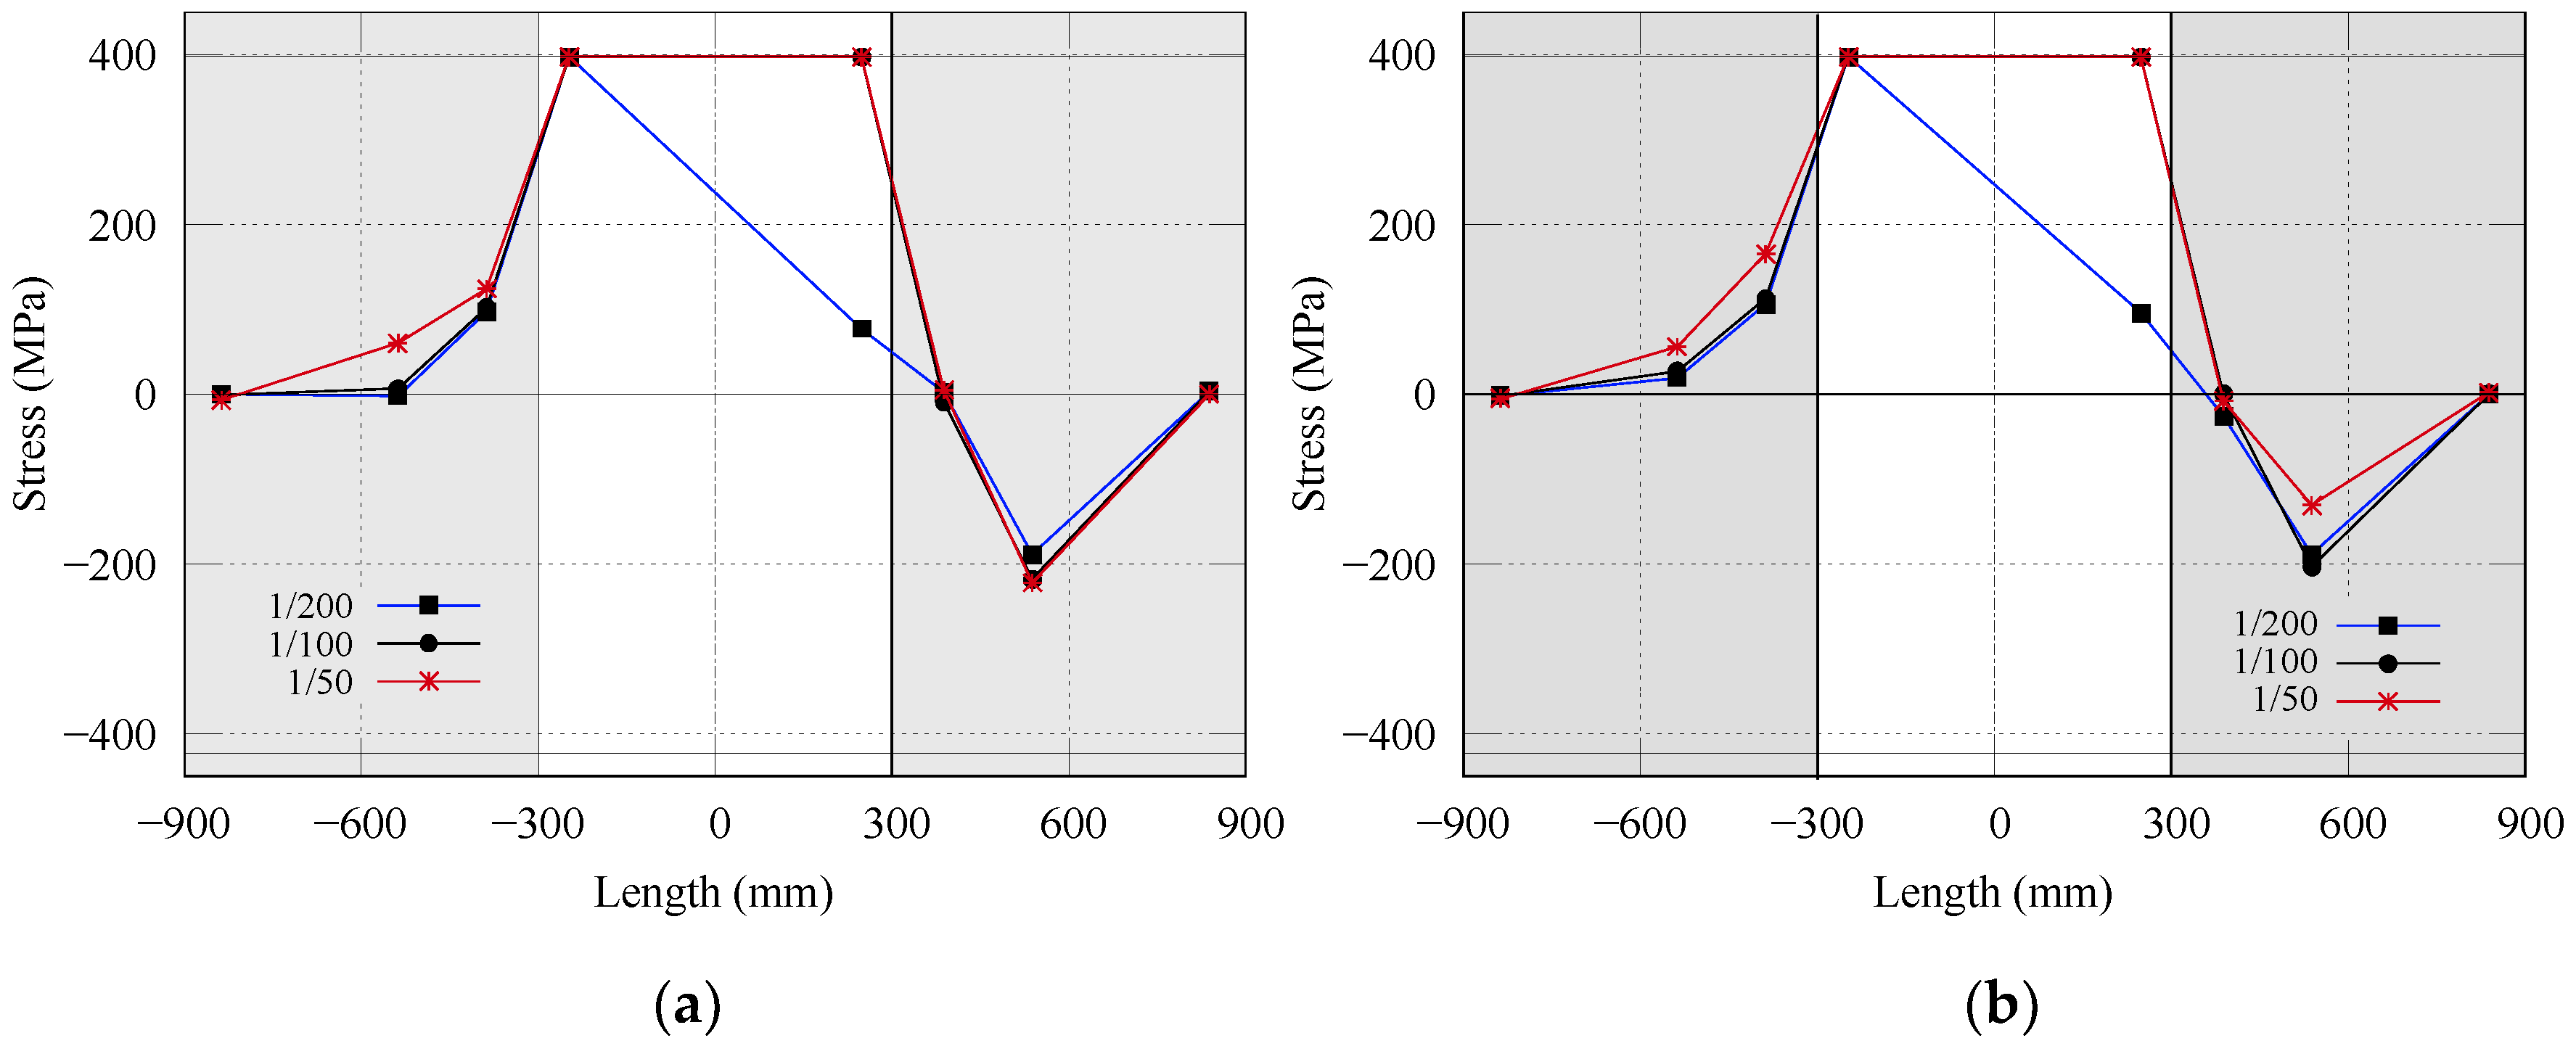
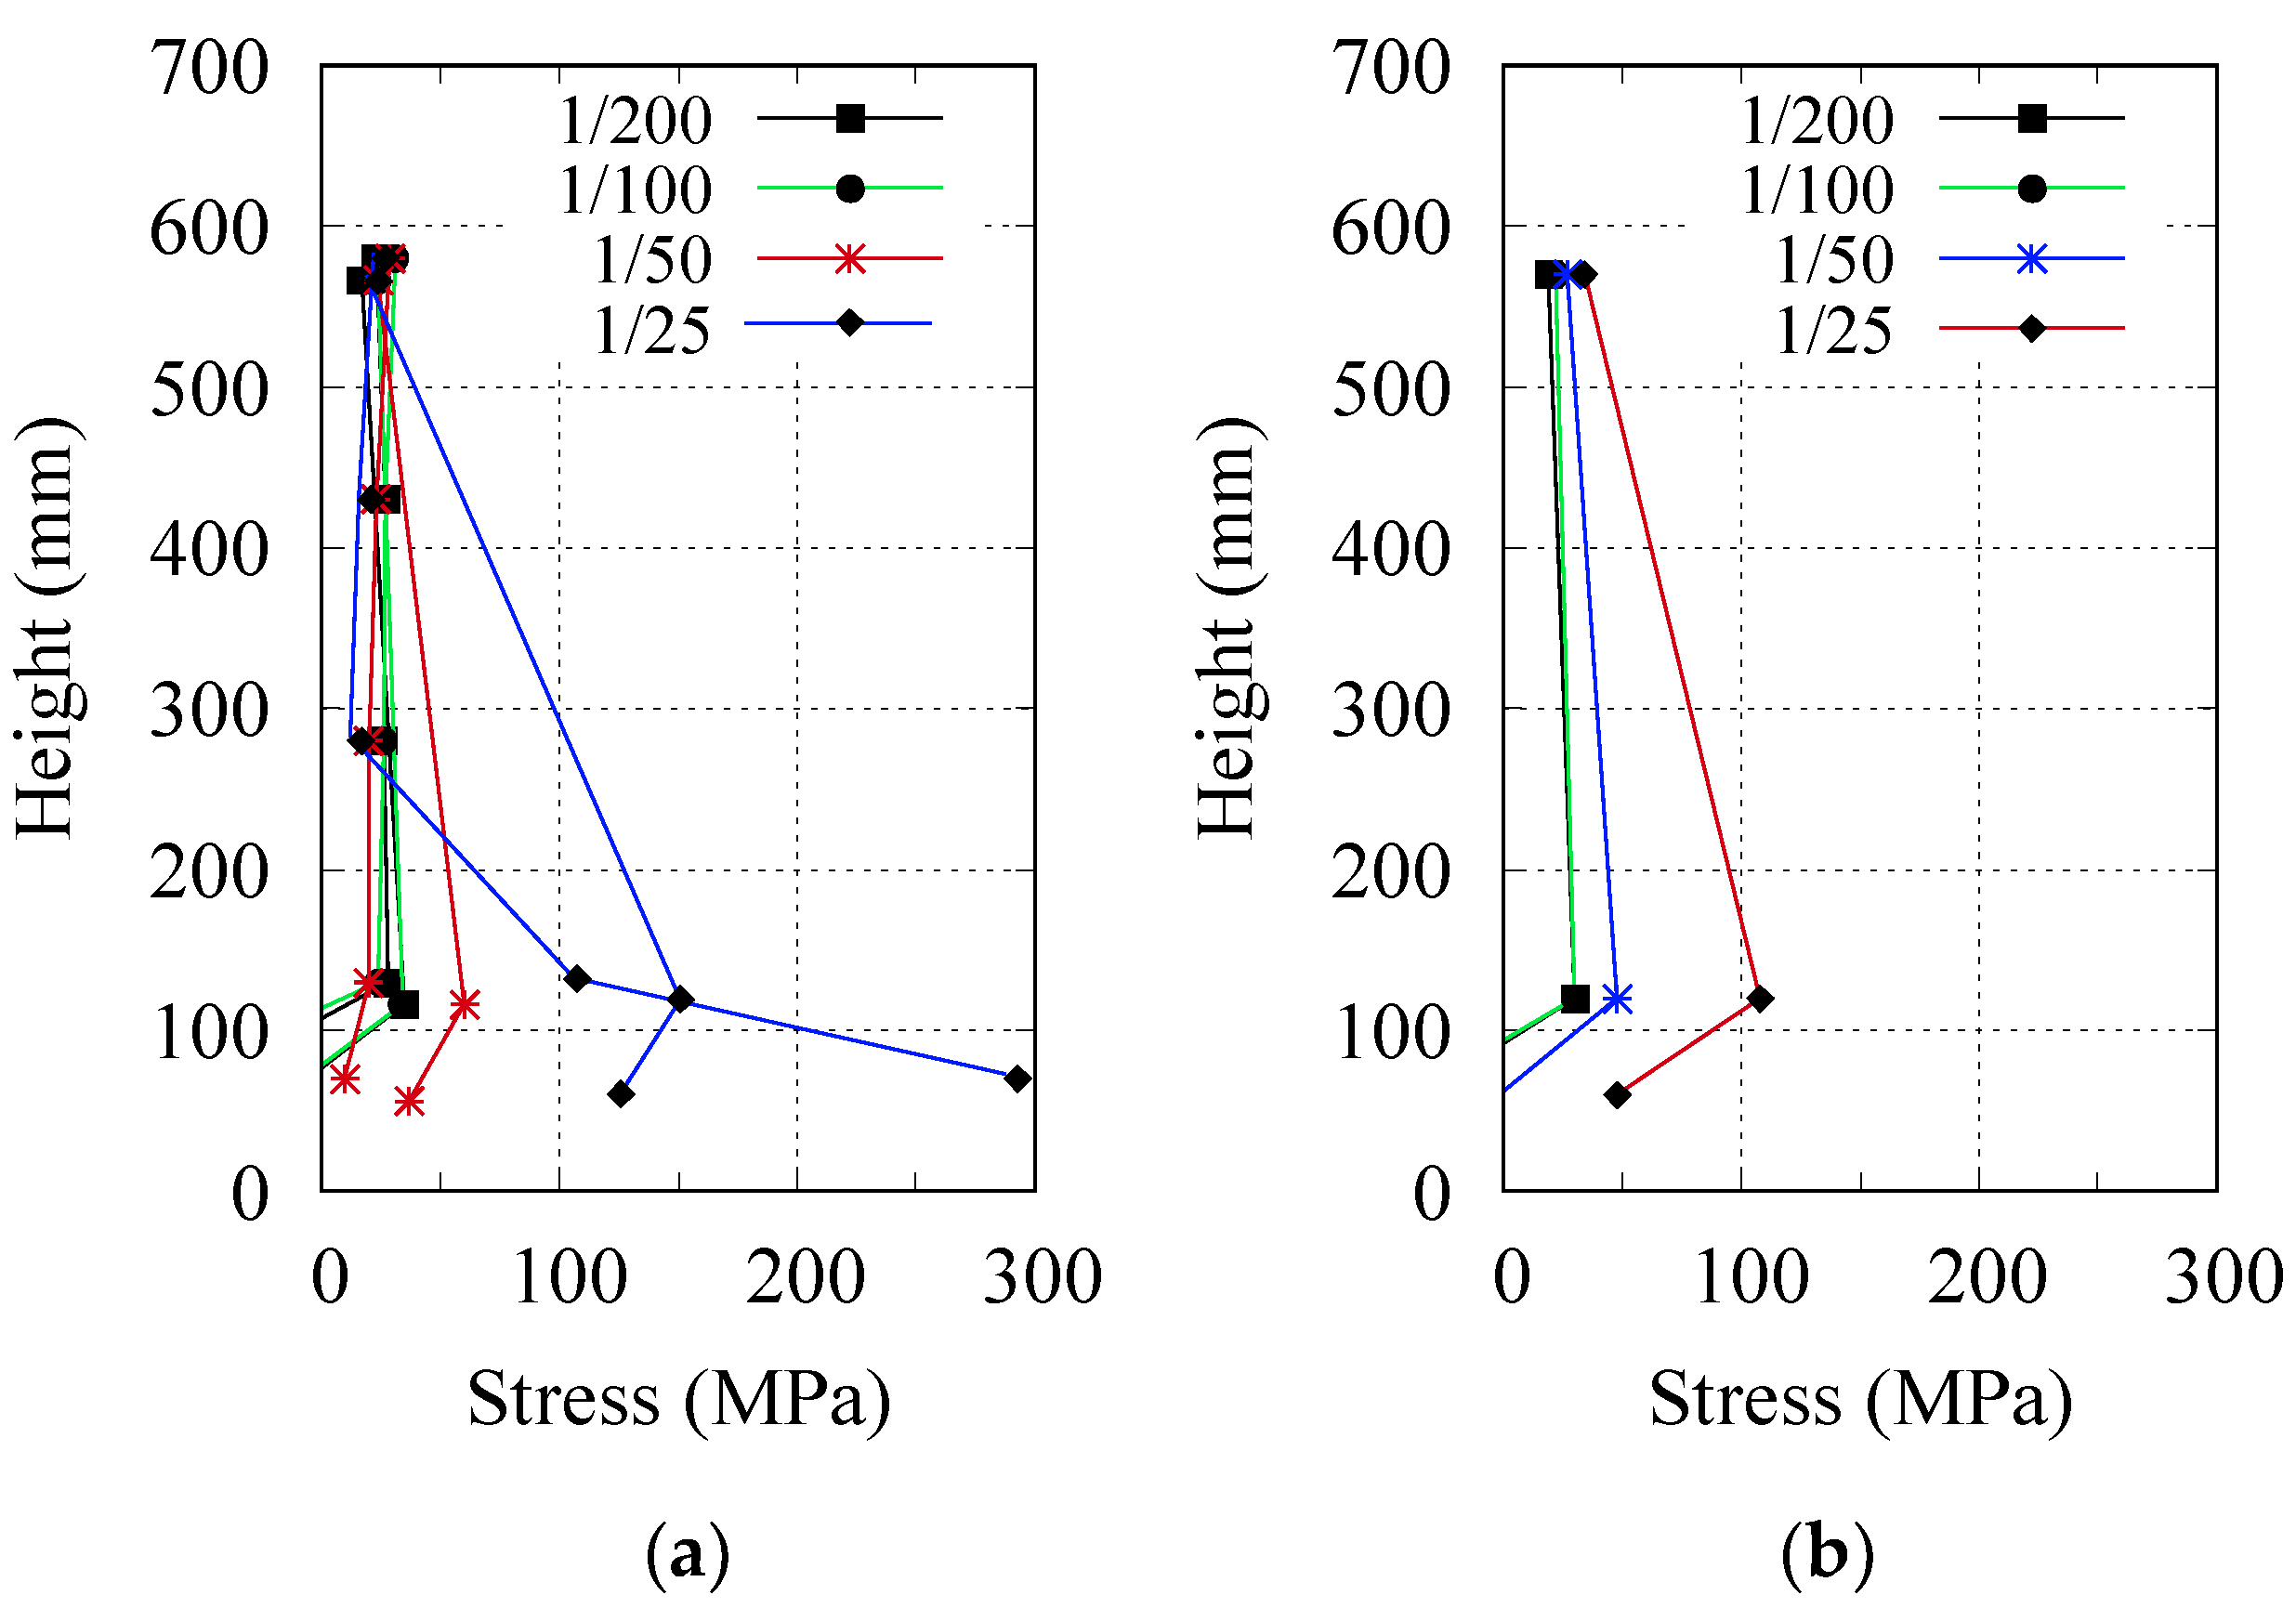
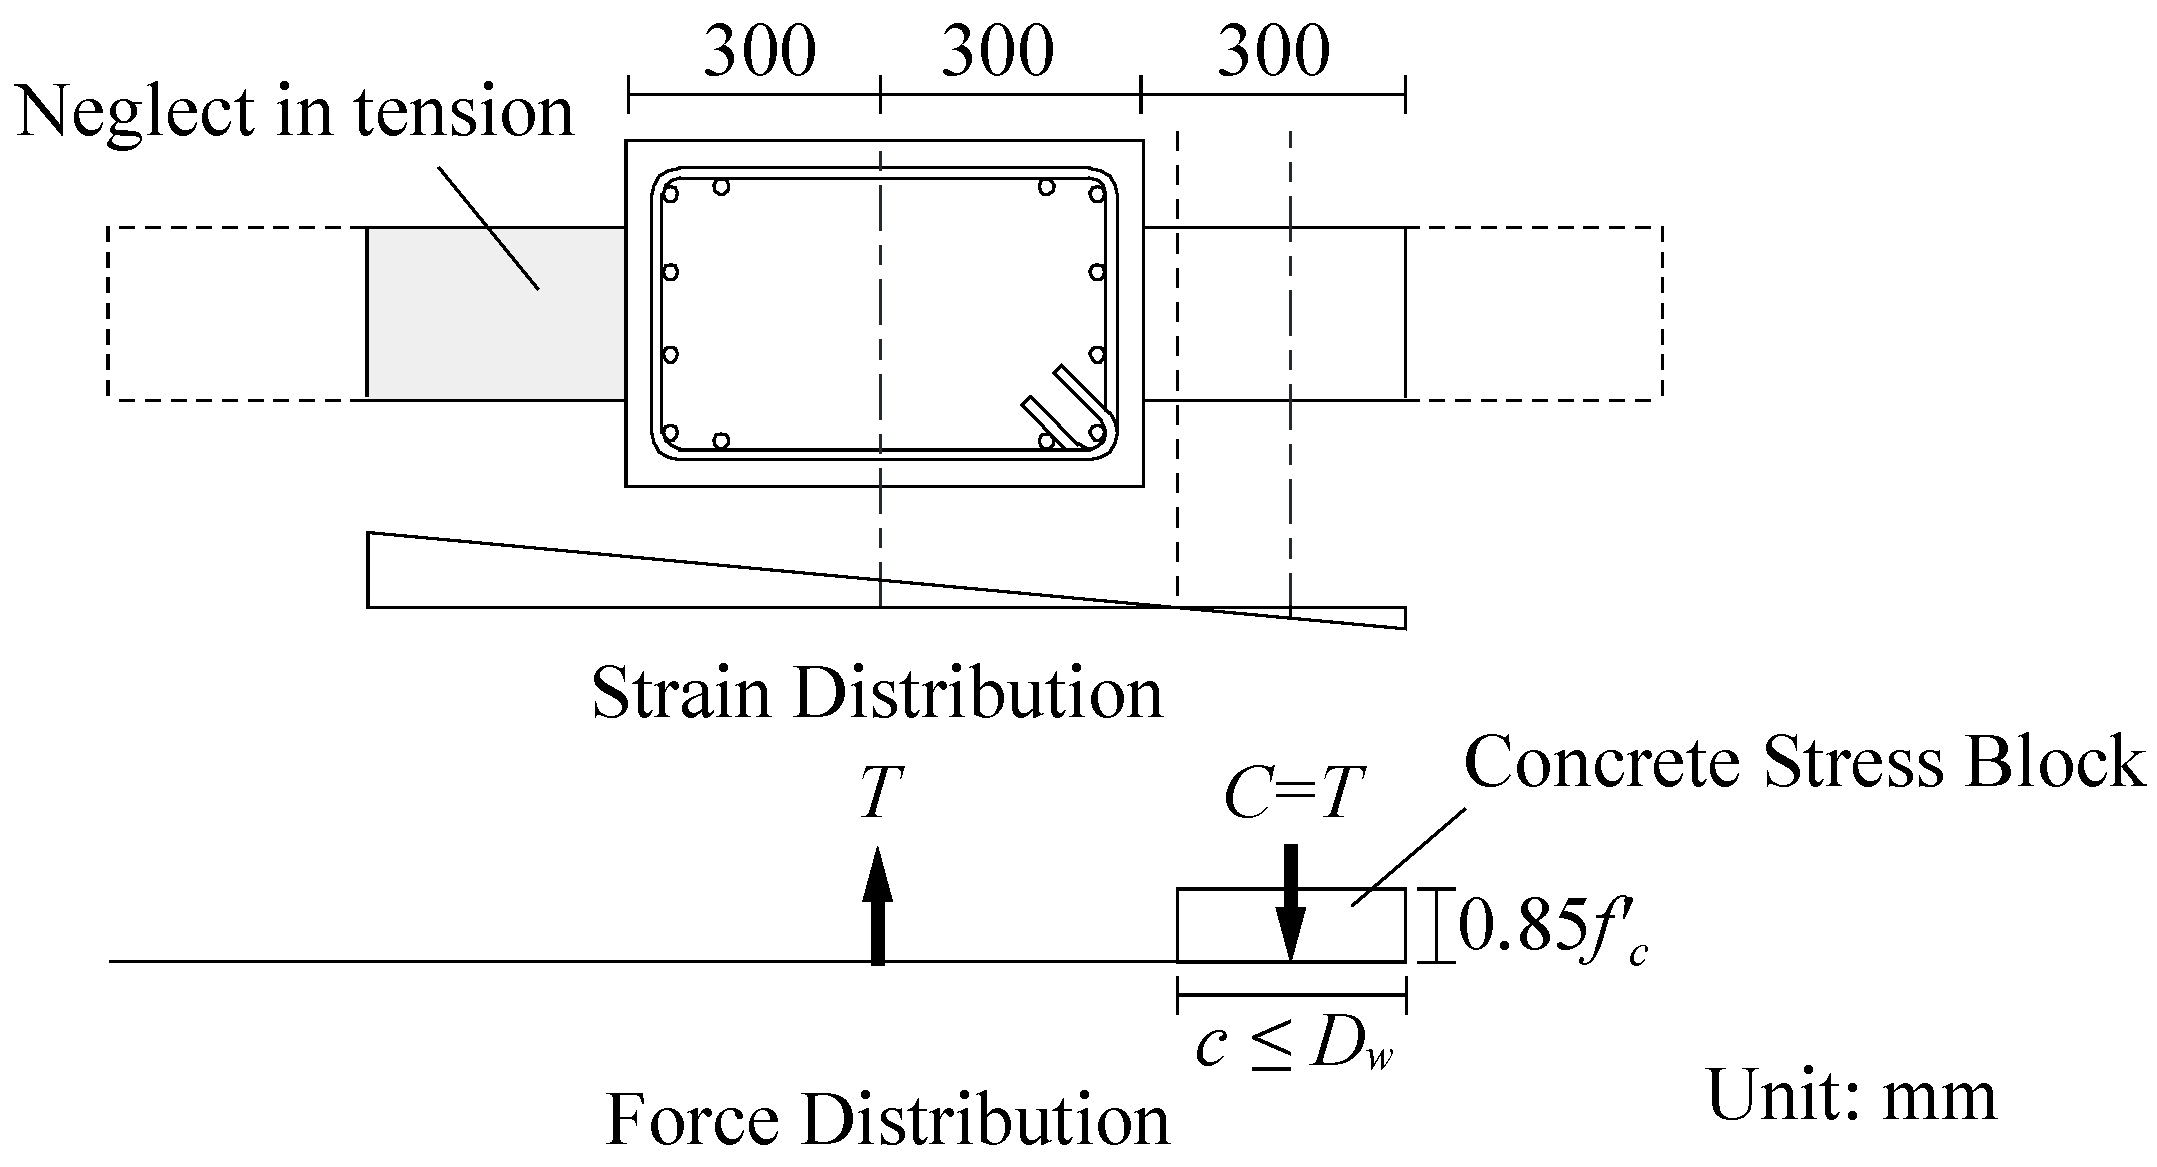
3.2.3. Stress Distributions
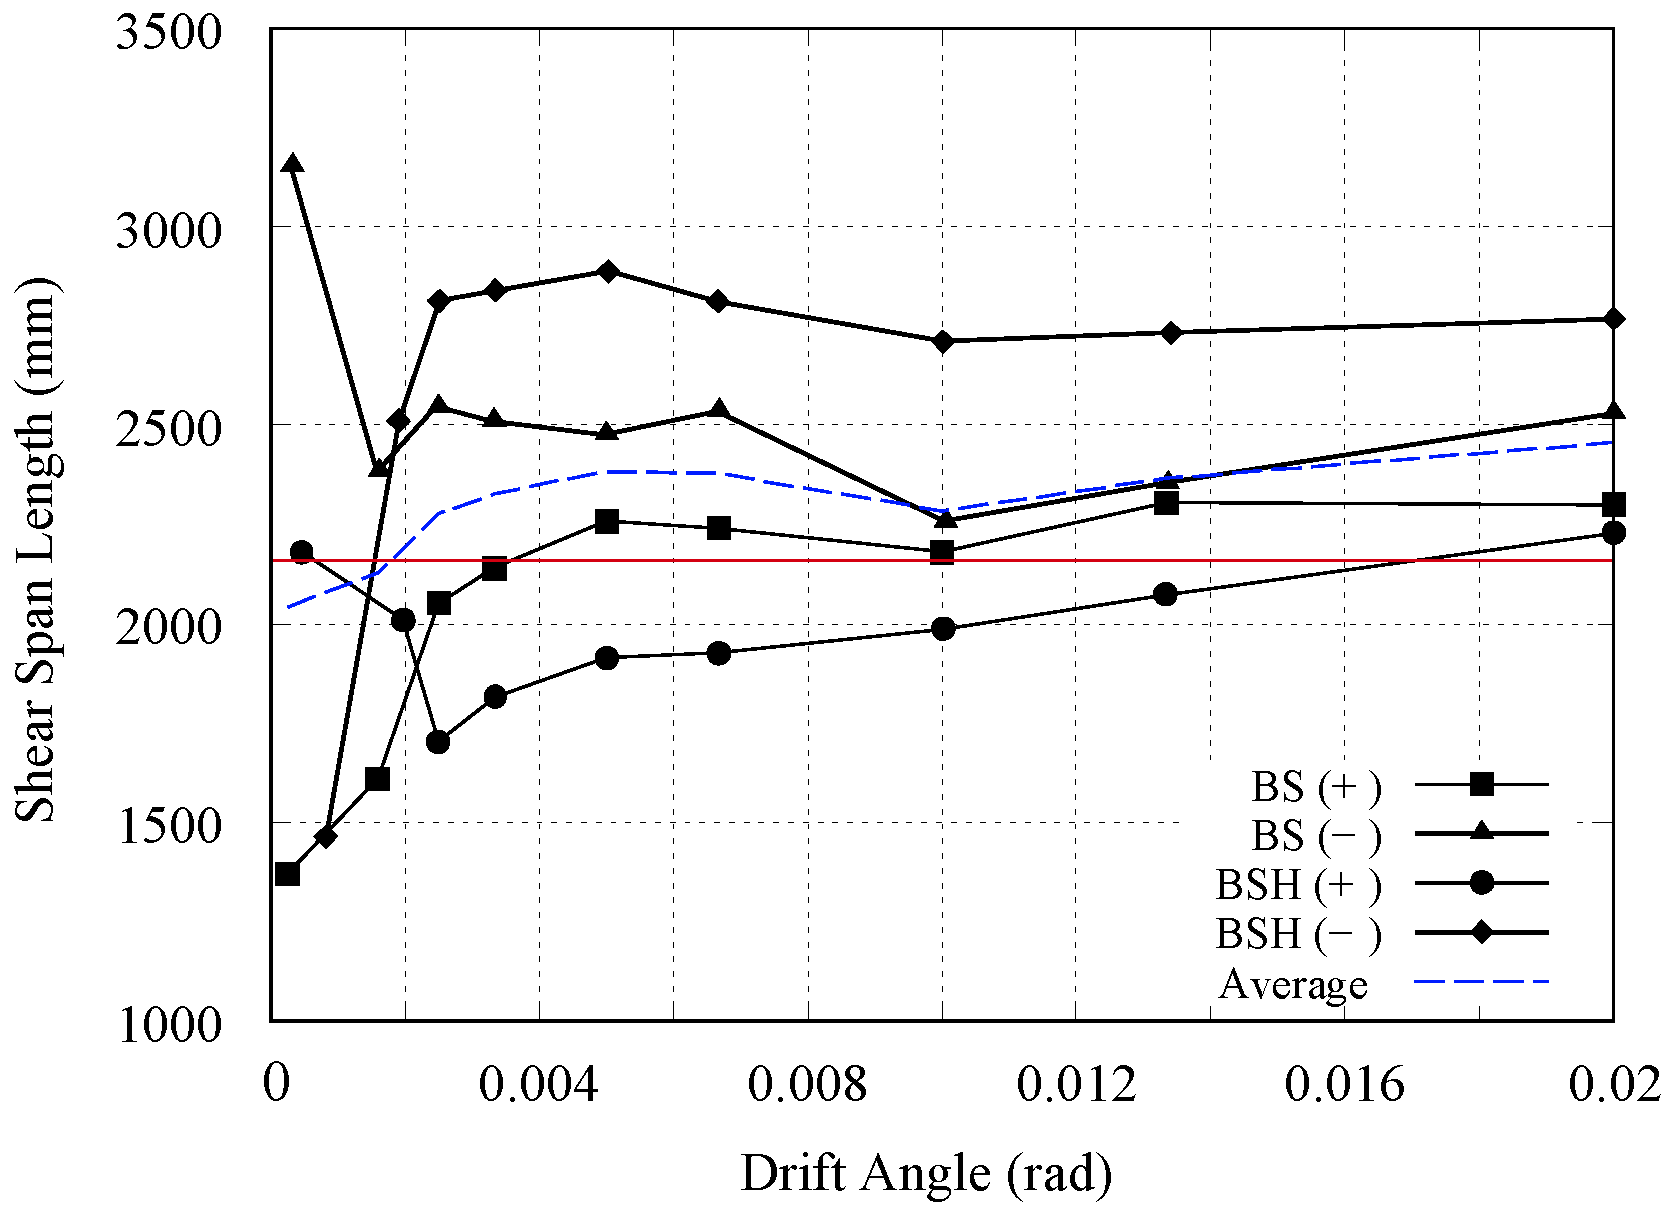
3.2.4. Prediction of Shear Span Length
3.2.5. Prediction of Shear Strength
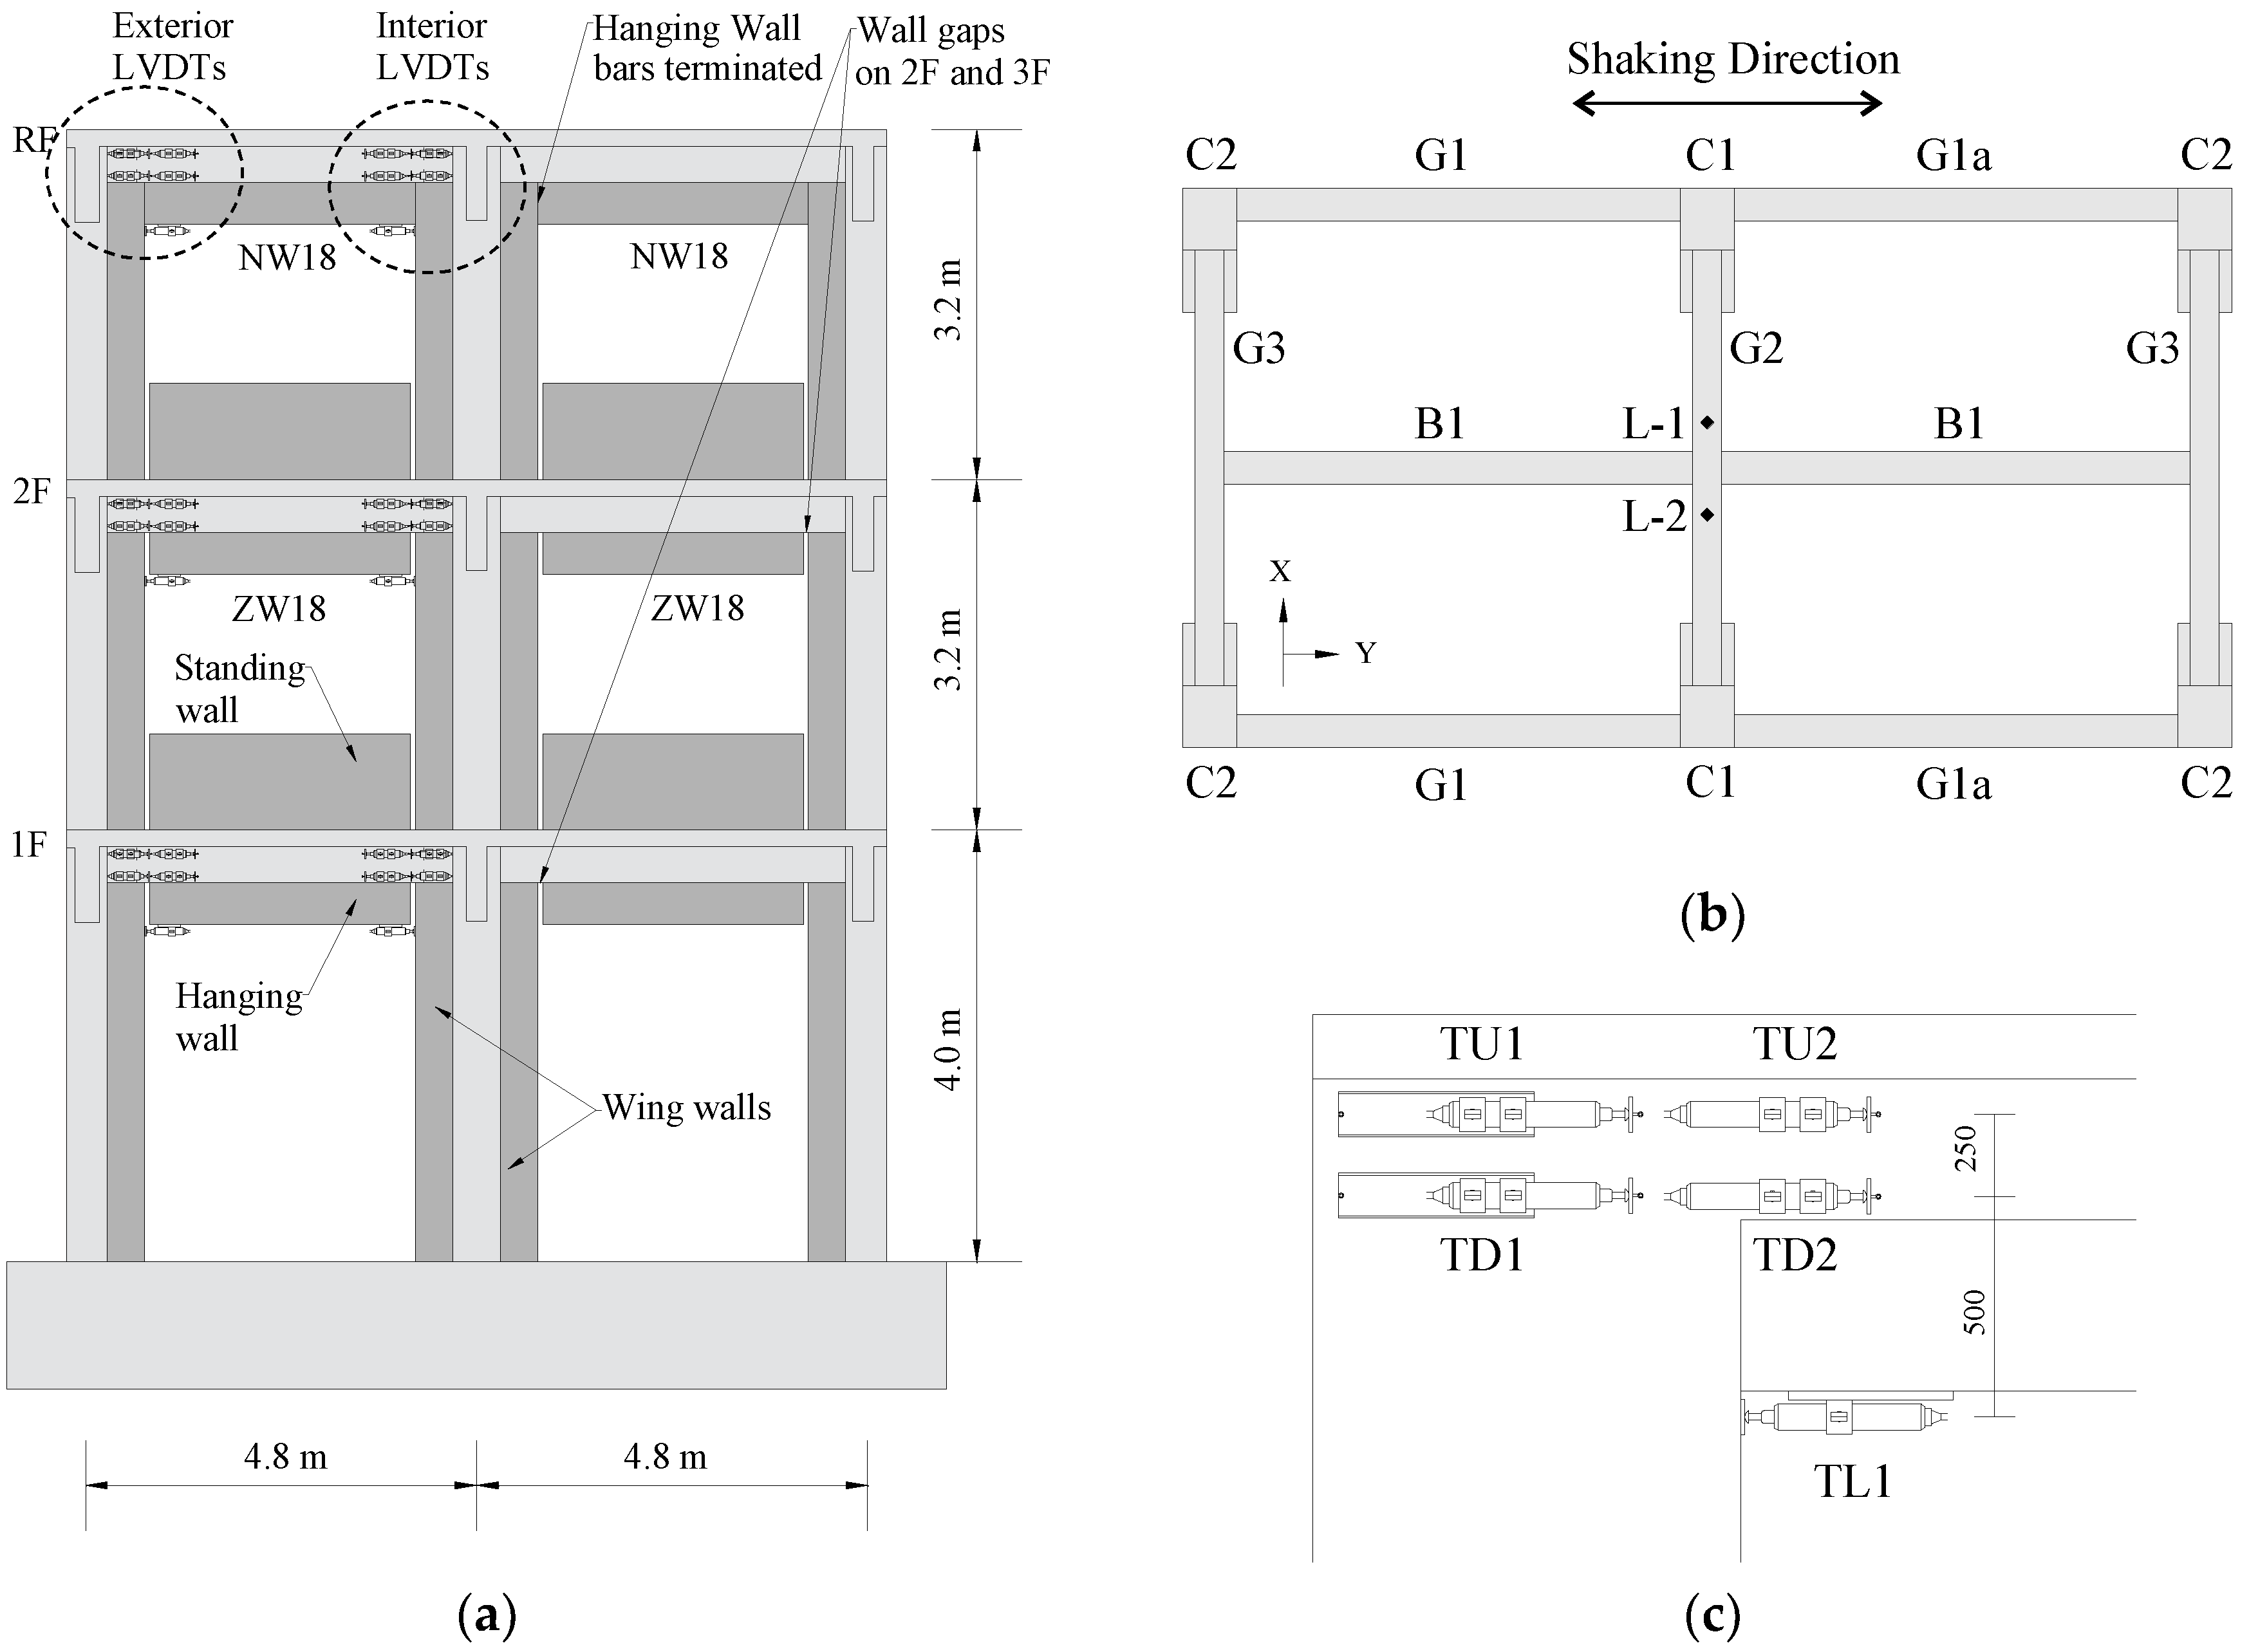
4. Dynamic Evaluation of the Proposed Detailing Method
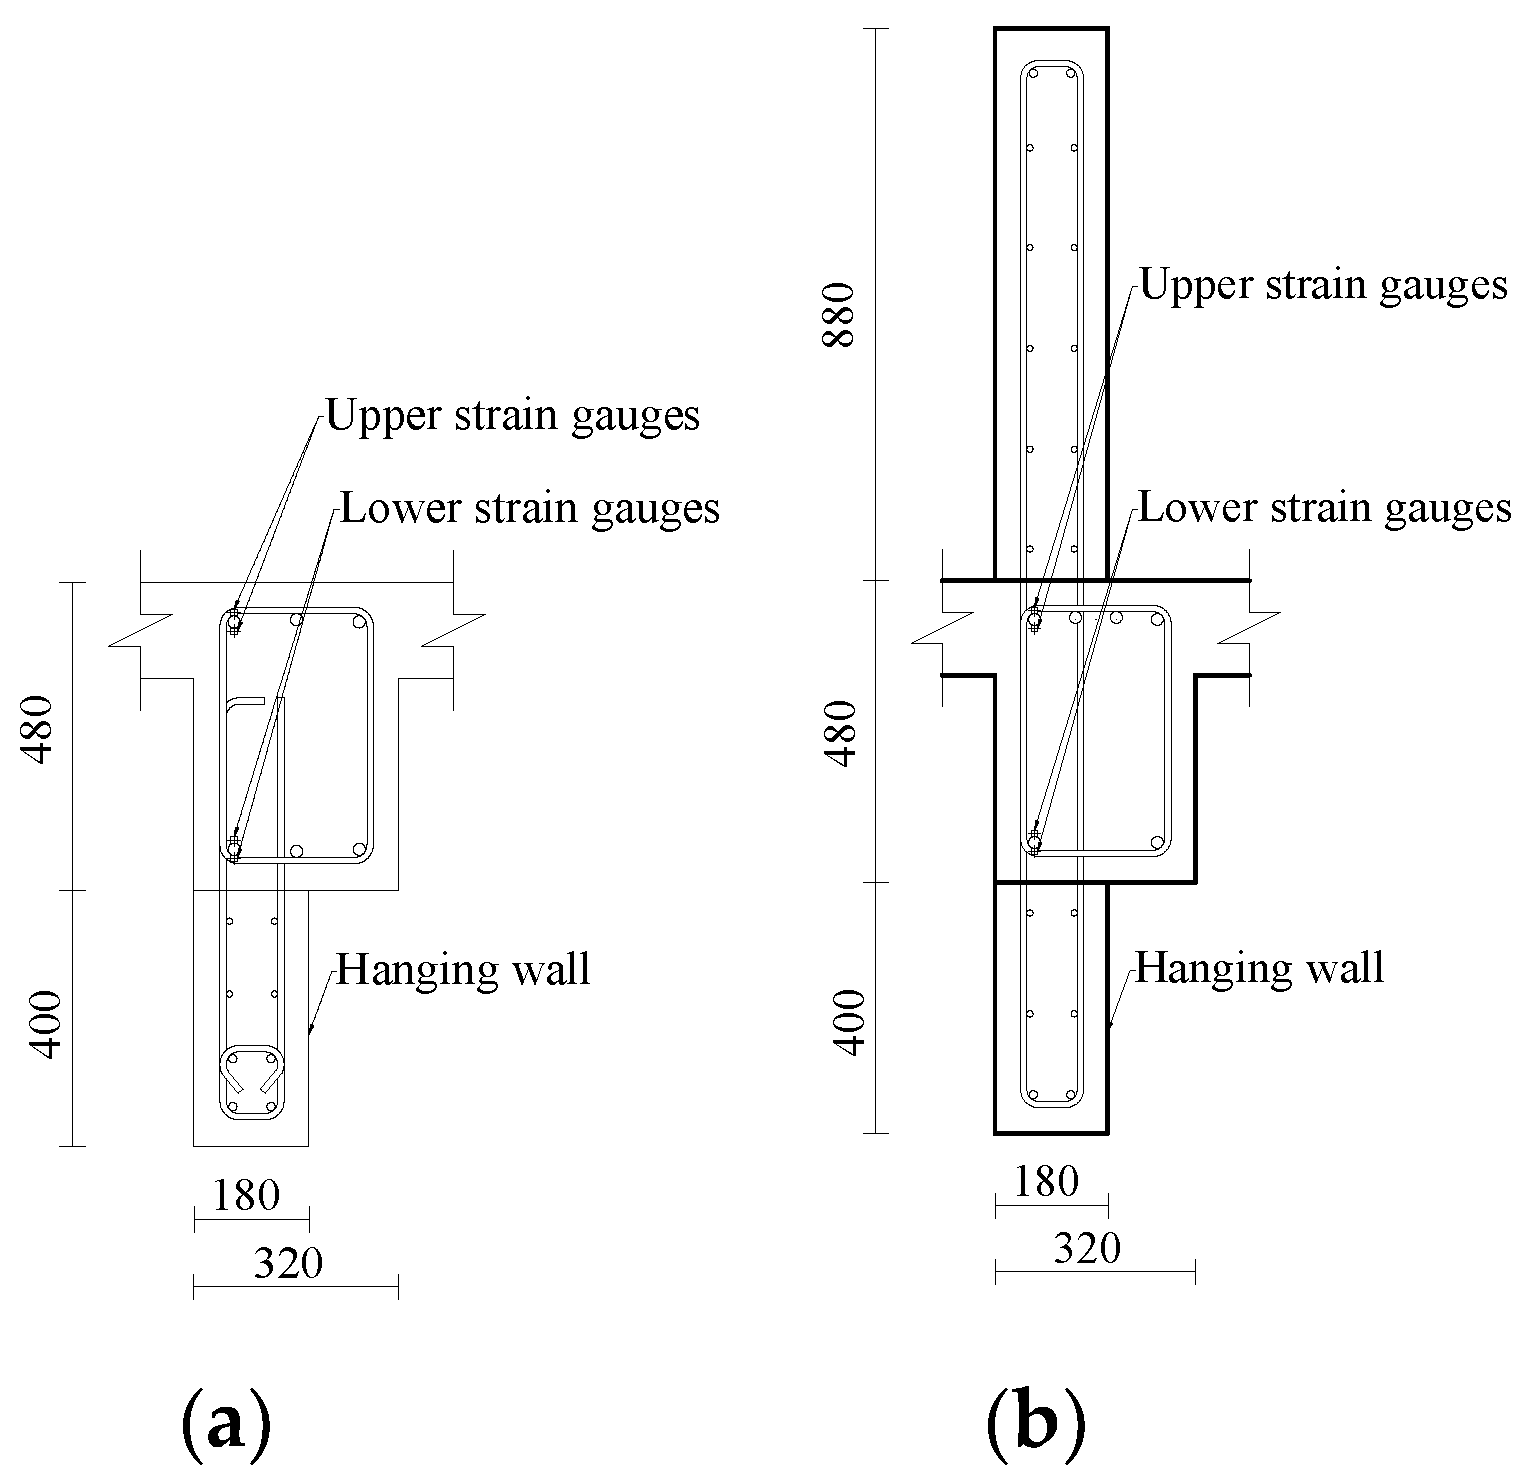
4.1. Test Specimen
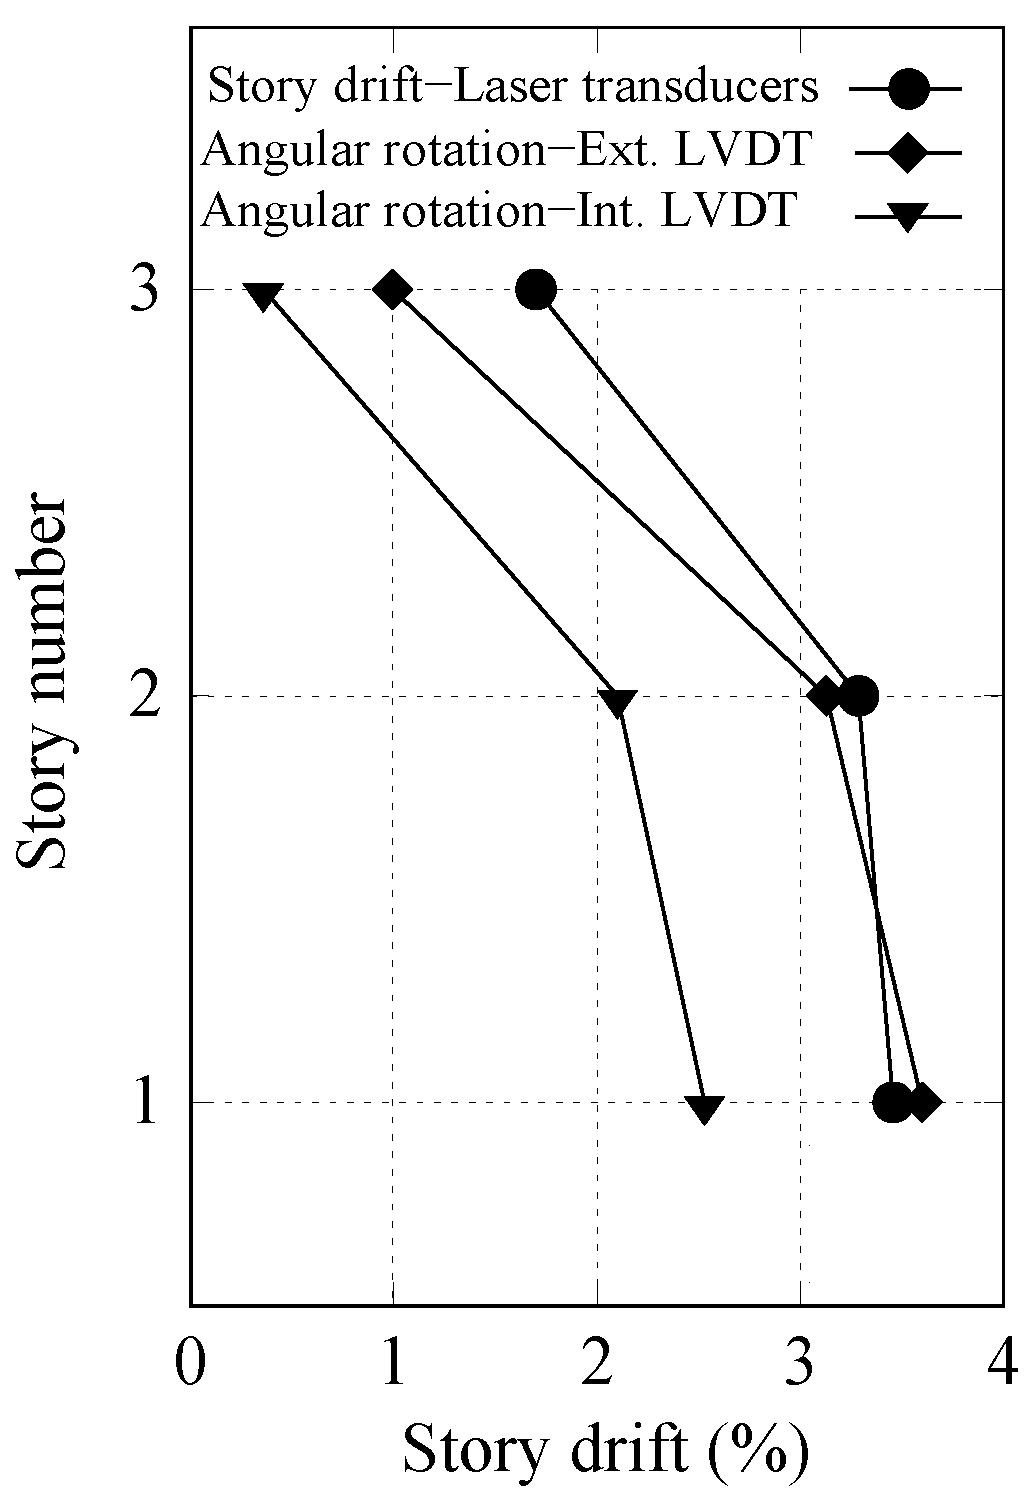
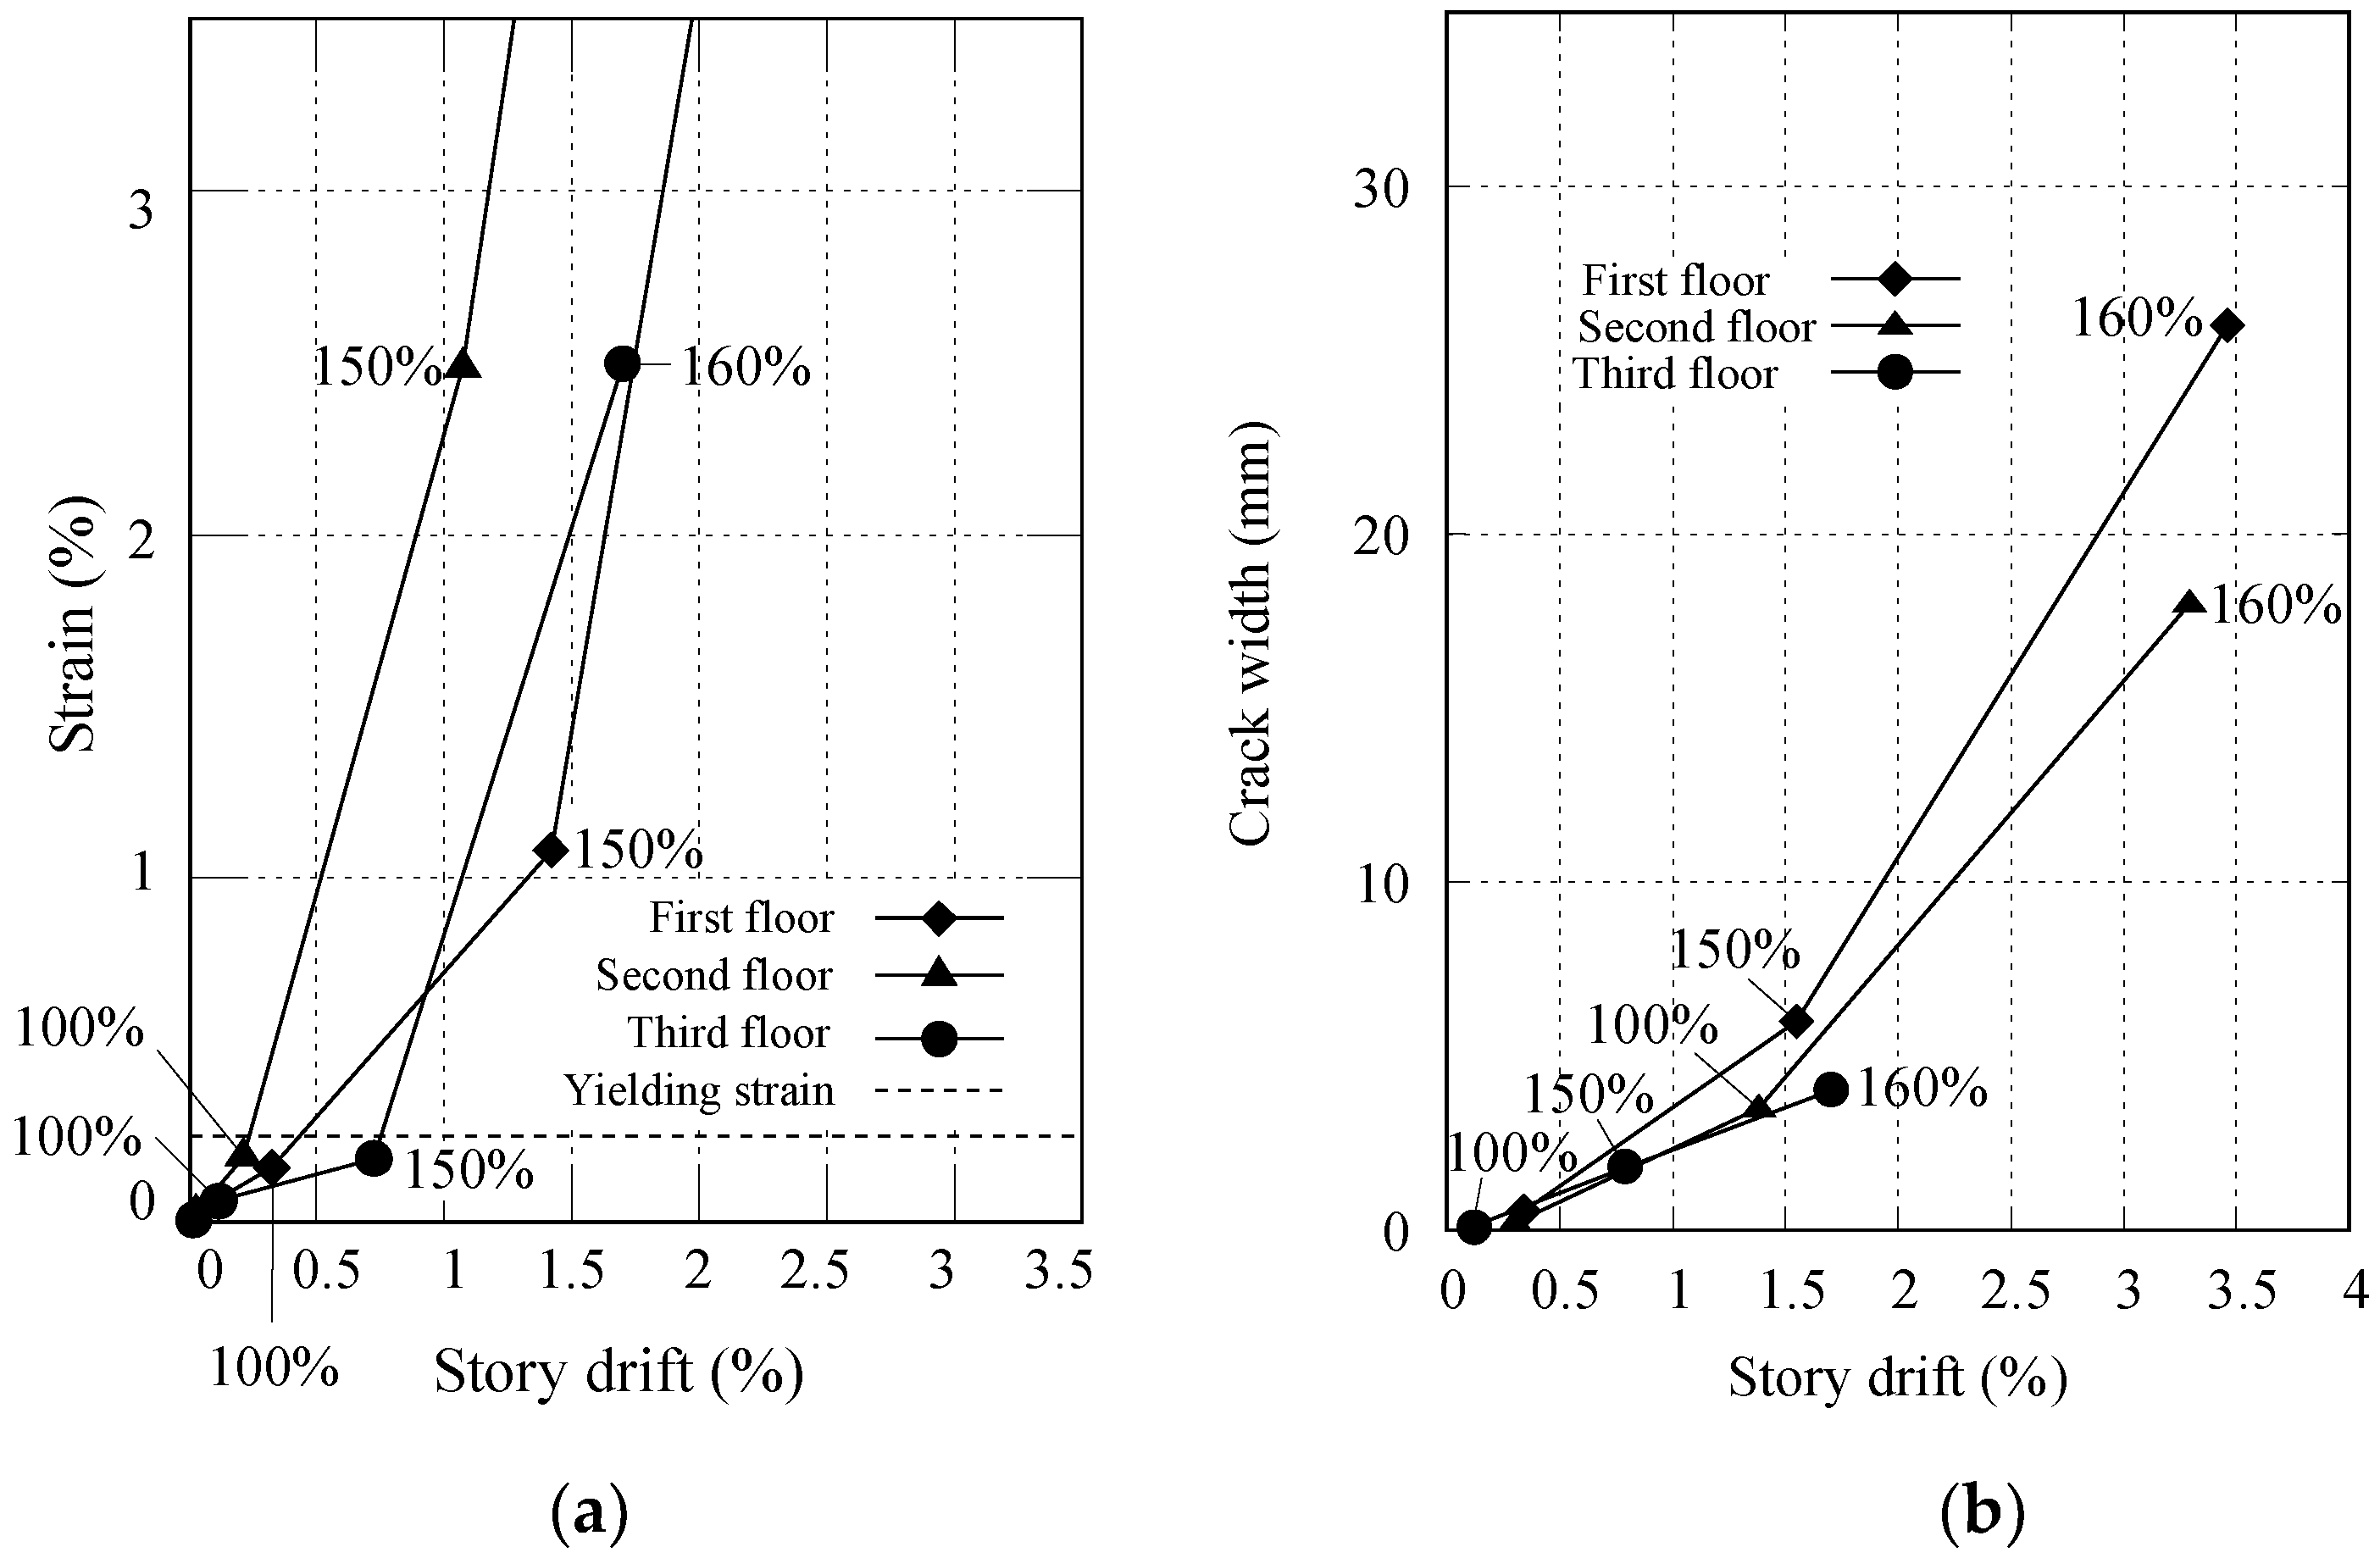
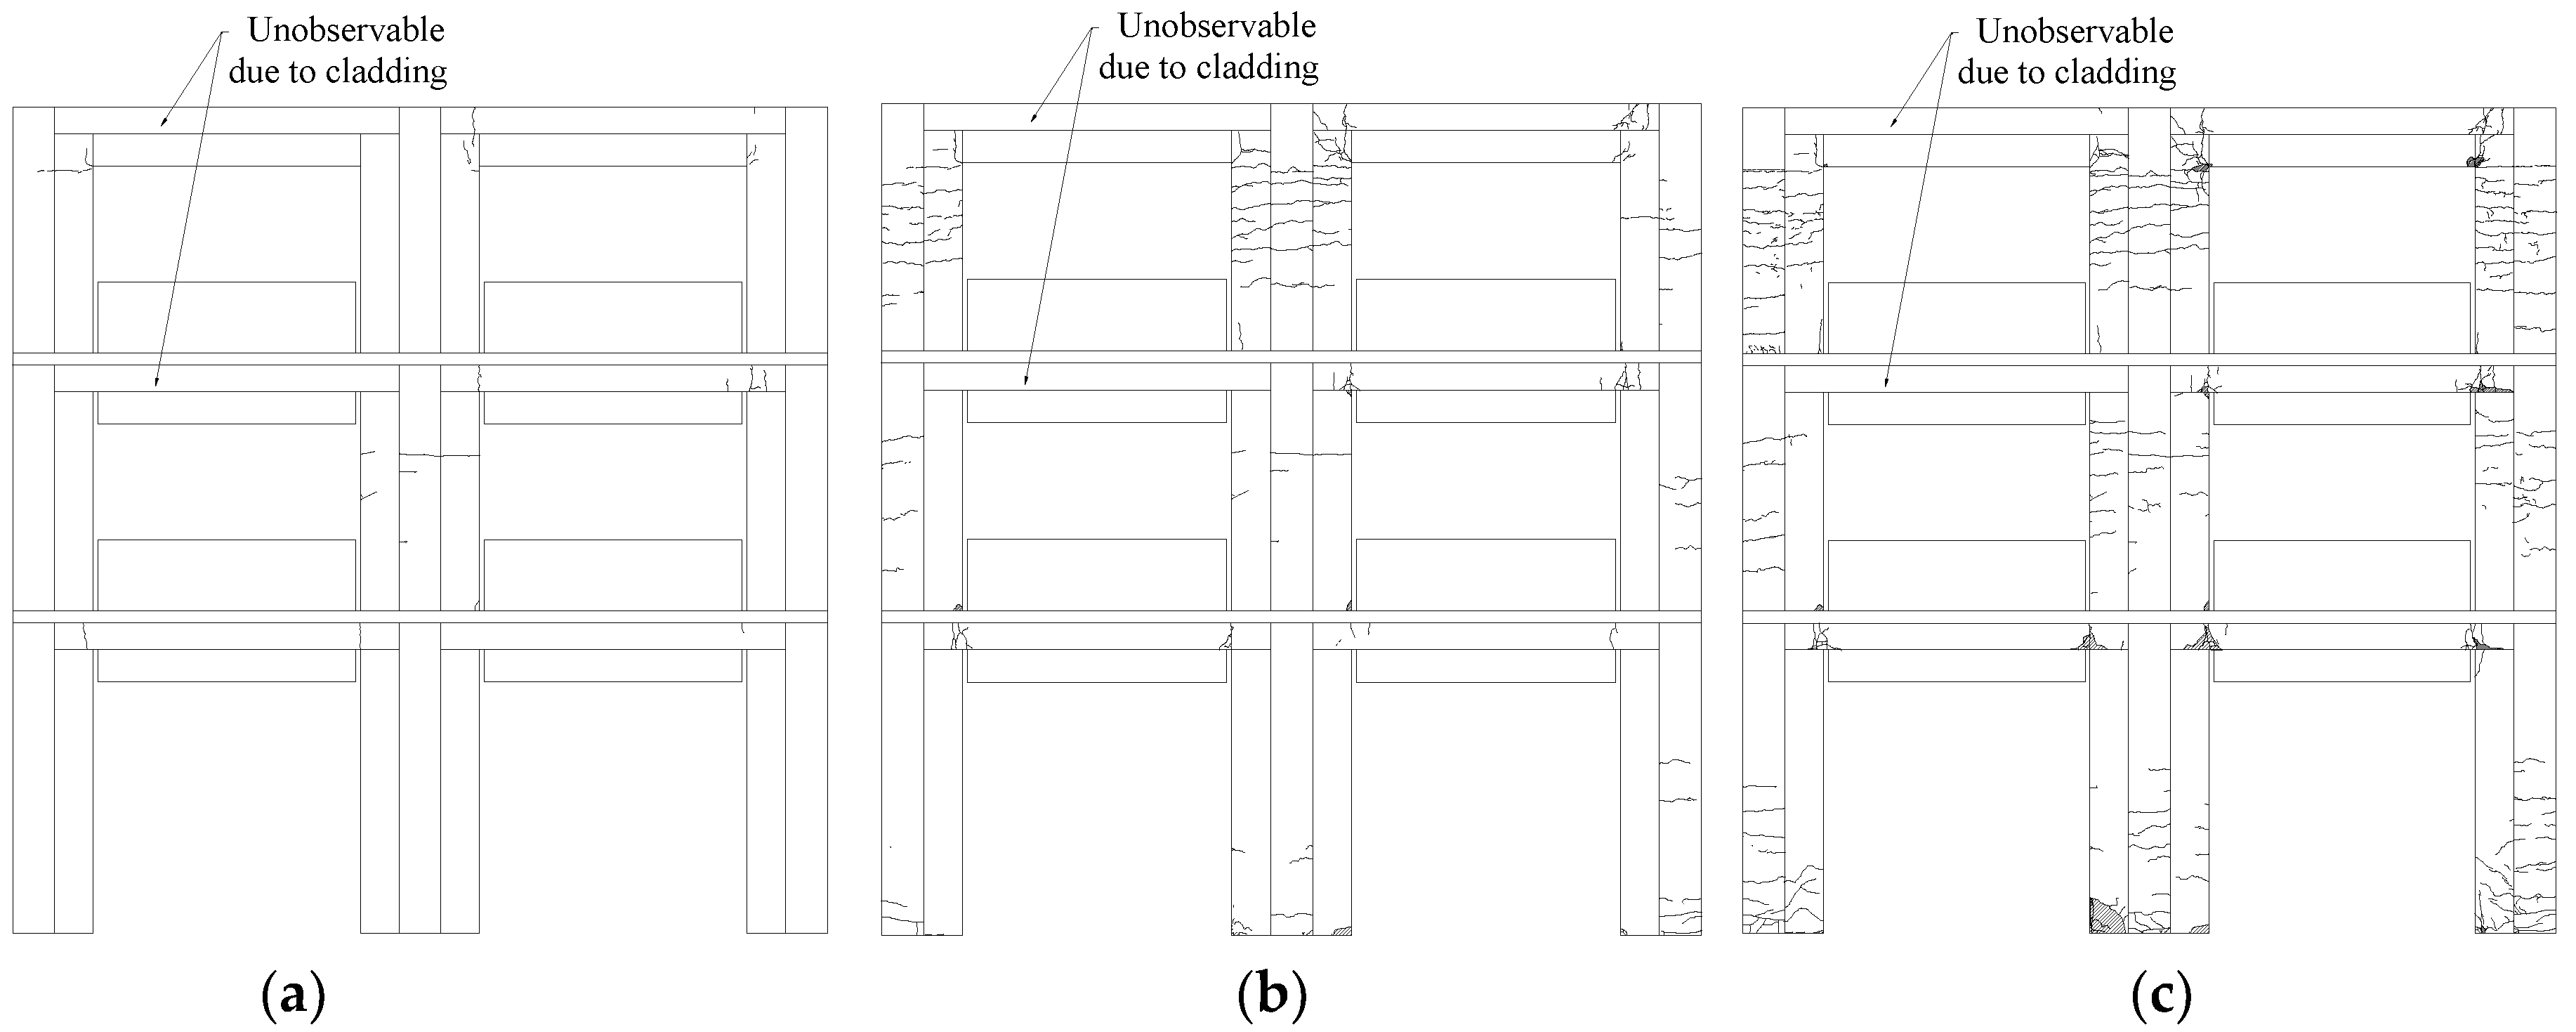
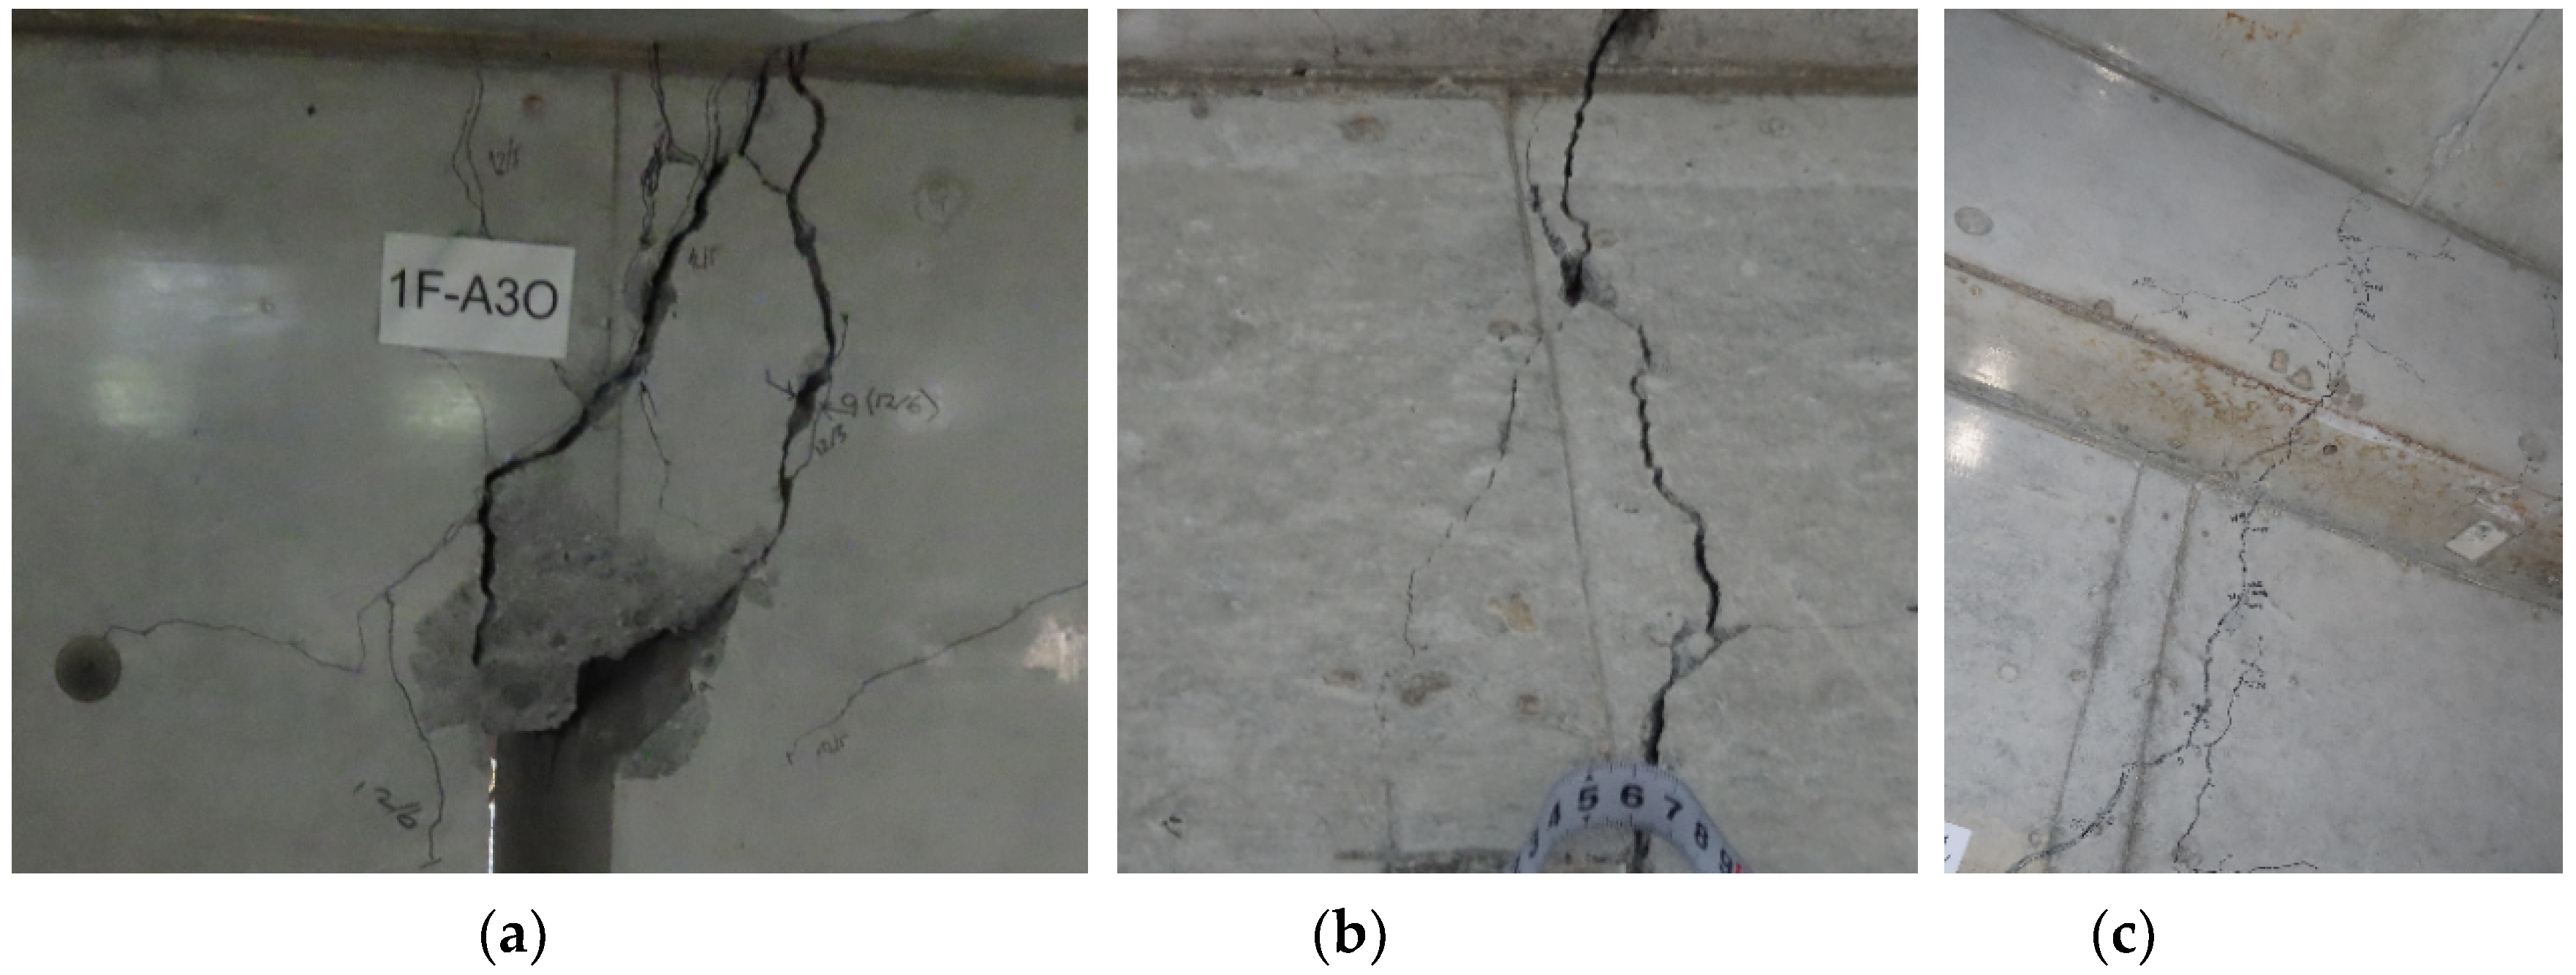
4.2. Test Results
5. Conclusions
Author Contributions
Funding
Acknowledgments
Conflicts of Interest
References
- Architectural Institute of Japan. Preliminary Reconnaissance Report of the 1995 Hyogoken-Nanbu Earthquake; English ed.; Architectural Institute of Japan: Tokyo, Japan, 1995. [Google Scholar]
- Masaki, M.; Hamood, A.; Kazuki, S.; Kanako, T. Damage of RC Building Structures due to 2011 East Japan Earthquake. In Proceedings of the structures congress 2012, Chicago, IL, USA, 29–31 March 2012; pp. 1023–1034. [Google Scholar]
- Yoon, R.; Sanada, Y.; Akahaori, T. Seismic performance evaluation of RC moment-resisting frames with typical non-structural walls in japan. J. Adv. Conc. Technol. 2017, 15, 544–557. [Google Scholar] [CrossRef][Green Version]
- Fujii, K.; Yoshida, S.; Nishimura, T.; Furuta, T. Observations of damage to Uto City Hall suffered in the 2016 Kumamoto Earthquake. In Proceedings of the 8th European Workshop on the Seismic Behavior of Irregular and Complex Structures, Bucharest, Romania, 17–18 October 2017; pp. 19–20. [Google Scholar]
- National Institute for Land and Infrastructure Management (NILIM). Design Guidelines for Buildings at Disaster Bases (Draft in Japanese). Available online: http://www.nilim.go.jp/lab/bcg/siryou/tnn/tnn1004pdf/ks100414.pdf (accessed on 4 March 2020).
- Tsubaki, M.; Sanda, Y.; Zhang, Z.; Kusunoki, K.; Hibino, Y. Experimental structural performance evaluation of RC columns with wing walls without wall vertical rebar anchorage. J. Struct. Constr. Eng. 2019, 84, 1881–8153. (In Japanese) [Google Scholar] [CrossRef]
- Architectural Institute of Japan. AIJ Standard for Lateral Load-Carrying Capacity Calculation of Reinforced Concrete Structures (Draft); Architectural Institute of Japan: Tokyo, Japan, 2016. [Google Scholar]
- American Concrete Institute. Building Code Requirements for Structural Concrete (ACI 318-14) and Commentary (ACI 318R-14); American Concrete institute: Farmington Hills, MI, USA, 2014. [Google Scholar]
- Bentz, E.; Collins, M.P. Response 2000; Version 1.0.5; University of Toronto: Toronto, ON, Canada, 2001. [Google Scholar]
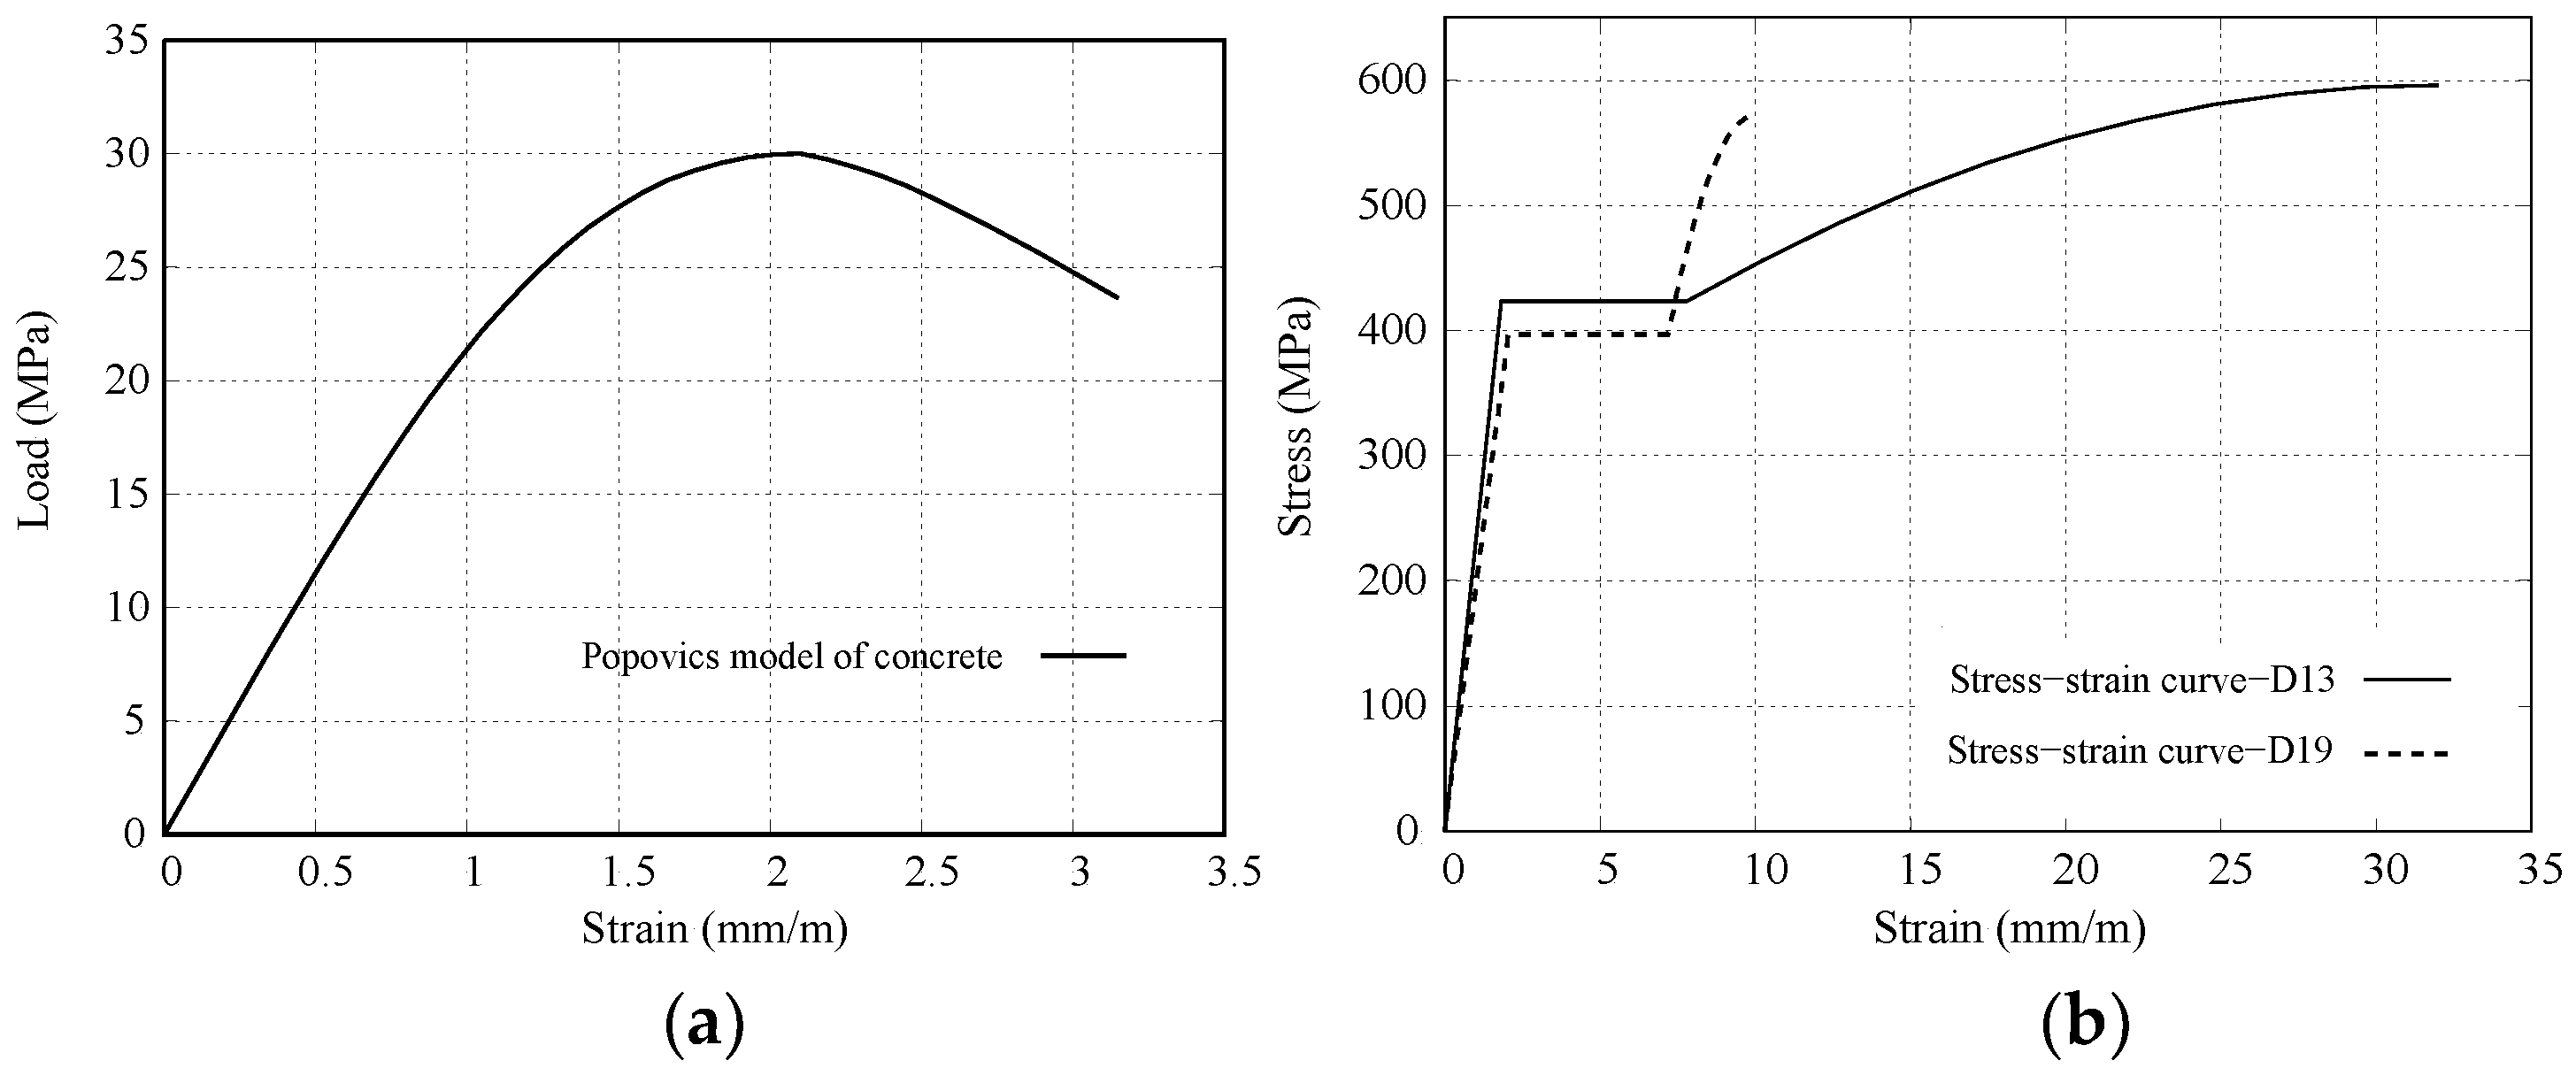
- Popovics, S. A Numerical Approach to the Complete Stress-Strain Curve of Concrete. Cement Conc. Res. 1973, 3, 583–599. [Google Scholar] [CrossRef]
- The Building Center of Japan (BCJ). The Building Standard Law of Japan on CD-Rom; The Building Center of Japan: Tokyo, Japan, 2016. [Google Scholar]
- Magnusson, J.; Hallgren, M.; Ansell, A. Air-Blast-loaded High-Strength Concrete Beams, Part I: Experimental Investigation. Magaz. Conc. Res. 2010, 62, 127–136. [Google Scholar] [CrossRef]


| Name | BSH | BS |
| Type of member (B × D) | Beam (400 mm × 600 mm) | |
| Long. reinforcement | 12-D19 (ρg = 1.56%) | |
| Trans. reinforcement | D13@150 (ρt = 0.42%) | |
| Wall type (Thickness) | Spandrel Walls (200 mm) | |
| Length of walls (mm) | 600 (300 at the wall boundary) | |
| Long. wall reinforcement | 2-D13@150 | |
| Trans. wall reinforcement | 2-D13@150 (0.84%) | |
| Design of confinement reinforcement | ACI | AIJ |
| Confinement reinforcement (X) | 2-D13@75 (2.54%) | (0.85 %) |
| Confinement reinforcement (Y) | 2-D13@75 (1.13%) | D13@150 (0.15%) |
| Initial target load (kN) | 88 (1st) and 162 (2nd) | |
| Target drift angle R (rad) | ±1/400, ±1/300, ±1/200, ±1/150, ±1/75, ±1/50, ±1/37.5, ±1/25 | |
| BSH | BS | |
|---|---|---|
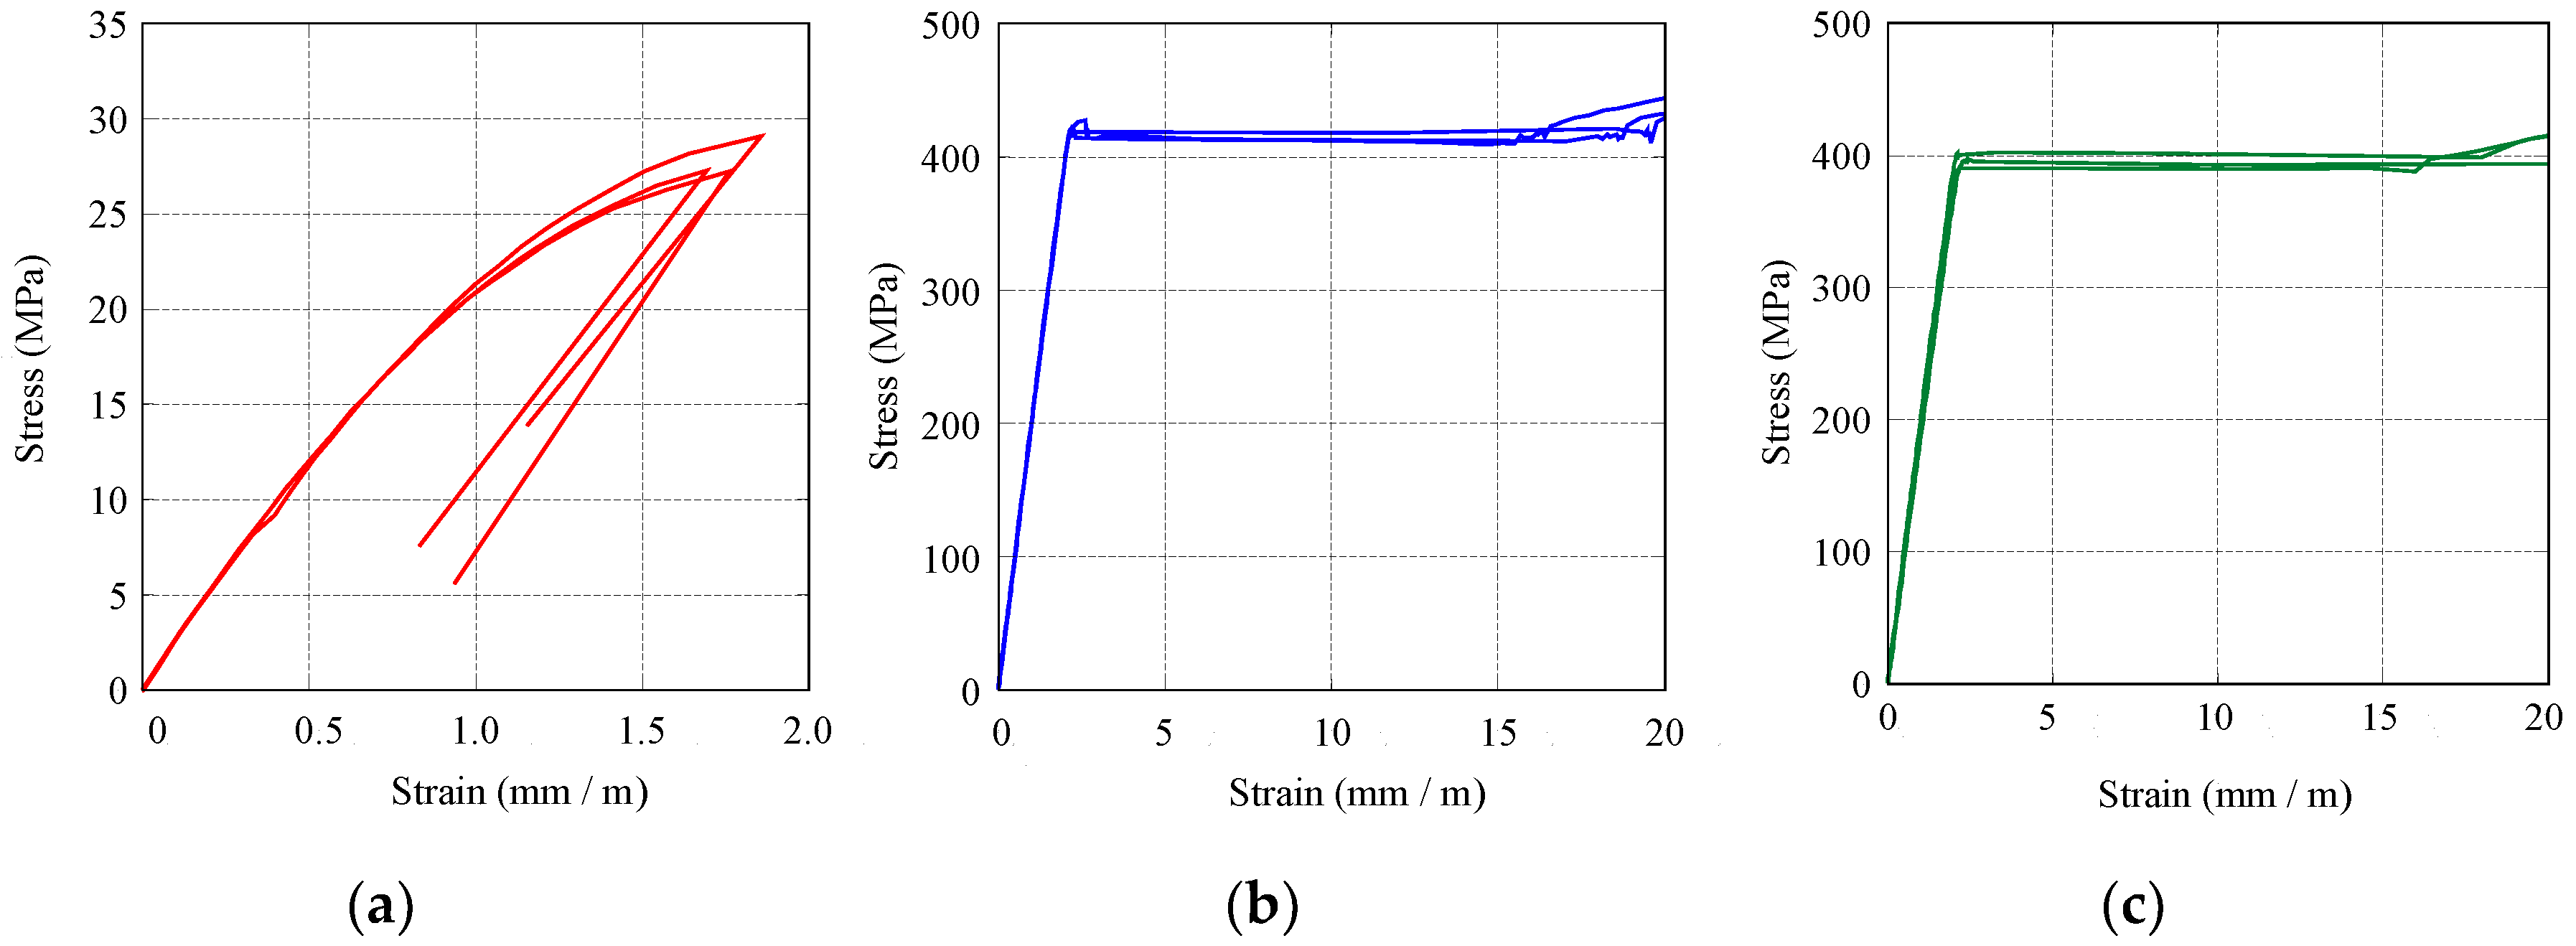
| Compressive strength (MPa) | 27.9 | 30.0 |
| Young’s modulus (MPa) | 23.9 × 10³ | 26.9 × 10³ |
| Number | D13 | D19 |
|---|---|---|
| Type | SD295A | SD345 |
| Yield stress (MPa) | 423 | 397 |
| Tensile stress (MPa) | 600 | 579 |
| Young’s modulus (MPa) | 202 × 103 | 194 × 103 |
| Specimen | ||
|---|---|---|
| Property | BSH | BS |
| Maximum observed shear strength from the test | 285 kN | 313 kN |
| Predicted shear strength by cross-sectional analysis (Bending moment) | 301 kN (651 kN·m) | 301 kN (651 kN·m) |
| Tension force T | 1367 kN | |
| Compression force C | 1367 kN | |
| Neutral axis depth c | 288 mm | 268 mm |
| Predicted shear strength by equation 2 (Bending moment) | 289 kN (637 kN·m) | 295 kN (623 kN·m) |
| Name | Third Floor | First and Second Floors |
|---|---|---|
| Type of member (B × D) | Beam (320 mm × 480 mm) | |
| Long. reinforcement | 6-D19 (SD345) ρg = 1.1% | |
| Trans. reinforcement | D10@160(SD295A) ρt = 0.28% | |
| Wall type (Thickness) | Spandrel Walls (180 mm) | |
| Height of hanging wall | 400 mm | |
| Height of standing walls | - | 880 mm |
| Long. wall reinforcement | 4-D13, 4-D10 (1.1%) | 2-D13, 4-D10 (0.75%) |
| Trans. wall reinforcement | D10@160 (0.5%) | D10@160 (0.5%) |
| Number of Trails | Max Designed Acceleration | Scale Factor | Expected Response of the Building |
|---|---|---|---|
| 1 | 5.95 m/s2 | 0.2 | Serviceability should be maintained for frequent earthquakes |
| 2 | 1.0 | Story drift limit should be less than 0.33%. | |
| 3 | 1.5 | Story drift limit should be less than 1.5% | |
| 4 | 1.5 | Building should survive an aftershock of equal intensity to the main shock (1.5 times code-level for buildings with post-disaster functionality) | |
| 5 | 1.6 | To observe performance of both structural and non-structural elements in its fully inelastic range and its capability to withstanding multiple significant seismic events. |
| Number of Stories | Story Drift (%) | Beam Rotation by LVDT (%) | Rotation/Story Drift (Exterior LVDT) | Rotation/Story Drift (Interior LVDT) | |
|---|---|---|---|---|---|
| Exterior LVDT | Interior LVDT | ||||
| 1 | 3.46 | 3.60 | 2.53 | 1.04 | 0.73 |
| 2 | 3.29 | 3.13 | 2.10 | 0.95 | 0.64 |
| 3 | 1.70 | 0.99 | 0.36 | 0.59 | 0.21 |
© 2020 by the authors. Licensee MDPI, Basel, Switzerland. This article is an open access article distributed under the terms and conditions of the Creative Commons Attribution (CC BY) license (http://creativecommons.org/licenses/by/4.0/).
Share and Cite
Safi, W.A.; Hibino, Y.; Kusunoki, K.; Mukai, T.; Sanada, Y.; Nakamura, I.; Fukai, S. The Structural Performance of Reinforced Concrete Members with Monolithic Non-Structural Walls under Static and Dynamic Loads. Buildings 2020, 10, 87. https://doi.org/10.3390/buildings10050087
Safi WA, Hibino Y, Kusunoki K, Mukai T, Sanada Y, Nakamura I, Fukai S. The Structural Performance of Reinforced Concrete Members with Monolithic Non-Structural Walls under Static and Dynamic Loads. Buildings. 2020; 10(5):87. https://doi.org/10.3390/buildings10050087
Chicago/Turabian StyleSafi, Walid Ahmad, Yo Hibino, Koichi Kusunoki, Tomohisa Mukai, Yasushi Sanada, Izumi Nakamura, and Satoru Fukai. 2020. "The Structural Performance of Reinforced Concrete Members with Monolithic Non-Structural Walls under Static and Dynamic Loads" Buildings 10, no. 5: 87. https://doi.org/10.3390/buildings10050087
APA StyleSafi, W. A., Hibino, Y., Kusunoki, K., Mukai, T., Sanada, Y., Nakamura, I., & Fukai, S. (2020). The Structural Performance of Reinforced Concrete Members with Monolithic Non-Structural Walls under Static and Dynamic Loads. Buildings, 10(5), 87. https://doi.org/10.3390/buildings10050087