1. Introduction
Modern control and energy management systems offer the potential to optimise energy systems usage and reduce energy consumption. However, fully automatic control systems or limited availability of environmental controls have been demonstrated to reduce the building occupants’ perceived comfort [
1,
2,
3,
4,
5,
6]. Increased perceived and exercised control in office spaces, such as employed in buildings with mixed-mode ventilation systems, has been demonstrated to lead to higher level of comfort for the occupants. In a study by Deuble and de Dear [
7], the occupants of an office building in Sydney (run in either air-conditioning or natural-ventilation mode) reported as comfortable a wider range of temperature (from 21 to 30 °C) when the building was run in natural ventilation mode [
7]. Leaman and Bordass [
8] found that the occupants’ 177 office and public buildings in the UK gave a higher “forgiveness score” (i.e., the ratio of the reported overall comfort to the reported average of individual comfort variables) to the buildings run with natural ventilation, thus showing a higher tolerance for wide ranges of comfort parameters. Brager et al. [
9] studied the difference between the neutral temperatures reported by occupants of a naturally-ventilated office building in Berkeley, CA. The occupants sitting in an open landscape were grouped in those who could directly access a window (High Personal Control) and those who could not (Low Personal Control). The authors found that in the cool season, the office occupants with High Personal Control reported a 1.3 °C higher neutral temperature than the one reported by those with Low Personal Control. In the warm season, no significant difference was found. A similar result was found by Bauman et al. [
10]. Baker and Standeven [
11] demonstrated that the perception and exercising of control of the indoor environment by the building occupants generates opportunities for comfort adaptation that expands the occupants’ neutral zone. If such opportunities were limited or totally absent, discomfort and stress were experienced by the occupants, as the working space failed to meet the occupants’ comfort expectations. According to de Dear and Brager [
12], and de Dear et al. [
13], three types of adaptations can be described. Behavioural adjustments, physiological adaptation, and psychological adaptation. In the adaptive models proposed by de Dear et al. [
13] and Humphrey et al. [
14], the building occupant is therefore no longer a passive recipient of the thermal environment, as described in the Fanger’s heat-balance model [
15], rather an active agent interacting with the environment. In such adaptive models, occupants achieve satisfaction with their indoor climate by matching the actual indoor conditions with their actual thermal expectations. Since the occupants’ goal is reached through a continuous feedback given by the results of their corrective action, the behavioural adjustment represents the most immediate feedback to the changes in the thermal environment. In such a perspective, it is worth mentioning the difference between thermal comfort, then termed as the “Subjective indifference to the thermal environment” [
6,
16], and pleasure, described as the sensation aroused by a specific stimulus (
alliesthesia), given by Cabanac [
16,
17]. The availability of controls is then critical for the occupants to process the feedback loop of correcting action and awarded pleasure. According to Paciuk [
18], three levels of the personal control are to be found in a workplace: available, exercised, and perceived control. Both the occupants’ awareness of available controls and the effectiveness of the feedback given by exercising control over the environment define the level of the occupants’ perceived control.
In such a perspective, interesting studies investigated the relationship between the occupants’ exercised actions of control and the indoor operative temperature. Meinke et al. [
19] studied the occupant’s choice between different cooling strategies and the effect on their perceived comfort. In their experiment, the occupants had the possibility to decide their preferred cooling strategy (window opening, air conditioning, ceiling fan, clothes changing) before and after the occupants were informed of which strategy was the most energy effective. They found that the majority of the participants initially chose either to open the window or remove a piece of clothing, and the window opening was the strategy that most effectively gave long-lasting thermal comfort until the end of the experiment (highest frequency of neutral thermal sensation vote). Haldi and Darren [
20] analysed the relationship between operative temperature and occupant actions (opening windows, closing window blinds, removing a piece of clothing) and they found that the most preferred action was to open the window, followed by removing a piece of clothing, and finally lowering the blind.
Despite the extensive knowledge on the consequences of limited control possibilities on the office occupants’ perceived comfort, automated control strategies are extensively used in new office buildings and especially pursued for the maximisation of daylight availability to minimise the buildings’ energy use [
21,
22,
23]. The driving comfort factors (if either thermal, or visual, or a combination of these, or other factors) for exercised control in office environments have been investigated in several studies, especially for window blinds use [
24,
25,
26,
27,
28,
29]. However, it is still debatable if either solar radiation (thus thermal comfort) or illuminance/glare (thus visual comfort) is the main triggering factor for blind use, as highlighted by O’Brien et al [
26].
The objective of this work is to investigate which are the triggering factors for achieving visual and thermal comfort, given different control strategies of window opening, blind use, artificial light operation, and thermostat adjustment in a cell office environment. This paper shows the results of a case-study experiment conducted in a test cell facility located in Trondheim, Norway. This paper is structured as such: first, the method and limitations of the experiment (specifically on the number of participants, the length of the experiment, and control strategies adopted) are explained; second, the results are presented and divided in those pertaining the cells’ occupants’ visual and thermal comfort, those pertaining the occupants’ actions in the cells, and those pertaining the occupants’ actions to increase their visual comfort; third, the consequences of the findings of this paper and the limitations of the experiment are discussed; fourth and last, conclusions from this work are drawn.
2. Method
Eleven participants (4 males and 7 females) with varying age (between 20 and 60 years) and ethnicity (North, Central, and South Europe, Middle East, and Asia), used the ZEB Test Cell Laboratory [
30] as a cell office. The ZEB Test Cell Laboratory consists of two identical test cells. Each cell was assigned as a working space to each participant for two to four days and for a minimum of 5 h per day, to primarily carry out office tasks at a personal computer. The experiment lasted for a total of 19 calendar days and both the test cells were occupied for a total of 36 days, of which 21 days were assigned to female participants and 15 days to male participants.
Regarding the number of participants (N = 11), this experiment was designed with the aim of evaluating the adaptive response of cell office users in as close as possible to a real working environment. For such a reason, the participants were expected to spend at least two days in each cell to replicate a normal working routine. This was envisioned to make the participants acquainted with the new environment and understand its limits and capabilities. This design choice consequently determined the possible number of participants that could be hosted during the time the ZEB Test Cell was available for this experiment, given also the funding limitation that could be allocated for renting the laboratory. The size of each of the cells did not allow either to host two participants at the same time. Moreover, as found by Schweiker and Wagner [
5], the presence of co-workers in an office environment has a clear effect on modifying the occupants’ perceived control and adaptation strategies.
Regarding the higher proportion of female participants (N = 7), given the difference of perception of thermal sensations and acceptability of thermal stress between female and male participants in studies of thermal comfort assessment [
31,
32], it is expected that a population of equally distributed male and female participants would give different results. As pointed out by Schellen et al. [
31], the female participants in a test on cooling strategies in office environment preferred a higher operative temperature (by 1.2 °C) than the male participants. In a survey (N = 3094) on the difference in thermal comfort between male and female respondents in different environments (office, home, university), Karjalainen [
32] found that the female respondents prefer higher indoor temperatures and tendentially feel more uncomfortable than male respondents with either too hot or too cold temperatures. Parson [
33] found that the difference in thermal comfort response between male and female participants is pronounced towards the cold TSV (female participants expressing a lower TSV than male participants), but it is irrelevant towards the warm TSV. Similarly, Krugen and Drach [
34], Karyono [
35], and Indraganti and Rao [
36] found that, despite female participants in surveys and thermal comfort tests showing a preference for a warmer environment, the results obtained were not statistically significant. In such a perspective, it can be inferred that the unequal distribution of male and female participants in this case study had a limited influence on the overall TSVs distribution.
Regarding the different age and geographical origin, it is worth noting that these may also play a role in determining the thermal comfort satisfaction and neutral temperature. In the case study presented in this paper, three of the 11 participants were above 40 years, and the remaining 7 participants were between 20 and 30 years. It is worth noting that, despite Fanger’s finding no correlation between age and thermal satisfaction [
15], Choi et al. [
37] found that over 40 years old group may show a higher level of satisfaction than the under 40 years old, in an equivalent thermal environment. Cultural habits and geographical origin may also be factors for influencing thermal comfort, as shown by Zaki et al. [
38] in the comparison of thermal satisfaction and adaptive strategies of Japanese and Malaysian university students. In such a perspective, the participants of this case study were representative of a variety of different geographical origins (North, Central, and South Europe, Middle East, and Asia).
Information regarding the scope of the experiment was given to the participants before their first working session in the test cell, and specifically, the participants were instructed to make themselves comfortable by using the cell’s window, blind, lights, by changing their clothing level, changing their working position, drink, eating, and taking breaks. A motorised office desk, a reclining office chair, a sofa, and a plant were placed in each cell to replicate a typical office setting. Food, fruit, tea, and coffee were also provided to make the environment more comfortable and to limit potential distress due to hunger and thirst. The participants answered a computer-based questionnaire to report their perceived thermal and visual comfort during their stay in the test cells. Measurements of indoor air, radiative, and surface temperature, relative humidity, CO2 concentration, and power consumption of light, office equipment and water-based radiators were registered. In addition, the use of windows, window blinds, and doors were recorded. Changes of clothing level were noted both using camera shots and the computer-based questionnaire.
Experimental Set-Up
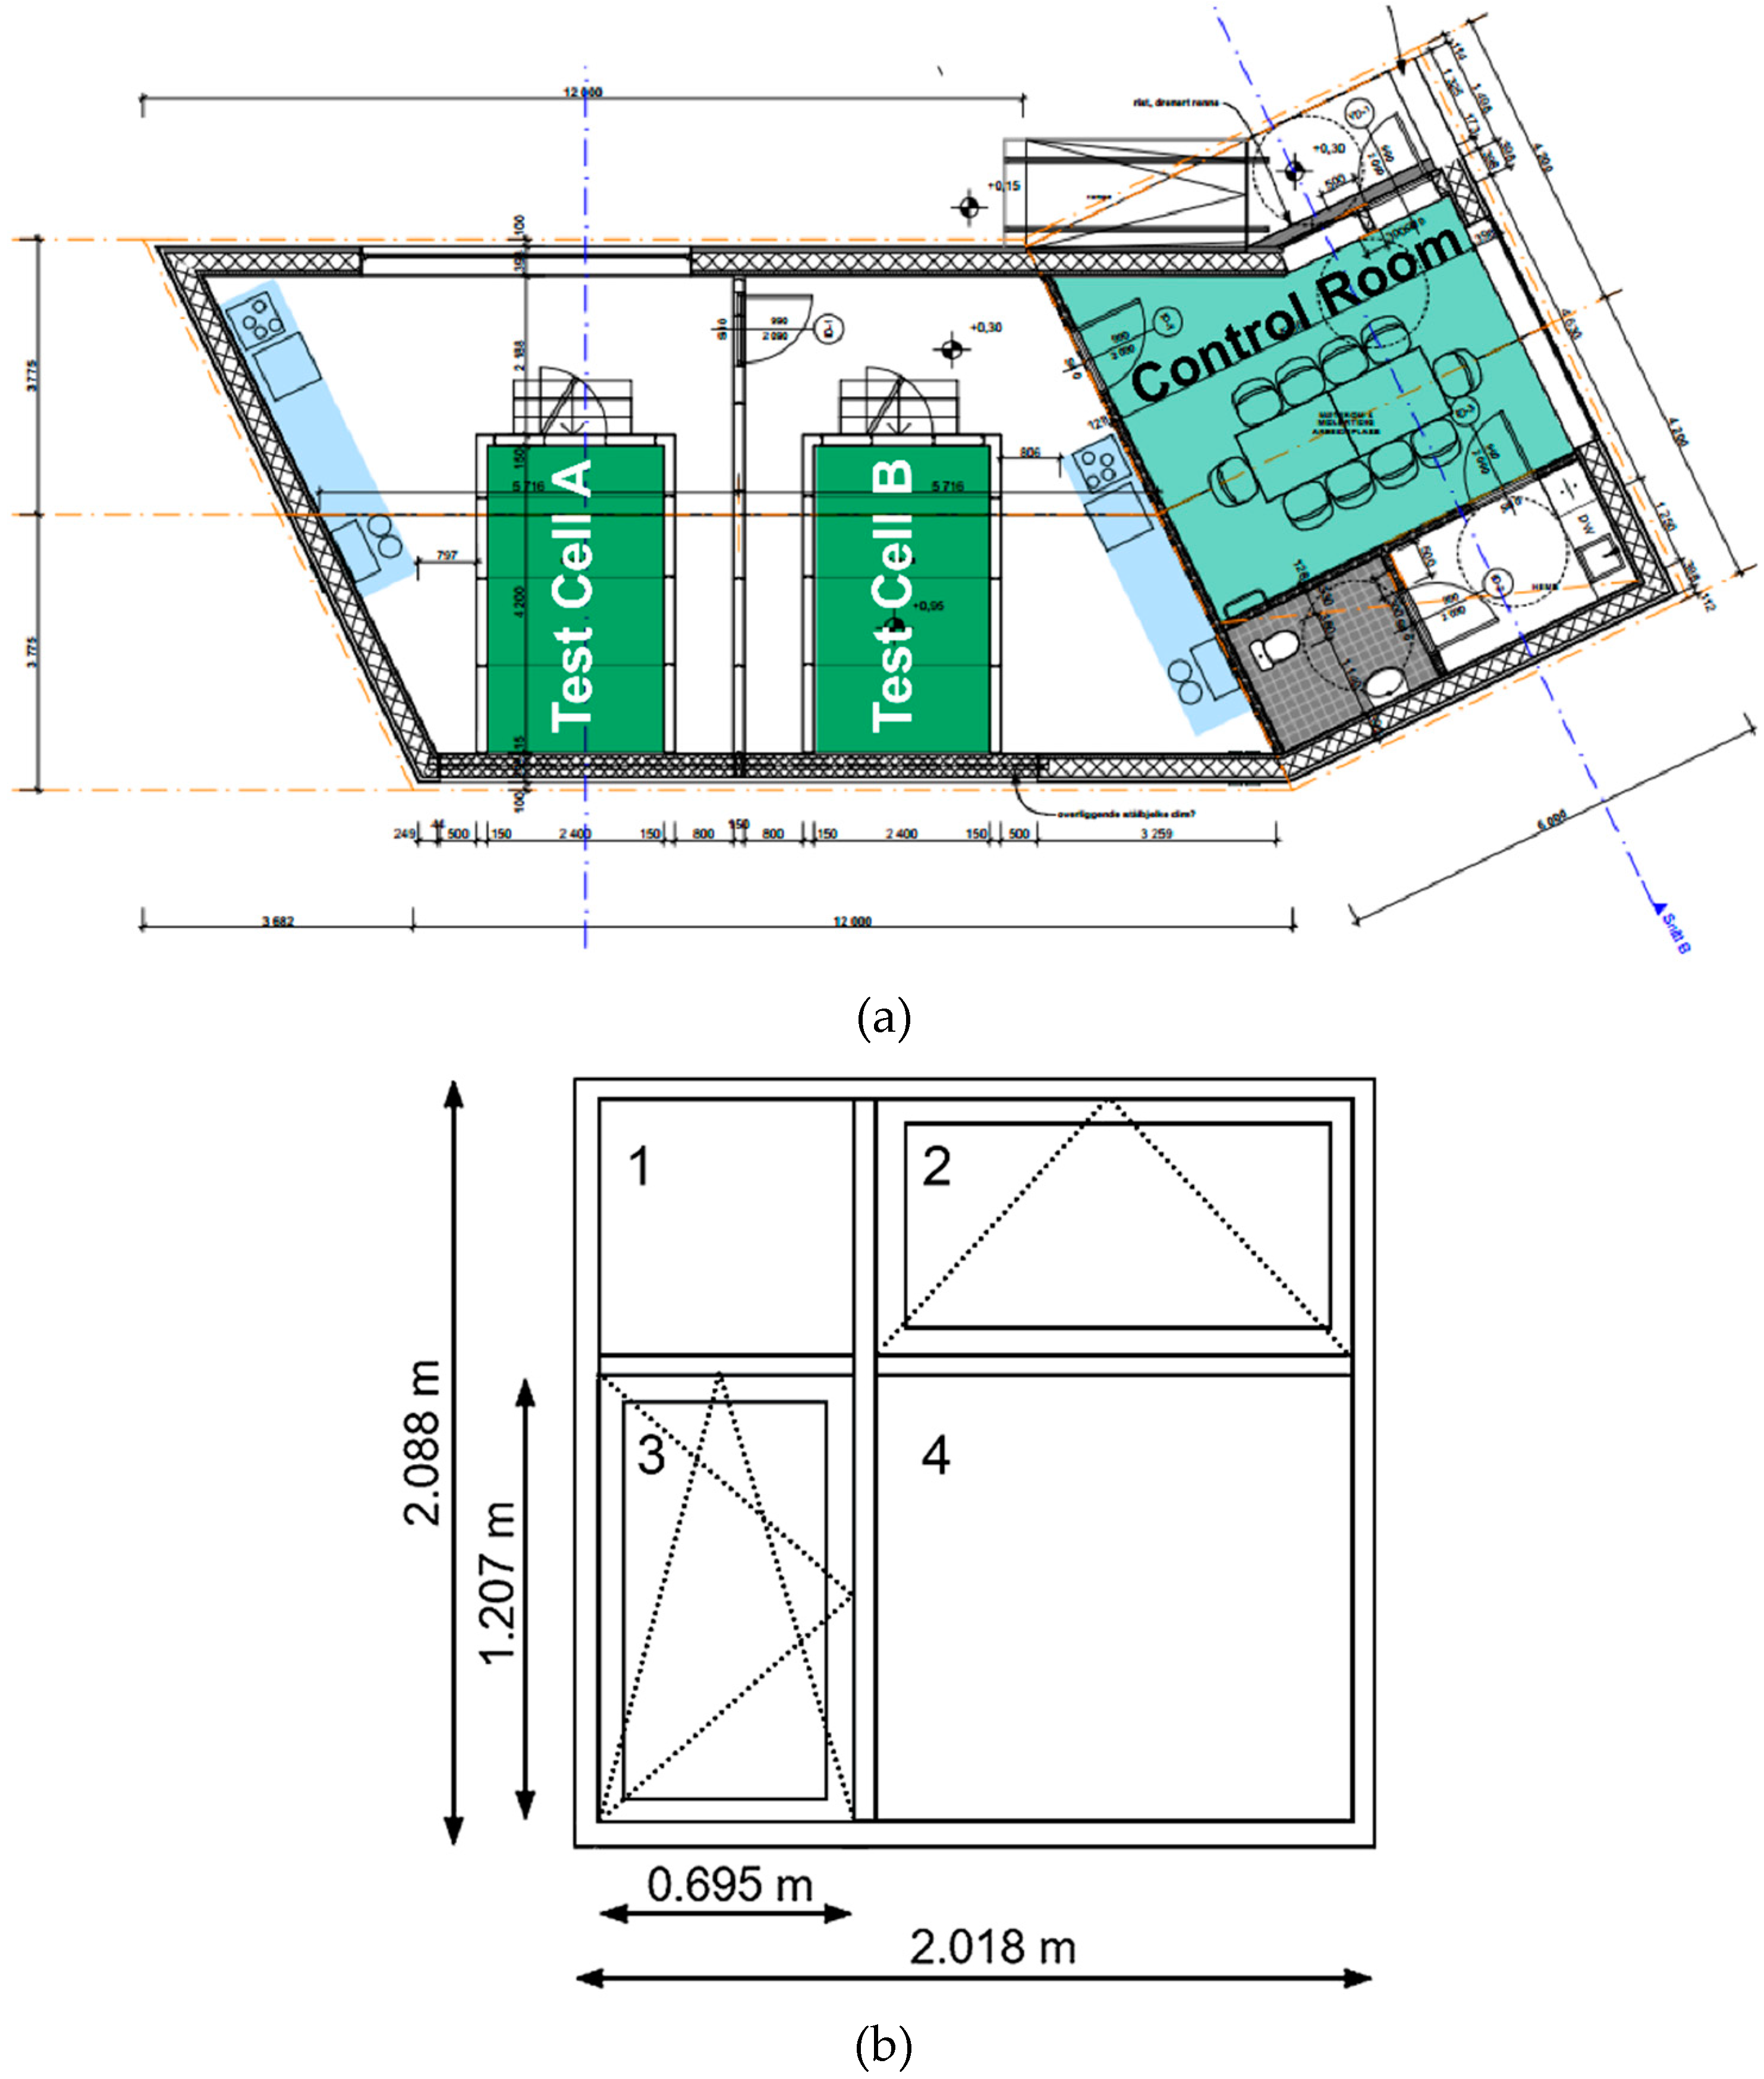
The ZEB Test Cell Laboratory is located at the Norwegian University of Science and Technology in Trondheim, Norway. It consists of two identical test cells with the size of a typical single-person office room, 2.4 × 4.2 × 3.3 m width, length and height, respectively (
Figure 1b). The southern façade of each cell is exposed to the outdoor environment and can be entirely replaced to perform tests on different components and materials. Each cell is surrounded by a guard room. Cells and guard rooms are equipped with independent HVAC systems. An independent air handling unit (AHU) provides fresh air intake to the guard rooms and to the auxiliary spaces of the facility. The facility is equipped with circa 520 sensors, for monitoring the internal and external cells’ wall temperature, air temperature, radiant temperature, illuminance, CO
2 level, relative humidity, pressure, and weather conditions from a weather station mounted on the roof. All sensors and actuators are connected to a central computer and a specifically written LabVIEW code manages the control system and the data logging. Manual controls for lighting, window opening, window blind deployment and heating systems are present in both cells, allowing for manual control and overriding of the automatic system when allowed by the control logic.
Figure 1b shows the layout of the windows installed in the ZEB Test Cell Laboratory during the experiment described in this paper. Each window is 2.018 m wide and 2.088 m high and is constituted by four glazing units. The glazing units are made of a triple glass (two 4-mm low-e panes on the two external sides and a clear 4-mm pane at the middle) with two Argon-filled gaps of 16 mm (specifications of the window unit are summarised in
Table 1). Glazing 1 and 4 are fixed, glazing 3 is manually controlled and can be fully opened or tilted. Glazing 2 is motorised, and the tilting can be controlled by the user (Cell B) or by the control system (Cell A). All doors and windows operations were monitored and logged by the acquisition system.
The two rooms were identically equipped with office furniture. On each desk, a desk lamp (35 W), a laptop (150 W) used by the participants to compile the questionnaires, and an LCD computer screen (120 W) were placed. The participants brought their own laptops during the experiment. The ceiling fixed lighting consisted of six fluorescent lamps (30 W each).
The two different strategies used in the experiment for controlling the window opening, blind deployment, thermostat adjustment, and room lighting in the test cells are described in
Table 2. The occupants had no control over the flow rate and temperature of the ventilation system. Ventilation was provided by the mechanical system to both cells in order to replicate the typical HVAC setting in office buildings. All controls activations (either by the central computer or the participants) were logged during the whole duration of the experiment.
Both cells’ space heating was provided with a water-based radiator connected to the ZEB Test cell’s warm water loop. For this experiment, a PID control system acting on a three-way valve kept the inlet water temperature constant at 35 °C. The water flow rate entering the radiator was further reduced in Cell A by a thermostatic valve downstream of the PID control, while the radiator in Cell B was equipped with a manual valve. The thermostatic valve was kept at a fixed position that corresponds to an air temperature of about 21 °C, according to the valve’s operating manual. The mechanical ventilation in both cells was controlled by keeping the fans at the inlet and outlet ducts at a constant power. Air velocity, humidity, and temperature were measured and recorded in both ducts, and the supply flow rate, 2 l/s per m
2 of floor area, was set according to office requirements for ventilation in Norway (NS 3031) [
39]. During the experiment, the air supply temperature was kept constant (19 °C) by a PID controller acting on the heating coil power.
The air temperature in the room was measured by 3 Pt100 thermometers mounted on racks at different heights following the recommendation of the ISO 7726:1998 [
40]. To limit the influence of direct solar radiation, these were shaded with white cardboard screens. The radiant temperature of the room was measured by a black globe thermometer mounted on the rack by the side of the office desk. Three portable omnidirectional hot-wire anemometers were installed next to the three Pt100 thermometers. The carbon dioxide level in the rooms was measured using a transducer with a range 0–2000 ppm (accuracy ± 100 ppm). A relative humidity sensor (accuracy ± 3%) was placed next to the CO
2 sensor. The illuminance sensor (measurement range was set to 0–1000 lux and accuracy 5%) was placed on the window-side of the office desk, to trigger the deployment of the automated window blind as soon as direct sunlight was hitting the desk. This was done to avoid sun patches on the working area and on the wall behind the computer screens to cause glare.
The following logic was used in the LabVIEW software controlling the operations in Cell A. The ceiling-mounted lights were operated by the system in response to the illuminance measured on the desk, as described in the section above, according to Algorithm 1. In the interval 600–1500 lux, a buffer zone was defined to avoid the continuous operation of the lights due to sudden changes in the outdoor sky luminance, and thus leading to user dissatisfaction [
41,
42,
43].
| Algorithm 1 Controlling the operations in Cell A by LabVIEW software |
1: for all 1 minute do
2: 1-minute-averaged_illuminance = average(1-sec_illuminace_horizontal)
3: if 1-minute-averaged_illuminance ≥ 1500 lux then
4: ceiling_light_state = OFF
5: elseif 1-minute-averaged illuminance ≤ 600 lux then
6: ceiling_light_state = ON
7: else
8: ceiling_light_state = NO_ACTION
9: end |
The motorised window was operated according to the average value of the air temperature registered by the PT100 thermometers on the mast (see Algorithm 2). No actions are taken to avoid the repetitive opening/closing of the window in the interval 21–25 °C.
| Algorithm 2 The motorised window’s operation according to the average value of the air temperature registered by the PT100 thermometers on the mast |
1: for all 1 minute do
2: 1-minute-averaged_air_temp_PT100 = average(1-sec_air_temp)
3: for all PT100 do
4: 1-minute-averaged_air_temp = average(1-minute-averaged_air_temp_PT100)
5: if 1-minute-averaged_air_temp ≥ 25 °C then
6: window_state = OPEN
7: elseif 1-minute-averaged_air_temp ≤ 21 °C then
8: window_state = CLOSE
9: else
10: window_state = NO_ACTION
11: end |
The motorised window blind, integrated in the window, was operated according to the same parameter used to control the ceiling lights, as shown in Algorithm 3. Once the illuminance meter read above 3000 lux, the computer sent the signal to close the screen and started recording the illuminance level every second. When the reading was below 3000 lux, the computer sent the signal to stop the screen motor. This was done to avoid the total closure of the screen and to maximise the use of daylight. The choice of 3000 lux as the above limit was due to the very low visible light transmittance (4.9%) and solar transmittance (5.1%) of the installed window blind. Initial tests were conducted to deploy the blind at 2000 lux. It was observed that under partially overcast sky conditions, the resulting illuminance at the desk was below 600 lux, thus triggering the ceiling lights. The authors decided to rise the upper limit to 3000 lux to limit the use of ceiling lights, even if this might cause an increased risk of glare [
44,
45].
| Algorithm 3 The motorised window’s operation integrated in the window according to the same parameter used to control the ceiling lights |
1: for all 1 minute do
2: 1-minute-averaged_out_illuminance = average(1-sec_out_illuminance)
3: if 1-minute-averaged_out_illuminance ≥ 3000 lux then
4: sun_shading_state = CLOSE
5: elseif 1-minute-averaged_out_illuminance ≤ 600 lux then
6: sun_shading_state = OPEN
7: else
8: sun_shading_state = NO_ACTION
9: end |
The participants were asked to report their Thermal Sensation Values (TSVs) and Illuminance Rating (IR) in a computer-based questionnaire and took part in individual interviews before and after the experiment. The initial interviews were meant to inform the participants of the scope of the experiment, to sign an informed consent of personal data management, and to collect information regarding the participants’ previous knowledge of thermal comfort, energy use in buildings, preferred temperature and daily routines to save energy. The participants reported their clothing level, their mood, physiological distress, and their discomfort throughout their working day by filling in the computer-based questionnaire every 30 min. Pictures were taken every minute by a camera positioned on the door of the test cell. This way, it was possible to monitor the participants’ position in the cell (if sitting at the desk or on the sofa by the window), activity, and changes of the clothing ensembles that were not reported in the questionnaire. With respect to the indoor thermal and visual comfort, two Likert scales were used in the questionnaire, as described in
Table 3. The questionnaire consisted of three parts. In the first, the participants were asked once per day to answer questions regarding their clothing level, their mood, physiological conditions, and planned activities. In the second, the participants were asked to rate every 30 min their perceived thermal sensation and illuminance rating, and open questions regarding what they would have changed in the environment. In the third and final part of the questionnaire, which was filled at the end of the working day, the participants were asked to rate their overall comfort acceptability, note what they would have changed in the environment during the day, and to report their physiological conditions. The answers were collected and analysed in relation to the recorded operative temperature and illuminance levels.
3. Results
In this section, the results of the experiment are divided into three subsections. First, the results of the cells’ occupants’ visual and thermal comfort are presented. Second, the occupants’ actions in the cells (window, blind, light, and clothing ensemble adjustments) to increase their thermal comfort are presented. Third and last, the occupants’ actions to increase their visual comfort are presented.
During the experiment, Cell A was occupied for 6361 min and Cell B for 7004 min. The occupants of Cell A recorded their thermal and visual comfort in the questionnaire 167 times (equal to an average of 38 min between each record), the occupants of Cell B filled in 188 records (equal to an average of 37 min between each record).
3.1. Occupants’ Visual and Thermal Comfort
Table 4 shows the median values of operative temperature and illuminance for which the thermal comfort (TSV = (0)) and the visual comfort (IR = (0)) were recorded, respectively. In the same table, the average, minimum, and maximum values of the operative temperature, illuminance, and outdoor air temperature measured during the experiment are also shown.
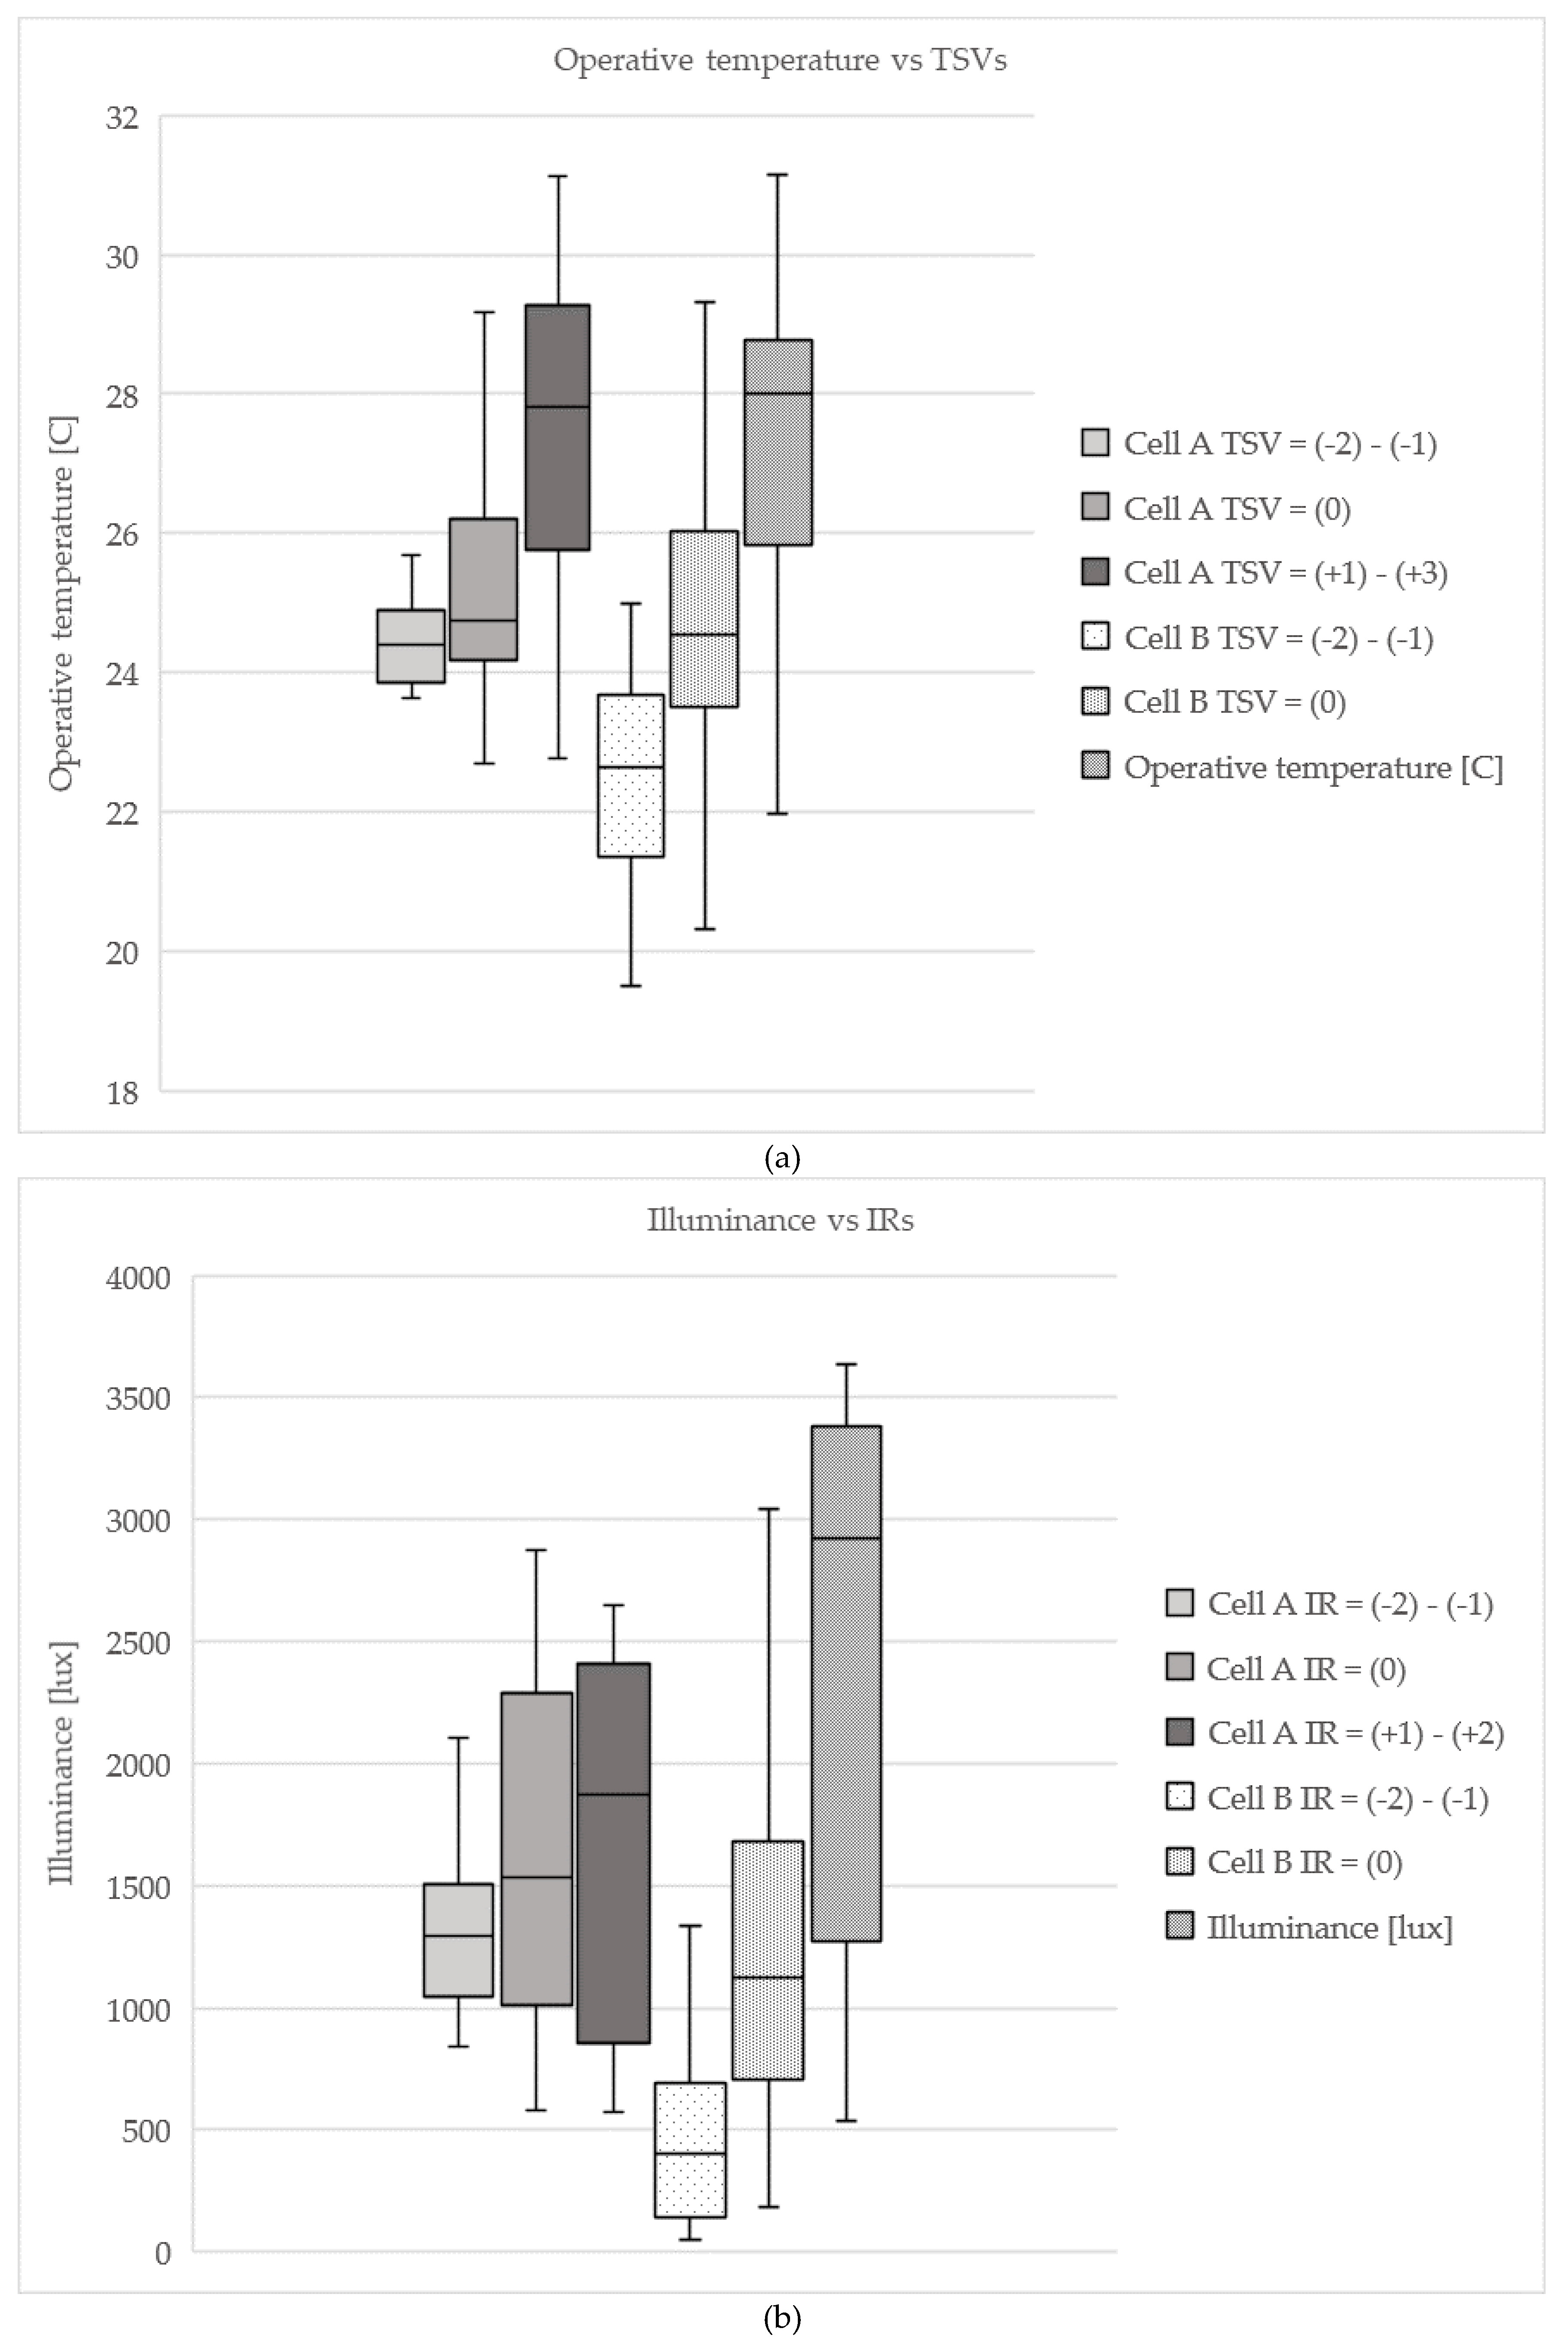
Figure 2a,b shows box plots of the occupants’ reported Thermal Sensation Values (TSVs) and Illuminance Ratings (IRs) against measured operative temperature and desk illuminance, respectively. The horizontal line in the box plot represents the median (most recurring) value of operative temperature and illuminance, respectively. The lower and the upper horizontal lines delimiting the box represent the 1st and the 3rd quartiles, respectively. Minimum and maximum values are given by the lower and upper horizontal brackets, respectively. As shown in
Figure 2a, for the whole scale of given TSVs, the occupants of Cell A reported a narrower range of median operative temperature than that reported by the occupants of Cell B. The median operative temperature measured in Cell A varies between 24.4 and 27.8 °C, whereas these vary between 22.6 and 28.0 °C. It is interesting to note that when the operative temperature was close to 24.5 °C, the occupants of Cell A reported either cold sensations (TSVs = (−1)–(−2)) or neutrality (TSV = (0)). Similarly, they reported either neutrality or warm sensations when the operative temperature was close to 26 °C. This pattern was recorded for the occupants of Cell B to a smaller extent, as shown by the overlapping of the box plots at 23.5 and 26 °C. In such a perspective, the occupant in Cell A disagreed on the temperature range corresponding to neutrality by a larger extent than the occupants of Cell B. By following this logic, it may be inferred that the range of operative temperature for which the occupants clearly expressed neutrality can be defined within the upper quartile of the lower TSV (TSV = (−1) and below) and the lower quartile of the upper TSV (TSV = (+1) and above). The neutral temperature is, therefore, found to be between 24.9 and 25.8 °C for Cell A, and between 23.7 and 25.8 °C in Cell B. This gives a thermal neutral zone of 0.9 °C in Cell A and 2.1 °C in Cell B. This pattern is even more pronounced in
Figure 2b, where the IRs are plotted against measured desk illuminance. In Cell A, the occupants either reported acceptable illuminance rating (IR = (0)) or visual discomfort (IR = (+1)–(+2)) for substantially the same illuminance values (between 1010 and 2290 lux). In Cell B, on the other hand, the occupants clearly reported increasing IRs at increasing illuminance, and they expressed visual comfort (IR = (0)) in the range 710–1272 lux. Moreover, the median illuminance across the whole IR scale is located in a narrower range in Cell A (1300–1900 lux) than in Cell B (400–2900 lux). The results of this section can be summarised as such:
A limited control of the cell environment (in Cell A) produced a narrower thermal neutral zone (0.9 °C in Cell A vs. 2.1 °C in Cell B).
The automation of the blind control in Cell A made it impossible to find an illuminance range for which all the occupants reported visual comfort. This was instead found between 710 and 1272 lux in Cell B.
3.2. Occupants’ Actions
Table 5 and
Table 6 show the events recorded in the questionnaires. The participants were asked to record their actions and to write (open question) what they would have liked to do in the previous 30 min, but they could not do in the cell (desired actions). The different control strategy for the window blind use is reflected in the number of actions performed in Cell B and in the desired actions not performed in Cell A. It is interesting to note that the participants reported the desire to adjust the screen more frequently than what they effectively did in Cell B. Concerning the thermostat adjustment, the occupants of Cell B performed such an action 0.8 times per day on average, and this is similar to the frequency of the desired action reported in Cell A. Interestingly, the occupants of Cell B reported a desire for thermostat adjustment (a cooler environment) with a similar frequency (0.8 times per day). It is worth noting that no active cooling systems were installed in the cells. This means that the other adaptive strategies employed by the occupants of Cell B (clothing adjustment, window opening, blind adjustment) were deemed insufficient to reach a comfortable temperature. The window adjustment was the most common action performed by the occupants in both cells. It is worth noting that the occupants reported a desire for further window adjustment for an average of 0.5 times per day, and glazing 2 is automated in Cell A, and motorised and user operated in Cell B. The occupants of Cell A used the windows less frequently (1.7 times per day) than those sitting in Cell B (2.8 times per day). This may be due to the automated operation of glazing 2 in Cell A. However, the lower frequency of window adjustments in Cell A seems not to justify the use of the automated glazing unit to increase the users’ comfort, as this did not lead to a higher perception of comfort. This is shown by the similar number of reported desired actions for window adjustment in both cells (
Table 6). Regarding light use, the events recorded for lights adjustments or desired light adjustment refer to both the use of the ceiling lights and the desk light. The occupants in Cell A reported the wish for light adjustment (either on or off) 0.5 times per day, which is similar to what was recorded as executed actions in Cell B. On the other hand, the occupants of Cell B reported wishes for lighting use for 0.3 times a day. One possible explanation of this is the distance between the ceiling light switch (located next to the entrance door) and the working station (close to the window), as shown in
Figure 1a.
The results of this section can be summarised as such:
The automated control of the window blind in Cell A caused the occupants to express a desire for blind adjustment more frequently than their actual use of the blind in Cell B.
The automated control of the window opening in Cell A was not considered to satisfy the occupants’ comfort as further window adjustments were expressed with equal frequency in both cells.
The manual control of the thermostat (only heating) in Cell B did not meet the comfort expectations of the occupants, as the desire for a cooler temperature was expressed with similar frequencies in both cells.
3.2.1. Actions for Thermal Comfort
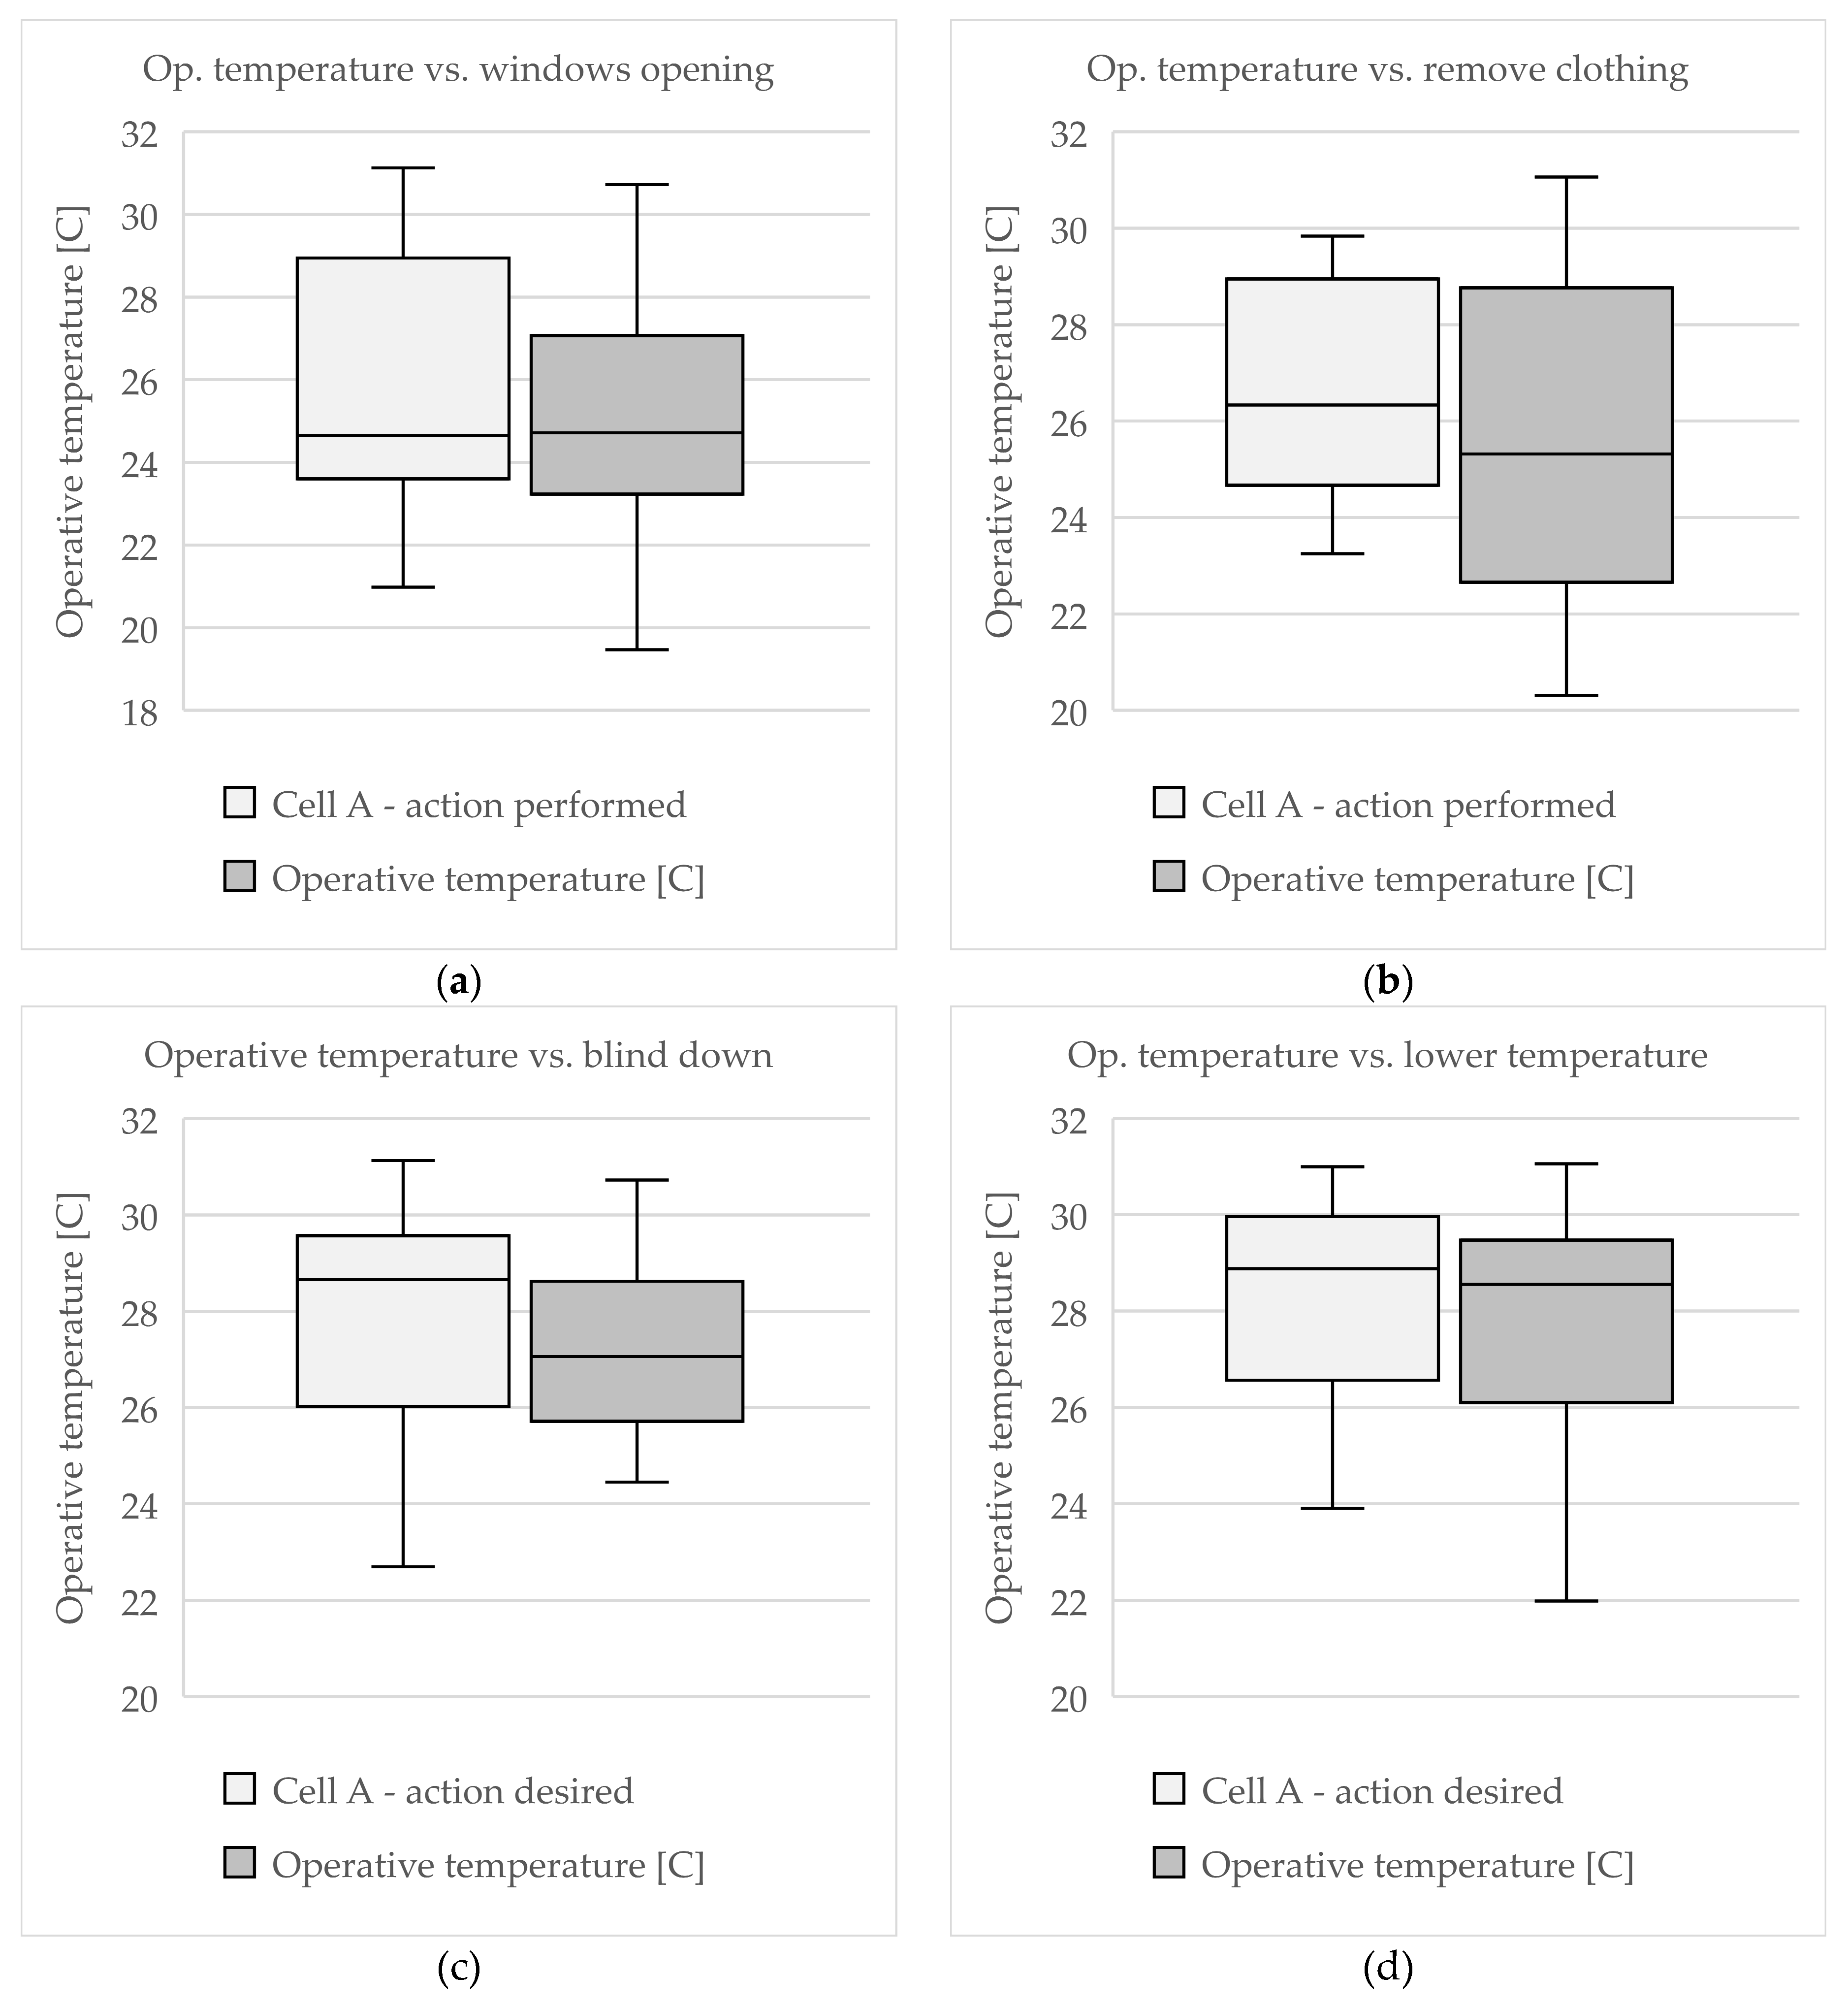
Figure 3a–d shows box plots of the occupants’ performed and desired actions in relation to the measured operative temperature in either cells. The horizontal line in the box plot represents the median value of operative temperature for the given action. The lower and the upper horizontal lines delimiting the box represent the 1st and the 3rd quartiles, respectively. Minimum and maximum values are given by the lower and upper horizontal brackets, respectively.
As shown in
Figure 3a, the occupants of both cells adjusted the window opening most frequently at 24.7 °C. However, the occupants of Cell A adjusted the window opening in a temperature range far wider than that recorded for the same action in Cell B. It is interesting to note that there is a 2 °C difference between the 3rd quartiles of recorded data in Cell A and in Cell B. This means that 75% of the window adjustments occurred below 27 °C in Cell B, whereas in Cell A, the window adjustments occurred up to 29 °C. In
Figure 3b, the action of removing a piece of clothing was recorded against the measured operative temperature in either cells. At least 25% of the action remove a piece of clothing occurred at 22.5 °C in Cell B, and at approximately 24.5 °C in Cell A. The average clothing levels the occupied time were 0.7 and 0.6 Clo, in Cell A and Cell B, respectively.
Figure 3c shows the blind adjustment (action performed in Cell B and action desired in Cell A) against measured operative temperature. Most of the blind adjustment occurred in Cell B between 25.7 and 28.7 °C, whereas the expressed wish for blind adjustment was recorded between 26 and 29.5 °C. It is interesting to note that there exists a lower threshold of 26 °C, at which the need of blind adjustment is either expressed or satisfied in either cells. However, the most recurring temperature at which the occupants of Cell A expressed their need of blind adjustment is 28.7 °C, 1.5 °C higher than the temperature measured in Cell B for the same action. This difference may be explained by the previously performed actions of the occupants of Cell A: window opening at 24.7 °C and clothing adjustment at 26.3 °C. In such a perspective, the operative temperature had to increase by 4 °C from the first performed action for the occupants of Cell A to express a clear wish of blind adjustment. In Cell B, the temperature difference between the first performed action (window opening at 24.7 °C) and the blind adjustment (27 °C) is 2.3 °C. One possible explanation is the blind adjustment in Cell B was not mainly driven due to temperature discomfort, but also due to other factors, such as illuminance, view, noise, and privacy. The test cells are located at the ground floor in a public parking lot. A secondary street is 50 m away. For this reason, some participants complained about the noise outside (cars and people talking). The participants in Cell B may have deployed the blind to reduce the outdoor noise and gain some privacy. However, questions regarding noise, privacy, and the need for an outdoor view were not investigated in this experiment. On the other hand, the occupants of Cell A, not being given the control of the blind, expressed their desire for blind adjustment to reduce the incoming solar radiation and lower the indoor temperature. This hypothesis is strengthened by the extended range of operative temperature (
Figure 3a) for which the window was adjusted, and the overlapping between the operative temperature range for which IR > 0 (
Figure 2a) and that for which the blind adjustment was desired (
Figure 3c). It may be therefore inferred that the occupants of Cell A, to reduce the indoor temperature, used the window for an extended range of temperature to compensate the lack of control of the window blind. The temperature range between 28.5 (Cell B) and 28.9 °C (Cell A) defines the upper threshold for the wish of having a lower temperature in both cells, as shown in
Figure 3d. This is, interestingly, very similar to the median value of the blind adjustment desired by the occupants of Cell A.
From
Figure 3a–d, it can be summarised that:
The occupants of Cell B seemed to perform the blind adjustment not primarily to reduce the indoor temperature. On the other hand, the desire for blind adjustment is more strongly linked to temperature in Cell A.
The occupants of Cell A seemed to compensate the lack of blind control by adjusting the window opening to up to a higher temperature than that in Cell B.
A temperature-dependent sequence of actions can be derived by using the median operative temperatures for each action in both cells. The chain of actions is as such: first window opening, then removing a piece of clothing, and finally either lowering the blinds (in Cell B) or wishing to do so (in Cell A).
Figure 4 shows the action of opening of the windows (either full opening or tilting) and doors in both cells, recorded against measured operative temperature. It is worth noting that the door opening (employed to allow cross ventilation in the cell) was performed for 11% and 6% of the occupied time in Cell A and Cell B, respectively. Glazing 3 in Cell A was either fully opened for 25% of occupied time or tilted for 31% of the occupied time. Glazing 3 in Cell B was either fully opened for 32% of the occupied time or tilted for 23% of the occupied time. Glazing 2 was tilted automatically by the software for 49% of the occupied time in Cell A, and tilted manually by the users for 24% of the occupied time in Cell B. Therefore, glazing 3 was the most used window in both cells, as it was opened for at least 50% of the occupied time.
By comparing the median operative temperatures, a pattern of use of different glazing in relation to increasing operative temperature is evident in both cells. First action was to tilt glazing 3 (between 24.6 and 24.9 °C in Cell A and Cell B, respectively). It is assumed that this was done to let more air enter the cell and met the occupants’ expectations as this action occurred in a temperature range that was deemed comfortable (TSV = (0) ≅ 25 °C in both cells, as shown in
Table 4). The second action was either the automatic or manual opening of glazing 2 in Cell A and Cell B, respectively. The final action was the full opening of glazing 3 in both cells. Temperature-wise, the use of glazing 2 occurred in a similar temperature range in both cells. However, the motorised opening of this glazing was not well accepted by the occupants, as they complained that it was noisy and slow. As a matter of fact, the participants used glazing 3 for a similar share of occupied time in both cells, despite glazing 2 being already tilted for almost half of the total occupied time in Cell A. This suggests they did not regard glazing 2 as effective enough to either cool the environment or to let more fresh air in the cell, as this was their second opening choice. As above mentioned, the fully opening of glazing 3 was the last action taken by the occupants of both cells. This may be explained by the fact that the full opening of glazing 3 let more air enter and more noise as well. This may also explain why the occupants of Cell A fully opened glazing 3 for a shorter time than those of Cell B. In Cell B, the occupants fully deployed the blind down to the windowsill, whereas, in Cell A, the control system never extended the blind below half of the window height. The blind partially reduced the outdoor sound level and contributed to an increased sense of privacy.
From
Figure 4, it can be summarised that:
A temperature-dependent sequence of window opening can be derived for both cells. First, the occupants tilted the lower glazing; second, they tilted the upper glazing (or this was automatically tilted by the system); third, they fully opened the lower glazing.
Outdoor noise and reduced privacy are hypothesised to make the occupants fully open the lower glazing at last.
The automated control of the upper glazing (Cell A) was a source of noise for the occupants and not considered effective for cooling/increasing the air flow.
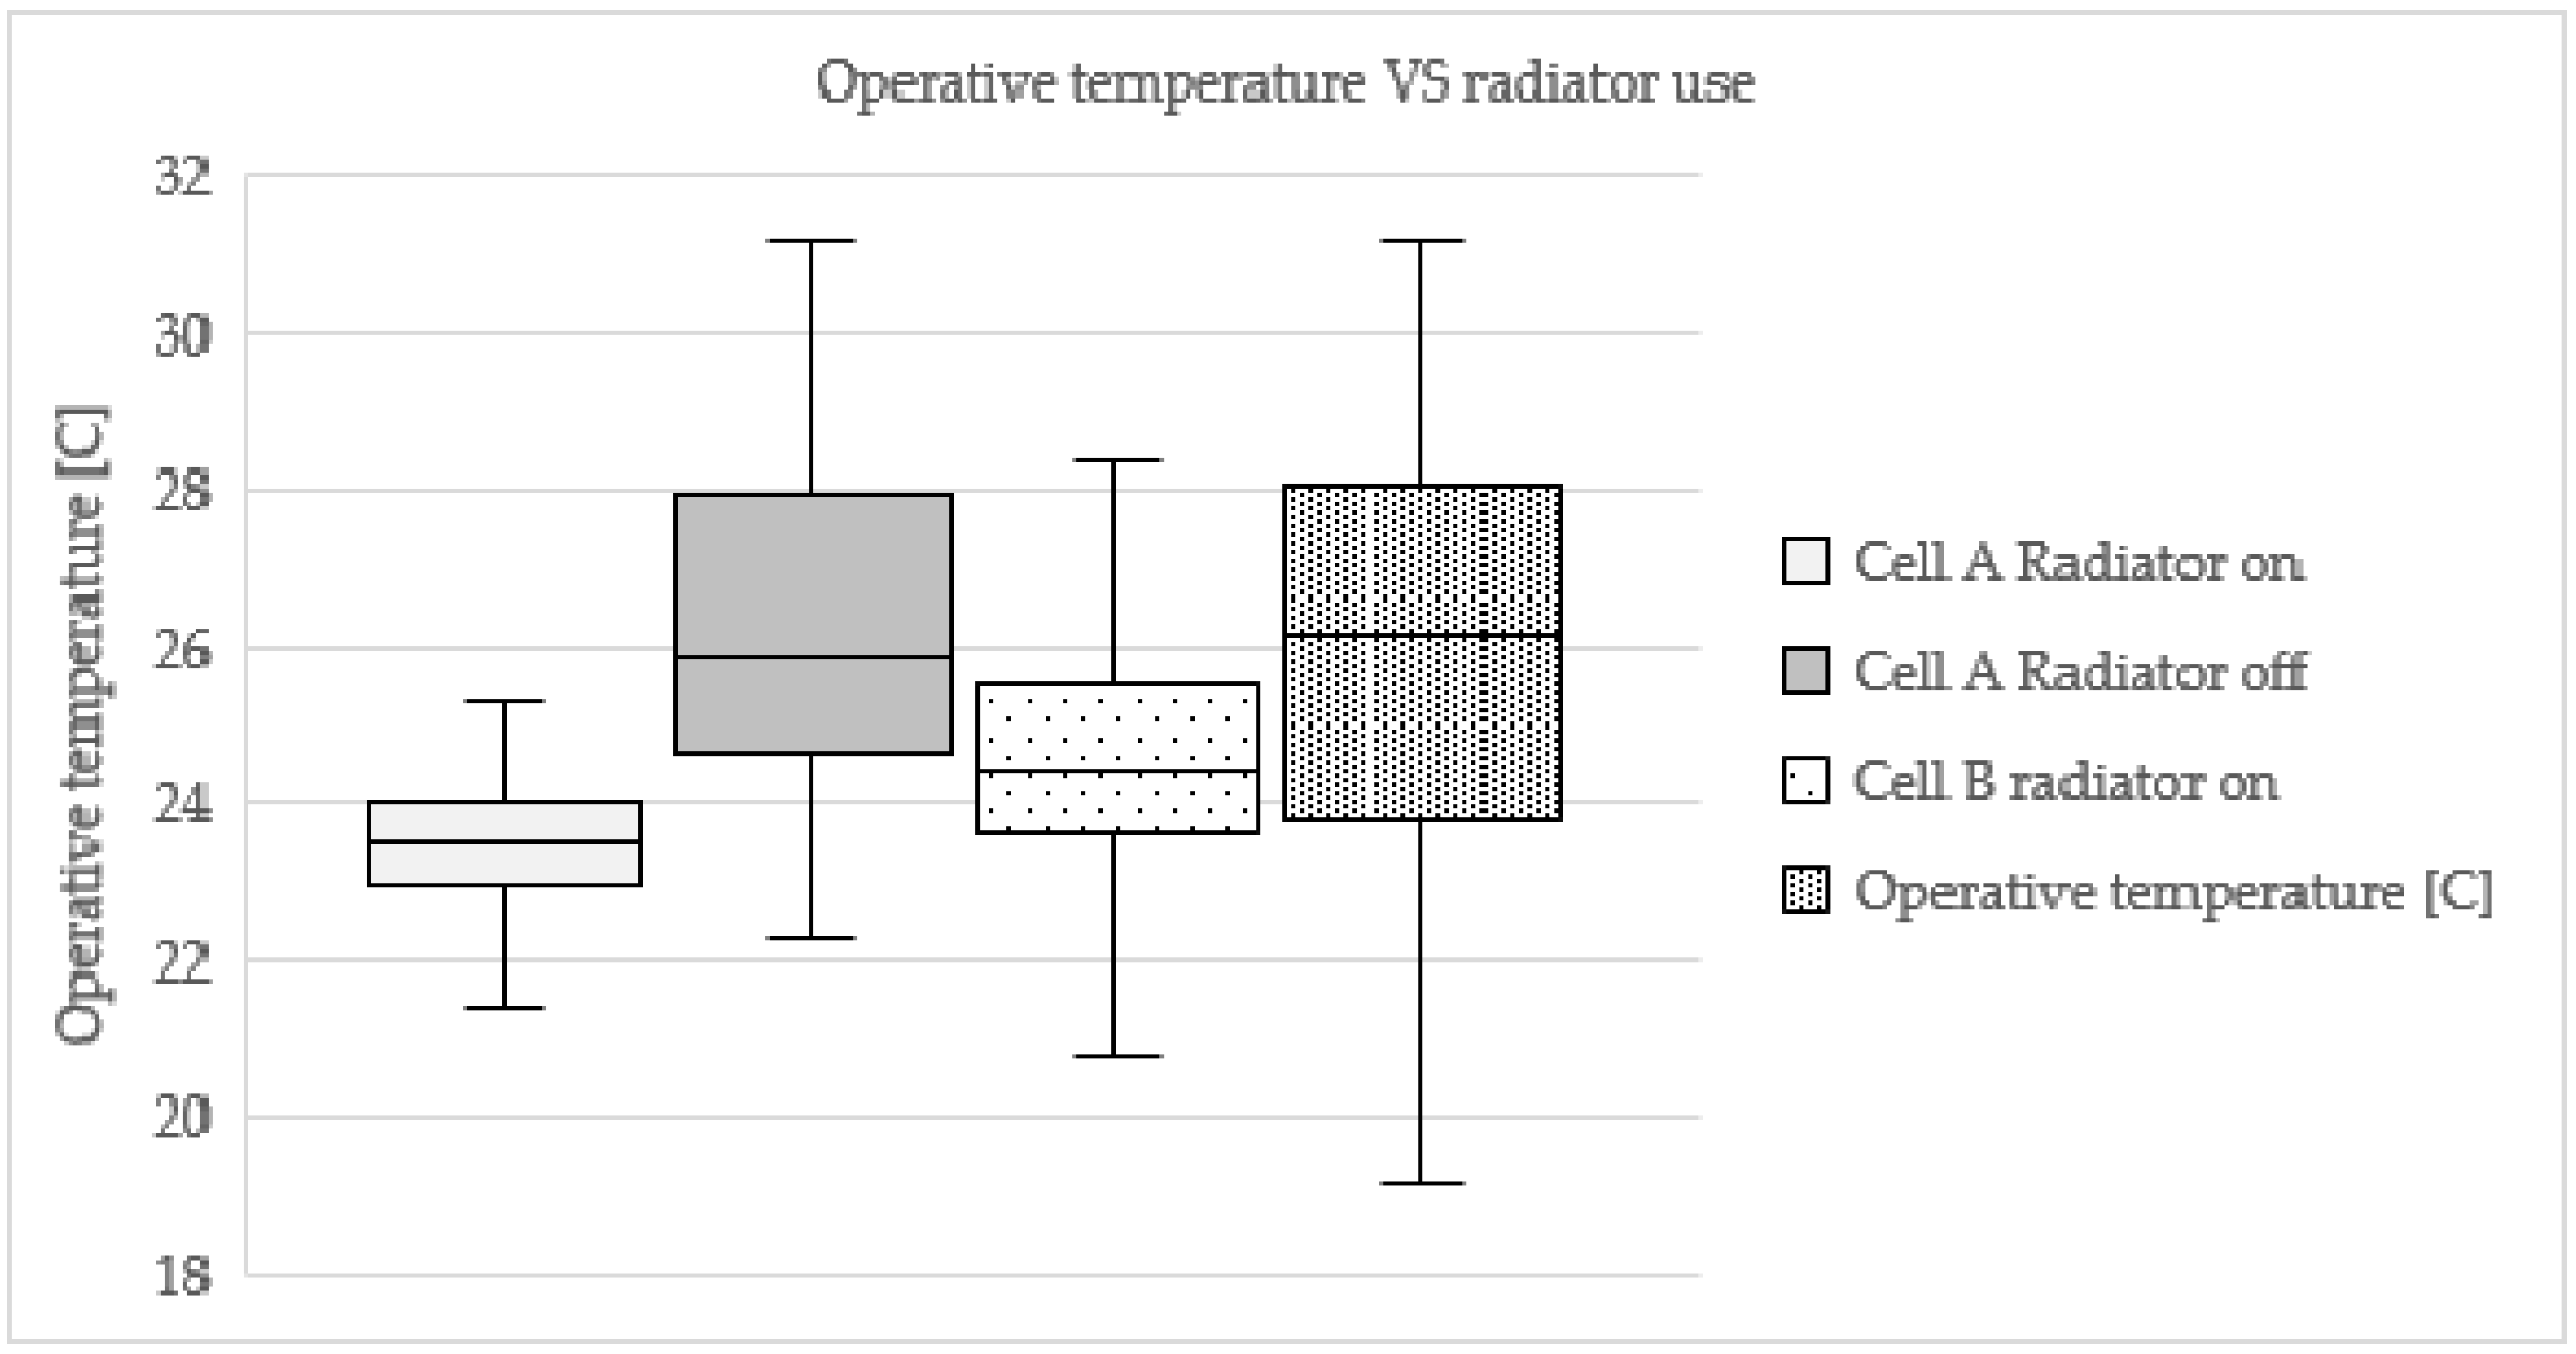
Figure 5 shows the use of the water-based radiators against measured operative temperature. The radiator in Cell A was operative for 13% of the occupied time (13.5 h), and the radiator in Cell B was operative for 44% of the occupied time (48.5 h). The radiator in Cell B was left on and without any adjustment for the first whole week of the experiment. This justifies the higher median operative temperature at which the radiator in Cell B was mostly used. The radiator in Cell B was used in a temperature range (between 23.5 and 25.5 °C) that fully overlaps with the use of tilting glazing 3 (between 22.9 and 26.1 °C), thus strengthening the hypothesis that the tilting of glazing 3 was done primarily for air changing rather than cooling.
3.2.2. Actions Taken for Increasing Visual Comfort
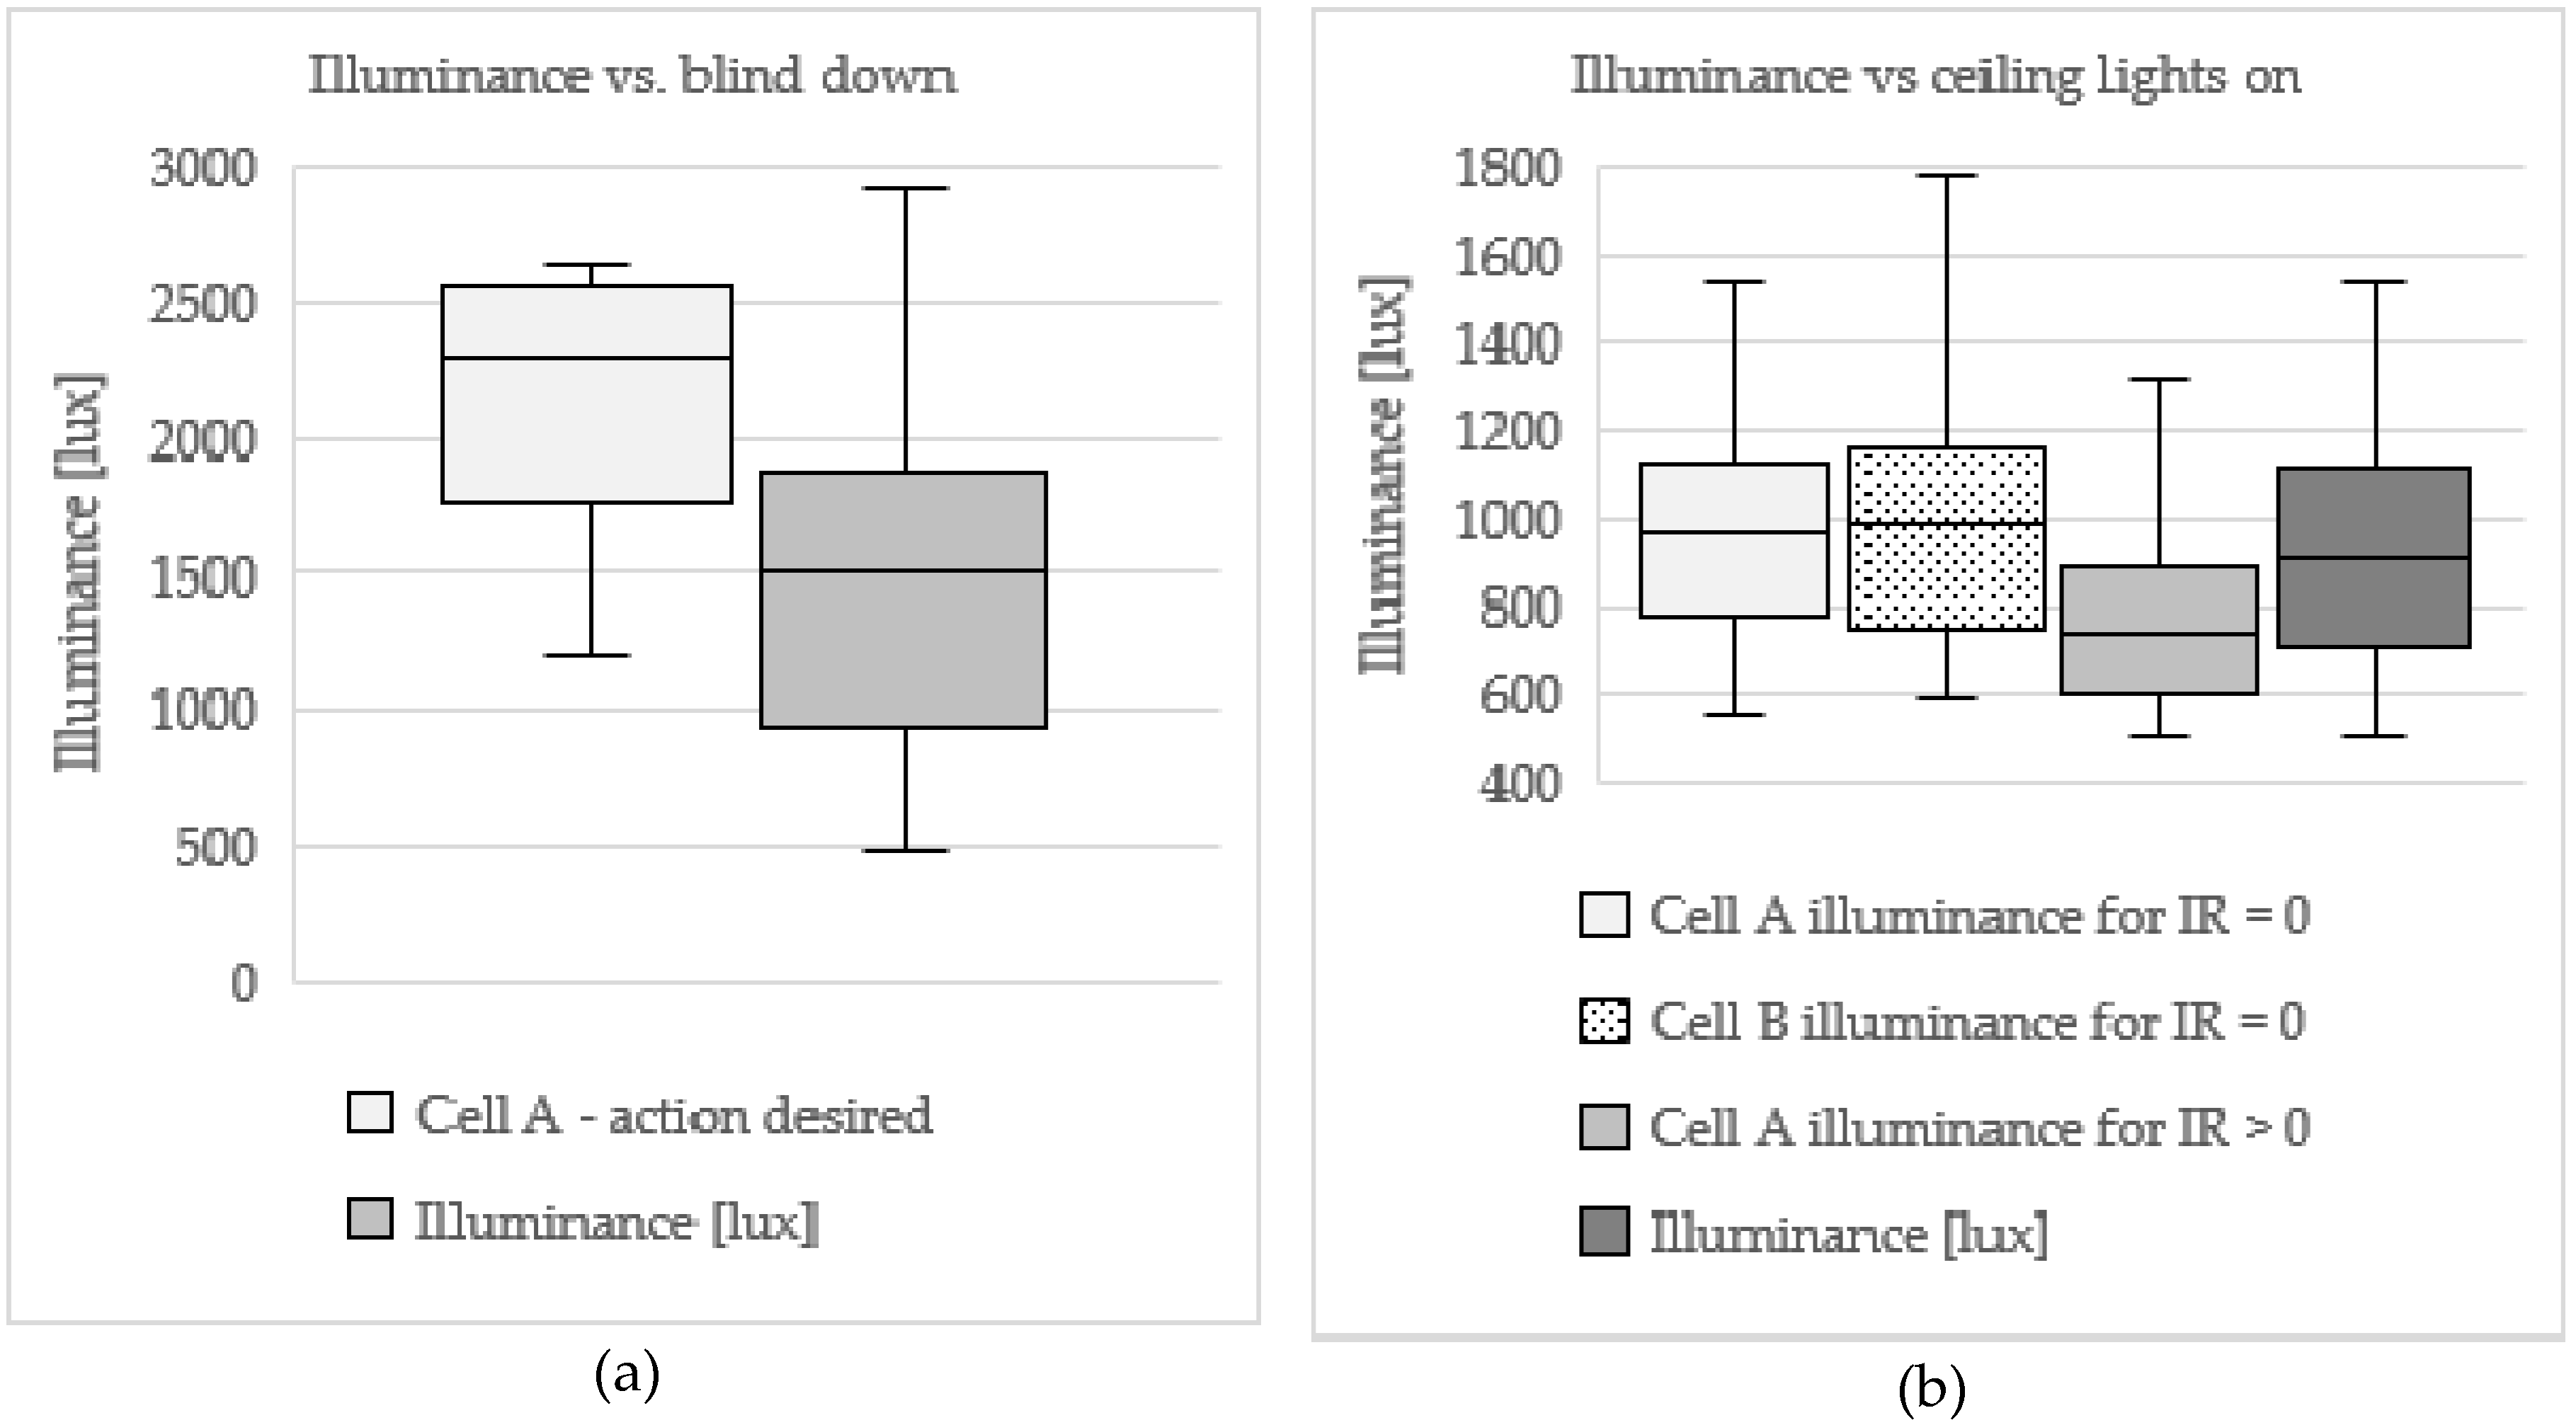
Figure 6a shows the usage pattern and the desired pattern for the window blinds against illuminance. The occupants of Cell B used the blinds between 930 and 1890 lux, whereas the occupants of Cell A expressed the desire to use the blind between 1760 and 2560 lux. The illuminance ranges are in line with the illuminance acceptability expressed by the occupants of both cells. The occupants of Cell B reported an illuminance range for IRs = (0) between 710 and 1680 lux, which almost coincides with the illuminance range of blind use (between 935 and 1885 lux). The occupants of Cell A reported an illuminance range for IRs > (0) between 854 and 2411 lux, which is much larger than the illuminance range for which they desired to use the blind (between 1767 and 2565 lux). It may be inferred therefore that the occupants of Cell A expressed a visual discomfort regardless of their expressed desire of deploying the blind. As shown in
Figure 6b, the automatic operation of the ceiling lights in Cell A is to be excluded as the main factor determining visual discomfort, since the majority of votes for IR > 0 lies between 600 and 890 lux, whereas the 1st quartile of IR = (+1)–(+2) is at 855 lux (see
Figure 2b). It is interesting to note that the visual comfort band for the use of ceiling lights (regardless of being automatic or manual) is similar in both cells. This may be related to the use of desk lamps by the occupants. It should be noted that also other factors than visual comfort may have determined the use of the window blind. Some of the occupants reported noise coming from the surrounding area. Given that both cells were located at the ground level and facing a public area, some occupants may have deployed the blind in response to increase privacy and reduce the incoming noise. This may explain the discrepancy between the illuminance range corresponding to visual discomfort and the wish of blind use, seen in Cell A. Discomfort due to noise was not investigated in this case study, though.
From
Figure 6a,b, it can be summarised that:
The manual control of the blind in Cell B was strongly linked to the reported visual comfort (IR = 0).
The visual discomfort of the occupants of Cell A was not directly related to the lack of manual control of the blind. It is hypothesised that other sources of discomfort (noise, privacy) were perceived in Cell A, but these could not be precisely identified as not directly investigated in the questionnaire.
4. Discussion
The results presented in this paper need to be evaluated in consideration of the limitations of this case study.
The frequency of use of windows in Cell A (1.7 opening/closing per day) is in line with the results by Schweiker and Wagner [
5] (between 1.6 and 1.9 opening/closing per day), whereas the frequency of window use in Cell B is higher (2.8 opening/closing per day). The difference of frequency use of windows between the two cells may be explained by the automated opening/closing of the top-right window in Cell A. However, the difference between the controls of the top-right window did not influence the perception of the cells’ occupants in relation to their need for more window adjustments. The frequency of blind adjustment seen in Cell B (1.1 times per day) is in line with the results by Schweiker and Wagner [
5].
The results of this case study confirm the findings that occupants tend to experience higher thermal discomfort by limited available control of window blinds, for equivalent thermal environments, as pointed out by Boerstra et al. [
46]. This is also consistent with the narrower band of operative temperature for which the occupants feel comfortable when they are given lower control opportunities, as highlighted by Baker and Standeven [
11].
The recorded pattern of adaptation strategies (lowering blind and opening window) used by the occupants of both cells is consistent with the findings by Haldi and Robinson [
20]. The pattern found in this case study showed that at increasing operative temperature, the occupants of Cell B first opened the window and then lowered the blind. Similar results are in Haldi and Robinson [
20], where the operative temperature for which the probability function gives 50% probability of either window opening or blind lowering is lower for window opening than for blind lowering.
A discrepancy between the desired and exercised control of the window and blind adjustments was found between the occupants of Cell A and Cell B. As seen by comparing
Figure 2a,b,
Figure 3c, and
Figure 6a. By assuming that the action of exercising control produces an increase of perceived comfort [
11,
13,
14,
16,
17,
18], it is then possible to directly relate the thermal (when TSV = 0) and visual (when IR = 0) comfort to the blind adjustment by comparing the respective variable ranges and median values (operative temperature and illuminance, respectively). In such a perspective, the occupants in Cell B used the window opening for primarily achieving thermal comfort, and the window blind for visual comfort. This is shown by the overlapping ranges and corresponding median values of operative temperature and illuminance registered during their action and when they reported their comfort levels (as shown in
Figure 2a,b,
Figure 3c, and
Figure 6a). Similarly, it is possible to find in Cell A a straightforward relation of operative temperature between the reported neutral temperature (TSV = 0) and the use of window. However, a univocal relation cannot be found in Cell A between the occupants’ expressed desire of blind use and visual comfort (IR = 0). It is hypothesised, therefore, that the occupants of Cell A attributed to the lack of control of the window blind the cause of both their thermal and visual discomfort. This is strengthened by the higher frequency of desired control of the window blind in Cell A vs. the actual exercised control in Cell B, as shown in
Table 5. According to Haldi and Robinson [
24], a direct relationship between raising indoor temperature and the increase of the shading fraction of blinds was found in tests performed in cellular offices of the LESO building, Lausanne, Switzerland. They found that the occupants tended to rather use the upper blind than the lower blind, in order to maintain a view outside. Zhang and Barret [
25] found that two concurring factors lead to deploying blinds: solar altitude and solar radiation. They analysed a one-year blind use pattern in an office building in Sheffield, England and found that the occupants tended to close the blinds primarily to prevent glare due to low sun altitude, and then because of high solar radiation and increasing indoor temperature. As described by O’Brien et al. [
26], multivariate models made to describe the use of window blinds found contradicting results in terms of which is the main driving factor, if either indoor illuminance, indoor temperature, or a combination of these two. In such a perspective, the results found in Cell A need to be further investigated to isolate single triggering factors for blind use. This case study confirms the findings that limited control opportunities in the built environment are cause of increased discomfort (either visual or thermal, as shown in
Figure 2a,b), as already shown in the literature. However, optimisation of the energy use in office buildings is often pursued by installation of automatic controls (of blinds, especially). A survey conducted in a recently built low-energy office building in Trondheim, Norway [
4] showed that the office occupants deactivated the automated external blinds just after one month of operation. The occupants complained of the too dark condition at blinds deployment and wished for an increased control of the blinds. As a result, the building owner installed internal manual roller shaders. The automated external blinds were installed to minimise the cooling demand of the building. In a similarly-low-energy building built in Kjørbo, Norway [
4] and equipped with automated external blinds, between 20% and 37% of occupants sitting in South-facing offices expressed visual discomfort during afternoons and middays, respectively. It is therefore clear that the energy optimisation of office buildings pursued by installation of automated systems does not necessarily meet the occupants’ comfort expectations. In such a perspective, a trade-off between the variety of occupants’ personal preferences and reduction of energy use in buildings should be pursued, as shown in studies of enhanced building–occupant interaction for a fine tuning of automated control systems [
47,
48].
5. Conclusions
The influence of different control strategies on the user’s satisfaction in cell offices was studied in a full-scale facility in Trondheim, Norway. Eleven participants used two test rooms as a workspace for a minimum of 5 h per day and for a total of 19 calendar days. During their permanence in the rooms, the participants answered a computer-based questionnaire for reporting Thermal Sensation Votes and Illuminance Rating. The answers were analysed against measured operative temperature and desk illuminance. Two different strategies for controlling the indoor environment were used in the case study. In Cell A, the ceiling-mounted lights, the window blind, and the water-based radiator were controlled by the main acquisition and control system, whereas in Cell B these were manually controlled by the users. In both cells, the window opening was user-controlled, except for the top motorised window, which in Cell A was computer-controlled, and in Cell B was user-controlled. The adaptive strategies adopted by the occupants, namely window opening, window blind, clothing level, and radiator use, were analysed in relation to the measured operative temperature and illuminance.
Patterns of adaptation strategies were found. The results of this case study showed that:
A limited control of the cell environment (in Cell A) produced a narrower thermal neutral zone (TSV = (0)), and this spanned for 0.9 °C in Cell A vs. 2.1 °C in Cell B.
The automation of the blind control in Cell A made it impossible to find an illuminance range for which all the occupants reported visual comfort (IR = (0)). This was instead found between 710 and 1272 lux in Cell B.
A discrepancy between the desired and exercised control of the window and blind adjustments was found between the occupants of Cell A and Cell B, and specifically:
The automated control of the window blind in Cell A caused the occupants to express a desire for blind adjustment more frequently than their actual use of the blind in Cell B.
The occupants of Cell B seemed to perform the blind adjustment not primarily to reduce the indoor temperature, and it was strongly linked to the reported visual comfort (IR = 0).
The desire for blind adjustment is more strongly linked to temperature in Cell A. For this reason, the occupants of Cell A seemed to compensate the lack of blind control by adjusting the window opening to up to a higher temperature than that in Cell B.
The visual discomfort of the occupants of Cell A was not directly related to the lack of manual control of the blind. It is hypothesised that other sources of discomfort (noise, privacy) were perceived in Cell A but these could not be precisely identified as not directly investigated in the questionnaire.
In both cells, a temperature-dependent sequence of actions was found to be: first window opening, then removing a piece of clothing, and finally either lowering the blinds (in Cell B) or wishing to do so (in Cell A). With regard to the use of the different glazing, this followed a temperature-dependent sequence in both cells. First, the occupants tilted the lower glazing; second, they tilted the upper glazing (or this was automatically tilted by the system); third, they fully opened the lower glazing. Specifically, it is hypothesised that outdoor noise and reduced privacy made the occupants fully open the lower glazing last. The automated control of the upper glazing (Cell A) was a source of noise for the occupants and not considered effective for cooling/increasing the air flow.
This study investigated the thermal and visual comfort as triggering factors for the exercise of control in a cell office environment. It was found that different triggering factors may have influenced the participants’ use of the window and blind to increase their comfort level, and these factors (indoor temperature and illuminance) may have played a different role depending on the availability of environmental controls. It is therefore worth investigating with additional test cell experiments to specifically focus on this difference. Moreover, other stress factors (such as noise and lack of privacy) were mentioned by the participants but not directly investigated. These are also worth being specifically evaluated and estimated for their influence on the visual and thermal comfort.
Author Contributions
Conceptualization, N.L.; methodology, N.L.; formal analysis, N.L.; investigation, N.L. and Alessandro Nocente; resources, N.L. and A.N.; data curation, N.L.; writing—original draft preparation, N.L.; writing—review and editing, N.L., A.N., S.G.; visualization, A.N.; supervision, S.G.; project administration, N.L.; funding acquisition, S.G. All authors have read and agreed to the published version of the manuscript.
Funding
This research was funded by the Research Council of Norway and several partners through the project “Advanced facades with integrated technology—SkinTech” (nr. 255252).
Acknowledgments
We gratefully thank Johannes Brozovksy and Ruth Woods for their helpful contribution to the realization of the experiment in this case study.
Conflicts of Interest
The authors declare no conflict of interest. The funders had no role in the design of the study; in the collection, analyses, or interpretation of data; in the writing of the manuscript, or in the decision to publish the results.
References
- Bordass, B.; Bromley, K.; Leaman, A. User and occupant controls in office buildings. In Building Design, Technology and Occupant Well-Being in Temperate Climates; Building Use Studies: Brussels, Belgium, 1993. [Google Scholar]
- Shahzad, S.; Brennan, J.; Theodossopoulos, D.; Hughes, B.; Calautit, J.K. Energy and comfort in contemporary open plan and traditional personal offices. Appl. Energy 2017, 185, 1542–1555. [Google Scholar] [CrossRef]
- Lolli, N.; Nocente, A.; Brozovsky, J.; Woods, R.; Grynning, S. Automatic vs manual control strategy for window blinds and ceiling lights: Consequences to perceived visual and thermal discomfort. J. Daylighting 2019, 6, 112–123. [Google Scholar] [CrossRef]
- Grynning, S.; Lolli, N.; Wågø, S.; Risholt, B. Solar shading in low energy office buildings—Design strategy and user perception. J. Daylighting 2017, 4, 1–14. [Google Scholar] [CrossRef]
- Schweiker, M.; Wagner, A. The effect of occupancy on perceived control, neutral temperature, and behavioral patterns. Energy Build. 2016, 117, 246–259. [Google Scholar] [CrossRef]
- Hellwig, R.T. Perceived control in indoor environments: A conceptual approach. Build. Res. Inf. 2015, 43, 302–315. [Google Scholar] [CrossRef]
- Deuble, M.P.; de Dear, R.J. Mixed-mode buildings: A double standard in occupants’ comfort expectations. Build. Environ. 2012, 54, 53–60. [Google Scholar] [CrossRef]
- Leaman, A.; Bordass, B. Are users more tolerant of ‘green’ buildings? Build. Res. Inf. 2007, 35, 662–673. [Google Scholar] [CrossRef]
- Brager, G.; Paliaga, G.; de Dear, R. Operable windows, personal control and occupant comfort. ASHRAE Trans. 2004, 110. [Google Scholar]
- Bauman, F.S.; Carter, T.G.; Baughman, A.V.; Arens, E.A. Field study of the impact of a desktop task/ambient conditioning system in office buildings. ASHRAE Trans. 1998, 104, 125–142. [Google Scholar]
- Baker, N.; Standeven, M. A behavioural approach to thermal comfort assessment. Int. J. Sol. Energy 1997, 19, 21–35. [Google Scholar] [CrossRef]
- De Dear, R.J.; Schiller Brager, G. Developing an adaptive model of thermal comfort and preference. ASHRAE Trans. 1998, 104, 145–167. [Google Scholar]
- de Dear, R.; Brager, G.; Cooper, D. Developing an Adaptive Model of Thermal Comfort and Preference; ASHRAE RP-884 Final Report; Macquarie Research Ltd.: Sydney, Australia, 1997; pp. 1–312. [Google Scholar]
- Humphreys, M.A.; Rijal, H.B.; Nicol, J.F. Updating the adaptive relation between climate and comfort indoors; new insights and an extended database. Build. Environ. 2013, 63, 40–55. [Google Scholar] [CrossRef]
- Fanger, P.O. Assessment of man’s thermal comfort in practice. Br. J. Ind. Med. 1973, 30, 313–324. [Google Scholar] [CrossRef] [PubMed]
- Cabanac, M. Pleasure and joy and their role in human life. In Creating the Productive Workplace; Croome, D., Ed.; CRC Press: Boca Raton, FL, USA, 2000. [Google Scholar]
- Cabanac, M. Physiological role of pleasure. Science 1971, 173, 1103–1107. [Google Scholar] [CrossRef] [PubMed]
- Paciuk, M. The role of personal control of the environment in thermal comfort and satisfaction at the workplace. In Coming of Age; Selby, R.I., Anthony, K.H., Choi, J., Orland, B., Eds.; Environmental Design Research Association: Oklahoma City, OK, USA, 1990; pp. 303–312. [Google Scholar]
- Meinke, A.; Hawighorst, M.; Wagner, A.; Trojan, J.; Schweiker, M. Comfort-related feedforward information: Occupants’ choice of cooling strategy and perceived comfort. Build. Res. Inf. 2017, 45, 222–238. [Google Scholar] [CrossRef]
- Haldi, F.; Robinson, D. On the behaviour and adaptation of office occupants. Build. Environ. 2008, 43, 2163–2177. [Google Scholar] [CrossRef]
- Tzempelikos, A.; Athienitis, A.K. The impact of shading design and control on building cooling and lighting demand. Sol. Energy 2007, 81, 369–382. [Google Scholar] [CrossRef]
- Shen, E.; Hu, J.; Patel, M. Energy and visual comfort analysis of lighting and daylight control strategies. Build. Environ. 2014, 78, 155–170. [Google Scholar] [CrossRef]
- Yu, X.; Su, Y. Daylight availability assessment and its potential energy saving estimation—A literature review. Renew. Sustain. Energy Rev. 2015, 52, 494–503. [Google Scholar] [CrossRef]
- Haldi, F.; Robinson, D. Adaptive actions on shading devices in response to local visual stimuli. J. Build. Perform. Simul. 2010, 3, 135–153. [Google Scholar] [CrossRef]
- Zhang, Y.; Barrett, P. Factors influencing occupants’ blind-control behaviour in a naturally ventilated office building. Build. Environ. 2012, 54, 137–147. [Google Scholar] [CrossRef]
- O’Brien, W.; Kapsis, K.; Athienitis, A.K. Manually-operated window shade patterns in office buildings: A critical review. Build. Environ. 2013, 60, 319–338. [Google Scholar] [CrossRef]
- Jain, S.; Garg, V. A review of open loop control strategies for shades, blinds and integrated lighting by use of real-time daylight prediction methods. Build. Environ. 2018, 135, 352–364. [Google Scholar] [CrossRef]
- Karlsen, L.; Heiselberg, P.; Bryn, I. Occupant satisfaction with two blind control strategies: Slats closed and slats in cut-off position. Sol. Energy 2015, 115, 166–179. [Google Scholar] [CrossRef]
- Yun, G.; Yoon, K.C.; Kim, K.S. The influence of shading control strategies on the visual comfort and energy demand of office buildings. Energy Build. 2014, 84, 70–85. [Google Scholar] [CrossRef]
- Goia, F.; Schlemminger, C.; Arild, G. The ZEB test cell laboratory. A facility for characterization of building envelope systems under real outdoor conditions. In Proceedings of the 11th Nordic Symposium on Building Physics, Trondheim, Norway, 11–14 June 2017. [Google Scholar]
- Schellen, L.; Loomans, M.G.; de Wit, M.H.; Olesen, B.W.; van Marken Lichtenbelt, W.D. The influence of local effects on thermal sensation under non-uniform environmental conditions—Gender differences in thermophysiology, thermal comfort and productivity during convective and radiant cooling. Physiol. Behav. 2012, 107, 252–261. [Google Scholar] [CrossRef]
- Karjalainen, S. Gender differences in thermal comfort and use of thermostats in everyday thermal environments. Build. Environ. 2007, 42, 1594–1603. [Google Scholar] [CrossRef]
- Parsons, K.C. The effects of gender, acclimation state, the opportunity to adjust clothing and physical disability on requirements for thermal comfort. Energy Build. 2002, 34, 593–599. [Google Scholar] [CrossRef]
- Kruger, E.L.; Drach, P. Identifying potential effects from anthropometric variables on outdoor thermal comfort. Build. Environ. 2017, 117, 230–237. [Google Scholar] [CrossRef]
- Karyono, T.H. Report on thermal comfort and building energy studies in jakarta—Indonesia. Build. Environ. 2000, 35, 77–90. [Google Scholar] [CrossRef]
- Indraganti, M.; Rao, K.D. Effect of age, gender, economic group and tenure on thermal comfort: A field study in residential buildings in hot and dry climate with seasonal variations. Energy Build. 2010, 42, 273–281. [Google Scholar] [CrossRef]
- Choi, J.; Aziz, A.; Loftness, V. Investigation on the impacts of different genders and ages on satisfaction with thermal environments in office buildings. Build. Environ. 2010, 45, 1529–1535. [Google Scholar] [CrossRef]
- Zaki, S.A.; Damiati, S.A.; Rijal, H.B.; Hagishima, A.; Abd Razak, A. Adaptive thermal comfort in university classrooms in malaysia and japan. Build. Environ. 2017, 122, 294–306. [Google Scholar] [CrossRef]
- SN/TS 3031:2016. Energy Performance of Buildings. Calculation of Energy Needs and Energy Supply; Standard Norge: Oslo, Norway, 2016. [Google Scholar]
- ISO 7726:1998. Ergonomics of the thermal environment. Instruments for measuring physical quantities; Standard Norge: Oslo, Norway, 2001. [Google Scholar]
- Van Den Wymelenberg, K. Patterns of occupant interaction with window blinds: A literature review. Energy Build. 2012, 51, 165–176. [Google Scholar] [CrossRef]
- Galasiu, A.D.; Veitch, J.A. Occupant preferences and satisfaction with the luminous environment and control systems in daylit offices: A literature review. Energy Build. 2006, 38, 728–742. [Google Scholar] [CrossRef]
- Kim, S.-Y.; Kim, J.-J. Influence of light fluctuation on occupant visual perception. Build. Environ. 2007, 42, 2888–2899. [Google Scholar] [CrossRef]
- Nabil, A.; Mardaljevic, J. Useful daylight illuminance: A new paradigm for assessing daylight in buildings. Light. Res. Technol. 2005, 37, 41–57. [Google Scholar] [CrossRef]
- Roche, L.; Dewey, E.; Littlefair, P. Occupant reactions to daylight in offices. Int. J. Light. Res. Technol. 2000, 32, 119–126. [Google Scholar] [CrossRef]
- Boerstra, A.; Beuker, T.; Loomans, M.; Hensen, J. Impact of available and perceived control on comfort and health in european offices. Archit. Sci. Rev. 2013, 56, 30–41. [Google Scholar] [CrossRef]
- Sadeghi, S.A.; Karava, P.; Konstantzos, I.; Tzempelikos, A. Occupant interactions with shading and lighting systems using different control interfaces: A pilot field study. Build. Environ. 2016, 97, 177–195. [Google Scholar] [CrossRef]
- Nagy, Z.; Yong, F.Y.; Schlueter, A. Occupant centered lighting control: A user study on balancing comfort, acceptance, and energy consumption. Energy Build. 2016, 126, 310–322. [Google Scholar] [CrossRef]
© 2020 by the authors. Licensee MDPI, Basel, Switzerland. This article is an open access article distributed under the terms and conditions of the Creative Commons Attribution (CC BY) license (http://creativecommons.org/licenses/by/4.0/).


