Article

Key Decision-Makers and Persuaders in the Selection of Energy-Efficient Technologies in EU Residential Buildings

1
Department of Civil and Environmental Engineering, Chalmers University of Technology, 41296 Gothenburg, Sweden
2
Computational Social Science Department, Institute for Social Science, University of Stuttgart, 70174 Stuttgart, Germany
3
Wuppertal Institute for Climate, Environment and Energy, 42103 Wuppertal, Germany
4
TEP Energy, 8037 Zürich, Switzerland
*
Author to whom correspondence should be addressed.
Buildings 2020, 10(4), 70; https://doi.org/10.3390/buildings10040070
Submission received: 5 February 2020 / Revised: 29 March 2020 / Accepted: 30 March 2020 / Published: 2 April 2020
(This article belongs to the Section Building Energy, Physics, Environment, and Systems)

Abstract

:
With regard to residential energy use in the European Union (EU), most studies consider potential adopters of the technology (e.g., private owners) as being the sole decision-makers in the technology selection. However, during an integrated decision-making process (e.g., a construction project) multiple stakeholders will interact, influencing each other’s judgement, thereby making it difficult to discern who is affecting the final decision, and to what extent. The goal of this study is to outline the full network of stakeholders involved in the decision-making process, along with their degree of power and interaction in the technology choice. For this purpose, empirical evidence from a multi-country survey is examined using social network analysis (SNA). The information is compared across building typologies, project types and countries (i.e., Italy, Spain, Germany, Poland, the United Kingdom, France, Belgium and the Netherlands). The results demonstrate that, in EU residential buildings, potential adopters of the technology are not the only stakeholders involved in the technology selection. They are in all instances in communication with multiple stakeholders, some of whom also hold a high level of power in the decision (i.e., key persuaders). Furthermore, their level of power and communication varies substantially across building typologies, project types and countries.

1. Introduction

In Europe, about 35% of the building stock is over 50 years old and more than 75% is considered to be energy inefficient [1]. In view of this situation, the EU decided to upgrade the energy performance of the building stock and has appointed two main decrees to support this task: (1) the Energy Efficiency Directive (EED) (2012/27/EU), and (2) the Energy Performance of Buildings Directive (EPBD) (revised 2018/844/EU) [2,3]. Among its requirements, the revised EPBD demands all buildings—including residential buildings—to be nearly zero-energy (nZEB) by 2050.
Technology options to decrease a building’s energy demands to nZEB standards are readily available and often economically viable. The promising performance and economic potential of these technologies has also been acknowledged in residential buildings at an EU level [4,5,6]. The study developed by (Hermelink et al.) showed that, in various cases, and depending on the exact national nearly zero-energy building definition, nZEBs are beyond cost optimality. Nevertheless, these are not being deployed at the rate required to meet the EU’s greenhouse gas emission (GHG) reduction targets. Annual new construction rates in the residential sector are still around 1%. Furthermore, most EU Member States have suffered a decrease in the rate of new-builds in recent years [7]. In terms of retrofit activities, an average of 0.4%–1.2% of the EU residential building stock is renovated each year [8], out of which less than 5% is reaching nZEB standards [9]. The divergence between the technoeconomic potential and actual market behaviour, the so-called ‘energy efficiency gap’, implies that market hurdles are preventing the large-scale diffusion of these solutions [10]. It also suggests that, in the European housing context, the economic viability of energy efficiency technologies—specifically, the cost of potential energy savings (commonly considered to be the only financial benefit)—is not sufficiently acknowledged or appealing to motivate the necessary investments [11].
In order to bridge the energy efficiency gap, market barriers need to be addressed. Barriers vary considerably depending on location, building type, culture and stakeholder groups, as do the options to overcome them (i.e., policies, programmes and strategies) [12]. An underlying hurdle in the adoption of innovations—common across countries—is derived from the structure of the construction sector itself [13]. In the construction sector, projects are composed of a temporary network of people with contrasting roles and priorities interacting with each other to bring the work forward [14]. These distinct roles and priorities have often been identified as a key barrier in the adoption of energy-efficient (EE) technologies. An example of this is represented by the low interest of some builders to invest in energy-efficient technologies because they will not be the beneficiaries of the energy savings. A first step to address this barrier is to better comprehend the complete network of stakeholders involved in the technology selection, along with their level of power in the decision. Nonetheless, in the EU residential building context, most studies consider the potential technology adopters (i.e., demand-side actors) to be the sole decision-makers of the technology selection, neglecting any other actor from the decision-making process.
Against this background, the goal of this study is to contribute to the understanding of the complete stakeholder network involved in the adoption of energy-saving technologies in EU residential buildings. More specifically, the study aims to better understand: (I) Which stakeholder groups are involved in the technology selection process, (II) what the level of power and communication is for each group involved in the decision, (III) who the key persuaders are for the potential adopters in this process and (IV) how this system varies across EU member states, building typologies and building projects.
In the following section, we synthesise the state of research in this topic (Section 2). We then elaborate on the methods used to map the networks and identify the most important decision-makers and persuaders (Section 3). Results of the network analysis are presented in Section 4. This is followed by discussions and conclusions (Section 5). The paper closes with a presentation of the outlook and potential applications (Section 6).

2. Literature Overview

In scientific terms, the understanding of technology dissemination—along with its attitude-based conditions and dynamics—has typically been addressed by technology diffusion theories. Technology diffusion theories seek to explain how, why and with what gradients and rates new ideas and technologies are spread [15]. It is defined by the process in which an innovation is communicated over time among the participants in a social system.
In this way, given that demand-side actors (i.e., private owners or public and private housing associations) make the adoption-decision, they are central to the diffusion of innovations. This view has been reflected in most of the scientific literature within the European residential context. Using an adopter-centric approach, Mahapatra and Gustavsson analysed the influence of investment subsidies on the conversion of resistance heaters and oil boilers, and the variation in diffusion patterns of district heating, heat pumps and pellet boilers in Swedish detached homes. Similarly, Hecher et al. investigated the triggers behind homeowner decisions to invest in a new heating system in Austria [16]. For their part, Wilson et al. analysed the contrasting perspectives on why homeowners renovate energy-efficiently [17]. Pettifor et al. provided empirical evidence for the influence of energy efficiency policy on homeowners conducting renovations [18]. Banfi et al. studied the willingness to pay for energy-saving measures in residential buildings in Switzerland [19].
However, during an integrated decision-making process—such as a construction project—multiple stakeholders will interact, influencing each other’s judgements. This makes it difficult to distinguish who is really involved in the technology choice and to what extent this determines the final outcome (i.e., adoption or rejection). Furthermore, the individual priorities, objectives and roles of these agents might change from one type of project to another [14,20,21]. As a result of this, when seeking to better understand the decision-making process in the technology selection, it is vital to comprehend the complete stakeholder network, including not only the adopter but also key persuaders (i.e., any stakeholder with whom the adopter is in communication, with the capacity or power to affect or determine their final choice) [13].
In the EU residential sector, several studies exist that map the level of implication of the multiple stakeholders involved in a building decision-making process. An example of this is provided by Li et al., where they developed a systematic approach to identify key stakeholders (including influencers and interests) and key performance indicators for district- and building-energy performance analysis [22]. Similarly, Olander and Landin evaluated the influence of stakeholders in the implementation of construction projects [23] Olander and Landin. In another instance, Berardi developed a semi-structured interview questionnaire, which he conducted to identify stakeholders’ level of influence in two specific case studies for new buildings in Italy [14]. There is another whole body of literature, which studies multiple stakeholders using agent-based modelling (ABM). ABM is a class of computational models for simulating the actions and interactions of autonomous agents (both individual or collective entities, such as organisations or groups). It has often been used as a tool to represent the complexities of energy demand in the building sector, such as those caused by social interactions and spatial constraints [24]. For instance, Stephan et al. used ABM to understand how social network interactions can help stakeholders with different characteristics to prioritise their values on cost awareness, energy saving and organisational performance [25]. Knoeri et al. studied construction stakeholders’ decisions regarding recycled mineral construction materials in Switzerland [26]. Moglia and James applied ABM to a number of scenarios with policies aimed at increasing the adoption of solar hot water systems [27].
However, despite the fact that these studies can reveal the level of power or influence in the decisions, they do not visually represent the interlinkages between the stakeholders and the potential effect on each other’s judgements. To better represent these results in a network structure, social network analysis (SNA) can serve as a useful tool.

Social Network Analysis (SNA) in the Building Sector

Social network analysis (SNA), sometimes also referred to as ‘structural analysis’ [28], is not a formal theory, but rather a broad strategy for investigating and visualising social structures. SNA examines interactions between units in a group through the use of networks and graph theory [29]. Network structures are characterised in terms of nodes (i.e., individual actors, agents, people or things within the network) and the links between the nodes (i.e., ties or edges). SNA has been applied to a multitude of research fields (e.g., aerospace, anthropology and computer science) with the goal of investigating different relationships between organisations and individuals [30,31,32,33]. In this way, SNA has proved to be a powerful tool in order to unravel complex interaction patterns within the network, as is the case for building construction projects.
Few SNA studies have been applied to the building sector. One of the most comprehensive ones is from Zheng et al., which provides a review of the application of SNA in construction project and management research [34]. Likewise, Malisiovas and Song investigate team communication structure optimisation for construction projects through SNA [35]. Also, Yang and Zou utilised SNA to analyse stakeholder-associated risk and interactions in complex green building projects [36]. Similarly, Bale et al. developed social networks for promoting the adoption of energy technologies in the domestic sector for the British city of Leeds [37]. In parallel, Pryke presents an overview of applications, methods and advantages, in which the following benefits of SNA in the context of building construction projects are described [38]:
  • Detailed representation of the construction structure and process of the project: the construction process demands a non-linear and iterative approach (e.g., discrete choice) to an increasingly complex process. Non-network types of analysis generally present the construction process as a linear action with a very low or non-existing level of interaction.
  • Interdependence: the inquiry of social networks allows for the observation of changing project roles regarding specific fundamental groups of activities.
  • Appropriate detail: the analysis of information exchanges related to particular individual decisions, or small groups of decisions, will not offer sufficiently broad data about changes to the duties of the project actors within new procurement routes.
  • Consistency of analysis and representation: the sole use of social network analysis enables a relevant comparison of a wide range of different networks, with quite distinct kinds of relationships.
  • Recognition of non-dyadic, contractual relations: the use of a network approach admits the need for the development of new contractual adjustments that do not rely on dyadic relations.
This synthesis shows the advantages of applying SNA in the building sector. Nonetheless, no study was found that characterises the complete stakeholder network (including key persuaders) in the technology selection and how they differ across building typologies, project types and EU countries.

3. Materials and Methods

The purpose of this paper is to map stakeholders’ levels of power and interaction in the decision-making process leading to the technology selection. Specifically, we conduct a social network analysis (SNA) using the data collected from a multi-country survey. The results have been clustered per building typology and project type across the sampled countries. The remainder of this section describes the survey instrument used for the data collection, as well as the SNA.

3.1. Data Collection: A Multi-Country Online Survey

The data used in the SNA was collected from a multi-country online survey distributed in 2019 across 8 European countries: Italy (IT), Spain (ES), Germany (DE), Poland (PL), the United Kingdom (UK), France (FR), Belgium (BE) and the Netherlands (NL). To enable cross-country comparability of the results, all countries used a common survey instrument translated into the local language and jargon with the support of a market expert team and targeted respondent representatives from each country. The overall sample contains 7231 responses.
Since the population of interest (i.e., residential building projects in the EU) was significantly large and heterogeneous, and because there was a need to represent even small subgroups of the population (e.g., stakeholder groups, comprehensive refurbishment projects, etc.), a stratified sample approach was considered to be the most appropriate [39]. Based on the universe defined for this study, the sample was divided into the following three stratification axes: (I) Stakeholder group, (II) building typology and (III) project type. The complete list of stakeholder groups, building typologies and project types addressed in this study is described in Table 1 and Table 2.
One stratification axis is controlled ex-ante (i.e., stakeholder group) and two are controlled for during the survey or ex-post (i.e., building typology and project type). When the two main building typology groups and project types are combined, the following clusters arise, herein referred to as ‘buckets’:
  • retrofit of single-dwelling buildings
  • retrofit of multi-dwelling buildings
  • comprehensive retrofit of single-dwelling buildings
  • comprehensive retrofit of multi-dwelling buildings
  • new construction of single-dwelling buildings
  • new construction of multi-dwelling buildings
To ensure the analysis of each axis, a minimum quota was assigned to each one (see Appendix A). The minimum quota per country was established in 500 responses, with a correction factor in those countries with a smaller population size (e.g., Belgium). To obtain a well-balanced sample, the distribution of the survey was assigned to a professional company using a consistent methodology across all countries (Hecher et al.). Since the analysis focused on building projects, a subset of the complete database was used. Subsequently, the final sample used for this study consists of 4277 responses, with the following distribution across countries: Italy (n = 722), Spain (n = 511), Germany (n = 526), Poland (n = 545), the United Kingdom (n = 504), France (n = 501), Belgium (n = 463) and the Netherlands (n = 505).
Further information on the survey methodology including access to the complete questionnaire can be found in Appendix A.

3.2. Data Analysis

After collecting all of the responses, data cleaning was performed to remove responses with: (1) any of the SNA questions unanswered, (2) a completion time of less than 8 min (as this has been the minimum tested time for completion of the questionnaire) and (3) inconsistent answers (e.g., selecting different stakeholder groups throughout the interview). By means of this process, responses in each country were screened out—5%–15% depending on the country.
The survey analysis was then organised to investigate four interconnected research questions: (I) Who are the stakeholders involved in the EE technology measures? (II) What is the level of power of each stakeholder in the decision? (III) What is the level of communication/interaction between them? and (IV) How does this vary across the different countries, building typologies and project types? The applied method is described hereafter.

3.3. Social Network Analysis (SNA)

In this study, the stakeholder groups are represented by nodes (i.e., circles), and their role in the building value chain is represented by a given number. In parallel, the power of the stakeholder in the decision is expressed in the graph through the size of the node. The link between the nodes represents the level of communication between them in technology adoption, where the width of the line represents the level or frequency of their communication. In this way, undirected weighted graphs are traced.
Given that the information to feed the analysis was gathered through an online survey (thereby representing a sample of the complete population), the system is categorised as an ego-network on roles.
As in most network graphs, the full information about the network is contained in its list of nodes and relations, rather than in the location of the nodes. The location of the nodes is defined by an algorithm and might therefore change according to the plot used to render it (e.g., random configuration, free-hand grouping, circle configuration, etc.) [41]. In this study, the network was created using the Fruchterman–Reingold algorithm, which is one of the most often used methods, where the sum of the force vectors determines in which direction a node should move. The step width, which is a constant, determines how far a node moves in a single step. When the energy of the system is minimised, the nodes stop moving and the system reaches its equilibrium state (Github). In this context, energy is described as the motion or inertia of a force-directed algorithm, such as Fruchterman–Reingold [42].

3.3.1. Stakeholder Groups are Involved in the Technology Selection

The information to identify their role was collected from the first question in the survey: “Are you working professionally in one of the following company or organisation types?”. Responses from all stakeholder groups were aggregated to ensure a comprehensive understanding of the situation.
In order to identify who were the main stakeholders involved in the decision, the survey respondents were asked: “Who were the most important actors with whom you were in contact for the EE technology selection?”. The selected stakeholders were collected in a complete list of nodes, including egos and alteri. Each node was then weighted based on its level of power in the decision.

3.3.2. Level of Power in the Decisions

The level of power of each agent in the decision was appraised based on an interpretation of the power-interest matrix developed by Johnson et al. [43]. In this matrix, a stakeholder’s power is defined as the ability to influence the project, whereas his/her interest is related to the will to achieve something. Within this study, stakeholders with a high level of interest and influence were considered as powerful (Figure 1), as it was assumed that a high level of influence and interest enabled them to have a strong capability in the technology selection process.
Referring to the actors selected from the previous question (i.e., what stakeholders they had identified as important in the EE technology selection), the information on the level of power was extracted by the survey questions: “What was the level of influence of each actor in the technology selection?” and “What was the level of interest of each actor in the technology selection?”. The answer option was a Likert scale from 0 (None) to 5 (Very high). The weights of the nodes were calculated using a median of the interest for the entire sample, plus the median influence for the entire sample, divided by two, as described in (1). This is calculated for each stakeholder group. The calculated level of power per stakeholder group resulted in the complete list of weighted nodes.
Power :   P i = i n t e r e s t i + i n f l u e n c e i 2

3.3.3. Level of Communication or Interaction between Each Stakeholder in the Decision

According to communication theories, the more often two stakeholders communicate in a particular topic [44], the higher the chance they will influence each other. In this way, in order to identify who were the key stakeholders in the technology selection, the frequency of communication was also analysed, herein referred to as “level of communication”. In the survey, the level of communication between the ego and the alter was then gathered by means of the survey question: “How often were you in contact with each actor in the technology selection?”—again, based on the actors they had selected in the first SNA question. The level of communication among “alteri-alteri” was measured using the question: “How often do you assume the actors communicated with each other for the technology selection?”. In both questions, respondents were provided with a Likert scale from 0 (Never) to 5 (Daily). For all queries, respondents were also granted with the option “I don’t know” and “I had no contact with anyone”.
In a network graph, degree centrality is measured by the total amount of direct links with the other nodes, the fundamental formula CD is Equation (2). To decrease possible size effects, we normalised the degree centrality with the Equation (3), where x i j   means the number of links directly connected with node N, and n means the total number of the nodes in the focal network.
Degree :   C D N i = j = 1 n X i j       i j
Degree :   C D N i = j = 1 n X i j   /   n 1 n 2 ,     i j
Due to the use of the Likert scale in the answer option, the level of communication was calculated by the median of the responses. We calculated the degree for all respondents providing N ego-networks from which we build the union—i.e., all network relations between roles are combined in one graph. Once the list of weighted nodes and edges was created, we plotted the graph with the igraph and ggnet2 in R-Studio libraries [45].

3.3.4. Cross-Country Comparison

The process was repeated for each country, building typology and project type. The statistical representation of the results was ensured based on the survey design, including its sampling and distribution.

4. Results

This section presents the results of applying SNA to the survey datasets across the selected countries. It is divided into two main sections: (I) the country-specific networks, and (II) a cross-country comparison of the results to evaluate how these vary across each region.

4.1. Stakeholder Network per Country

The resulting networks from the application of the SNA are displayed below. The numerical output of the SNA can be found in Appendix B.
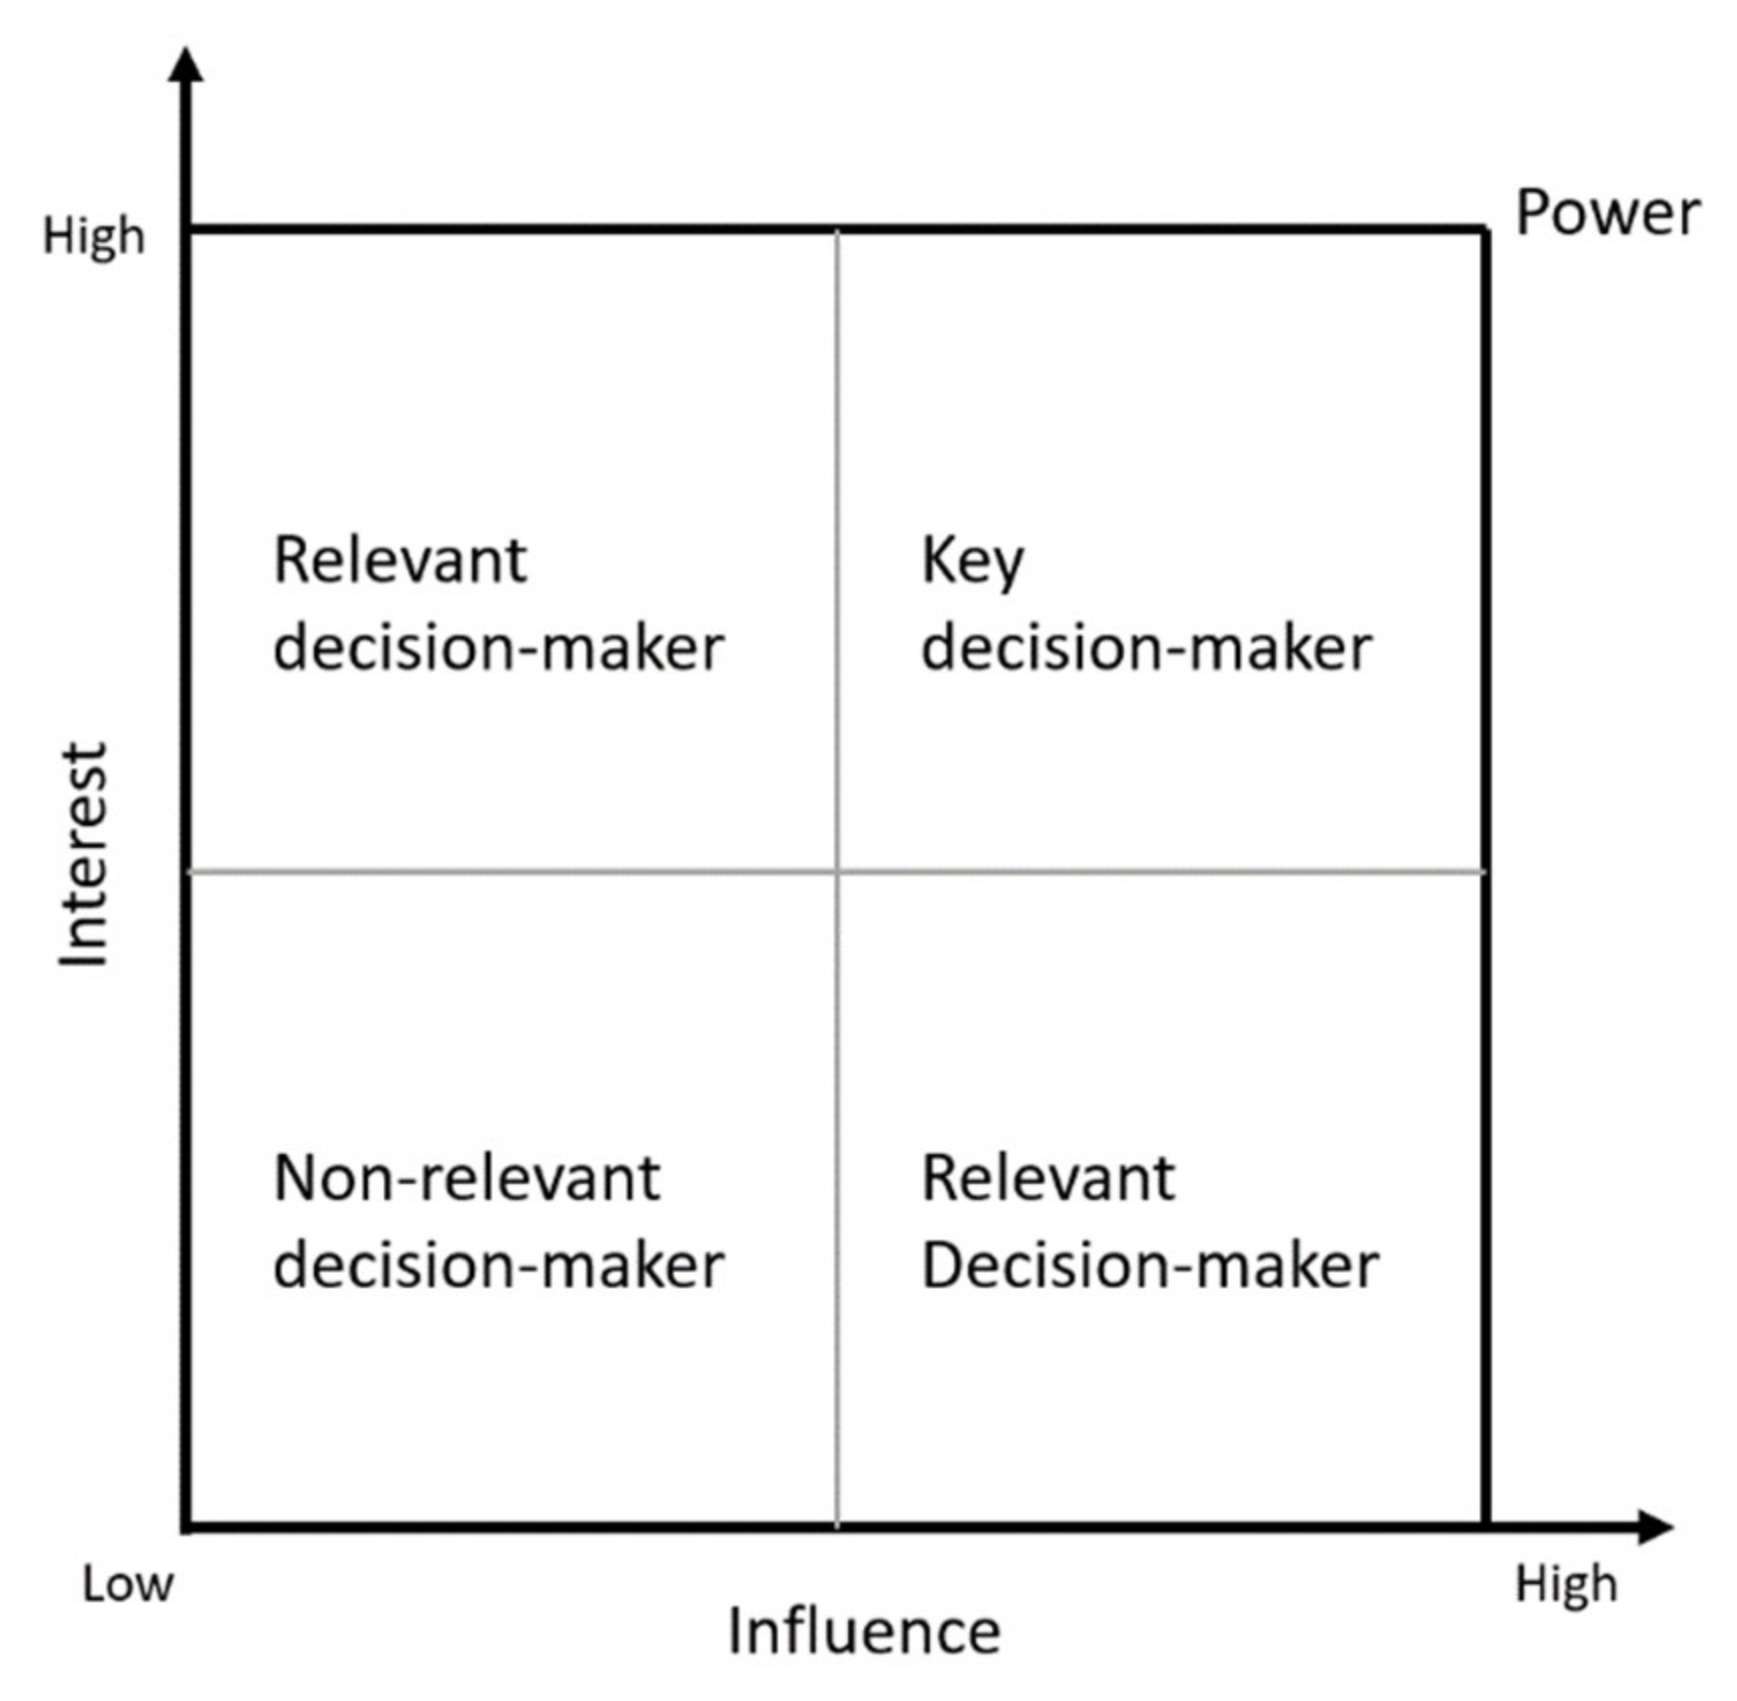
The figures should be read in the following way: the circles or nodes represent the different stakeholder groups; and the size of the circle represents the level of power in the decision (i.e., the bigger the circle, the greater the level of power). As previously mentioned, power in this context is defined by the conjunction of interest and influence. The level of communication among the stakeholders is defined by the different lines or edges. The thickness of the line represents the level of communication, from communicating on a regular basis (“Daily”) to a seldom exchange (“1” on the Likert scale). In the event of no communication at all (“Never”), no line is traced. In addition, the more links or lines within a circle, the stronger its standing point is in the communication. The location in the graphs is defined by the Fruchterman–Reingold algorithm, as described in the method section.
The final responses are listed in the tables below, indicating the median value of the level of importance of each stakeholder group in the decision leading to the selection of the technology. For both the level of power (size of the circles) and the level of communication, the median value in the total responses was categorised into six main groups:
  • No power or communication (0 in the Likert scale)
  • Very low level of power or communication (1 in the Likert scale)
  • Low level of power or communication (2 in the Likert scale)
  • Medium level of power or communication (3 in the Likert scale)
  • High level of power or communication (4 in the Likert scale)
  • Very high level of power or communication (5 in the Likert scale)
The legend for the stakeholder group reference in the network is provided in Table 3 below.

4.1.1. Italy

For retrofit projects in single-dwelling buildings (SDBs), the most powerful actors in the technology selection are the demand-side actors and the engineers (Table 4). The stakeholders with the highest level of communication (in terms of number and intensity) are also demand-side actors, this time with architects, engineers and the construction company. Material or technology traders, banks/other financial service companies and consultants have the lowest level of communication with other stakeholders, along with facility managers (administrative), who only communicate with the demand-side actors. For multi-dwelling buildings (MDBs), the results show a rare case in which the level of power is the same for all stakeholders, all of whom having a strong influence in the decision. In terms of communication, demand-side actors, engineers and construction companies have the highest level.
For comprehensive retrofit projects in SDBs, demand-side actors and banks and other financial service companies are perceived to have the highest level of power. In terms of information exchange, demand-side actors, installers, architects and construction companies have the strongest and highest number of exchanges. The energy suppliers, on the other hand, only communicate with the demand-side actors. For MDBs, demand-side actors and construction companies have the strongest power in the decision-making process (with 5). The remaining stakeholders all share the same level of power (with 4). In terms of the communication, demand-side actors and installers have the highest level. The remaining stakeholders also have a high level of power (all with 5). The stakeholder with the lowest level of communication is the public authority, which only communicates with the construction company.
For new construction projects in SDBs, the demand-side actors and the architects have the highest level of control in the technology selection process (both with 6). These are followed by the engineers, the installers, the facility managers (both technical and administrative) and the consultants. In terms of communications and exchange, the demand-side actors again have the highest number and frequency, exchanging with 11 stakeholders. Construction companies are the other most communicative actor in this process, with 10 linkages to other agents. On the other hand, for MDBs, demand-side actors and facility managers (administrative) have the highest level of power (with 5), followed by the remaining stakeholders (with 4). Construction companies have the highest level of communication (10 links), followed by the demand-side actors (9 links).
In Italy, the demand-side actors are considered to be particularly important stakeholders, as they have a leading position in terms of both power and communication in nearly all building and project types. In addition, more stakeholders and streams of communication are involved in new constructions than in retrofit projects.

4.1.2. Spain

In the case of retrofit projects in SDBs, the most powerful actors in the technology selection are the demand-side actors, the engineers and the technology or material suppliers (all with 6) (Table 5). In terms of level of communication, it is again the demand-side actors who have the highest number and frequency of connections (10), followed by the architects, installers and engineers (with 9 links). For MDBs, demand-side actors have the highest level of power in the process, along with public authorities (both with 6). In terms of communication, demand-side actors again have the highest level, followed by the architects (with 8).
For comprehensive retrofit projects in SDBs, the highest level of power goes to the demand-side actors, the architects, engineers and the consultants (all with 6). In terms of communication, demand-side actors have the highest number of communications, followed by architects and construction companies (8 links). For MDBs, as with SDBs, the engineers, architects and the demand-side actors have the highest level of power. Energy suppliers and consultants also have quite high importance (with 5). The demand-side actors and the construction companies also have the highest level of communication.
For new constructions in SDBs, the highest level of power is perceived to be held by the demand-side actors, engineers and consultants (all with 6). The stakeholders with highest level of communication in this process are again the demand-side actors (11 links), and the architects (10). In terms of MDBs, the highest level of power is assigned to demand-side actors, architects and engineers (all with 6). In terms of communication, demand-side actors have the largest and most frequent number of exchanges with other stakeholders (10 links), followed by the architects and the construction companies (both with 8 links).
Therefore, the general picture in Spain is that demand-side actors, architects and engineers are the most powerful stakeholders in the technology selection. There are also more streams of communication in new constructions than in retrofit projects.

4.1.3. Germany

For retrofit projects in SDBs in Germany, many stakeholders have a high level of power in the technology selection (Table 6). The most powerful actors in the technology selection are the demand-side actors and public authorities (both with 5.5), followed by the engineers, energy suppliers or utilities, consultants, construction companies and banks (with 5). The stakeholders with the highest level of communication (in terms of number and intensity) are also the demand-side actors, together with the installers (both 13). Public authorities and architects also have a high number of interactions with other stakeholders (12 and 11 links, respectively). For MDBs, the highest level of power is shared between demand-side actors and (technical) facility managers (both with 6). Consultants and administrative facility managers are also quite relevant (both 5). In terms of information exchange, it is the demand-side actors that have the highest number of interactions with other stakeholders (12 links). Consultants and installers also have interactions with many other stakeholders (11 links).
For comprehensive retrofit projects in SDBs, demand-side actors and energy suppliers have the highest level of power (both with 6). They are closely followed by the engineers (5.5). In terms of communications, the strongest agent in terms of number and level of communication are the demand-side actors (13 links). Architects, engineers, installers and technology or material providers also have a high number of communications (12 links). On the other hand, for MDBs, the highest level of power is assigned to demand-side actors and consultants (6). These are followed by the engineers and the construction companies (both with 5.5). In terms of level of communication, the highest level goes to demand-side actors and architects (11 links), followed by the engineers and the installers (both with 9).
For new construction projects in SDBs, demand-side actors and installers (both with 6) have the highest level of control in the technology selection process. Then come the engineers, the consultants and the energy suppliers (all with 5). In terms of communications and exchange, the demand-side actors again have the highest number and frequency, exchanging with 13 stakeholders. Architects are the other most communicative actors in this process (with 11 linkages to other agents). For MDBs, demand-side actors and material and technology traders have the highest level of power (with 6), followed by the architects and energy suppliers (with 5). With the highest level of communication for MDBs, it is the architects (with 12) and the engineers and the demand-side actors (both 11 links).
Overall in Germany, the level of power is concentrated in a few groups—particularly demand-side actors, architects, engineers, installers and construction companies. In all cases (i.e., retrofit projects and new constructions), the stakeholder network is particularly strong in terms of communication and number of stakeholders involved.

4.1.4. Poland

For retrofit projects and SDBs in Poland (Table 7), most of the stakeholders have a high level of power in the technology selection. As with Germany, the most powerful actors in this case are the demand-side actors and the public authorities (both with 6). In terms of level of communication, it is again the demand-side actors, material or technology providers and installers who are the stakeholders with the highest number and frequency of connections (12 links), followed by the architects and the engineers (11 links). For MDBs, demand-side actors have the highest level of power in the process, along with architects and engineers (all with 6). In terms of communication, demand-side actors again have the highest level, followed by the architects and installers (11 links).
For comprehensive retrofit projects and SDBs, the highest level of power goes to the demand-side actors and the installers (with 6). In terms of communication, demand-side actors and architects have the highest number of communications (13), followed by the technology providers (12 links). For MDBs, on the other hand, the consultants and the demand-side actors have the highest level of power in the selection (6), closely followed by the construction companies and the engineers (with 5.5). With the highest level of communication are the demand-side actors and architects (11).
For new constructions and SDBs, many stakeholders share the highest level of power in the decision: the demand-side actors, the consultants, the installers, the facility managers and business associations (all with 5). The stakeholders with the highest level of communication in this process are again the demand-side actors and the installers (13 links). In terms of MDBs, the highest level of power is assigned to demand-side actors (6), followed by the consultants, the facility managers (technical) and construction companies (all with 5.5). In terms of communication, demand-side actors and the engineers have the largest and most frequent number of exchanges with other stakeholders (13 links), followed by the architects, installers and consultants (12 links).
In Poland, the stakeholder with most importance in the technology selection, both in power and communication, is again the demand-side actors. In addition, worth mentioning in relation to the level of power are the consultants and installers, as are the architects and installers in relation to the communications. As with Germany—both in retrofit projects and new constructions—the stakeholder network is particularly strong in terms of communication and number of stakeholders involved.

4.1.5. France

For retrofit projects in SDBs in France, there are many relevant stakeholders in the technology selection (Table 8). The actors perceived to be most powerful are the demand-side actors (with 6), followed by the engineers, the consultants, the installers and the energy suppliers (all with 5). In terms of level of communication, there are many strong interactions (more than in other countries), and it is again the demand-side actors, the engineers, energy suppliers and the architects who are perceived as having the highest number and frequency of connections (13), along with the construction companies, installers, etc. (12). For MDBs, demand-side actors have the highest level of power in the process, along with architects and consultants (all with 6). In terms of communication, it is again demand-side actors, along with the architects, installers and construction companies, that have the highest level. It is noteworthy that the number of streams of communications between stakeholders is much higher in SDBs than in MDBs.
For comprehensive retrofit projects and SDBs, the highest level of power goes to the demand-side actors (6), followed by the engineers (5.5). In terms of communication, demand-side actors and installers have the highest number of communications (13 links), followed by the consultants and construction companies (12 links). For MDBs, on the other hand, the consultants, the banks and the business associations, along with the demand-side actors, have the highest level of power (6), closely followed by the construction companies (5.5). The demand-side actors also have the highest level of communication (13), closely followed by the construction companies (12). Business associations are only connected to the demand-side actors and facility managers (technical). As in the case of retrofit projects, the number of links between stakeholders in the decision is higher than in MDBs.
For new construction projects in SDBs, the highest level of power is perceived to be held by the demand-side actors, engineers, architects and consultants (all with 6). The stakeholders with the highest level of communication in this process are again the demand-side actors (13 links), the engineers and construction companies (12) and the architects (11). In terms of MDBs, the highest level of power is assigned to demand-side actors (5.5) and the installers (5). In terms of communication, the architects have the largest and most frequent number of exchanges with other stakeholders (12 links), followed by the demand-side actors (11 links).
Therefore, the general picture in France is that there are many stronger interactions than in other countries. The demand-side actors, architects and engineers are crucial in this process. The case with the highest number of stakeholders involved, as well as strong streams of communication, is retrofit projects in SDBs.

4.1.6. Belgium

When looking at retrofit or partial retrofit projects in Belgium, the stakeholder setup varies between SDBs and MDBs (Table 9). For SDBs, the most powerful influencers in the technology selection are the demand-side actors, the facility managers (administrative) and the construction companies. For MDBs, on the other hand, the most influential actors are the demand-side actors, the engineers and the construction companies. When it comes to the level of communication, more streams of communication are taking place in SDBs—namely the demand-side actors (with 13), consultants, installers and public authorities (all 11) with a high level of communication among them. In MDBs, it is the engineers who have the highest number of links, with a high level of communication in each case.
For comprehensive retrofit projects, the stakeholder setup in the technology selection also varies between SDBs and MDBs. For SDBs, the key persuaders are the demand-side actors, the material or technology traders, the architects, the construction companies, the facility managers (administrative) and the engineers, whereas for MDBs it is mostly the installers and the demand-side actors. In terms of communication, it is the architects and construction companies that have the highest number of communication streams in SDBs, with a high level of communication. In MDBs, it is again the installers and the demand-side actors that have a key role in the exchange with other stakeholders.
For new constructions in SDBs, the stakeholders with the highest level of power are the demand-side actors and facility managers (both with 6), as well as the engineers (with 5). In terms of communication, it is a rare case in which the demand-side actors are not the ones with the highest number of interactions. In new constructions and SDBs in Belgium, it is the architects (11 links) and the installers that are the stakeholders with the highest level of communication. They are followed by demand-side actors, engineers and construction companies (all with 6 links). For MDBs, on the other hand, it is demand-side actors and engineers that have the strongest power, closely followed by facility managers (administrative). In terms of the information exchange, it is the demand-side actors and installers who have the highest and strongest exchanges. It is noteworthy how more and stronger interactions take place in this case than in the other cases in Belgium.
Similar to other countries, the demand side is again well represented in terms of power and communication. In addition, of importance in Belgium are the facility managers (administrative), construction companies and engineers (level of power), as well as the architects (level of communication). In retrofit projects and MDBs (both retrofits and comprehensive retrofits), the network of stakeholders is much less dense than in the other cases (i.e., less stakeholders involved and less level of communication among them).

4.1.7. The United Kingdom

For retrofit or partial retrofit projects in the United Kingdom (Table 10), the stakeholder network varies between SDBs and MDBs. For SDBs, the most powerful influencers in the technology selection are the demand-side actors, the business associations or agencies and the technology or material traders. For MDBs, on the other hand, the most influential actors are the demand-side actors, the construction companies and the engineers. When it comes to communication, for SDBs as well as for MDBs the main course of communication seems to go through the demand-side actors (13 for SDBs, and 12 for MDBs).
For comprehensive retrofit projects, the stakeholder setup in the technology selection also varies between SDBs and MDBs. For SDBs, the key persuaders are the demand-side actors and the consultants. This contrasts with MDBs, where many groups are deemed to be powerful: the demand-side actors, technology suppliers, facility managers (technical and administrative), consultants and the public authorities (all with 6). In terms of communication for SDBs, the demand-side actors (with 11) have the highest number of streams with high level of communication, followed by the architects, installers and banks (all with 10). For MDBs, it is the demand-side actors, the construction companies and the engineers that have a key role in the exchange with other stakeholders.
For new constructions and SDBs, the stakeholders with the highest level of power are the demand-side actors, followed by the construction companies and the architects. In terms of communication, it is again the demand-side actors and the construction companies that show a key connection to other stakeholders involved in the decision-making process. On the other hand, for new constructions and MDBs, demand-side actors have the strongest power, closely followed by facility managers (administrative). When it comes to the information exchange, demand-side actors and architects are the strongest.
In the UK, the demand side actors are key in the information exchange, whereas in terms of power there are other key stakeholders involved, e.g., the material and technology traders or the consultants. When comparing results across the various cases, retrofit projects in MDBs and comprehensive retrofits in SDBs have the highest number of stakeholders involved and the least level of communication.

4.1.8. The Netherlands

For retrofit projects and SDBs in the Netherlands (Table 11), the actors perceived to be most powerful are the demand-side actors and the facility managers (technical) (with 6). In terms of the level of communication, it is the demand-side actors (12), the architects, the consultants and the construction companies that have the highest number and frequency of connections (10), along with the business associations (11). For MDBs, many stakeholders are perceived to have a high level of power, with demand-side actors being identified as having the strongest influence in the technology choice, along with the architects, the installers and the bank authorities (all with 6). In terms of communication, it is again the demand-side actors that have the highest level (11 links), followed by the construction companies and the public authorities (both with 10 links).
For comprehensive retrofits and SDBs, the highest level of power goes to the demand-side actors (6), followed by the installers and the architects (5). In terms of communication, demand-side actors have the highest number of communications (11 links), along with construction companies (10 links). As is the case for retrofit projects, for comprehensive retrofit projects in MDBs, many stakeholders are present with a high level of power in the decision, with the architects dominating, along with the demand-side actors. As for the level of communication, demand-side actors have the strongest presence (13), along with architects (12) and public authorities (11).
For new constructions and SDBs, there are many stakeholders with a high level of power and high level of communication. The most powerful actors are perceived to be the demand-side actors, installers and architects (all with 6). The stakeholders with the highest level of communication in this process are again the demand-side actors (13 links), followed by the construction companies and the installers (12 links). In terms of MDBs, the highest level of power is assigned to demand-side actors, the construction companies and the architects (all with 5.5). In terms of communication, the demand-side actors again have the largest and most frequent number of exchanges with other stakeholders, along with the public authorities and technology and material traders (11 links).
Therefore, the general picture in the Netherlands is that there are many strong interactions, with demand-side actors, architects and engineers being crucial in this process. In contrast to the UK, when comparing results across the various cases, retrofit projects in MDBs and comprehensive retrofits in SDBs have the lowest number of stakeholders involved, with the least intense channels of communication.

4.2. Cross-Country Comparison

In order to compare the results across countries, we created a heat map representing the 3 stakeholders having the highest numbers of power and level of communication in each case (i.e., conjunction of project types and building typologies).

4.2.1. Level of Power

Overall, across countries and building projects, the highest power in the technology selection decision goes to the demand-side actors (40/42 cases), the engineers (16/42), the architects (15/42) and the installers (13/42) (Table 12). The only cases in which the demand-side actors are not the most powerful are in comprehensive retrofit projects in SDBs in Poland, where construction companies have a higher level of power than the demand-side actors. In general, the actors involved, and their level of power are closer across building typologies than across building types.

4.2.2. Level of Communication

Results across the 8 countries and 6 cases (Table 13) show that demand-side actors have the highest number and strongest connections with other stakeholders (37/42), with the only exceptions being retrofit projects in Belgium, or the construction companies in new constructions for MDBs in France. The second most interconnected actors are the architects, who are identified with the highest number of connections in 24 of the 42 cases. These are followed by the engineers (14/42), the installers (15/42) and the construction companies (14/42).
When cross-referencing the results from the level of power and communication across the 8 countries, it can be seen that, in most cases, demand-side actors are the key decision-makers. However, they are not the sole agents involved in the technology selection process. Many more stakeholders are present and interconnected, with some of them (e.g., architects, engineers and installers) holding the same (or, in some cases, even more) level of power and communication as the demand-side actors in this action. Another insight gained from the analysis is the fact that the level of power and communication across countries is closer between building typologies than between project types. It is also noteworthy that, in general, installers have a higher level of power than the construction companies in the decision-making process. In addition, architects have the highest streams of communication with other actors. Despite this, architects are perceived to have a lower level of power in the decision than engineers. Finally, across all countries, the heterogeneity of the results is higher for the level of power than for the level of communication.

5. Discussions and Conclusions

By applying SNA to the results of a multi-country survey, this study maps the complete group of stakeholders involved in the technology selection process, as well as their level of power and interaction in this process, across various project types, building typologies and EU countries. In this way, it addresses the knowledge gap concerning cross-country comparable identification of the complete stakeholder system, including key persuaders in the technology choice.

5.1. The Stakeholder Network in the Technology Selection: Decision-Makers and Key Persuaders

Results from this study show that the stakeholder network and the individual level of power and communication vary across the different cases and countries. Nonetheless, in all instances, there are multiple stakeholders communicating, thereby potentially influencing each other in the development. The demand-side actors (i.e., adopters) are identified as having the highest power in the decisions, often followed by the engineers, the architects and the installers. The stakeholder networks show the heterogeneity in the stakeholder setup across the sampled countries, and also demonstrate that, in the technology selection process, there is not just one stakeholder involved, but rather a cohort of actors with distinct levels of power and interaction with each other. Therefore, technology adopters—in most cases the most powerful ones—should not be understood as being the sole decision-makers in the technology selection process. In fact, many other stakeholders are involved and interconnected in these decisions, some of which (e.g., architects, engineers and installers) can have the same or even more power and communication than the demand-side actors. Therefore, even in the cases in which demand-side actors have the highest influence in the decision, this is in strong communication with other stakeholders who can inform, and therefore affect, their decision.
Accordingly, findings suggest that, to favour the promotion of energy-saving technologies, it is necessary to encourage a more integrated relationship between stakeholders in the process. This conclusion coincides with the results from other works in the field, such as [13,14].

5.2. Method Limitations

This paper presents a novel approach to the quantification of stakeholders’ levels of interest, influence and communication in technology adoption for residential building projects in the EU. The stratified sample used in the survey design enabled us to address all of these multiple variables (i.e., countries, project types, building typologies and stakeholders) within a single survey. Likewise, the SNA proved to be a valuable instrument in the calculation of all of the resulting parameters in just 2 dimensions (i.e., nodes and edges). It also offered a visual representation of the results, which, along with a numerical output, was essential to better comprehend the complexity of the network as one whole system.
Nonetheless, the methodology has a set of limitations that need to be taken into consideration: the results presented in this study are based on a survey sample and are therefore subject to personal judgement. This adds a subjective component that should be considered during the analysis and interpretation of the results. To minimise the effect of this issue, two main measures were implemented in the research design: (1) during the data collection, the interviewees were asked to respond to the questions based on their experience in their latest project (not based on a hypothetical case), and (2) the analysis of the results was performed in parallel with market experts’ discussions for each country in order to be able to validate and contextualise the results.
An additional factor of uncertainty that should be considered in this study is diversity across building projects. This means that the results might not be applicable to each and every building project. They do, however, reflect the heterogeneity across them.
Additionally, further comparisons across studies carried out at different points in time may not be warranted, since the technological, social, cultural, economic and policy environments evolve over time.

5.3. Contribution to Technology Diffusion Theoretical Framework

The findings also contribute to the interpretation of R. Rogers’ theoretical framework in the EU residential sector. In his universal model “Five Stages in the Innovation-Decision Process”, Rogers assumes that the “Decision-Making Unit” is only applied to the potential technology adopter [15]. However, with the results from this paper, we demonstrate that, in the EU residential sector, non-adopters are still part of the institutional context in which those decisions are framed. Furthermore, some of these stakeholders are also key contributors to the knowledge and persuasion phase leading to the final decision (i.e., adoption or rejection of the technology). This expands the scope of the “Five Stages in the Innovation-Decision Process” model to address not only the potential adopter of the technology but any stakeholder with whom they are in communication and that has the capacity or power to affect or determine their final choice (i.e., key persuader). Even though the role of the key persuader in the project might vary depending on the context, this should still be taken into consideration when trying to comprehend the complete decision-making framework in which the technology is selected.

6. Outlook

Future research should focus on an in-depth analysis of differences across energy-efficient technologies. In addition, many stakeholder groups are grouped together under the demand-side actors (e.g., private owners, public and/or private associations). Further investigations will be needed that break down the demand-side actors into their sub-groups in order to map the differences among the networks. Likewise, extending the findings of this study to other EU countries and non-residential buildings is also necessary in order to provide a comprehensive pan-European overview.
A potential application of this study is to support the development of evidence-based policy instruments (national and pan-EU). In particular, these findings could support the identification of key persuaders in the adoption process to accelerate large-scale diffusion of energy-efficient technologies. Furthermore, it could encourage other scientific works in the field to include multiple perspectives in the decision-process analysis, rather than mostly targeting the demand-side actors.

Author Contributions

The corresponding author of this paper is responsible for initiating this paper, planning and conducting the research design and performing the analysis. The analysis and writing of the paper were done in close collaboration with the co-authors. All authors have read and agreed to the published version of the manuscript.

Funding

This work has been financed by Climate-KIC, with the support of the EIT—a body of the European Union TC_2.7.8_190515_P183-1B.

Acknowledgments

The authors would like to thank Stefan Forsaeus (Head of the Building Technologies Division) and Holger Wallbaum (Head of the Sustainable Building Research Group) at Chalmers University of Technology.

Conflicts of Interest

The authors declare no conflict of interest.

Appendix A. Survey Methodology

Quota

Due to the stratified approach, there is no maximum number of responses stipulated, but rather a minimum quota for different strata and sub-strata. This minimum number has been defined based on the estimate of some of the sample size calculation approaches defined by (Czaja et al.), and it has been defined for the three axes of stratification (i.e., stakeholder group, building typology and project type). One stratification axis is controlled ex-ante (stakeholder group) and two are controlled for during the survey or ex-post (building typology and project type).
The breakdown of the minimum number of responses per project type, building typology and stakeholder group required in the survey for each country are displayed in the table below.
Table A1. Minimum quotas per stratum defined in the survey.
Project TypeSub-TotalTotal
New BuildComprehensive Retrofit (Three Elements or More)All Other Measures (Maintenance, Refurbishment)
Stakeholder groupIncluding the following sub-groupsSFH *MDH **SFHMDHSFHMDHSFHMDH
1. Conceiving, planning and consulting servicesArchitects and engineers999999272754
2.Material and technology supplyMaterial or technology manufacturers or retailers999999272754
3.Construction and installationConstruction companies and installers101010101010303060
4. Enabling servicesLocal authorities, banks and other financial services999999272754
5.Operation and maintenance servicesEnergy supply/utilities and Energy service companies (ESCO), facility managers (commercial, administrative, technical, maintenance, etc.)101010101010303060
6.Institutional demand sideInvestors, developers, housing companies for profit, public/part-governmental/non-profit151515151515154560
7. Private demand sidePrivate house owners, flat-renters or self-owners2626262626267878156
Total888888888888234264498
* SDB: single-dwelling building, ** MDB: multi-dwelling building.

Survey Intelligence

The building value chain is complex and dynamic (i.e., multiple building typologies, project types, stakeholder groups involved, timings, etc.). To characterise the uptake of energy efficiency technologies and to encompass this complexity (while attaining the high number of responses that were needed), the survey questionnaire ought to be dynamic and adaptive. This need for dynamism and adaptability requires back-end programming, hereafter referred to as ‘survey intelligence’. The survey intelligence therefore refers to the latent architecture designed and coded within the survey. Its objective was two-fold:
To control the questionnaire so it can adapt to every stakeholder profile within the value chain (i.e., questionnaire profiling).
To ensure that the minimum quota is met (i.e., minimum quota).
The design and implementation of the survey intelligence and how it effectively works in practice are explained hereafter.

I. Questionnaire Profiling

Given the high number of stakeholder groups this study encompasses, as well as the distinct perspectives and level of knowledge in the topics addressed, the questionnaire needed to be programmed to dynamically adapt to each angle. This is referred to as ‘questionnaire profiling’ and it has been implemented on two levels. The first level refers to an overall questionnaire architecture, adapting it according to the stakeholder group and concrete response selected—for instance, technology providers do not necessarily have practical experience in building projects and might, therefore, need to skip any project-related questions. The second type of questionnaire profiling was on a more detailed level, related to the formulation of the specific questions—for example, once the respondent had identified their country or type of project and building typology, the upcoming questions were coded so that they referred to this information and the respondent could relate to the question better. Another example of this featured in questions B046-57 (see “Questionnaire” section below), to identify the exact alias they had chosen for the different stakeholder groups. This has been marked in orange in the text.

II. Minimum Quota

There are several ways in which the questionnaire controls the quotient. One of these is the quotient stop: if there are enough questionnaires for a certain stratum, further participants of this group are requested to answer the survey for another stratum (e.g., comprehensive retrofit projects instead of new-builds, large houses instead of small houses, etc.). Another way is to ask for a specific project type and building typology (i.e., bucket) when the current numbers are insufficient, and the quota of the other buckets has already been satisfied.
In order to enable a proper functioning of the survey intelligence for both the questionnaire profiling and minimum quota to ensure the validity and reliability of the results, the survey intelligence was evaluated and pre-tested.

Distribution

An aligned and accurate execution of the survey distribution was crucial to ensure the coherence of results on a national level as well as across countries. Due to the high number of markets addressed in this study (n=8), the distribution of the survey was entrusted to research institutes in the respective country, hereafter referred to as “local partners”. To this end, detailed distribution instructions were developed. The progress of the dissemination was scrupulously guided and monitored by the corresponding author of this paper to ensure its rigorous implementation.

Questionnaire

Based on the study of the literature, discussions with market experts and input from stakeholder group representatives across the whole value chain, a questionnaire was developed. The final questionnaire was divided into five parts according to the topic that was addressed. The first part of the survey concerns the characterisation of the stakeholder profile (Part I). The respondents were asked to identify what had been their latest project. Once they had done this, they were asked to select their building typology and type of project (Part II). The behavioural factors determining adoption decisions were measured in two ways: firstly, the respondents were asked to assess the perceived influence, interest and level of communication with actors involved in the decision concerning the selection of the technology (Part III). Afterwards, they were asked about their level of familiarity with different building technologies. Based on their answers, they were asked to identify the main drivers and barriers in relation to that technology (Part IV). Finally, they were asked questions about contextual factors, such as buildings and socio-demographic characteristics (Part V).
The complete questionnaire can be accessed via the link: https://chalmersuniversity.box.com/v/SurveyQuestionnaire.

Appendix B. SNA Numerical Output

The results can be read like this:
Table A2. Legend to read the numerical outputs of the networks.
Level of CommunicationLikert ScaleNumerical Interpretation
No power0 (None)X = 1
Very low10< X ≥ 2
Low22 < X ≥ 3
Medium33< X ≥ 4
High44 < X ≥ 5
Very high5 (Very High)5 < X ≥ 6

IT

Table A3. Numerical output stakeholder networks classified according to building typologies and project types in Italy (IT).
Retrofit ProjectsNew Constructions
RetrofitComprehensive Retrofit
SDBsMDBsSDBsMDBsSDBsMDBs
NodesPowerDegreeNodesPowerDegreeNodesPowerDegreeNodesPowerDegreeNodesPowerDegreeNodesPowerDegree
D68D57D612D57D611D59
227357559655268248
62665725844364106410
3685564455473591045
124254346245559147
52575464.5734473.551146
42316521647411057347
72415310431643458547
941952164314314.581643
1653456952 1644742
8231053756 953953
11511152 113.54447
843

ES

Table A4. Numerical output stakeholder networks classified according to building typologies and project types in Spain (ES).
Retrofit ProjectsNew Constructions
RetrofitComprehensive Retrofit
SDBsMDBsSDBsMDBsSDBsMDBs
NodesPowerDegreeNodesPowerDegreeNodesPowerDegreeNodesPowerDegreeNodesPowerDegreeNodesPowerDegree
D610D610D69D610D611D610
25921.5854.573662410658
51943326850.17649547
657657658659114.5613.57
369315755267123268
166104312410.15516366
84676446481536783.57
114.5451436670.1371643.52
45.5680.1382545481293.52
73490.129419414651144
186110.11114311521644103.53
1612 160.111853
1211
1012

DE

Table A5. Numerical output stakeholder networks classified according to building typologies and project types in Germany (DE).
Retrofit ProjectsNew Constructions
RetrofitComprehensive Retrofit
SDBsMDBsSDBsMDBsSDBsMDBs
NodesPowerDegreeNodesPowerDegreeNodesPowerDegreeNodesPowerDegreeNodesPowerDegreeNodesPowerDegree
D5.513D612D613D611D613D611
551331935.51246664.592512
14.510648541235.59569649
2411219162.542511160.16169
11595311649748358539
33974825125592411447
75.51245111512113414.563411
161514873765.581244848
4510952116893870.1470.16
659106682.571054456120.12
857161744111468431158
104.55112794.571635115693.56
124584810598339411036
944 122.55 1034

PL

Table A6. Numerical output stakeholder networks classified according to building typologies and project types in Poland (PL).
Retrofit ProjectsNew Constructions
RetrofitComprehensive Retrofit
SDBsMDBsSDBsMDBsSDBsMDBs
NodesPowerDegreeNodesPowerDegreeNodesPowerDegreeNodesPowerDegreeNodesPowerDegreeNodesPowerDegree
D612D613D613D611D513D613
151245107584661492512
55123611561135.5945115512
351195101512251164.5965.58
4510131094974824.51080.17
2411261245115595513939
765114.5101655113434.59159
16491059241365.5874645.512
84782834.599388171656
6586410105510541148746
11585512113.5101469573513
1059123365916351045111.57
95673883.538331652105.58
16241244 12531234

FR

Table A7. Numerical output stakeholder networks classified according to building typologies and project types in France (FR).
Retrofit ProjectsNew Constructions
RetrofitComprehensive Retrofit
SDBsMDBsSDBsMDBsSDBsMDBs
NodesPowerDegreeNodesPowerDegreeNodesPowerDegreeNodesPowerDegreeNodesPowerDegreeNodesPowerDegree
D613D612D613D613D613D5.511
241335.5835.5735102611349
164112612441216473612558
104.58551223.511251014.5724.512
6412641284.59749164.561613
4512165.5712986954.510748
351374955134610739135
5512466102665.5121138916
141214.596412104.59937438
941284107411126212441146
11513110716465596412649
8411106511512113746101047
74.510123594.5510.198310814
123890412489381057

BE

Table A8. Numerical output stakeholder networks classified according to building typologies and project types in Belgium (BE).
Retrofit ProjectsNew Constructions
RetrofitComprehensive Retrofit
SDBsMDBsSDBsMDBsSDBsMDBs
NodesPowerDegreeNodesPowerDegreeNodesPowerDegreeNodesPowerDegreeNodesPowerDegreeNodesPowerDegree
D513D510D510D5.59D69D513
241065942.564273593510
541124111510102424112412
34894.56104724864.598311
721172625136594574212
9553593581377365413
83104476512347541072.511
1232847541055.5910346412
104913816219261371246
43115261223734113613.512
1137124395484484.5610311
13911221136 96494.58
657 826 11310
724 1623

NL

Table A9. Numerical output stakeholder networks classified according to building typologies and project types in the Netherlands (NL).
Retrofit ProjectsNew Constructions
RetrofitComprehensive Retrofit
SDBsMDBsSDBsMDBsSDBsMDBs
NodesPowerDegreeNodesPowerDegreeNodesPowerDegreeNodesPowerDegreeNodesPowerDegreeNodesPowerDegree
D612D611D611D613D613D5.511
1595693446593511458
65102695510751165121511
106464.5106489287581026
94414716441247125765.59
84916141461157104.5107411
559866114883984113510
241074.51084.56329115854.59
74111013255261242825.59
3381113942103.569451256
44.5104477471510261190.16
114.581254124.55457561280.17
1624943 5510158110.13
356 16641664

UK

Table A10. Numerical output stakeholder networks classified according to building typologies and project types in the United Kingdom (UK).
Retrofit ProjectsNew Constructions
RetrofitComprehensive Retrofit
SDBsMDBsSDBsMDBsSDBsMDBs
NodesPowerDegreeNodesPowerDegreeNodesPowerDegreeNodesPowerDegreeNodesPowerDegreeNodesPowerDegree
D613D612D5.511D612D611D612
4592511251035102577511
551084965916484795.56
9249481575591481257
1141166113589664464511
759741145.5665115463510
3510541154.51025.5711446510
25101158841046665.5102512
65111510115612441233148
126335.5916451157356858
1614451072676490.12558
168124.510104684416261145
10551634 106270.121056
825

References

  1. Buildings—European Commission. Available online: https://ec.europa.eu/energy/en/topics/energy-efficiency/buildings (accessed on 28 November 2018).
  2. European Commission. Energy efficiency directive (EED). Available online: https://ec.europa.eu/energy/topics/energy-efficiency/targets-directive-and-rules/energy-efficiency-directive_en (accessed on 1 April 2020).
  3. Audanaert, A.; De Boeck, L.; Roelants, K. Economic analysis of the profitability of energy-saving architectural measures for the achievement of the EPB-standard. Energ. 2010, 35, 2965–2971. [Google Scholar] [CrossRef]
  4. BPIE. Nearly Zero Energy Buildings Definitions Across Europe; BPIE: Brussels, Belgium, 2015. [Google Scholar]
  5. Zangheri, P.; Armani, R.; Pietrobon, M.; Pagliano, L. Identification of cost-optimal and NZEB refurbishment levels for representative climates and building typologies across Europe. Energ. Effic. 2018, 11, 337–369. [Google Scholar] [CrossRef] [Green Version]
  6. Hermelink, A.; Schimschar, S.; Boermans, T.; Pagliano, L.; Zangheri, P.; Armani, R.; Voss, K.; Musall, E. Towards nearly zero-energy buildings Definition of common principles under the EPBD—Final Report. In Proceedings of the 2013 European Council for an Energy Efficient Economy, Brussels, Belgium, February 2013; Volume 17, p. 469. [Google Scholar]
  7. Economidou, M.; Atanasiu, B.; Despret, C.; Maio, J.; Nolte, I.; Rapf, O. Europe’s Buildings under the Microscope; BPIE: Brussels, Belgium, 2011. [Google Scholar]
  8. European Commission, EU Buildings factsheet. Available online: https://ec.europa.eu/energy/eu-buildings-factsheets_en (accessed on 1 April 2020).
  9. Grözinger, J.; Boermans, T.; John, A.; Seehusen, J.; Wehringer, F.; Scherberich, M. Overview of Member States Information on NZEBs. 2014. Available online: www.ecofys.com (accessed on 21 December 2018).
  10. Jakob, M. The Drivers of and Barriers to Energy Efficiency in Renovation Decisions of Single-Family Home-Owners. 2007. Available online: www.cepe.ethz.ch (accessed on 21 December 2018).
  11. Popescu, D.; Bienert, S.; Schützenhofer, C.; Boazu, R. Impact of energy efficiency measures on the economic value of buildings. Appl. Energy 2012, 89, 454–463. [Google Scholar] [CrossRef]
  12. Lucon, O.; Ürge-Vorsatz, D.; Ahmed, A.Z.; Akbari, H.; Bertoldi, P.; Cabeza, L.F.; Eyre, N.; Gadgil, A.; Harvey, L.D.D.; Jiang, Y.; et al. Buildings. In Climate Change 2014: Mitiga-tion of Climate Change. Contribution of Working Group III to the Fifth Assessment Report of the Intergovernmental Panel on Climate Change; Cambridge University Press: Cambridge, UK; New York, NY, USA, 2014; Available online: https://www.ipcc.ch/site/assets/uploads/2018/02/ipcc_wg3_ar5_chapter9.pdf (accessed on 7 August 2018).
  13. Albino, V.; Berardi, U. Green Buildings and Organizational Changes in Italian Case Studies. Bus. Strat. Environ. 2012, 21, 387–400. [Google Scholar] [CrossRef]
  14. Berardi, U. Stakeholders’ influence on the adoption of energy-saving technologies in Italian homes. Energy Policy 2013, 60, 520–530. [Google Scholar] [CrossRef]
  15. Rogers, E.M. Diffusion of Innovations; Simon and Schuster: New York, NY, USA, 2012. [Google Scholar]
  16. Hecher, M.; Hatzl, S.; Knoeri, C.; Posch, A. The Trigger Matters: The Decision-Making Process for Heating Systems in the Residential Building Sector. Energy Policy 2017, 102, 288–306. [Google Scholar] [CrossRef]
  17. Wilson, C.; Dowlatabadi, H. Models of Decision Making and Residential Energy Use. Annu. Rev. Environ. Resour. 2007, 32, 169–203. [Google Scholar] [CrossRef]
  18. Pettifor, H.; Wilson, C.; Chryssochoidis, G. The appeal of the green deal: Empirical evidence for the influence of energy efficiency policy on renovating homeowners. Energy Policy 2015, 79, 161–176. [Google Scholar] [CrossRef] [Green Version]
  19. Banfi, S.; Farsi, M.; Filippini, M.; Jakob, M. Willingness to Pay for Energy—Saving Measures in Residential Buildings. Available online: https://doc.rero.ch/record/6588/files/filippini_EE_2007_2.pdf (accessed on 5 June 2017).
  20. Cooke, R.; Cripps, A.; Irwin, A.; Kolokotroni, M. Alternative energy technologies in buildings: Stakeholder perceptions. Renew. Energy 2007, 32, 2320–2333. [Google Scholar] [CrossRef]
  21. Svenfelt, Å.; Engström, R.; Svane, Ö. Decreasing energy use in buildings by 50% by 2050—A backcasting study using stakeholder groups. Technol. Forecast. Soc. Chang. 2011, 78, 785–796. [Google Scholar] [CrossRef]
  22. Li, Y.; O’Donnell, J.S.; García-Castro, R.; Vega-Sánchez, S. Identifying stakeholders and key performance indicators for district and building energy performance analysis. Energ. Build. 2017, 155, 1–15. [Google Scholar] [CrossRef]
  23. Olander, S.; Landin, A. Evaluation of stakeholder influence in the implementation of construction projects. Int. J. Proj. Manag. 2005, 23, 321–328. [Google Scholar] [CrossRef]
  24. Rai, V.; Henry, A.D. Agent-based modelling of consumer energy choices. Nat. Clim. Chang. 2016, 6, 556–562. [Google Scholar] [CrossRef]
  25. Stephan, K.; Menassa, C.C. Modeling the Effect of Building Stakeholder Interactions on Value Perception of Sustainable Retrofits. J. Comput. Civ. Eng. 2015, 29, B4014006. [Google Scholar] [CrossRef]
  26. Knoeri, C.; Binder, C.R.; Althaus, H.J. Decisions on recycling: Construction stakeholders decisions regarding recycled mineral construction materials. Resour. Conserv. Recycl. 2011, 55, 1039–1050. [Google Scholar] [CrossRef]
  27. Moglia, M.; James, M. An Agent-Based Model of Residential Energy Efficiency Adoption. J. Artif. Soc. Soc. Simul. 2018. [Google Scholar] [CrossRef]
  28. Granovetter, M. Models and Methods in Social Network Analysis; Cambridge University Press: Cambridge, UK, 2005. [Google Scholar]
  29. Rousseau, R. Social Network Analysis: A Powerful Strategy, Also for the Information Sciences. J. Inf. Sci. 2002, 28, 441–453. [Google Scholar]
  30. Barrat, A.; Barthelemy, M.; Pastor-Satorras, R.; Vespignani, A. The architecture of complex weighted networks. Proc. Natl. Acad. Sci. USA 2003, 101, 3747–3752. [Google Scholar] [CrossRef] [Green Version]
  31. Wassrman, S.; Faust, K. Social network analysis; Cambridge University Press: Cambridge, UK, 1994. [Google Scholar] [CrossRef]
  32. Wasserman, S.; Faust, K. Social Network Analysis: Methods and Applications; Cambridge University Press: Cambridge, UK, 1999. [Google Scholar]
  33. Hanneman, R.A.; Riddle, M. Concepts and Measures for Basic Network Analysis. In The SAGE Handbook of Social Network Analysis; SAGE Publications: Thousand Oaks, CA, USA, 2014. [Google Scholar] [CrossRef] [Green Version]
  34. Zheng, X.; Le, Y.; Chan, A.P.; Hu, Y.; Li, Y. Review of the application of social network analysis (SNA) in construction project management research. Int. J. Proj. Manag. 2016, 34, 1214–1225. [Google Scholar] [CrossRef]
  35. Malisiovas, A.; Song, X. Social Network Analysis (SNA) for Construction Projects’ Team Communication Structure Optimization. In Construction Research Congress 2014; American Society of Civil Engineers: Reston, VA, USA, 2014; pp. 2032–2042. [Google Scholar]
  36. Yang, R.; Zou, P. Stakeholder-associated risks and their interactions in complex green building projects: A social network model. Build. Environ. 2014, 73, 208–222. [Google Scholar] [CrossRef]
  37. Bale, C.S.; McCullen, N.; Foxon, T.J.; Rucklidge, A.; Gale, W.F. Harnessing social networks for promoting adoption of energy technologies in the domestic sector. Energy Policy 2013, 63, 833–844. [Google Scholar] [CrossRef] [Green Version]
  38. Pryke, S. Social Network Analysis in Construction; Wiley-Blackwell: Hoboken, NJ, USA, 2012. [Google Scholar]
  39. Blair, J.; Czaja, R.F.; Blair, E.A. Designing Surveys: A Guide to Decisions and Procedures; Sage Publications: Thousand Oaks, CA, USA, 2013. [Google Scholar]
  40. Camarasa, C. On the Uptake of Energy Efficiency Technologies in European Residential Buildings. Ph.D. Thesis, Chalmers Tekniska Hogskola, Göteborg, Sweden, 2019. [Google Scholar]
  41. Freeman, L.C. Centrality in Social Networks Conceptual Clarification. Soc. Netw. 1978, 1, 215–239. [Google Scholar] [CrossRef] [Green Version]
  42. Github. Fruchterman Reingold. Available online: https://github.com/gephi/gephi/wiki/Fruchterman-Reingold (accessed on 18 December 2019).
  43. Johnson, G.; Scholes, K.; Whittington, R. Exploring Corporate Strategy; Pearson: London, UK, 2017; p. 828. [Google Scholar]
  44. Whittington Exploring Corporate Strategy; Griffin, E. A First Look at Communication Theory; McGraw-Hill: New York, NY, USA, 2016. [Google Scholar]
  45. Igraph R Package. Available online: https://igraph.org/r/ (accessed on 29 March 2020).
Figure 1. Parameters identifying relevant decision-makers.
Buildings 10 00070 g001
Table 1. Stakeholder groups and subgroups actively involved in the uptake of energy-efficient (EE) technologies in residential building projects [40].
#Stakeholder Groups and SubgroupsMain Role in the Building Value Chain
1Conceiving, planning and consulting services, including:Planning/design, construction/installation
Architect
Engineer
2Material and technology suppliers, including:Technology and material supply
Technology or material manufacturer or trader
3Construction and installation, including:Construction/installation
Construction Company
Installer
4Enabling services, including:Overarching and enabling services,
economic or business management
Local public authorities (e.g., construction permit authorities)
Bank or other financial services (including local branch offices)
5Operation and maintenance services, including:Use and maintenance, economic or business management
Facility manager (commercial, administrative)
Facility manager (technical, maintenance, etc.)
Energy supply/utility and energy service company (ESCO)
6Institutional demand side, including:Real estate, use and maintenance
Investor or developer
Housing company (for profit)
Housing company or housing association, cooperative (public/part-governmental/non-profit)
7Private demand side, including:Real estate, use and maintenance
Private house owner
(private owner but asset rented out)
Self-occupying private house owner (resident)
Table 2. Building typologies and project types: definitions and acronyms.
ClusterDescription
Building typologiesSingle-dwelling buildings (SDBs), e.g., single-family house or detached house, semi-detached house, twin house or duplex row house or terrace house
Multi-dwelling buildings (MDBs), e.g., small multi-dwelling home or small apartment building, large multi-dwelling home or large apartment building
Project typesNew construction
Retrofit: including repair, retrofit or partial retrofit
Comprehensive or deep retrofit
Table 3. Stakeholder group legend.
Colour#Stakeholder group
1Material or technology trader
2Architect
3Engineer
4Consultant
5Installer
6Construction company
7Public authority
8Bank/other financial service company
9Facility manager—administrative and businesses
10Facility manager—technical
11Energy supplier/utility or energy service company
12Business association, agency agent
DDemand-side actor, including investor or developer, housing company (for profit), housing company or housing association, cooperative (public/part-governmental/non-profit), private house owner (self-occupying or with the asset rented out).
16OTHER company or organisation type in the building sector
Table 4. Stakeholder level of power and interaction in the technology selection, classified according to building typologies and project types in Italy (IT).
Retrofit Projects
Retrofit Comprehensive Retrofit New Construction
SDBsMDBsSDBsMDBsSDBsMDBs
Buildings 10 00070 i001
Table 5. Stakeholder level of power and interaction in the technology selection, classified according to building typologies and project types in Spain (ES).
Retrofit Projects
Retrofit Comprehensive Retrofit New Construction
SDBsMDBsSDBsMDBsSDBsMDBs
Buildings 10 00070 i002
Table 6. Stakeholder level of power and interaction in the technology selection, classified according to building typologies and project types in Germany (DE).
Retrofit Projects
Retrofit Comprehensive Retrofit New construction
SDBsMDBsSDBsMDBsSDBsMDBs
Buildings 10 00070 i003
Table 7. Stakeholder level of power and interaction in the technology selection, classified according to building typologies and project types in Poland (PL).
Retrofit Projects
Retrofit Comprehensive Retrofit New Construction
SDBsMDBsSDBsMDBsSDBsMDBs
Buildings 10 00070 i004
Table 8. Stakeholder level of power and interaction in the technology selection, classified according to building typologies and project types in France (FR).
Retrofit Projects
Retrofit Comprehensive Retrofit New Construction
SDBsMDBsSDBsMDBsSDBsMDBs
Buildings 10 00070 i005
Table 9. Stakeholder level of power and interaction in the technology selection, classified according to building typologies and project types in Belgium (BE).
Retrofit Projects
Retrofit Comprehensive Retrofit New Construction
SDBsMDBsSDBsMDBsSDBsMDBs
Buildings 10 00070 i006
Table 10. Stakeholder level of power and interaction in the technology selection, classified according to building typologies and project types in the United Kingdom (UK).
Retrofit Projects
Retrofit Comprehensive Retrofit New Construction
SDBsMDBsSDBsMDBsSDBsMDBs
Buildings 10 00070 i007
Table 11. Stakeholder level of power and interaction in the technology selection, classified according to building typologies and project types in the Netherlands (NL).
Retrofit Projects
Retrofit Comprehensive Retrofit New Construction
SDBsMDBsSDBsMDBsSDBsMDBs
Buildings 10 00070 i008
Table 12. Top three stakeholders involved in the selection of the technology decision (classified according to project and country).
CountryRetrofitComprehensive RetrofitNew Construction
SDBsMDBsSDBsMDBsSDBsMDBs
ITD(6)-D(6)D(5)D(6)D(5)
3(6)-1(6)6(5)2(6)9(5)
16(5)-----X
ESD(6)D(6)D(6)D(6)D(6)D(6)
3(6)7(6)3(6)3(6)3(6)2(6)
1(6)6(5)2(6)4(6)4(6)3(6)
DED(5.5)D(6)D(6)D(6)D(6)D(6)
7(5.5)10(6)11(6)4(6)5(6)3(6)
--3(5.5)---
PLD(6)D(6)6(6)D(6)D(5)D(6)
7(6)3(6)5(6)2(6)5(5)6(5.5)
-2(6)--4(5)4(5.5)
UKD(6) D(6) D(5.5) D(6) D(6) D(6)
12(6)6(6)4(5.5)-6(5.5) 9(5.5)
1(6)3(5.5)----
FRD(6)D(6)D(6)D(6)D(6)D(5.5)
-2(6)3(5.5)8(6)2(6)5(5)
-4(6)-4(6)3(6)2(4.5)
BED(5)D(5)D(5)D(5.5)D(6)D(5)
5(5)6(5)1(5)5(5.5)3(6)3(5)
2(5)3(5)2(5)6(5.5)4(5)9(4.5)
NLD(6)D(6)D(6)D(6)D(6)D(5.5)
10(6)5(6)5(5)5(6)5(6)6(5.5)
--2(5)2(6)-2(5.5)
Legend: Stakeholder group (level of power). 1: Material or technology trader, 2: Architect, 3: Engineer, 4: Consultant, 5: Installer, 6: Construction company, 7: Public authority, 8: Bank/other financial service company, 9: Facility manager—administrative and businesses, 10: Facility manager—technical, 11: Energy supplier/utility or energy service company, 12: Business association, agency agent, D: Demand-side actor, 16: Other company or organisation type in the building sector. “-“: More than one stakeholder group in the same position.
Table 13. Stakeholders with the highest number of streams of communication (sum of all links) in each case.
CountryRetrofitComprehensive RetrofitNew Construction
SDBsMDBsSDBsMDBsSDBsMDBs
ITD(8)D(7)D(12)D(7)D(11)6(10)
3(8)3(7)5(9)5(7)2(10)D(9)
2(7)6(7)2(8)--2(8)
ESD(10) D(10)D(9)D(10)D(11)D(10)
-2(8)2(8)6(9)2(10)6(8)
-6(7)6(8)-6(9)2(8)
DED(13)D(12)D(13)D(11)D(13)D(12)
5(13)4(11)-2(11)2(11)6(11)
7(12)5(11)-3(9)-3(11)
PLD(12)D(13)D(13)D(11)D(13)D(13)
1(12)2(12)2(13)2(11)5(13)3(13)
5(12)5 (12)1(12)-4(11)-
UKD(13)D(12)D(11)D(12)D(11)D(12)
11(11)--6(11)6(10)2(12)
6(11)--3(10)1(8)-
FRD(13)D(12)D(13)D(13)D(13)2(12)
3(13)5(12)5(13)6(12)3(12)D(11)
2(13)6(12)--6(12)-
BED(13)2(11)2(13)D(9)2(11)D(13)
-D(10)6(12)5(9)5(10)5(13)
---6(9)--
NLD(12)D(11)D(11)D(13)D(13)D(11)
7(11)5(10)5(10)2(12)6(12)1(11)
-2(10)-7(11)5(12)7(11)
Legend: Stakeholder group (level of communication). 1: Material or technology trader, 2: Architect, 3: Engineer, 4: Consultant, 5: Installer, 6: Construction company, 7: Public authority, 8: Bank/other financial service company, 9: Facility manager—administrative and businesses, 10: Facility manager—technical, 11: Energy supplier/utility or energy service company, 12: Business association, agency agent, D: Demand-side actor, 16: Other company or organisation type in the building sector. “-“: More than one stakeholder group in the same position.

