1. Introduction
Building Information Modeling (BIM) is a relatively new innovation that has been introduced to the architectural, engineering, and construction (AEC) industry. However, its implementation has been lackluster for the past decades, primarily due to the considerable financial risk, especially for local small and medium enterprises (SMEs) [
1]. For these SMEs to transition from the traditional construction approach to the BIM-based method, strong and evident benefits need to be identified to justify the high initial transition cost. The study conducted by Alwisy et al. [
2] highlighted the high initial cost associated with the implementation of BIM systems in SME companies, which limits BIM usage among construction practitioners. In view of that, promising labor productivity is one appealing benefit that is encouraging the implementation and adoption of BIM in the construction industry. Despite strategies having been developed to explore the benefits of BIM in terms of labor productivity, the empirical quantification of labor productivity is still difficult and complex due to the newness of BIM; the complexity of projects; and the lack of standard, unified productivity measurements. According to prior studies, there is a considerable gap between the pioneering edge (early adopter) and the majority of the industry. Therefore, it is crucial to tighten this gap by evaluating the impact of BIM on labor productivity in the construction sector, if BIM adoption is to be used as a way to increase productivity [
3].
However, determining this impact has always been difficult due to the sheer complexity of measuring labor productivity, which requires extensive efforts in collecting and analyzing data in the field. In short, these are the major barriers currently being faced by most researchers and particularly construction companies attempting to justify the cost of the transition to BIM platform practices [
4]. The recent study of Zhang et al. [
5] proposed BIM as a tool to achieve the principles of lean construction in order to improve the coordination and collaboration of work teams, enhance the project quality, and reduce the waste in a move towards higher construction productivity.
The construction sector in Malaysia has recorded an unsatisfactory productivity level, mainly due to a large proportion of the construction workforce consisting of low-skilled foreign labor. Therefore, the construction sector needs to evolve from using traditional approaches, which are unsustainable in terms of waste generation and resource depletion, to advanced methods, such as the use of information technology utilizing a BIM platform in integrated design and construction management [
6]. The Construction Industry Development Board (CIDB) of Malaysia, through the Construction Industry Transformation Program (CITP 2016-2020), has been encouraging the use of modern technologies such as BIM to increase the productivity level [
7]. The CITP 2016-2020, as part of the national agenda of the 11th Malaysia Plan (RMK11), aimed to effectively decrease the foreign workforce while providing equally impressive productivity through the implementation of BIM, as much of the fabrication work can be done off-site.
The main objective of this research is to determine the key factors affecting construction labor productivity with the implementation of BIM, which will ultimately be used to tackle the low-productivity issues facing the Malaysian construction sector. This can be achieved by the following research objectives:
To identify the BIM-related labor productivity factors through the perception of AEC professionals;
To document the impact of these BIM-related factors on labor productivity in Malaysia;
To recommend the areas where BIM can be used to improve labor productivity.
This paper presents the findings on the impact of BIM on construction labor productivity obtained through a quantitative survey method, which was undertaken in a few of Malaysia’s top architectural, engineering, and construction (AEC) companies that have been established since 2000. This paper is divided into four sections. The first part identifies the BIM-related factors that will affect labor productivity in construction projects, which are extracted through past studies and related literature. The second part will be focused on the research methodology and data collection process adopted in this study. The third part discusses the results and findings obtained through the survey questionnaire using extensive statistical factor and regression analysis. Finally, the fourth section concludes the paper with a discussion of push factors and challenges associated with the implementation of BIM, along with the recommendations for tackling these issues.
In order to effectively determine the underlying impacts of BIM on labor productivity, the survey questionnaire is aimed at understanding how professionals (including directors, general managers, senior project managers, project managers, project engineers, site engineers, site foremen, BIM engineers, coordinators, and estimators) in the AEC industry differently perceive the impact of BIM adoption on construction labor productivity. This paper intends to determine the primary labor productivity factors through the perspectives of AEC professionals who are involved in conventional and BIM-based design and construction practices. This study focuses on the quantitative survey method for evaluating labor productivity, instead of measuring labor productivity directly on a job site, due to the possible uncertainty in tracking labor productivity due to complexity in knowledge and communication aspects when dealing directly with foreign laborers working on construction projects.
2. Productivity and Digital Technology in Construction
In this section, selected literature findings on the definition, benefits, and primary factors of building information modeling (BIM) affecting labor productivity in the AEC industry will be presented. This section concludes with a proposed point of departure related to the impact of BIM on construction labor productivity.
In the past decade, building information modeling (BIM) has emerged as a revolutionary innovation, showing anecdotal evidence of successes in improving construction productivity. The BIM platform is a technology and process that enables the digital visualization of a project prior to its physical construction [
1]. It provides a resource sharing platform that allows close collaboration between project owners, design consultants, and contractors throughout a project lifecycle [
8]. Besides digital information sharing, Eastman et al. [
9] described six other essential applications of BIM, as follows:
Traditional computer-aided design (CAD) provides a static 2D environment that requires users to cross-reference different documents while studying the properties of building objects. These processes become more time and cost-inefficient for projects with a complex scale, and it is challenging to manage design errors among multidisciplinary building practitioners [
10]. As a result, information and communication technology is developing at a breakneck pace [
11]. During the last decade, the emergence of BIM has brought the AEC industry into a new era. In the BIM platform, the building elements are represented by a 3D digital model that provides inherent properties, such as the material characteristics, volume, and location of an object, instead of the solid models with only geometrical lines and shapes that are employed in the case of a 2D format. In light of this, Rogers et al. [
12] have divided the level of proficiency of BIM into four separate stages, as presented in
Table 1.
In light of the evolution of BIM, Germany, Finland, and the US are regarded as the pioneering countries of this technology [
13,
14,
15]. A previous record indicated that the earliest development of BIM was achieved in 1982 by Gabor Bojar through Graphisoft in Hungary. Meanwhile, the US is the biggest producer and consumer of BIM products, and the flow of BIM knowledge dissemination has generally been from the US to other developing countries [
15]. The Economic Transformation Programme of Malaysia’s 2014 annual report highlighted Finland as the world leader in BIM implementation. In Finland, related BIM software, such as Tekla and Vicosoft, have been invented and utilized by the AEC industry [
16]. Nevertheless, apart from the United Kingdom (UK) and Hong Kong (HK), Singapore, South Korea, and Australia are countries that are making progress towards the endorsement of BIM at national levels. The study by Abanda et al. [
17] highlighted the crucial role of BIM in containing metadata in an interoperable format to foster collaborative practices in the AEC industry. The interoperability format of building components’ data in the BIM environment translates to both traditional construction and the off-site production and manufacturing of buildings.
Despite the industry’s awareness of the advantage of BIM, construction organizations are yet to fully utilize its potential. According to Alshawi et al. [
18], the UK construction sector is facing slow, gradual changes in the implementation of BIM in design and construction practices. The reasons for this could be the complexity of implementing BIM, the fact that adoption could incur additional project costs and require a comprehensive set of training, and the fact that a majority of the designers are still familiar with using AutoCAD in their designs instead of BIM-based software in design and construction practices. The study by Ibrahim et al. [
19] proposed a serious game approach to fill in the identified capacity training gaps for industrialized construction. The recent study by Chan et al., published in 2019, elaborated on the major barriers to BIM adoption, which are related to the inherent resistance to change amongst construction stakeholders, and the lack of a system for and standards on BIM implementation in Hong Kong’s construction industry [
20]. In a similar study conducted in Italy, perceived major barriers for using BIM technology in the building during a renovation process were classified as a lack of awareness, lack of skills and competency, lack of financial resources, and the technical limitation of existing BIM tools in the renovation of existing buildings [
21]. In short, a successful transition to the adoption of BIM requires a wide range of involvement and research from all project participants. Previous studies have investigated the adoption of BIM and implementation by numerous parties, as shown in
Table 2. For example, a recent research study developed the BIM-based Augmented Reality (AR) application, which is combined with a location-based management system for higher productivity of site managers, automating their daily work and improving the construction performance [
22]. This is a common point of departure among international initiatives that promote the integration of building information modeling for multidisciplinary collaboration amongst architects, quantity surveyors, and contractors in building design and the construction lifecycle. However, the construction industry in Malaysia has been taking a more conservative approach towards the implementation of BIM, where they would prefer to observe the effect of the method for a longer time before introducing it themselves. As shown in
Table 2, BIM in Malaysia has been promoted after the year 2014, while other countries had already begun looking into BIM potentials for the AEC industry from the year 2005 or even earlier.
On the other hand, the chronology of BIM adoption in the construction industry revealed a considerable gap in its adoption during the construction phase, particularly by construction contractors. Hence, BIM technology has the potential to be involved in the entire construction process by initiating real-time integration into the building design database for controlling and monitoring the construction productivity. One of the Malaysian government agendas in the 12 National Key Economic Areas (NKEAs) is to improve economic growth within the AEC industry [
7]. To achieve this target, AEC organizations have zealously introduced new technology to remain competitive in the current market [
26]. Currently, BIM adoption in Malaysia is at Level 1 and has an implementation rate of 10%, which is considerably low compared to other countries. In the United States, this rate is 71%; in Singapore, it is 65%; and in the United Kingdom, it is 39%. The CITP 2016-2020 recommends that Malaysia moves beyond Level 1 to Level 2 through a comprehensive package of initiatives, policies, and specific programs, such as introducing a BIM platform to enable the accurate and open sharing of information, as well as the establishment of a reference center to support BIM adoption, a national BIM guide, and a standard BIM library containing local manufacturers’ products [
42].
2.1. Factors Affecting Labor Productivity
For the past four decades, the number of studies conducted to identify factors affecting construction labor productivity has been very extensive and well-documented [
43]. The early work of this relatively new field was initiated by Bocherding, followed by Maloney and McFillen, who evaluated the impact of craftsman motivation on construction labor productivity [
44,
45]. While some studies have suggested that construction productivity and construction labor productivity are identical components, a distinct difference between the two exists to accurately identify the factors, as construction labor productivity is a subset of construction productivity [
46].
Most studies have presented construction labor productivity models to explain the interaction between factors [
47,
48,
49,
50]. However, it is challenging to determine and quantify the effect of any single factor since construction productivity is simultaneously influenced by numerous factors. Since the 1990s, most studies have categorized factors through different classification schemes. For example, in 1993, Dozzi and AbouRizk developed two categories of factors affecting labor productivity in the construction industry, classified as technological and administrative factors [
51]. Through interviews with construction practitioners, the authors identified 35 underlying factors within those categories. In another study, Liberda et al. (2004) investigated a group of laborers’ perceptions on the impact of general construction issues encountered during bricklaying on construction productivity [
52]. The authors then divided the factors into internal and external factors, suggesting that these factors may be within or beyond the control of management, respectively.
On the other hand, the study by Tse et al. published in 2005 identified nine different categories and 44 underlying factors where worker motivation and satisfaction were found to be the most influential factors in construction labor productivity [
41]. Similar to Olomolaiye et al. and Liberda et al., Howard and Björk also used externally as one of the broad classifications for 51 underlying factors, with management and labor as the remaining two categories in these new classification systems for analyzing the impact of BIM on labor productivity [
40]. Based on interviews with 20 industry experts, management factors were found to be responsible for half of the most significant factors. It thus becomes evident that although there is a relative trend in categorizing the factors affecting construction labor productivity in the literature, the classification of these factors has been very inconsistent. This is primarily due to the fact that the factors affecting productivity vary by job, location, and industry. Other studies have mainly focused on Middle Eastern countries. For instance, the study by Jarkas et al. published in 2015, established a ranking system of 33 factors under four major groups named management, technological, labor, and exogenous, which affected construction labor productivity in the Sultanate of Oman [
53]. In a similar study in Yemen, the classification system ranked 52 predefined factors that were categorized into four primary groups: labor, management, technical/technological, and external [
54]. The technical and technological factors have the highest impact on construction labor productivity in Yemen. In addition, Hiyassat et al. (2016) also emphasized technology and equipment factors that affect construction labor productivity in Jordan [
55]. To mitigate these adverse factors affecting productivity, numerous studies have also proposed methods to increase productivity by tackling the issues at the task level. These solutions can generally be categorized into four classification types: management systems, technology, manpower, and improvised techniques [
7]. According to Lee et al. (2017), solving management issues may be key to improving productivity. Still, without the incorporation of technology and techniques, the effect might not be evident enough [
56]. In support of that, the lack of proper communication and information sharing among construction participants in design and construction projects has had a critical impact on the performance of the workforce in this industry [
57]. A prior study suggested establishing a more efficient information feedback network by reengineering the existing information flow channels for quality management in the construction industry. Therefore, the introduction of BIM into construction projects is an ideal approach that comprises both the technological and managerial aspects that are mentioned above.
In conclusion, this study has summarized a series of 33 factors that affect labor productivity based on the three main categories found in prior studies (See
Table 3). These individual factors were selected based on the number of times that the researchers came across them in previous studies. As a rule of thumb, the factors summarized in
Table 3 appeared at least once in past research.
However, in the recent predesigned master plan by CIDB [
7], the adoption of BIM was put forward as one of the top initiatives for increasing the quality of the workforce and creating higher productivity. Despite the provided benefits, the adoption rate is still low due to the high initial investments. This study aimed to identify the impact of BIM technology on labor productivity in the Malaysian construction industry.
2.2. Impact of BIM on Labor Productivity
Despite the observed evidence showing the success of BIM and its benefits for construction projects, small- and medium-scale construction companies are still reluctant to transition due to the lack of empirical justification; however, over the past decades, studies have increasingly attempted to quantify the impact of BIM on construction productivity. For example, Coates et al. [
58] investigated the labor productivity measurement method for structural formwork using BIM. They found that productivity information can be obtained most easily through construction progress monitoring and control. They also discussed how processes like 3D BIM modeling and quantity take-off could improve productivity assessment. However, they did not evaluate the potential impact of BIM on productivity, which accounts for these improvements.
Furthermore, more recent studies have attempted to quantify the impact of BIM on labor productivity. The study by Bryde et al. [
10] investigated the effects of BIM on six key performance indicators commonly used in the construction industry: quality control (rework), on-time completion, cost, safety (lost man-hours), units (square feet) per man-hour, and dollars per unit performed. Through a survey, they found that quality control, on-time completion, and units per man-hour were the three highest-ranked key performance indexes. Following Suerman’s dissertation, Nitithamyong and Skibniewski assessed the impact of BIM adoption in a Knowledge Transfer Partnership (KTP) project based on a set of KPIs that have been developed and tested through action research [
59,
60]. The authors concluded that man-hours spent per project, speed of development, and revenue per head were the three main KPIs established to effectively measure the impact of BIM in a project. In a recent study in Malaysia, the importance of labor productivity data for measuring project progress was explored and a set of productivity data acquisition methods were developed. The authors alluded that quantity take-off and clash detection were the main factors that lead to an improvement in labor productivity [
61].
Despite the conceivable points of interest, the implementation of BIM is still hampered by inadequacies, as highlighted by recent studies, and it is suggested that the impact of a contextualized BIM process should be evaluated in a local context in order to give a qualitative and quantitative perspective to the stakeholder for proper decision making regarding the use of this technology in the design and construction field [
3,
60,
61,
62]. For instance, such stakeholders are faced with significant limitations, such as a lack of historical data due to the uniqueness of project complexity; a shortage of training; a lack of qualified internal staff, and, most importantly, the remarkably expensive cost of the transition to BIM. These costs are associated with the purchasing of various software and hardware, as well as the training of staff. As a result, these challenges hinder the effort to effectively correlate BIM with labor productivity. Currently, this issue is still faced by most, if not all, organizations, in quantifying the impact of BIM on labor productivity. Therefore, more studies on these BIM-related and labor productivity issues are required in the future due to the newness of BIM. Based on these prior studies, the authors reckoned that the adoption of BIM would generally have positive impacts on construction productivity. Additionally, the benefits that come along with the adoption of BIM, such as increased labor productivity, are more than enough to justify the costs of transitioning to BIM from traditional construction methods.
3. Methodology
This study designed a structured close-ended survey questionnaire consisting of 33 BIM-related productivity factors to evaluate the impact of BIM adoption on labor productivity. At the same time, a project information form was included to collect demographic information, as well as project practices and exposure to BIM. The whole survey questionnaire was conducted through an online-based survey platform (i.e., Survey Monkey) using an electronic tablet by approaching the AEC professionals in person. The purpose of surveying with an electronic tablet is to ease the data collection and organization process, while reducing the usage of printed papers. On the other hand, approaching potential participants in person allows informal discussions and ensures that the surveys are conducted adequately.
Instead of measuring labor productivity directly on-site, this research assessed the impact of BIM on labor productivity through the AEC professionals’ perspective. The survey questionnaire consisted of four sections. In section one, respondents provided their demographic information, including their role within the company, working experiences, company background, and project context. The second section was related to respondent’s exposure to BIM, their relevant experiences with BIM, and the level of adoption of BIM at their respective companies. As for
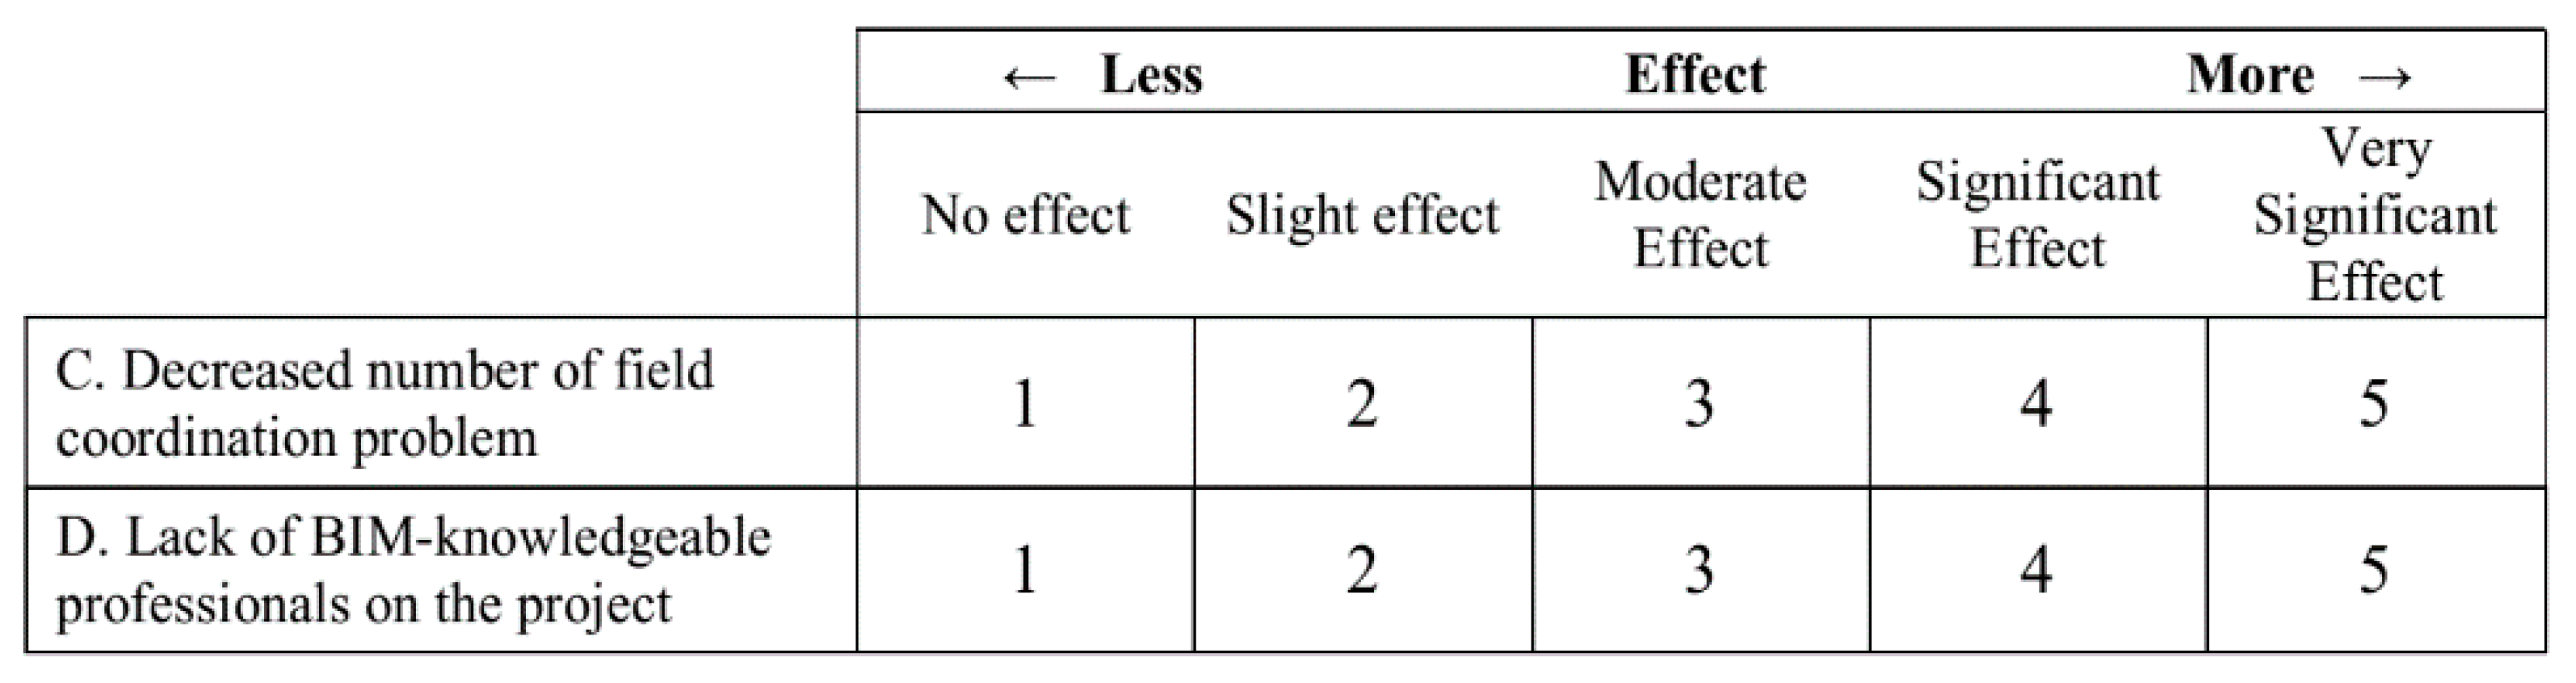
Section 3, respondents were required to rate the 33 productivity factors, as shown in the example in
Figure 1. These factors were assessed using a five-point Likert scale, with 1 indicating totally not affected, and 5 indicating very significantly changed, with the adoption of BIM. Lastly, as it is challenging to discretely quantify the labor productivity, the fourth section consisted of a few questions that asked the respondents about their opinions on the benefits and challenges of BIM currently faced in the construction industry, the impact of BIM on labor productivity, and recommendations on tackling the issues related to BIM adoption. However, one of the limitations is that the respondents may not have felt comfortable providing answers that presented themselves in an unfavorable manner. To address this potential bias, positive- and negative-worded variables were intentionally mixed to improve the quality of responses, as shown in the example in
Figure 1.
Prior to the collection of survey data, a pilot test was conducted on a small sample, i.e., 18 of the potential respondents who went through industrial training related to BIM. This was conducted to establish a credible validity of the findings obtained by this research, which also ensured that the questions measured what they were intended to measure. The objectives of this test were (1) to assess the comprehensibility, clarity, interpretation, and suitability of the questions designed through feedback; (2) to determine the effectiveness of respondents in completing the questionnaires within the allocated time; and (3) to estimate the range of time required to complete the survey questionnaire. Following the feedback from the participants, it was revised by the researchers and redirected to the respondents until corrections reached a saturation point (i.e., a point at which responses did not provide any additional insight). Furthermore, the estimated time required was found to be approximately 20–25 minutes in total.
Data Collection and Analysis Process
Abiding with the Monash University Human Research Ethics Committee (MUHREC) policy, the next step was to design an explanatory statement that included information such as the objective of this study, benefits and risks associated with the study, and data storage and confidentiality. The aim of this statement was to provide an overview of this research when liaising with potential construction companies for data collection. Additionally, a consent letter was drafted to ensure that participants were well-aware of the future use of data collected. Through the effort of pilot surveying, a few candidate construction companies that are currently pioneering BIM design and application in Malaysia were identified. Participating companies mainly constitute the Grade 7 of CIDB License according to their tendering capacity as CIDB recommends at least a 40% adoption rate of BIM stage 2 for public projects above RM 100 million [
63]. For each potential company, researchers visited the virtual design and construction (VDC) department to explain the research purpose and type of data they intended to collect through an explanatory statement. Letters granting permission for researchers to collect the survey data were sent to these respective companies and returned with approval of the VDC representatives. Finally, these documents (i.e., permission letters, explanatory statement, drafted consent letter, and risk assessment) were submitted to MUHREC for their approval to start the research data collection and the researchers received permission after two weeks. Researchers then studied the number of survey questionnaires required for the results to be valid. With a total of 4401 registered AEC professionals, including engineers, architects, quantity surveyors, and land surveyors, with a margin of error of 10% and confidence level of 95%, a total of 95 respondents were needed to conduct reliable data gathering in this study [
62,
63,
64]. The decision on using a margin error of 10% and 95% confidence level was made to account for distortion in data, where respondents may agree to the statements as provided and select the most suitable answer, or otherwise tend to choose the answers in favor of themselves or their companies.
The researchers then visited the respective companies on an agreed date for data collection. The data collection was conducted in a small, quiet meeting room, where the respondents took turns completing the survey questionnaire one-by-one. The standard open-ended questions and answers were employed based on the guidelines proposed by Creswell and Poth [
64]. Firstly, the researchers introduced themselves to AEC professionals. Secondly, the researchers explained the purpose of the study, methods of data collection, and other additional information, together with the explanatory letter. Then, the consent form was delivered to the survey participants. Once the participants had consented, the data collection procedures commenced accordingly. Subsequently, the authors had a brief, informal discussion with the survey participant to obtain their opinions. The above-stated procedures were repeated for all survey respondents over three days at the respective companies. Moreover, to ensure the accuracy of the responses and cooperation of the participants, a gift card worth 10 Malaysian Ringgit (MYR) was given to the participants who were willing to provide precious insights, despite their competing time priorities.
After completion of all the data collection procedures, the survey results and informal discussions were retrieved, and were transcribed verbatim and anonymized. Adopting past related studies, the researchers analyzed the qualitative data through a statistical technique known as factor analysis [
43]. Factor analysis is an analytical technique that reduces a large number of variables into fewer numbers of unobserved factors. Knowing that the observed productivity factors are likely to be inter-related and can be classified through a few underlying categories of factors, this study adopted factor analysis to identify and quantify these categories. Specifically, this research utilized the principal axis method to extract the underlying categories that explain the common variance of the observed variables because the data did not have a statistically multivariate normal distribution, which is also needed for other factor extraction methods such as maximum-likelihood method [
65].
4. Results
This section will now present the extent of BIM-related factors affecting the labor productivity and areas of labor productivity where BIM can improve. The analyses are divided into three sections: demographic information, categorization of BIM-related factors, and regression analysis, which are comprehensively discussed in this section.
4.1. Demographic Information
Demographic variables were studied to examine the difference in BIM impact on labor productivity among different populations. The labor productivity survey was completed by 103 respondents from various positions within the AEC industry. The organizational role data results show most responses were from project engineers (25.2%), while the least respondents came from the director/president’s position category (1.9%). A detailed statistical analysis for different categories of responses is presented in
Table 4.
This can be explained by the fact that the director and presidents are located at the top of the management organizational hierarchy and had more overall knowledge on the impact of different factors on organizational productivity. In addition, the directors, presidents, and general managers had more experience (more than 20 years) working with BIM compared to other positions; thus, their opinions regarding the impact of BIM on labor productivity will be given a higher priority in the following sections.
Moreover, as shown in
Table 5 below, the percentage of any project in Malaysia which has completed the adoption of BIM within the past five years was cross-tabulated with the respondent’s professional roles and respective BIM proficiency level to find the relationship between the two dependent variables. Firstly, the project adoption rate was categorized as (1) no experience, (2) adopted BIM in less than 25% of their recent five-year projects, (3) 25% to 50% adoption rate, (4) frequent adoption (i.e., 51% to 75%), and (5) very frequent adoption where more than 75% of the projects were BIM-based.
Comparing the professions of survey respondents, the calculated Chi-square value of 43.459 and its corresponding p-value of 0.183 suggest that the profession does not affect the project adoption rate. Besides, the top managerial positions had generally conducted all their projects within the past five years with BIM implementation, with all the directors/presidents having a very frequent adoption rate of more than 75%, while 66.7% of the general managers frequently adopted BIM in any type of construction project. As for the individual’s proficiency level, a p-value of less than 0.01 indicates that there is a significant association between the two variables. In general, practitioners who are located in a top-level position are involved with more BIM-based projects in comparison to lower-ranked professionals or practitioners in the construction industry in Malaysia.
4.2. Categorization of BIM-Related Productivity Factors
This section presents the factor analysis method that was performed on the productivity factors in order to reduce them into a few categories, as there were too many primary factors to be analyzed. Recognizing that these 33 factors are likely inter-related through an underlying category of main factors, but that the researchers were not certain of how many of these underlying categories represented the overall data, the study applied exploratory factor analysis, where the statistical software extracted the groups of factors that were highly intercorrelated. In other words, the software statistically defined a group of factors as highly intercorrelated when the group had an Eigenvalue of at least 1. The other components, with Eigenvalues less than 1, were considered as “scree” and assumed not to represent any real traits underlying the 33 factors. As a result, five different categories of underlying factors were measured, and factor loading scores of all 33 factors were calculated for each underlying type from the factor score coefficient matrix, as stated in
Table 6.
For every primary variable, factor analysis was performed based on the frequency and effectiveness rating of each factor. The Kaiser-Meyer-Olkin (KMO) measure of sampling adequacy was 0.85, and Bartlett’s significance of p < 0.01 indicates that factor analysis was applicable for determining the underlying categories of labor productivity factors. Through factor analysis, five underlying types of factor were extracted through orthogonal rotation (varimax rotation), where rotation is a technique of adjusting the factor axes to minimize the number of variables, and results were proposed by sets of factors with respect to their interpretability. Factor loadings describe how much correlation exists between observed variables and underlying factors. The rotated factor-loading matrix for the five categories of underlying factors with their correlation to the observed variables is shown in
Table 6. To simplify the analysis process, loadings of less than 0.3 were suppressed as their effect on labor productivity was minimal. Overall, the five underlying categories of factors accounted for 41.7% of the total cumulative variance. The variables with prevailing factor loadings were used to categorize the nature of these underlying factors, as described in
Table 2. For instance, project-related factors such as 3D modeling/design, an extended building life, and 4D modeling/scheduling of construction activities, loaded more substantially on Category 1 than other categories. Hence, Category 1 was classified as the project category.
Moreover, Category 2 was classified Individual (Labor) category, which refers to specific individual skills or attributes (i.e., labor works) affecting productivity. The limited BIM knowledge of clients also loaded significantly on Individual (Labor) category, which may be explained by the fact that the communication between BIM professionals and clients was hindered due to the lack of knowledge, causing stagnation in the construction process.
On the other hand, variables in Category 3, such as the decreasing number of field coordination problems and monitoring building performance, related more to the supervision of laborers classified as being in the Individual (Supervision) category. Category 4 was labeled as an organization, being associated with variables like the project budget, hardware requirement, and size of the companies/organizations. Lastly, management-related variables loaded significantly on Category 5. However, although maintaining business with past clients better represents the Organizational category, it loaded more significantly on Category 5, which may be explained by the fact that management skills at an individual level more or less affect the impression of clients towards an organization. Factor scores were calculated for each underlying category from the factor score coefficient matrix (
Table 6). However, the limitation of this technique is the minimum and maximum factor scores, which are different for each category, as each category comprises a different number of observed variables with different weightings, adding more complexity to the analysis process. To reduce this complexity, the factor score for each category was converted into a proportion of its corresponding underlying categories’ potential range using methods described by others [
43]. For each observed variable, the factor scores were converted to a range of 0.0 to 1.0, with 0.0 indicating no effect on productivity and 1.0 indicating a very significant impact. As these scores denote the respective proportion, it allows easy and consistent comparisons across various scales. Through this conversion, the authors will be able to determine the impact of underlying categories based on the perspective of AEC professionals, which is a significant departure from previous related studies.
Table 7 below presents the mean, maximum, and minimum converted factor scores of the underlying factors.
According to
Table 7, the AEC professionals considered factors within the Project category to potentially have the most significant impact on labor productivity as a whole, followed by Individual (Supervision), Individual (Labor), Organizational, and Individual (Management). It is noted that all the underlying categories had a relatively high maximum score, with Individual (Supervision) having a maximum score of 1, showing that this category has the highest impact on the productivity, while the single observed factor (i.e., decreased number of field coordination problems) within Individual (Supervision) had the highest impact on labor productivity, as is tabulated in
Table 6.
4.3. Regression Analysis
The underlying categories of factors that affect construction labor productivity were investigated through regression analyses that were undertaken for the factor scores and perceived productivity. Prior to the regression analyses, a reliability test was conducted to ensure internal consistency between the observed variables. The Cronbach’s alpha value of 0.85 was determined, indicating that the observed variables had a high internal consistency.
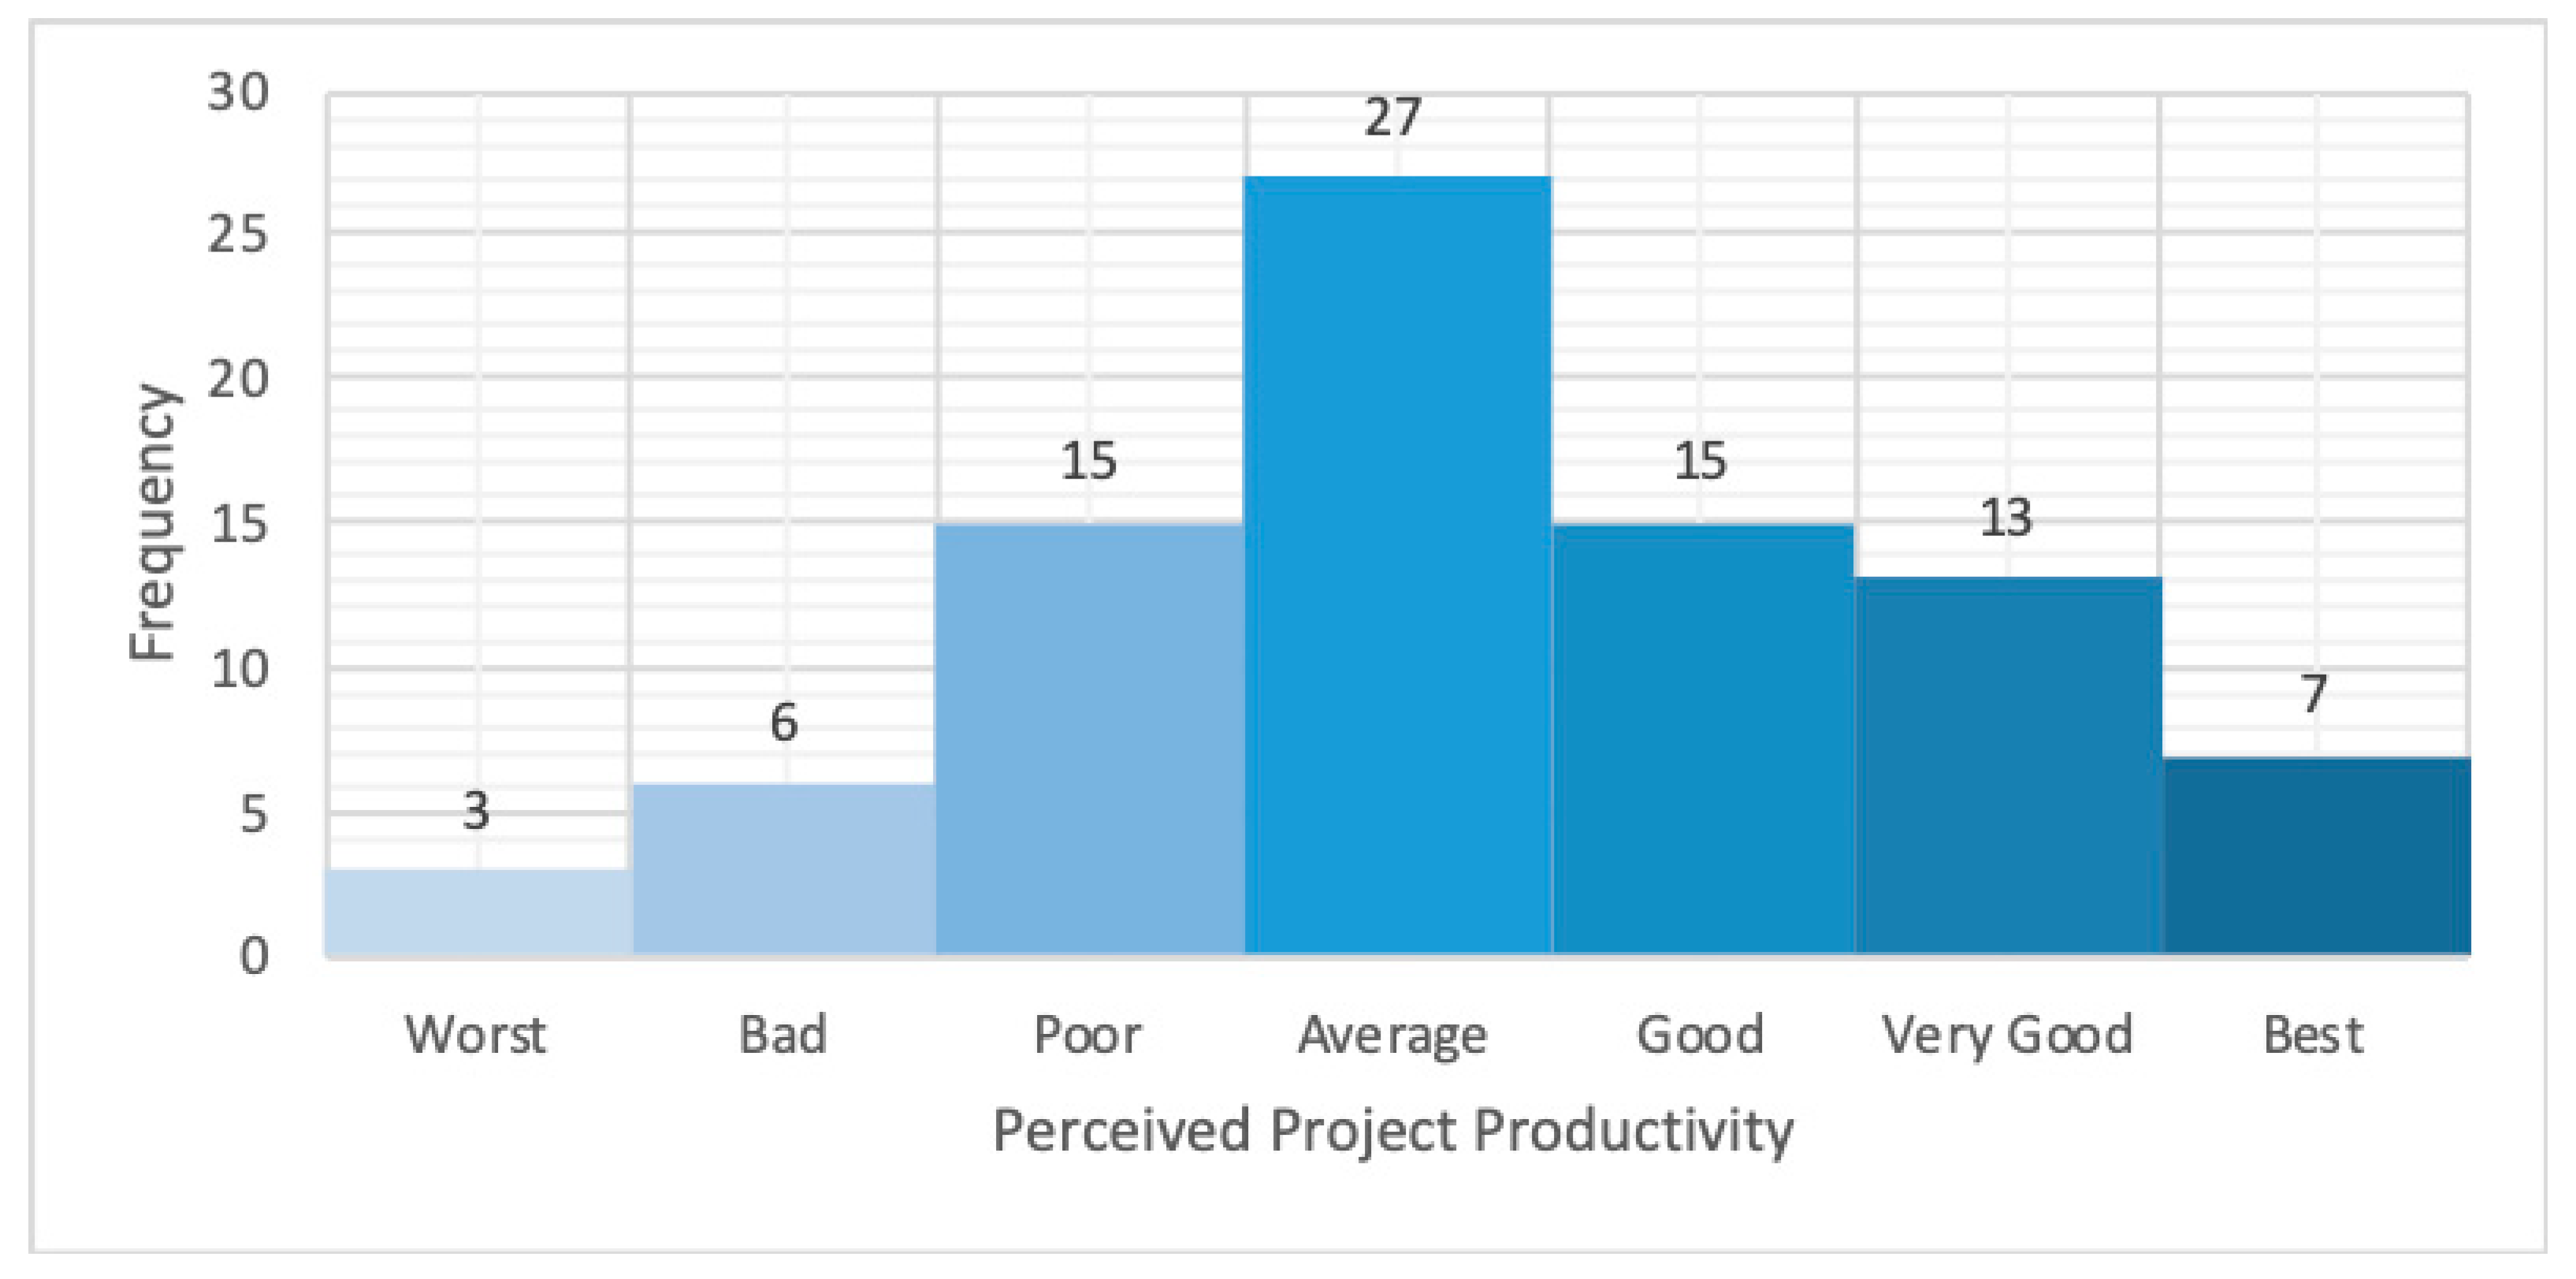
Figure 2 presents the distribution of construction project productivity perceived by the survey respondents. The AEC professionals were asked to rate the perceived construction labor productivity based on the projects completed in the past 5 years from 1 (worst productivity) to 7 (best productivity).
There were 103 valid respondents, with an average productivity (27), which contributed to the highest frequency of 31.4%. In addition, all the underlying categories were included in the regression model and had a significant impact on labor productivity from the AEC professional’s perspective, as shown in
Table 8. The negative regression coefficient of Category 2—Individual (Labor)—indicates that AEC professionals perceived lower project productivity when BIM was adopted at the labor level. This can be explained by the low-skilled foreign laborers facing significant limitations due to their lack of knowledge on modern technologies, such as BIM technology, in design and construction firms.
The underlying categories were ordered as (1) Project, (2) Individual (Labor), (3) Individual (Supervision), (4) Organization, and (5) Individual (Management).
Moreover, these five factors contributed to 19% of the variance proportion for the professionals’ perception of the impact of BIM on labor productivity. This proportion of variance is considered moderately significant, which can be explained by the fact that the respondents that participated were mostly from the professional level, and all other classes of workers within the construction industry were not included. Besides, the variance inflation factors (VIF) of the independent variables in the regression model were also examined. All five underlying categories had a VIF of approximately 1, which was much lower than the common cut-off point of 5. Therefore, multicollinearity was not an issue for this regression model, as shown in
Table 8. Since all the categories of factors had different standard deviations, the standardized regression coefficient was also used to compare the relative impact of BIM on the perceived labor productivity following the method proposed by Dai et al. [
66]. In addition, the linear regression of AEC professionals’ perception and underlying categories of factors were modeled to determine the extent of the impact on labor productivity, and most importantly, whether it has a positive or negative effect. As is shown in
Table 8, all of the underlying categories were included in the regression model and had a significant impact on the construction productivity from the professionals’ perspective. These five categories explained 19% of the total variance on AEC professionals’ perception of their project productivity. The amount of variation is considered significant, given the fact that the sampled respondents contained a wide array of roles, each with its specific work scope, and the uniqueness of construction projects. Based on the regression model, Individual (Supervision), as it is classified as Category 3, has the highest positive impact on labor productivity, with a regression coefficient of 0.271, and Individual (Management), which is classified as Category 5, has the least positive effect, with a coefficient of 0.008. On the other hand, Individual (Labor), classified as Category 2, is the only category with a negative coefficient of −0.231, indicating a negative impact on labor productivity.
The standardized regression coefficient statistically refers to the estimated increase of perceived labor productivity in the standard deviation unit per standard deviation increase of the underlying category factors.
where
is the standardized regression coefficient for the
variable;
is the corresponding standard deviation of the independent variable, and
is the standard deviation of the dependent variable. The standardized correlation coefficients calculated from the regression model (See
Table 8) were also tabulated and are presented in
Table 9, together with the standard deviation of each underlying category.
Individual (Supervision) has the most substantial influence on professionals’ perception of construction labor productivity, as described by the standardized correlation coefficient of 0.183. It is also the highest-ranked converted factor score (See
Table 7). This shows that the majority of AEC professionals perceived that supervision at the individual level has the highest impact on labor productivity. Next, the second-ranked category is Individual (Labor), with a standardized correlation coefficient of 0.156, followed by the Project category, which ranks third with a coefficient of 0.114. Although the Project category was suggested to significantly impact the labor productivity, as proven by the converted factor scores, the influence on the AEC professionals’ perception of labor productivity was not substantial, as evidenced by the regression analysis. This finding may be explained by the fact that most respondents considered few opportunities for improvement in factors associated with the project-level since many of the decisions at a project level were made by the top managerial positions in an organization (i.e., directors, presidents, and general managers). Hence, there are only a few areas of improvement associated with the perception of the middle and lower hierarchy level of an organization.
5. Discussion
The review of relevant literature identified 33 BIM-related labor productivity factors in the construction industry in Malaysia. Using factor analysis, the BIM-related labor productivity factors were classified into five underlying categories, providing an overview of the significant factors affecting labor productivity. Based on
Table 7, the Individual (Supervision) category was found to have the highest impact on labor productivity, followed by the Organization, Project, Individual (Labor), and Individual (Management) category. On the other hand, the potential areas that have a positive impact on labor productivity based on the perspective of AEC professionals, as presented in
Table 8, are ranked as follows (highest to lowest): Individual (Supervision), Project, Organization, and Individual (Management) from AEC professionals’ perspective. Individual (Labor) was the only category with a negative impact on productivity. The results of the factor analysis coincide with those of the regression analysis, for which the Individual (Supervision) category was shown to have the most significant factors affecting productivity, while nontangible factors, such as maintaining business with clients, within the Individual (Management) category, ranked relatively low, as shown in
Table 6. Besides, by looking at the Individual (Labor) category, the findings suggested that factors such as a lack of BIM-knowledgeable fabricators on the project, limited or no previous experience working with other companies on BIM projects, and a lack of BIM-knowledgeable professionals on the project are potential areas of improvement for overcoming the negative impact of BIM adoption on labor productivity in a construction project. A prior study in the Canadian construction industry suggested a clear positive impact of BIM on labor productivity for those areas that were modeled and prefabricated, with a range of 75% to 214% improvement compared to the areas that were not modeled in the BIM platform [
1]. The aforementioned study highlighted the significant role of BIM in the organization’s bid for work leading towards higher labor productivity. The main outcome of this survey study from the perception of AEC professionals also highlighted the significant impact of transitioning from a conventional method to BIM-based practices by decreasing the number of field coordination problems, faster regulatory approval, decreases in the project cost, monitoring the performance of the complex project with a tight schedule, and a safer construction process and improved safety performance in the building post-occupancy phase. This will lead to higher labor productivity in design and construction projects in Malaysia.
However, measuring labor productivity on-site is extremely difficult, considering the simultaneous occurrence of different labor productivity. These findings recommend that the industry should put more focus on supervision of the job site at the individual level, as site supervisors such as foremen and engineers are the people who directly affect labor productivity.
The evaluation stage of this research also considered the problems of low labor productivity which BIM can address within an organization. Informal discussions with the survey respondents allowed us to identify the current challenges of BIM adoption in the Malaysian AEC industry and provide us with some suggestions on and insights into the improvements of productivity and BIM adoption. As noted above, the use of BIM in construction projects was perceived as being beneficial in many ways:
BIM designs accurately predict the material take-off required for an activity. This reduces the waste and helps an organization to drive lean construction. The on-site team could thus focus on the construction process and sequencing of work, instead of managing the materials and tools in the field. As a result, the amount of field coordination could be significantly reduced;
BIM reduced the site activity as it is part of the Industrialized Building System (IBS), where fabrication and manufacturing are done off-site. The labor productivity can significantly increase as less foreign laborers will be required on-site for conventional construction activities. Similar to the above, less field coordination would be required on site;
In terms of post-construction maintenance, BIM can benefit parties that did not participate in the model, namely post-construction facility management. For example, building information is fed into the model, so the facility engineer can efficiently perform their work, without wasting time trying to understand the designs. Hence, this explained the reason why the Organization category was ranked second in terms of the positive impact on labor productivity.
Moreover, the challenges that hamper the adoption of BIM identified during the informal discussions are as follows:
Consultancy firms are one of the reasons that BIM adoption is lacking behind, as they are more concerned about the staff that they train with BIM skillsets leapfrogging to other companies. Therefore, they are more reluctant to waste costs and resources training the staff. Consequently, there is currently a lack of BIM-knowledgeable professionals across the AEC industry;
Fresh graduates are not exposed to BIM in their university courses. They have only limited or no experience working on BIM models in their first job. Therefore, companies need to spend time and resources training them after they join the company. As a result, they will not be contributing to any productivity until they are well equipped with BIM skillsets;
The effect of BIM is only evident when every discipline in a project is accessing the same model in a central repository. When a project is not BIM-compliant, and parties are not contractually obligated to adopt BIM, it will significantly undermine the overall effect of BIM. This mostly happens due to unsupportive contract forms for BIM-based collaboration, as the client or superintending officer of a project does not require the adoption of BIM within the contract itself.
In view of these challenges, the recommendations on accelerating the adoption rate of BIM in the Malaysian AEC industry given by the respondents are as follows:
CIDB should take the lead in BIM adoption by firstly enforcing all public sector/government projects to be BIM-compliant under tender requirements, mandating BIM e-submissions for projects higher than 20,000 square meters, and gradually increasing the need for instances of 5000 square meters;
Local universities should also expose students to BIM as part of their university studies. This way, they will be fully aware of these technologies before stepping into the working world;
The BIM objects of building projects should be reutilized to train the workforce involved in prefabricating and manufacturing building components;
Application of the Design for Manufacture and Assembly (DFMA) process in construction projects will significantly decrease the number of foreign laborers needed, while also creating more job opportunities for locals.
This study also proposes the acceleration of BIM adoption to solve the low labor productivity in the Malaysian construction industry, along with the four targets of CITP 2016-2020 [
7]. The CITP 2016-2020 suggests the utilization of modern construction methods and technologies by introducing initiatives such as the BIM platform to allow the open and accurate sharing of information; the establishment of a reference center to support BIM adoption in Malaysia; and the setting up of a national BIM guide and standard BIM library containing local manufacturer products, including IBS components. In addition, the CITP 2016-2020 intends to increase the labor productivity level by gradually decreasing the dependency on the low-skilled foreign workforce and increasing the local multi-skilled workforce through technical education and vocational training. Organizations are also encouraged to train and equip their employees with computer-aided specialized skills.
In conclusion, this research identified the areas of BIM that have an impact on labor productivity and may provide some useful directions for the construction industry to tackle the low productivity issues, as mentioned in the CITP 2016-2020 as part of the national agenda, in Malaysia’s construction industry.
6. Conclusions
The current research has investigated the impact of BIM on labor productivity in the AEC industry in Malaysia. The BIM-related labor productivity factors were categorized into the following categories: Individual (Supervision), Organization, Project, and Individual (Management). These were organized in descending order of their positive impact on construction labor productivity, as measured by the converted factor scores (
Table 6), while Individual (Labor) was the sole category with a negative effect on labor productivity. The Project category, however, was perceived as presenting a small area of improvement which could be achieved by AEC professionals. This is mainly because most respondents were from the middle and lower managerial hierarchy, and fewer decisions can be made at the project level to improve productivity. As the apparent benefits of BIM on labor productivity are significantly greater than the negative impact based on the study above, it is hoped that these results will serve as solid evidence for small and medium civil consulting firms to convert to BIM from traditional construction approaches.
However, further studies can be done to quantitatively evaluate the BIM’s impact on labor productivity through measuring the amount of productivity generated on-site, as more organizations are increasingly seeking empirical evidence to justify the cost of transitioning to BIM from traditional approaches. Tracking the actual productivity of a project is very time-consuming and cost-inefficient, so organizations generally forgo these processes. Therefore, a set of productivity measurement guidelines can also be formulated to effectively assess the construction productivity. In short, a lot of work and research still needs to be conducted in the future to accurately, effectively, and pragmatically evaluate the impact of BIM on construction labor productivity.


