Article

The Role of Glass Compounds in Autoclaved Bricks

1
Civil Engineering and Architecture Department, Kielce University of Technology, al.1000-lecia PP 7, 25-314 Kielce, Poland
2
Department of Civil and Environmental Engineering, University of California Los Angeles, 420 Westwood Plaza, Boelter Hall, Los Angeles, CA 90095, USA
3
Department of Materials Science and Engineering, University of California Los Angeles, 410 Westwood Plaza, Engineering V, Los Angeles, CA 90095, USA
*
Author to whom correspondence should be addressed.
Buildings 2020, 10(3), 41; https://doi.org/10.3390/buildings10030041
Submission received: 21 December 2019 / Revised: 18 February 2020 / Accepted: 26 February 2020 / Published: 29 February 2020
(This article belongs to the Special Issue Advances in Sustainable Building Material Engineering)

Abstract

:
This study describes the relationship between the physio-mechanical and chemical properties of sand-lime materials which have undergone hydrothermal treatment, and which were modified through the introduction of glass components (90% glass sand, GS). Process parameters such as temperature, pressure and saturation vapor pressure were found to have a significant impact on the series of chemical reactions as well as on the formation and transformation of solid hydrates. During the stirring process of sand-lime mass, the temperature of the reaction between lime and water in the presence of quartz sand (QS) was determined to be 83 °C. In the presence of glass sand, measured temperature was only 42 °C. Thermodynamic equilibrium-based modelling was applied to predict stable phase assemblages in the studied systems. It was found that compositional modification along with the application of the autoclaving process resulted in the formation of two crystalline phases: natrolite and gyrolite. Compressive strength and density were also assessed. The strength of fresh laboratory samples was found to be greater than their traditional analogues by 15 MPa. In addition to experimental characterization, sand-lime materials were also modeled using neural networks (backpropagation neural network, BPNN) which serve as a universal approximation method capable of modelling complex functions.

Graphical Abstract

1. Introduction

The construction industry has a special impact on the terrain and environmental changes in the areas where it is incorporated. The production of building materials is currently directed towards recycling and sustainable development. This incentive is largely associated with global climate changes, which are increasingly noticeable, and which have been clearly visible since the beginning of 2019 (frequent fires, rains, anomalous floods and droughts in Europe which is the result of a rise in temperature climate changes) [1,2]. Many solutions propose approaches in which they focus on the reduction of heat loss from buildings. Sustainable construction is also considering paths leading to the reduction of the depletion of natural resources through e.g., the use of passive systems in buildings [3,4,5,6,7]. Mainly concrete and monolithic construction is the most commonly used building method in the world [8,9]. For example, the current level of cement production is around 4.2 B tons (2018) which allows to produce over 30 B tons of concrete [10,11]. The autoclaved aerated concrete (AAC) is followed by autoclaved bricks, and finally wood and other materials [6]. One of the most popular additions (especially to concrete) to reduce the amount of cement is fly ash (as a critical material for partial replacement of portland cement). Oye and all shown that fly ashes hosting glasses with a high network ratio are more reactive than others [12]. Another addition with an amorphous structure is glass sand (GS) from cullet glass [13]. For the past few years, the introduction of recycled glass into construction materials has been proposed as one of the ways of utilizing this type of waste material. For that reason, this research investigates the fate of glass in sand-lime bricks, which are formed under hydrothermal conditions. This type of brick has been utilized for over 140 years [6,14]. The breakthrough moment for the development of silicate production technology was in 1880 when German scientist W. Michaelis invented and patented the technology of “white brick” production (“The method of producing artificial sandstone”) [15,16,17]. These types of materials commonly called “silicates products” are construction materials which can provide a solid structure and comfortable interior microclimate. In addition, they can also promote sustainable environmental technologies [18,19]. Khomchenko and Semeykin [20] have developed a method for improving the efficiency and safety of the production of autoclaved materials with lime. As part of the scientific work on improving the quality of autoclaved products, an additive (copper sulphate) was found, which makes it possible to slow down the lime hydration time in the binder for several hours [20]. However, despite of technological progress, this material has not undergone significant modifications over the past decades. The microstructure and structure of this type of material also has not been thoroughly investigated. The production of brick itself is from the process standpoint is very similar to AAC but differs from traditionally produced concrete because it is manufactured under hydrothermal conditions (200 °C). As such in AACs, crystalline phases such as tobermorite are formed [21,22] contrary to nearly amorphous calcium silicate hydrate gel (known as C-S-H) which is found in traditional concrete hydrated at ambient or sub-ambient conditions. Because of these mineralogical changes, this study focuses on the relationship between the physio-mechanical and chemical properties of sand-lime materials which undergo hydrothermal treatment (autoclaving process) and which were modified through the introduction of glass components (GS). Due to structural and textural differences as well as the grain surface and contact surface between individual grains, information on the formation (or its lack of) of bonds is important in developing an understanding regarding the physio-chemical nature of these materials [23].
In addition, this work considers thermodynamic properties of mineral components and phases forming in the sand-lime composite. For this purpose, a simulation using a geochemical thermodynamic equilibrium-based program has been used [24,25]. An important innovative aspect of the research presented herein stems from the fact that to produce traditional bricks, crystalline quartz sand (QS) is used, and during the modification process described in this study, recycled glass sand with an amorphous structure was adopted. This sand shows greater reactivity as compared to the materials which exhibit crystalline structure. The microstructure brick considered in this study comprises a majority of hydrated calcium silicates (C-S-H phase, tobermorite, jennite etc.) which is analogous to what we observe in hydrated cement mortars [26]. Process parameters such as temperature, pressure and saturation vapor pressure have a significant impact on the series of chemical reactions as well as on the formation and transformation of solid hydrates. Phase transformations are governed by thermodynamic and kinetic processes hence influencing the production process of this specific building material. Thermodynamic relationships are known to be generic and can be applied to nearly any material regardless of the type and structure of the examined object, hence were considered in this study.
Emphasis was put on ecology and recycling of materials through the utilization of broken glass present in the form of glass sand. This sand exhibits amorphous structure in sand-lime bricks, which are known to be poor in lime content (CaO not more than 10% by mass). The use of glass components which are high in sodium can result in the formation of phases such as natrolite and gyrolite. Literature discloses that gyrolite may also occur without sodium substitution. To date recycled glass has been mainly used to modify concrete [27,28,29]. It has been reported that the first attempts to use glass in concrete took place in 1973, but due to the lack of information on the long-term behavior of concrete modified in this way and the lower technological development at that time, this research was discontinued [30,31]. Taha and Nanau along with others [29,32,33,34] concluded that the alkali-silicate gel (ASR) formation takes place in concrete only in the presence of a sufficient amount of calcium ions (Ca2+), which means that the silica in the reactive aggregate will simply dissolve in alkali-hydroxide solution, and will not be available to form any alkali-silicate gel and expansion due to ASR can be reduced. In addition, concrete containing addition of glass powder (GP) as a binder shows very low permeability to chloride ions.
The northeastern Canadian province of Quebec has a policy on waste management which promotes recovery and management of materials from the industrial sectors, therefore favoring a sustainable economy [35]. Their research showed that in concrete which contains 70% SiO2 prepared with a water-binder ratio (w/b) of 0.40, the replacement of 20% by mass of cement by glass powder (GP, finely ground glass cullet in the form of flour) delayed cracking of the concrete cover and slightly improved the load-carrying capacity and the post peak response for columns tested at 28 days. Kumar, Raju and others have shown in their research that glass waste when ground to a very fine powder shows pozzolanic properties and, therefore, can be used as a partial replacement for cement in concrete [36].

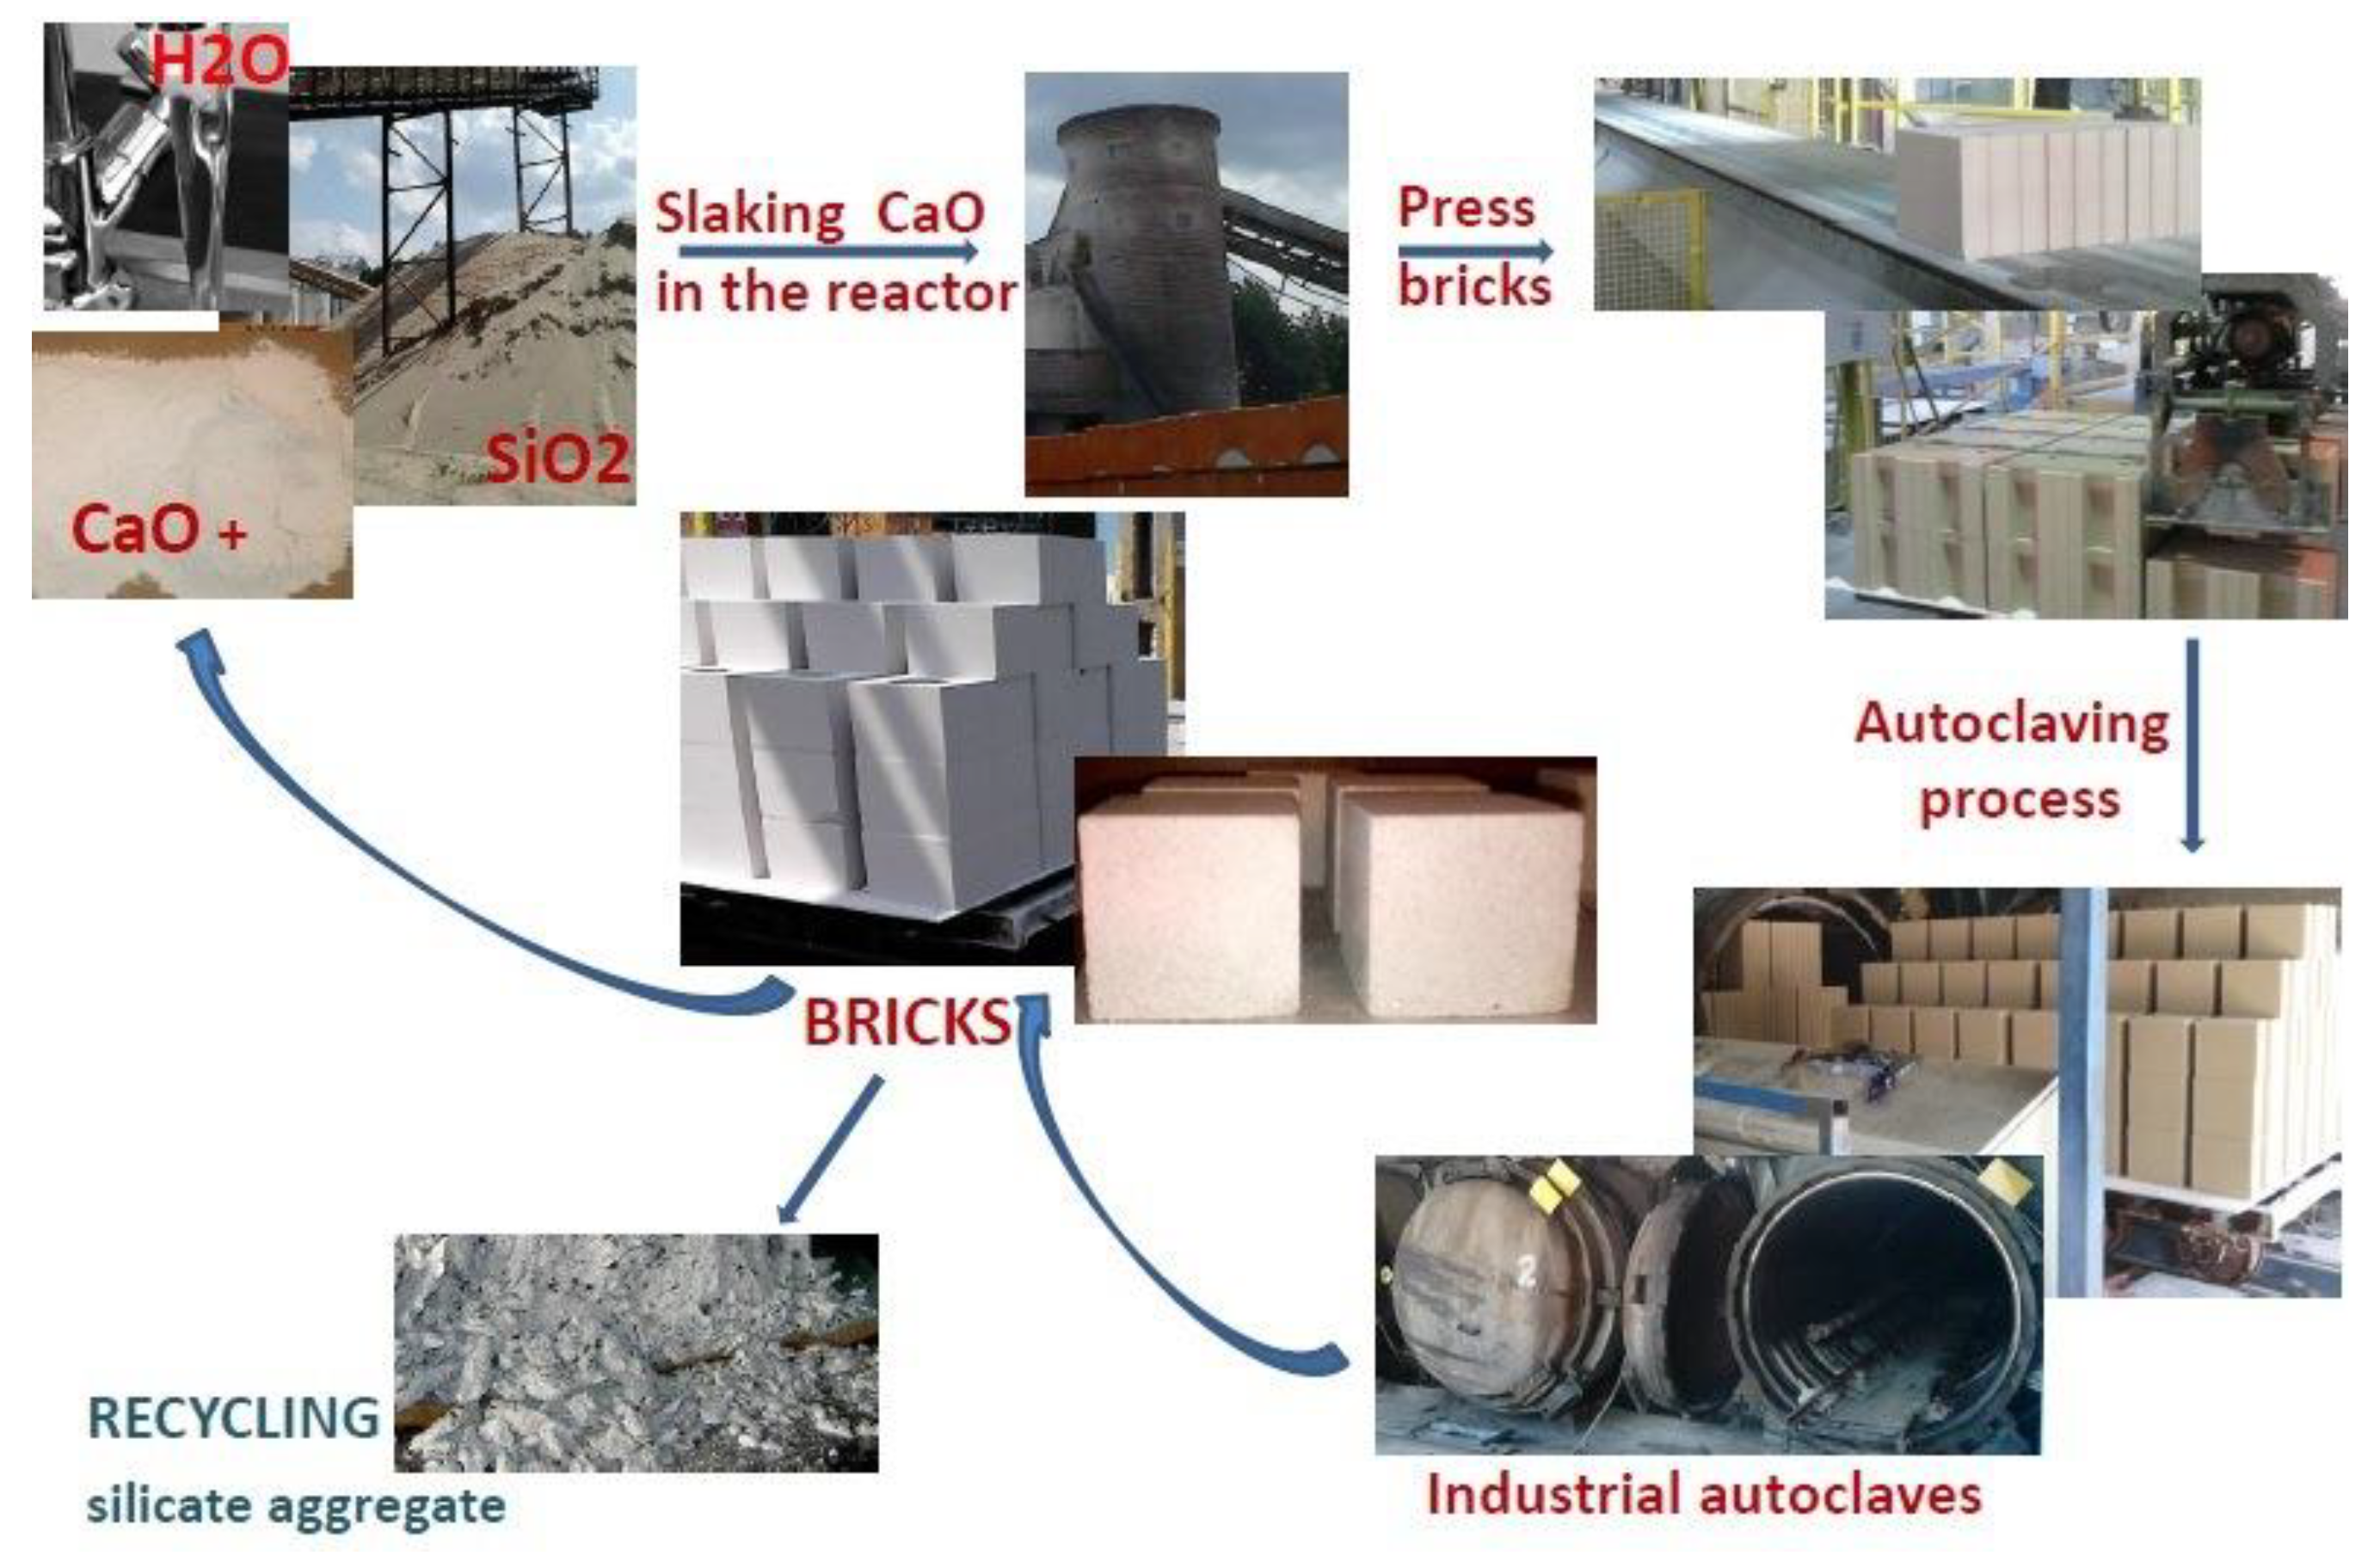
2. Autoclaving Process during the Industrial Production of Traditional Sand-Lime Bricks

Traditional industrially prepared sand-lime bricks consist of quartz sand (90 wt% SiO2), lime (7 wt% CaO) and water (3 wt% H2O). The lime quenching process and the resulting formation of chemical bonds ensures their durability. In the autoclaved materials, chemical processes which occur when the product is exposed to hydrothermal conditions (200 °C and 1.6 MPa pressure) are essential. Autoclaving induces increases in pressure and temperature as well as variations in humidity. As such in order to be able to determine links between mechanical properties and the physio-chemical changes in these materials a series of chemical and microscopic analyses (including microstructural analysis) were performed. The sand-lime mass is mixed with water and then placed in steel silo tank reactors. It is then left in the reactors for approximately 2 to 4 h, where the process of slaking lime takes place, accompanied with an increase in temperature to around 60 °C. This elevated temperature also facilitates the subsequent formation of reaction products. Subsequently, the sand-lime mixture is directed to the press (hydraulic press), in which it is compressed at a pressure of 15–20 MPa (bulk density is estimated at the level of 1.7 kg/dm3) and formed into blocks of suitable size and shape. Water absorption of this type of brick is at the level of 16% in relation to the product’s weight (for other materials it is estimated at 24% [37,38]). In the final phase, the compressed bricks are placed in autoclaves and subjected to a hardening process at a temperature of 200–203 °C and pressure of 16 bar (1.6 MPa). The hardening process takes about 6–12 h (it depends on the class of bricks, but usually 1 + 8 + 1 pattern means: 1 h of heating + 8 h of autoclaving + 1 h of cooling) [6]. The traditional sand-lime brick production flow is shown in Figure 1.
Silicate brick is an artificial stone, which is formed from natural substrates, therefore after use it can be ground or crushed and reused in the form of silicate aggregate (Figure 1). The autoclaving process during the preparation in laboratories is reduced to 5 h, usually due to limitations of autoclaving instruments adapted for laboratory purposes. Because of that fact, some properties of bricks prepared in a laboratory may differ from those prepared on the industrial scale (enough autoclaving time may not be maintained). The compressive strength of laboratory samples reaches the average level of 10 MPa and it also depends on the composition and amount of additions with a crystalline and amorphous structure (the biggest difference in comparison with industrially manufactured traditional sand-lime brick samples for which compressive strength reaches 15 MPa). The density of a laboratory manufactured specimen is at a similar level of 1.66 kg/dm3 (in comparison with the industrial product: 1.7 kg/dm3) and the water absorption is estimated at 15%.

Calcium Silicates Hydrates Formation under Hydrothermal Conditions

In hydrated cements roughly 60%–80% of the volume of the solid formed comprises of the hydrated calcium silicate phases abbreviated as C-S-H. Many studies have been conducted to develop understanding of the structure and properties of C-S-H [39,40,41,42]. Interesting analysis were carried out by Constantinides and Ulm [43], who tried to describe the C-S-H phase in terms of low ((LD) C-S-H) and high density ((HD) C-S-H) products. That research has shown that both phases exhibit a unique nanogranular behavior which is driven by particle-to-particle contact forces rather than by mineral properties [43].
Thomas and Jennings [44] claimed that the C-S-H gel forms a continuous layer that binds the cement particles together (Figure 2). All other hydration products form separate crystals that are intrinsically strong but do not form strong connections with the solid phases they are in contact with. It follows that these products cannot significantly contribute to the overall strength of the material. As such C-S-H is the main contributor responsible for the strength increase in hydrated cement.
Due to the autoclaving process employed in the sand-lime brick production process, the situation about mineralogy and hence microstructure of forming solids is slightly different as compared to hydrated cement and concrete. This type of brick is made of low lime (7 wt% CaO), quartz sand (90 wt% SiO2) and water (3 wt% H2O). As such, due to the low calcium content and the hydrothermal conditions, C-S-H (Equation (1)) formation in sand-lime bricks is minimal, and crystalline analogue of low calcium C-S-H known as tobermorite is produced. It has been reported that when C-S-H is subjected to elevated temperatures it transforms crystalline phases such as tobermorite (with low lime content), jennite (with a higher lime content are predicted to form [45,46]. Equations (1)–(3) and Figure 1 below show the basic reactions that occur during the hydration of lime in the process of silicate brick production. (Transformation of the C-S-H into crystalline analogue is anticipated at elevated temperatures > 85 °C).
CaO + H2O + SiO2 => C-S-H
Ca(OH)2 + CO2 (from air) => CaCO3 + H2O
CO2 + CaSiO3 => CaCO3 + SiO2
In addition, due to the elevated level of sodium (Na) in glass materials used for brick manufacturing a phase called gyrolite has a potential to form [47,48,49,50].

3. Methods and Materials

Basic examination methods included chemical and microstructural analysis of the materials which contain low lime content (maximum 10% by mass) and are abundant in silica (approximately 90% by mass) and which were modified with broken amorphous glass containing higher levels sodium. Tests in this study were carried out according to the CEN standards: PN-EN 772-13: 2001, CEN. PN-EN 1996-2, CEN. PN-EN 771-2 as described in [51,52,53]. Physical and mechanical tests were conducted for samples (30 days after production) containing glass components in the range of 0–90 wt% GS (glass sand) as shown on Figure 3 and Figure 4. For the microscopic examinations, samples with 0 wt% GS and 90 wt% GS were used.
Particular attention was directed towards investigation of crystallization processes and phase formations, which are believed to be connected to the loss of water in the material during the autoclaving process (so-called path regulated by thermodynamic phase stability).
A series of physical and mechanical characterizations was carried out applying X-ray diffraction (XRD), scanning electron microscopy (SEM), geochemical modeling (GEMS), and artificial neural network (ANN) analytical methods.

3.1. Preparation of the Artificial Neural Network (ANN)

The determining the properties of sand-lime materials were predicted in this research by using neural networks.
ANNs, due to their mode of action, are very effective in the analysis of the problem of prediction. In this paper a backpropagation neural network (BPNN) was applied. This type of network is often presented as a universal approximator capable of modelling a function with any complexity law. Modelling using BPNN is an iterative search of a non-linear relation in considered model, using the given data set [54,55,56,57,58,59]. The ANN method was chosen because this method can be used as a model to develop tools capable of predicting moisture and other properties of material, and which can account for nonlinearity and the complex interactions between input and output variables in kind of bricks considered herein. Before starting the prediction, it is necessary to initially determine the architecture of neural networks. The alignment criterion for learning and testing errors was used to assess the quality of the network. During the ANN formulation, the mean square errors (MSE) and relative errors were checked. After preliminary calculations, the network with only one hidden layer was accepted. The architecture of such a network can be written schematically as: BPNN: X-H-Y, where X means number of inputs (arguments of the functions sought), H means the number of neurons in hidden layer, and the Y is the output (single or multi-element) from the network. The log-sigmoid transfer function according to the Formula (4) was assumed for hidden layer neurons and linear function in the output layer:
log sig(x) = 1/(1 + exp(−x))
Defining the network was carried out off line using Neural Network Toolbox, working in the MATLAB computing environment. For the learning the pseudo-gaussian Levenberg–Marquardt method was applied [48]. In the analyzed task, the input vector (x) to the network was the percentage level of GS in the sample. At the output, parameters such as: compressive strength (δ), bulk density (γ) and humidity (W) were computed. The network was formulated with the samples obtained from the laboratory tests. 80 learning and validating (l) patterns and 40 patterns for the testing (t) of PBNN network were extracted. After the preliminary calculations, for a further analysis, the BPNN:1-6-3 was accepted, see (Figure 5a). The following errors were obtained for the prepared network: mean squared error—MSE = 0.0061, average relative error—ARE = 2.36.
The linear regression coefficient r was computed for every set of pairs. Figure 5b shows the correlation of parameters (δ, γ, W), computed through ANN and values from laboratory tests. This correlation is close to unity.
These error values validate that the network has been formulated correctly and can generalize the characteristics of silicate material.

3.2. X-ray Diffraction (XRD) Analysis

Qualitative phase analyses of the pastes at different reaction times were obtained through X-ray powder diffraction, using a D8 DISCOVER diffractometer in a θ-θ configuration and Cu-Kα radiation (λ = 1.54 Å). Samples were placed in a rotating sample holder and scanned from 5° and 70° (2θ) in continuous mode with an integrated step scan of 0.021° using a VANTEC-1 detector. The acquisition time for a full scan was ≈11 min. A fixed divergence slit of 1.00° was used during data acquisition. X-ray structure data for the anhydrous and hydrated crystalline phases was sourced from the literature or standard databases. In this way, samples modified by glass sand were tested (after 26 months from the date of production).

3.3. Thermodynamic Equilibrium-Based Modelling

Thermodynamic calculations were carried out using GEMS-PSI software package [60,61]. GEMS is a broad-purpose geochemical modelling code which requires as input a bulk elemental analysis and uses Gibbs energy minimization to compute equilibrium phase assemblages and speciation. Chemical interactions involving solids, solid solutions, and aqueous electrolyte can be calculated simultaneously. A standard GEMS database of minerals amended by the cement database was used for simulations presented in this work. Thermodynamic data for gyrolite, natrolite and xontolite were taken from [61,62]. All calculations assumed CO2-free conditions.

3.4. Scanning Electron Microscope (SEM)

Microstructural characterization and elemental analysis of the samples were performed using the FEI Nova NanoSEM 230 scanning electron microscope with field emission gun and variable pressure capabilities, equipped with a Thermo Scientific NORAN System 7 X-ray energy-dispersive spectrometer (EDS). Morphological and topographic characteristics of the surface were recorded using the low-vacuum mode (LVD) and secondary electron detector (SE). Elemental spectra and maps of characteristic X-ray photon emissions were acquired using EDS.

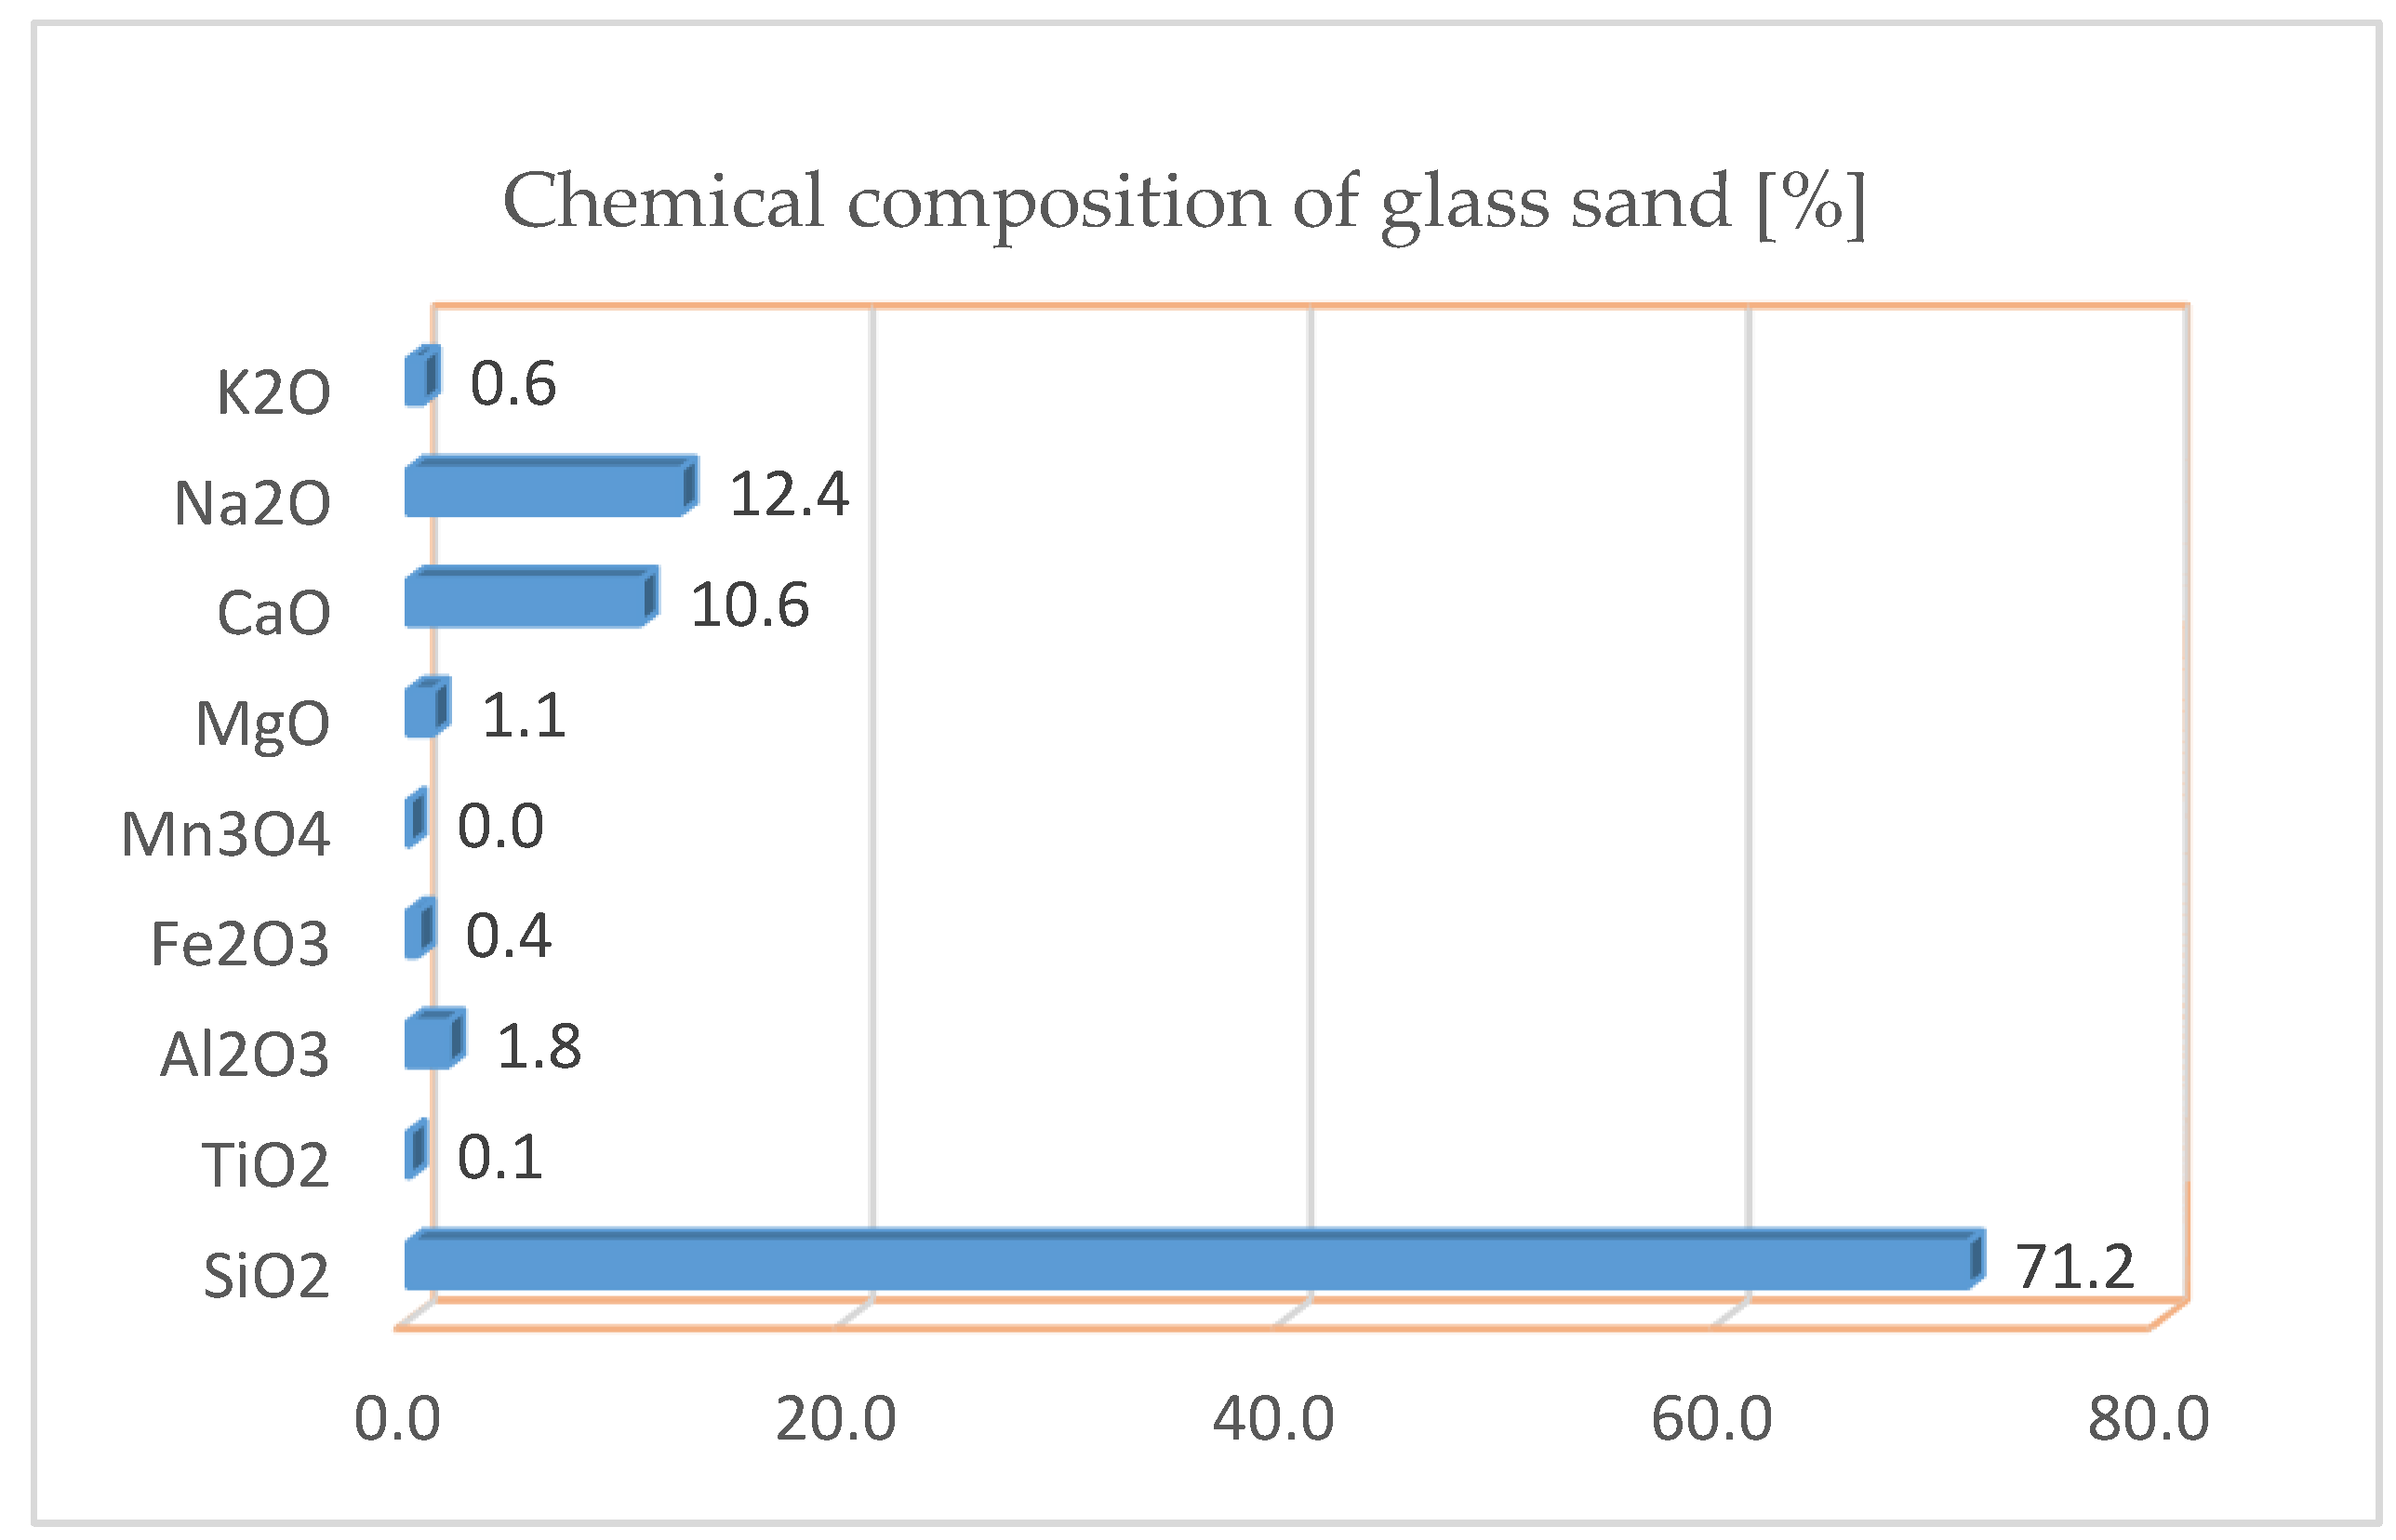
3.5. Quartz Sand ‘QS’ and Glass Sand ‘GS’

Traditional silicate mass prior subjection to compositional modification comprised of SiO2 (90 wt%), CaO (7 wt%) and H2O (3 wt%). The QS used in the process exhibited a grain size in a range 0–2 mm (90% relative to the weight of the product). Approximately 50%–60% of the 90 wt% of sand fell within a range of grain size of 0–0.5 mm, and the remaining 30%–40% within grain size 0.5–2 mm. For the modifications of the bricks, clean ground GS from recycled wine bottles (with a grain size ranging 80–160 μm) was used.
The main components of the glass sand were determined to be: SiO2, Na2O, CaO, Al2O3, (composition presented on Figure 6) which under the influence of elevated temperature were expected to contribute to the formation of phases such as natrolite and gyrolite. The reactivity of minerals and additives in building materials increases as a function of decrease in grain size and an increase in the amorphous phases content. The latter one is related to the thermodynamic metastability and hence greater reactivity of amorphous contents as compared to crystalline phases. As such amorphous or nearly amorphous materials are an excellent addition to concrete (e.g., fly ash) due to their ability to contribute to strength development through pozzolanic reaction [63]. Thermodynamic databases used in the recent years have been mainly applied for traditional and modified concrete materials, and in their current form there is insufficient information to account for the hydrothermal treatment (autoclaved concretes, sand-lime bricks). For this reason, in this work it was sometimes difficult to estimate and compare the exact empirical data with thermodynamic simulations. However thermodynamic models even considering their limitations still can serve as useful generic approaches capable of providing guidelines towards optimizing the composition of building materials.

3.6. Hydrothermal Conditions and Laboratory Conducted Autoclaving Process

Traditional silicate products produced in this study consisted of sand, lime and water. First, sand-lime mass was mixed and then placed in a steel device similar as the reactor, where it was left for around 4 h, for the process of line slaking to take place.
A formula approximating the pressure increase in relation to the temperature is shown in Formula (5).
p = −0.0695 + 15.55 × 10⁻⁹ × T4,
where: p—pressure, T—temperature (°C).
In this case, to determine the numerical coefficients the least squares approximation was used. Sets of base functions were selected by the trial-and-error technique.
This was accompanied by an increase in temperature to around 60 °C. After that, the sand-lime mass was directed to the press (one-sided pressing in laboratory conditions), in which it was compressed at a pressure of 15–20 MPa, and formed into the small bricks of the size 5 × 5 × 5 cm. In the final phase the compressed blocks were placed in autoclaves and subjected to a hardening process at the temperature around 200 °C accompanied by pressure increase as shown on Figure 7. The autoclaving process was scheduled as follows: 1 h of heating up to 190 °C + 5 h autoclaving process in a temperature of 200 °C + 1 h or more cooling.
During the stirring process of sand-lime mass, the temperature of the reaction between lime (CaO) and water in the presence of QS was determined to be 83 °C. However, in the presence of glass sand (90% GS) measured temperature was only 42 °C. The sand-lime mass based on glass sand reacted similarly to the clay materials in terms of behavior during stirring and absorption of water. Reactions occurring in samples during the 5 h long autoclaving process at the temperature of 200 °C and pressure 1.6 MPa are shown above (Formulas (1)–(3)).

4. Results

Compressive strength, impregnability and bulk density of the autoclaved silicate products were measured according to the CEN standards (European Committee for Standardization): PN-EN 772-13: 2001, CEN. PN-EN 1996-2, CEN. PN-EN 771-2 [51,52,53].

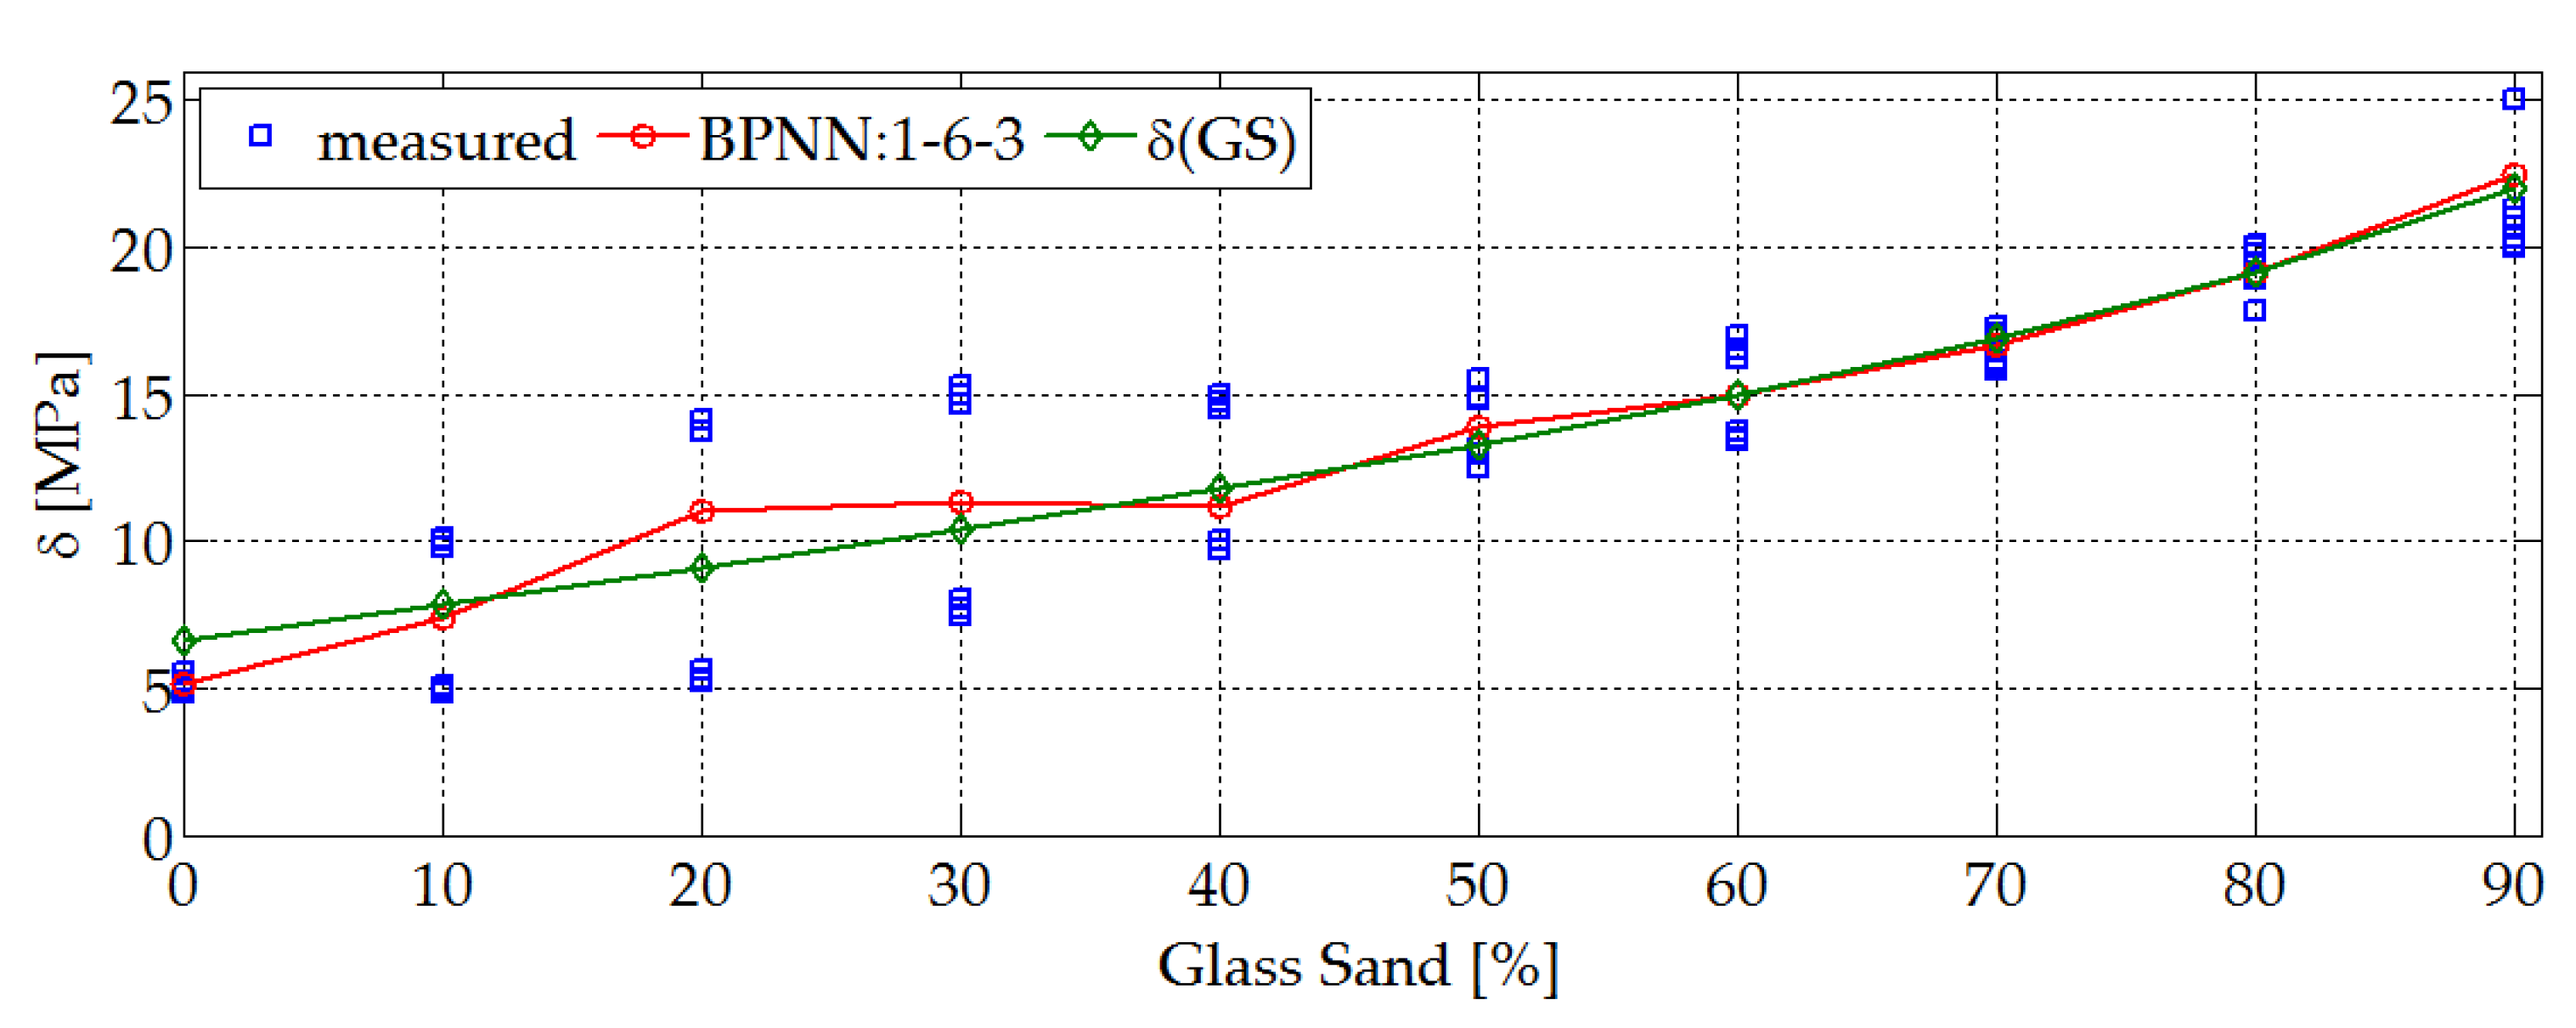
4.1. Physical and Mechanical Properties. Research and Prediction of Characteristics of Sand-Lime Bricks Using Neural Networks

Below, Figure 8, Figure 9 and Figure 10 show the results (measured as well as predicted using BPNN:1-6-3 neural network) and changes in the compressive strength (δ), bulk density (γ) and humidity (W) respectively, as a function of glass sand content.
In order to compare the efficiency of the BPNN network for the prediction of the material parameters, traditional approximation of the obtained results was also made. The following formulas have been developed to estimate material parameters:
  • compressive strength,
δ ( GS ) = 6.622 + 12.1788 tan ( GS 100 ) ,
  • bulk density,
γ ( GS ) = 1.6934 + 0.0036 GS 5.26 e 5 GS 2 ,
  • moisture content,
W ( GS ) = 0.4961 + 2.3221 sin ( GS 100 ) .
The coefficients of the functions which approximate the sets δ(GS) (6), γ(GS) (7) and W(GS) (8) were determined using the least-squares method, while the selection of the combination of the base functions was carried out using the “trial and error” method.
The compressive strength δ (Figure 8) for the material with QS was around 6.5 MPa, and for material with GS around 20 MPa. The compressive strength for bricks manufactured on an industrial scale is 15–20 MPa. Compressive strength increased with the increase in the share of GS. This is an interesting observation since the hydration temperature of lime with the increasing share of GS (amorphous glass sand) was lowered, hence it can be deducted that hydration of lime during the production of autoclaved bricks provided adequate chemical bonds, and as a result strength of bricks increased. It should be also noted that calcium hydroxide shows retrograde solubility with respect to the temperature, so it is possible that at this lower temperature more calcium ions were released upon dissolution and available for the reaction to form hydrates. From the rheological standpoint the mass containing GS had the consistency of clay.
Compared bulk density (γ) values of traditional and modified sand bricks did not show significant differences. The recorded change was only 0.5 kg /dm3 on average. Bulk density level for bricks with 90 wt% QS was around 1.7 kg/dm3, and for bricks with GS was 1.6–1.65 kg/dm3 (Figure 9).
Humidity (W) increased with the increasing percentage of GS in silicate mass. Certainly, the higher humidity of the new material is related to the properties of cullet and may indicate lower water absorption (Figure 10).

4.2. Structure and Microstructure

Calcium silicate hydrate often abbreviated as the C-S-H phase is a dominant phase forming in cementitious systems at room temperature. Depending on the initial composition of cement clinker (C3S and C2S contents) hydrated cement roughly contains 60%–80% C-S-H. Calcium silicate hydrate xCaO⋅SiO2⋅yH2O is a poorly crystalline thermodynamically metastable product of variable composition in terms of its H2O/SiO2 ratio and Ca/Si molar ratio. It forms a gel that is nearly X-ray amorphous and is responsible for the development of strength in Portland cement. At elevated temperatures C-S-H transforms into thermodynamically stable crystalline phases such as tobermorite, jennite, afwillite, xonotlite or hillebrandite [46]. As a result of high temperature during the autoclaving process, it was anticipated that the C-S-H phase presence will be minor. Due to the low lime content and high silica content in the samples crystalline phase exhibiting low Ca/Si ratio such as tobermorite was be expected. The system CaO-SiO2-H2O was created as the result of the reaction of lime, SiO2 source and water in the studied system. However, it should be noted that tobermorite is a hydrated silica with ordered structure. Amorphous phases, such as C-S-H show larger specific surface than crystalline phases. The more ordered the structure is, the smaller the specific surface. In autoclaved products modified with glass components, where the presence of sodium element (Na) is observed, phases different than C-S-H, tobermorite such as xonotlite or gyrolite have a potential to form. As such elevated temperature can alter phase balances and kinetics of phase transformations. For that reason, the presence of another phase otherwise rarely seen at room temperature due to its slow precipitation known as natrolite [24] can also be observed in the studied systems. From this perspective, sand-lime products have not been studied yet. It may be associated with the fact that not many scientists working in the field of bricks focus on the materials containing very little calcium. The amount of CaO oscillates between 3 and 10% by weight in the sand-lime mass.

4.2.1. XRD of Traditional Sand-Lime Laboratory Sample

The structure and phase compositions were examined via the XRD and SEM analyses. First, a test was carried out for the reference sample containing QS (Figure 11), and then for the sample modified with GS (Figure 12). The XRD test also collected fragments of material up to 1 cm in size from the same laboratory bricks, and then they were ground to powder form. Samples are derived from the same laboratory bricks. The area of the sample was swept by electron probe under voltage of 5–50 keV. Based on the images obtained, the analysis of the microstructure and different phase composition of the tested products was possible. The modifications of the bricks were used: quartz industrial sand and GS. The phase analysis (X-ray diffraction analysis measurements of powdered samples were conducted with Empyrean PANalytical diffractometer using Ka radiation from Cu anode) of the traditional brick and brick modified by sand glass samples (after 2 months from initial production) have been measurement in the 5–70° range of 2θ Qualitative identification of the phase composition of the samples was performed with reference to the ICDD PDF-2 database (The International Centre for Diffraction Data (ICDD)) [64].
The table below presents XRD files used for characterization of reference sample containing QS. The following phases and minerals were present in a traditional brick sample: tobermorite 9A, SiO2 (α) and calcium aluminum silicate.

4.2.2. XRD for Laboratory Brick Sample Modified by Glass Sand (90% GS)

In a sample modified with GS, the following minerals were found to be present: tobermorite, gyrolite and natrolite.
Amorphous materials can crystallize over time (this process can be accelerated after ensuring appropriate conditions, e.g., high temperature Figure 12a,b), because they are thermodynamically metastable materials. This is the case with samples containing amorphous sand, hence observable changes in the microstructure and structure of the materials tested were noted. Spectra at the peak around 30 degrees in Figure 12b is amorphous silica.

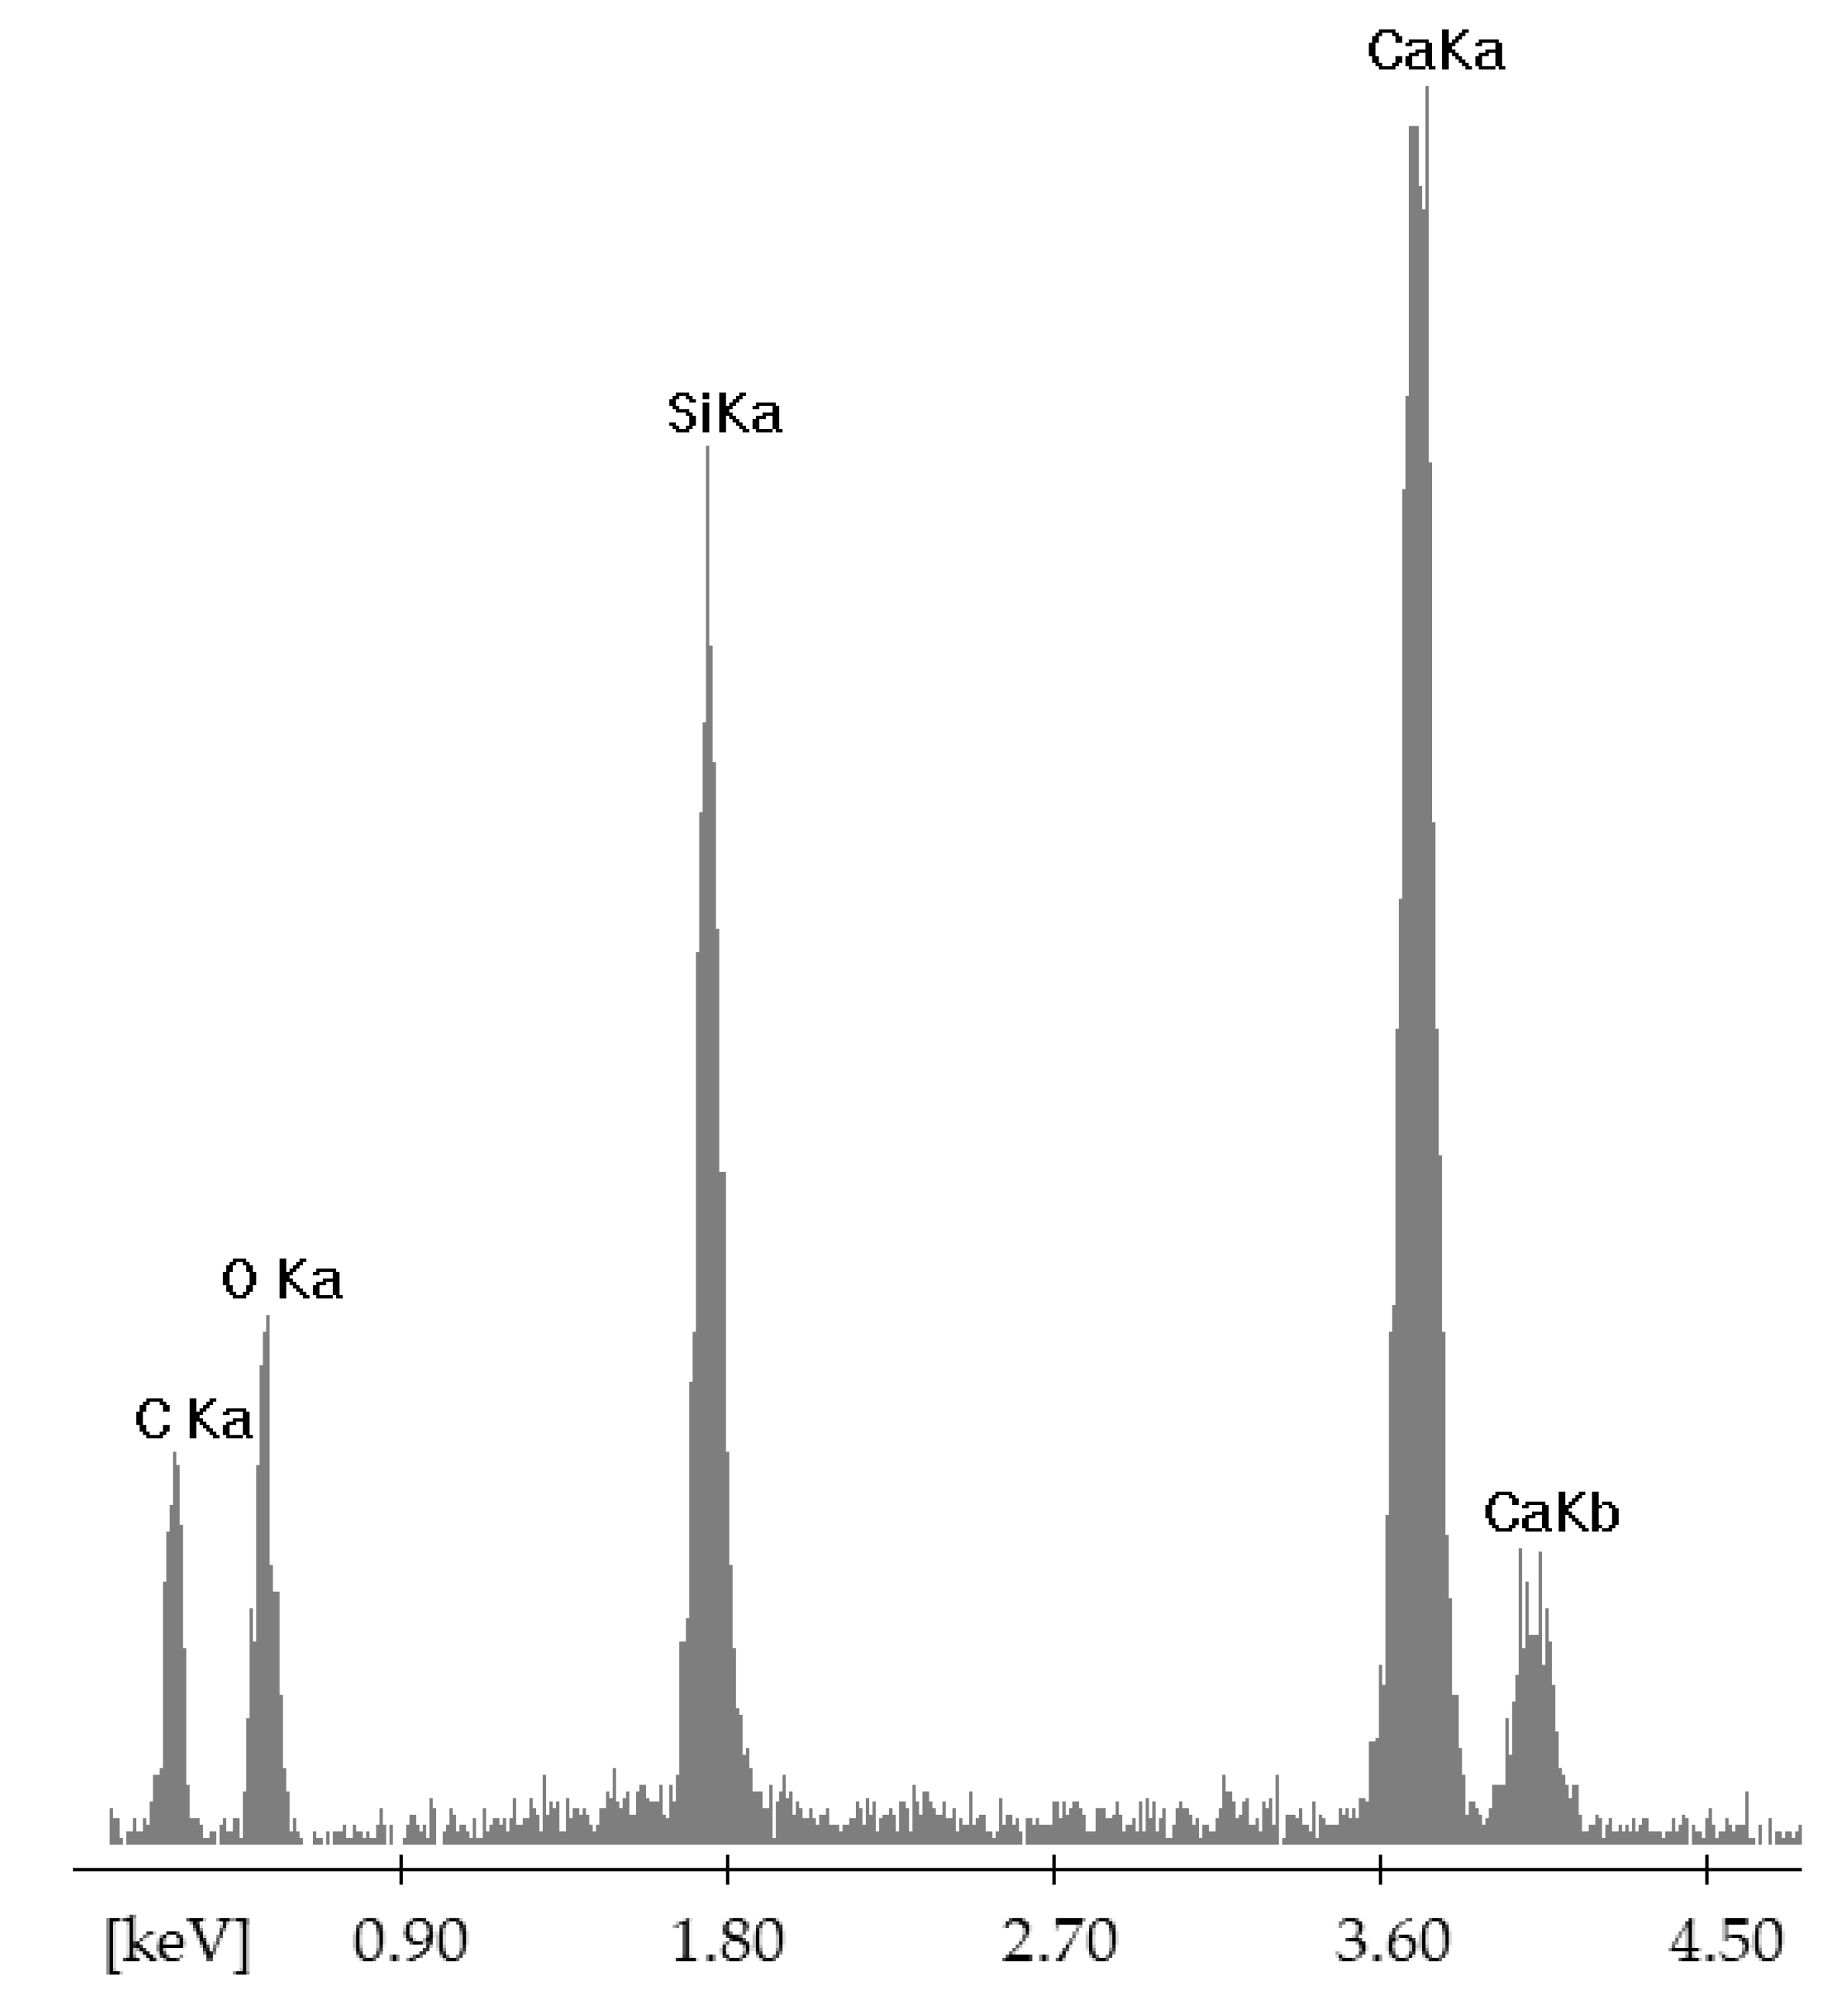
4.2.3. Scanning Electron Microscopy (SEM) of Traditional Sand-Lime Bricks

Images (Figure 13 and Figure 14) below present the microstructure of samples of sand-lime products.
Traditional sand-lime products disclosed presence of calcium silicate mineral with tobermorite-like structure and the C-S-H phase. The creation and frequency of the occurrence of structures are connected with the quality of the components used and their chemical reactivity.
Figure 15 and Figure 16 show EDS spectra obtained for traditional (reference) sample containing QS tested at 2 points.

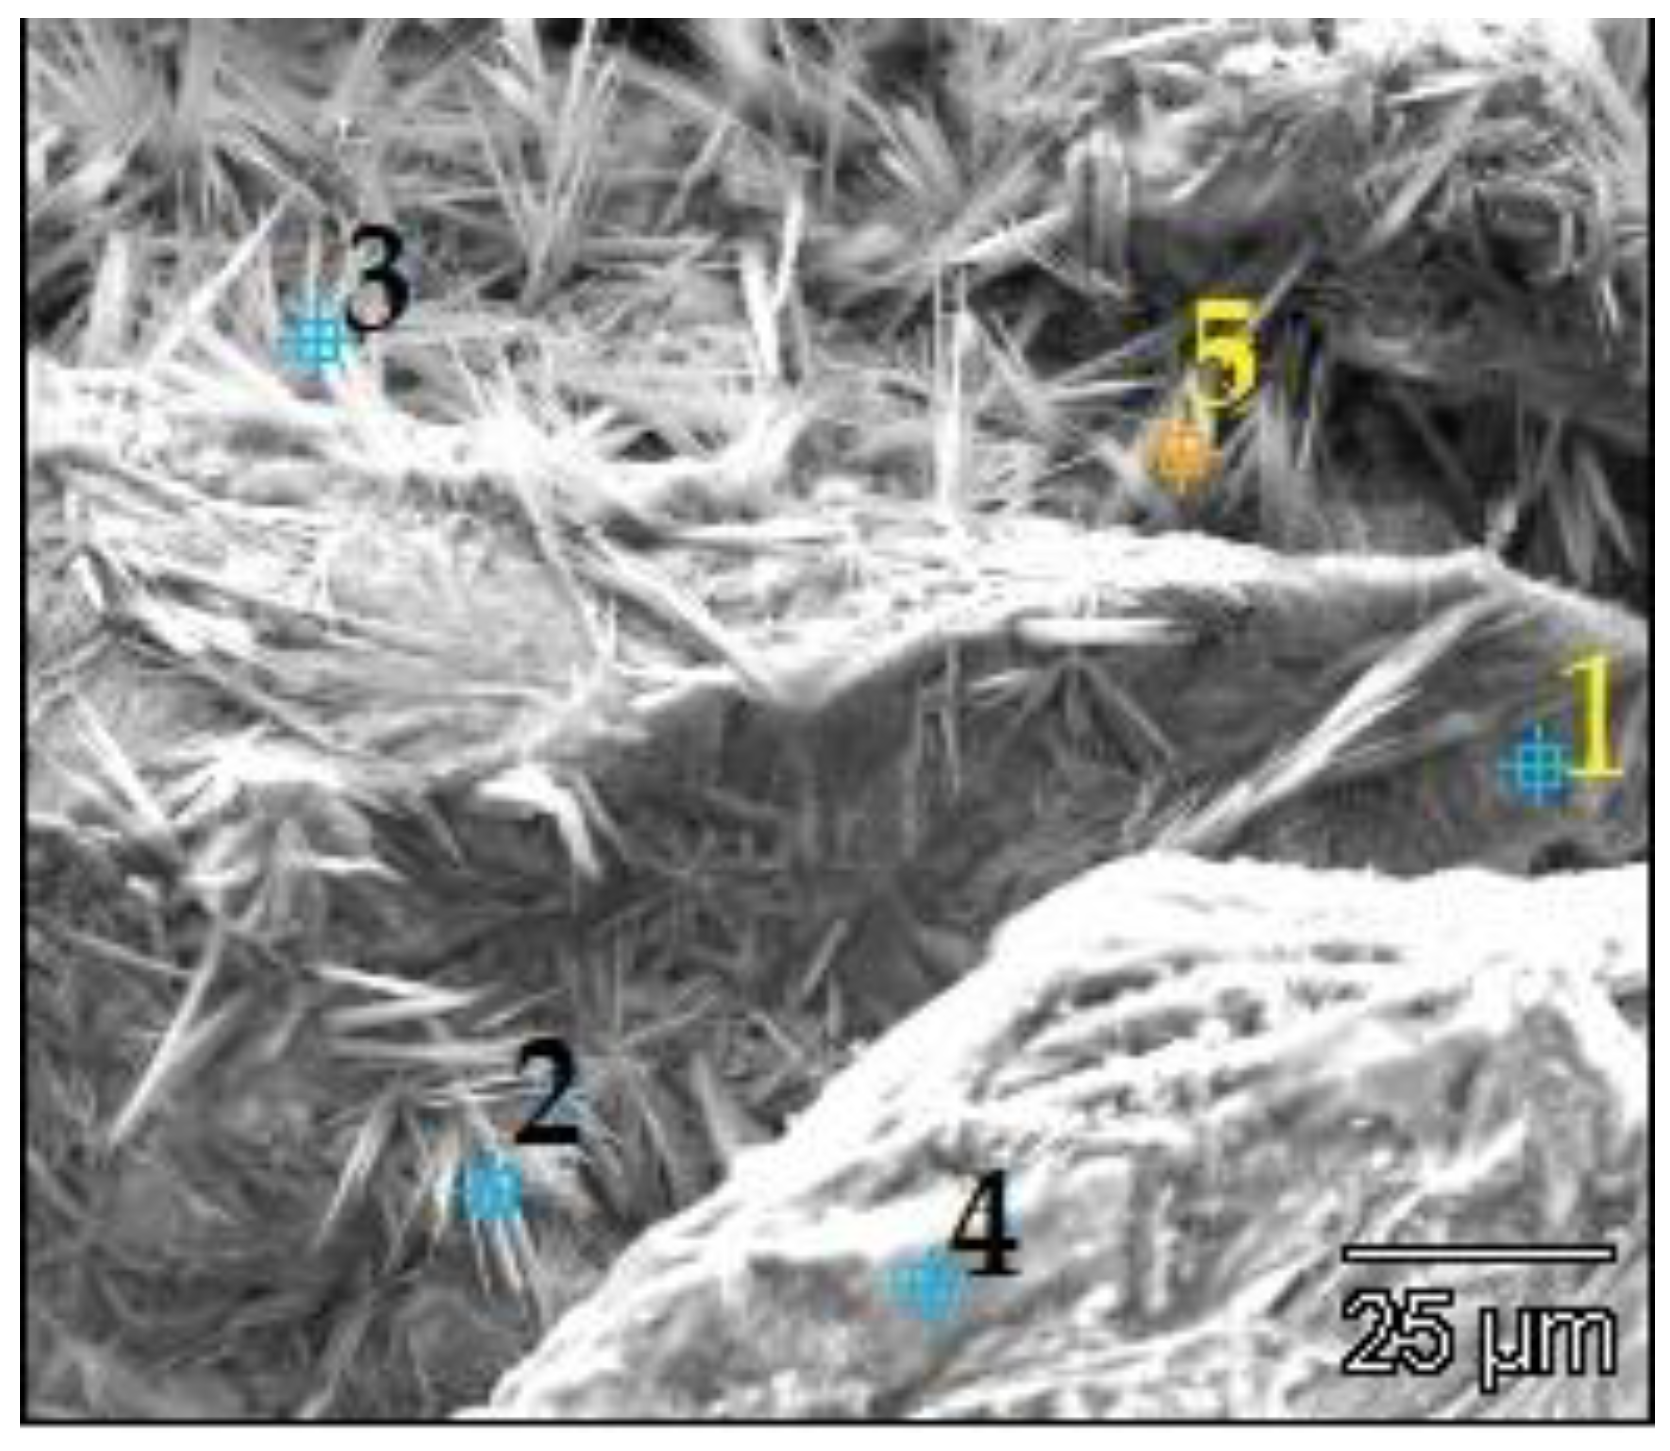
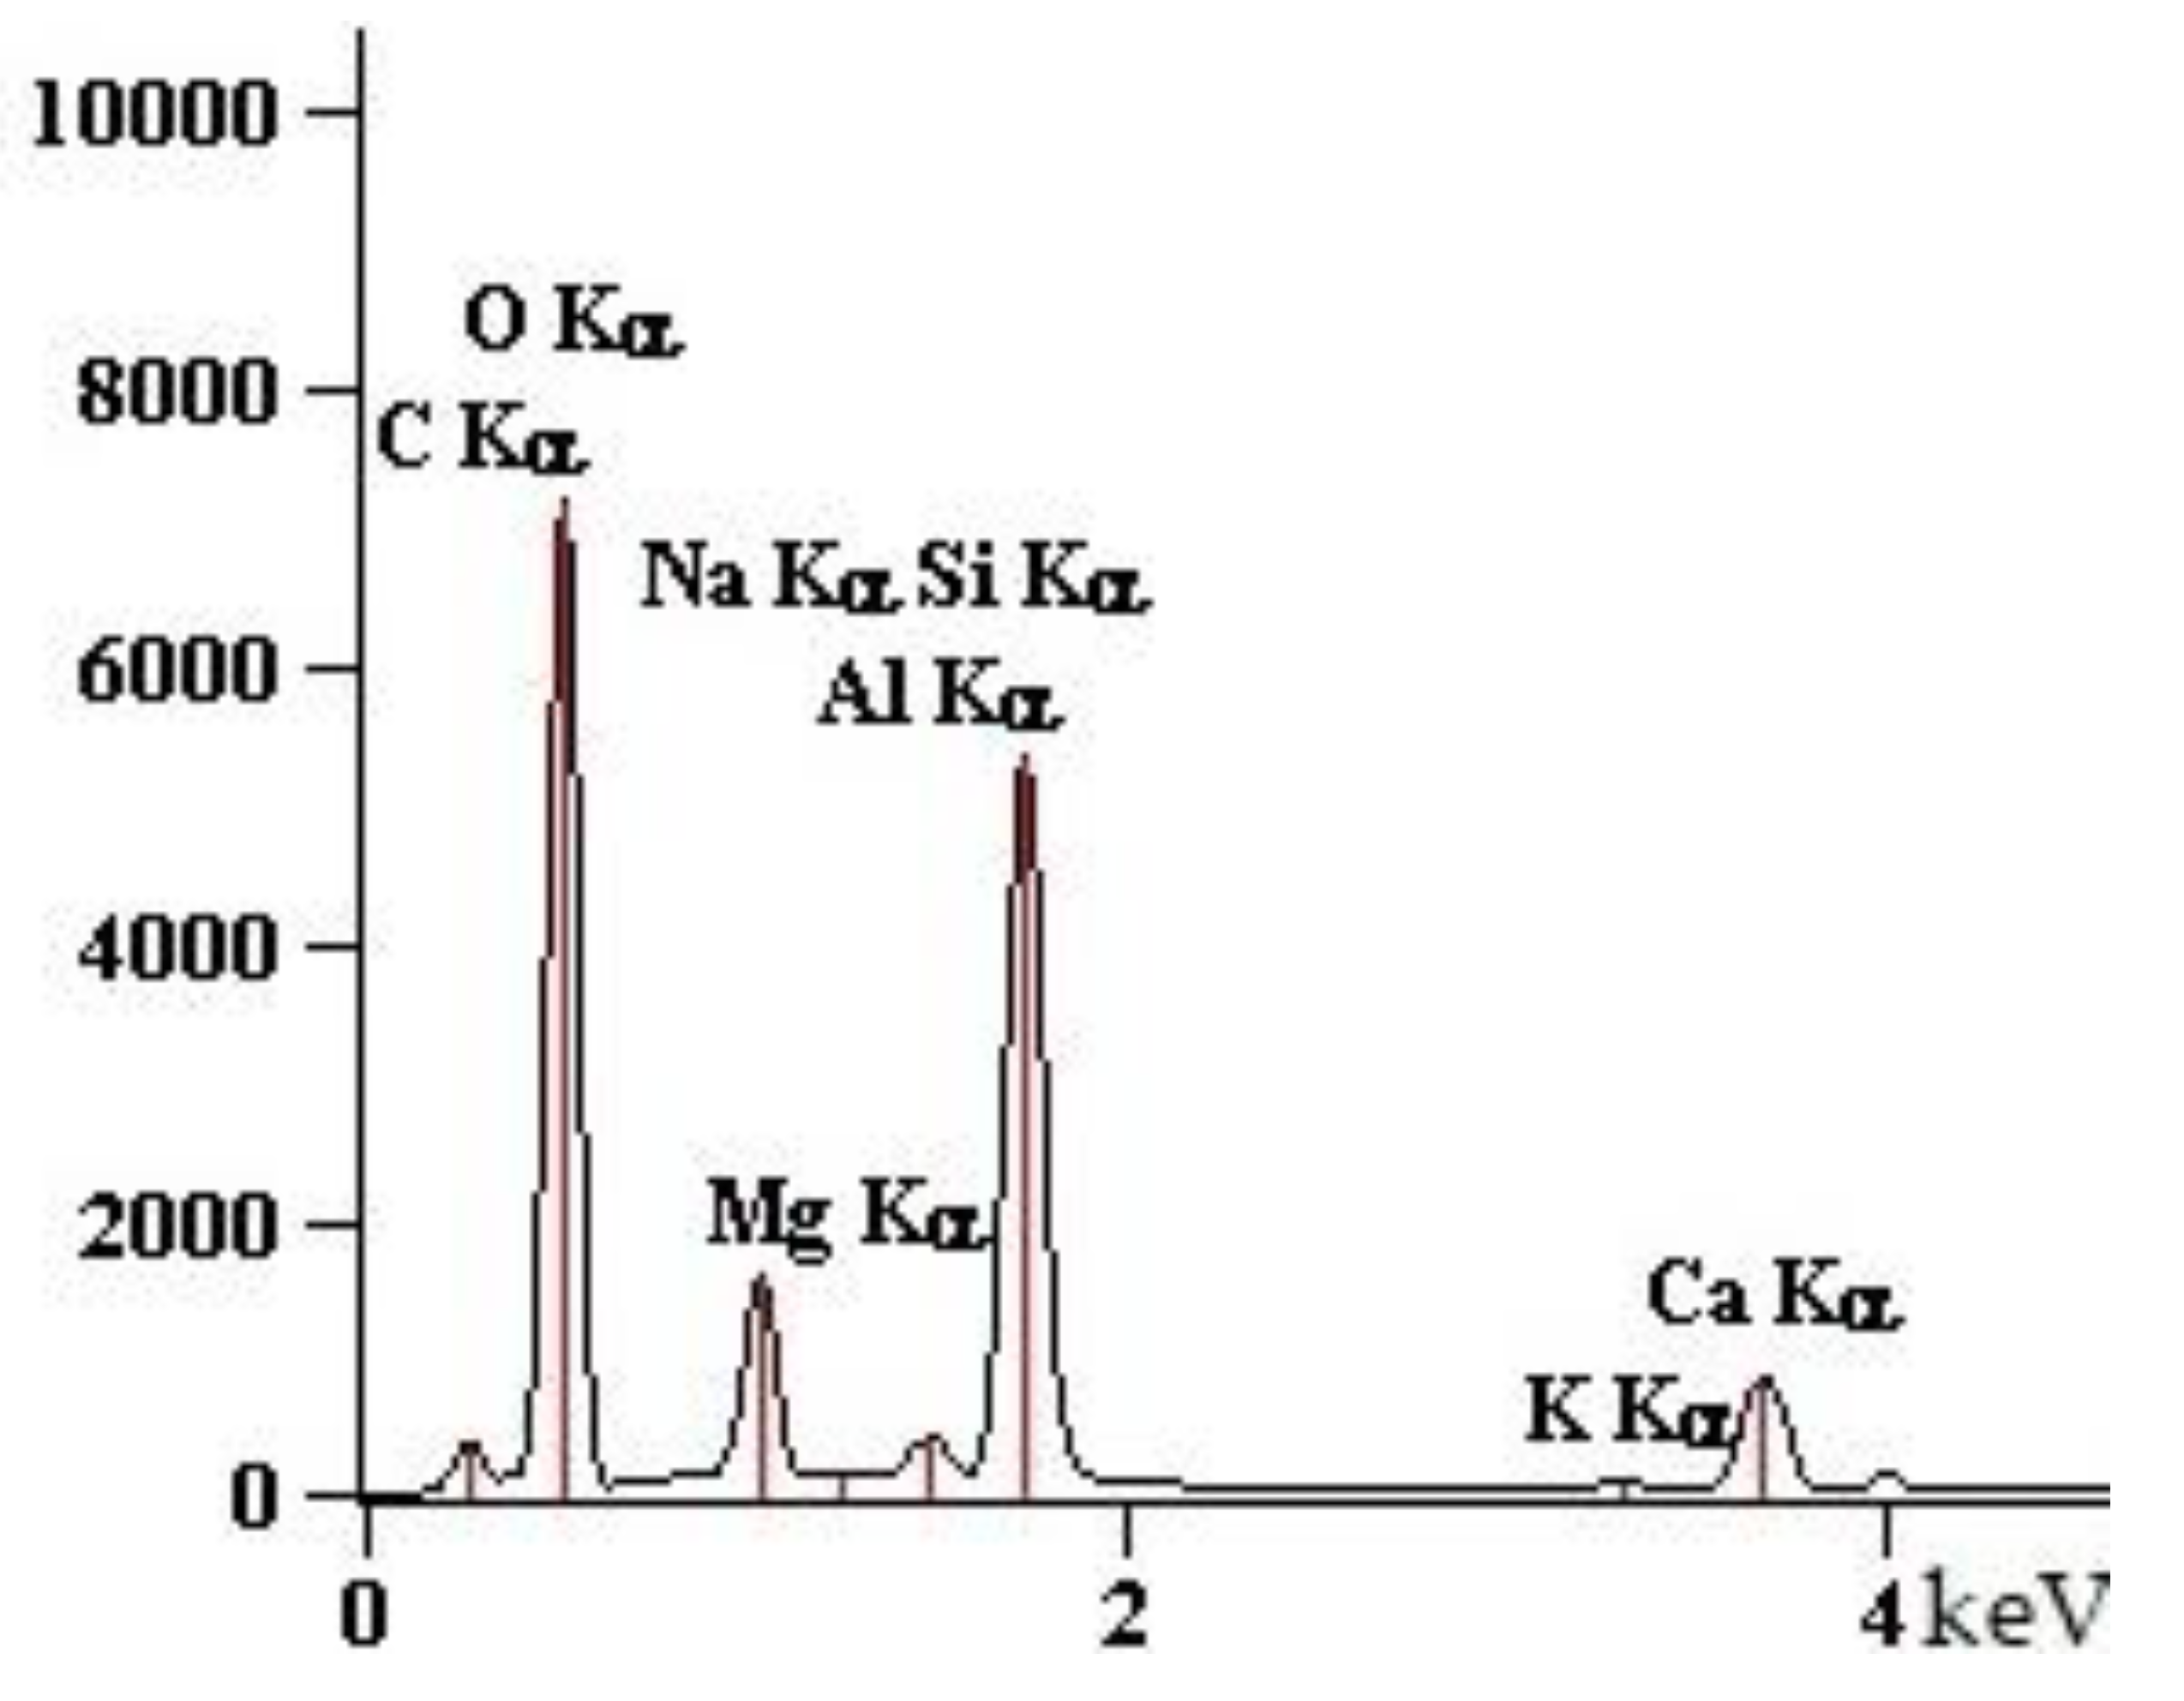
4.2.4. SEM of the Sample with 90% GS

Images below (Figure 17, Figure 18, Figure 19 and Figure 20) show the microstructure of samples modified with GS.
The images disclose different phases (e.g., gyrolite) and different arrangement of grains of glass sand as compared to the reference sample containing quartz sand.
The EDS spectra for laboratory bricks modified with 90% GS is shown below (Figure 21, Figure 22, Figure 23 and Figure 24, and Table 1).
EDS spectra for Figure 21, Figure 22, Figure 23 and Figure 24 at the tested points 1, 2, 3, 4.

4.3. Thermodynamic Modelling

Thermodynamic properties of phases considered in this study are shown in Table 2 and Table 3. Figure 25 and Figure 26 present the results of thermodynamic simulation for GS modified material. Prior to undertaking thermodynamic simulations, X-ray fluorescence (XRF) analysis was performed to determine for calculations input oxide compositions of the mixtures used to manufacture bricks (Table 4 and Table 5)
There is no information about tobermorite 9A in the database [62], therefore they are not included in the Table 3.
Data and information from the XRF analysis (Table 4) were used to perform thermodynamic simulation for a sample of brick material modified by 90% GS (Table 5) to determine the composition and interpretation of the microstructure (calcium silicate hydrates) of bricks modified in this method (Table 6). Silica is 100%% present in traditional sand-lime bricks.
Table 5 presents the total amount of individual compounds used to manufacture bricks containing glass sand. Table 6 along with Figure 25 and Figure 26 show mass percentages of solids predicted through thermodynamic simulations for laboratory brick modified by 90% GS.
Two scenarios were considered: the one where C-S-H phase was allowed to precipitate and the other one more likely to occur at elevated temperatures where C-S-H formation was suppressed in the calculation. During the first simulation the phases that were anticipated to be present in the material at 25 °C and at a pressure of 1 Bar were identified as: C-S-H, natrolite, gyrolite, M-S-H (magnesium silicate hydrate) analogous to C-S-H and found in the systems with elevated Mg contents such as for example slag cements [65]. During the second simulation of the data and when phase C-S-H was suppressed, the phases projected to be present in the material were identified to be: natrolite, gyrolite and brucite.

5. Discussion

Comparing two types of materials: traditional bricks used for the past 140 years and modified, which have a minimum compressive strength of about 15 MPa and contain recycled broken glass cullet (cullet in the form of glass sand), mechanical properties of both remain at similar levels. Only in laboratory-prepared conditions in bricks made with QS a decrease in strength to 6.5 MPa was observed but for the bricks with glass sand the compressive strength was estimated at around 20 MPa. Strength decreased in the quartz containing samples is believed to be caused by the autoclaving time shortened to 5 h as compared longer times when bricks are made at the industrial scale, which means that silica potentially had insufficient time to fully react. However, the largest differences can be seen by analyzing the microstructure of these two materials. X-ray diffraction allowed us to identify materials that have different structures, but the same chemical composition (polymorphic variants). In general, crystalline or amorphous phases were found. In traditional bricks the main phases identified were tobermorite, and C-S-H. In a ‘new’ proposed brick modified with amorphous glass sand at the 90 wt% level, the crystalline phases that precipitated were identified to be natrolite and gyrolite. The quantity of these phases rises as a function of the reaction time and as is facilitated under elevated temperature and pressure conditions achieved during the autoclaving process. These newly formed phases can have a significant impact on the behavior of the material over the years and, therefore, on its durability, porosity and frost resistance [66,67]. In the publication by Wawrzeńczyk [66] during the testing of cement materials (Protected Paste Volume (PPV)) a new description of the air gap structure was proposed. Based on that it has been concluded that following the determination of basic properties of glass brick (strength, structure, microstructure, density), porosity testing would provide additional response to the material behavior over time. As such, future tests related to this work will focus on the: porosity, absorption and capillary action and thermal insulation studies after 3 years from the initial production date (there were changes in the microstructure of the material modified by glass sand—phase crystallization occurred). These tests are aimed to determine the usefulness, behavior and durability of brick materials modified through the addition of glass cullet and over a long period of time. Having a comprehensive picture of physical and chemical properties for these two types of brick (traditional as we have known to date, and modified with recycled glass sand) would be also beneficial to in terms of building prototypes of building objects which can exhibit certain microclimates. It would also provide a sustainable and environmentally friendly alternative for the recycling of broken glass.

6. Conclusions

This study shows the effect of addition of recycled amorphous glass sand on individual properties of lime-sand brick products. Based on the research conducted, the following conclusions were made:
(1)
The replacement of crystalline quartz sand (90 wt% QS) with amorphous glass sand during the brick production process reduced the lime hydration temperature. During the stirring process of sand-lime mass, the temperature of the reaction between lime and water in the presence of quartz sand was determined to be 83 °C. In the presence of glass sand, measured temperature was only 42 °C. The temperature of lime hydration depended on the number of QS and GS in the sand-lime mass and decreased as the share of GS in the test increased.
(2)
For 5 h of autoclaving process in a laboratory autoclave, the compressive strength for the material with QS was around 6.5 MPa, and for material containing GS around 20 MPa. The test was carried out after 30 days from the date of production. The compressive strength for bricks manufactured on an industrial scale is 15–20 MPa. This aspect was met in laboratory conditions for bricks modified with GS.
(3)
With the increase in the proportion of a ‘new material’ (GS), the bulk density of this type of bricks slightly decreases. For the traditional laboratory made samples bulk density was 1.7 kg/dm3, and for those modified with glass sand was 1.65 kg/dm3. Standards for these types of materials have, therefore, been met.
(4)
Humidity is higher for GS modified materials (this property increases with the increase of GS content in the silicate mass and increase occurs from the level of 0.5% to 2.1%).
Certainly, the higher humidity of the new material is related to the properties of cullet and may mean lower water absorption. Considering all of the above, bricks modified with recycled glass may be a beneficial construction material, if not immediately applied as a major component in residential buildings, then at least for some their parts, such as: partition walls or elements of home infrastructure. Further studies are being conducted which concern the physical, mechanical and microstructural properties of bricks modified by glass sand after 26 and 36 months from the production date and the results of these tests will be presented in the next article.

Author Contributions

Conceptualization, A.S.; Methodology, A.S., M.B., B.P.-S.; Software, A.S., B.P.-S., D.P.P., T.J.O.; Validation, A.S. and M.B.; Formal Analysis, A.S.; Investigation, A.S., B.P.-S. and M.B.; Resources, A.S, B.P.-S., D.P.P., T.J.O.; Data Curation, A.S. and B.P.-S.; Writing—Original Draft Preparation, A.S.; Writing—Review and Editing, A.S. and M.B.; Visualization, A.S. and M.B.; Supervision, M.B.; Project Administration, A.S.; Funding Acquisition, A.S. All authors have read and agreed to the published version of the manuscript.

Funding

This research was funded by NATIONAL SCIENCE CENTER Krakow, Poland, under the Miniature 2 Grant No.: 2018/02/X/ST8/00544, ID: 409666, Title: “Chemical and microscopic analysis of calcium hydrated silicates in the CaO-SiO2-H2O system in autoclaved materials with low content of lime (less than 10%) and high content of glass components with amorphous structure”. Place of international internship and research: University of California Los Angeles, Henry Samueli School of Engineering (USA).

Acknowledgments

First author would like to acknowledge National Science Center in Poland for providing me with an opportunity to undertake internship at UCLA (as part of the grant Miniature 2) and complete this work; Gaurav N. Sant is kindly acknowledged for his help and scientific support during my stay at UCLA.

Conflicts of Interest

The authors declare no conflict of interest.

Nomenclatures

QSQuartz sand
GSGlass sand
XRFX-ray Powder Diffraction
SEMScanning Electron Microscope
XRDX-ray Powder Diffraction [keV]
γBulk density [kg/dm3]
pPressure [MPa]
δCompressive strength [MPa]
VMolar volume [cm3·mol−1]
MMolar mass [g·mol−1]
TTemperature [°C or K]
Log10 KSolubility product at T = 298 K (25 °C)(this information is the basis for determining the pH of the material)
fStandard Gibbs free energy of formation [J·mol−1]
fStandard enthalpy of formation, is the change in enthalpy when one mole of a substance is formed from its elements under a standard pressure of 1 atm/1 bar [J·mol−1]
Cp°Specific heat [J·mol−1·K−1]
Standard entropy of formation [J·mol−1·K−1]
BPNNBackpropagation Neural Network
MSEMean Square Error
XNetwork input
YOutput from the network
HNumber of neurons in hidden layer
lNumber of learning and validating patterns
tNumber of testing patterns
rLinear regression coefficient

References

  1. Nijland, T.G.; Adan, O.C.G.; van Hees, R.P.J.; van Etten, B.D. Evaluation of the Effects of Expected Climate Change on the Durability of Building Materials with Suggestions for Adaptation. Heron 2009, 54, 37–48. Available online: https://www.researchgate.net/publication/280016232 (accessed on 12 December 2019).
  2. The Effects of Climate Change. Available online: https://climate.nasa.gov/effects/ (accessed on 18 November 2019).
  3. Piotrowski, J.Z.; Stroy, A.; Olenets, M. Mathematical modelling of the steady state heat transfer processes in the convectional elements of passive solar heating systems. Arch. Civ. Mech. Eng. 2013, 13, 394–400. [Google Scholar] [CrossRef]
  4. Bomberg, M.; Wojcik, R.; Piotrowski, J.Z. A concept of integrated environmental approach, Part 2: Integrated approach to rehabilitation. J. Build. Phys. 2016, 39, 482–502. [Google Scholar] [CrossRef]
  5. Piotrowski, J.; Stroy, A.; Olenets, M. Mathematical Description of Heat Transfer and Air Movement Processes in Convectional Elements of a Building’s Passive Solar Heating Systems. Energy Procedia 2014, 57, 2070–2079. [Google Scholar] [CrossRef] [Green Version]
  6. H+H Partner w Budowaniu Ścian (H+H Partner in Building Walls). Available online: https://www.hplush.pl/zaklad-ludynia (accessed on 23 August 2019).
  7. Noszczyk, P.; Nowak, H. Inverse contrast in non-destructive materials research by using active thermography. Materials 2019, 12, 835. [Google Scholar] [CrossRef] [PubMed] [Green Version]
  8. Kurdowski, W. Poradnik Technologa Przemysłu Cementowego/Cement Industry Technologist’s Guide; Wyd. ARKADY: Warszawa, Poland, 1981. [Google Scholar]
  9. Orłowski, Z. Podstawy Technologii Betonowego Budownictwa Monolitycznego/Fundamentals of Monolithic Concrete Construction Technology; Wyd. Naukowe PWN SA: Warszawa, Poland, 2010. [Google Scholar]
  10. Cement Production Globally and in the U.S. from 2010 to 2019. Available online: https://www.statista.com/statistics/219343/cement-production-worldwide (accessed on 6 December 2019).
  11. Scrivener, K.L.; John, V.M.; Gartner, E.M. Eco-efficient cements: Potential economically viable solutions for a low-CO2 cement-based materials industry. Cem. Concr. Res. 2018, 114, 2–26. [Google Scholar] [CrossRef]
  12. Oey, T.; Timmons, J.; Stutzman, P.; Bullard, W.J.; Balonis, M.; Mauchy, M.; Sant, G. An improved basis for characterizing suitability of fly ash as a cement replacement agent. J. Am. Ceram. Soc. 2017, 100. Available online: http://matse1.matse.illinois.edu/concrete/hist.html (accessed on 23 November 2019). [CrossRef]
  13. Stepien, A.; Potrzeszcz-Sut, B.; Kostrzewa, P. Influence and Application of Glass Cullet in Autoclaved Materials. IOP Conf. Ser. Mater. Sci. Eng. 2019, 471, 032065. [Google Scholar] [CrossRef]
  14. Kostrzewa, P.; Stępień, A.; Dziadek, K.; Szmidt, A. Technological aspect of brick production using the method of autoclaving. Struct. Environ. 2018, 11, 249–257. [Google Scholar] [CrossRef]
  15. Stepien, A.; Kostrzewa, P.; Dachowski, R. Influence of barium and lithium compounds onsilica autoclaved materials properties and on the microstructure. J. Clean. Prod. 2019, 236, 117507. [Google Scholar] [CrossRef]
  16. Stepien, A. Wpływ Modyfikacji Składu Wyrobów Silikatowych na ich Mikrostrukturę i Właściwości Użytkowe/Impact of Modification of Silicate Products Composition on Their Microstructure and Functional Properties. Ph.D. Thesis, Civil Engineering and Architecture Department, Kielce University of Technology, Kielce, Poland, 3 July 2013; pp. 7–163. [Google Scholar]
  17. SILKA, Historia Silikatów. Available online: http://silikaty.blogspot.com/2012/09/historia-silikatow.html (accessed on 23 August 2019).
  18. Olenets, M.O.; Piotrowski, J.Z.; Stroy, A.F. Heat transfer and air movement in the ventilated air gap of passive solar heating systems with regulation of the heat supply. Energy Build. 2015, 103, 198–205. [Google Scholar] [CrossRef]
  19. Witthohn, M.; Wittenborn, D.E.; Klemm, R.; Chemnitz, D.E. Proces Zwiększania Pojemności Cieplnej Cegieł Wapienno-Silikatowych Oraz Cegła z Materiału Wapienno-Silikatowego/The Process of Increasing the Heat Capacity of Lime-Silicate Bricks and Brick of Lime-Silicate Material. Europejski Builetyn Patentowy PL/EP 1752509 T3, 8 August 2007. Available online: https://tech.money.pl/przemysl/patenty/ep-1752509-117739.html (accessed on 13 December 2019).
  20. Khomchenko, Y.V.; Semeykin, A.Y. Improving the Efficiency and Safety in the Technology of Lime and Silicate Materials. Mater. Sci. Forum 2019, 974, 243–248. [Google Scholar] [CrossRef]
  21. Nocuń-Wczelik, W. Structure and the most important properties of selected hydrated calcium silicates. Ceramics 1999, 59, 17–32. [Google Scholar]
  22. Paradisoa, P.; Santosc, R.L.; Horta, R.B.; Lopesa, J.N.C.; Ferreira, P.J.; Colaço, R. Formation of nanocrystalline tobermorite in calcium silicate binders with low C/S ratio. Acta Mater. 2018, 152, 7–15. [Google Scholar] [CrossRef]
  23. Labus, M.; Such, P. Microstructural characteristics of wellbore cement and formation rocks under sequestration conditions. J. Pet. Sci. Eng. 2016, 138, 77–87. [Google Scholar] [CrossRef]
  24. Lothenbach, B.; Kulik, D.A.; Matschei, T.; Balonis, M.; Baquerizo, L.; Dilnes, B.; Miron, J.D.; Myers, R.J. Cemdata18: A chemical thermodynamic database for hydrated Portland cements and alkali-activated materials. Cem. Concr. Res. 2019, 115, 472–506. [Google Scholar] [CrossRef] [Green Version]
  25. Matschei, T.; Lothenbach, B.; Glasser, F.P. The role of calcium carbonate in cement hydration. Cem. Concr. Res. 2007, 37, 551–558. [Google Scholar] [CrossRef]
  26. Richardson, I. Tobermorite/jennite- and tobermorite/calcium hydroxide-based models for the structure of C-S-H: Applicability to hardened pastes of tricalcium silicate, beta-dicalcium silicate, Portland cement, and blends of Portland cement with blast-fumace slag, metakaolin, or silica fume. Cem. Concr. Res. 2004, 34, 1733–1777. [Google Scholar]
  27. Kittipong, K.; Suwimol, A.; Kwannate, S. Effect of Fine Al-Containing Waste in Autoclaved-Aerated; Concrete Incorporating Rice-Husk Ash 10.1061/(ASCE), MT.1943-5533.0001149. ©; American Society of Civil Engineers: Reston, VA, USA, 2014. [Google Scholar]
  28. Pytel, Z. The Influence of Ground Limestone on the Properties of Sand-Lime Bricks; Ceramic Science, Polish Ceramic Bulletin Polish Academy of Science-Krakow Division, Polish Ceramic Society: Krakow, Poland, 2005. [Google Scholar]
  29. Taha, B.; Nounu, G. Utilizing Waste Recycled Glass as Sand/Cement Replacement in Concrete; Cement and Concrete Composities; Elsevier: Amsterdam, The Netherlands, 2008; pp. 497–505. Available online: https://www.researchgate.net/publication/248399903 (accessed on 17 November 2019).
  30. Schmidt, A.; Saia, W.H.F. Alkali-Aggregate Reaction Tests on Glass Used for Exposed Aggregate Wall Panel Work. J. Am. Concr. Inst. Aci Mater. J. 1963, 60, 1235–1236. [Google Scholar]
  31. Pattengill, M.; Shutt, T.C. Use of Ground glass as a pozzolan. In Symposium on Utilisation of Waste Glass in Secondary Products; The University of New Mexico: Albuquerque, NM, USA, 1973. [Google Scholar]
  32. Diamond, S. ASR Another Look at Mechanisms. In Proceedings of the 8th International Conference on Alkali-Aggregate Reaction in Concrete, Kyoto, Japan, 17–20 July 1989; Elsevier Science: New York, NY, USA, 1989; pp. 83–94. [Google Scholar]
  33. Chatterji, S. The role of Ca(OH)2 in the breakdown of Portland cement concrete due to alkali-silica reaction. Cem. Concr. Res. 1979, 9, 185–188. [Google Scholar] [CrossRef]
  34. Helmuth, R. Alkali-Silica Reactivity: An Overview of Research; Strategic Highway Research Program SHRP-C-432; National Research Council: Washington, DC, USA, 1993; pp. 7–103. [Google Scholar]
  35. Niang, A.; Roy, N.; Tagnit-Hamou, A. Structural Behavior of Concrete Incorporating Glass Powder Used in Reinforced Concrete Columns; American Society of Civil Engineers: New York, NY, USA, 2015; Volume 141, Issue 3–March. [Google Scholar]
  36. Shilpa, R.; Kumar, P.R. Effect of Using Glass Powder in Concrete. In Proceedings of the International Conference on Innovations & Advances in Science, Engineering And Technology, IC-IASET 2014, Kerala, India, 16–18 July 2014. [Google Scholar]
  37. H + H Silikaty Produkty Podstawowe. Available online: https://www.hplush.pl/h-h-silikaty-produkty-podstawowe (accessed on 11 November 2019).
  38. Murator-Budowa. Available online: https://miesiecznik.murator.pl/budowa/cegly-licowe_1521 (accessed on 11 November 2019).
  39. Rayment, D.L.; Majumdar, A.J. The composition of the C-S-H phases in portland cement pastes. Cem. Concr. Res. 1982, 12, 753–764. [Google Scholar] [CrossRef]
  40. Nonat, A. Thermodynamic Modelling of C-S-H Composition in Neat and Blended Cement Pastes. In Proceedings of the 19th Ibausil ConferenceAt, Weimar, Germany, 16–18 September 2015. [Google Scholar]
  41. Du, T.; Li, H.; Zhou, Q.; Wang, Z.; Sant, G.; Ryan, J.V.; Bauchy, M. Chemical composition of calcium-silicate-hydrate gels: Competition between kinetics and thermodynamics. Phys. Rev. Mater. 2019, 3, 065603. [Google Scholar] [CrossRef]
  42. Flint, E.P.; Wells, L.S. Study of the system CaO-SiO2-H2O at 30 °C and of the reaction of water on the anhydrous calcium silicates. Bur. Stand. J. Res. 1934, 12, 751–783. [Google Scholar] [CrossRef]
  43. Constantinides, G.; Franz-Josef, U. The nanogranular nature of C–S–H. J. Mech. Phys. Solids Pergamon 2007, 55, 64–90. [Google Scholar] [CrossRef]
  44. Dissertation: Jeff Thomas, Hamlin Jennings (Northwestern University, Evanston, IL). Available online: http://iti.northwestern.edu/cement/monograph/Monograph5_4_2.html/ (accessed on 21 August 2019).
  45. Arabi, N.; Jauberthie, R. Calcium Silicate Materials: Substitution of Hydrated Lime by Ground Granulated Blast Furnace Slag in Autoclaving Conditions. J. Mater. Civ. Eng. Mater. Civ. Eng. 2012, 24, 1230–1236. [Google Scholar] [CrossRef]
  46. Hong, S.Y.; Glasser, F.P. Phase relations in the CaO–SiO2–H2O system to 200 °C at saturated steam pressure. Cem. Concr. Res. 2004, 34, 1529–1534. [Google Scholar] [CrossRef]
  47. Baltušnikas, A.; Lukošiūtė, I.; Baltakys, K. XRD Characterization of Organically Modified Gyrolite. Mater. Sci. (Medžiagotyra) 2009, 15, 325. [Google Scholar]
  48. Galvánková, L.; Másilko, J.; Solný, T.; Štepánková, E. Tobermorite synthesis under hydrothermal conditions. Procedia Eng. 2016, 151, 100–107. [Google Scholar] [CrossRef]
  49. Siauciunas, R.; Baltakys, K. Formation of gyrolite during hydrothermal synthesis in the mixtures of CaO and amorphous SiO2 or quartz. Cem. Concr. Res. 2004, 34, 2029–2036. [Google Scholar] [CrossRef]
  50. Maschio, S.; Tonello, G.; Furlani, E. Recycling Glass Cullet from Waste CRTs for the Production of High Strength Mortars. Hindawi Publ. Corp. J. Waste Manag. 2013, 2013. [Google Scholar] [CrossRef]
  51. CEN. PN-EN 772-13: 2001 Methods of Test for Masonry Units-Part 13: Determination of the Density of the Net and Gross Density of Masonry in the Dry State (Except for Natural Stone); CEN: Brussels, Belgium, 2001. [Google Scholar]
  52. CEN. PN-EN 1996-2: 2010 Eurocode 6-Design of Masonry Structures-Part 2: Design, Selection of Materials and Execution of Masonry; CEN: Brussels, Belgium, 2010. [Google Scholar]
  53. CEN. PN-EN 771-2: Specification for Masonry Units. Part 2: Calcium Silicate Masonry Units; CEN: Brussels, Belgium, 2010. [Google Scholar]
  54. Potrzeszcz-Sut, B.; Pabisek, E. ANN constitutive material model in the shakedown analysis of an aluminum structure. Comput. Assist. Methods Eng. Sci. 2014, 21, 49–58. [Google Scholar]
  55. Young, B.A.; Hall, A.; Pilon, L.; Gupta, P.; Sant, G. Can the compressive strength of concrete be estimated from knowledge of the mixture proportions? New insights from statistical analysis and machine learning methods. Cem. Concr. Res. 2019, 115, 379–388. [Google Scholar] [CrossRef]
  56. Fausett, L. Fundamentals of Neural Networks: Architectures, Algorithms and Applications; Prentice Hall: Englewood Cliffs, NJ, USA, 1994. [Google Scholar]
  57. Gallant, S. Neural Network Learning and Expert Systems; MIT Press: Cambridge, MA, USA, 1993. [Google Scholar]
  58. Haykin, S. Neural Networks-A Comprehensive Foundation; Prentice Hall: New York, NY, USA, 1999. [Google Scholar]
  59. Hornik, K. Approximation capabilities of multilayer feedforward networks. Neural Netw. 1991, 4, 251–257. [Google Scholar] [CrossRef]
  60. Hudson, B.M.; Hagan, M.; Demuth, H. Neural Network Toolbox for Use with MATLAB; User’s Guide; The MathWorks. Inc.: Natick, MA, USA, 2011. [Google Scholar]
  61. GEM Software (GEMS). Available online: http://gems.web.psi.ch (accessed on 29 August 2019).
  62. Thermoddem. Thermochemical and Mineralogical Tables for Geochemical Modeling. Available online: http://thermoddem.brgm.fr (accessed on 19 August 2019).
  63. Taylor, H.F.W. Cement Chemistry; Thomas Telford Publishing: London, UK, 1997. [Google Scholar]
  64. Stepien, A.; Leśniak, M.; Sitarz, M. A Sustainable Autoclaved Material Made of Glass Sand. Buildings 2019, 9, 232. [Google Scholar] [CrossRef] [Green Version]
  65. Brew, D.R.M.; Glasser, F.P. Synthesis and characterisation of magnesium silicate hydrate gels. Cem. Concr. Res. 2005, 35, 85–98. [Google Scholar] [CrossRef]
  66. Wawrzeńczyk, J.; Kozak, W. Protected Paste Volume (PPV) as a parameter linking the air-pore structure in concrete with the frost resistance results. Constr. Build. Mater. 2016, 112, 360–365. [Google Scholar] [CrossRef] [Green Version]
  67. Pereira de Oliveira, L.A.; Castro-Gomes, J.P.; Santos, P. Mechanical and Durability Properties of Concrete with Ground Waste Glass Sand. Conf. 11dbmc Int. Conf. Durab. Build. Mater. Compon. 2008, 1, 1–8. [Google Scholar]
Figure 1. Production flow of traditional sand-lime bricks.
Buildings 10 00041 g001
Figure 2. Density of the C-S-H gel [44].
Buildings 10 00041 g002
Figure 3. Fragment of reference brick made with quartz sand (QS).
Buildings 10 00041 g003
Figure 4. Fragment of brick made with 90 wt% glass sand (GS).
Buildings 10 00041 g004
Figure 5. (a) Architecture of backpropagation neural network (BPNN):1-6-3; (b) correlation graphs for chosen BPNN:1-6-3.
Buildings 10 00041 g005
Figure 6. Chemical composition of glass sand used to modify sand-lime bricks (% by mass).
Buildings 10 00041 g006
Figure 7. Autoclaving conditions used in laboratory setting during the brick production (3 processes with 10 elements each).
Buildings 10 00041 g007
Figure 8. Compressive strength (δ) as a function of glass sand content [MPa].
Buildings 10 00041 g008
Figure 9. Bulk density (γ) as a function of glass sand content.
Buildings 10 00041 g009
Figure 10. Humidity (W) as a function of glass sand content.
Buildings 10 00041 g010
Figure 11. XRD of reference sand-lime sample containing QS [64].
Buildings 10 00041 g011
Figure 12. (a) X-ray diffraction (XRD) analysis of the bricks modified by 90% GS (after 2 months from initial production) [64]. (b) XRD pattern of the sample modified with 90% GS (after 26 months from initial production).
Buildings 10 00041 g012
Figure 13. Scanning electron microscope (SEM) image of traditional sand-lime bricks (conataining Quartz Sand), SEM: low vaccum mode, 500× magnification.
Buildings 10 00041 g013
Figure 14. SEM image of traditional sand-lime bricks (containing Quartz Sand), SEM: high vaccum mode, 3000× magnification (1-C-S-H phase; 2-C-S-H crystallization towards tobermorite).
Buildings 10 00041 g014
Figure 15. Energy-dispersive spectrometry (EDS) spectrum for traditional sand-lime bricks (containing quartz sand): Point 1.
Buildings 10 00041 g015
Figure 16. EDS spectrum for traditional sand-lime bricks (containing quartz sand): Point 2.
Buildings 10 00041 g016
Figure 17. SEM image of “Glass Bricks”—brick modified by 90% glass sand: SEM low-vacuum mode, 500× magnification.
Buildings 10 00041 g017
Figure 18. SEM image of “Glass Bricks”—brick modified by 90% glass sand: SEM high-vacuum mode, 3000× magnification.
Buildings 10 00041 g018
Figure 19. SEM image of “Glass Bricks”—brick modified by 90% GS, high-vacuum mode 2000× mag.
Buildings 10 00041 g019
Figure 20. SEM image of “Glass Bricks”- brick modified by 90% Glass Sand, high vacuum mode.
Buildings 10 00041 g020
Figure 21. EDS spectrum of brick modified with 90% GS. Point 1.
Buildings 10 00041 g021
Figure 22. EDS spectrum of brick modified with 90% GS. Point 2.
Buildings 10 00041 g022
Figure 23. EDS spectrum of brick modified with 90% GS. Point 3.
Buildings 10 00041 g023
Figure 24. EDS spectrum of brick modified with 90% GS. Point 4.
Buildings 10 00041 g024
Figure 25. Weight % of solids predicted by thermodynamic simulation at 20 °C.
Buildings 10 00041 g025
Figure 26. Weight % of solids predicted by thermodynamic simulation at 20 °C. In this simulation precipitation of C-S-H was suppressed.
Buildings 10 00041 g026
Table 1. EDS analysis results for a ‘new’ brick with 90% GS.
PointC-KO-KNa-KMg-KAl-KSi-KK-KCa-K
90GS(2)_pt1154776,16610,4485786189567,1737127650
90GS(2)_pt2270387,88024,477 141179,79699310,422
90GS(2)_pt3475973,28434,184 84940,1336846528
90GS(2)_pt4219953,04011,62813225651,57895910,255
90GS(2)_pt5368679,05629,717 93844,8215615868
Table 2. Standard thermodynamic properties at 25 °C and 1 bar. bricks [24,62].
Mineral NameFormulaΔf
[kJ/mol]
Δf
[kJ/mol]

[J/K·mol]
p
[J/K·mol]

[cm3/mol]
M
[g/mol]
C-S-HCa0.8SiO2.8:1.54H2O−1769.0−1945.13107.850138.359.2132.6
Tobermorite 11ACa5Si6O16(OH)2−9889.3−10,680.0692.5764.9286.1739.9
GrossularCa3Al2Si3O12−6279.6−6640.260.1327.8125.3450.4
α-SiO2 −856.2−910.741.444.522.660.0
β-SiO2 −854.9−908.643.744.7-60.0
ΔfG°—standard molar Gibbs free energy of formation; ΔfH°—standard molar enthalpy; S°—standard molar entropy; C°p—heat capacity, V°—molar volume, M—molar mass.
Table 3. Standard molar thermodynamic properties of gyrolite, natronite and xonotlite [62].
Mineral NameFormulaΔf
[kJ/mol]
Δf
[kJ/mol]

[J/K·mol]
p
[J/K·mol]
V°
[cm3/mol]
M
[g/mol]
GyroliteCa2Si3O7.5(OH)·2H2O−4550−4917309325137337.4
XonotliteCa6Si6O17(OH)2−9465−10,022573628256.9714.9
NatroliteNa2(Al2Si3)O10:2H2O−5316.6−5718.6359359.2169.2380.2
ΔfG°—standard molar Gibbs free energy of formation at To = 298 K; ΔfH°—standard molar enthalpy at To = 298 K; S°—standard molar entropy at To = 298 K; C°p—heat capacity at To = 298 K, V°—molar volume, M—molar mass.
Table 4. X-ray fluorescence (XRF) analysis of the composition of lime and glass compounds [64].
XRF-CaOXRF-GS
Final Weight CaO LOI (%):7.7113 g
0.018
Final weight GS LOI (%):7.7046 g
1.304
CompoundValueUnitCompoundValueUnit
SiO21.691%SiO271.2%
TiO20.026%TiO20.1%
Al2O30.342%Al2O31.8%
Fe2O30.182%Fe2O30.4%
Mn3O40.024%MgO1.1%
MgO0.921%CaO10.6%
CaO96.034%Na2O12.4%
K2O0.6%
Table 5. Quantities of individual components used to manufacture bricks containing glass sand.
ElementsGlass Sand (90%) 903 (g)Quartz Sand (0%) 0 (g)CaO (7%) 73.5 (g)H2O (3 + 4 = 7%) 73.5 (g)
SiO2642.94-1.24
Al2O316.25-0.25
MgO9.93-0.13
CaO95.72-0.02
Na2O111.97-0.68
K2O5.42-70.59
Table 6. Thermodynamic (geochemical modeling, GEMS) simulation results obtained at 20 °C.
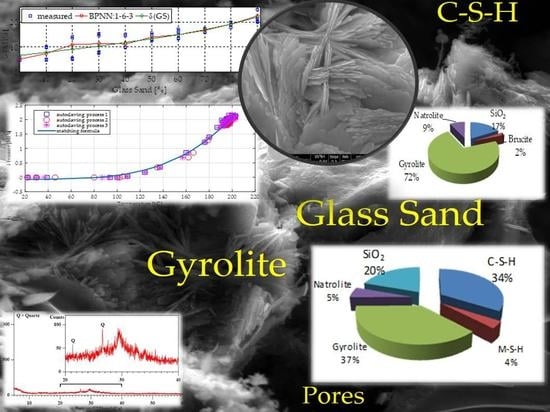
Solid Phases Predicted to Form
Type of PhaseMass of Solid Phases (g)Volume of Solid Phases (cm3)
C-S-H (ECSH-I) about the structure of tobermorite low Ca/Si ratio:373.29132.84
MSH (magnesium silicate hydrate)40.6317.11
gyrolie414.1697.28
natrolite59.6626.55
SiO2218.3782.45

