Article

Emission Reduction Potential of Different Types of Finnish Buildings through Energy Retrofits

1
Department of Mechanical Engineering, Aalto University, 00076 Aalto, Finland
2
Finnish Environment Institute, 00790 Helsinki, Finland
3
Granlund Consulting Oy, 00701 Helsinki, Finland
4
College of Urban Construction, Nanjing Tech University, Nanjing 211816, China
*
Author to whom correspondence should be addressed.
Buildings 2020, 10(12), 234; https://doi.org/10.3390/buildings10120234
Submission received: 28 October 2020 / Revised: 1 December 2020 / Accepted: 3 December 2020 / Published: 8 December 2020
(This article belongs to the Special Issue Net-Zero/Positive Energy Buildings and Districts)

Abstract

:
Energy retrofitting of buildings shows great potential in reducing CO2 emissions. However, most retrofitting studies only focus on a single building type. This paper shows the relative potential in six Finnish building types, to identify possible focus areas for future retrofits in Finland. Data from previous optimization studies was used to provide optimal cases for comparison. Energy demand of the buildings was generated through dynamic simulation with the IDA-ICE software. The cases were compared according to emissions reduction, investment and life cycle cost. It was found that, in all buildings, it was possible to reduce emissions cost-neutrally by 20% to 70% in buildings with district heating and by 70% to 95% using heat pumps. Single-family homes with oil or wood boilers switching to heat pumps had the greatest emission reduction potential. More stringent requirements for energy efficiency could be mandated during building renovation.

1. Introduction

Energy use in buildings causes 36% of the CO2 emission in the European Union (EU). This is why the Energy Performance of Buildings Directive (EPBD) declares energy efficiency goals for new buildings in the European Union [1]. However, most buildings in the EU have been built before the EPBD regulations, which is also true for Finland. Relying only on new constructions is too slow to impact CO2 emissions reduction [2]. Thus, the EPBD has been updated with a requirement for each EU member state to create a roadmap for the renovation of existing buildings [3]. More concretely, in a recent renovation strategy, the European Commission calls for a 60% reduction in the carbon emissions of buildings by the year 2030 [4]. Already, many studies have been done to find the optimal deep retrofit designs for various building types, to minimize cost and energy consumption.

1.1. Localization of Retrofit Solutions

Building retrofits are a timely issue in all parts of the world, both in countries in hot climates seeking to reduce cooling demand and countries in cold climates trying to reduce heating demand. Depending on the building type and climate, the optimal technical solutions are different. Some influential environmental factors are ambient temperature, humidity and solar radiation intensity. On the building-side, differences can arise, for example, from electric load patterns, the use of hot water, and occupational schedule. National policies also influence results, as they may determine the framework for solutions by setting, for example, the base efficiency levels of the current building stock and the requirements for energy efficiency of renovation measures.
Optimization and dynamic building energy simulation have been popular tools for building-related research. For example, in a hot and humid Indian climate, simulation-based optimization was used to design a residential building envelope retrofit, based on phase-change materials and insulation layers [5]. Heat gain in the building was reduced by up to 33.5% after optimal retrofits. A review on building façade retrofits found that, in cooling dominated climates, façade retrofits can reduce energy demand by 15% to 53% [6]. In addition to envelope retrofits, a study based on a South African apartment building included solar panel installation as a building retrofit measure [7]. By optimizing net present value, payback period, and energy savings, energy consumption reduction of 36% to 43% was achieved with a payback period of four years or less. Retrofits of residential villas in Dubai were designed in Reference [8]. A two-stage parametric analysis was used, such that each retrofit measure (insulation, windows and air conditioning) was simulated by itself and then a combined retrofit set was formed based on costs found from a National Renewable Energy Laboratory (NREL) database. In the old buildings of Dubai, with low window-to-wall ratios, thermal insulation of walls was found to be beneficial along with the installation of a more efficient air-conditioning system. Replacing relatively new windows with improved ones was not cost-effective. Since no price data from the United Arab Emirates was available, prices from the USA were used instead. This highlights the need to perform national studies on building retrofits, to provide more information to both businesses and individuals, as well as policymakers.
Air infiltration was found to be of low importance in warm Mediterranean climates [9]. This is because of low temperature differences between indoor and outdoor air compared to cold climates, where infiltration is significant. Temperate climates have their own problems and solutions. Minimizing the cost and greenhouse gas emissions of a retrofitted German office building [10] highlighted solutions, such as improved thermal insulation, increased air-tightness, and a low temperature gas boiler. This is an example of a locally optimal solution, as electricity is very expensive in Germany, while natural gas is relatively cheap, preventing the use of heat pumps (HP). In a study about French houses, thermal insulation of external walls was found to have the highest impact on emissions [11]. On the one hand, deep renovation was not feasible using the French 9-year home improvement loans due to the short amortization period. On the other hand, in a regional level study on the French building stock, 35% reductions in greenhouse gas emissions were obtained with negative costs, when a 50-year horizon was utilized [12]. Retrofits to both the building envelope and heating system were needed to mitigate 70% of emissions. The observed costs were less than 50 €/t-CO2. This highlights the need for long-term financing, which could be provided through the EU.
Many retrofit optimization studies have also been made for cold climates. Optimization of retrofits on an old Swedish multi-family building showed that improvements to the building envelope or ventilation system were not cost-effective [13]. In fact, the only economical retrofit action was the installation of energy-efficient windows. Another retrofit optimization study of 12 historical residential building types in Sweden also revealed window upgrades as a good solution to improve energy efficiency [14]. Thermal insulation of walls and roof was also cost-effective in many cases. Deep energy retrofits of older Finnish detached single-family houses were examined in Reference [15]. Multi-objective optimization was used to minimize costs and emissions in four age categories of buildings with five different heating systems. Air-source heat pumps were used for auxiliary heating in all optimized buildings and switching from a wood or oil boiler to a ground-source heat pump (GSHP) was the most cost-effective retrofit measure to reduce CO2 emissions. Similarly, in studies on old Finnish apartment buildings, GSHP was also the most effective way to reduce primary energy consumption [16,17]. An opposite view was presented in a Swedish study that accounted for the whole energy generation chain when considering the energy system retrofit of code compliant and passive level single-family houses [18]. Depending on how the grid electricity was generated, heat pumps could be more CO2 intensive than district heating (DH) produced by combined heat and power (CHP) plants. This effect stems from heat pumps having to use more high emission electricity during peak demand hours. However, another study found that if all Finnish single-family houses were to perform a deep energy retrofit, the reduction in direct electric heating demand in part of the building stock could compensate for increased heat pump electricity demand in other buildings [19]. At a large scale, the total peak electricity demand could even go down. In Canada, which has a cold climate but with more solar energy than the Nordic countries, solar photovoltaic-thermal collector retrofits in the housing stock could reduce greenhouse gas (GHG) emissions by 17% [20]. Similarly, installing air-to-water heat pumps could results in 23% reduction in GHG emissions [21]. A review of façade retrofit measures showed that façade retrofits are most effective in heating dominated climates, especially ones with high heating degree day values [6]. The review found a range of 7% to 62% energy demand reduction in various studies.
The optimal solutions are influenced by the energy markets and national energy generation systems. The generation mix and local policies influence emissions and the relative benefits of one retrofit measure over another. National energy prices and emission factors were reported in a study that analyzed the cost and emission impacts of energy retrofits in European cities in various climates [22]. For example, electricity cost and emissions were low in France, where electricity is mainly generated by nuclear power [23] and high in Germany, where coal and natural gas are major fuels [24]. Similarly, electrified heating using heat pumps has been economically sensible in Finland [15,16,17], where the emissions and cost of electricity are relatively low. While the EU calls for electrification of heating, a study based on Canada found that electrification could also increase emissions depending on the local energy infrastructure [25]. This shows that large-scale actions need to be determined according to the local conditions. The most effective solutions will not necessarily be the same even for countries with similar climates. Things like the locally typical façade structure or cost of labor can change the best solutions, even if system efficiencies seem similar on the surface. Thus, the results of any optimization should not be directly utilized in a different context, as many influential factors can change the optimal solutions.

1.2. Retrofits in Different Building Types

Most retrofit studies focus on residential buildings, since they form the majority of the building stock. Other building types have also gained attention. For example, a Finnish office building retrofit was optimized in Reference [26]. The optimized variables were cost and emissions, but the study also took into account the thermal comfort. Thermal comfort of workers could account for 75% of building life cycle cost (LCC). Cost-optimal retrofit solution with a GSHP could reduce CO2 emissions by 63% while also generating cost-savings. In a study done on large USA office buildings [27], simply adjusting the heating and ventilation setpoints had the potential of reducing energy consumption by 60% in moderate climates but not in cooling dominated climates. In Spain, on the other hand, heating and cooling set points adapted according to the temperature of the previous days were successfully used to reduce both heating and cooling energy consumption by a total of up to 45% [28]. An office building in Hong Kong saw emission reduction of 43% after retrofits [29]. A 19% reduction in CO2 emissions was obtained in a Turkish university campus building using an optimal combination of energy conservation measures [30]. The energy retrofit of an Italian industrial building with a workshop included measures, such as envelope upgrades, ventilation heat recovery, solar energy and active set point controls [31]. The best out of 1320 examined configurations reduced CO2 emissions by over 70% without government subsidies. The retrofit study of an Italian hospital involved heat recovery, solar shading and envelope upgrades [32]. With various budget limitations, emission reductions of 180 to 1260 t-CO2 were obtained. Historical buildings can be a difficult target for retrofits, as visible changes could compromise their special cultural value. However, energy retrofits can also be a protective tool, as improved energy efficiency can ensure that historical buildings will be used even in the future [33].

1.3. Other Aspects of Building Retrofits

Building retrofits can be valuable to investors regardless of any environmental benefits. For example, property values of Canadian office buildings were increased by retrofits [34]. Retrofits could result in decreased operating costs, increased occupancy rates and increased effective rental rates. On the other hand, a large survey of 1550 homeowners in Sweden revealed that energy cost reduction is not a typical reason to renovate a building [35]. Instead, a more common reason is to improve the indoor environment. According to the survey, some barriers to energy renovation are the lack of access to low interest loans and the lack of information related to potential renovation projects. While thermal comfort and indoor air quality are harder to evaluate than energy savings, they do have real value. For example, a Swedish study showed that 77% of retrofit investment cost could be realized as increased value of the house [36]. It also revealed that energy savings promised by dynamic building simulation (58%) were quite close to the actual realized savings (53%). This confirms the importance of dynamic simulation and optimization as a tool for designing emission reducing retrofits.

1.4. Contribution of the Current Study

Optimal renovation measures have been found for several building types in previous studies. In many cases, emissions can be reduced by more than 50%. However, local conditions, such as the climate and energy policy, influence the optimal solutions, while the lack of information can hinder concrete actions. There are differences in the optimal retrofit solutions even between the very similar Nordic countries. Retrofit solutions cannot be copied directly from country to another. The key questions are: In which building types in Finland can the retrofits be done at the lowest cost? Which building types have the greatest impact on Finnish emissions? This paper compiles results from several Finnish building retrofit studies. The results from other studies are adjusted so that the same discounting and energy price source is used in every case, allowing for better comparison of the different cases. The main contribution is to show the potential impact of energy retrofits in different kinds of Finnish buildings. The novelty of this study is in revealing where the building retrofits can have the greatest impact. Compiling the results together helps in gaining a better view of the whole. This can aid decision makers to evaluate their cost and impact relative to other emission reducing actions, such as those in the energy production sector, and to choose priorities within and outside the building sector.

2. Materials and Methods

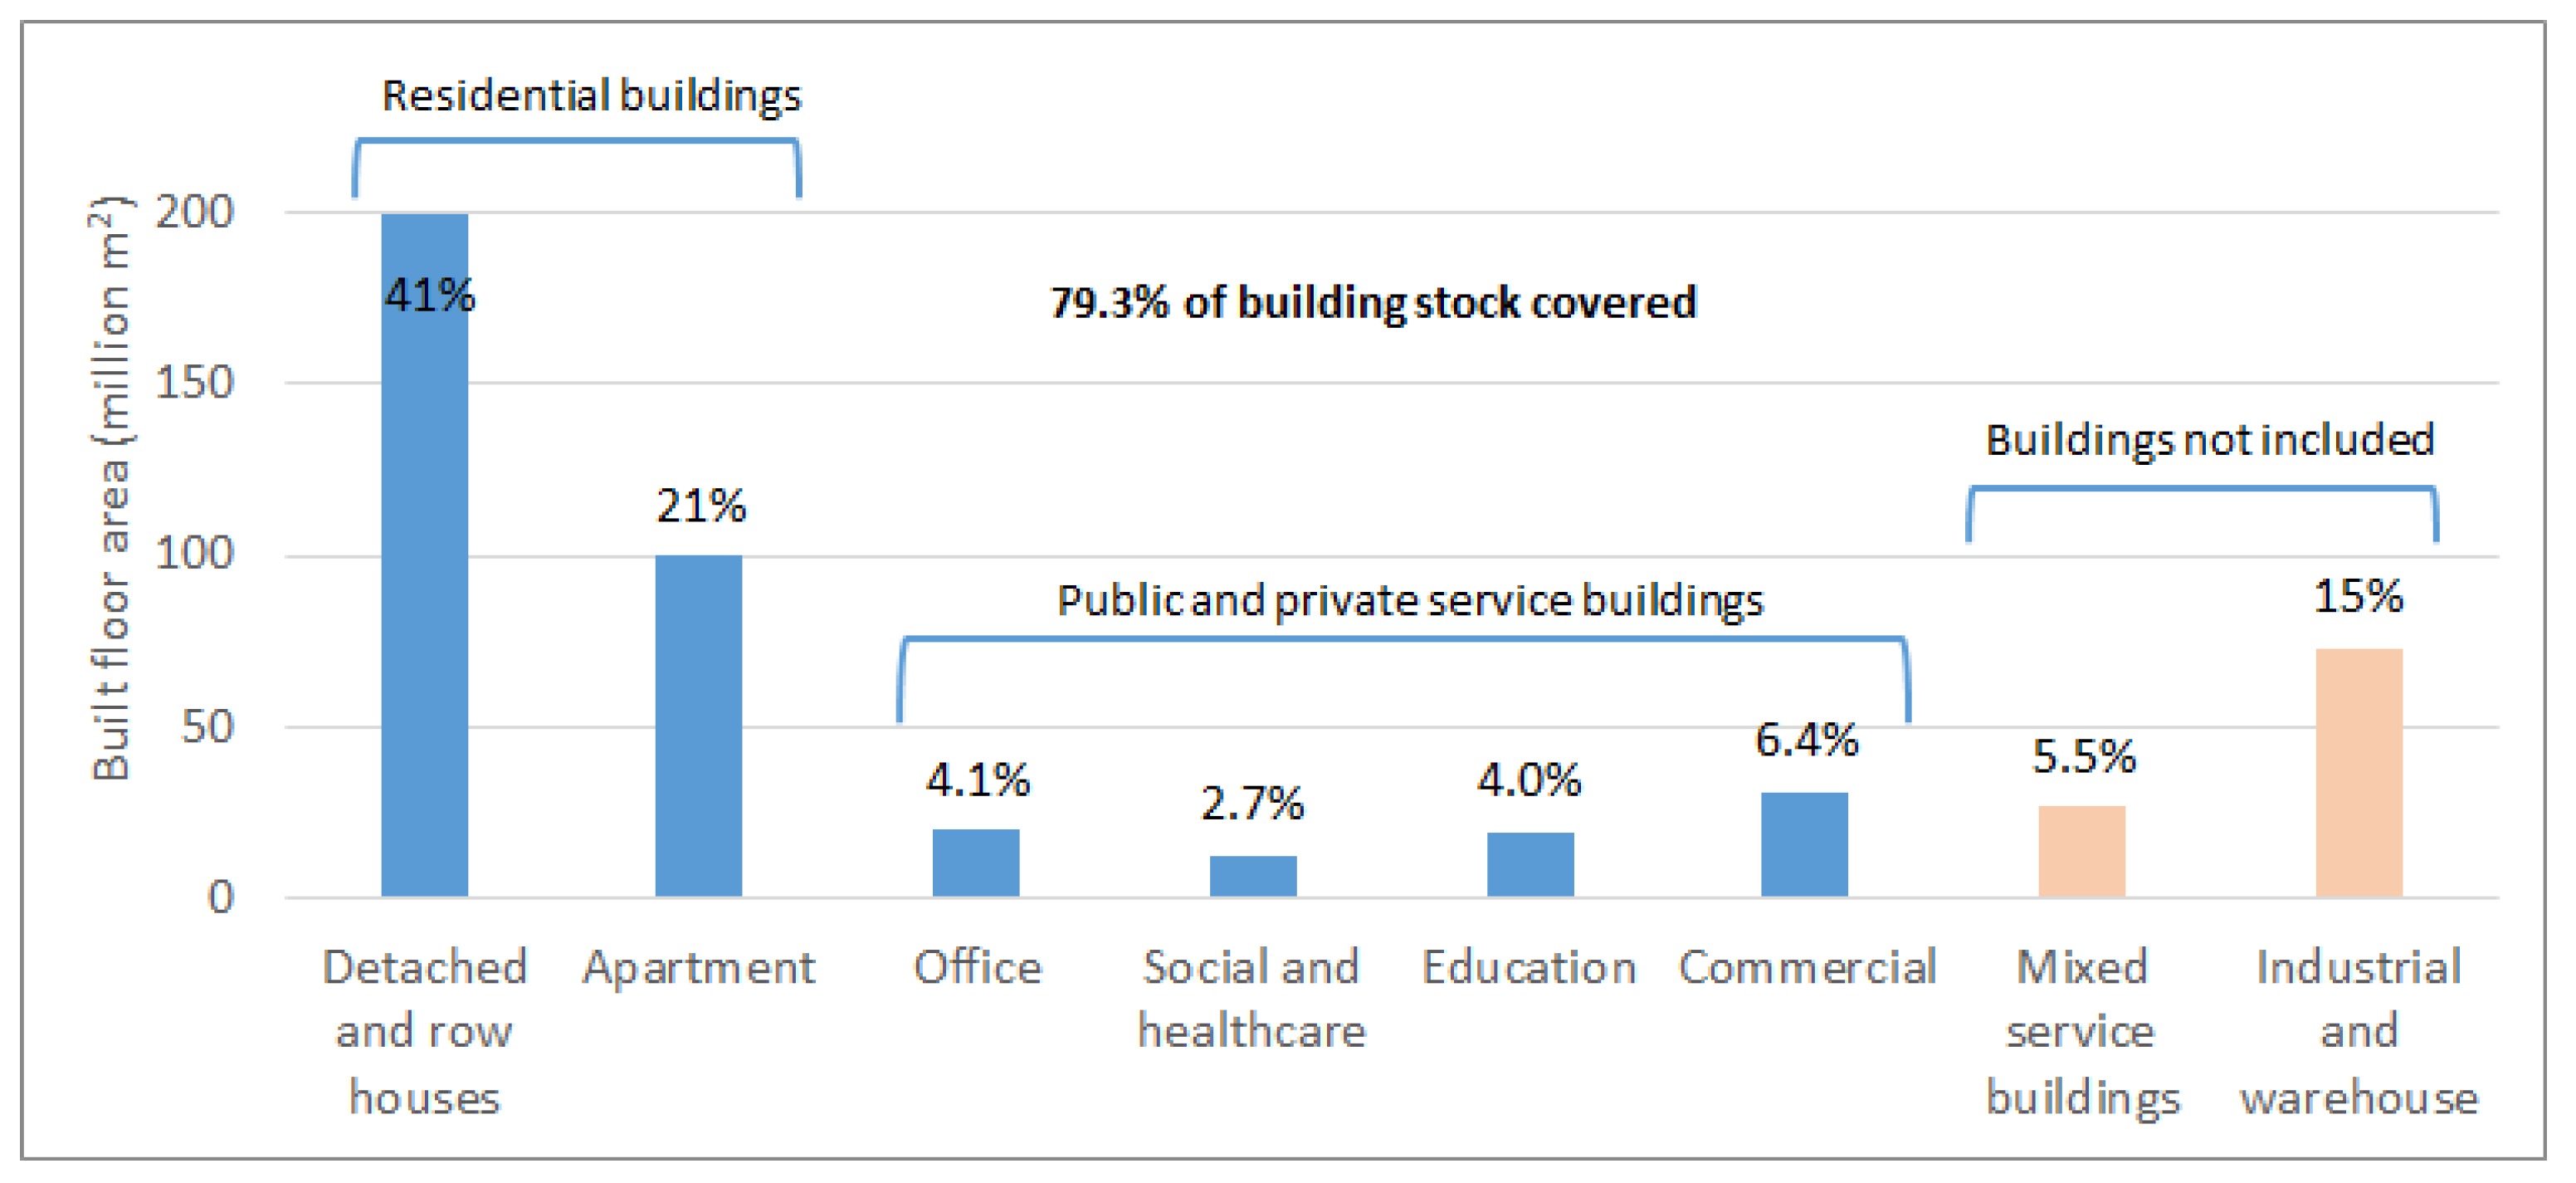
2.1. Finnish Building Stock

The Finnish building stock is composed of buildings of various ages and many different uses, though it is dominated by residential buildings, as shown in Figure 1. In this study, six common building types have been chosen to provide an insight into retrofit potential and to show which building types to focus on: detached houses [15], multi-story apartment buildings [37], elderly care buildings [38], office buildings [26], educational buildings [39], and commercial buildings [40]. Each building type has been studied in prior research papers. The chosen building types cover 79% of the Finnish building stock [41] and provide an instructive view on the emission reduction possibilities of building retrofits. The buildings excluded from this study are very heterogeneous buildings where energy retrofits are unlikely to happen (such as warehouses) or industrial buildings for which the CO2 emissions are calculated as part of the industrial sector, instead of the building sector. This means understanding the efficiency, impact, and cost-effectiveness of actions in different building types. Decision-makers can use the information when deciding on retrofitting priorities or the allocation of government grants and other support. Since residential buildings dominate the building stock, they were examined in more detail, using several age classes of buildings.

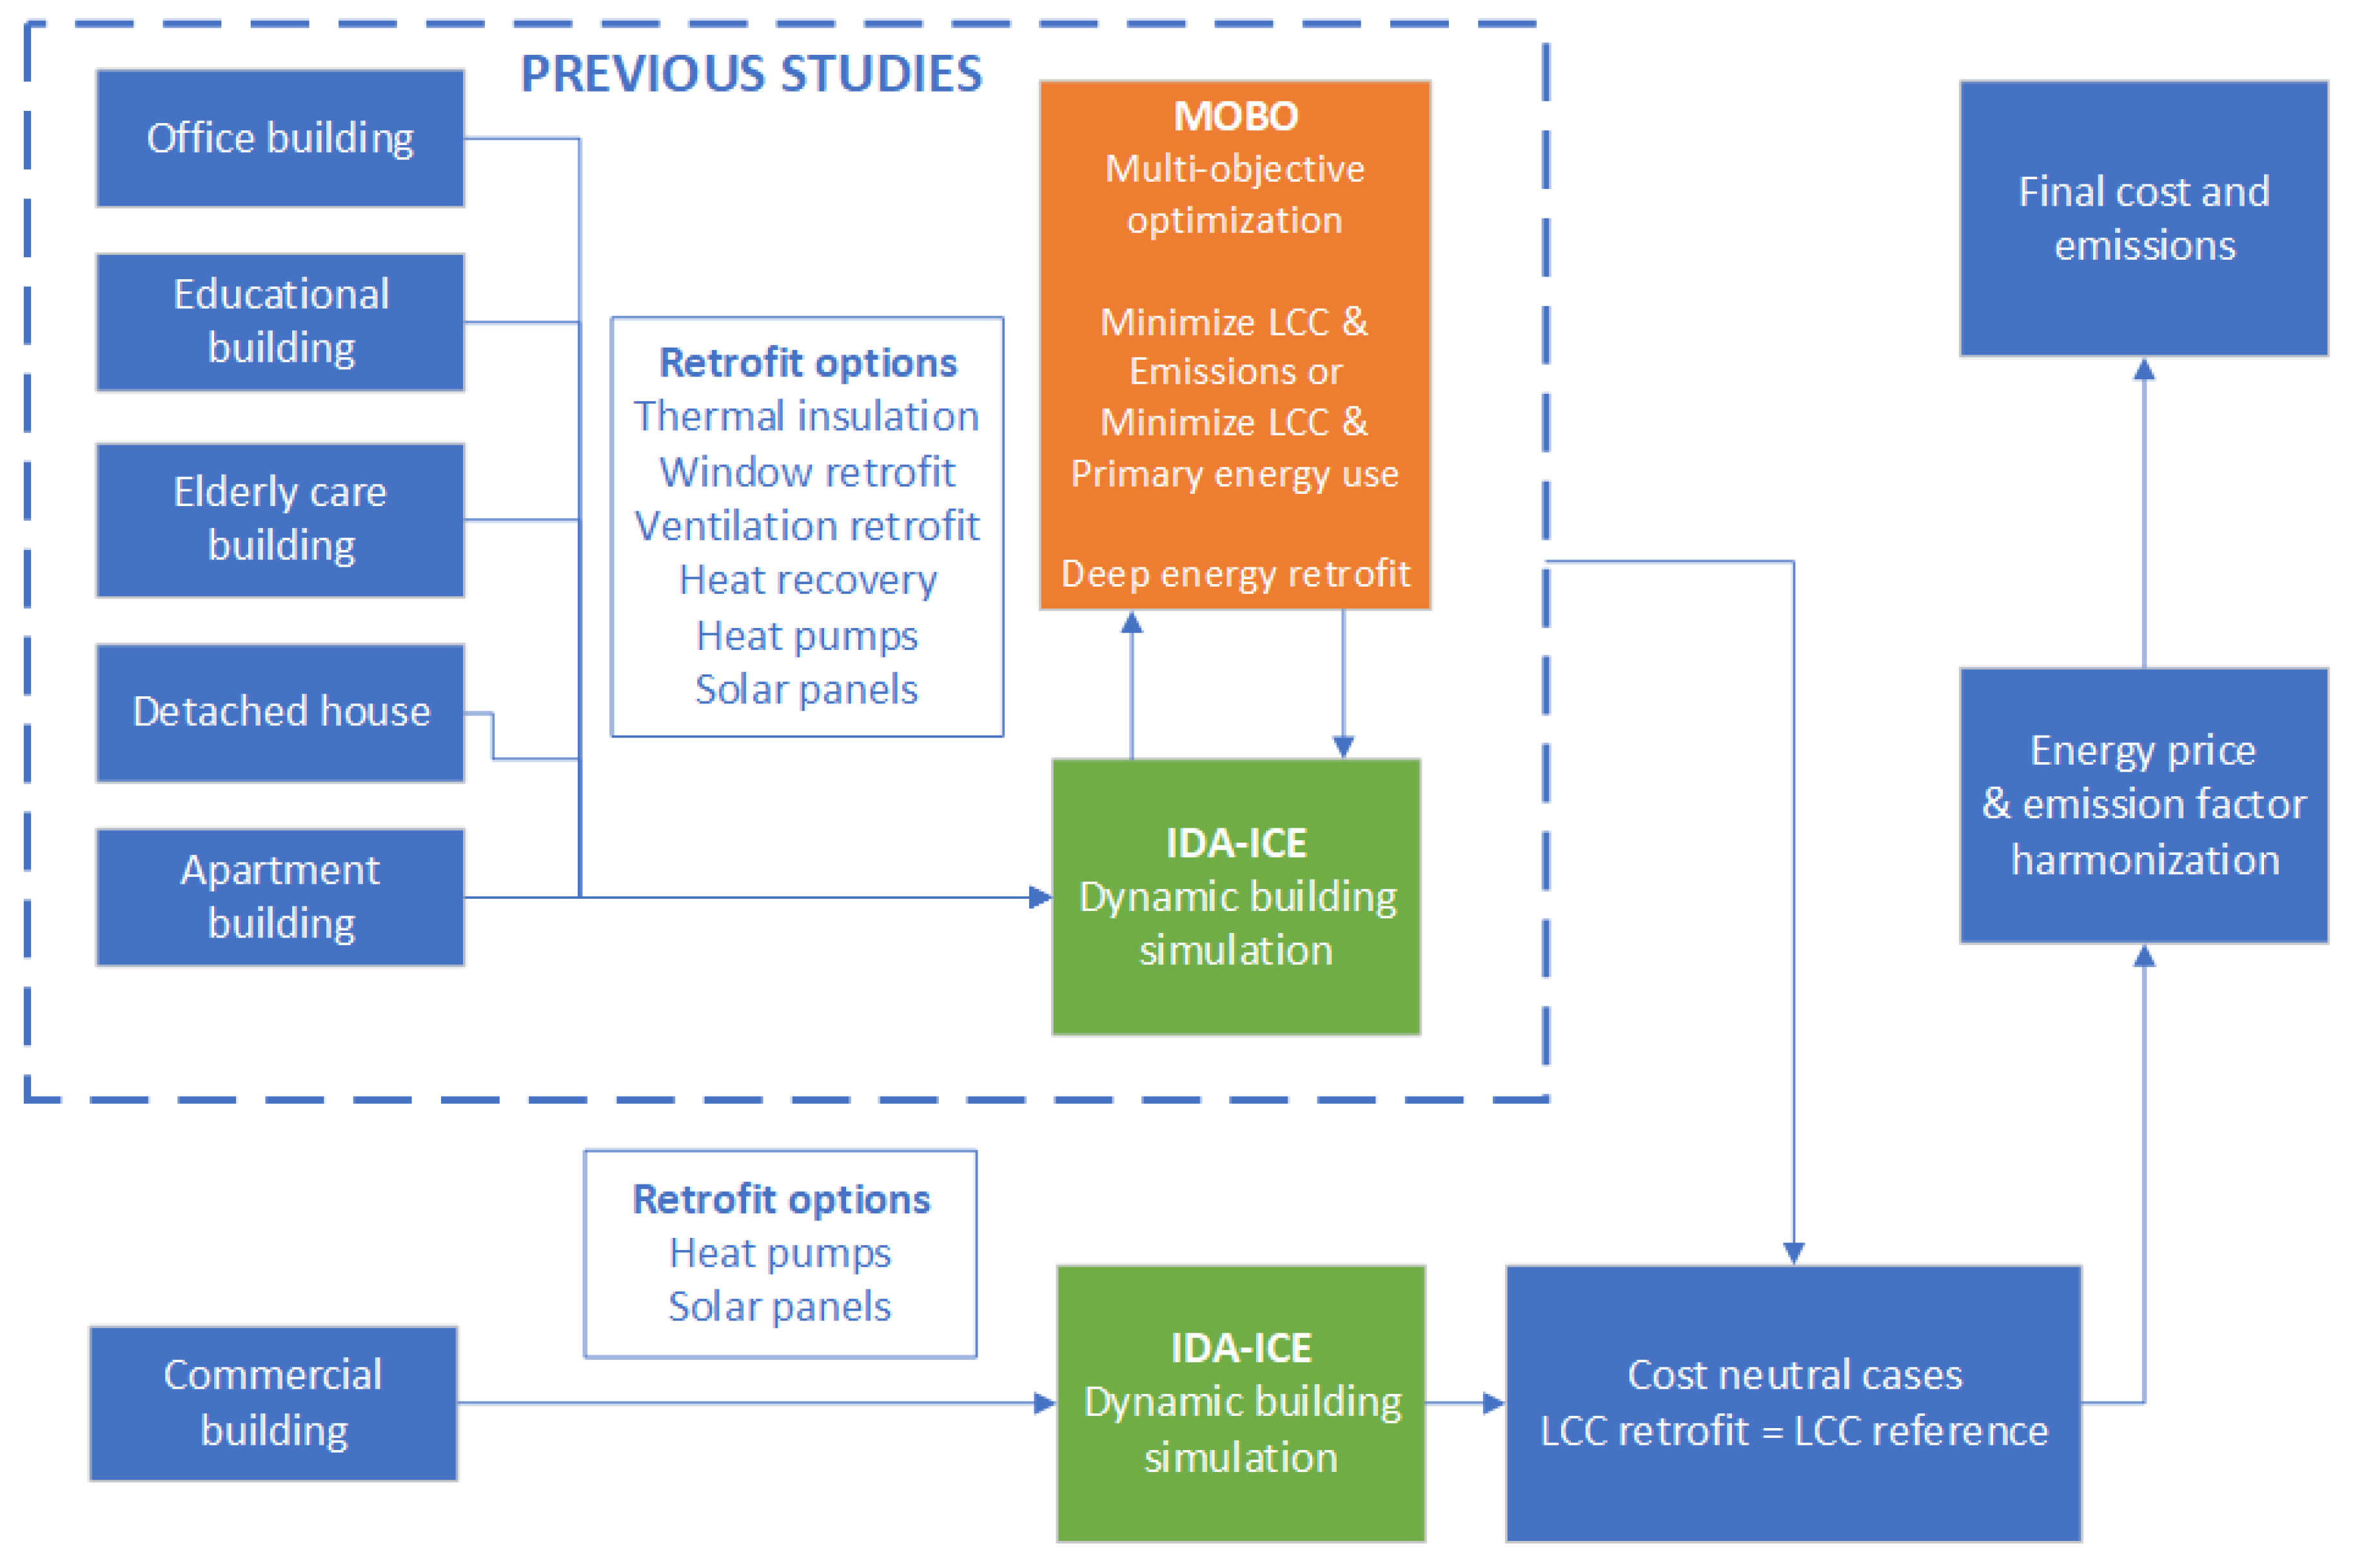
2.2. Simulation and Optimization

Results from dynamic IDA-ICE (IDA Indoor Climate and Energy) [42] simulations from the previous studies were used to determine the energy demand for each building type in this study. IDA-ICE 4.8 (Equa Simulations AB, Stockholm, Sweden) is a comprehensive dynamic building simulation software [43] that takes into account the building geometry, internal structure of the envelope, thermal mass, infiltration, internal gains, heating curves and plant efficiencies etc. It has been validated, for example, in Reference [44,45]. The calculation process is shown in Figure 2. The configuration of each building (envelope properties, solar energy capacity etc.) was determined using the optimized results from previous studies. The optimization in the previous studies was performed using the MOBO (Multi-Objective Building Optimizer) optimization tool [46], which is based on the genetic algorithm NSGA-II (Non-dominated sorting genetic algorithm II) [47]. The use of an optimization algorithm removes the bias of pre-selecting the combinations of retrofit options. Since the original results were obtained using multi-objective optimization, there were many different optimal solutions, each with a unique combination of retrofit options and different cost and emissions. To make the various cases comparable, cost-neutral retrofitting was used by selecting retrofitted cases which had the same life cycle cost as their reference case over a lifetime of 25 years. The selection principle is shown in Figure 3. Finally, the energy costs were recalculated using the same discounting factors for all building types. The annual energy demand in the studied buildings is shown in the Appendix A, in Table A1.

2.3. Building Information—Residential Buildings

2.3.1. Single-Family Houses

The single-family houses (SH) were divided into four age categories, according to the building code in effect at the time of construction (–1975, –2002, –2009, 2010–, for SH1 to SH4, respectively). The basic form of the house was the same for all age categories, a two-story building with a square base and 180 m2 heated net area. There were several options of main heating systems used in the buildings: district heating (DH), oil/wood boiler, direct electric heating, and ground-source heat pump (GSHP). In the results section of this compilation study, the older buildings SH1 and SH2 have been grouped together, as has been done for the newer building SH3 and SH4.
Heating demand for the single-family houses with on-site boilers were altered from the original source [15] by accounting for oil and pellet boiler efficiencies, which were missing in the original study. The efficiency was 0.81 for the oil boiler and 0.75 for the pellet boiler [48]. This increased the final energy demand, emissions, and cost for these cases.
When possible, the chosen retrofit level was cost-neutral. In case of buildings with direct electric heating, almost all the solutions were lower cost than the reference case and thus the level B retrofit from Reference [15] was chosen. Similarly, for oil heating replaced by GSHP. In all retrofitted buildings (except the GSHP cases), air-to-air heat pumps (AAHP) were installed due to their cost-effectiveness. Solar thermal and solar electric systems were also utilized in most cases. In houses built before the year 2003, new windows and additional thermal insulation to external walls were installed. This was done in many newer building configurations, as well. The details of the apartment building properties are shown Table 1. The abbreviated ventilation systems mentioned in the table are natural stack ventilation, mechanical exhaust ventilation, and mechanical balanced ventilation with heat recovery. Variable air volume ventilation (VAV) was performed by reducing ventilation flows according to occupation, down to a minimum of 40% during no occupation.
For further reading on the optimization and emission reduction in the single-family houses, please see Reference [15]. On the effects of retrofitting on the heating and electric power demand, see Reference [19].

2.3.2. Apartment Buildings

The apartment buildings (AB) were divided into four age categories, according to the building code in effect at the time of construction (–1975, –2002, –2009, 2010–, for AB1 to AB4, respectively). The buildings of different age were also of different shapes and sizes, ranging from large buildings with 4050 m2 heated net area to smaller ones at 1585 m2. District heating was used in each reference case. In the results section of this compilation study, the older buildings, AB1 and AB2, have been grouped together, as has been done for the newer buildings, AB3 and AB4.
The retrofit actions common to all cost-neutral apartment building retrofits included the installation of sewage heat recovery, solar photovoltaic (PV) panels, and solar thermal collectors. In the two older building categories, additional thermal insulation of external walls and roof were also utilized and energy-efficient windows were installed. In new buildings with existing mechanical balanced ventilation, demand-based ventilation was installed during the retrofit in all cases. The list of building properties for all retrofitted cases is shown in Table 2. The ventilation systems mentioned in the table are mechanical exhaust ventilation and mechanical balanced ventilation with heat recovery (HR).
Additional information on the apartment building retrofit optimization can be found in Reference [37]. The impact of retrofits on the hourly power demand of heating and electricity is presented in Reference [49].

2.4. Building Information—Public and Private Service Buildings

Table 3 shows the properties of all the retrofitted service buildings. Since their share of the building stock is much smaller than that of residential buildings, these building types were not divided into as many categories. The ventilation controls reported in Table 3 are constant air volume ventilation according to predetermined schedules (CAV, sched) and variable air volume ventilation controlled by CO2 and temperature sensors (VAV, CO2 + T). The following sections briefly describe the properties of the retrofitted buildings.

2.4.1. Elderly Care Buildings

The elderly care buildings included an old reference building (pre-1980) and a retrofitted building with either district heating or an air-to-water heat pump. The building size was comparable to a large apartment building at 4709 m2 heated net area. Retrofit actions in the elderly care building included the installation of additional thermal insulation in the external walls and roof, as well as the installation of energy-efficient windows. Ventilation heat recovery was also installed, along with automated lighting controls, PV panels, and solar thermal collectors. The properties of the retrofitted buildings are shown in Table 3. For additional details on the retrofitting process, please refer to Reference [38].

2.4.2. Office Buildings

The office buildings included an old reference building (pre-1980) and a retrofitted building with either district heating or a ground-source heat pump. It was a large building with a 13,400 m2 heated net area. The utilized retrofit actions were the installation of ventilation heat recovery and energy-efficient windows, the use of CO2-controlled VAV ventilation, and the installation of LED lighting and PV panels. Automated lighting control and blinds between the windows were also used in the GSHP case. The properties of the retrofitted buildings are shown in Table 3. More details on the buildings and their optimization can be found in Reference [26].

2.4.3. Educational Buildings

The educational buildings included an old reference building (pre-1980) and a retrofitted building with either district heating or a ground-source heat pump. The example building was a large university campus building with 19,000 m2 of heated floor area. The utilized retrofit actions include the installation of ventilation heat recovery and energy-efficient windows. In the DH case, both solar thermal collectors and PV panels were installed. In the GSHP case, only PV panels were installed, but additional thermal insulation was added in the roof. Because the use profile of the building had sharp changes in demand, the cost-effective heat pump size was very small and district heating provided most of the heating energy even in the GSHP configuration. The properties of the retrofitted buildings are shown in Table 3. A detailed account of the educational building optimization can be found in Reference [39].

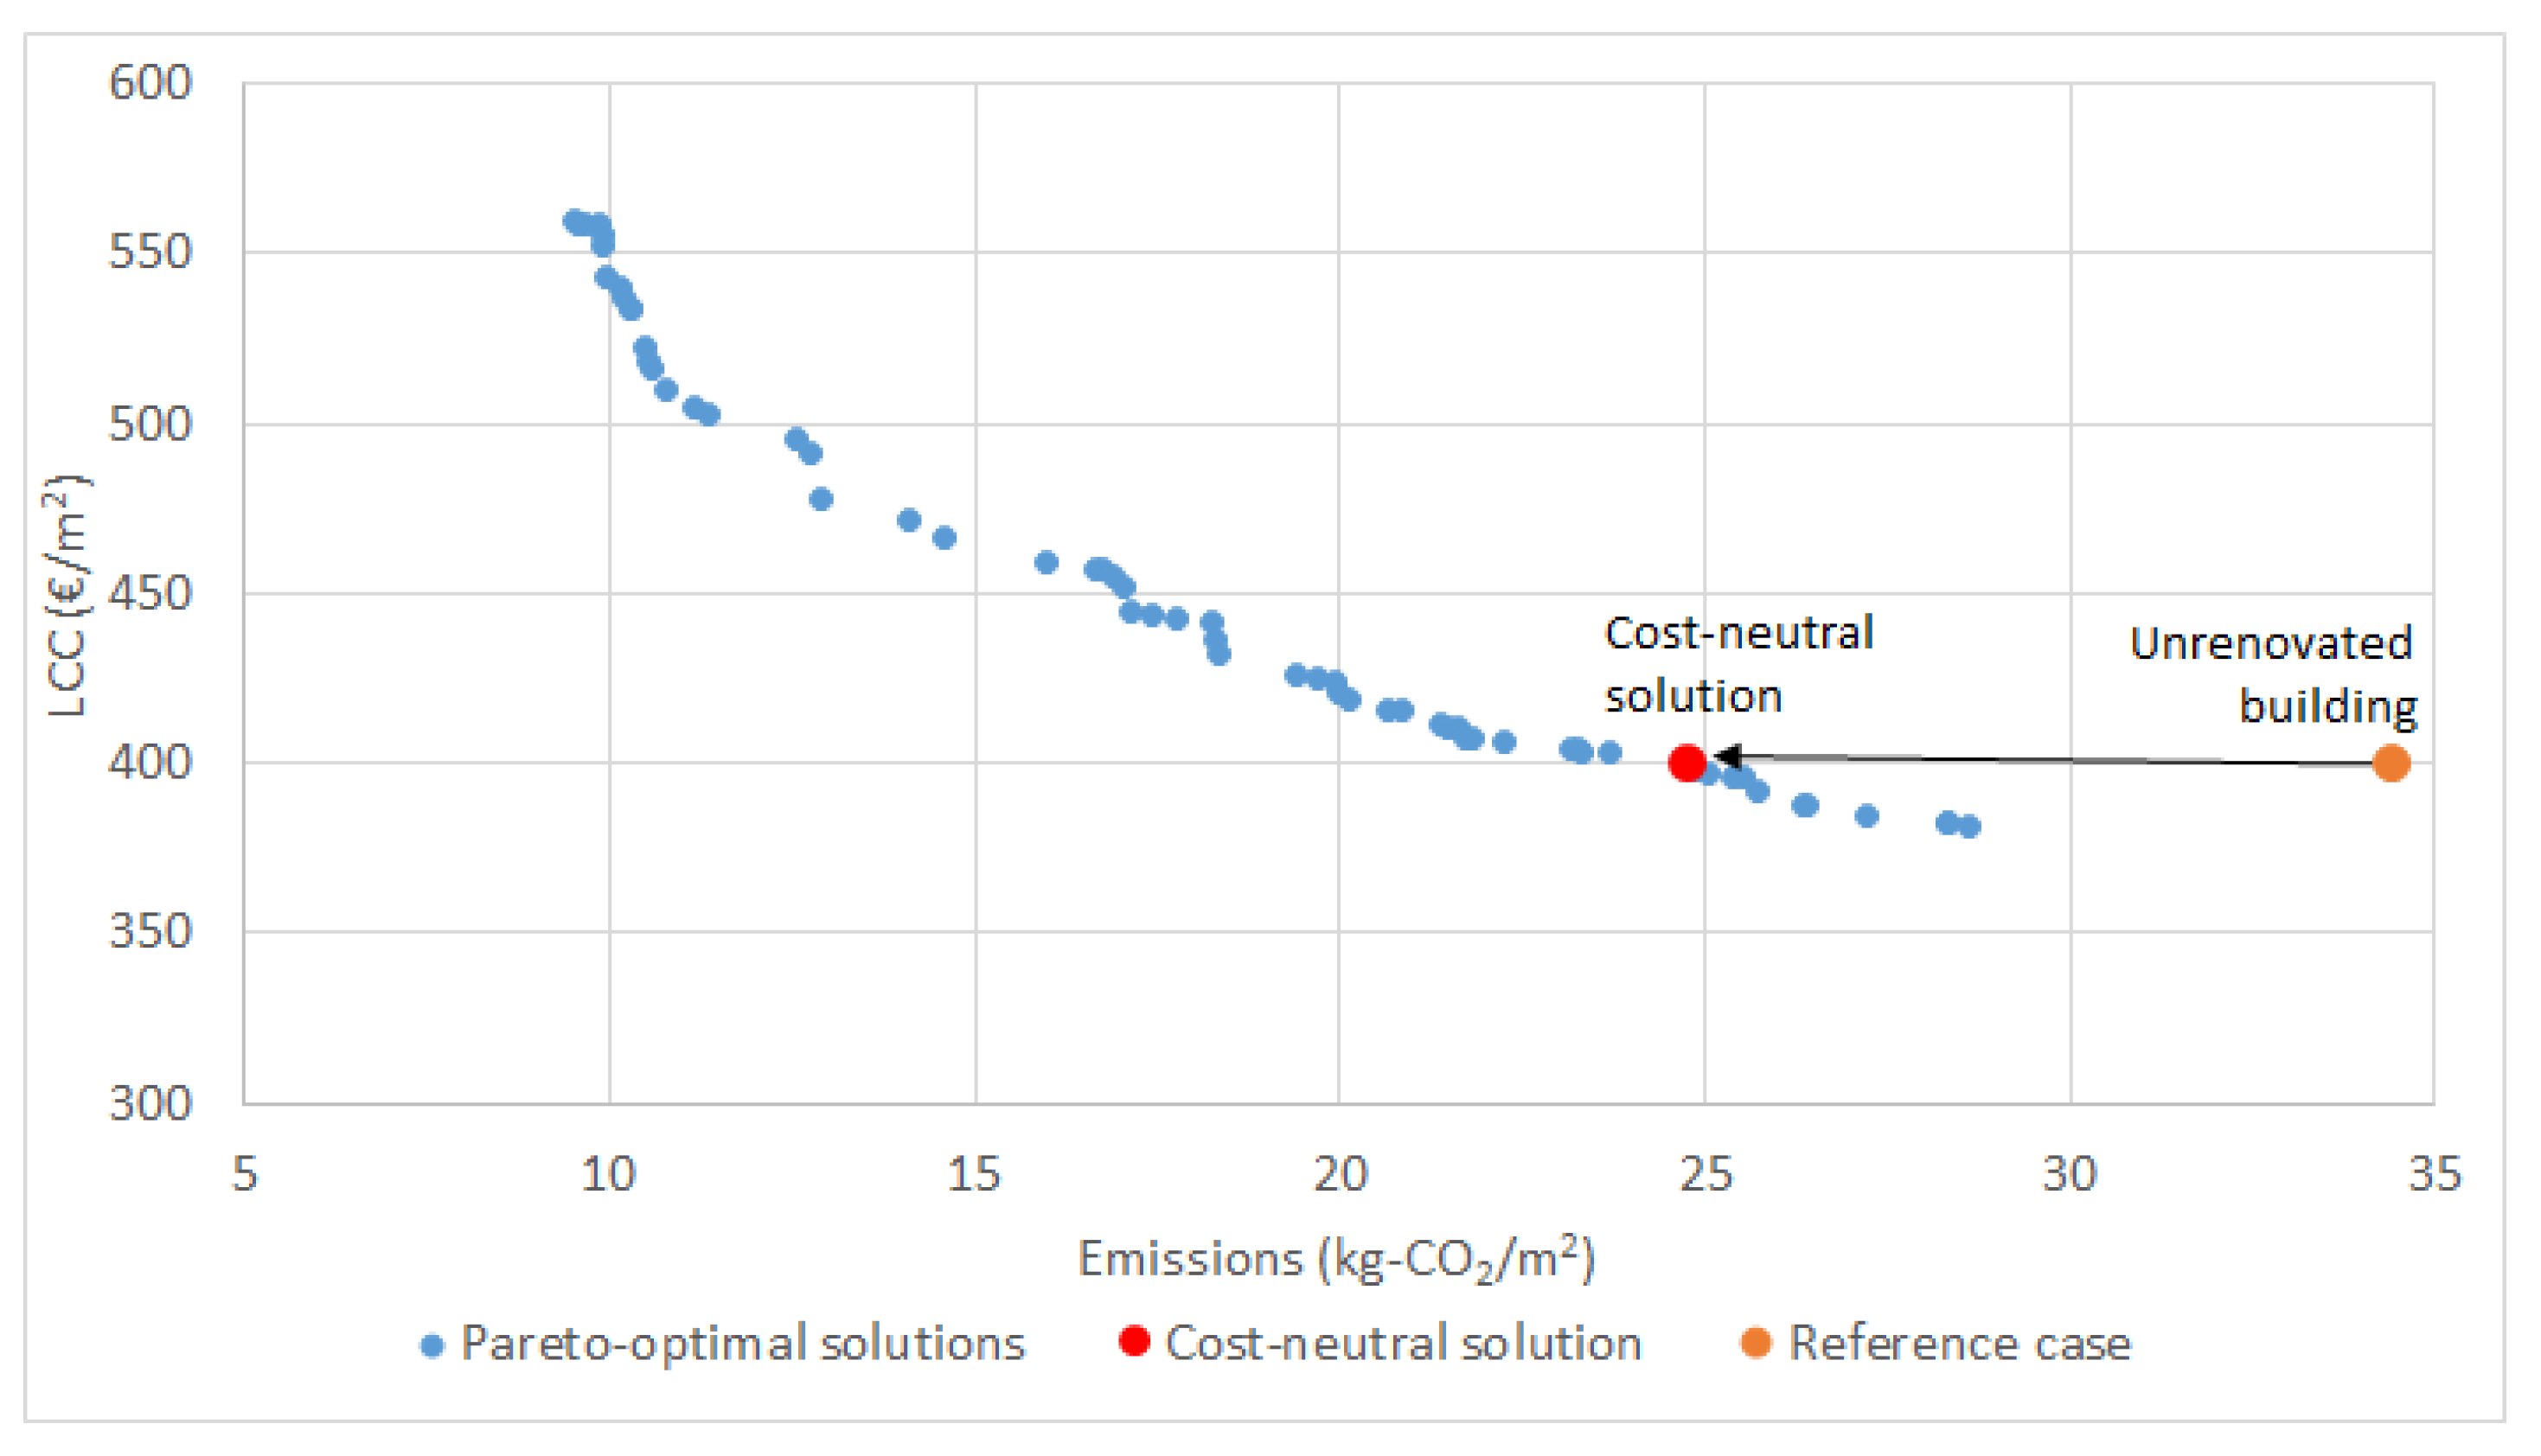
2.4.4. Commercial Buildings

The commercial building was a 2554 m2 hall-like retail space with side offices. The reference building was based on a new commercial building presented in Reference [40], which was then downgraded to match the building code of the 1980s (lower insulation values, no ventilation heat recovery). Unlike the others, this building type was not based on a previous optimization study. With the commercial building, the retrofit consisted only of the installation of solar panels and the installation of GSHP. The cost-neutral level of solar panels was very large, with 80% of power being sold back to the grid. For comparison, a case with a smaller, minimum LCC PV array was also simulated and presented in this compilation. The properties of the retrofitted buildings are shown in Table 3.

2.5. Costs and Emissions
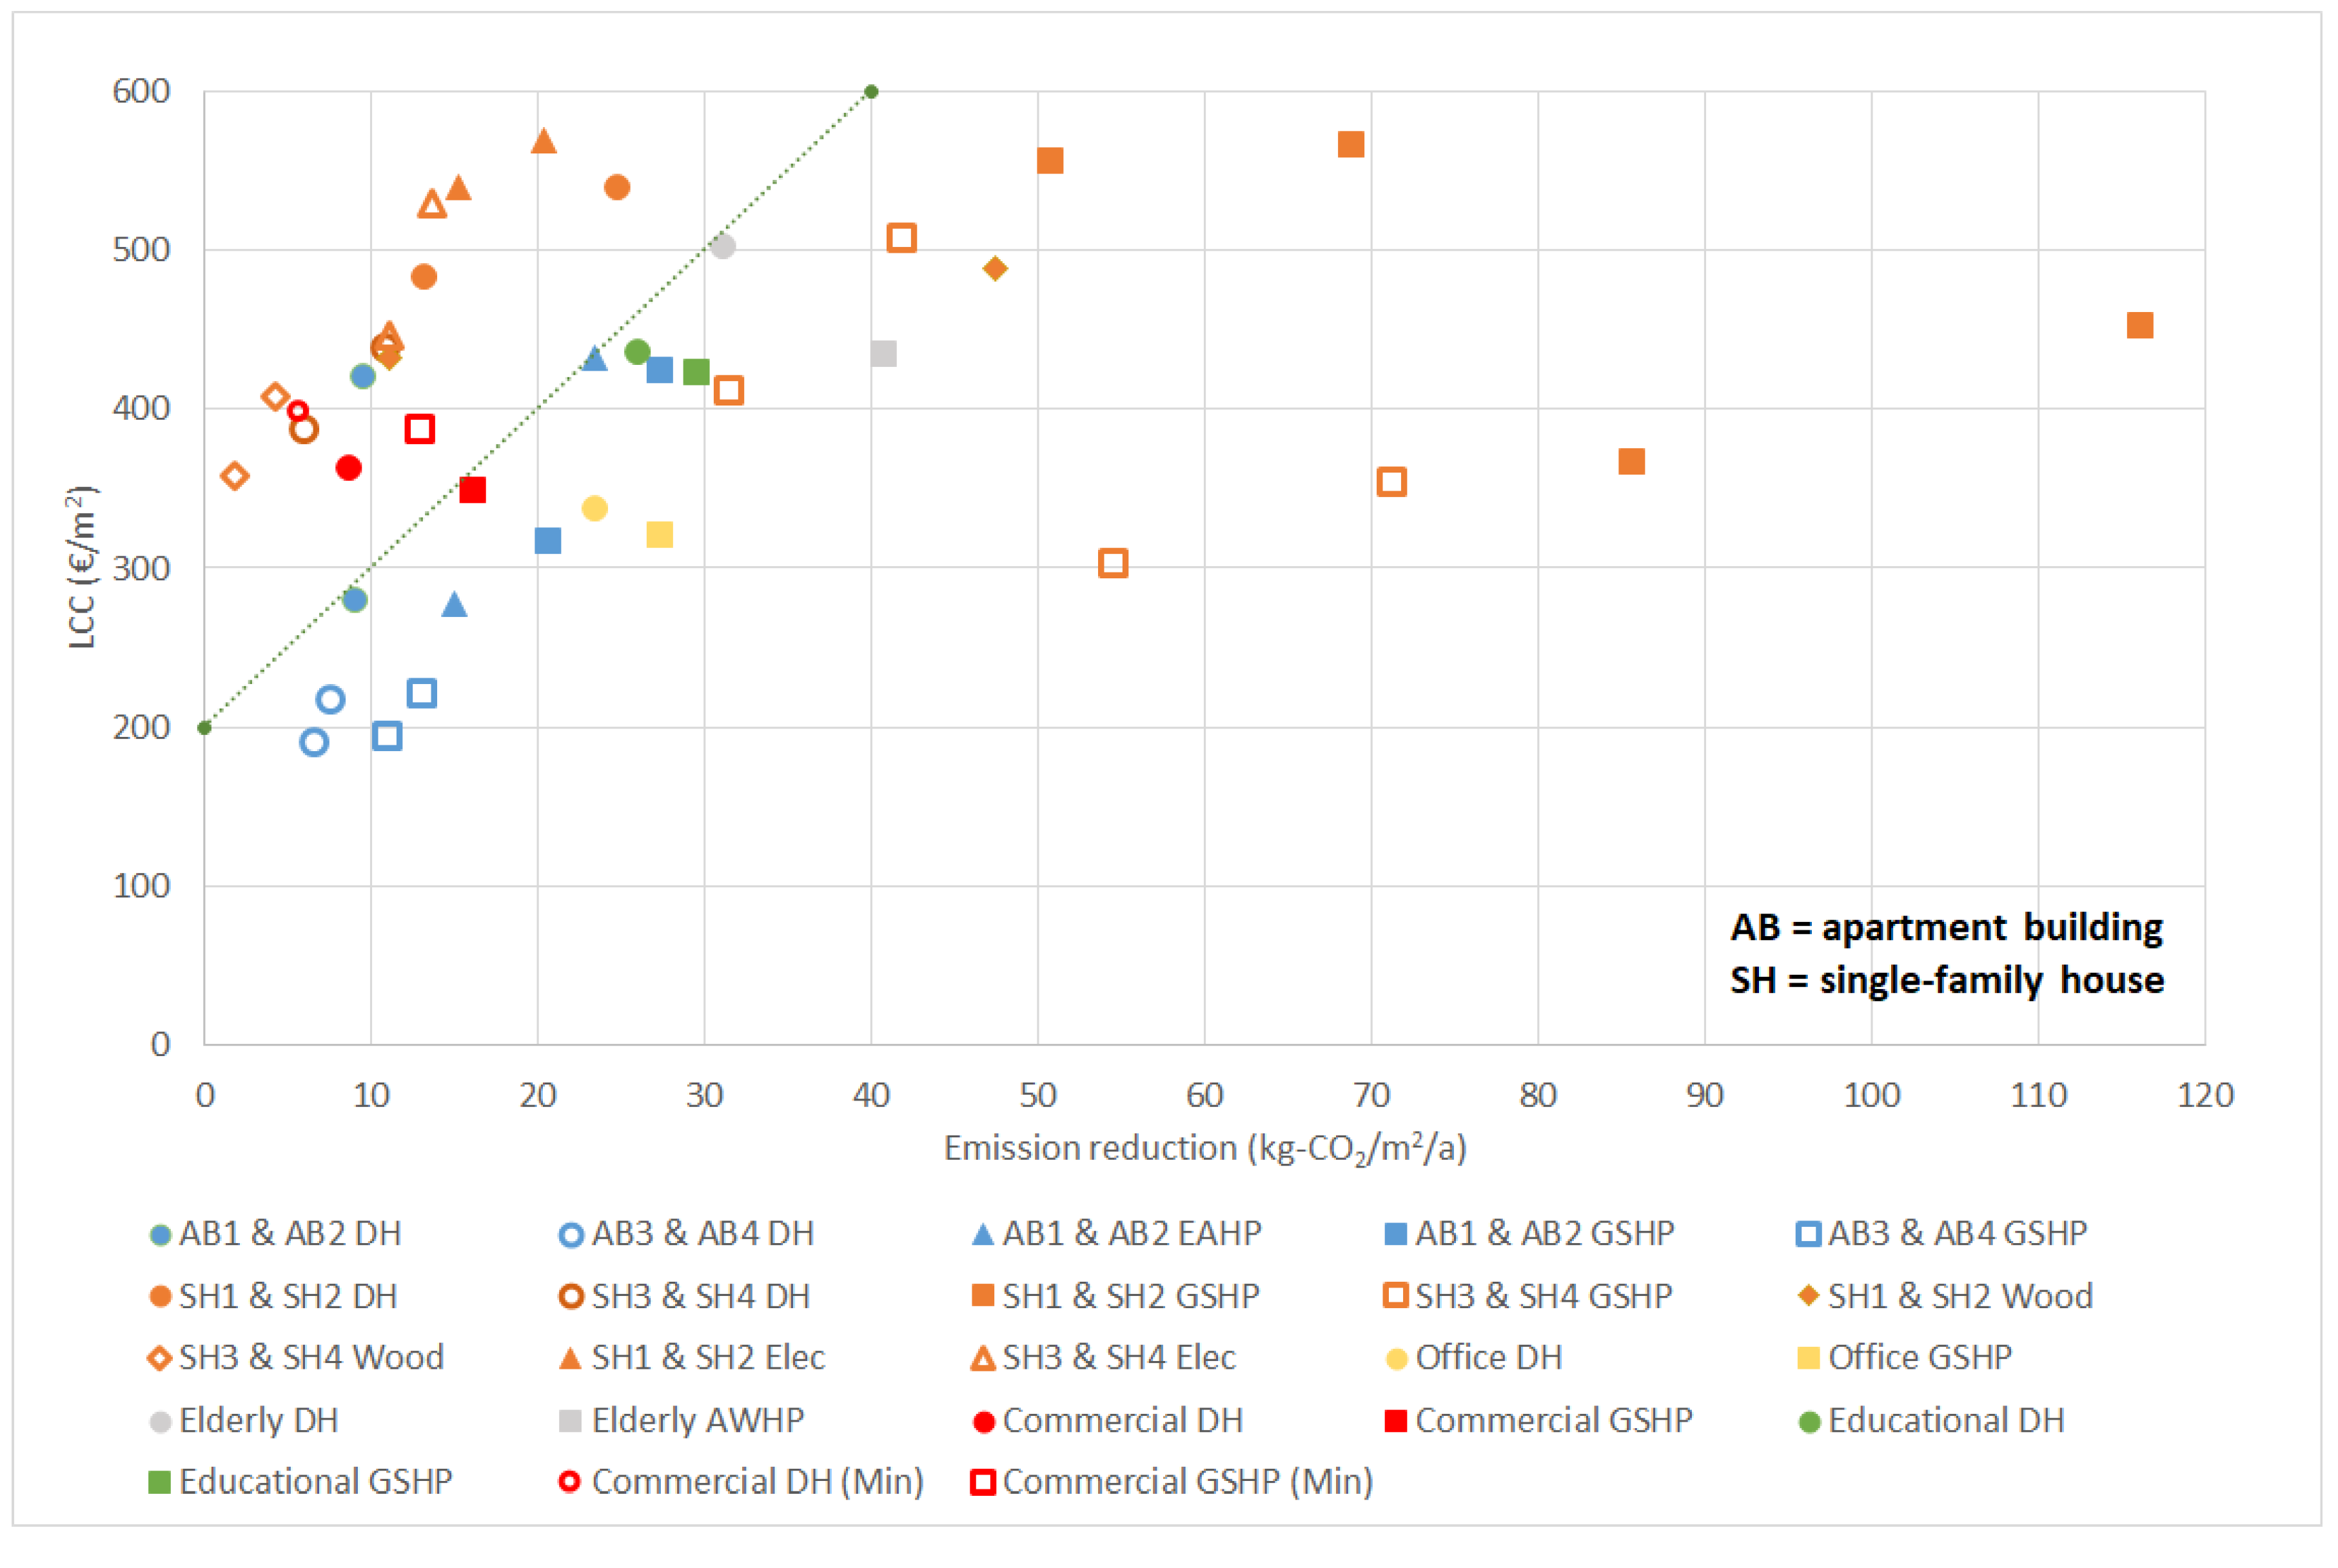
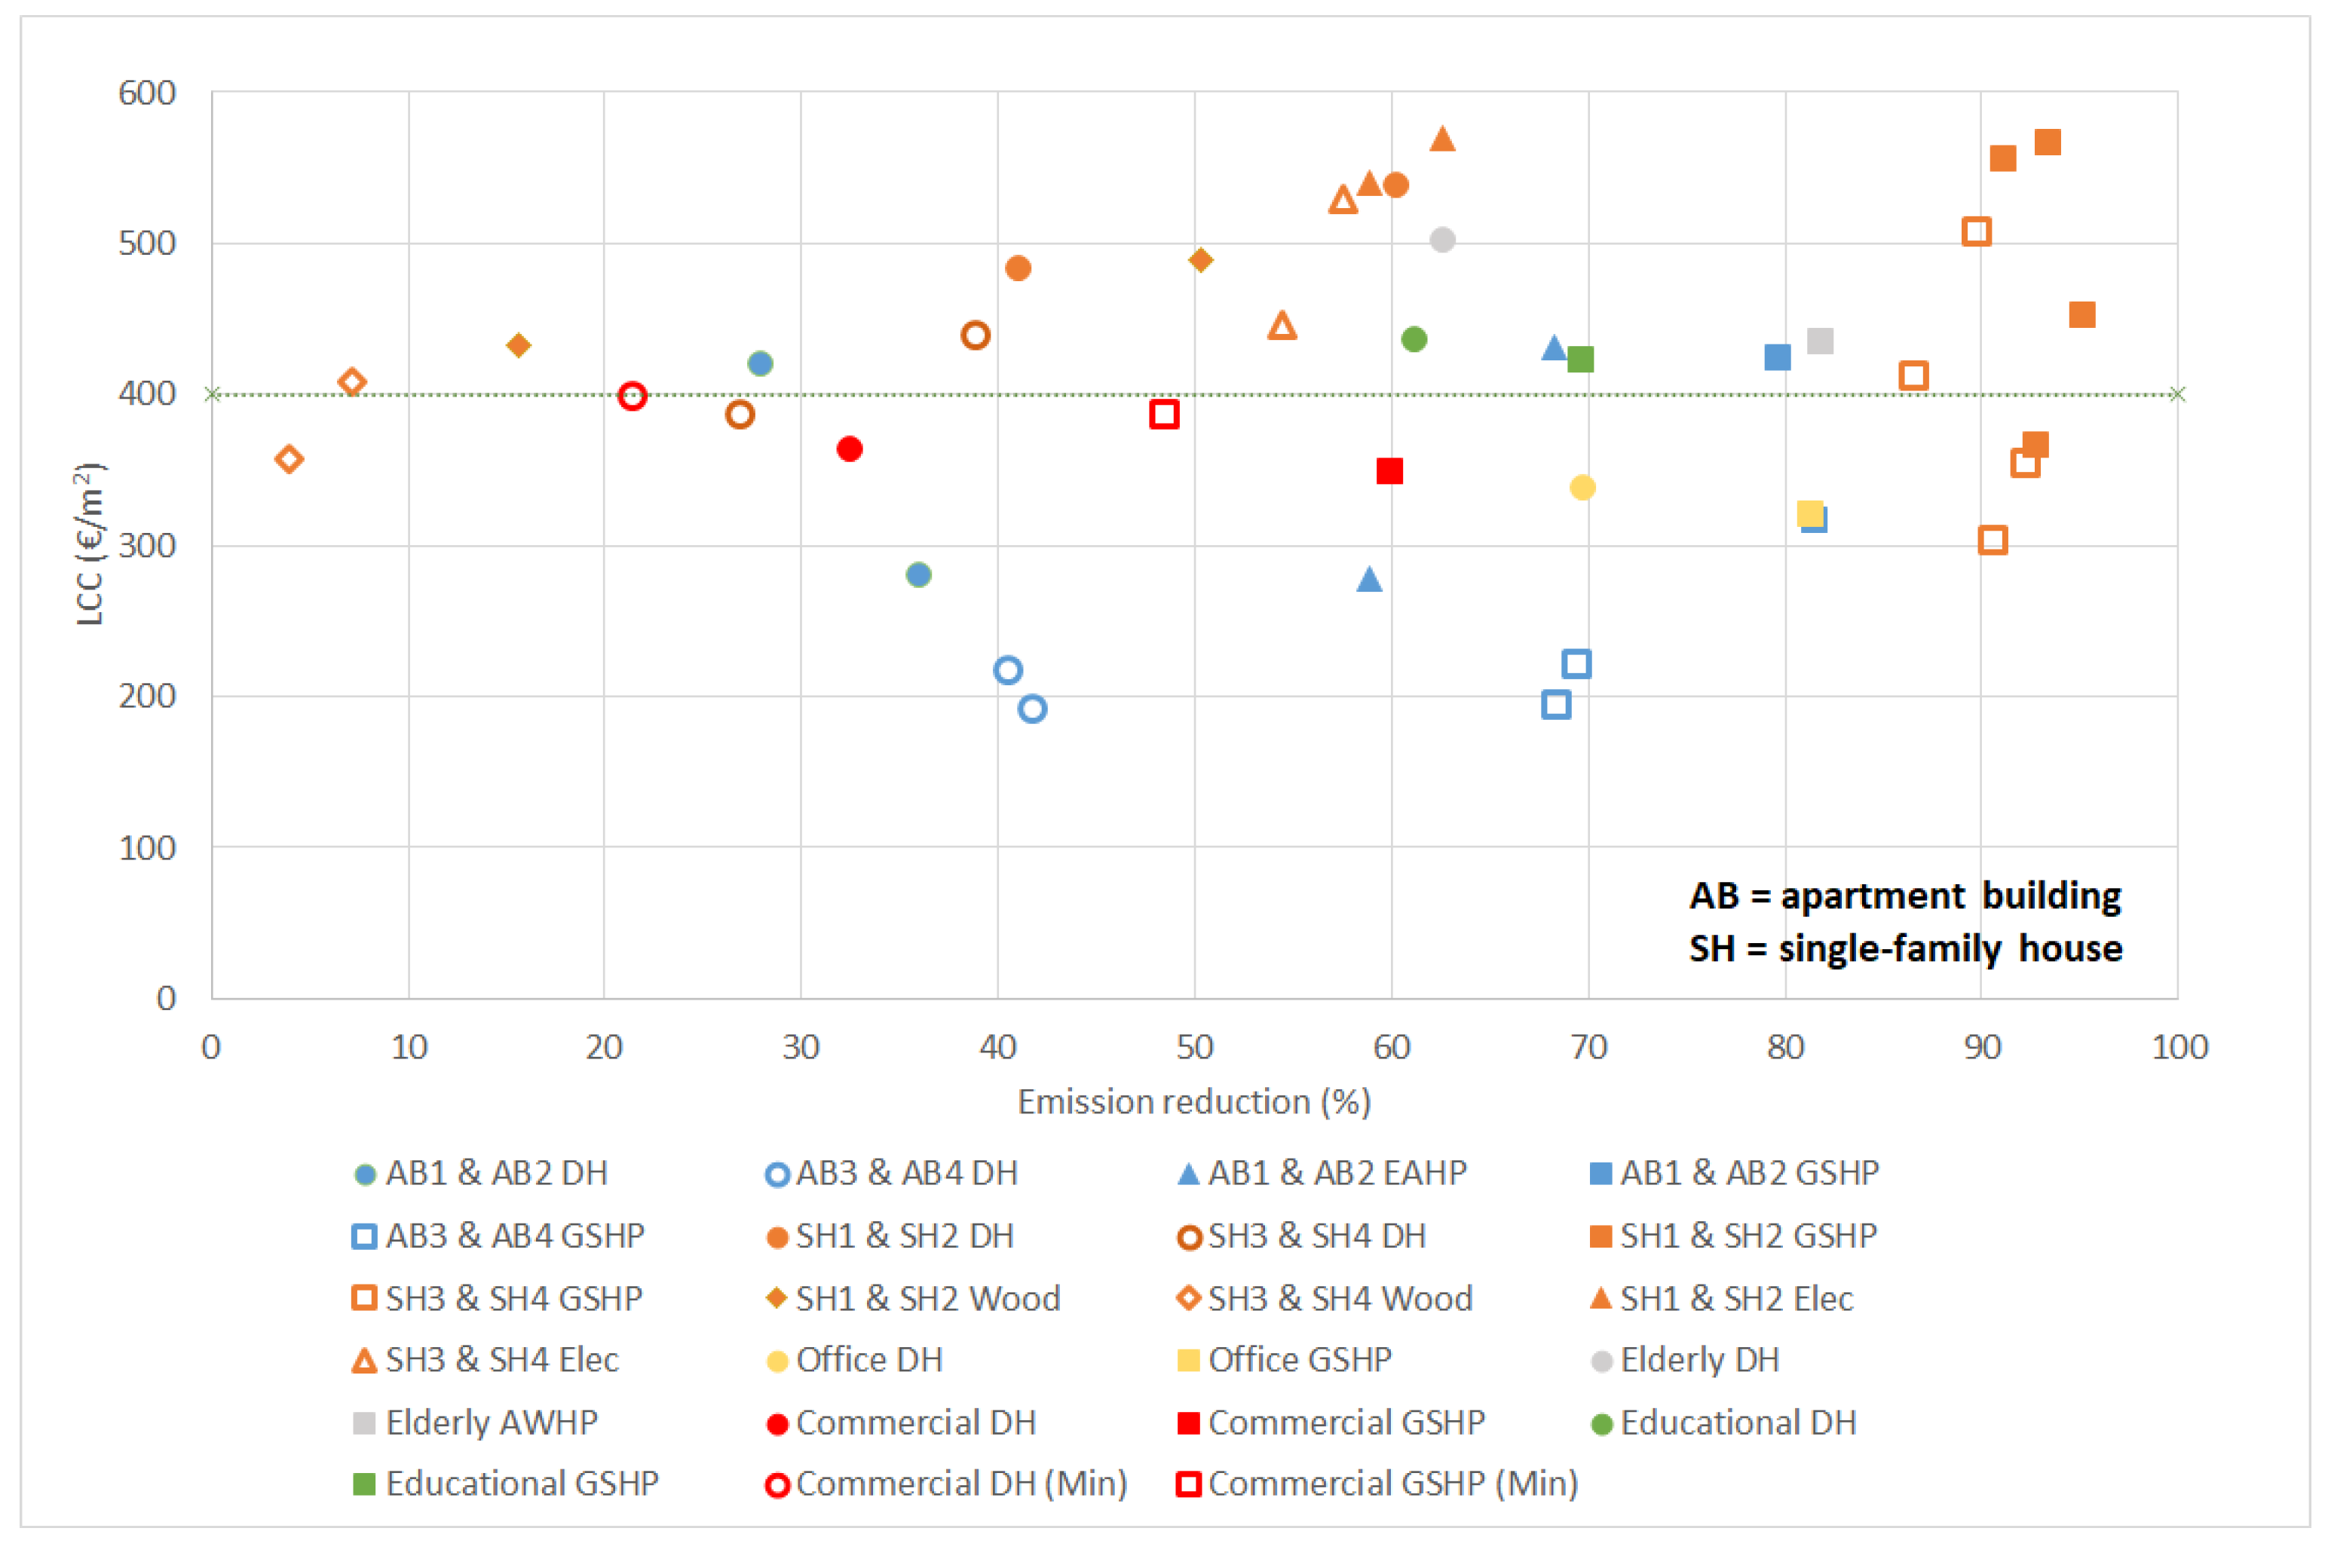
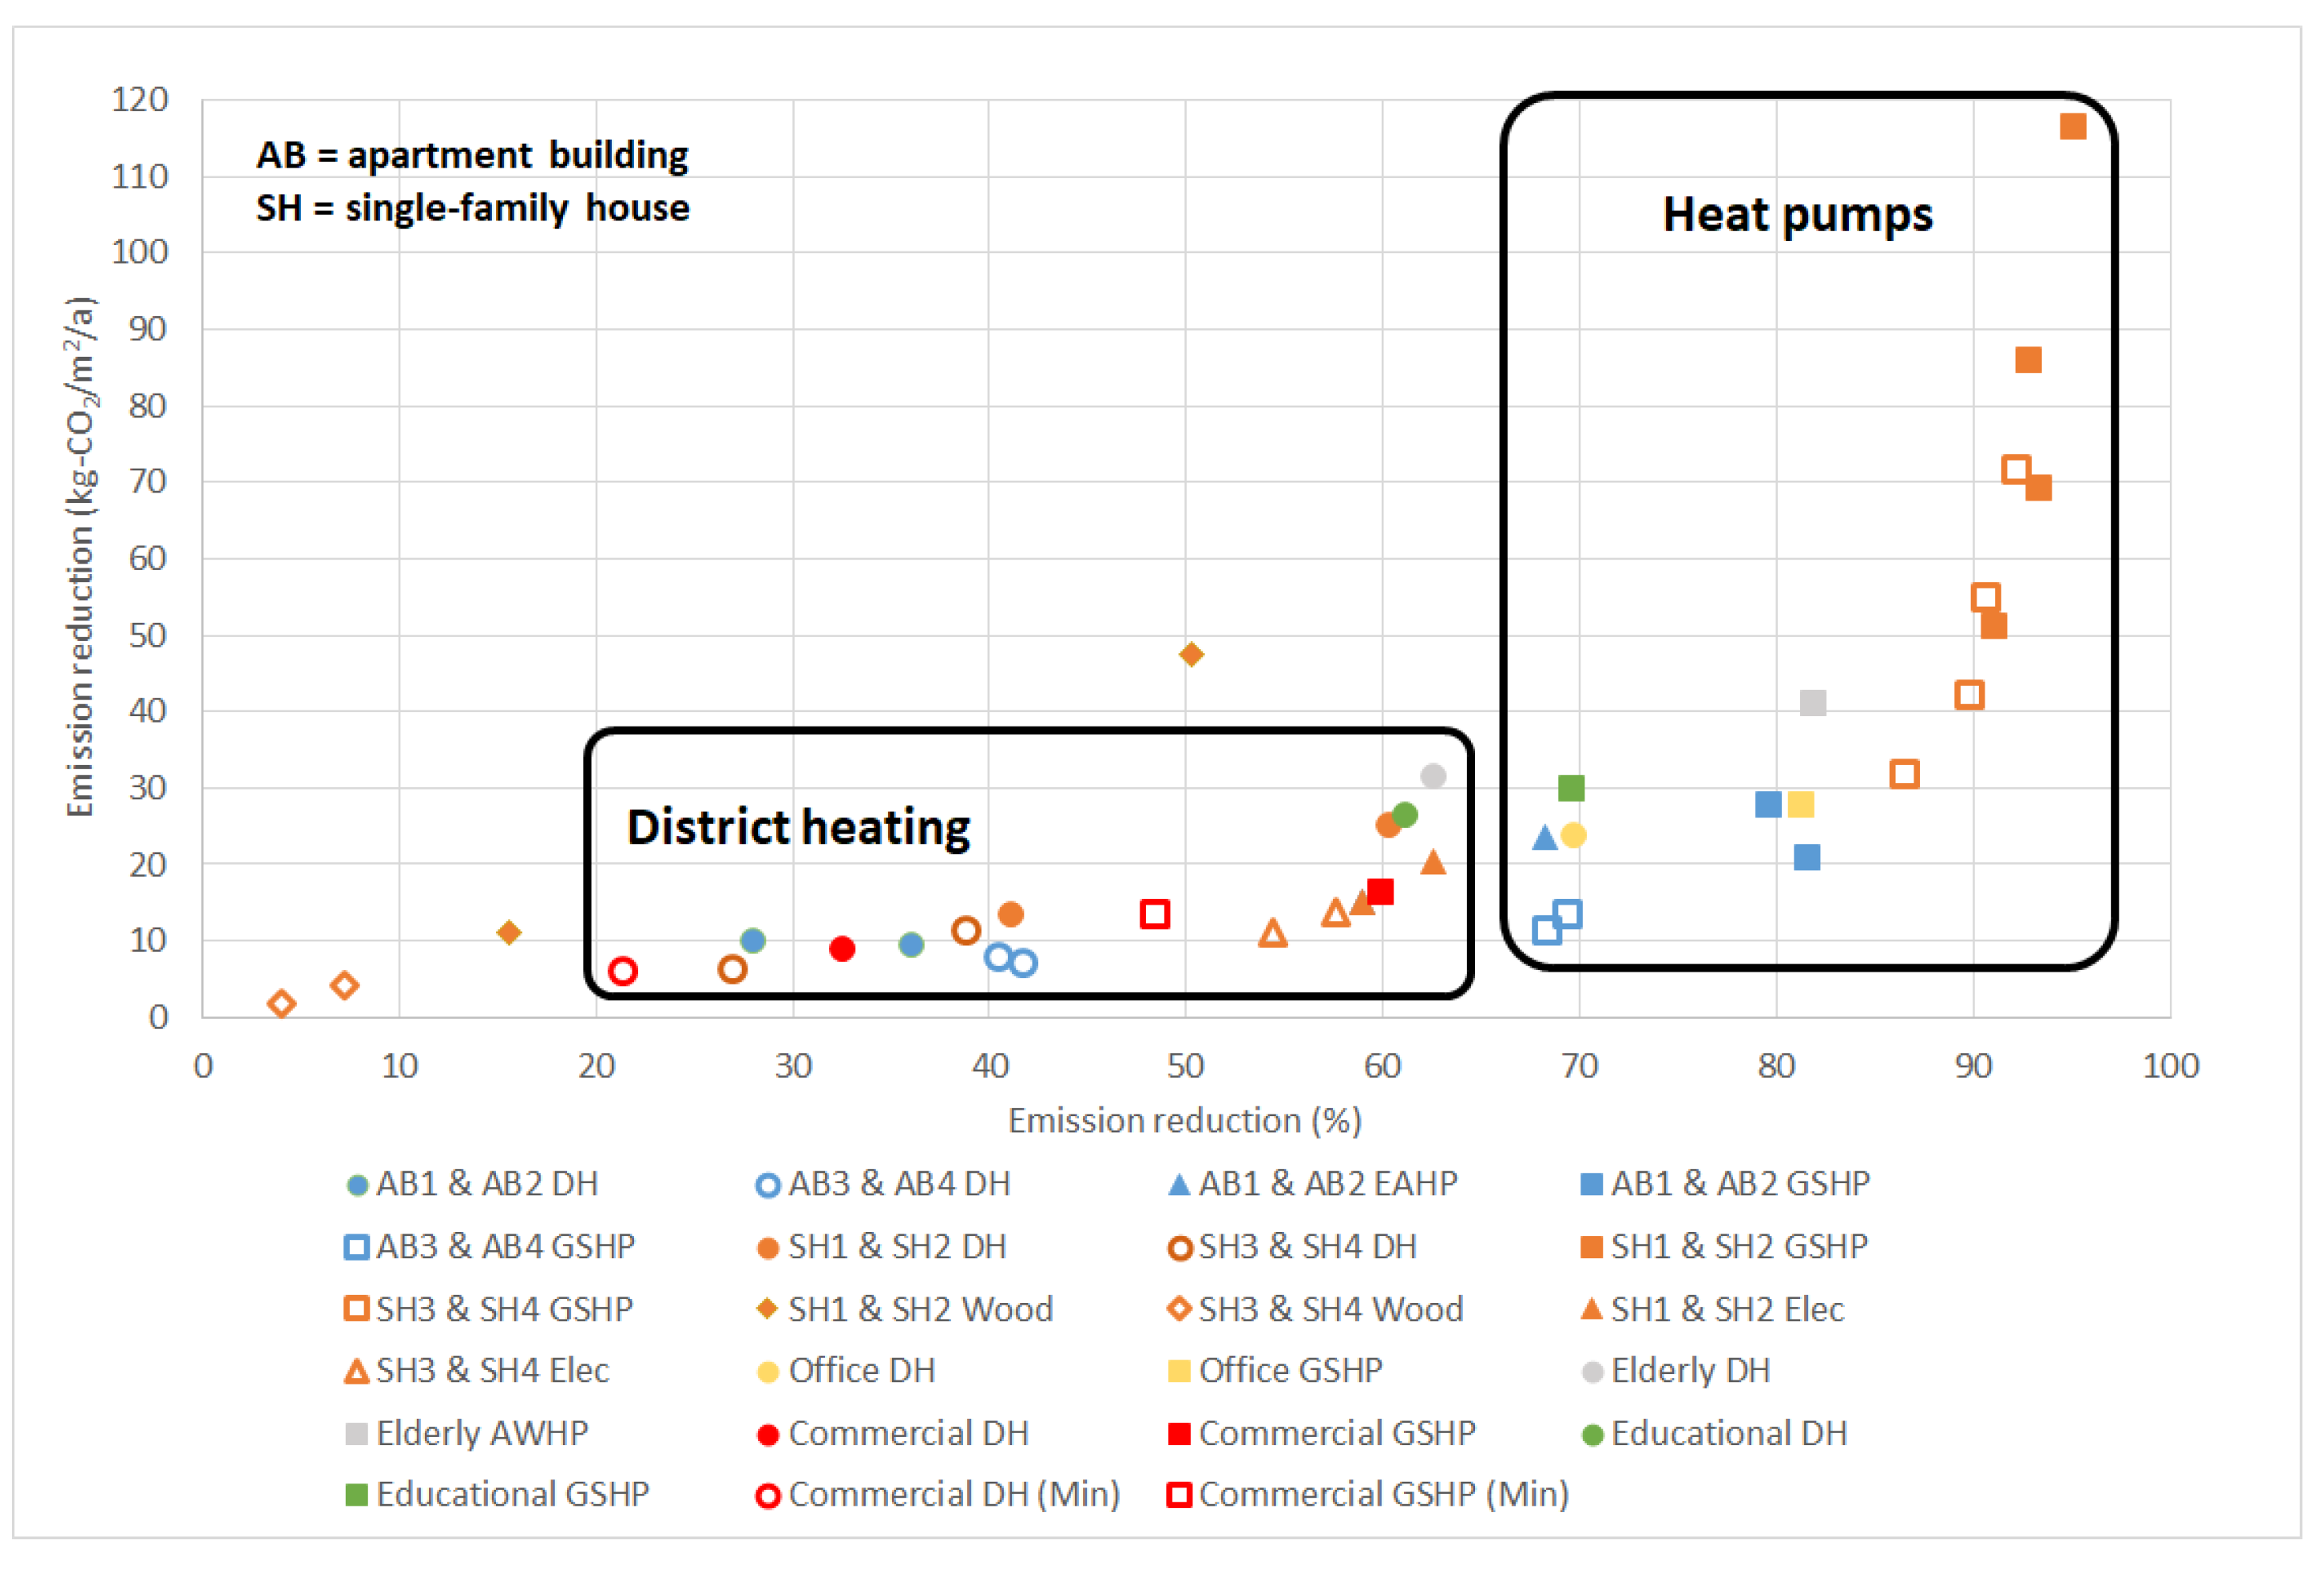
The LCC of the different cases was determined as the discounted sum of the initial investment and lifetime energy use costs. The investment costs were taken directly from the previous optimization studies. The energy costs were recalculated using the same discounting factors for every case. The interest rate was 3%, while the annual energy price escalation rate was 2%. The calculation period was 25 years. The costs of district heating are shown in Table 4. Monthly DH prices were weighted accordingly to get a constant energy cost. The prices of electricity are shown in Table 5. The price consists of the fixed and consumption-based costs, the latter consisting of distribution costs, market-based energy cost, and the national electricity tax. The costs for electricity distribution were influenced by the maximum power demand and season. Since 70% of electricity consumption happens during the colder half of the year, similar weighting was used to get a constant electricity distribution cost. The cost of heating oil was 104 €/MWh and the cost of wood fuel was 56 €/MWh.
The emission factors used in the calculations are shown in Table 6. Here, the emissions of wood-burning were given according to actual carbon content, though typically they are assumed to be zero due to absorption in new tree growth. An important local factor on the results of the study is the low emission factor of electricity compared to district heating. Even though the efficiency of heat generation in combustion power plants (with cogeneration or not) is higher than electricity generation in typical power plants, the electricity sector in Finland also includes significant amounts of zero carbon electricity generation, like nuclear, hydro, and wind power. This can be expected to favor electrical heating solutions.

3. Results

Figure 4 shows how much the CO2 emissions can be reduced in different building types with different heating systems versus what would be the investment cost per heated floor area. The selected cases represent buildings for which a cost-neutral retrofit was done, so that the life cycle cost of the retrofitted case was the same as for the reference case without retrofits. Mostly the cost-neutral measures provided emission reductions of 2 to 40 kg-CO2/m2/a, but, in single-family houses with on-site boilers, the reduction potential was as much as 40 to 115 kg-CO2/m2/a.
The results in Figure 4 were grouped by a line to high and low-cost cases. On the high cost side were the electrically heated single-family houses, new wood heated single-family houses, commercial buildings and some district heated residential buildings. The position of electrically heated houses is explained by the high cost of electric heating and the resulting high LCC of the reference case. Since the retrofit cases were chosen by cost-neutrality with respect to LCC, this resulted in high investment costs and low cost-efficiency due to the low emission factor of electricity. The cost-neutral commercial building retrofit was also on the high side, because a large number of solar panels were cost-neutral in the long term, but had diminishing emission reducing effects. On the lower cost side, there are the office, educational and elderly care buildings, as well as many of the residential buildings. When considering where to focus retrofit actions and the use of limited funding, buildings on the right side of the dividing line are good candidates. Lower emission reduction unit costs help create more impact for the same investment.
The greatest emission reduction potential was in single-family houses where wood or oil heating was replaced by GSHP (orange squares). This was to be expected, since the emissions of wood and oil are high versus the emissions of electricity. Here, the investment cost was between 200 to 500 €/m2 and emission reductions between 30 and 120 kg-CO2/m2/a. In electrically heated buildings, the chosen measures were costly (300 to 400 €/m2) with somewhat low emission reduction potential (10 to 20 kg-CO2/m2/a).
The other building types are clustered on the lower side of emission reduction and have roughly linear investment cost versus emission reduction relation 50 to 300 €/m2 and 2 to 40 kg-CO2/m2/a. GSHP installation in old apartment buildings (AB1 and AB2) reduced emissions by over 20 kg-CO2/m2/a, while, in new buildings (AB3 and AB4), it was between 10 to 15 kg-CO2/m2/a. GSHP systems had higher investment costs than district heating systems in the same building type.
Elderly homes (gray) had the largest emission reduction potential of the non-residential buildings. For commercial buildings (red), going from minimum cost PV array to cost-neutral PV array reduced CO2 emissions only by a little, but significantly increased investment costs (+200 €/m2). Emissions in office buildings (yellow) and educational buildings (green) could be reduced by about 25 kg-CO2/m2/a. Elderly homes and other social or healthcare buildings are especially good candidates for energy retrofits due to their round-the-clock use. Schools are closed in summer and offices during the weekends, but the need for social care buildings remains constant.
Figure 4 also presents some values for emission reduction cost, calculated as investment cost divided by cumulative emission reductions over a 25-year period. These costs ranged from 132 €/t-CO2 in the most cost-effective case (old single-family house switching from a wood boiler to a GSHP) to 2918 €/t-CO2 in the least cost-effective case (new single-family house that keeps using a wood boiler). Of course, these investments also result in reduced operation expenses which are not counted in this value. All the cases were cost-neutral with respect to LCC in the original sources, so, in that sense, the lifetime reduction cost was zero.
Figure 5 shows the emission reductions versus life cycle costs. Using LCC, the monetary value of energy savings is taken into account. All examined building retrofits fit between 200 and 600 €/m2 during the life cycle. The retrofit cases in Figure 5 were grouped to low and high cost cases by a line of constant LCC/emission reduction. All the service buildings were on the low cost side, except for district heated commercial buildings. The priority message in Figure 5 is similar to Figure 4.
In both new and old single-family houses, priority should be given to replace on-site wood and oil boilers with GSHP. Electrically heated houses have a high LCC and average emission reduction because the energy source is expensive but has a low emission factor. In wood heated houses the energy source is cheap, which reduces the economic potential of energy efficiency improvements. In educational and office buildings, the DH and HP cases are very similar in terms of emissions and LCC. Looking at the commercial building, the cost difference between the minimum cost and cost-neutral cases are much smaller using LCC compared to just the investment costs.
Figure 6 shows emission reductions as a percentage value. This reduces the weight of old buildings versus new. The life cycle cost range for the cost-neutral building energy retrofits is 200 to 600 €/m2. More specifically, most cases have a life cycle cost of 300 to 500 €/m2.
GSHP systems provided the biggest relative reductions, 48% to 95%. With district heating, the range for reductions was 20% to 70%. Smallest changes happened in single-family houses that kept using wood boilers. The biggest changes were in single-family houses that switched from on-site boilers to GSHP. Switching from DH to GSHP was also effective for reducing emissions. In most service buildings, the emission reduction potential was over 60% with both DH and heat pumps. This exceeds majorly, for example, the reduction potential in district heated old apartment buildings. In commercial buildings with district heating, simply the addition of solar electricity could reduce emissions by more than 30%, which is a good achievement considering the heating-dominated climate and the minimal solar energy availability during the winter.
Figure 7 shows the absolute and relative emission reductions in the retrofitted buildings. In more than half the cases, it was possible to reduce emissions by more than 50%. Absolute emissions have a roughly linear correlation with relative emissions until about 80% reductions, but there are also cases where the absolute emission reductions between different buildings are the same, even though they have very different relative emission reductions. The reduction potential for district heated buildings was between 20% and 70%, while, in buildings switching to heat pumps, it was 70% to 95%. In the different types of service buildings, the emission reduction potential was between 60% and 85%, and great reductions were possible with both heat pumps and district heating.

4. Discussion

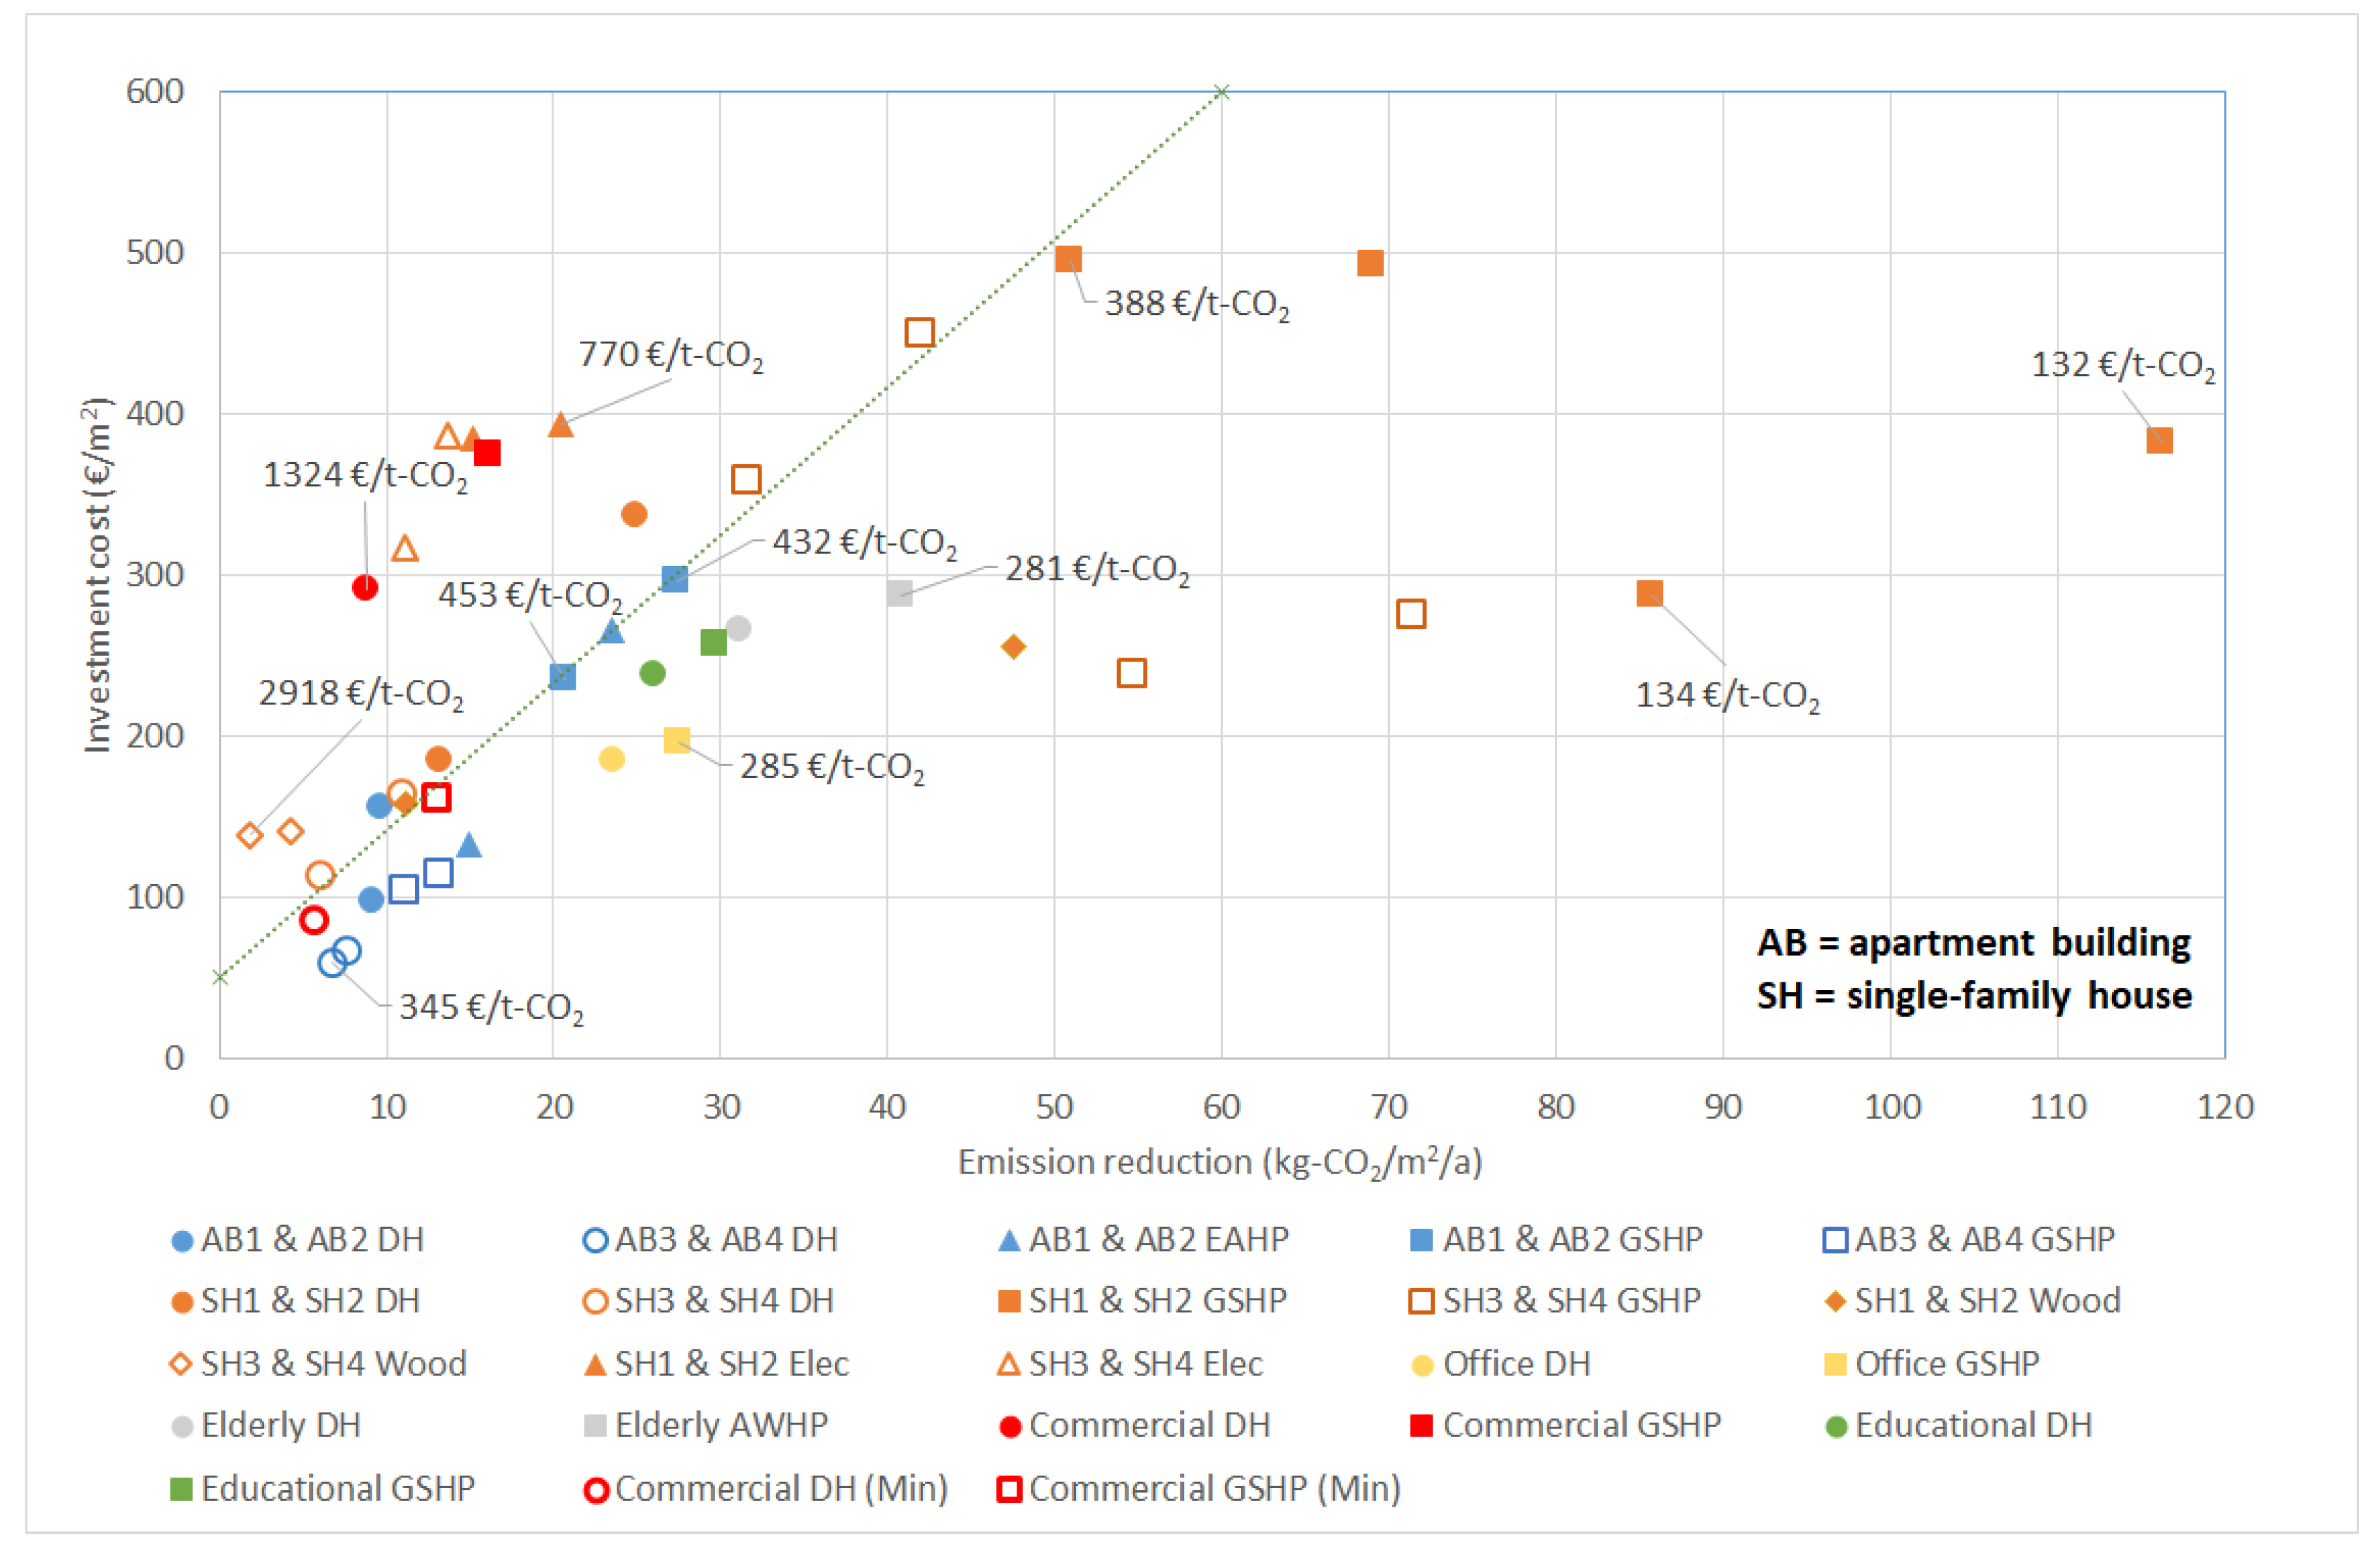
4.1. Emission Reduction Potential and Emission Prices

In most of the examined buildings, emission reductions of 30% to 70% could be achieved in a cost-neutral manner and in some buildings as much as 80% to 95%. The investment cost for most buildings was 100 to 400 €/m2. The emission reduction potential in the majority of examined buildings was 5 to 40 kg-CO2/m2/a, but reductions of 40 to 115 kg-CO2/m2/a were achievable in single-family homes with oil or wood based boilers, which represent a significant share of the whole building stock. A detailed examination of emission reduction potential in the whole building stock was out of the scope of this paper. However, Finland has 300 million-m2 of residential buildings and 110 million-m2 of service buildings [57]. It is estimated that heating of buildings is responsible for 7.8 Mt-CO2 or 17% of Finnish emissions [58] and that all energy consumption in buildings causes 30% of Finnish emissions [59] or 17 Mt-CO2. A separate study is forthcoming from Hirvonen et al. to analyze the emission reduction potential in the building stock, taking into account the shares of buildings built in different periods and the distribution of different heating systems. In addition, the economic benefits in the private and public sector should be analyzed as large-scale retrofits also influence the job market and tax revenues.
The minimum investment cost to mitigate 25 years of CO2 emissions by cost-neutral building renovation was 132 €/t-CO2. The average cost was 578 €/t-CO2. This can be compared to the cost of emission reducing measures in the power generation sector and to the cost of carbon taxes or carbon absorption schemes. For example, the Finnish CO2 tax related to gasoline is 83 €/t-CO2 [60]. However, if all the taxes on gasoline were accounted as CO2 tax, the cost would be 336 €/t-CO2. The cost of compensating for CO2 emissions by planting trees in Finland over 25 years is 23 €/t-CO2 [61]. The cost of emission allowances in the European Emission Trading System (EU ETS) is about 25 €/t in the year 2020. This suggests an underpricing of emission allowances, as even cost-effective building energy retrofits are many times more expensive than simply purchasing the right to emit. Of course, these retrofit measures also reduce energy consumption and thus provide monetary savings, as well. In the life cycle point-of-view, the emission reduction cost in this study was roughly zero in all cases. In addition, building retrofits are always long-term affairs that can produce cumulative emission reductions even past the calculation period.

4.2. Benefits of Building Energy Retrofits

Building energy retrofits reduce the cost of living and often pay for themselves over time. However, there are also other benefits in doing energy retrofits. For example, energy retrofits increase property values, which can reduce the effective cost of retrofitting. It was estimated that 77% of the investments made into the retrofits of Danish single-family houses was transferred into property values [36]. Reduced heating expenses are valuable even when moving out of the house, as the new owners are willing to pay more for a house with lower upkeep. Increased property values have also been observed in retrofitted office buildings [34]. Improved indoor air quality and thermal comfort are also valued by occupants, but it is hard to determine their value in the market. Lower number of missed work and school days due to lesser respiratory illness impact is a concrete benefit [62]. Indoor air quality has an effect on worker productivity [63], which should be of interest for all businesses. Energy efficiency may also improve brand value, which can result in increased sales [64].

4.3. Drivers and Obstacles of Change

Because heat pump systems are cost-effective without any government grants, it can be expected that more and more building owners wish to switch away from municipal DH grids into their own heat pump systems. The interests of residents and municipalities—which own the district heating grid—are in conflict because energy saved by residents means less income for the municipality. City-owned utilities can also cause a conflict against the city’s own climate goals. For example, utilities can increase the fixed cost of available heating capacity, while reducing the cost of actual consumption to make it more difficult to use heat pumps for support heating. This can be justified through the benefits of the whole district heating system compared to the benefits of individual buildings, as the efficiency of combined heat and power generation is reliant on both the district heating consumption and return temperature [65]. However, discouraging auxiliary heat pumps can result in building owners completely cutting themselves off of the district heating grid. To prevent this, the utilities could also start installing their own heat pump systems either in the client building or in a centralized heat pump facility. This way the use profile of the heat pump could be optimized according to the needs of the heating grid. Centralized heat pumps have the potential to reduce district heating costs, but at the same time they may raise the cost of electricity, which would improve the feasibility of CHP district heating [66]. Several private companies in Finland are already selling their heat pumps as a service, which means that residents do not need to invest their own capital and can get monetary savings from day one.
Lack of capital is a problem for both individual house owners and housing cooperatives. Many housing cooperatives already have significant debts due to plumbing renovations or other unavoidable maintenance. Building owners can be afraid of incurring new debt, even if said debt could be economically profitable. Sometimes energy efficiency can be improved as a side effect of comfort improvements. Comfort has been reported to be a more common reason for wanting to do renovations than cost savings [35]. However, building owners who do not live or work on the premises might not be interested in expending money for the renters’ comfort.
It was shown that, in a low interest rate environment, cost-effective building energy renovation is possible in all building types. However, many building owners may be afraid of the investment due to lack of information. New investments into energy retrofits could be encouraged through a public retrofit database. Building owners (companies, housing cooperatives, homeowners) could report their current energy consumption information to an open database, where companies could analyze them and offer solutions. This would lower the threshold of making contact and would automatically allow competing offers. Energy consumption statistics shown before and after retrofits would make previously apprehensive building owners more interested in joining the system, as well. This could be tied to the energy retrofitting subsidies that are in place in 2020–2022 [67]. Completed projects could be required to report their results (such as cost and achieved savings) to the open database in an anonymous way. Municipalities could also encourage energy renovation investments by promising rent discounts for buildings lying on land owned by the municipality, on the condition of achieving improved energy efficiency levels. One solution would be to lower property taxes for energy efficient buildings. However, this would require changes in tax legislation and hurt the most reliable income source that municipalities have. The national government might have to compensate for the income lost this way [68]. Some building owners are afraid of increasing debt loads, as money also needs to be put into mandatory renovations not related to energy. Very low interest renovation loans with long enough amortization periods should be available to encourage building retrofits. The immediate costs could also be externalized through the use of energy-as-a-service provided by retrofitting companies, where the company providing the service provides the initial capital for the improvements and just collects monthly fees as payment.
There are clear societal benefits of energy efficiency, but the sometimes long payback periods can be an obstacle for businesses with high expectations of return on invested capital. Thus, owners of private service buildings might need additional encouragement from the public by, for example, legislation or tax credits. For example, the minimum requirements for energy efficiency improvements during building renovations could be raised according to current economic optimum. Municipalities and the national government could lead the way in building retrofits. They are often both the user and owner of the building, which helps in justifying the investment. The share of public buildings in the Finnish building stock is estimated to be 10% [59], which gives the public sector a major role in advancing building energy retrofitting.

4.4. Reliability of Results

A major question in this kind of study is the generalizability of the results. Many assumptions are required regarding the buildings themselves and the cost of energy. For example, the cost of district heating and electricity is reported differently in the Finnish statistics compared to pricing given by the utilities. In the statistics, the cost of DH might be given completely as an energy consumption-based cost, which disregards fixed monthly payments that are determined by the maximum power demand. This can overemphasize the role of energy demand savings. To provide more accurate cost analysis requires knowledge of the monthly or at least annual peak energy demand. Studies often report only the total annual energy demand without any seasonal or short-term variances. In this study, the heating power capacity cost was taken into account through hourly demand profiles, which improves the accuracy of the results, but makes the setup more difficult to understand. The selected DH consumption-based prices in this study were fixed for the whole year. It is also possible to have a contract with low prices in summer and high prices in winter.
Heat pumps turned out to be the most cost-effective retrofit solution in all buildings. This is mainly due to the lower emission factors of electricity compared to district heating. A national average was used for the district heating emission factor, but in practice there are significant regional differences. Some Finnish cities produce DH mainly with coal or peat, while others utilize wood or waste-based fuels. Thus, additional consideration of the utility of heating system switch is needed, depending on the location of the building. Similarly, the method of electricity generation in the Nordic electricity market (Nord Pool) changes every hour, so even electrified heating is not always equally clean. Decarbonizing the district heating system itself would reduce the relative benefits of electrification. Of course, it would also reduce the absolute impact of any building-side energy saving measures. Thus, the long-term view of building energy retrofits should also consider the feedback between the individual buildings and the energy grid. Buildings with on-site boilers will be good candidates for switching to heat pumps, regardless of changes in district heating plants. When interpreting the results, it is important to take the local context into account. The optimal solutions are based on Finnish cost levels, emission factors and construction practices.

5. Conclusions

In this article, we analyzed the climate impact of cost-neutral building energy retrofits in several different building types. The investment cost and life cycle cost of retrofit actions were also examined. The retrofit configurations were taken from previous studies, each examining a single building type for which cost-optimal retrofit options were found. In this study, the previous results were compiled together. The energy consumption profiles were generated using the IDA-ICE building simulation tool under the test reference weather data for Southern Finland. CO2 emissions were calculated using the average emission factors for Finnish electricity and district heating, as well as heating fuels. In Finland, the emission factor for electricity is lower than that of district heating or building-side heating fuels. The results apply conditionally to cold climates with relatively clean and low-cost electricity.
In all examined Finnish building types, emissions could be reduced in a cost-neutral way. The potential was different, depending on the heating system and building type. In service buildings where major retrofits were done (office, educational, and elderly care buildings), the emissions could be reduced by 61% to 82% at an investment cost of 180 to 300 €/m2. In commercial buildings, where only solar electricity or GSHP were installed, the reduction was 33% to 60% for cost-neutral retrofits with an investment cost of 300 to 380 €/m2. In apartment buildings, cost-neutral retrofits resulted in 28% to 82% reductions in emissions at an investment cost of 60 to 300 €/m2, with the higher reductions obtained using heat pumps. If the buildings remained in the district heating grid, the emission impact of retrofits was much higher in these service buildings than in apartment buildings. The retrofits were thus more effective per unit in the service building, but the built floor area of apartment buildings is about 20% higher, influencing total impact potential. Both the most and least effective energy retrofits were found in single-family residential buildings, where the range of emission reduction was 4% to 95% at a cost of 100 to 500 €/m2. The top range of both the reduction potential and investment cost was typically related to GSHP systems. Some residential buildings show significant potential to reduce emissions, but the residents may be lacking in capital. Service buildings have less variance, but there is still a lot of reduction potential. Here, the requirement for high return on investment may slow down deep building retrofits. The government could encourage retrofits by retrofitting public buildings and by giving retrofit grants or long-term low interest loans to both citizens and companies. Social care buildings, such as elderly homes, are good candidates for retrofits because of their high degree of use.
Replacing on-site boilers in single-family houses with ground-source heat pumps was the most effective emission reducing measure both in emission impact and low cost. In houses that kept using wood boilers, the cost-neutral reductions were limited due to the low cost of heating energy. Different types of heat pumps were the most cost-effective energy conservation measure (ECM) in all building types. Other common ECMs were envelope upgrades, such as the installation of new windows or additional thermal insulation to the roof. Solar energy (thermal or electricity) was utilized in all retrofitted buildings, as well. In office buildings, automated and demand-based lighting and ventilation control was cost-effective. In service buildings, such as educational and office buildings, the emission reduction potential was greater than in most apartment buildings. Looking at the total LCC, all non-residential buildings were on the lower cost side. Elderly care buildings had the largest emission reduction potential among the service buildings, which implies that more focus should be given to the other buildings which are always in use regardless of weekends or summer holidays, such as hospitals. However, no single building type could be said to be the best target for emission reduction based on achieved results in the cited studies, as the heating system also influences the result. The important point is that the whole building stock does offer chances for reducing emissions significantly and with reasonable cost. The building code should reflect this through more stringent energy efficiency requirements related to renovation work. To support this, low interest loans with long amortization periods should be available for performing the work.
By replacing district heating or on-site electric/combustion-based heating with heat pumps, emissions could often be reduced by 70% to 95%. Even in buildings which kept using district heating, emissions could be reduced by 20% to 70%. The benefit of heat pumps was dependent on the low emission factor of electricity compared to district heating. Thus, technology switching in district heating generation could alter the balance in favor of district heating. The greatest emission reduction potential was in buildings with on-site oil and wood boilers, which are not participating in the EU ETS. One way to enhance European climate action would be to expand the ETS to include building-side heating systems, as well. This could be done by mandating the purchase of emission allowances for heating fuel suppliers. This would have the largest impact on countries where on-site boilers are dominant. The emission reduction cost in the examined cases was at least 132 €/t-CO2, and the average cost was 578 €/t-CO2. This implies that, if building renovation in the EU is to be significantly sped up on an economic basis, the cost of emissions in the EU ETS should go up.

Author Contributions

Conceptualization, J.H., J.J. and R.K.; methodology, J.H., J.J. and R.K.; software, J.H.; validation, J.H., J.J., T.N. and P.S.; formal analysis, J.H.; investigation, J.H.; resources, J.H., T.N. and P.S.; data curation, J.H., T.N. and P.S.; writing—original draft preparation, J.H.; writing—review and editing, J.H., J.J., R.K. and P.S.; visualization, J.H.; supervision, J.J. and R.K.; project administration, R.K.; funding acquisition, R.K. All authors have read and agreed to the published version of the manuscript.

Funding

This research was funded by the Academy of Finland under the project “Optimal transformation pathway towards the 2050 low carbon target: integrated building, grids and national energy system for the case of Finland”, grant number 309064.

Conflicts of Interest

The authors declare no conflict of interest.

Abbreviations

AAHPAir-to-air heat pump
ABApartment building
AWHPAir-to-water heat pump
BalancedMechanical balanced ventilation
CAVConstant air volume ventilation
CHPCombined heat and power
DHDistrict heating
EAHPExhaust air heat pump
ECMEnergy conservation measure
EPBDEnergy performance of buildings directive
ETSEmission Trading System
ExhaustMechanical exhaust ventilation
GSHPGround-source heat pump
HPHeat pump
HRHeat recovery
HXHeat exchanger
LCCLife cycle cost
LEDLight-emitting diode
NaturalNatural stack ventilation
PVSolar photovoltaic panel
SHSingle-family house
STSolar thermal collector
VAVVariable air volume

Appendix A

Table A1. Energy demand in the presented buildings before and after retrofit.
--OriginalRetrofitted
BuildingCaseDH/Boiler DemandElectricity DemandDH/Boiler DemandElectricity Demand
--kWh/m2kWh/m2kWh/m2kWh/m2
AB1 (–1976)DH171.930.2118.627.6
AB2 (–2002)DH124.128.174.322.3
AB3 (–2010)DH80.736.541.728.1
AB4 (2010+)DH64.834.931.827.1
AB1 (–1976)EAHP171.930.230.838.8
AB2 (–2002)EAHP124.128.131.434.0
AB1 (–1976)GSHP171.930.2048.3
AB2 (–2002)GSHP124.128.1032.2
AB3 (–2010)GSHP80.736.5040.1
AB4 (2010+)GSHP64.834.9035.6
SH1 (–1976)DH234.320.676.326.2
SH2 (–2002)DH177.023.283.736.7
SH3 (–2010)DH148.328.476.033.1
SH4 (2010+)DH115.826.871.634.2
SH1 (–1976)Oil → GSHP280.620.6032.8
SH1 (–1976)Wood → GSHP303.020.6040.4
SH2 (–2002)Oil → GSHP212.023.2033.4
SH2 (–2002)Wood → GSHP228.923.2045.0
SH3 (–2010)Oil → GSHP177.628.4032.2
SH3 (–2010)Wood → GSHP191.828.4041.1
SH4 (2010+)Oil → GSHP138.726.8033.3
SH4 (2010+)Wood → GSHP149.826.8038.7
SH1 (–1976)Wood → Wood303.020.6103.935.3
SH2 (–2002)Wood → Wood228.923.2129.738.5
SH3 (–2010)Wood → Wood191.828.4123.938.7
SH4 (2010+)Wood → Wood149.826.8100.331.6
SH1 (–1976)Elec0.0233.4081.6
SH2 (–2002)Elec0.0179.5070.7
SH3 (–2010)Elec0.0169.5067.8
SH4 (2010+)Elec0.0140.8062.4
OfficeDH169.644.333.734.1
OfficeGSHP169.644.30.243.9
ElderlyDH253.958.675.644.2
ElderlyAWHP253.958.6062.5
CommercialDH, neutral68.6118.468.647.4
CommercialGSHP, neutral68.6118.44.567.6
CommercialDH, min cost68.6118.468.669.8
CommercialGSHP, min cost68.6118.44.591.1
EducationalDH222.146.677.727.4
EducationalGSHP222.146.655.926.3
The arrow in the Heating system column indicates a replacement of the heating system with another.

References

  1. European Parliament. Directive 2010/31/EU of the European Parliament and of the Council of 19 May 2010 on the energy performance of buildings. Off. J. Eur. Union 2010, 153, 13–35. [Google Scholar]
  2. Yücel, G. Extent of inertia caused by the existing building stock against an energy transition in the Netherlands. Energy Build. 2013, 56, 134–145. [Google Scholar] [CrossRef]
  3. European Parliament. Directive (EU) 2018/844 of the European Parliament and of the Council amending Directive 2010/31/EU on the energy performance of buildings and Directive 2012/27/EU on the energy efficiency. Off. J. Eur. Union 2018, 156, 75–91. [Google Scholar]
  4. European Commission. A Renovation Wave for Europe—Greening our Buildings, Creating Jobs, Improving Lives; European Commission: Brussels, Belgium, 14 October 2020. [Google Scholar]
  5. Saikia, P.; Pancholi, M.; Sood, D.; Rakshit, D. Dynamic optimization of multi-retrofit building envelope for enhanced energy performance with a case study in hot Indian climate. Energy 2020, 197, 117263. [Google Scholar] [CrossRef]
  6. Sarihi, S.; Saradj, F.M.; Faizi, M. A Critical Review of Façade Retrofit Measures for Minimizing Heating and Cooling Demand in Existing Buildings. Sustain. Cities Soc. 2021, 64, 102525. [Google Scholar] [CrossRef]
  7. Fan, Y.; Xia, X. A multi-objective optimization model for energy-efficiency building envelope retrofitting plan with rooftop PV system installation and maintenance. Appl. Energy 2017, 189, 327–335. [Google Scholar] [CrossRef] [Green Version]
  8. Rakhshan, K.; Friess, W.A. Effectiveness and viability of residential building energy retrofits in Dubai. J. Build. Eng. 2017, 13, 116–126. [Google Scholar] [CrossRef]
  9. Guillén-Lambea, S.; Rodríguez-Soria, B.; Marín, J.M. Air infiltrations and energy demand for residential low energy buildings in warm climates. Renew. Sustain. Energy Rev. 2019, 116, 109469. [Google Scholar] [CrossRef]
  10. Shao, Y.; Geyer, P.; Lang, W. Integrating requirement analysis and multi-objective optimization for office building energy retrofit strategies. Energy Build. 2014, 82, 356–368. [Google Scholar] [CrossRef]
  11. Foda, E.; El-Hamalawi, A.; Le Dréau, J. Computational analysis of energy and cost efficient retrofitting measures for the French house. Build. Environ. 2020, 175, 106792. [Google Scholar] [CrossRef]
  12. Rogeau, A.; Girard, R.; Abdelouadoud, Y.; Thorel, M.; Kariniotakis, G. Joint optimization of building-envelope and heating-system retrofits at territory scale to enhance decision-aiding. Appl. Energy 2020, 264, 114639. [Google Scholar] [CrossRef] [Green Version]
  13. La Fleur, L.; Rohdin, P.; Moshfegh, B. Investigating cost-optimal energy renovation of a multifamily building in Sweden. Energy Build. 2019, 203, 109438. [Google Scholar] [CrossRef]
  14. Milić, V.; Ekelöw, K.; Andersson, M.; Moshfegh, B. Evaluation of energy renovation strategies for 12 historic building types using LCC optimization. Energy Build. 2019, 197, 156–170. [Google Scholar] [CrossRef]
  15. Hirvonen, J.; Jokisalo, J.; Heljo, J.; Kosonen, R. Towards the EU Emission Targets of 2050: Cost-Effective Emission Reduction in Finnish Detached Houses. Energies 2019, 12, 4395. [Google Scholar] [CrossRef] [Green Version]
  16. Niemelä, T.; Kosonen, R.; Jokisalo, J. Cost-effectiveness of energy performance renovation measures in Finnish brick apartment buildings. Energy Build. 2017, 137, 60–75. [Google Scholar] [CrossRef] [Green Version]
  17. Niemelä, T.; Kosonen, R.; Jokisalo, J. Energy performance and environmental impact analysis of cost-optimal renovation solutions of large panel apartment buildings in Finland. Sustain. Cities Soc. 2017, 32, 9–30. [Google Scholar] [CrossRef] [Green Version]
  18. Dodoo, A. Techno-economic and environmental performances of heating systems for single-family code-compliant and passive houses. E3S Web Conf. 2019, 111, 03039. [Google Scholar] [CrossRef] [Green Version]
  19. Hirvonen, J.; Jokisalo, J.; Kosonen, R. The Effect of Deep Energy Retrofit on The Hourly Power Demand of Finnish Detached Houses. Energies 2020, 13, 1773. [Google Scholar] [CrossRef] [Green Version]
  20. Asaee, S.R.; Nikoofard, S.; Ugursal, V.I.; Beausoleil-Morrison, I. Techno-economic assessment of photovoltaic (PV) and building integrated photovoltaic/thermal (BIPV/T) system retrofits in the Canadian housing stock. Energy Build. 2017, 152, 667–679. [Google Scholar] [CrossRef] [Green Version]
  21. Asaee, S.R.; Ugursal, V.I.; Beausoleil-Morrison, I. Techno-economic feasibility evaluation of air to water heat pump retrofit in the Canadian housing stock. Appl. Therm. Eng. 2017, 111, 936–949. [Google Scholar] [CrossRef] [Green Version]
  22. Salata, F.; Ciancio, V.; Dell’Olmo, J.; Golasi, I.; Palusci, O.; Coppi, M. Effects of local conditions on the multi-variable and multi-objective energy optimization of residential buildings using genetic algorithms. Appl. Energy 2020, 260, 114289. [Google Scholar] [CrossRef]
  23. IEA. France—Countries & Regions. IEA Data Browser, France. 2020. Available online: https://www.iea.org/countries/france (accessed on 15 September 2020).
  24. IEA. Germany—Countries & Regions. IEA Data Browser, Germany. 2020. Available online: https://www.iea.org/countries/germany (accessed on 15 September 2020).
  25. Prabatha, T.; Hewage, K.; Karunathilake, H.; Sadiq, R. To retrofit or not? Making energy retrofit decisions through life cycle thinking for Canadian residences. Energy Build. 2020, 226, 110393. [Google Scholar] [CrossRef]
  26. Niemelä, T.; Levy, K.; Kosonen, R.; Jokisalo, J. Cost-optimal renovation solutions to maximize environmental performance, indoor thermal conditions and productivity of office buildings in cold climate. Sustain. Cities Soc. 2017, 32, 417–434. [Google Scholar] [CrossRef] [Green Version]
  27. Papadopoulos, S.; Kontokosta, C.E.; Vlachokostas, A.; Azar, E. Rethinking HVAC temperature setpoints in commercial buildings: The potential for zero-cost energy savings and comfort improvement in different climates. Build. Environ. 2019, 155, 350–359. [Google Scholar] [CrossRef]
  28. Bienvenido-Huertas, D.; Sánchez-García, D.; Pérez-Fargallo, A.; Rubio-Bellido, C. Optimization of energy saving with adaptive setpoint temperatures by calculating the prevailing mean outdoor air temperature. Build. Environ. 2020, 170, 106612. [Google Scholar] [CrossRef]
  29. Zheng, L.; Lai, J.H. Environmental and economic evaluations of building energy retrofits: Case study of a commercial building. Build. Environ. 2018, 145, 14–23. [Google Scholar] [CrossRef]
  30. Güçyeter, B.; Gunaydin, H.M.; Günaydın, H.M. Optimization of an envelope retrofit strategy for an existing office building. Energy Build. 2012, 55, 647–659. [Google Scholar] [CrossRef] [Green Version]
  31. Ascione, F.; Bianco, N.; Iovane, T.; Mauro, G.M.; Napolitano, D.F.; Ruggiano, A.; Viscido, L. A real industrial building: Modeling, calibration and Pareto optimization of energy retrofit. J. Build. Eng. 2020, 29, 101186. [Google Scholar] [CrossRef]
  32. Ascione, F.; Bianco, N.; De Stasio, C.; Mauro, G.M.; Vanoli, G.P. Multi-stage and multi-objective optimization for energy retrofitting a developed hospital reference building: A new approach to assess cost-optimality. Appl. Energy 2016, 174, 37–68. [Google Scholar] [CrossRef]
  33. Webb, A.L. Energy retrofits in historic and traditional buildings: A review of problems and methods. Renew. Sustain. Energy Rev. 2017, 77, 748–759. [Google Scholar] [CrossRef]
  34. Carlson, K.; Pressnail, K.D. Value impacts of energy efficiency retrofits on commercial office buildings in Toronto, Canada. Energy Build. 2018, 162, 154–162. [Google Scholar] [CrossRef]
  35. Azizi, S.; Nair, G.; Olofsson, T. Analysing the house-owners’ perceptions on benefits and barriers of energy renovation in Swedish single-family houses. Energy Build. 2019, 198, 187–196. [Google Scholar] [CrossRef]
  36. Bjørneboe, M.G.; Svendsen, S.; Heller, A. Evaluation of the renovation of a Danish single-family house based on measurements. Energy Build. 2017, 150, 189–199. [Google Scholar] [CrossRef] [Green Version]
  37. Hirvonen, J.; Jokisalo, J.; Heljo, J.; Kosonen, R. Towards the EU emissions targets of 2050: Optimal energy renovation measures of Finnish apartment buildings. Int. J. Sustain. Energy 2019, 38, 649–672. [Google Scholar] [CrossRef] [Green Version]
  38. Jokisalo, J.; Sankelo, P.; Vinha, J.; Sirén, K.; Kosonen, R. Cost optimal energy performance renovation measures in a municipal service building in a cold climate. E3S Web Conf. 2019, 111, 03022. [Google Scholar] [CrossRef] [Green Version]
  39. Niemelä, T.; Kosonen, R.; Jokisalo, J. Cost-optimal energy performance renovation measures of educational buildings in cold climate. Appl. Energy 2016, 183, 1005–1020. [Google Scholar] [CrossRef]
  40. Saari, A.; Airaksinen, M. Energiatehokkuutta Koskevien Vähimmäisvaatimusten Kustannusoptimaalisten Tasojen Laskenta; EU Commission: Espoo, Finland, 2012. (In Finnish) [Google Scholar]
  41. Statistics Finland. Buildings by Area, Heating Fuel/Source of Heat, Intended Use of Building and Information. PxWeb. 2017. Available online: http://pxnet2.stat.fi/PXWeb/pxweb/en/StatFin_Passiivi/StatFin_Passiivi__asu__rakke/statfinpas_rakke_pxt_002_201700.px/table/tableViewLayout1/ (accessed on 30 June 2020).
  42. EQUA Simulation AB. IDA ICE—Simulation Software. 2019. Available online: https://www.equa.se/en/ida-ice (accessed on 8 August 2019).
  43. Vadiee, A.; Dodoo, A.; Gustavsson, L. A Comparison Between Four Dynamic Energy Modeling Tools for Simulation of Space Heating Demand of Buildings. In Cold Climate HVAC 2018; Springer: Cham, Switzerland, 2019; pp. 701–711. [Google Scholar]
  44. EQUA Simulation AB. Validation of IDA Indoor Climate and Energy 4.0 with Respect to CEN Standards EN 15255-2007 and EN 15265-2007; EQUA Simulation AB: Solna, Sweden, 2010. [Google Scholar]
  45. Loutzenhiser, P.; Manz, H.; Maxwell, G. Empirical Validations of Shading/Daylighting/Load Interactions in Building Energy Simulation Tools; IEA—International Energy Agency: Paris, France, 2007. [Google Scholar]
  46. Palonen, M.; Hamdy, M.; Hasan, A. MOBO a new software for multi-objective building performance optimization. In Proceedings of the 13th Conference of International Building Performance Simulation Association, Chambéry, France, 26–28 August 2013. [Google Scholar]
  47. Deb, K.; Pratap, A.; Agarwal, S.; Meayarivan, T. A fast and elitist multiobjective genetic algorithm: NSGA-II. IEEE Trans. Evolut. Comput. 2002, 6, 182–197. [Google Scholar] [CrossRef] [Green Version]
  48. Lehtinen, T. Rakennuksen Energiankulutuksen ja Lämmitystehon Tarpeen Laskenta [The Calculation of Energy Consumption and Heating Power Demand]; Ministry of the Environment: Helsinki, Finland, 20 December 2017. (In Finnish) [Google Scholar]
  49. Hirvonen, J.; Jokisalo, J.; Heljo, V.J.; Kosonen, R. Effect of apartment building energy renovation on hourly power demand. Int. J. Sustain. Energy 2019, 38, 918–936. [Google Scholar] [CrossRef]
  50. Fortum Oy. Kaukolämmön hinnat pientaloille, (District Heating Prices for Detached Houses). Available online: https://www.fortum.fi/kotiasiakkaille/lammitys/kaukolampo/kaukolammon-hinnat-pientaloille (accessed on 23 June 2020).
  51. Fortum Oy. Kaukolämmön hinnat taloyhtiöille ja yrityksille, (District Heating Prices for Companies). 2020. Available online: https://www.fortum.fi/yrityksille-ja-yhteisoille/lammitys-ja-jaahdytys/kaukolampo/kaukolammon-hinnat-taloyhtioille-ja-yrityksille (accessed on 23 June 2020).
  52. Helen Oy. Sähkön siirtohinnat Helsingissä (Electricity distribution prices in Helsinki). 2020. Available online: https://www.helensahkoverkko.fi/palvelut/hinnastot (accessed on 23 June 2020).
  53. Nord Pool. Historical Electricity Market Data. 2018. Available online: https://www.nordpoolgroup.com/historical-market-data/ (accessed on 14 January 2020).
  54. Statistics Finland. Fuel Classification 2019; Statistics Finland: Helsinki, Finland, 2019. (In Finnish) [Google Scholar]
  55. Motiva Oy. CO2 Emission Factors in Finland; Motiva Oy: Helsinki, Finland, 2019. (In Finnish) [Google Scholar]
  56. Finnish Energy. Emission Factors of Finnish Electricity, Email Contact; Finnish Energy: Helsinki, Finland, 2017. [Google Scholar]
  57. Statistics Finland. Buildings and Gross Floor Area of Finnish Building Stock by Building Type. Tilastokeskuksen PX-Web Tietokannat. 2019. Available online: http://pxnet2.stat.fi/PXWebPXWeb/pxweb/en/StatFin/StatFin__asu__rakke/statfin_rakke_pxt_116g.px/. (accessed on 22 September 2020).
  58. Ministry of the Environment. Pitkän Aikavälin Korjausrakentamisen Strategia 2020–2050; Ministry of the Environment: Helsinki, Finland, 2020. (In Finnish) [Google Scholar]
  59. Motiva Oy. Rakentaminen ja rakennukset. Motiva. Available online: https://www.motiva.fi/julkinen_sektori/kestavat_julkiset_hankinnat/tietopankki/rakentaminen_ja_rakennukset (accessed on 22 September 2020).
  60. Verohallinto. Nestemäisten Polttoaineiden Verotaulukot. Verohallinto. Available online: https://www.vero.fi/yritykset-ja-yhteisot/tietoa-yritysverotuksesta/valmisteverotus/nestemaiset_polttoaineet/nestemaisten_polttoaineiden_verotaulukk/ (accessed on 10 March 2020).
  61. Taimiteko. Taimiteko [The Planting Deed]. Taimiteko. Available online: https://www.taimiteko.fi/info/ (accessed on 10 March 2020).
  62. Haverinen-Shaughnessy, U.; Pekkonen, M.; Leivo, V.; Prasauskas, T.; Turunen, M.; Kiviste, M.; Aaltonen, A.; Martuzevicius, D. Occupant satisfaction with indoor environmental quality and health after energy retrofits of multi-family buildings: Results from INSULAtE-project. Int. J. Hyg. Environ. Health 2018, 221, 921–928. [Google Scholar] [CrossRef] [PubMed]
  63. Lan, L.; Wargocki, P.; Lian, Z. Quantitative measurement of productivity loss due to thermal discomfort. Energy Build. 2011, 43, 1057–1062. [Google Scholar] [CrossRef]
  64. Hardcastle, J.L. How to Boost Brand Value, Sales from GHG Management; Environment + Energy Leader: Fort Collins, CO, USA, 2017; Available online: https://www.environmentalleader.com/2017/02/boost-brand-value-sales-ghg-management/ (accessed on 12 June 2020).
  65. Rämä, M.; Niemi, R.; Similä, L. Exhaust Air Heat Pumps in a District Heating System (Poistoilmalämpöpumput Kaukolämpöjärjestelmässä); VTT-CR-00564-15; VTT Technical Research Center of Finland: Espoo, Finland, 2015. (In Finnish) [Google Scholar]
  66. Helin, K.; Syri, S.; Zakeri, B. Improving district heat sustainability and competitiveness with heat pumps in the future Nordic energy system. Energy Procedia 2018, 149, 455–464. [Google Scholar] [CrossRef]
  67. ARA. Energy Assistance 2020 (Energia-Avustukset 2020). 2019. Available online: https://www.ara.fi/fi-FI/Lainat_ja_avustukset/Energiaavustus (accessed on 22 October 2020). (In Finnish).
  68. Ministry of the Environment. Staggering of the Property Tax of Buildings according to Energy Efficiency and heating System (Rakennusten kiinteistöveron porrastaminen energiatehokkuuden ja lämmitystavan perusteella); Ministry of the Environment: Helsinki, Finland, 2009. (In Finnish) [Google Scholar]
Figure 1. The amount of different building types in the Finnish building stock.
Buildings 10 00234 g001
Figure 2. Flowchart of the calculation process.
Buildings 10 00234 g002
Figure 3. Selection of cases for this study. The cost-neutral cases were chosen from the Pareto fronts generated in previous studies.
Buildings 10 00234 g003
Figure 4. Investment cost for different levels of emission reduction. Different building types are identified by color, while the heating systems are identified by the shape of the symbol. The numbers next to some of the points are examples of emission reduction cost, i.e., what is the investment cost to reduce CO2 emissions by one ton over 25 years.
Buildings 10 00234 g004
Figure 5. Life cycle cost for different levels of emission reduction.
Buildings 10 00234 g005
Figure 6. Life cycle cost (LCC) versus emission reduction as a percentage relative to unrenovated reference cases.
Buildings 10 00234 g006
Figure 7. Absolute versus relative emission reduction in all building types.
Buildings 10 00234 g007
Table 1. Properties of cost-neutrally retrofitted single-family houses (SH). Buildings from four time periods are presented: SH1 (–1975), SH2 (1976–2002), SH3 (2003–2009), and SH4 (2010–).
--Building EnvelopeBuilding Service Systems
BuildingHeating SystemWallsRoofDoorsWindowsVentilationRadiatorGSHPAAHPPVST
--W/m2 K(HR eff)°C/°CkWthkWthkWm2
SH1DH0.120.11.41Natural (0%)70/400698
SH2DH0.120.081.41.6Exhaust (0%)70/400308
SH3DH0.170.081.41.4Balanced, VAV (55%)45/350516
SH4DH0.170.0911Balanced, VAV (65%)45/350304
SH1Oil → GSHP0.10.0910.6Natural (0%)45/3580620
SH1Wood → GSHP0.20.121.40.6Natural (0%)45/3570100
SH2Oil → GSHP0.080.0910.6Exhaust (0%)45/35120818
SH2Wood → GSHP0.190.091.41.6Exhaust (0%)45/3570102
SH3Oil → GSHP0.080.0810.6Balanced, VAV (75%)45/3560816
SH3Wood → GSHP0.140.091.41.4Balanced, VAV (75%)45/357090
SH4Oil → GSHP0.080.080.81Balanced, VAV (75%)45/35140910
SH4Wood → GSHP0.110.0911Balanced, VAV (65%)45/3550100
SH1Wood0.120.0911.8Natural (0%)70/4005012
SH2Wood0.190.11.41.6Exhaust (0%)70/400304
SH3Wood0.250.091.41.4Balanced, VAV (55%)45/350302
SH4Wood0.170.0911Balanced, VAV (65%)45/350104
SH1Elec0.10.090.80.6Natural (0%)70/4003818
SH2Elec0.080.080.80.6Exhaust (0%)70/4004720
SH3Elec0.10.070.80.6Balanced, VAV (75%)45/3504818
SH4Elec0.070.0811Balanced, VAV (75%)45/3504818
The arrow in the Heating system column indicates a replacement of the heating system with another. Improvements over the reference case have been highlighted in green.
Table 2. Properties of cost-neutrally retrofitted apartment buildings (AB). Buildings from four time periods are presented: AB1 (–1975), AB2 (1976–2002), AB3 (2003–2009), and AB4 (2010–).
--Building EnvelopeBuilding Service Systems
BuildingHeating SystemWallsRoofDoorsWindowsVentilation System and ControlRadiator TempGSHP/
EAHP
Backup HeatingSewage HRPVST
--W/m2K(HR eff)-°C/°CkWthkW-kWm2
AB1DH0.810.082.20.7Exhaust (0%)CAV70/40--HP3055
AB2DH0.340.260.71Exhaust (0%)CAV70/40--HX25100
AB3DH0.250.071.41.4Balanced (60%)VAV70/40--HX1550
AB4DH0.170.0911Balanced (65%)VAV45/35--HX1545
AB1EAHP0.230.110.8Exhaust (0%)CAV70/4035DHHP400
AB2EAHP0.340.260.70.6Exhaust (0%)CAV70/4025DHHP4535
AB1GSHP0.360.080.70.7Exhaust (0%)CAV45/35110ElectricHP3560
AB2GSHP0.340.261.40.7Exhaust (0%)CAV65/4035ElectricHP3525
AB3GSHP0.250.060.71.4Balanced (60%)VAV70/4025ElectricHX2060
AB4GSHP0.170.0911Balanced (65%)VAV45/3525ElectricHX2530
Improvements over the reference case have been highlighted in green.
Table 3. Properties of the service buildings.
--Building EnvelopeBuilding Service Systems
BuildingHeating SystemWallsRoofWindowsVentilation System & ControlGSHP/AWHPBackup HeatingPVSTOther
--W/m2K(HR eff) kWth kWm2
ElderlyDH0.270.080.6Balanced (72%)CAV, sched--95119automated lights
ElderlyAWHP0.170.080.5Balanced (72%)CAV, sched175 (81%)Electric153118automated lights
EducationalDH0.540.171Balanced (77%)CAV, sched--347168
EducationalGSHP0.540.090.7Balanced (77%)CAV, sched42 (3.3%)DH4840-
OfficeDH0.350.10.6Balanced (77%)VAV, CO2 + T--740LED
OfficeGSHP0.350.290.7Balanced (77%)VAV, CO2 + T276 (104%)DH760LED, automated lights
CommercialDH, cost-neutral0.280.221.4Balanced (60%)CAV, sched--6200-
CommercialGSHP, cost-neutral0.280.221.4Balanced (60%)CAV, sched121 (67%)DH6500-
CommercialDH, min cost0.280.221.4Balanced (60%)CAV, sched--1800-
CommercialGSHP, min cost0.280.221.4Balanced (60%)CAV, sched121 (67%)DH1950-
Improvements over the reference case have been highlighted in green.
Table 4. District heating costs for different building types. PDH is the annual peak district heating power demand. Capacity costs are annual [50,51].
BuildingSHElder, AB, Office GSHPCommercial, Office DHAB1 DHEducational
Capacity cost (€/kW + €)5.15 × PDH − 6.153 × PDH − 6038 × PDH + 122036 × PDH + 300012 × PDH + 14,020
Energy cost (€/MWh)5252525252
Table 5. Electricity costs for different building types [52,53].
BuildingSH Non-ElectricSH ElectricElder DH, Commercial, ABEducational, Office, Elder Electric
Fixed cost (€/month)5.5117.532.24217
Capacity cost (€/kW/month)01.595.584.56
Distribution (€/MWh)40.122.217.714.6
Energy (€/MWh)56.356.356.356.3
Tax (€/MWh)27.9427.9427.9427.94
Table 6. Emission factors of energy sources.
Energy SourceEmission Factor (kg-CO2/MWh)
Oil263 [54]
Wood403 [54]
District heating164 [55]
Electricity133 [56]
Publisher’s Note: MDPI stays neutral with regard to jurisdictional claims in published maps and institutional affiliations.

