Robustness Assessment of Redundant Structural Systems Based on Design Provisions and Probabilistic Damage Analyses
Abstract
1. Introduction
2. Background
2.1. Robustness Assessment Concepts and Design Provisions
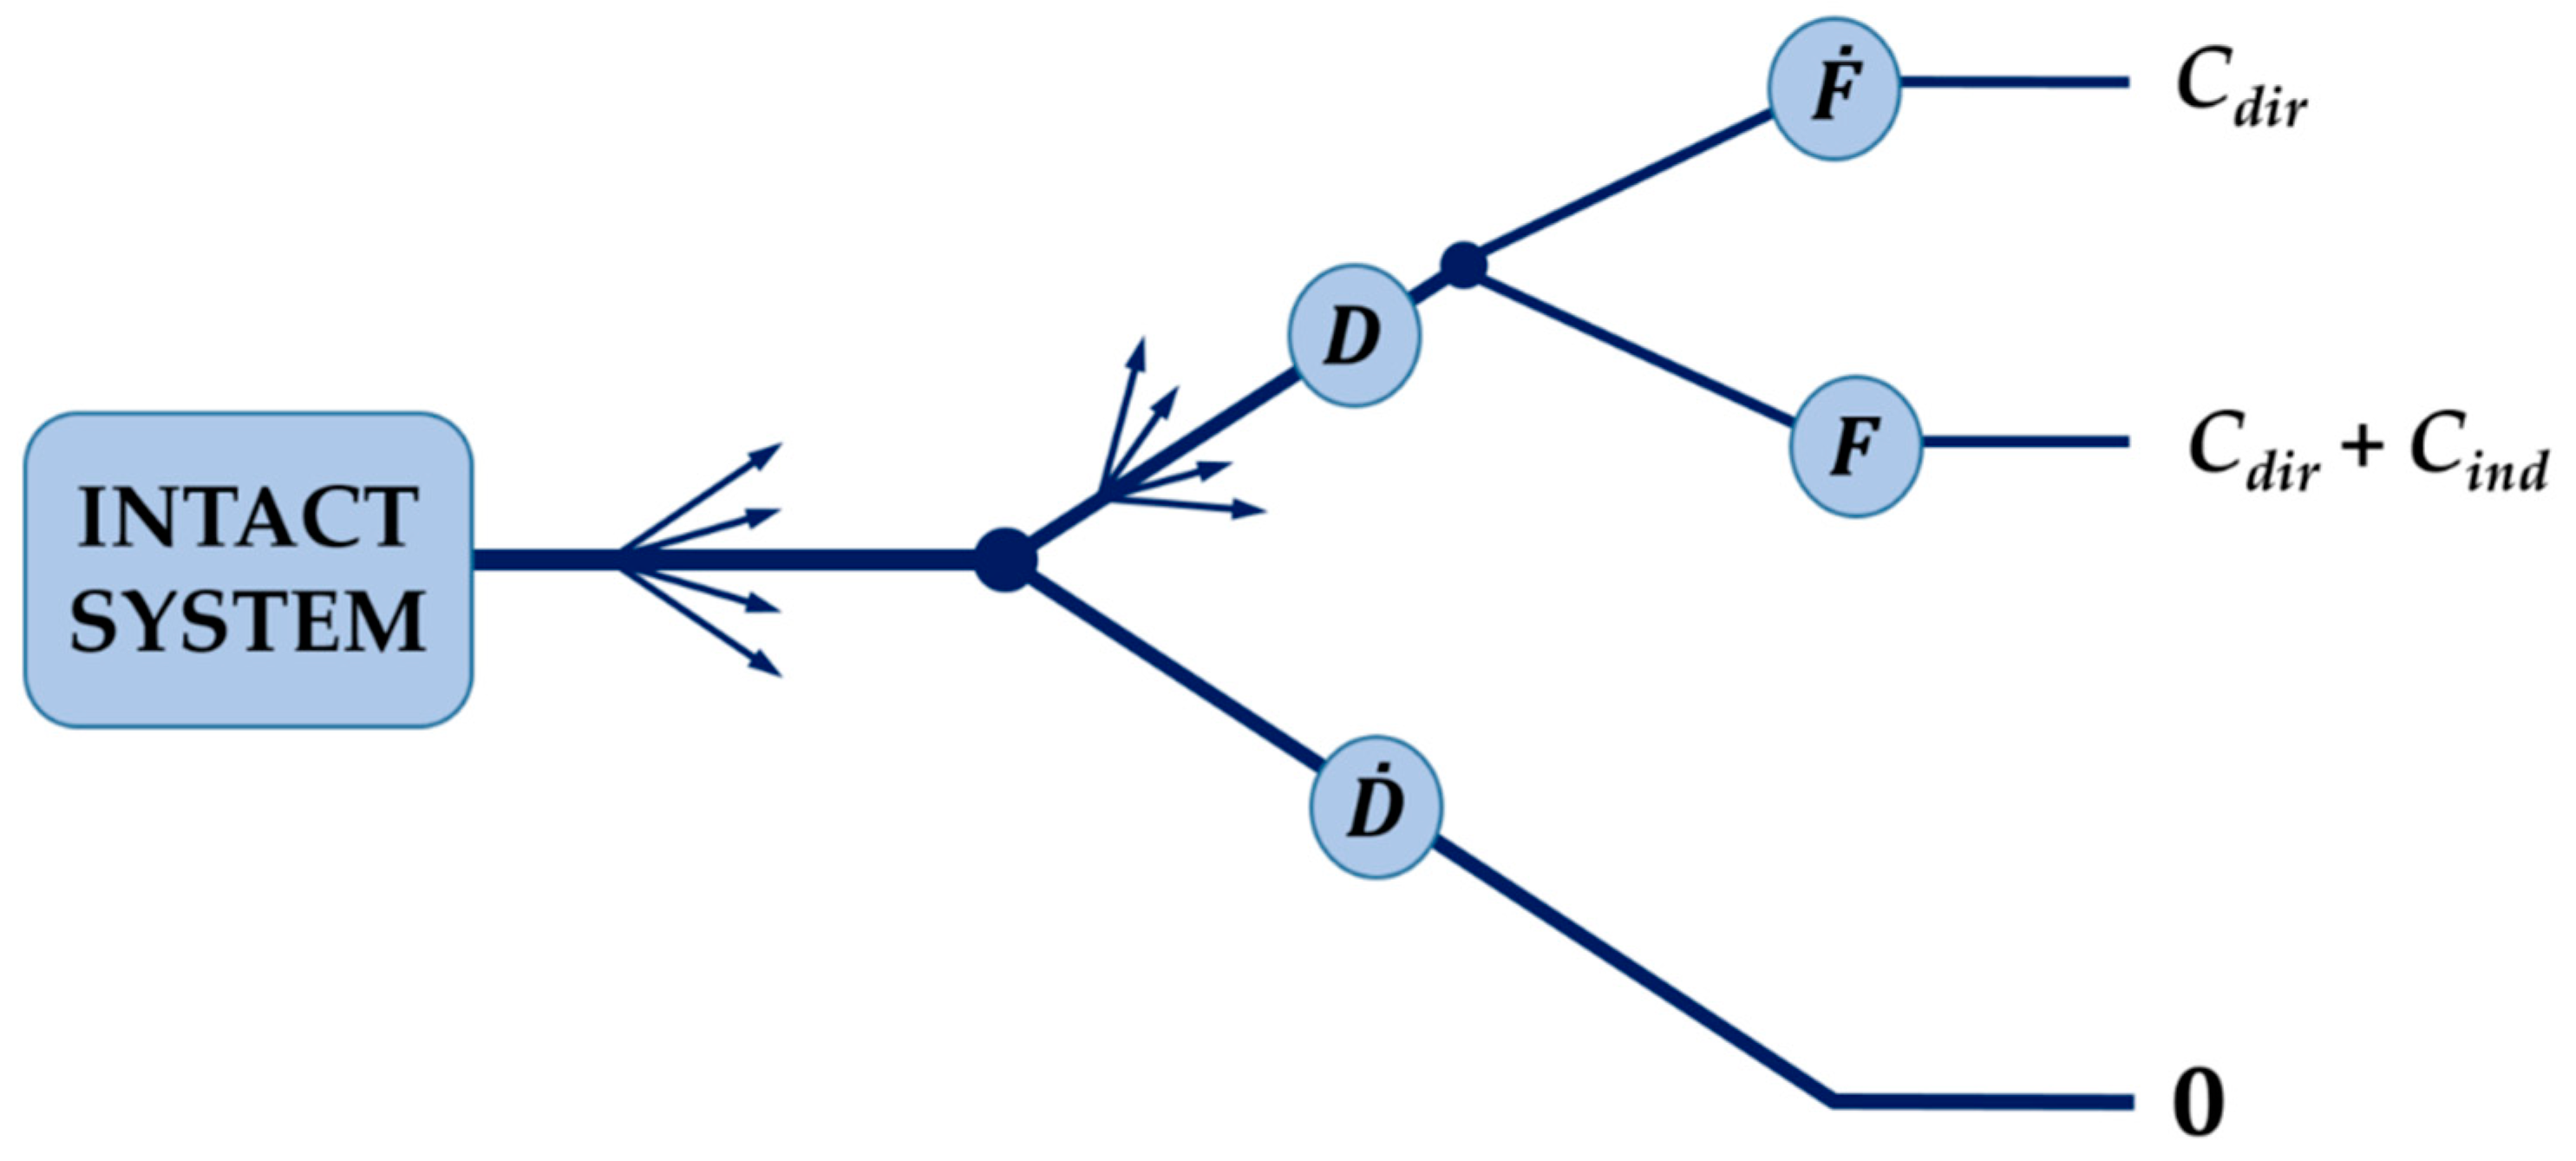
2.2. Design Concept in Current Developments of the Fib Model Code 2020
- P[Hi], the probability of occurrence of exposure to hazard Hi,
- P[Dj|Hi], the probability of (direct) damage Dj conditional on exposure to hazard Hi,
- P[Sk|Dj ∩ Hi], the probability of systemic damage Sk conditional on the damage Dj and the exposure to hazard Hi,
- Cdir, the direct consequences and
- Cind, the indirect consequences
2.2.1. Design Scenarios
2.2.2. Design Strategies
2.3. Quantitative Robustness Assessment and Redundancy Performance Indicators
- Risk-based quantification based on a complete risk analysis in which the consequences are divided into direct and indirect consequences
- Reliability based quantification derived from e.g., the reliability of the structural system in the damaged and in the undamaged situation;
- Deterministic quantification based on structural parameters such as the load-bearing capacity, stiffness, damage energy, etc.
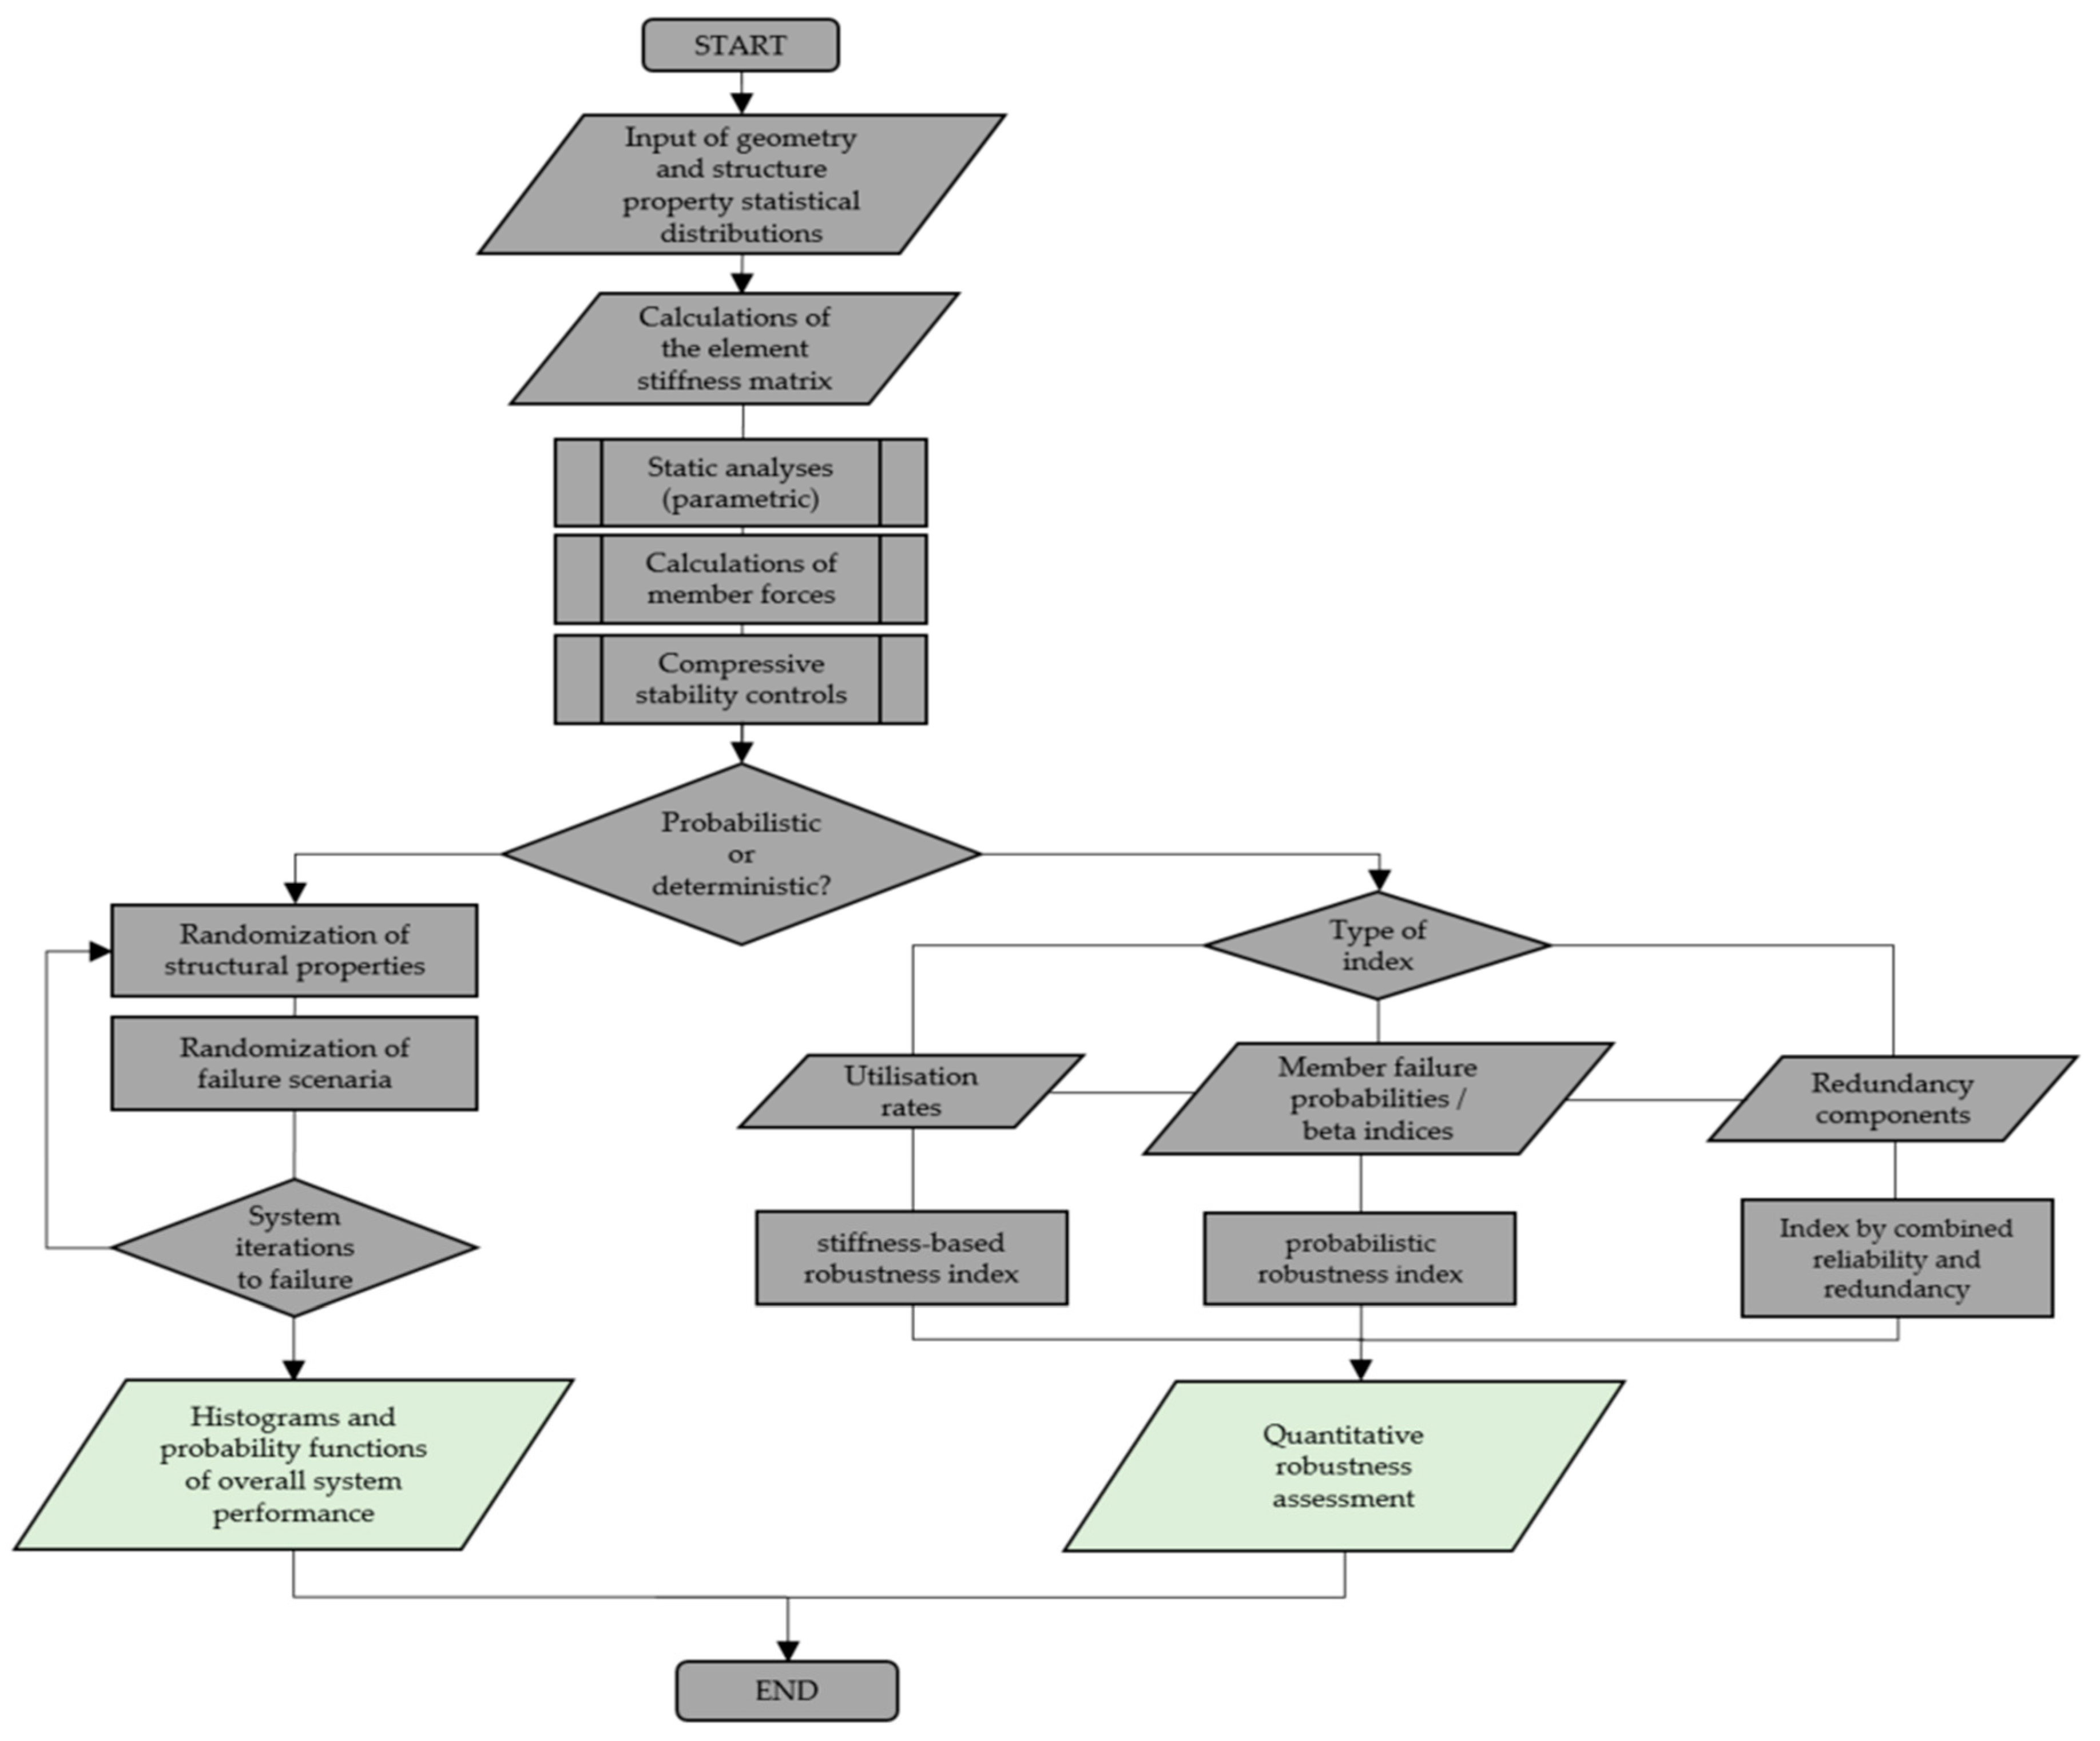
3. Implemented Methodology—Redundancy Concepts
4. Case Studies of Computations of Robustness Performance Indicators
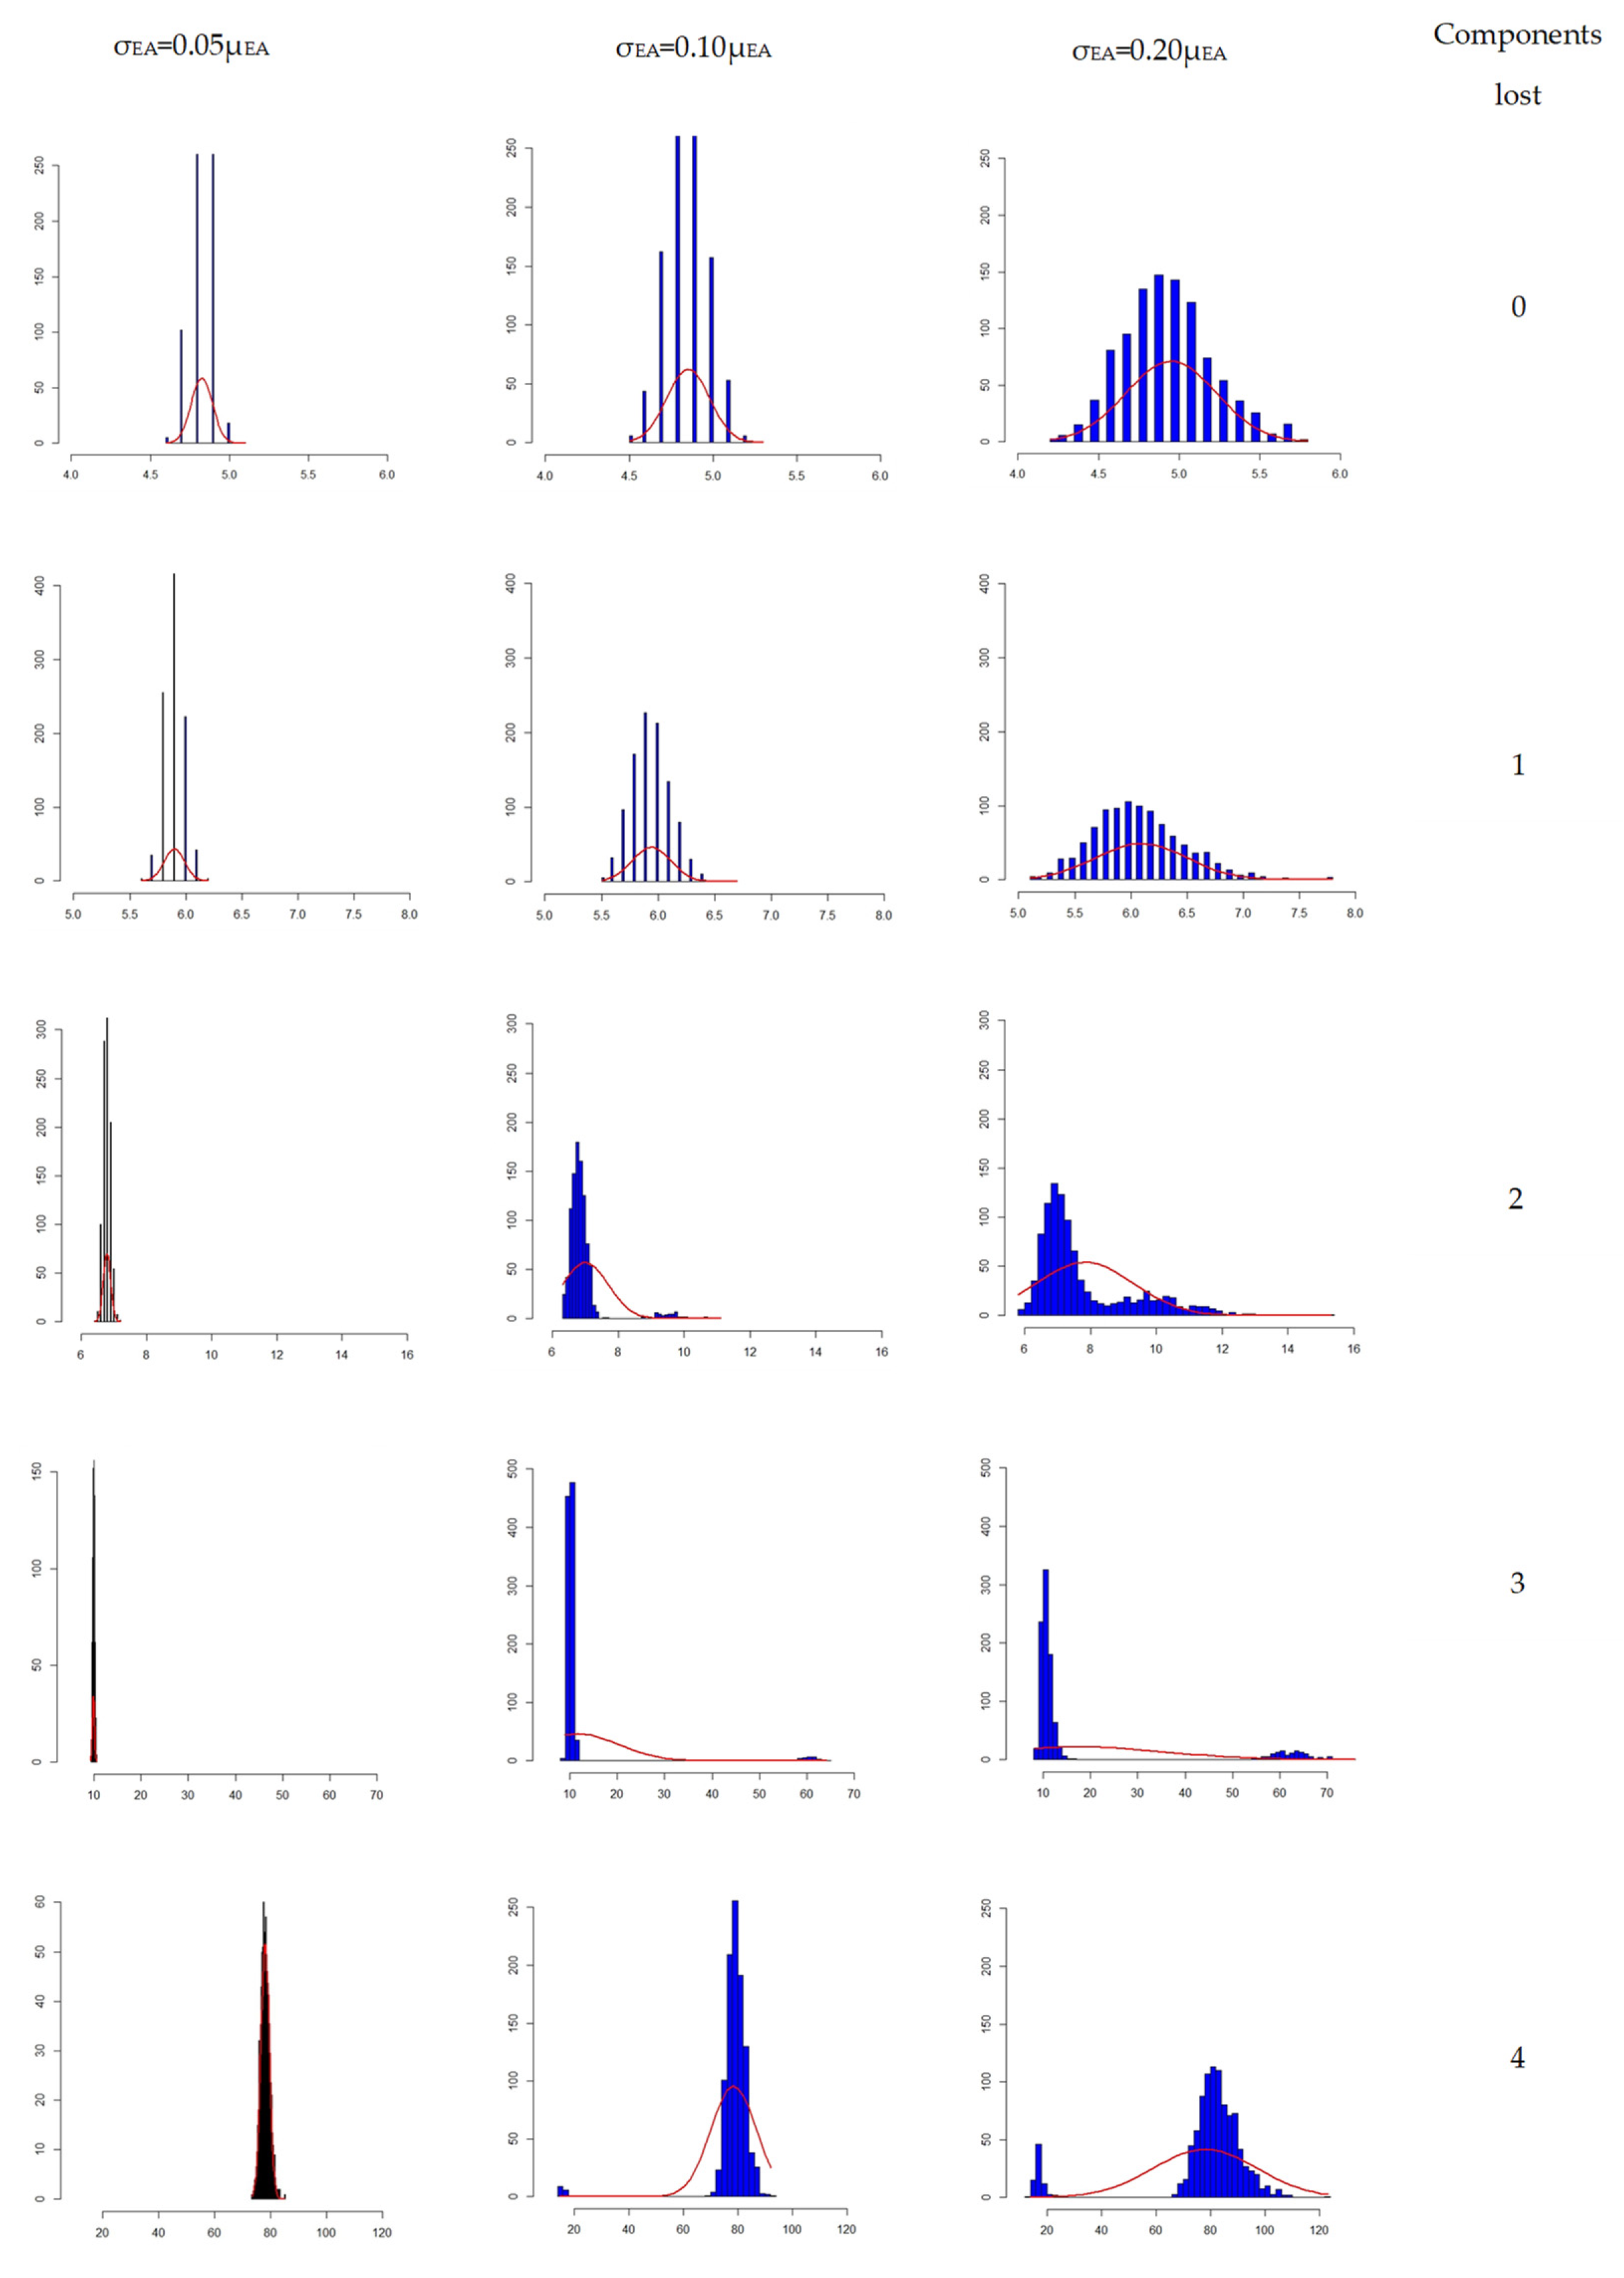
5. Probabilistic Elaborations
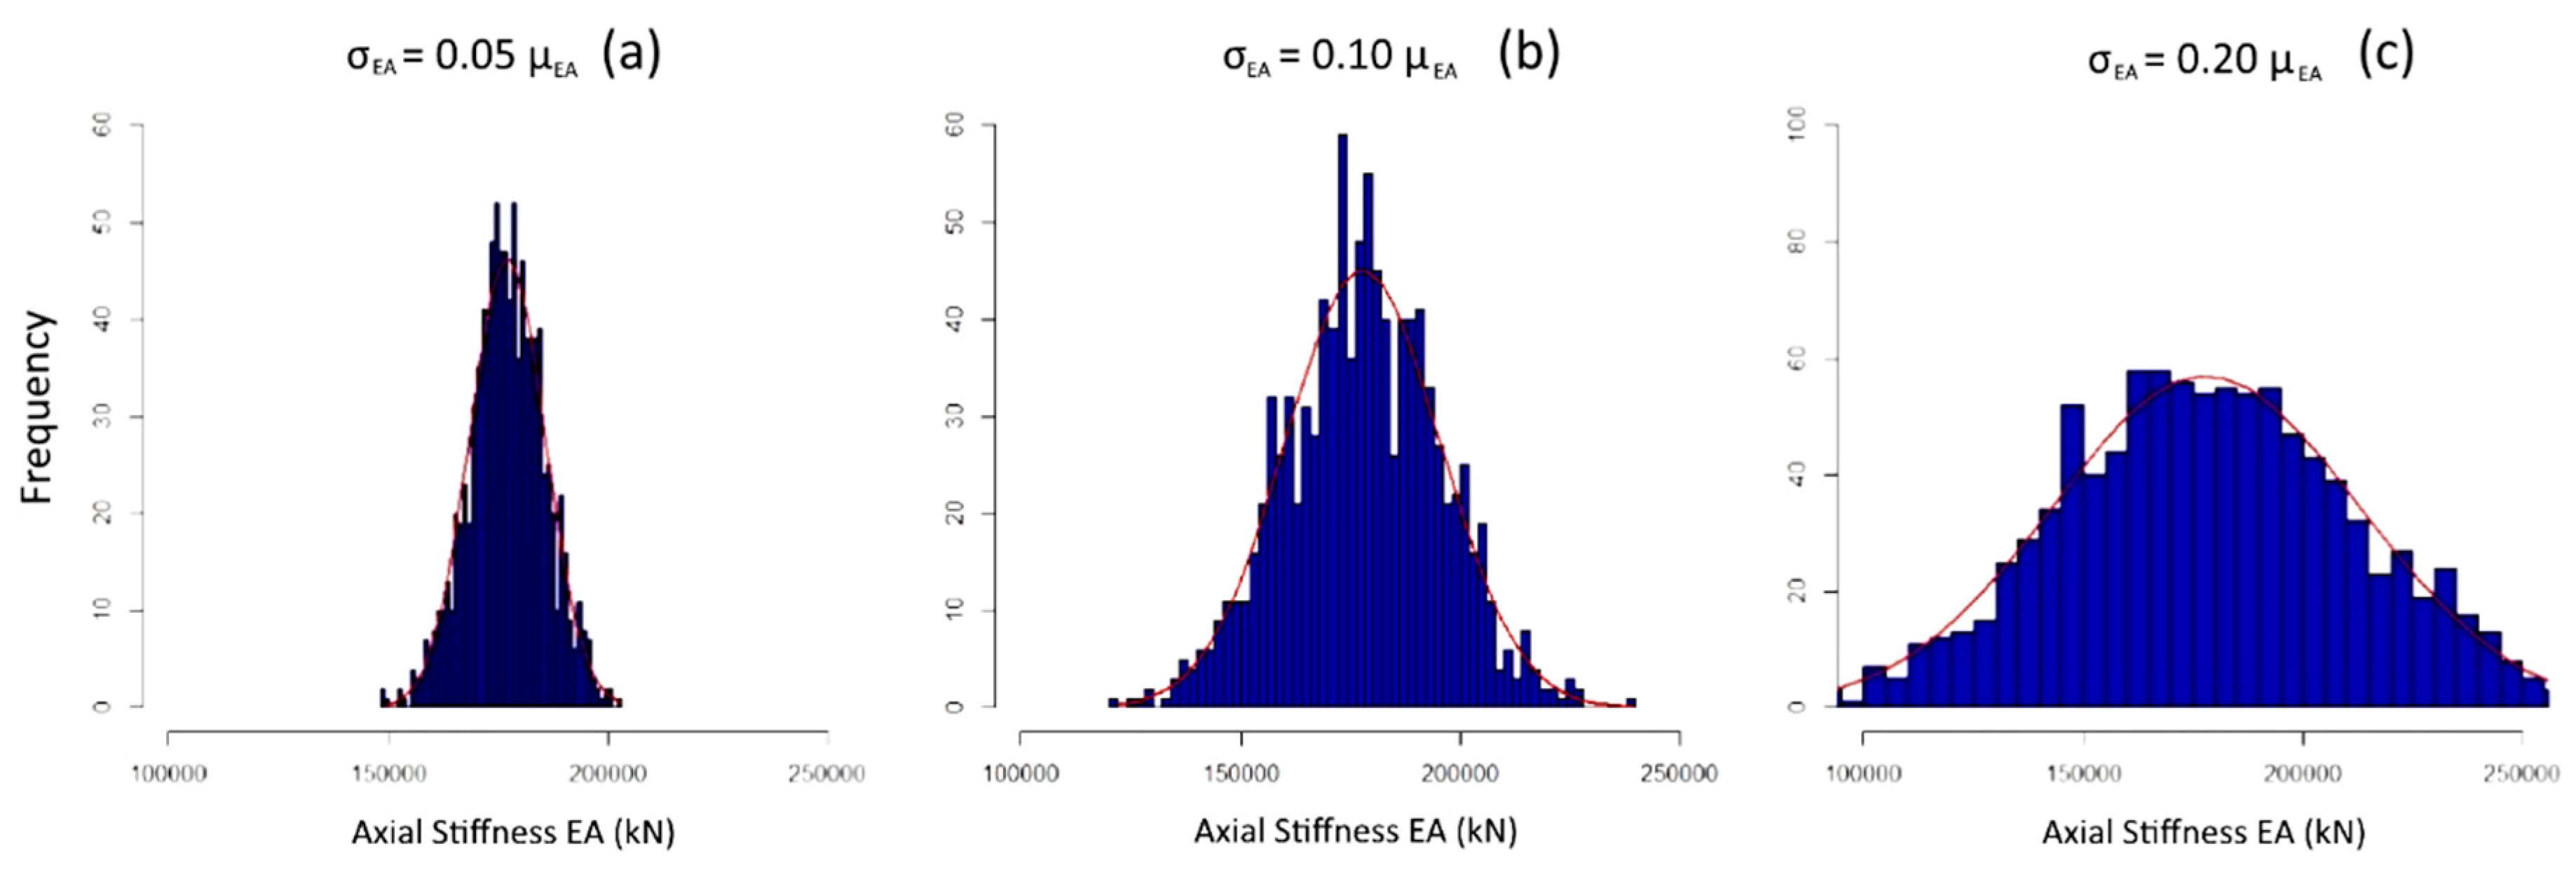
- σEA,Var1(5%) = 0.05 × 176,400 = 8820 kN (Coefficient of variation = 5%)
- σEA,Var1(10%) = 0.10 × 176,400 = 17,640 kN (Coefficient of variation = 10%)
- σEA,Var1(15%) = 0.20 × 176,400 = 35,280 kN (Coefficient of variation = 20%)
6. Discussion and Conclusions
- Robustness is a multifaceted discipline. Although basic principles can apply globally, the redundancy aspect of robustness is de facto crucial for multi-component systems. Without excluding a different possibility, this study has managed to treat truss systems with tools and methodologies that are customized for only these certain types of structures. The definition of individual members and the assessment with the stiffness- and the redundancy-based robustness indices presented in Equations (3) and (7), can become more intricate in case of monolithic or composite structures, as it requires separate treatment of the connection details.
- Quantification of the robustness can be translated to performance indicators, which can be computed and measured for individual structures. These can then be used in a life-cycle engineering approach by relating these performance indicators to performance criteria for progressive collapse. Furthermore, it is feasible to link these performance indicators with actual risks, with which structure stakeholders are typically concerned, as opposed to prescriptive structural characteristics. These performance indicators can in turn be associated with the condition assessment at section or member level. In the case of the probabilistic robustness index, the failure probability of a single member can be directly included in the calculations, as demonstrated in Equations (11) and (12). In the case of the stiffness-based index, a recalculation of the entire system with the altered or degraded parameters in one or more members needs to be carried out, as shown in Equation (10). For the robustness index by combined reliability and redundancy of the elements, both a member failure probability and a structural reanalysis of the system is integrated (see Equations (13) and (14), and Table 2).
- All the discussed robustness performance indicators are plausible. However, they are not necessarily equally beneficial to robustness assessment. As the degree of information involved with the assessment decreases, the indicators become generic, and they may fail to reveal the order of differences in the robustness of compared solutions or systems. The most useful index out of the ones evaluated is the robustness index by combined reliability and redundancy of the elements, since it accounts for a combined contribution of individual components on redundancy, and the individual components’ safety and reliability (see Equations (13) and (14), and Table 2). This indicates that this index is a more comprehensive representation of the system’s performance and it allows for a sensible measure to the system’s global safety and reliability assessment. Furthermore, it is seen that the probabilistic robustness indices in the examined truss variants have a very small difference in numerical value (99.0 and 97.68 for Variant 1 and 2 respectively), while it is clear from the calculations that the actual probability of failure of Variant 1 is several orders of magnitude higher to that of Variant 1. Based on this example, it is evident that the probabilistic robustness index does not always facilitate a decision process.
- Variability and randomness as regards the component strength and actions on the structure can have a substantial influence on the robustness assessment. Reasonably high variabilities have been shown to dramatically affect, not only the possible dispersion in certain the performance measures (e.g., deformations), but on the prevailing failure modes of the structure. In particular, a change in the truss components axial stiffness variability from 5% to 20%, led from contained and stable performance, to a high probability of progressive collapse, under the same loading conditions. As the results in Figure 10 show, actually multiple modes (peaks) appear in the output distributions for structures with a higher input variation, which implies not only high uncertainties in the load bearing capacity and reliability of the progressively damaged system, but uncertainty on the type of critical failure type. This starts to become evident at the systems with 10% and 20% variations after loss of 2 and 3 members respectively.
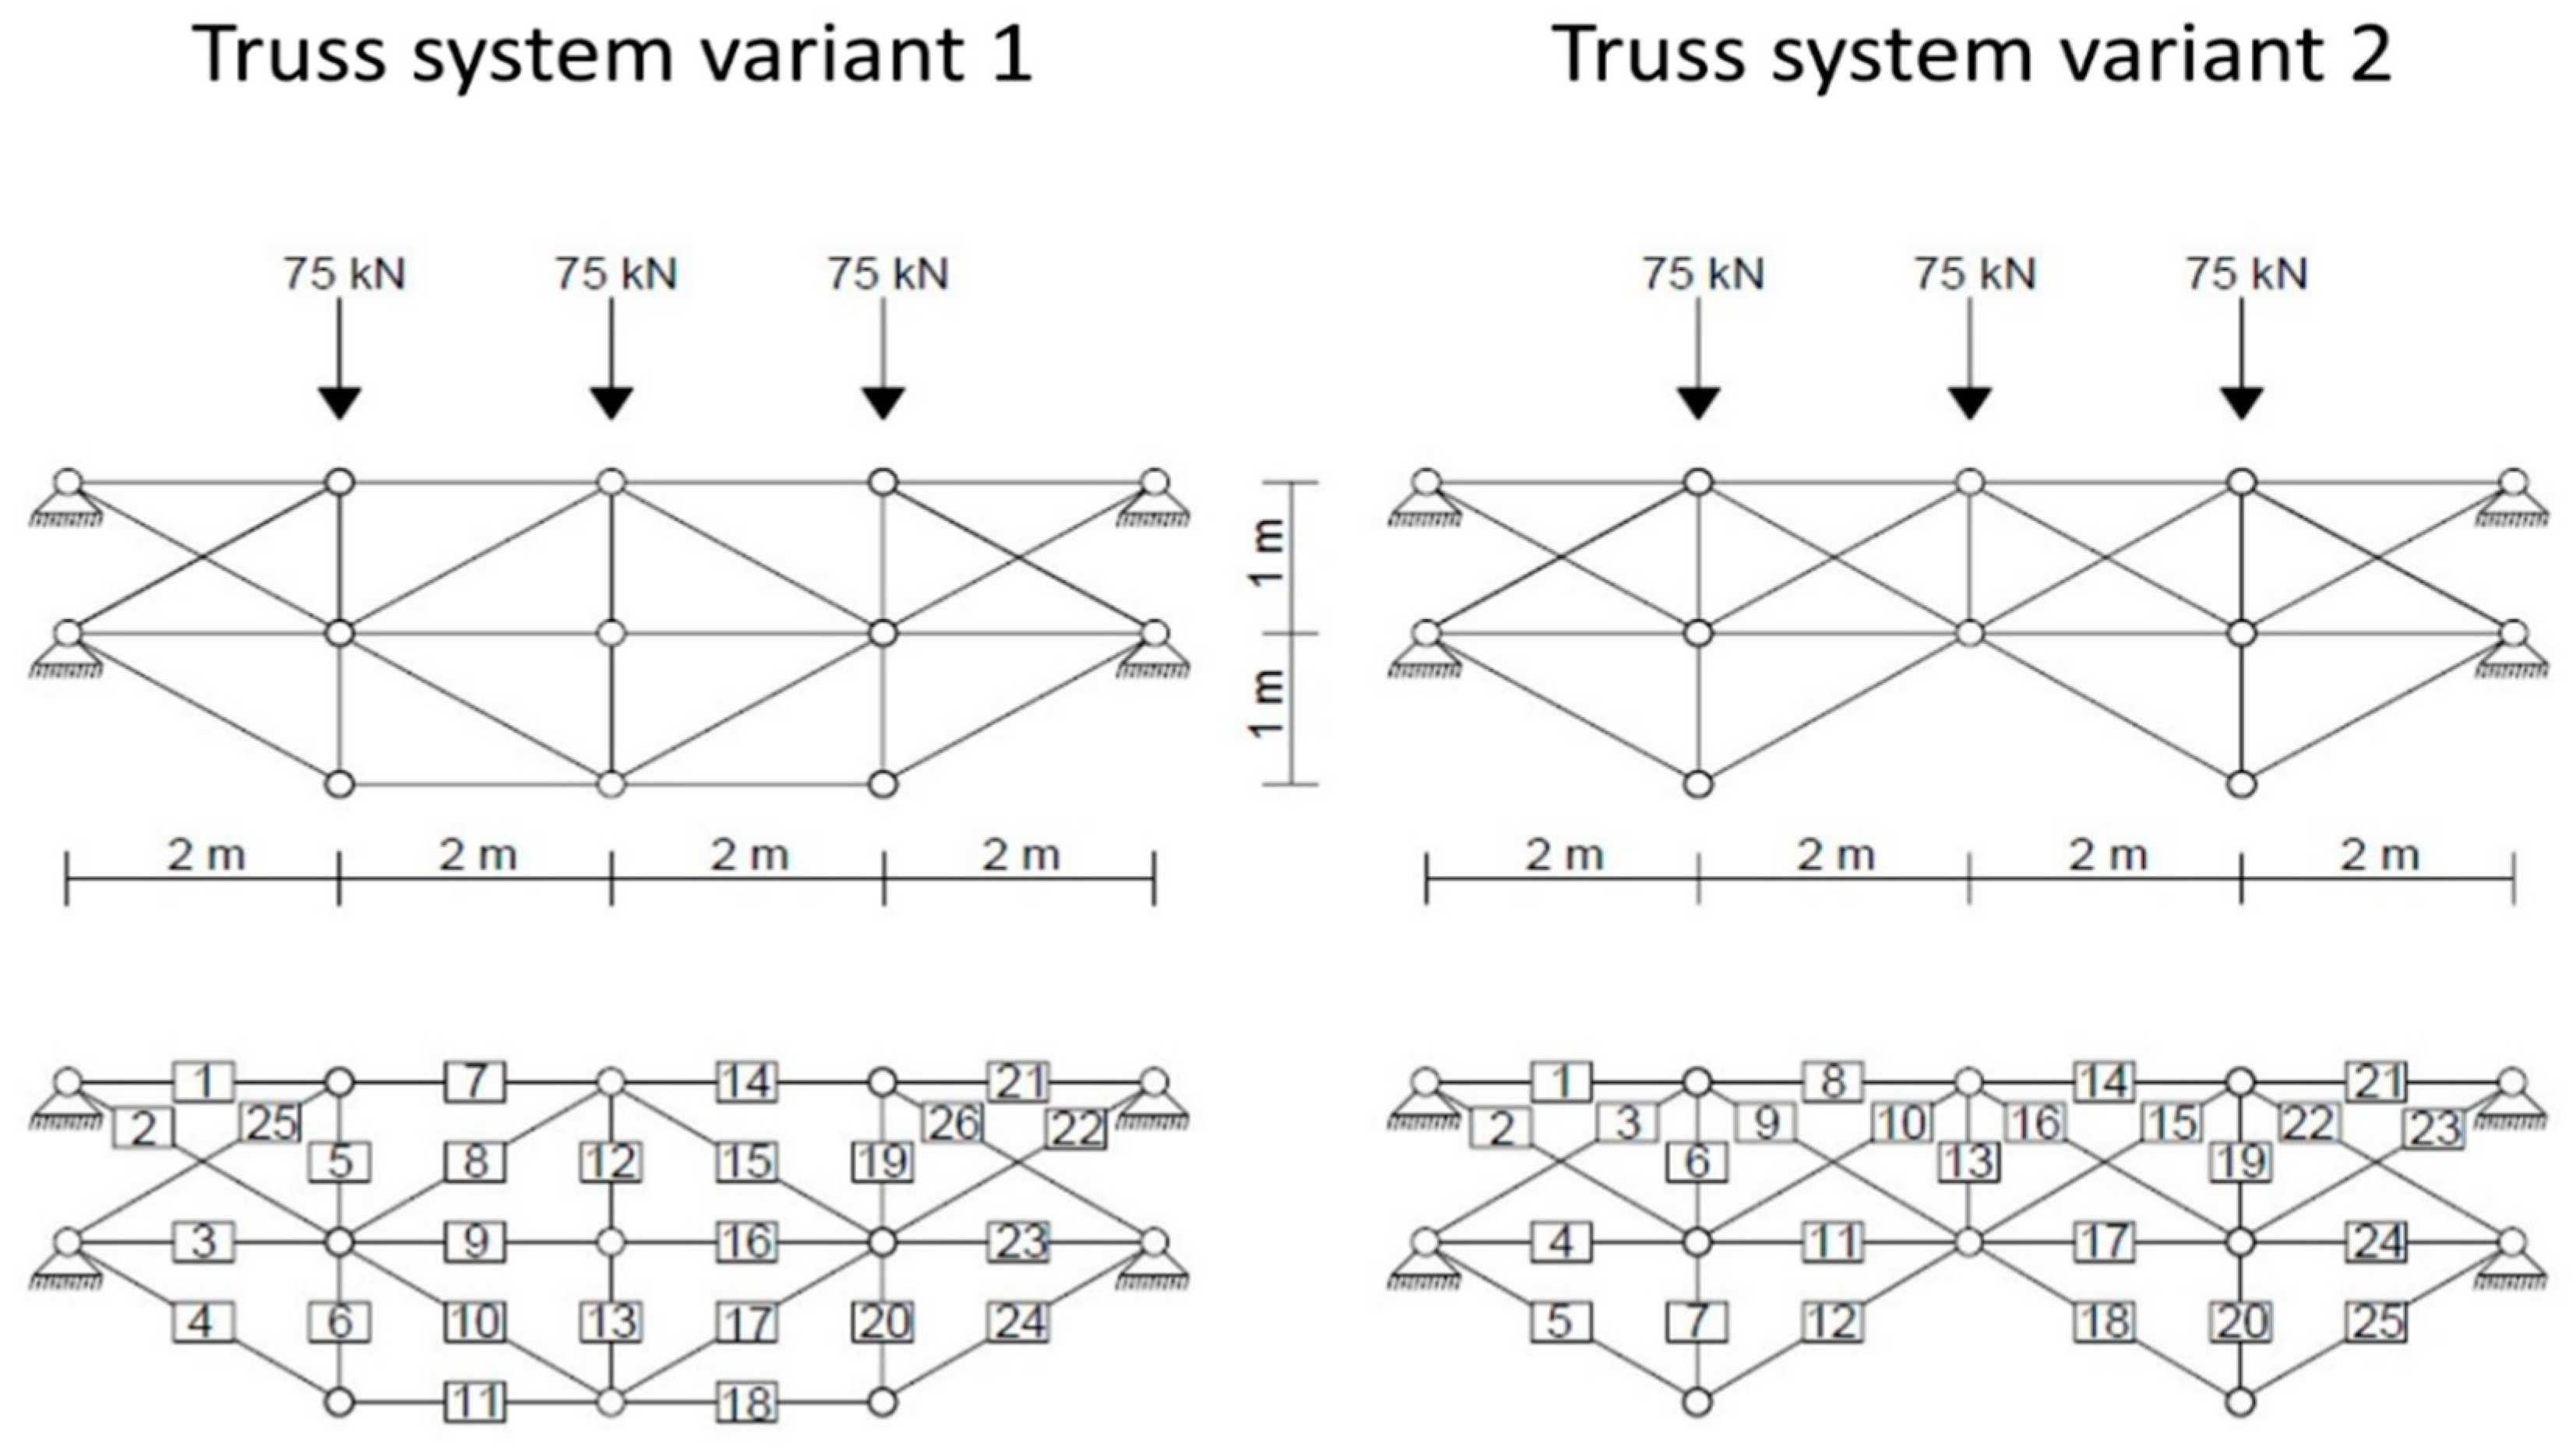
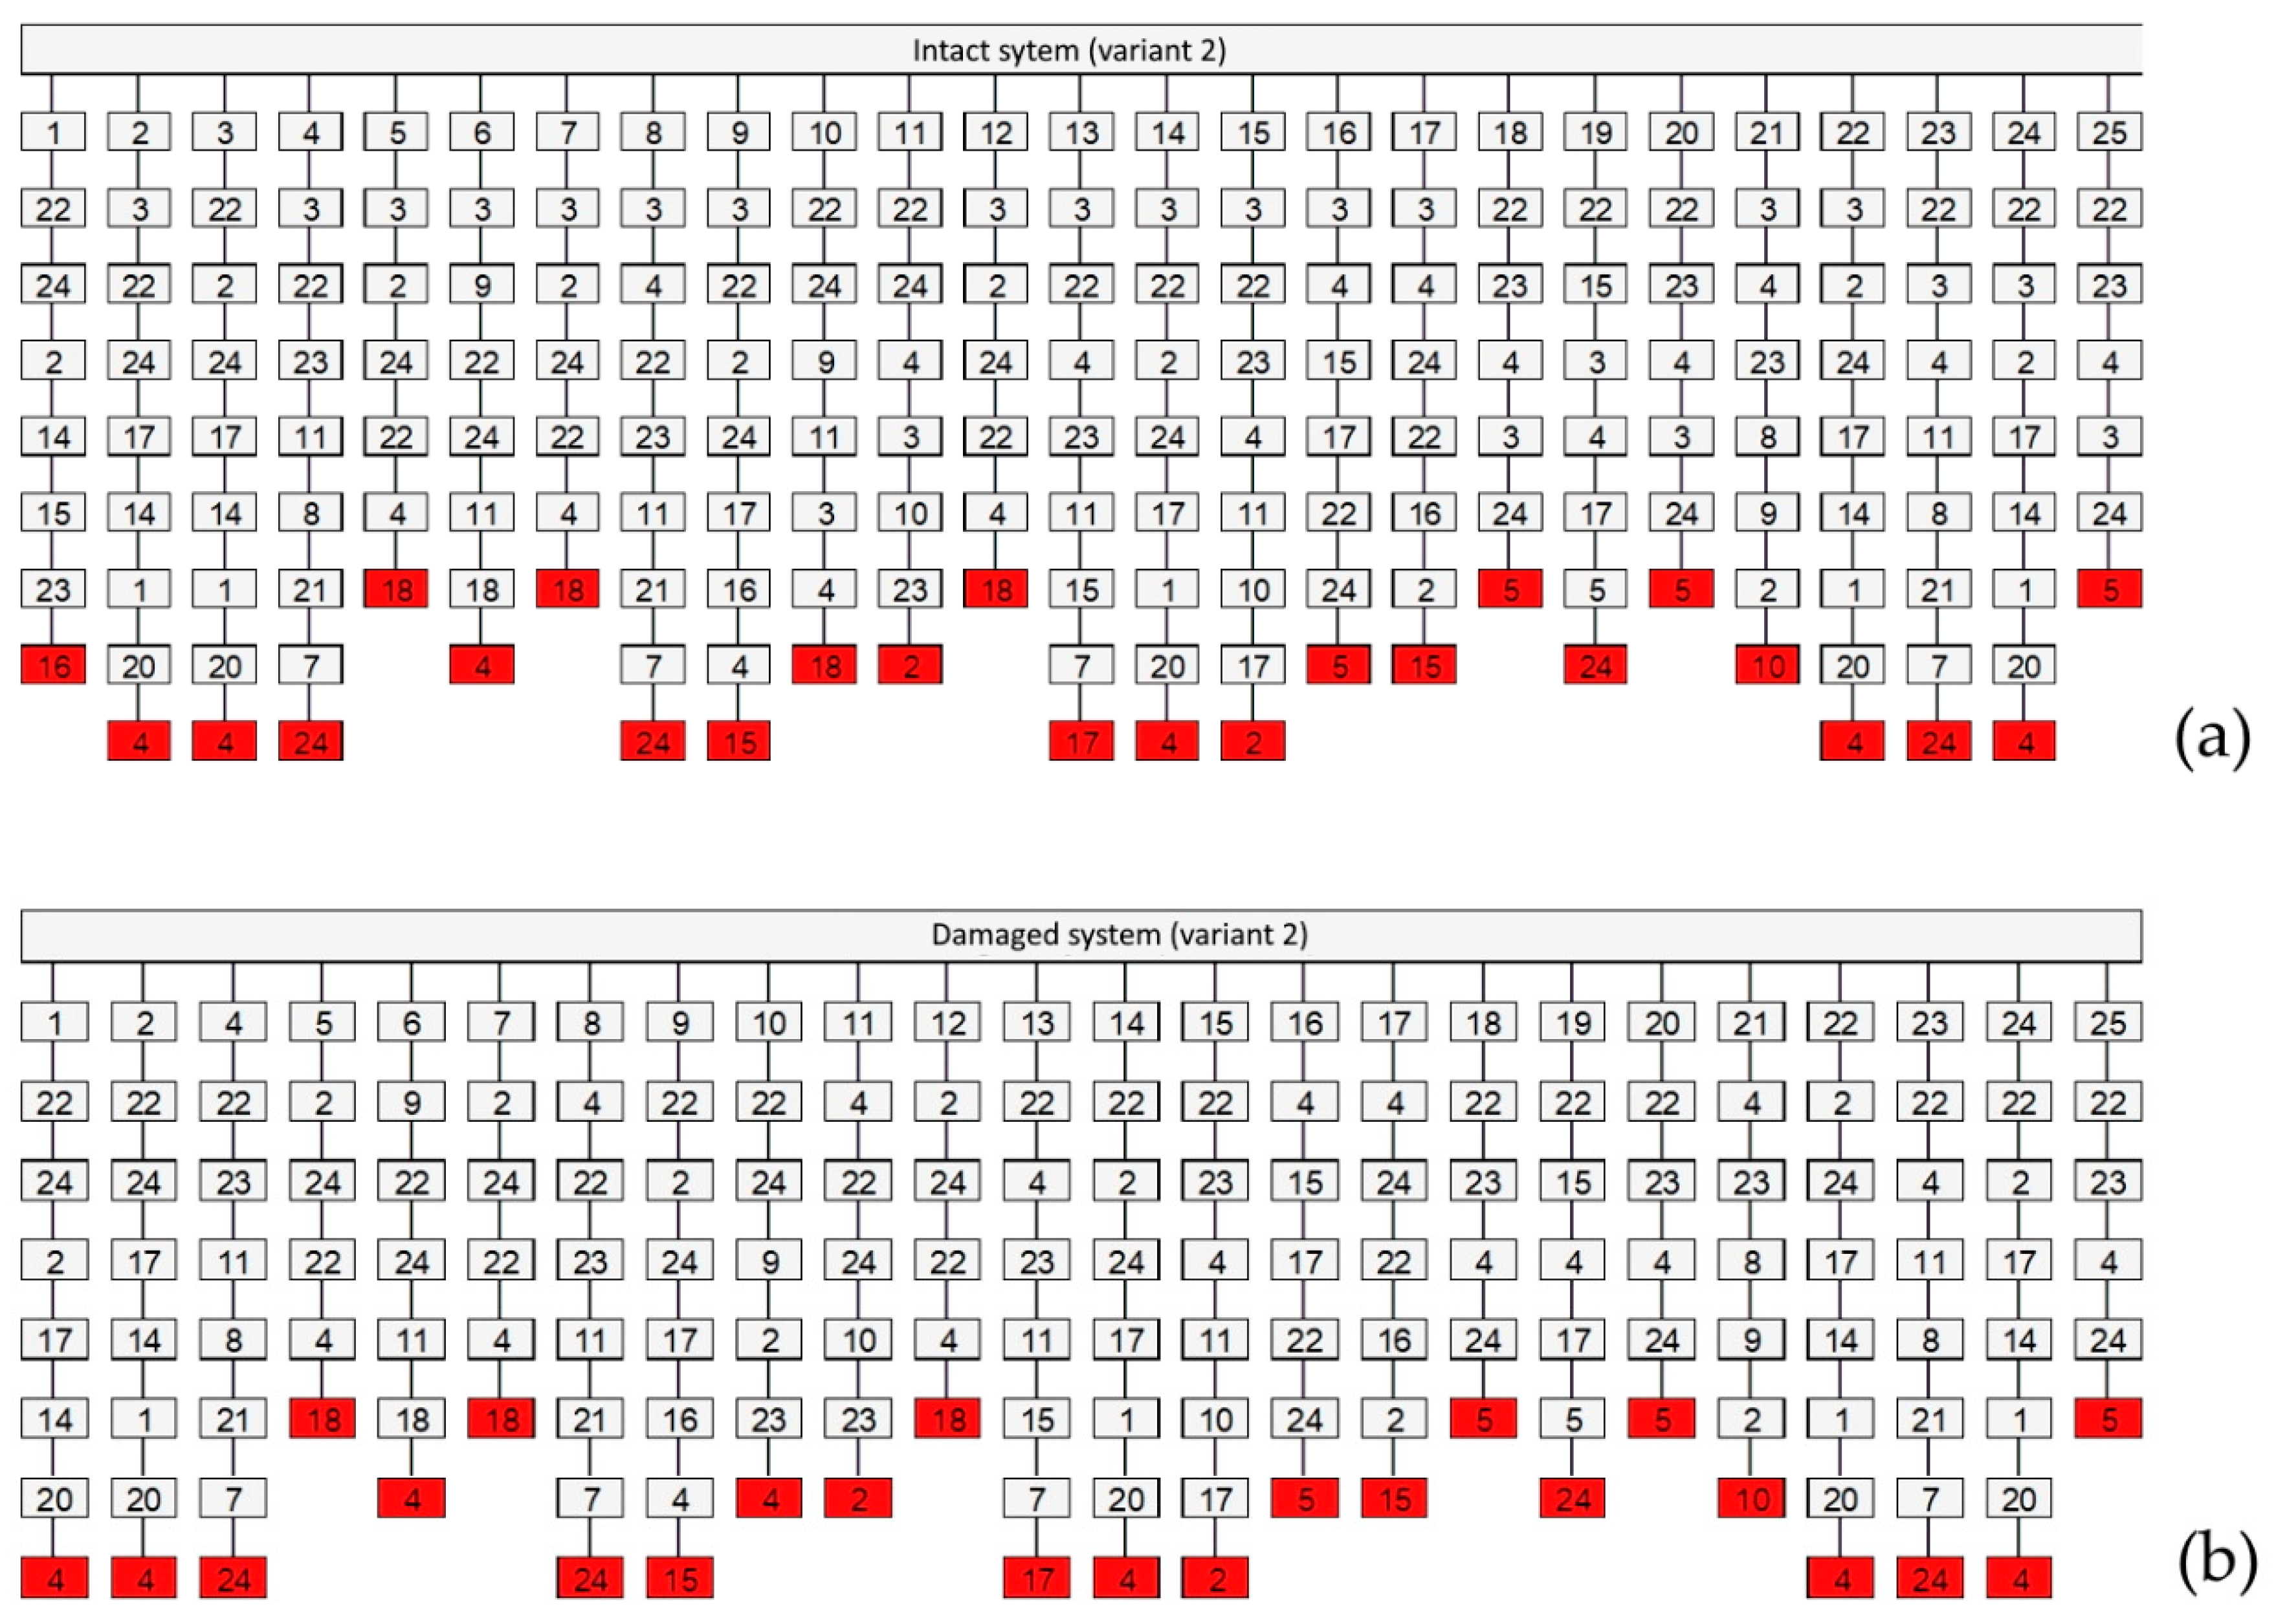
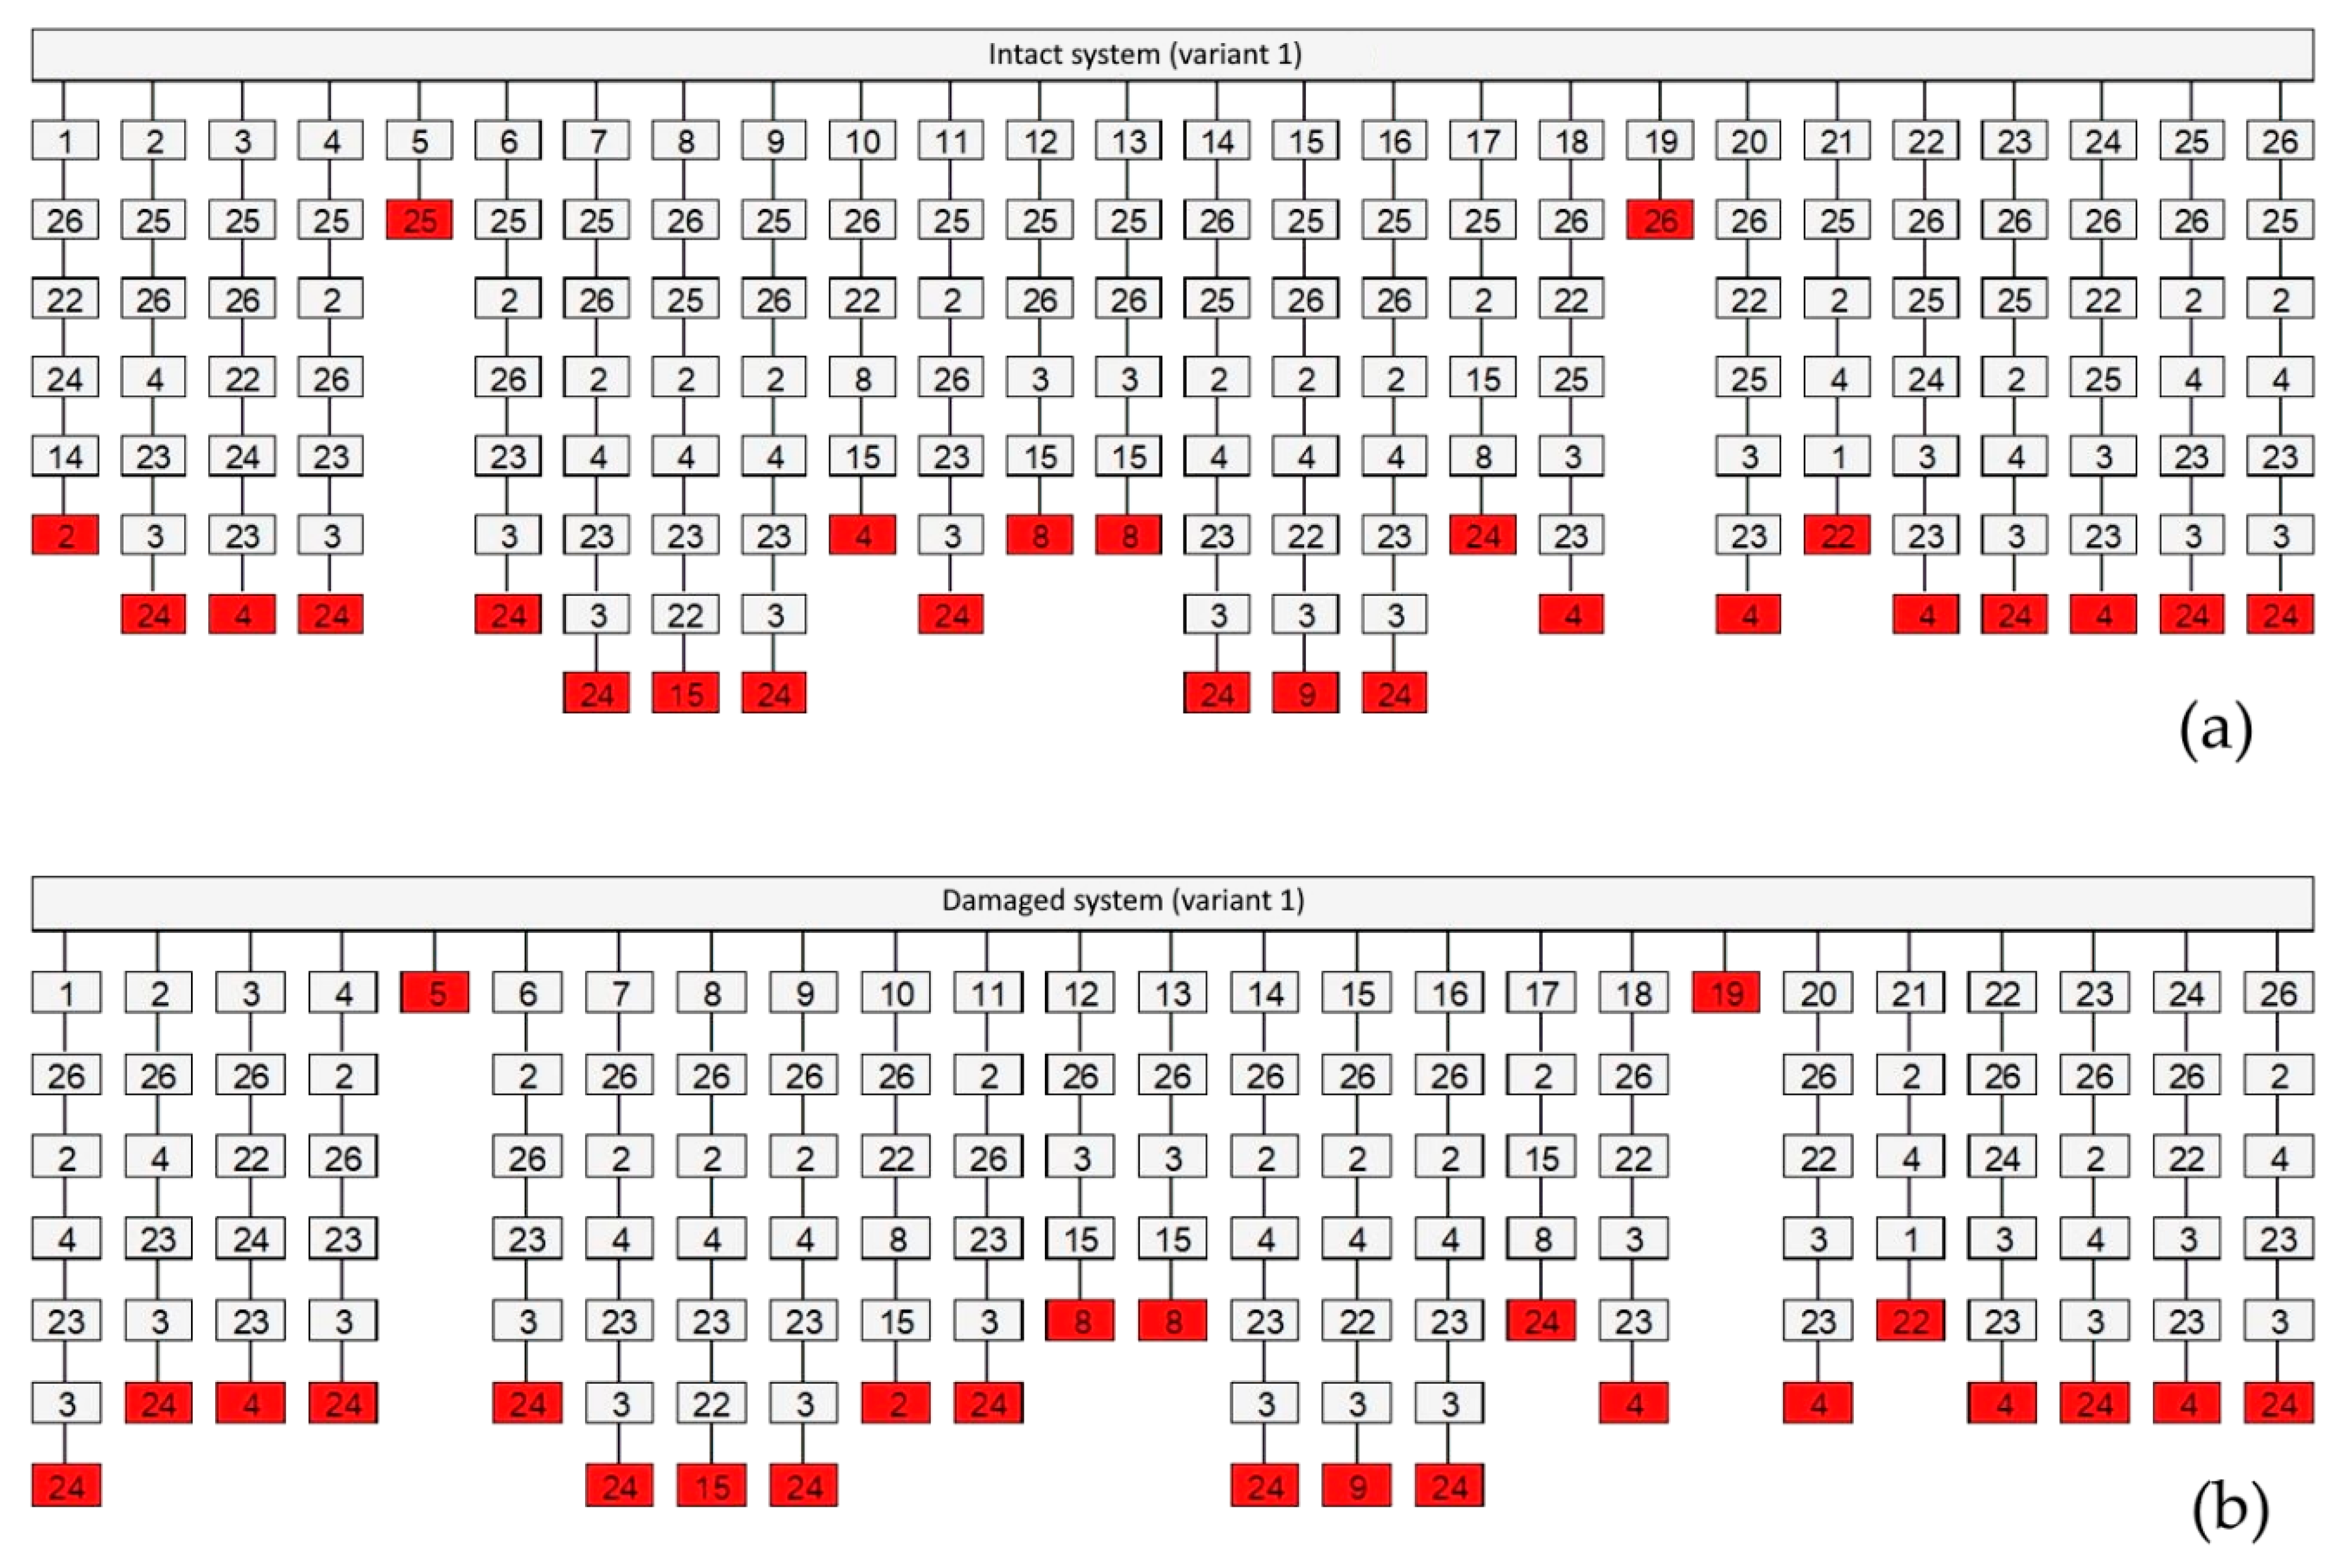
- A probabilistic elaboration of the structure’s collapse characteristics has proven to be very insightful, not only due to the appreciate treatment of uncertainty and randomness mentioned above, but because they also enable an inverse identification of the critical failure paths (see Figure 7 and Figure 8) and the characterization of weak links in a multicomponent system. On the example of Variant 1 analyzed in Section 4, prioritization of maintenance would be assigned primarily to elements 25 and 26, and perhaps secondarily to element 5 and 19 (although improvement of elements 25 and 26 may alter the originally anticipated failure paths). On the example of Variant 2, key elements are the ones identified as 5 and 18 in Figure 8. In turn, this can facilitate a rational design for robustness, as well as an efficient strategy for the design of, as for example the elements mentioned above, ‘key elements” as defined in Section 2.2.2. This further allows for a robustness-based strategy for structural maintenance, including health monitoring optimization and targeted strengthening. Alternatively, elements of high significance for the survival of the structure under an unexpected event, can be specifically designed as redundant or adaptive components in innovative structural concepts.
Author Contributions
Funding
Conflicts of Interest
References
- Pearson, C.; Delatte, N. Ronan point apartment tower collapse and its effect on building codes. J. Perform. Constr. Facil. 2005, 19, 172–177. [Google Scholar] [CrossRef]
- NTSB (National Transportation Safety Board). Highway Accident Report NTSB/HAR-07/02. In Ceiling Collapse in the Interstate 90 Connector Tunnel, Boston, Massachusetts, July 10 2006; NTSB: Washington DC, USA, 2006. [Google Scholar]
- Stacy, M.; Denton, S.; Pottle, S. Management of Safety-Critical Fixings. Guidance for the Management and Design of Safety-Critical Fixings (C778); CIRIA-Construction Industry Research and Information Association: London, UK, 2019; ISBN 978-0-86017-793-7. [Google Scholar]
- NTSB (National Transportation Safety Board). Highway Accident Report NTSB/ HAR-19/02 PB2019-101363. In Pedestrian Bridge Collapse over SW 8th Street, Miami, Florida, March 15 2018; NTSB: Washington DC, USA, 2019. [Google Scholar]
- Morgese, M.; Ansari, F.; Domaneschi, M.; Cimellaro, G.P. Post-collapse analysis of Morandi’s Polcevera viaduct in Genoa Italy. J. Civ. Struct. Health Monit. 2020, 10, 69–85. [Google Scholar] [CrossRef]
- Starossek, U.; Haberland, M. Measures of Structural Robustness—Requirements and Applications. In Proceedings of the Structures Congress 2008, Vancouver, BC, Canada, 24–26 April 2008. [Google Scholar]
- Frangopol, D.M.; Curley, J.P. Effects of damage and redundancy on structural reliability. J. Struct. Eng. 1987, 113, 1533–1549. [Google Scholar] [CrossRef]
- Biondini, F.; Frangopol, D.M.; Restelli, S. On Structural Robustness, Redundancy, and Static Indeterminacy; ASCE Press: Reston, VA, USA, 2008; pp. 1–10. [Google Scholar] [CrossRef]
- Kanno, Y.; Ben-Haim, Y. Redundancy and robustness, or when is redundancy redundant? J. Struct. Eng. 2011, 137, 935–945. [Google Scholar] [CrossRef]
- Kokot, S. Literature Survey on Current Methodologies of Assessment of Building Robustness and Avoidance of Progressive Collapse; JRC Scientific and Technical Reports; European Communities, Joint Research Centre, Institute for the Protectionand Security of the Citizen: Ispra, Italy, 2009. [Google Scholar]
- COST Action TU0601. Robustness of Structures. In Structural Robustness Design for Practicing; Canisius, T.D.G., Ed.; European Cooperation in Science & Technology: Brussels, Belgium, September 2011. [Google Scholar]
- Droogné, D. Reliability-Based Design for Robustness: Evaluation of Progressive Collapse in Concrete Structures Taking into Account Membrane Action. Ph.D. Thesis, Ghent University, Ghent, Belgium, 2019. [Google Scholar]
- Urban, S.; Strauss, A.; Macho, W.; Bergmeister, K.; Dehlinger, C.; Reiterer, M. Concrete structures under cyclic loading-robustness and redundancy considerations for residual lifetime optimization. Bautechnik 2012, 89, 737–752. [Google Scholar] [CrossRef]
- Strauss, A.; Vidovic, A.; Zambon, I.; Grossberger, H.; Bergmeister, K. Monitoring information and probabilistic-based prediction models for the performance assessment of concrete structures. J. Perform. Constr. Facili. 2016, 30, 04015081. [Google Scholar] [CrossRef]
- DCLG–Department for Communities and Local Government. Review of International Research on Structural Robustness and Disproportionate Collapse. (Report Commissioned from Arup Group); Department for Communities and Local Government (DCLG) and the Centre for the Protection of National Infrastructure (CPNI): London, UK, 2011.
- CEN (European Committee for Standardization). EN 1990, Eurocode 0: Basis of Structural Design, + A1:2005/AC:2010; CEN/TC 250 2010; European Committee for Standardization: Brussels, Belgium, 2010. [Google Scholar]
- CEN (European Committee for Standardization). EN 1991-1-7:2006. Eurocode 1: Actions on Structures-Part 1-7: General Actions-Accidental Actions. + A1:2014; CEN/TC 250 2014; European Committee for Standardization: Brussels, Belgium, 2014. [Google Scholar]
- Fib–International Federation of Structural Concrete. Fib Bulletin 65: Model Code for Concrete Structures; Fib–International Federation of Structural Concrete: Lausanne, Switzerland, 2012. [Google Scholar]
- CEN (European Committee for Standardization). EN 1992-1-1:2004. Eurocode 2: Design of Concrete Structures – Part 1–1: General Rules and Rules for Buildings. + A1:2014; CEN/TC 250 2014; European Committee for Standardization: Brussels, Belgium, 2014. [Google Scholar]
- Starossek, U. Progressiver Kollaps von Bauwerken. Beton-und Stahlbetonbau 2005, 100, 305–317. [Google Scholar] [CrossRef]
- Eriksson, A.; Tibert, A.G. Redundant and force-differentiated systems in engineering and nature. Comput. Methods Appl. Mech. Eng. 2006, 195, 5437–5453. [Google Scholar] [CrossRef]
- Ghosn, M.; Dueñas-Osorio, L.; Frangopol, D.M.; McAllister, T.P.; Bocchini, P.; Manuel, L.; Ellingwood, B.R.; Arangio, S.; Bontempi, F.; Shah, M.; et al. Performance indicators for structural systems and infrastructure networks. J. Struct. Eng. 2016, 142, F4016003. [Google Scholar] [CrossRef]
- Adam, J.M.; Parisi, F.; Sagaseta, J.; Lu, X. Research and practice on progressive collapse and robustness of building structures in the 21st century. Eng. Struct. 2018, 173, 122–149. [Google Scholar] [CrossRef]
- Matthews, S.; Bigaj-van Vliet, A.; Walraven, J.; Mancini, G.; Dieteren, G. fib Model Code 2020: Towards a general code for both new and existing concrete structures. Struct. Concr. 2018, 19, 969–979. [Google Scholar] [CrossRef]
- Maes, M.A.; Fritzsons, K.E.; Glowienka, S. Structural robustness in the light of risk and consequence analysis. Struct. Eng. Int. 2006, 16, 101–107. [Google Scholar] [CrossRef]
- Baker, J.W.; Schubert, M.; Faber, M.H. On the assessment of robustness. Struct. Saf. 2008, 30, 253–267. [Google Scholar] [CrossRef]
- Weigand, J.M.; Bao, Y.; Main, J.A. Acceptance criteria for the nonlinear alternative load path analysis of steel and reinforced concrete frame structures. In Proceedings of the Structures Congress 2017, Denver, CO, USA, 6–8 April 2017; pp. 222–232. [Google Scholar]
- Zhu, B.; Frangopol, D.M. Reliability, redundancy and risk as performance indicators of structural systems during their life-cycle. Eng. Struct. 2012, 41, 34–49. [Google Scholar] [CrossRef]
- Ghosn, M.; Frangopol, D.M.; McAllister, T.P.; Shah, M.; Diniz, S.M.C.; Ellingwood, B.R.; Manuel, L.; Biondini, F.; Catbas, N.; Strauss, A.; et al. Reliability-based performance indicators for structural members. J. Struct. Eng. 2016, 142, F4016002. [Google Scholar] [CrossRef]
- Kou, X.; Li, L.; Zhou, Y.; Song, J. Redundancy Component Matrix and Structural Robustness. Int. J. Civ. Environ. Eng. 2017, 11, 1150–1155. [Google Scholar]
- Praxedes, C.; Yuan, X.X. Development of a design-oriented structural robustness index for progressive collapse. In Life Cycle Analysis and Assessment in Civil Engineering: Towards an Integrated Vision, Proceedins of the Sixth International Symposium on Life-Cycle Civil Engineering, Ghent, Belgium, 28–31 October 2018; Caspeele, R., Taerwe, L., Frangopol, D.M., Eds.; IALCCE 2018; CRC Press: London, UK, 2018; ISBN1 978-1-315-22891-4. ISBN2 978-1-138-62633-1. [Google Scholar]
- Starossek, U.; Haberland, M. Approaches to measures of structural robustness. Struct. Infrastruct. Eng. 2011, 7, 625–631. [Google Scholar] [CrossRef]
- Fu, G.; Frangopol, D.M. Balancing weight, system reliability and redundancy in a multiobjective optimization framework. Struct. Saf. 1990, 7, 165–175. [Google Scholar] [CrossRef]
- Guevenc, M.; Spyridis, P. Redundancy in truss systems under uncertainty considerations. In Proceedings of the 29th European Safety and Reliability Conference (ESREL), Hannover, Germany, 22–26 September 2019; pp. 3248–3254. [Google Scholar]
- Guevenc, M.; Spyridis, P. Probabilistic robustness assessment for multi-component assemblies based on realistic case studies. In Proceedings of the 17th International Probabilistic Workshop (IPW), Edinburgh, UK, 11–13 September 2019; pp. 190–195. [Google Scholar]
- CEN (European Committee for Standardization). EN 1993-1-1: Eurocode 3—Part 1–1, Design of Steel Structures—General rules and Rules for Buildings, AC:2009. CEN/TC 250 2009; CEN: Brussels, Belgium, 2009. [Google Scholar]
- Bijlaard, F.; Feldmann, M.; Naumes, J.; Sedlacek, G. The “general method” for assessing the out-of-plane stability of structural members and frames and the comparison with alternative rules in EN 1993—Eurocode 3—Part 1-1. Steel Constr. Design Res. 2010, 3, 19–33. [Google Scholar] [CrossRef]
- Guevenc, M. Robustheit und Redundanzverhalten von Traversensystemen Mit Mehreren Knoten. (Robustness and Redundancy Behavior of Truss Systems with Multiple Nodes). Master’s Thesis, Technische Universität Dortmund, Dortmund, Germany, 2019. [Google Scholar]

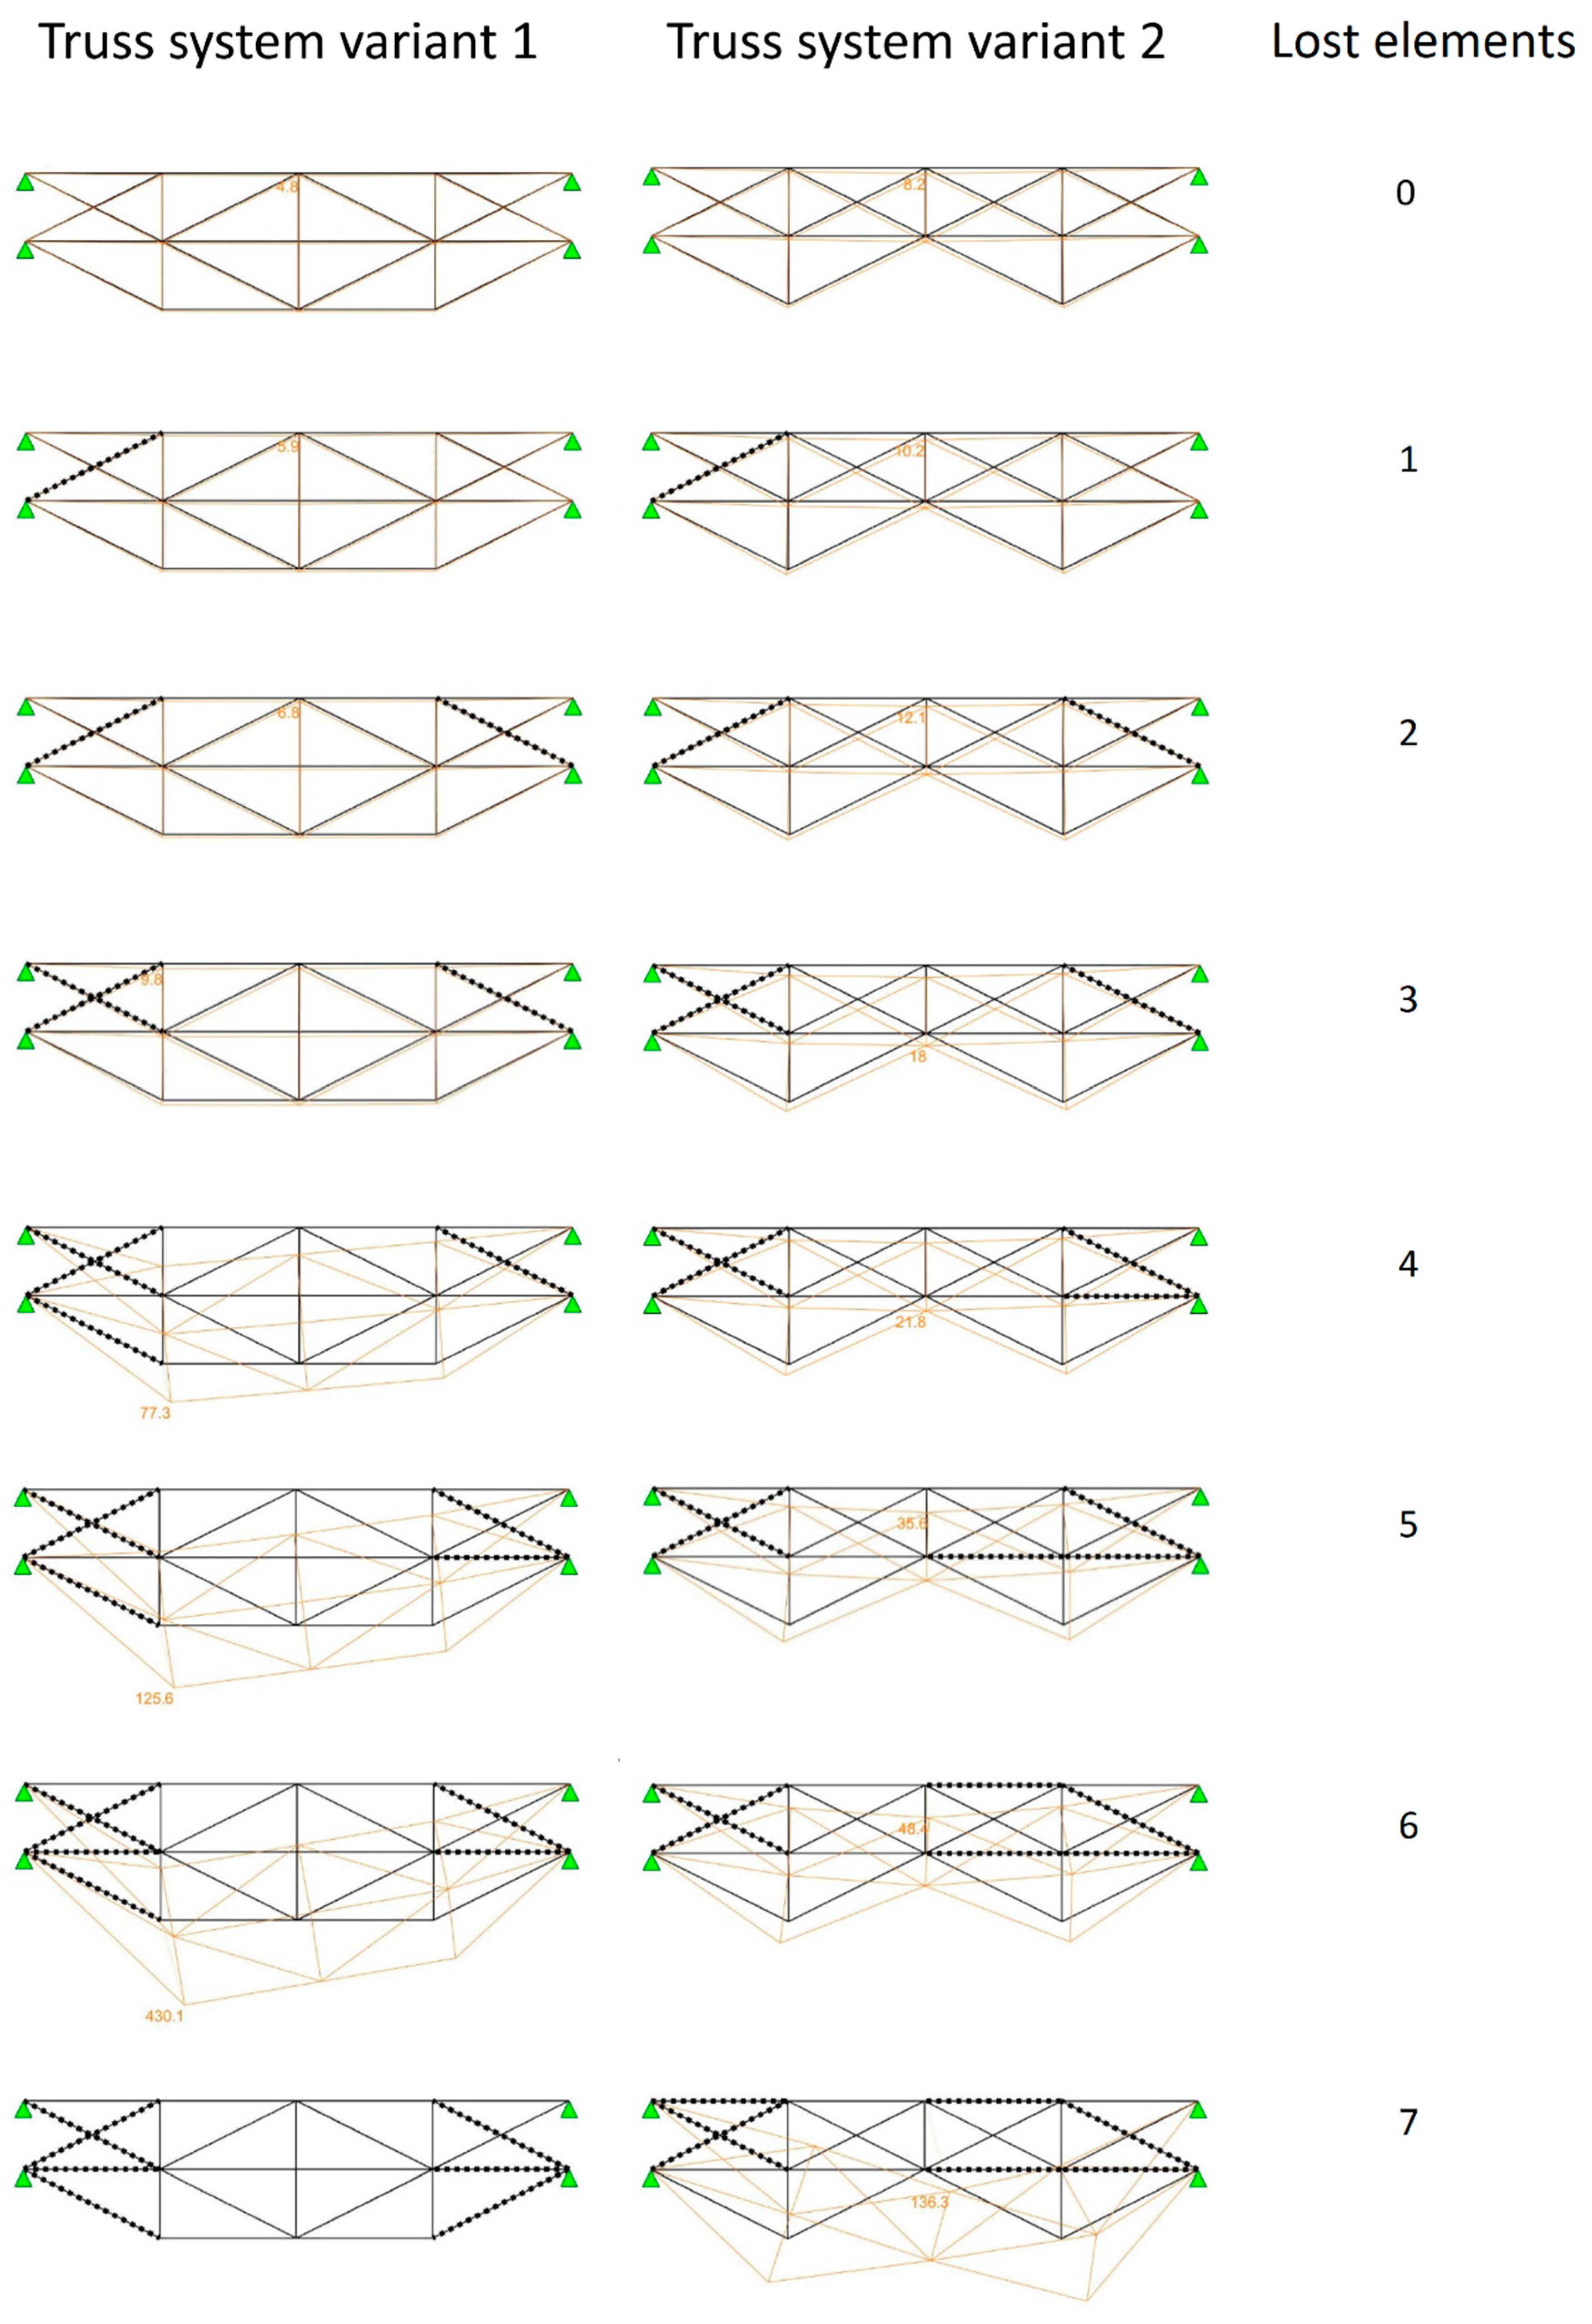
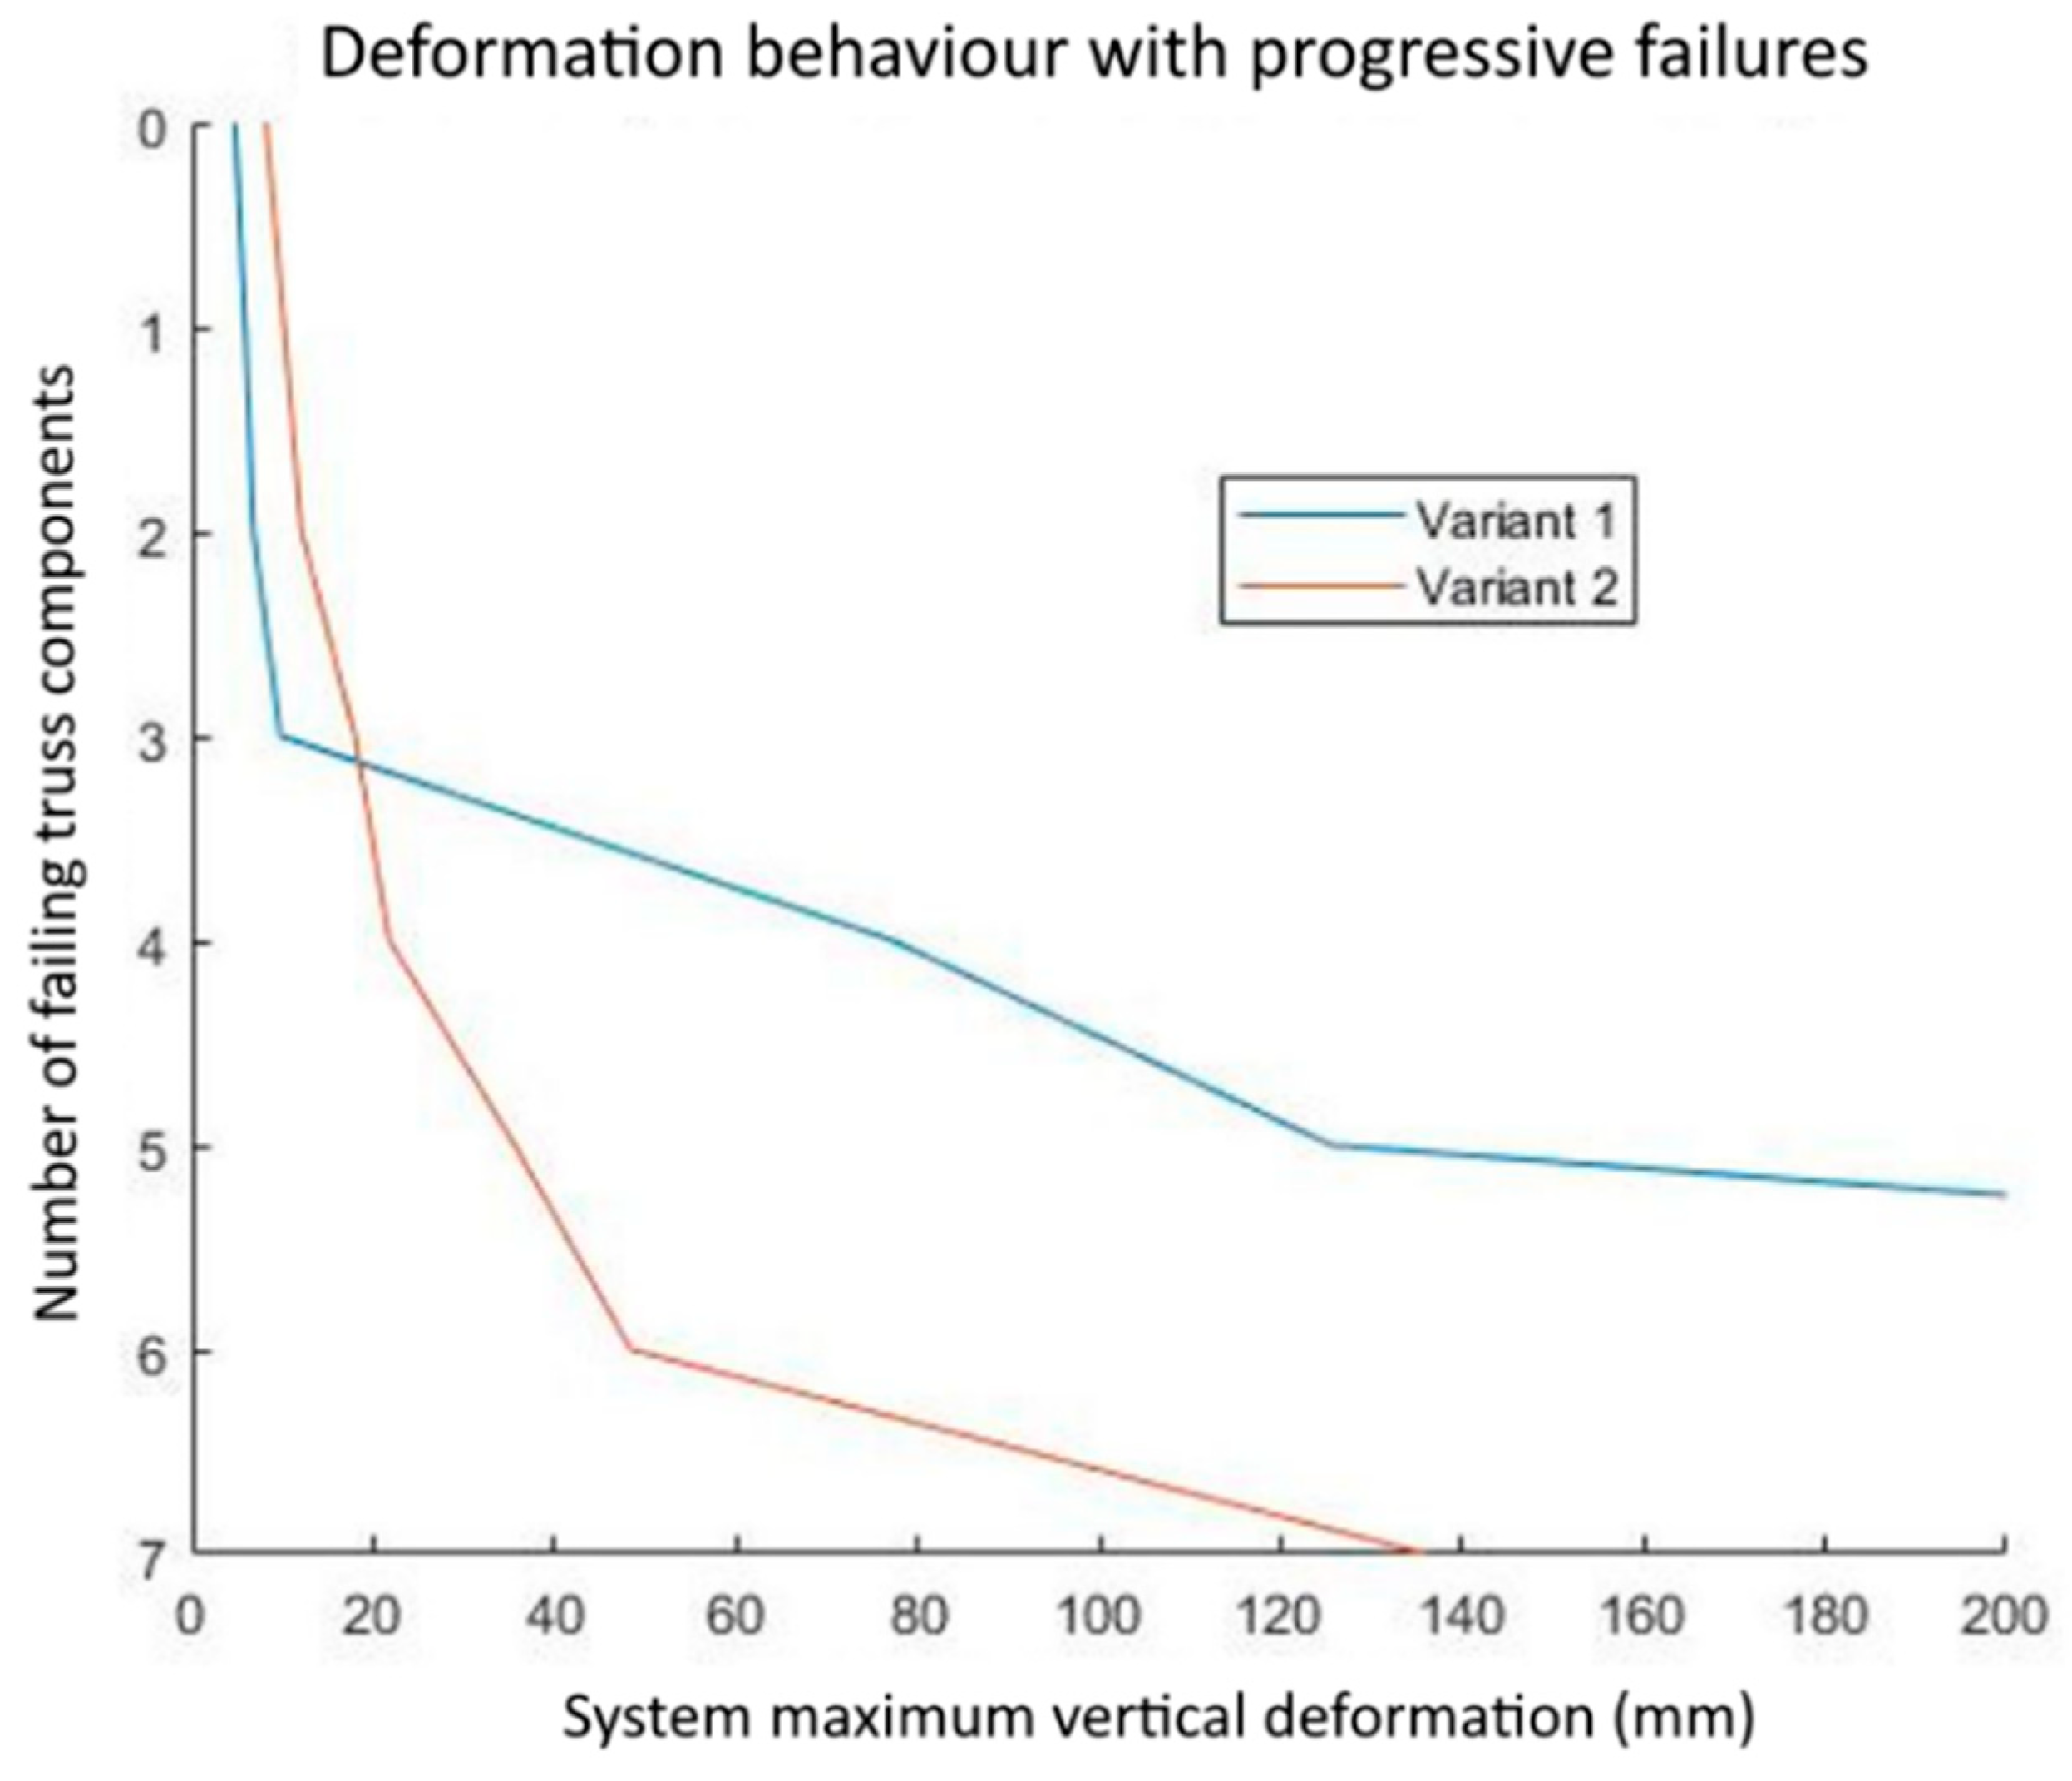
| Number of Failing Components | Variant 1 | Variant 2 | ||||
|---|---|---|---|---|---|---|
| w | η | Element | w | η | Element | |
| 0 | 4.8 | 0.55 | 25 | 8.2 | 0.72 | 3 |
| 1 | 5.9 | 0.51 | 26 | 10.2 | 0.69 | 22 |
| 2 | 6.8 | 0.50 | 2 | 12.1 | 0.64 | 2 |
| 3 | 9.8 | 0.68 | 4 | 18 | 0.93 | 24 |
| 4 | 77.3 | 2.65 | 23 | 21.8 | 0.81 | 17 |
| 5 | 125.6 | 2.54 | 3 | 35.6 | 1.23 | 14 |
| 6 | 430.1 | 6.02 | 24 | 48.4 | 1.14 | 1 |
| 7 | − | − | − | 136.3 | 1.96 | 20 |
| i | rii | βi | i | rii | βi |
|---|---|---|---|---|---|
| 1; 21 | 0.541 | 4.75 | 8; 15 | 0.249 | 4.75 |
| 2; 22 | 0.528 | 4.75 | 9; 16 | 0.362 | 4.75 |
| 3; 23 | 0.623 | 4.75 | 10; 17 | 0.249 | 4.75 |
| 4; 24 | 0.311 | 4.75 | 11; 18 | 0.223 | 4.75 |
| 5; 19 | 0.038 | 4.75 | 12; 13 | 0.050 | 4.75 |
| 6; 20 | 0.028 | 4.75 | 25; 26 | 0.430 | 4.75 |
| 7; 14 | 0.368 | 4.75 | - | - | - |
| i | rii | βi | i | rii | βi |
|---|---|---|---|---|---|
| 1; 21 | 0.582 | 4.75 | 7; 20 | 0.088 | 4.75 |
| 2; 23 | 0.507 | 4.75 | 8; 14 | 0.435 | 4.75 |
| 3; 22 | 0.423 | 4.75 | 9; 15 | 0.381 | 4.75 |
| 4; 24 | 0.587 | 4.75 | 10; 16 | 0.400 | 4.75 |
| 5; 25 | 0.246 | 4.75 | 11; 17 | 0.490 | 4.75 |
| 6; 20 | 0.079 | 4.75 | 12; 18 | 0.246 | 4.75 |
| 13 | 0.076 | 4.75 | - | - | - |
Publisher’s Note: MDPI stays neutral with regard to jurisdictional claims in published maps and institutional affiliations. |
© 2020 by the authors. Licensee MDPI, Basel, Switzerland. This article is an open access article distributed under the terms and conditions of the Creative Commons Attribution (CC BY) license (http://creativecommons.org/licenses/by/4.0/).
Share and Cite
Spyridis, P.; Strauss, A. Robustness Assessment of Redundant Structural Systems Based on Design Provisions and Probabilistic Damage Analyses. Buildings 2020, 10, 213. https://doi.org/10.3390/buildings10120213
Spyridis P, Strauss A. Robustness Assessment of Redundant Structural Systems Based on Design Provisions and Probabilistic Damage Analyses. Buildings. 2020; 10(12):213. https://doi.org/10.3390/buildings10120213
Chicago/Turabian StyleSpyridis, Panagiotis, and Alfred Strauss. 2020. "Robustness Assessment of Redundant Structural Systems Based on Design Provisions and Probabilistic Damage Analyses" Buildings 10, no. 12: 213. https://doi.org/10.3390/buildings10120213
APA StyleSpyridis, P., & Strauss, A. (2020). Robustness Assessment of Redundant Structural Systems Based on Design Provisions and Probabilistic Damage Analyses. Buildings, 10(12), 213. https://doi.org/10.3390/buildings10120213


