Effect of Support Conditions on Performance of Continuous Reinforced Concrete Deep Beams


Abstract
1. Introduction
2. Generation of the 3D Numerical Model
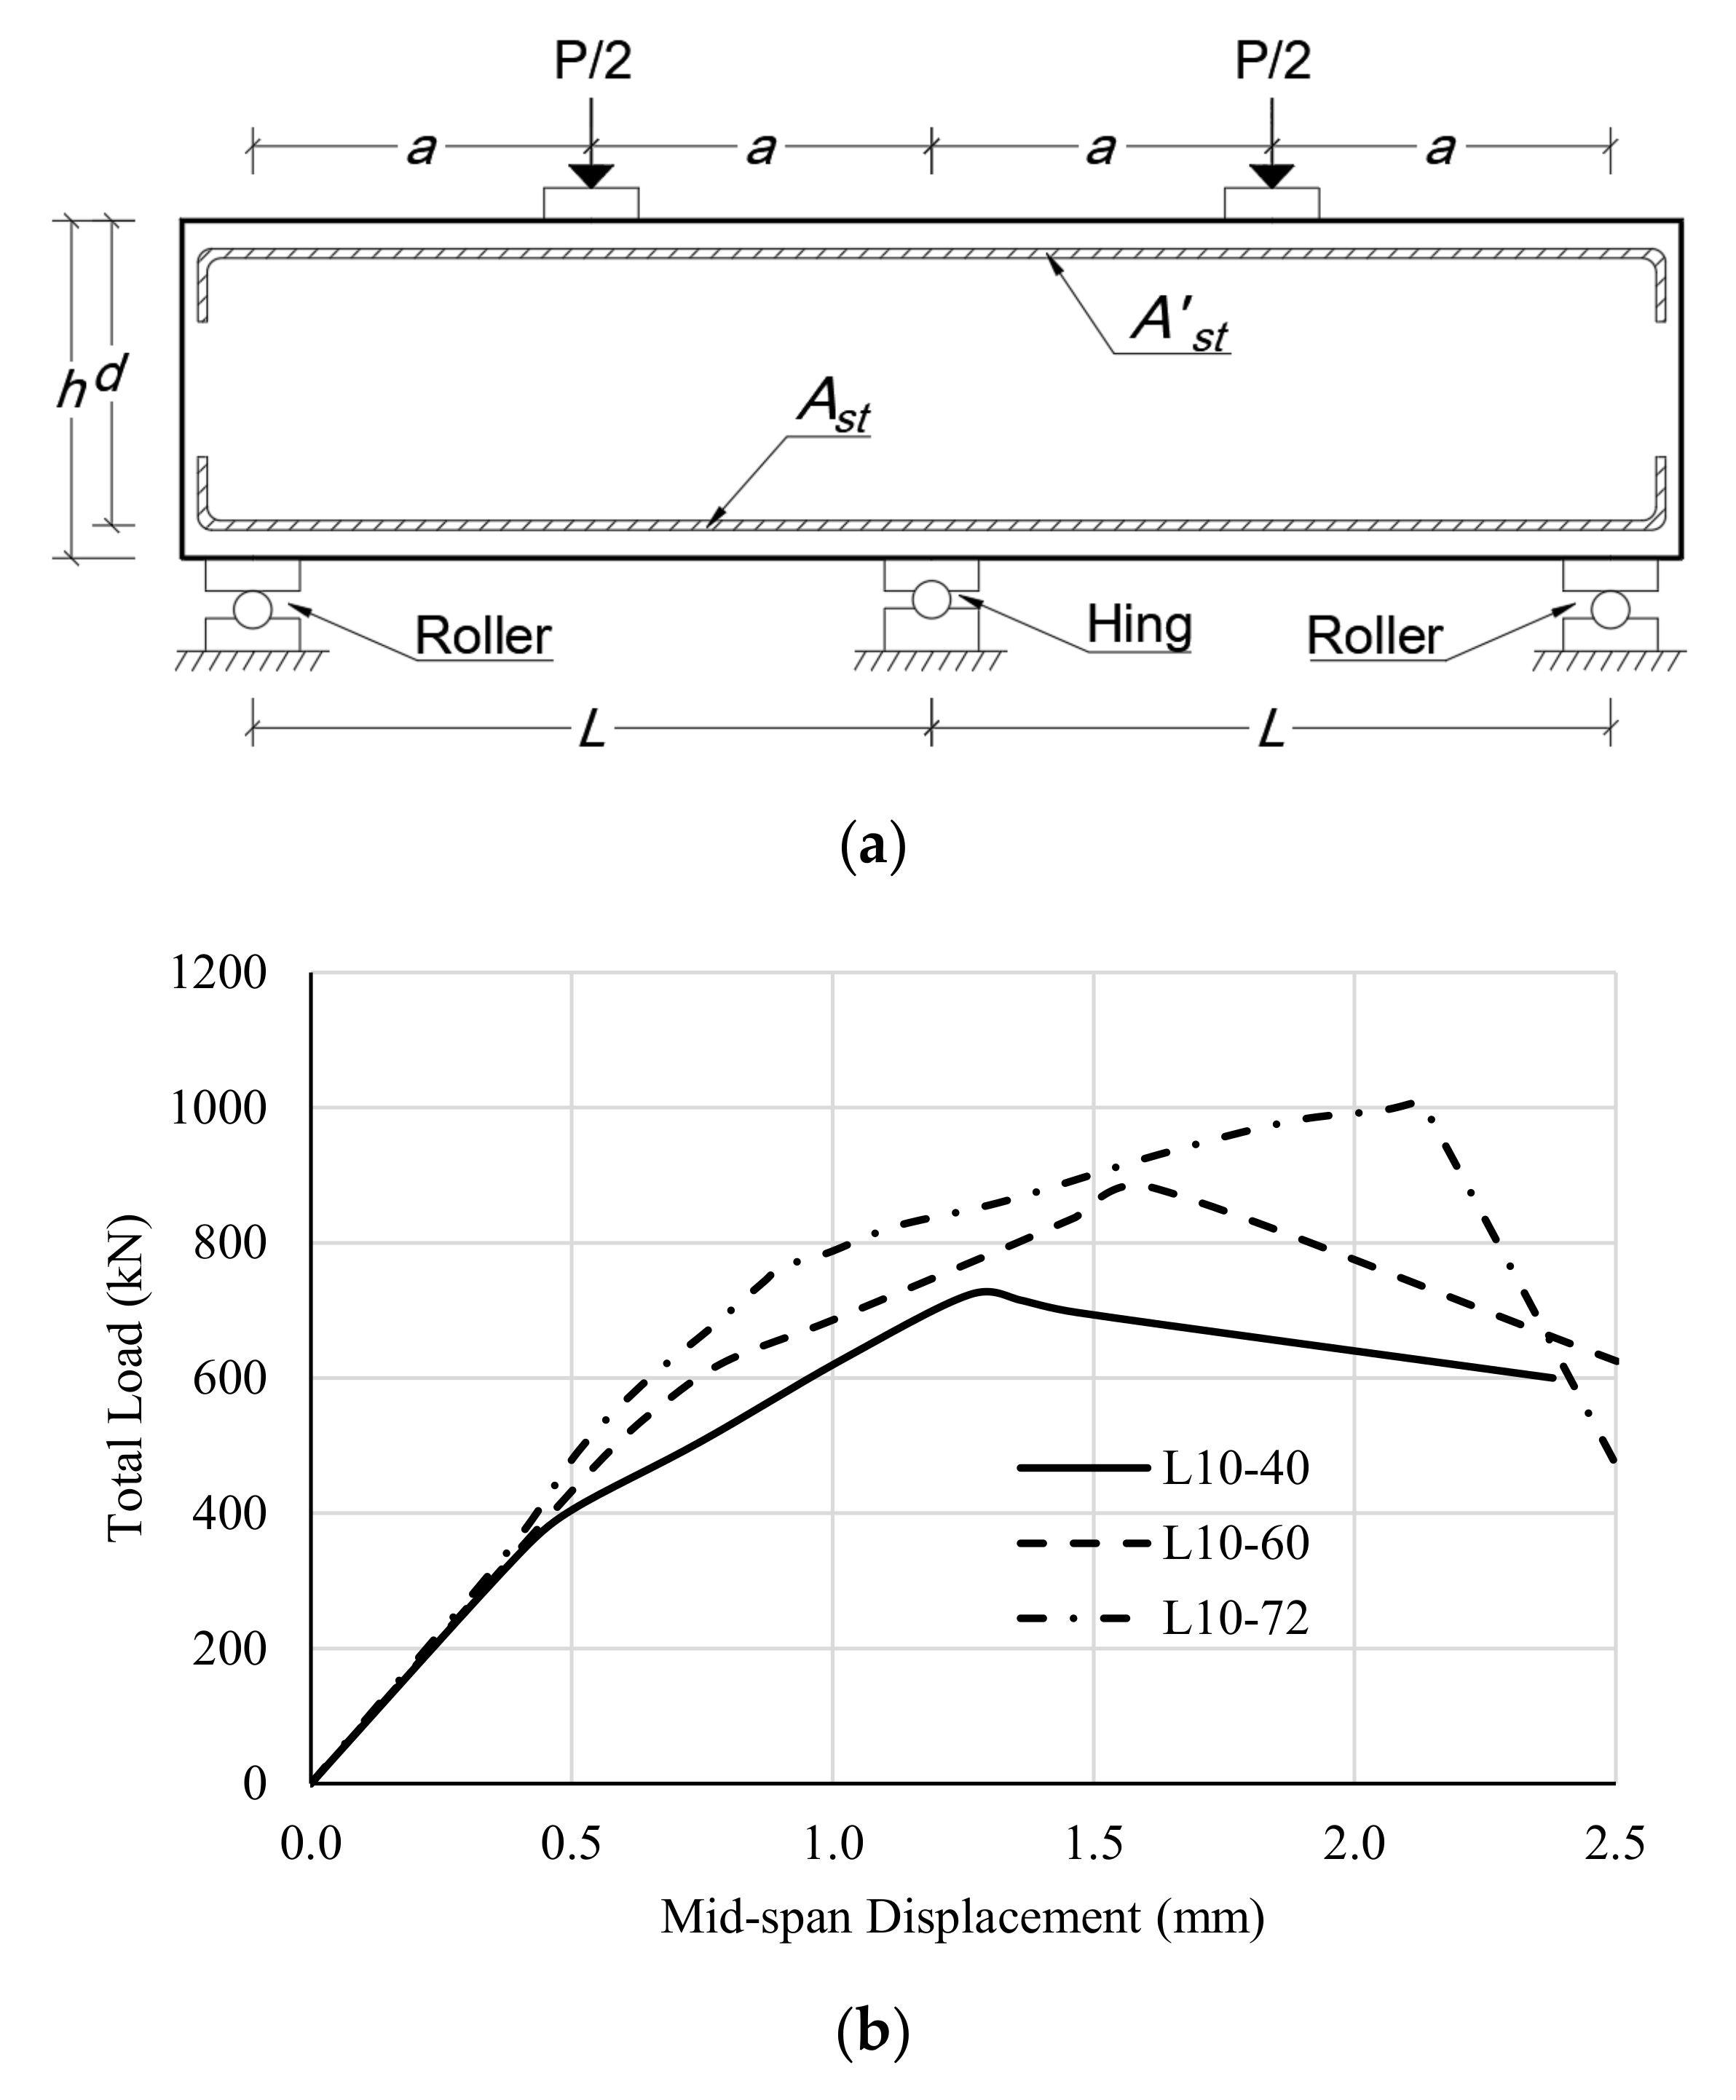
2.1. Test Results
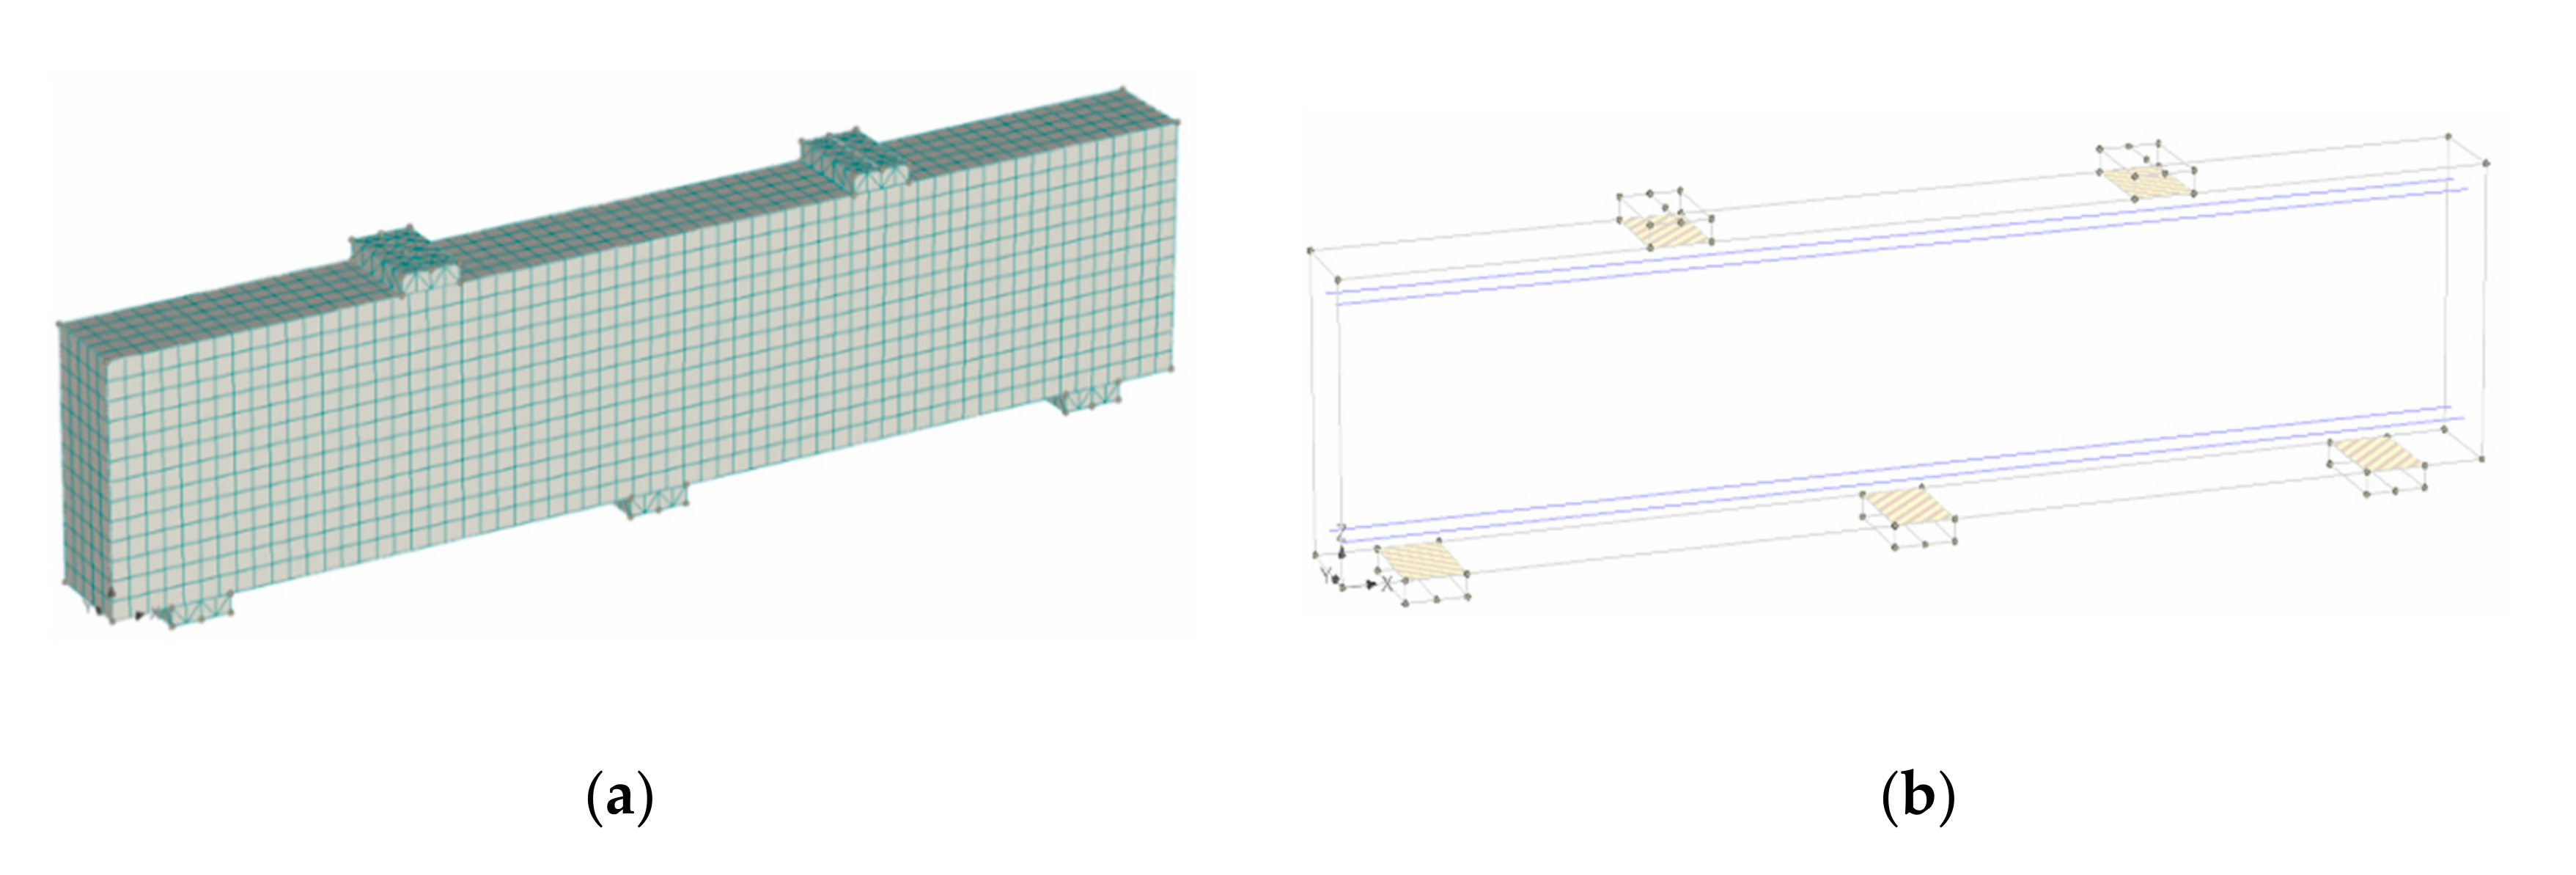
2.2. Mesh Generation of Test Beams
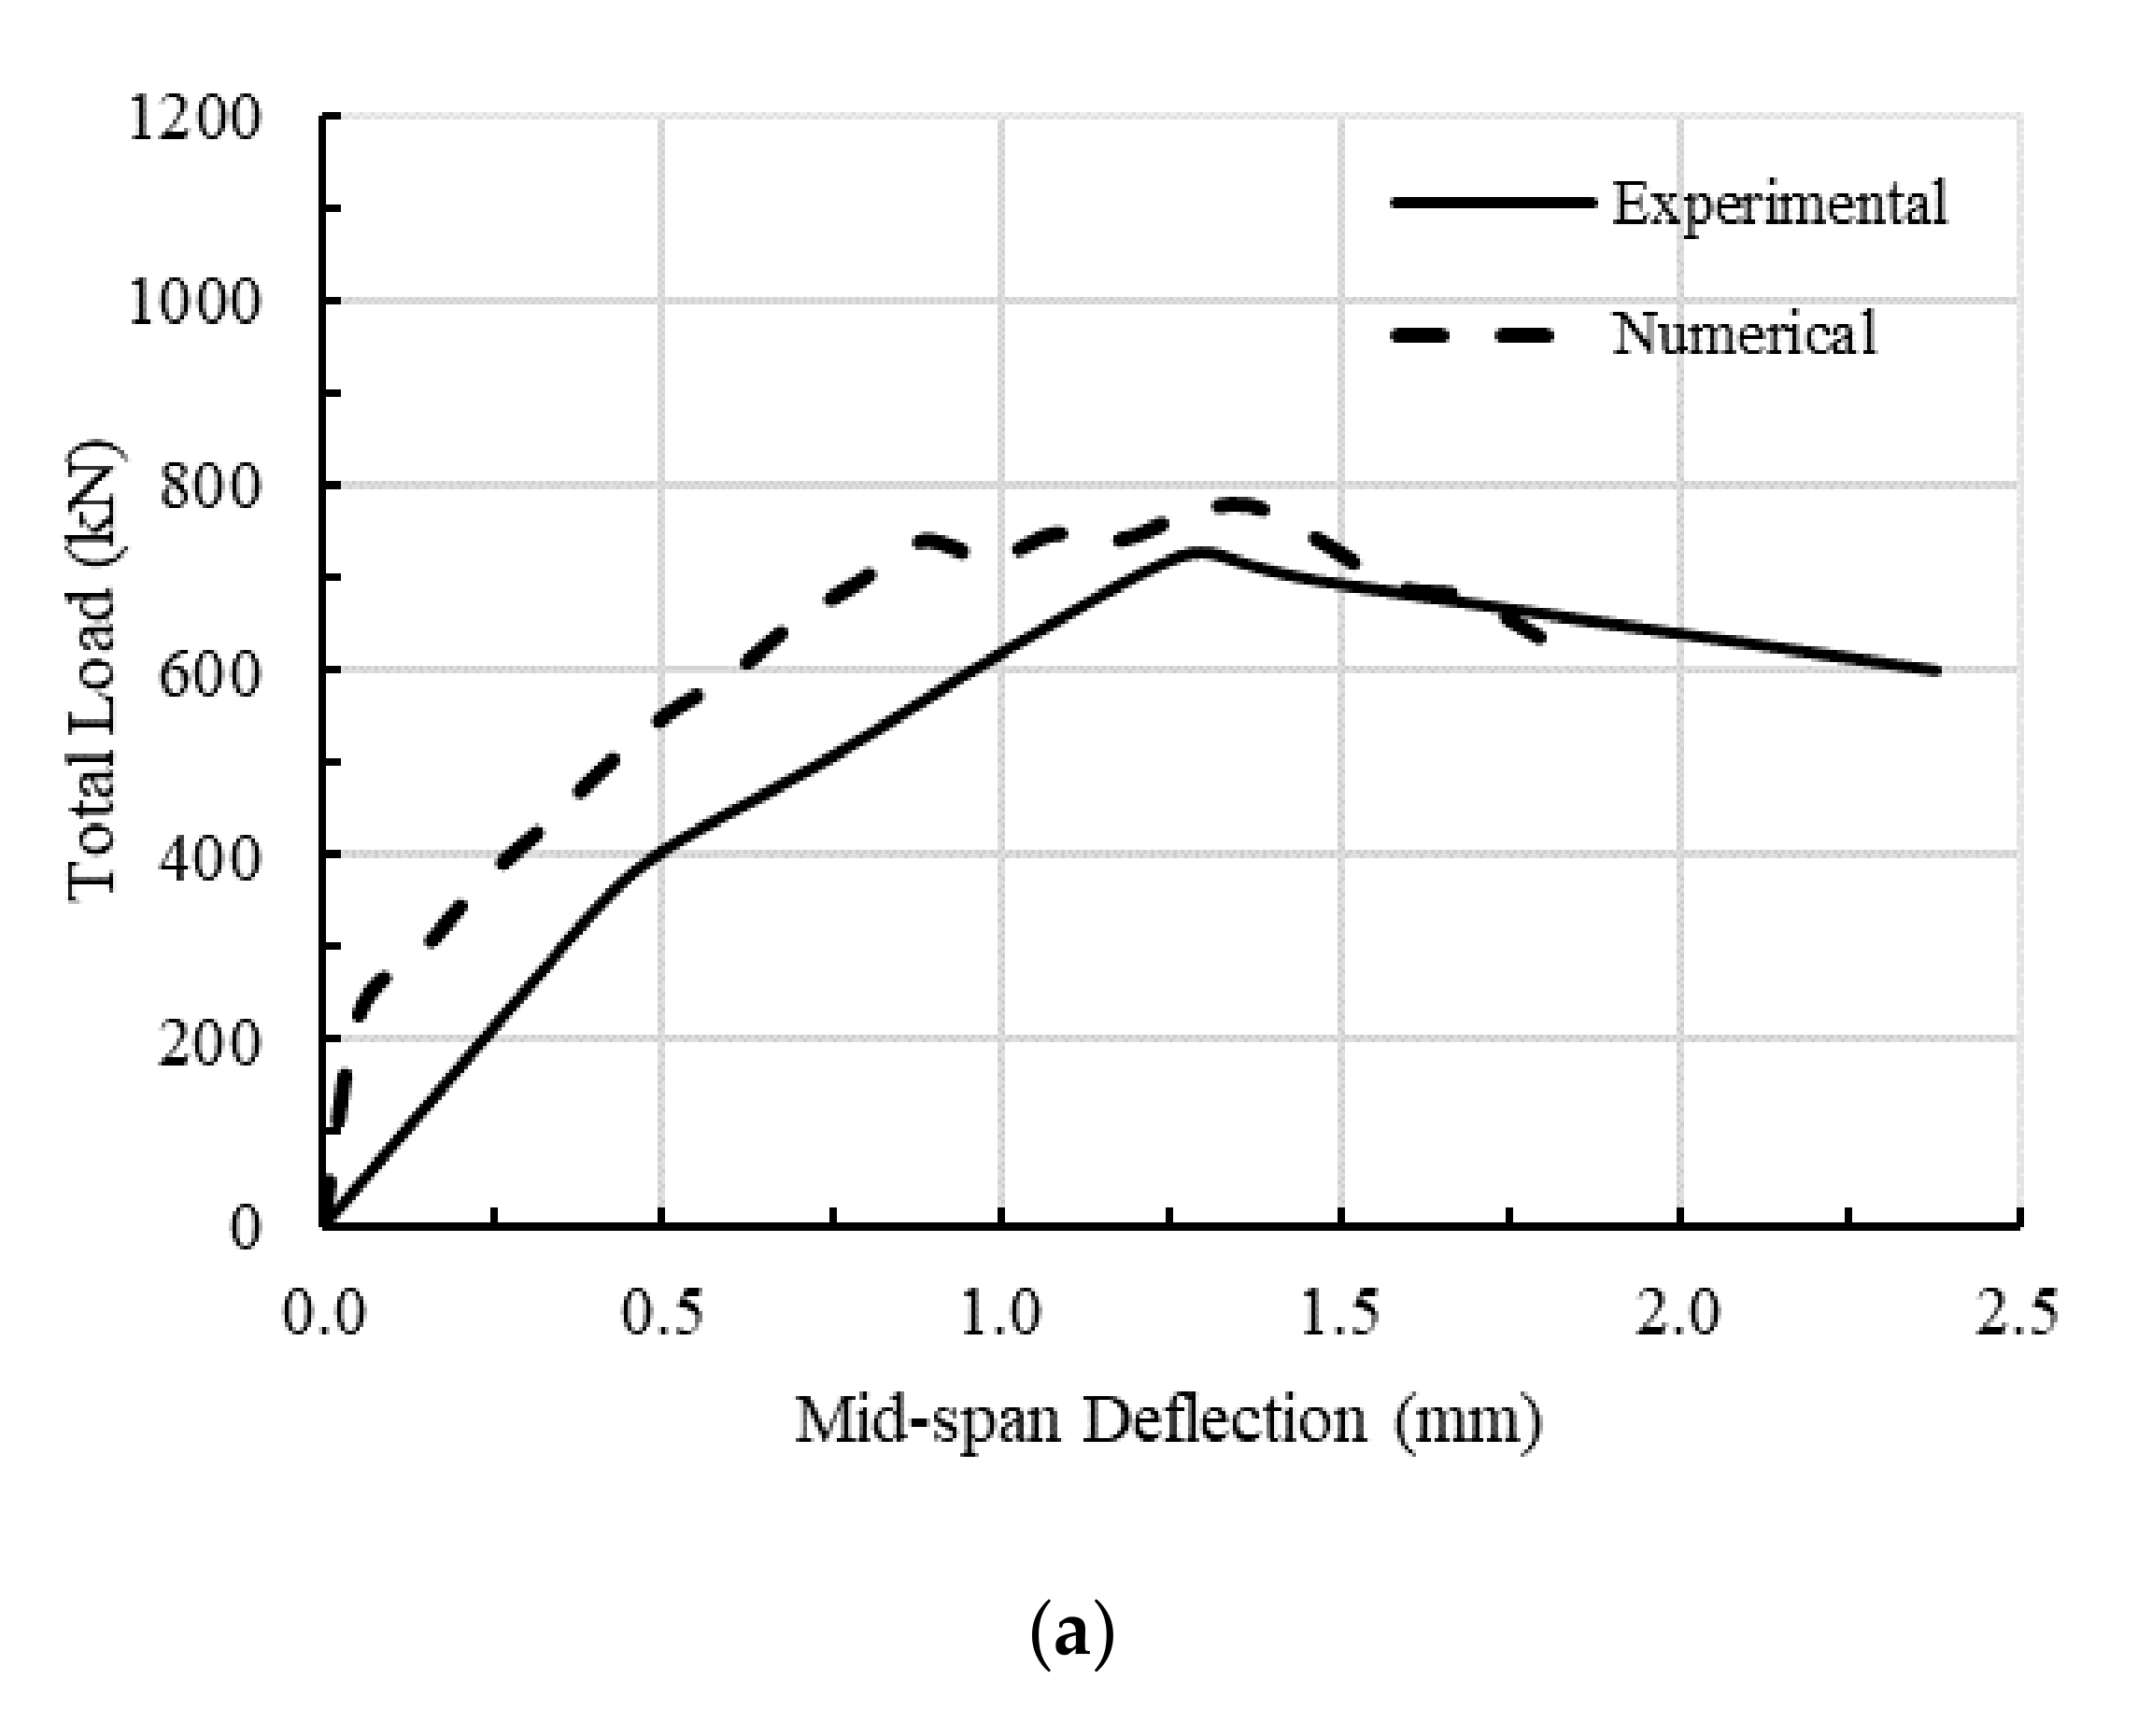
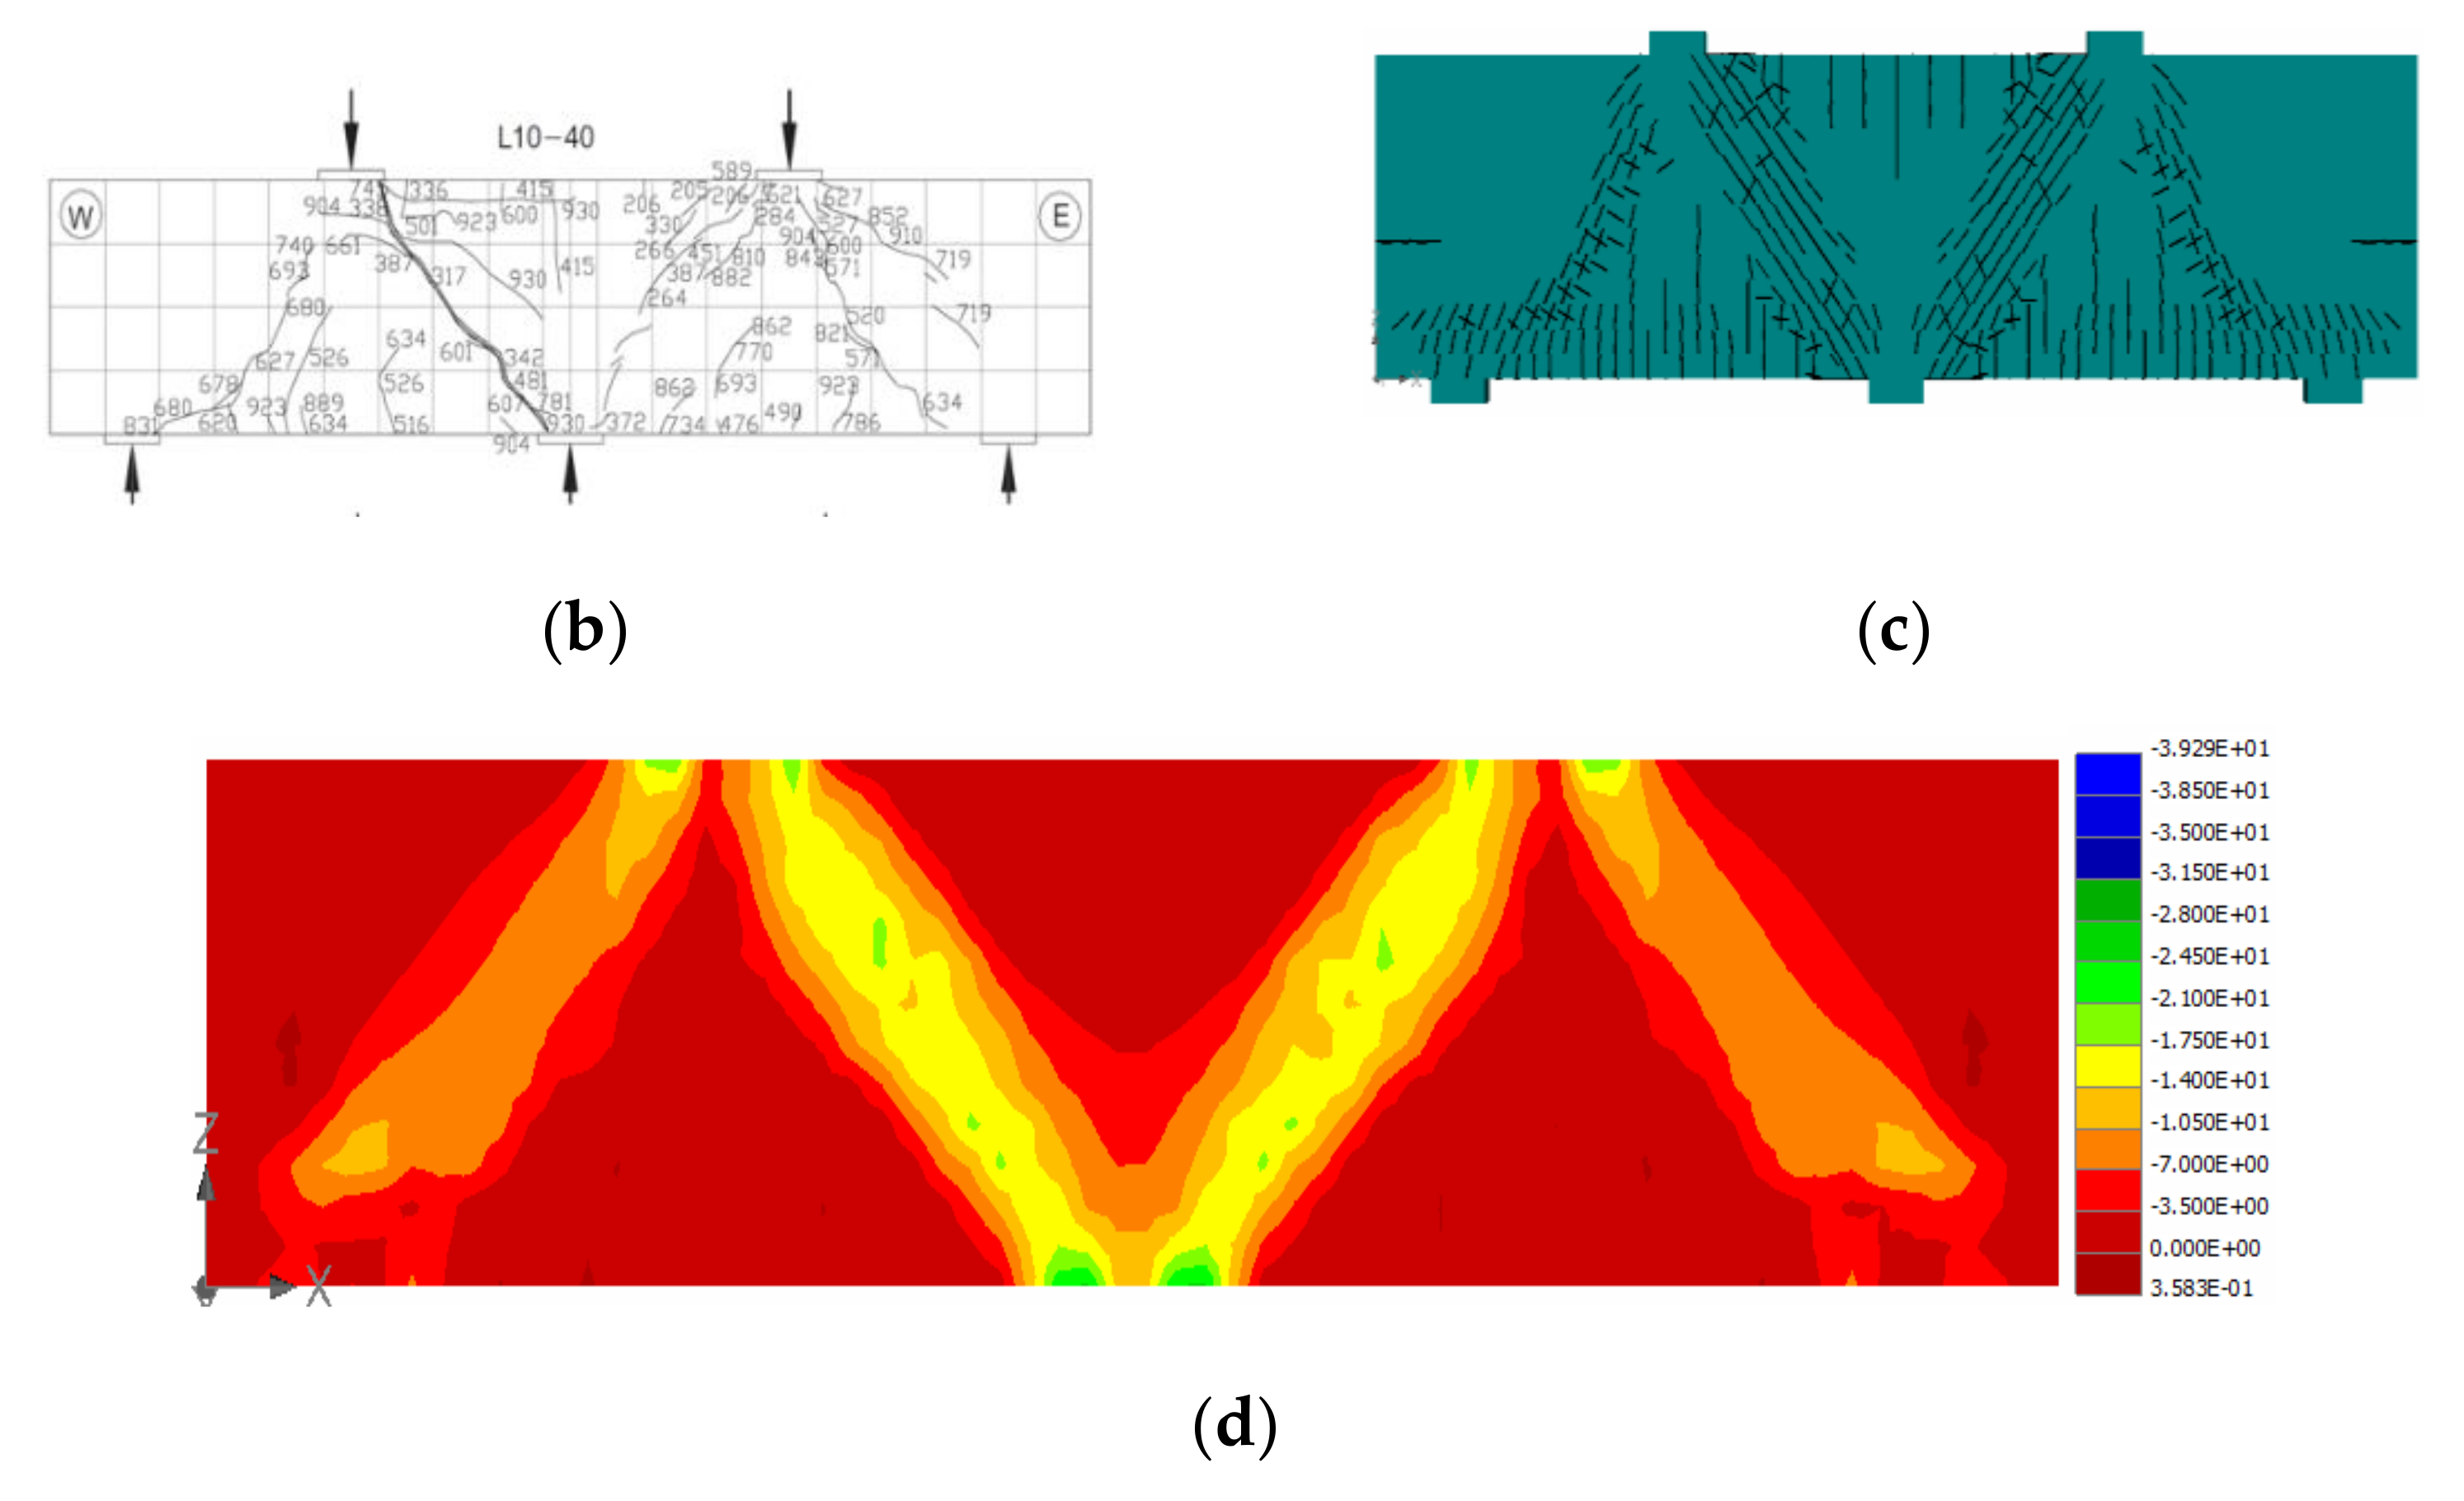
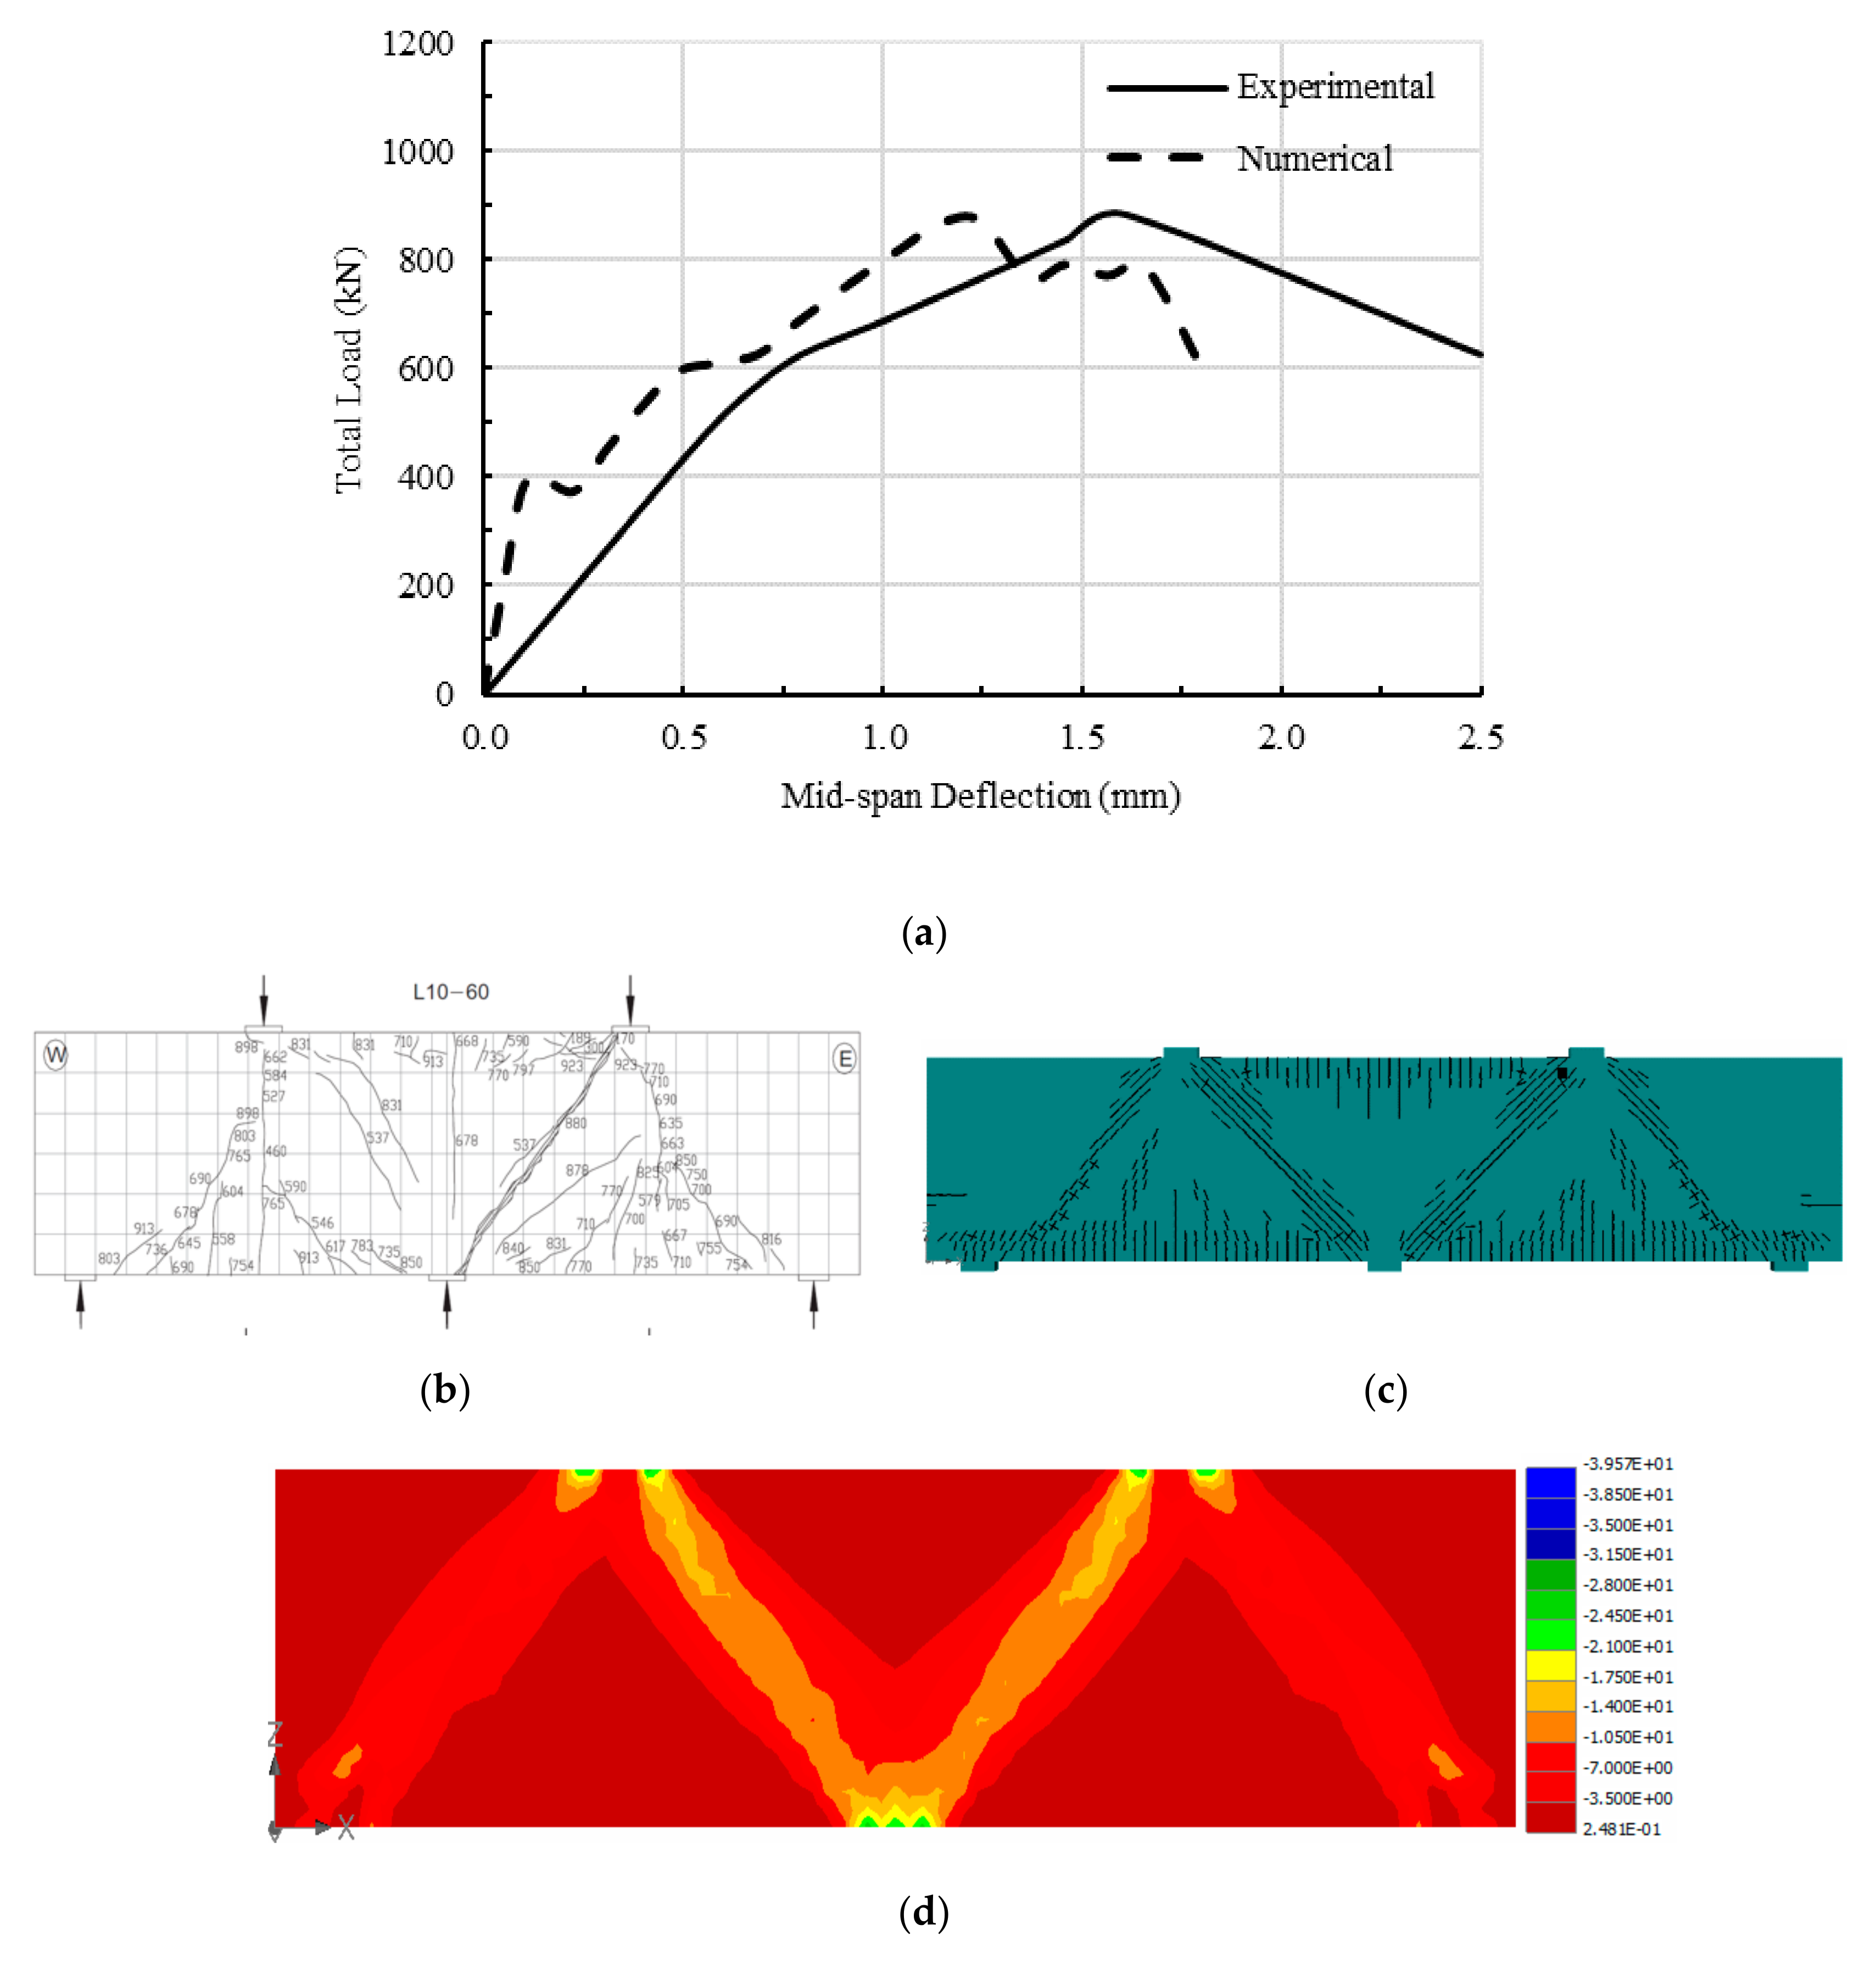
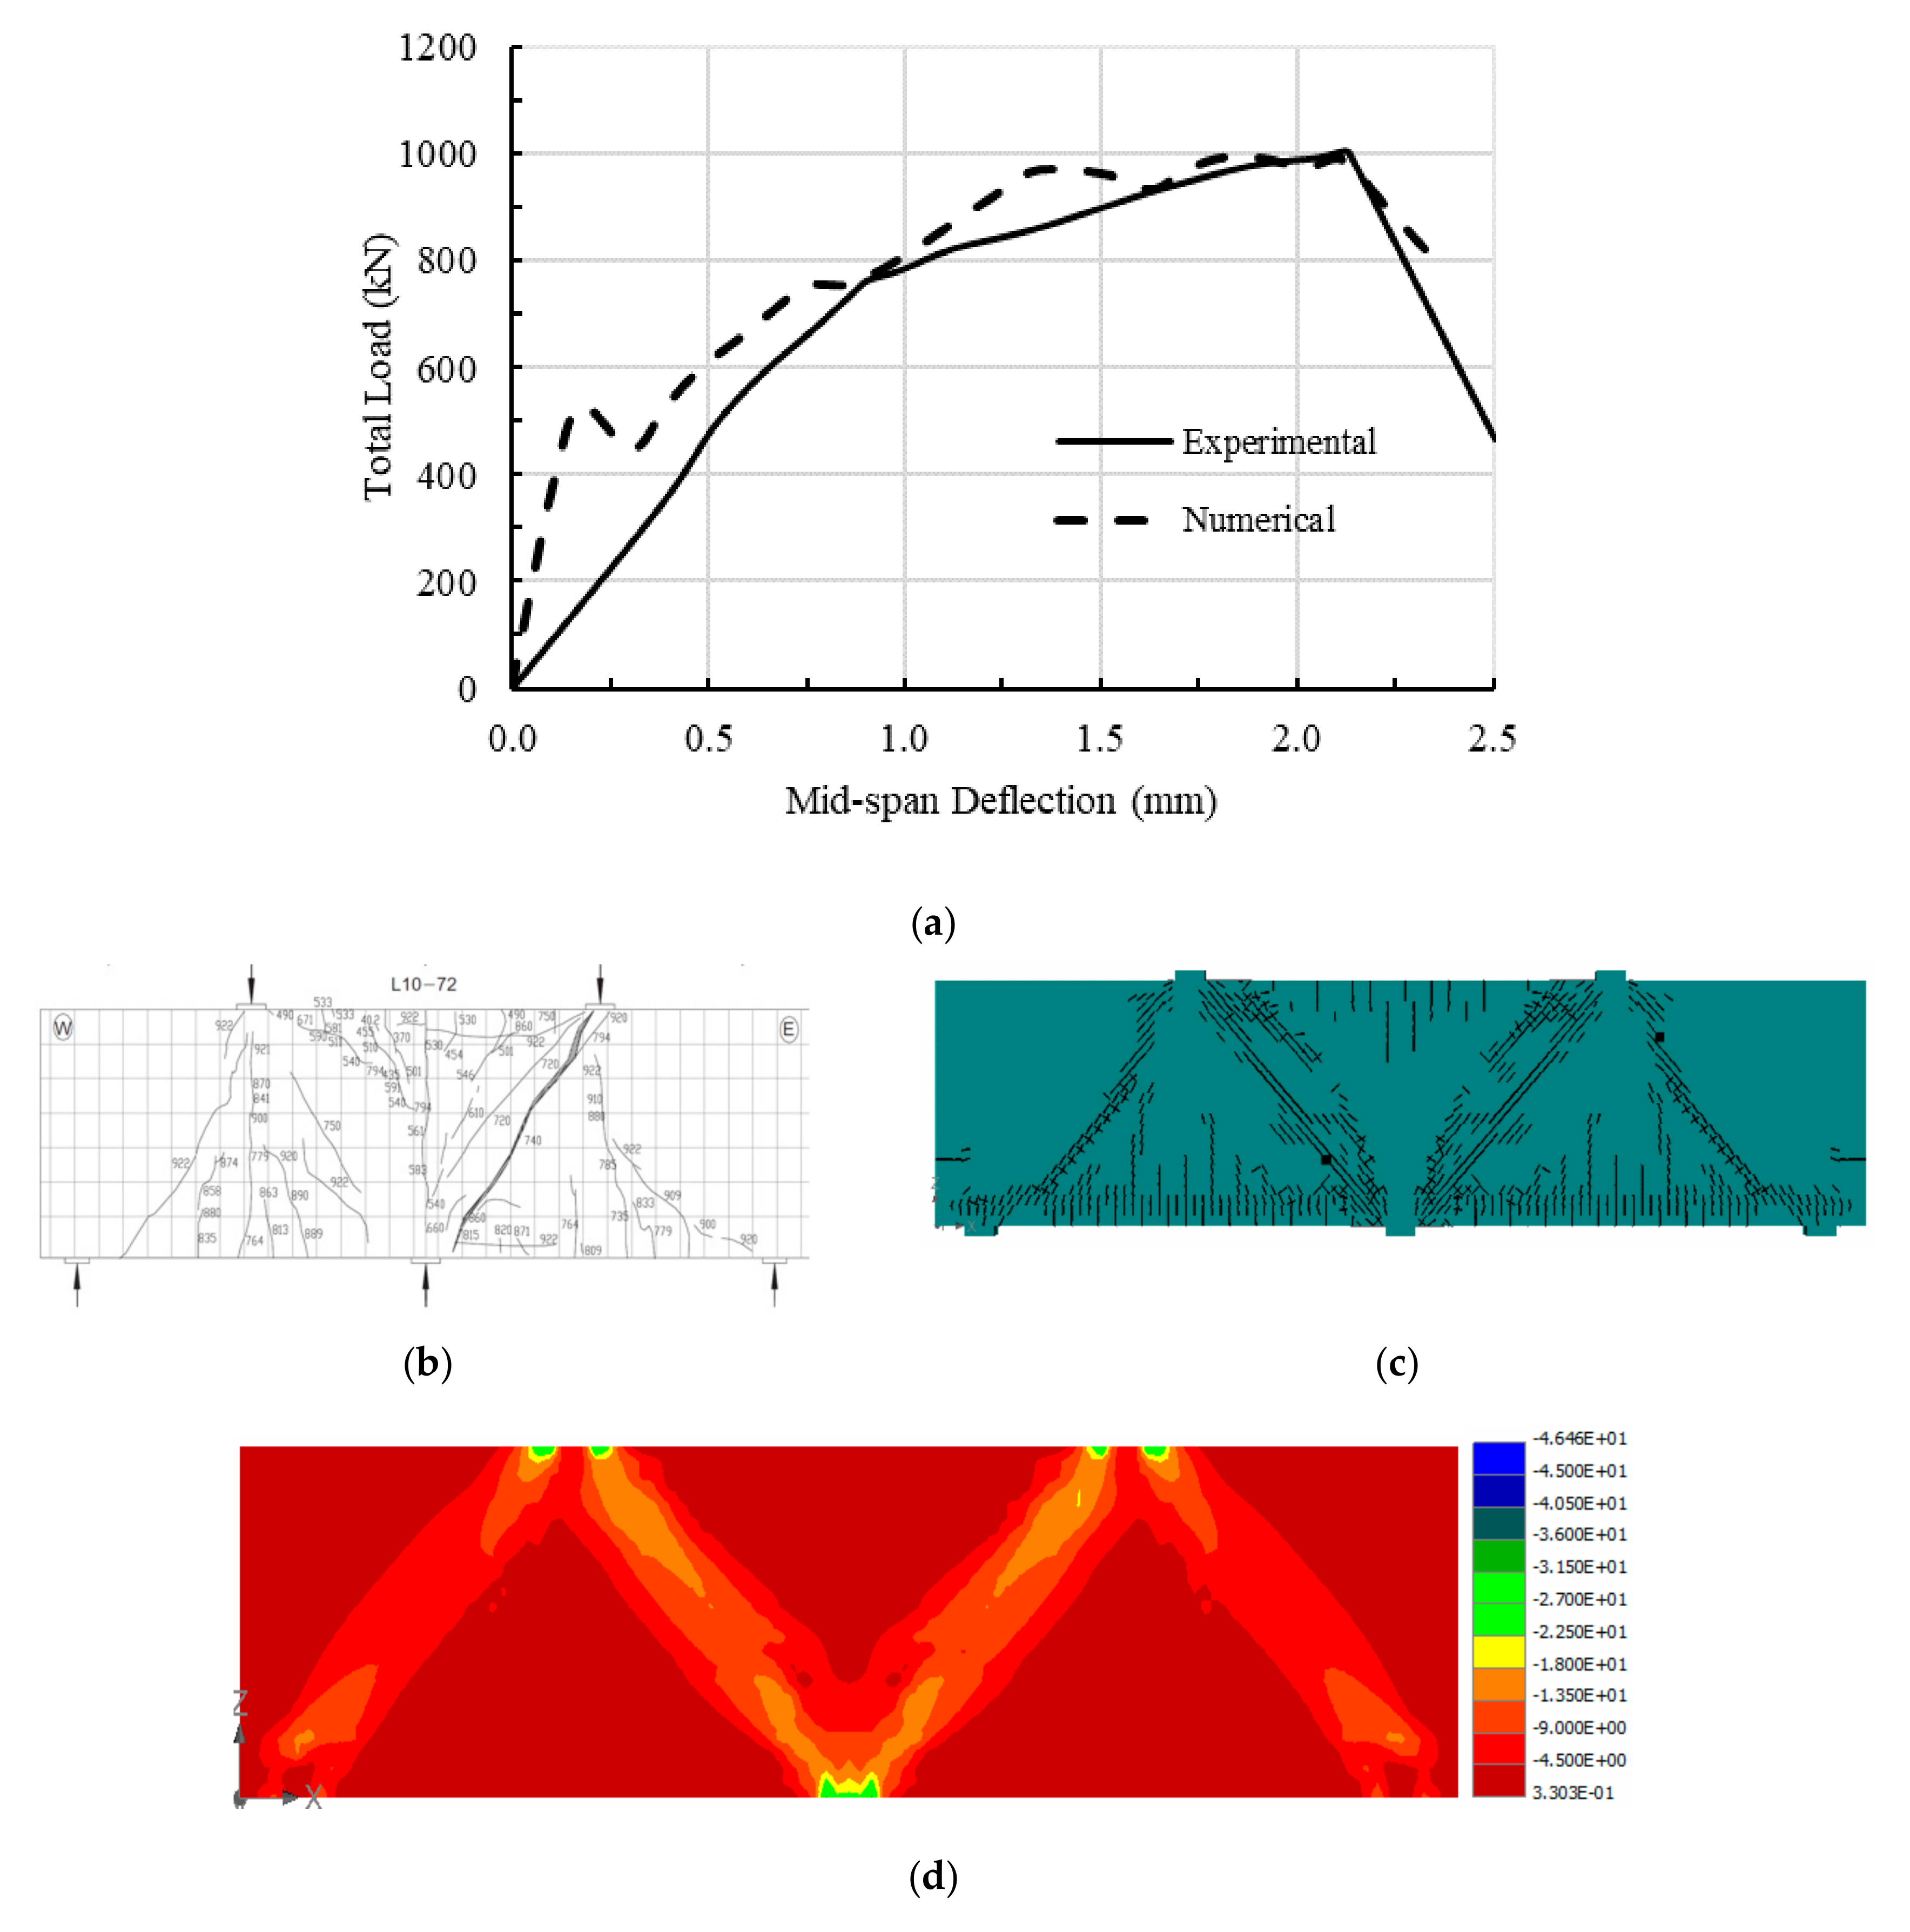
2.3. Verification of the Generated 3D Numerical Model
3. Parametric Study
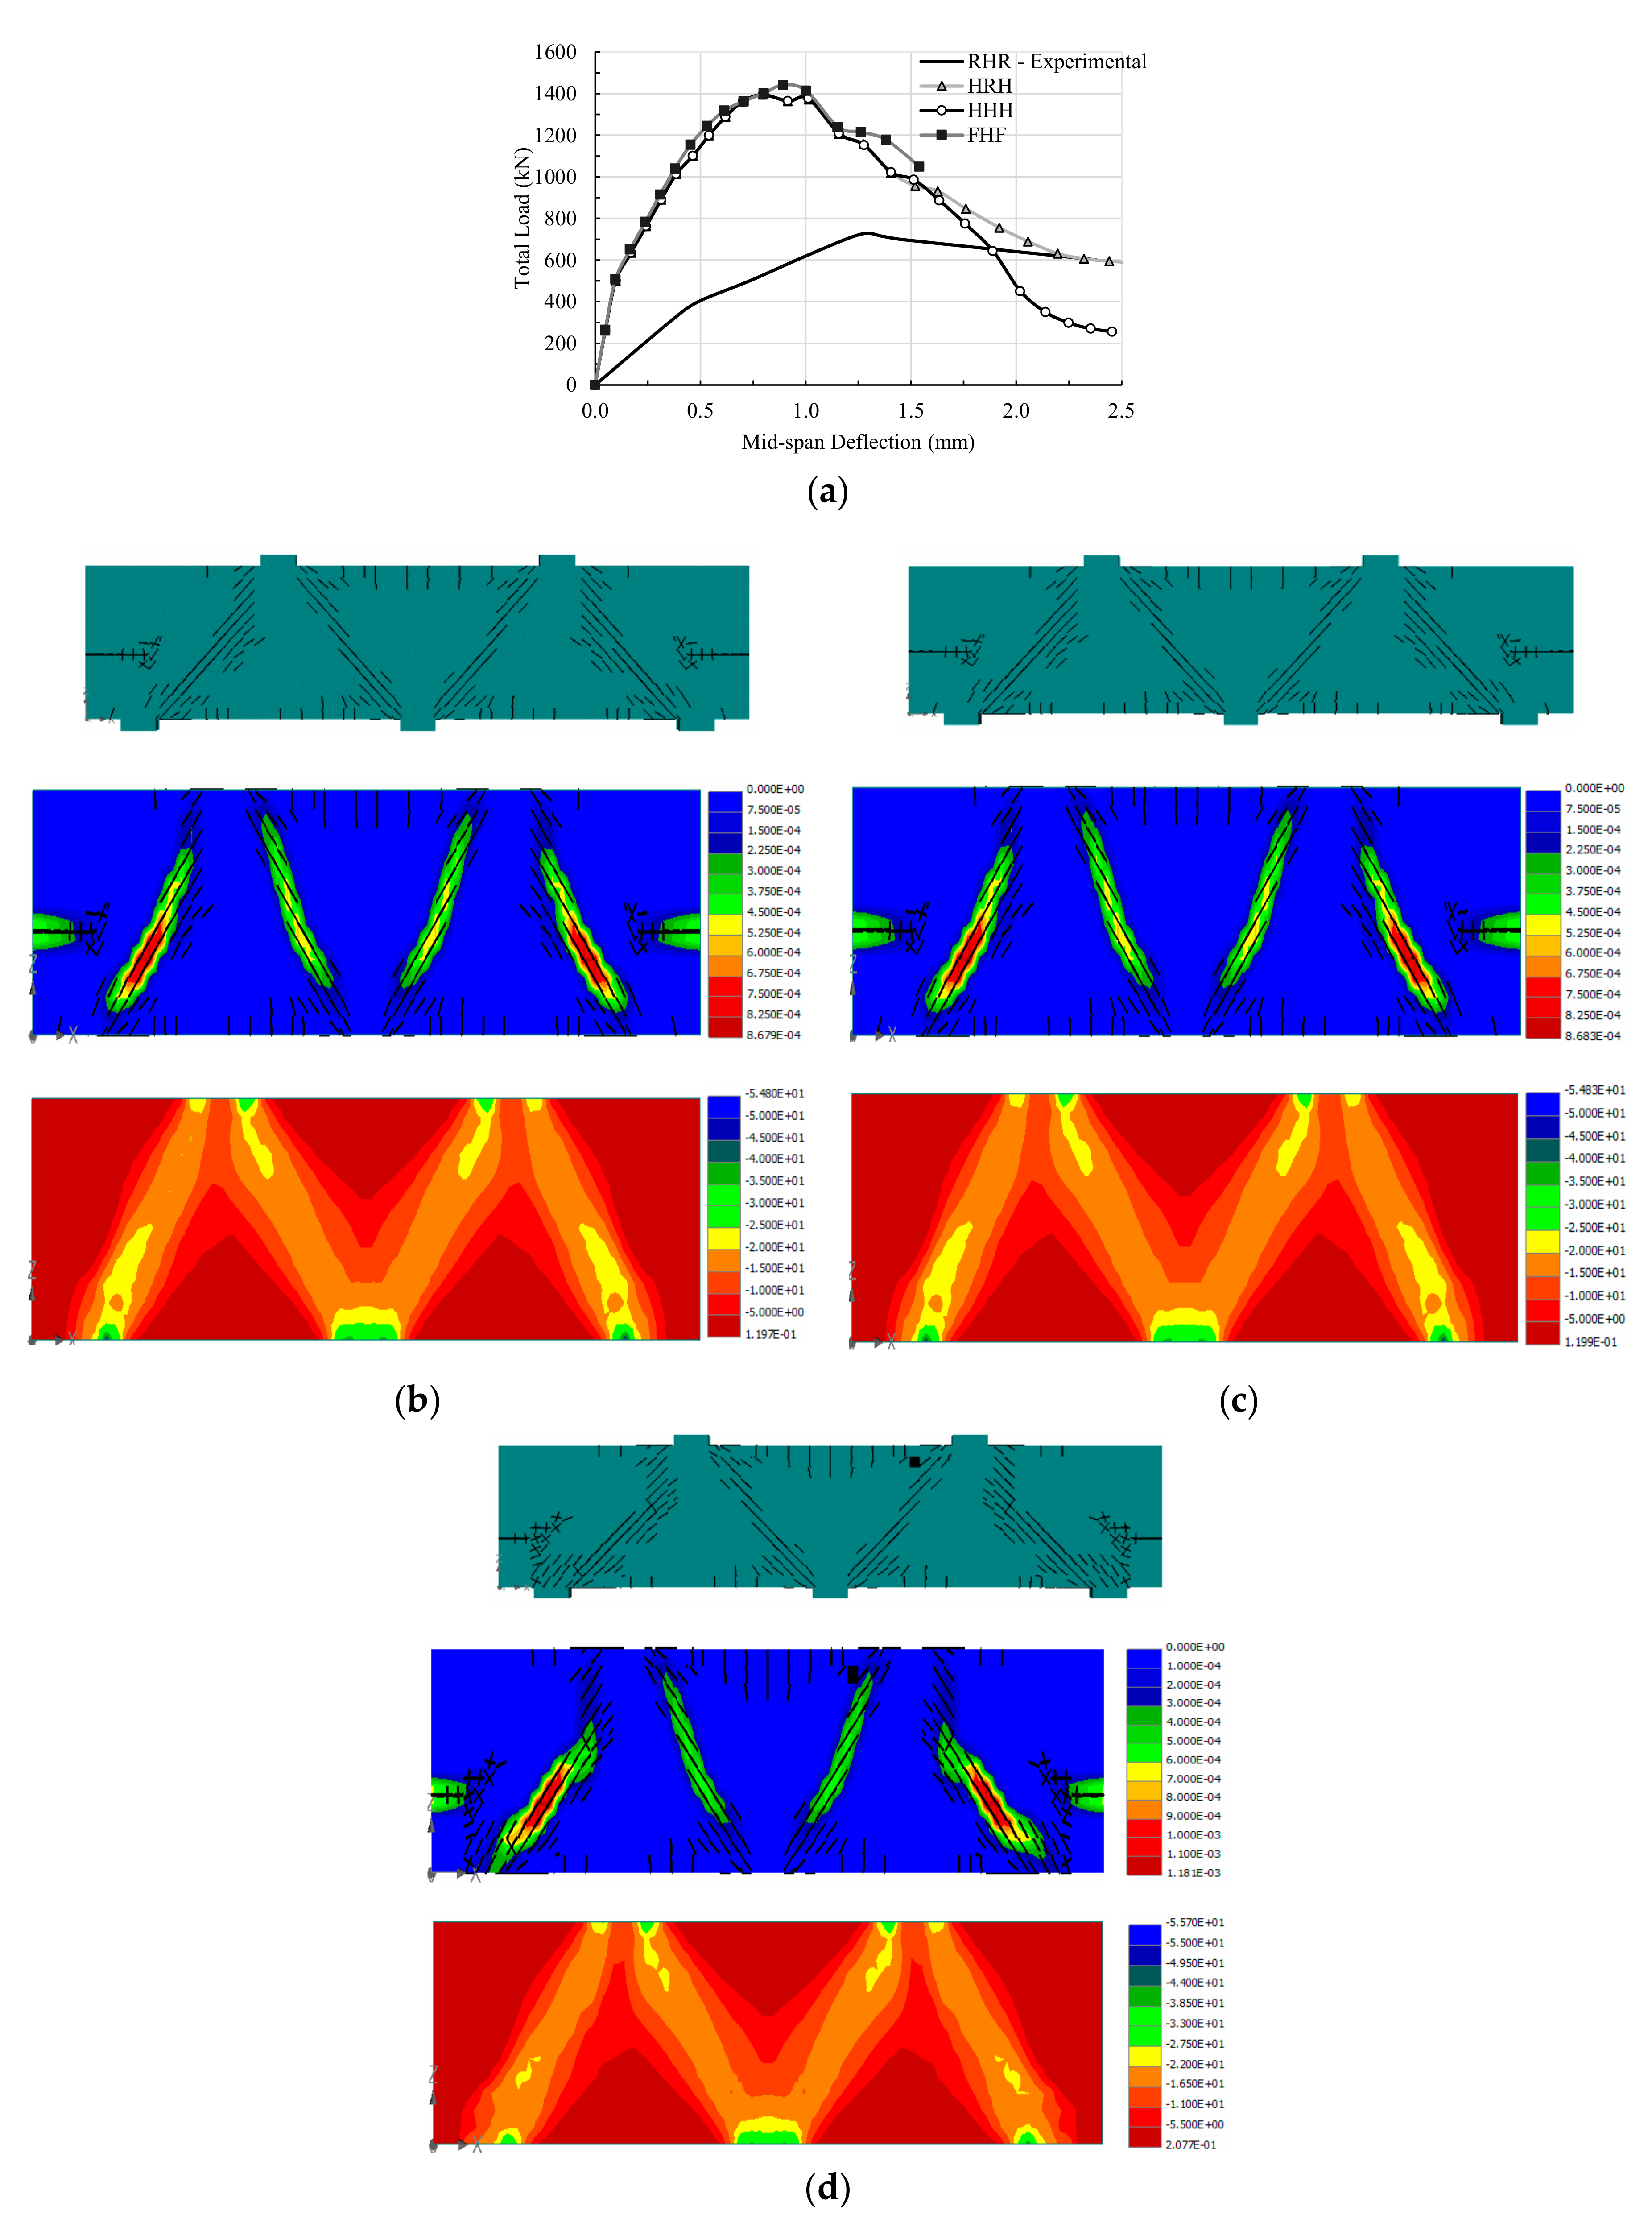
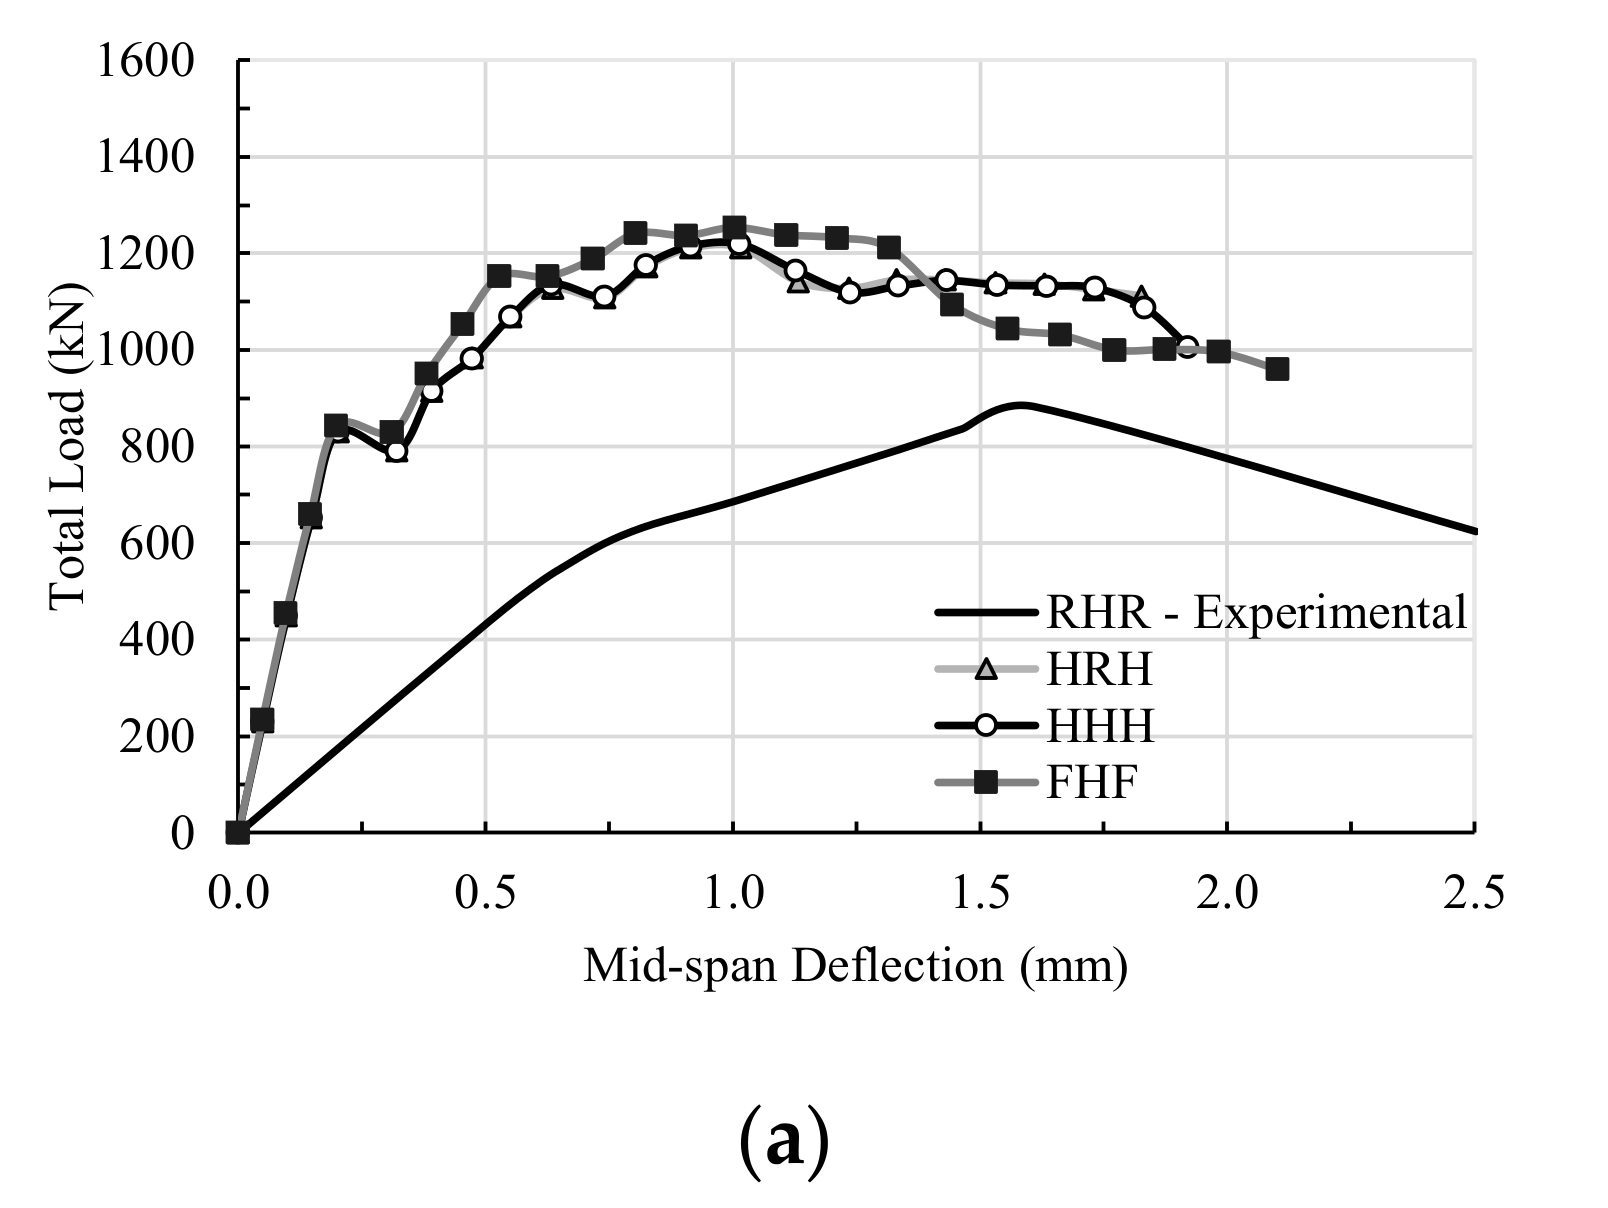
3.1. Sets of Support Conditions Considered in This Study
- Hinged-Roller-Hinged support set—HRH (two exterior hinged supports; interior roller support)
- Hinged-Hinged-Hinged support set—HHH (all three supports are hinged)
- Fixed-Hinged-Fixed support set—FHF (two exterior fixed supports; interior hinged support)
3.2. Changing Specimen L10-40 Support Conditions
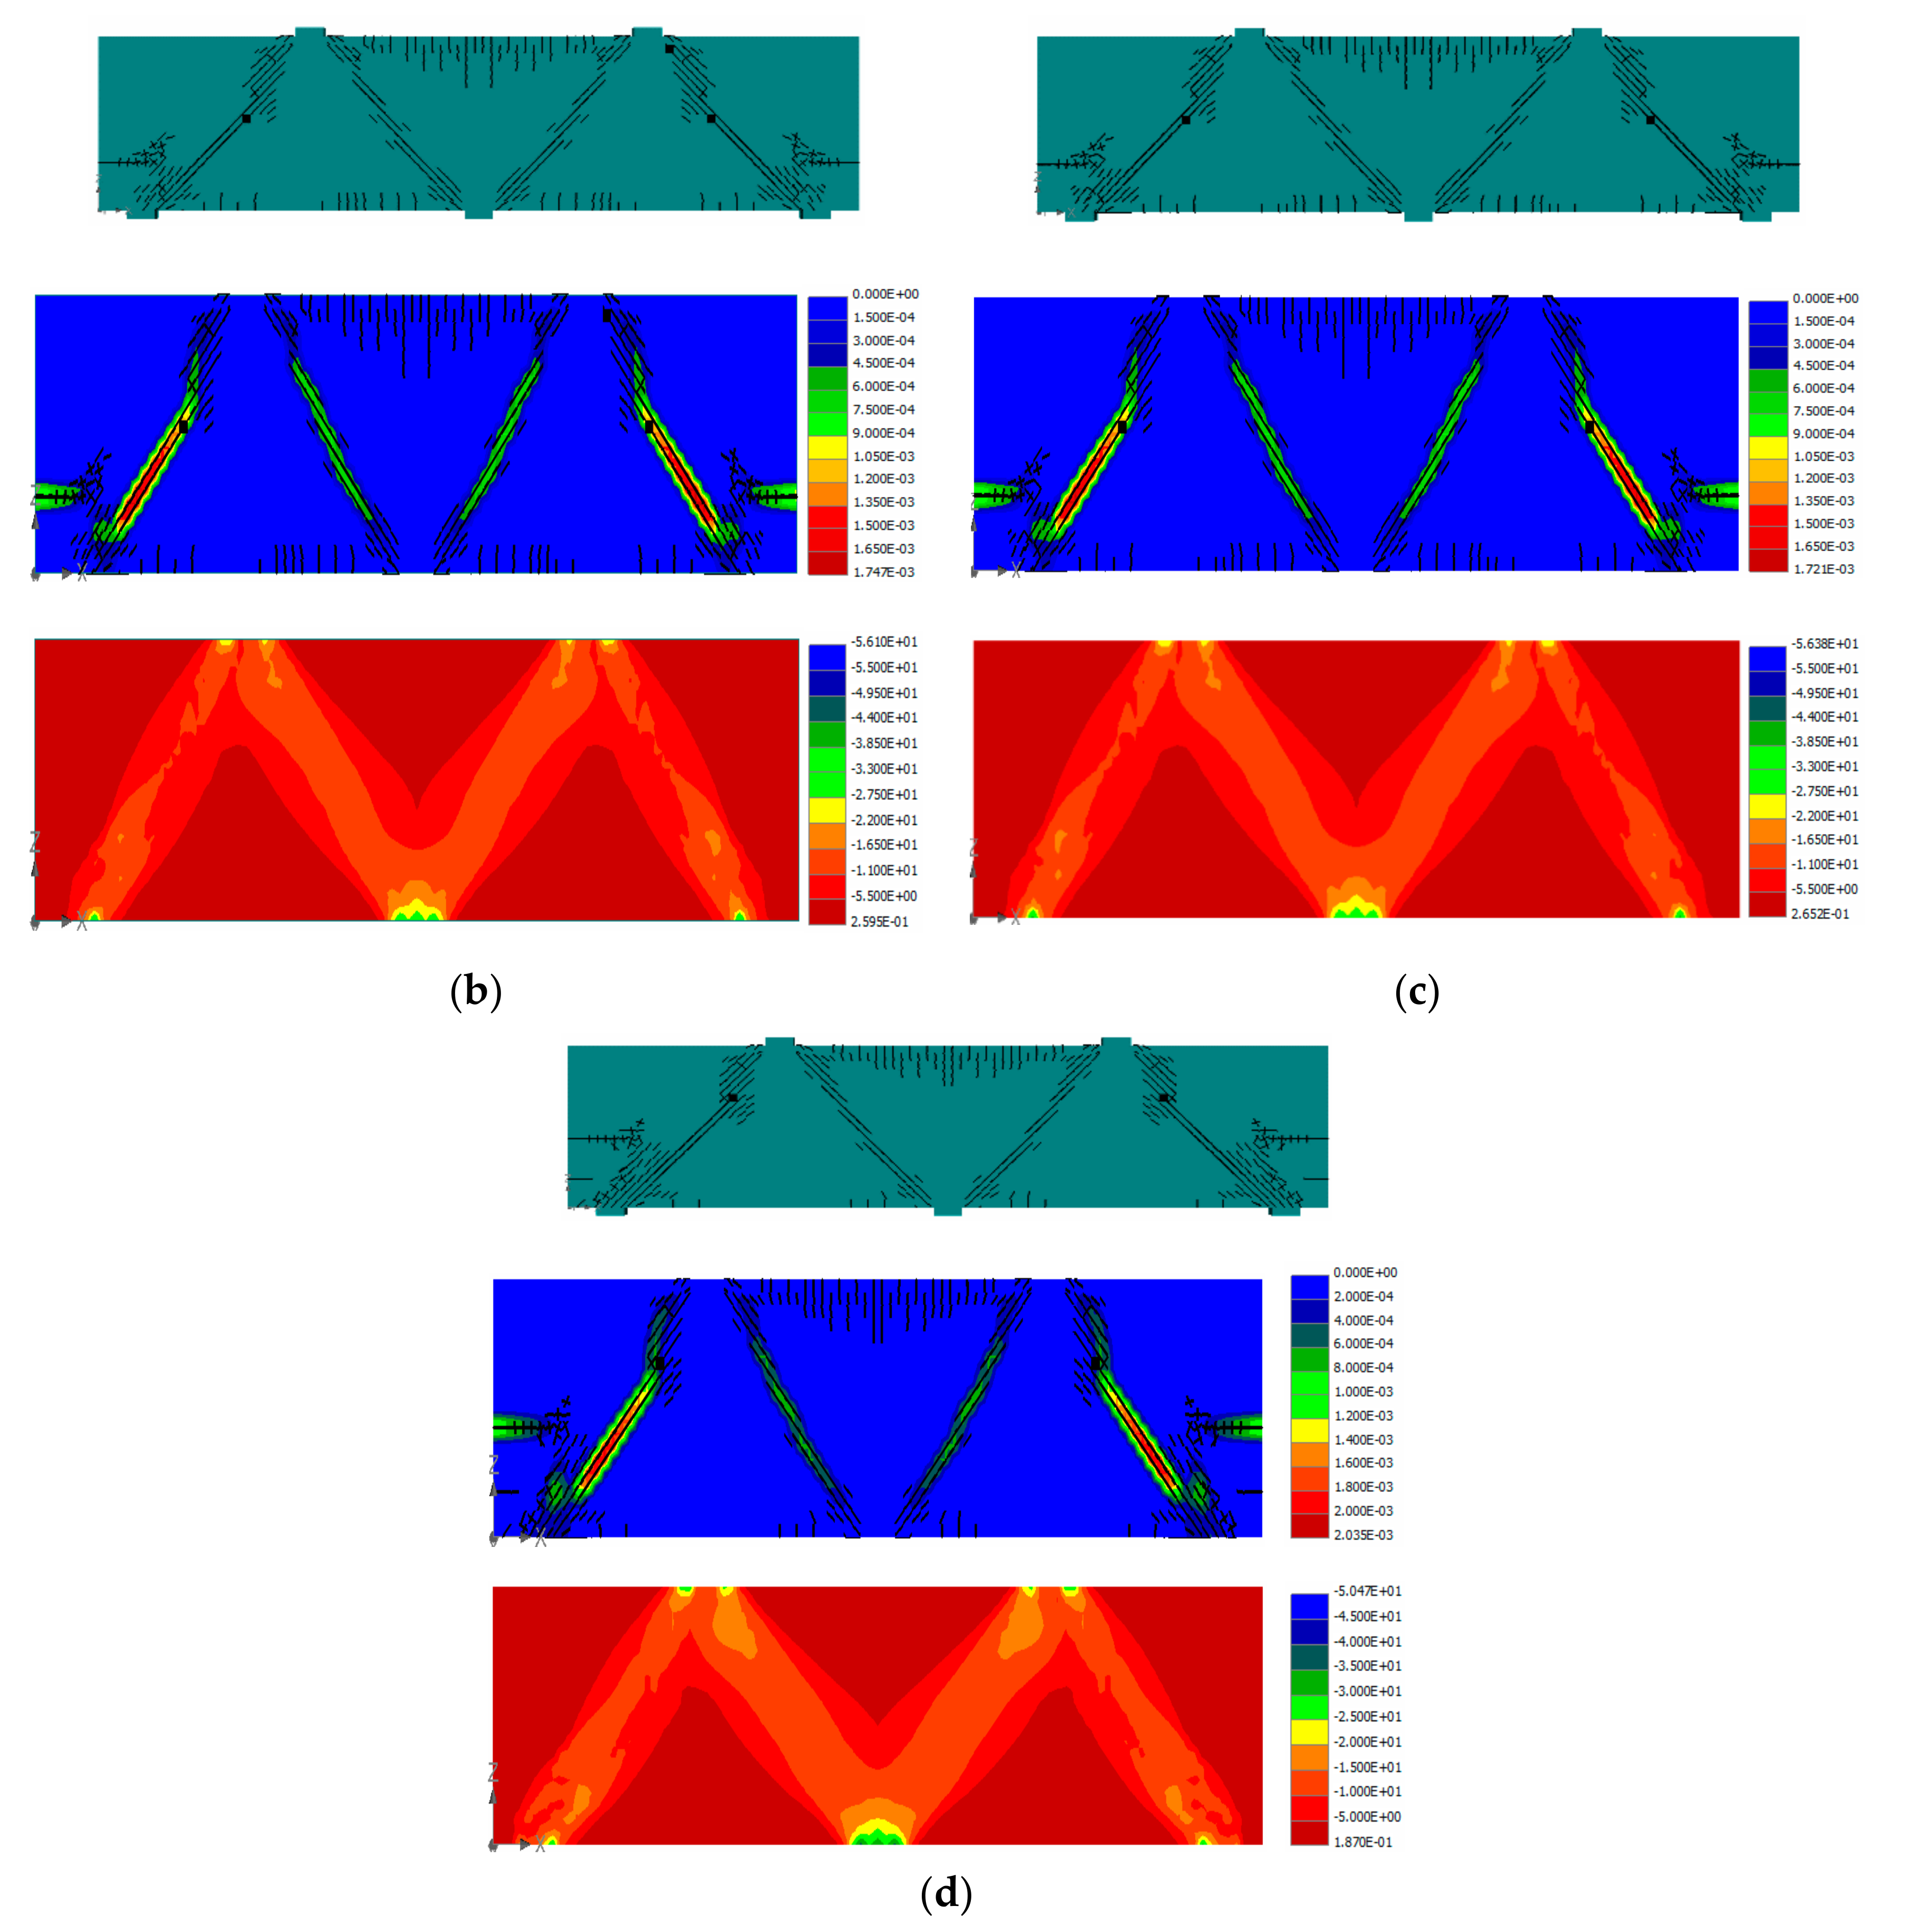
3.3. Changing Specimen L10-60 Support Conditions
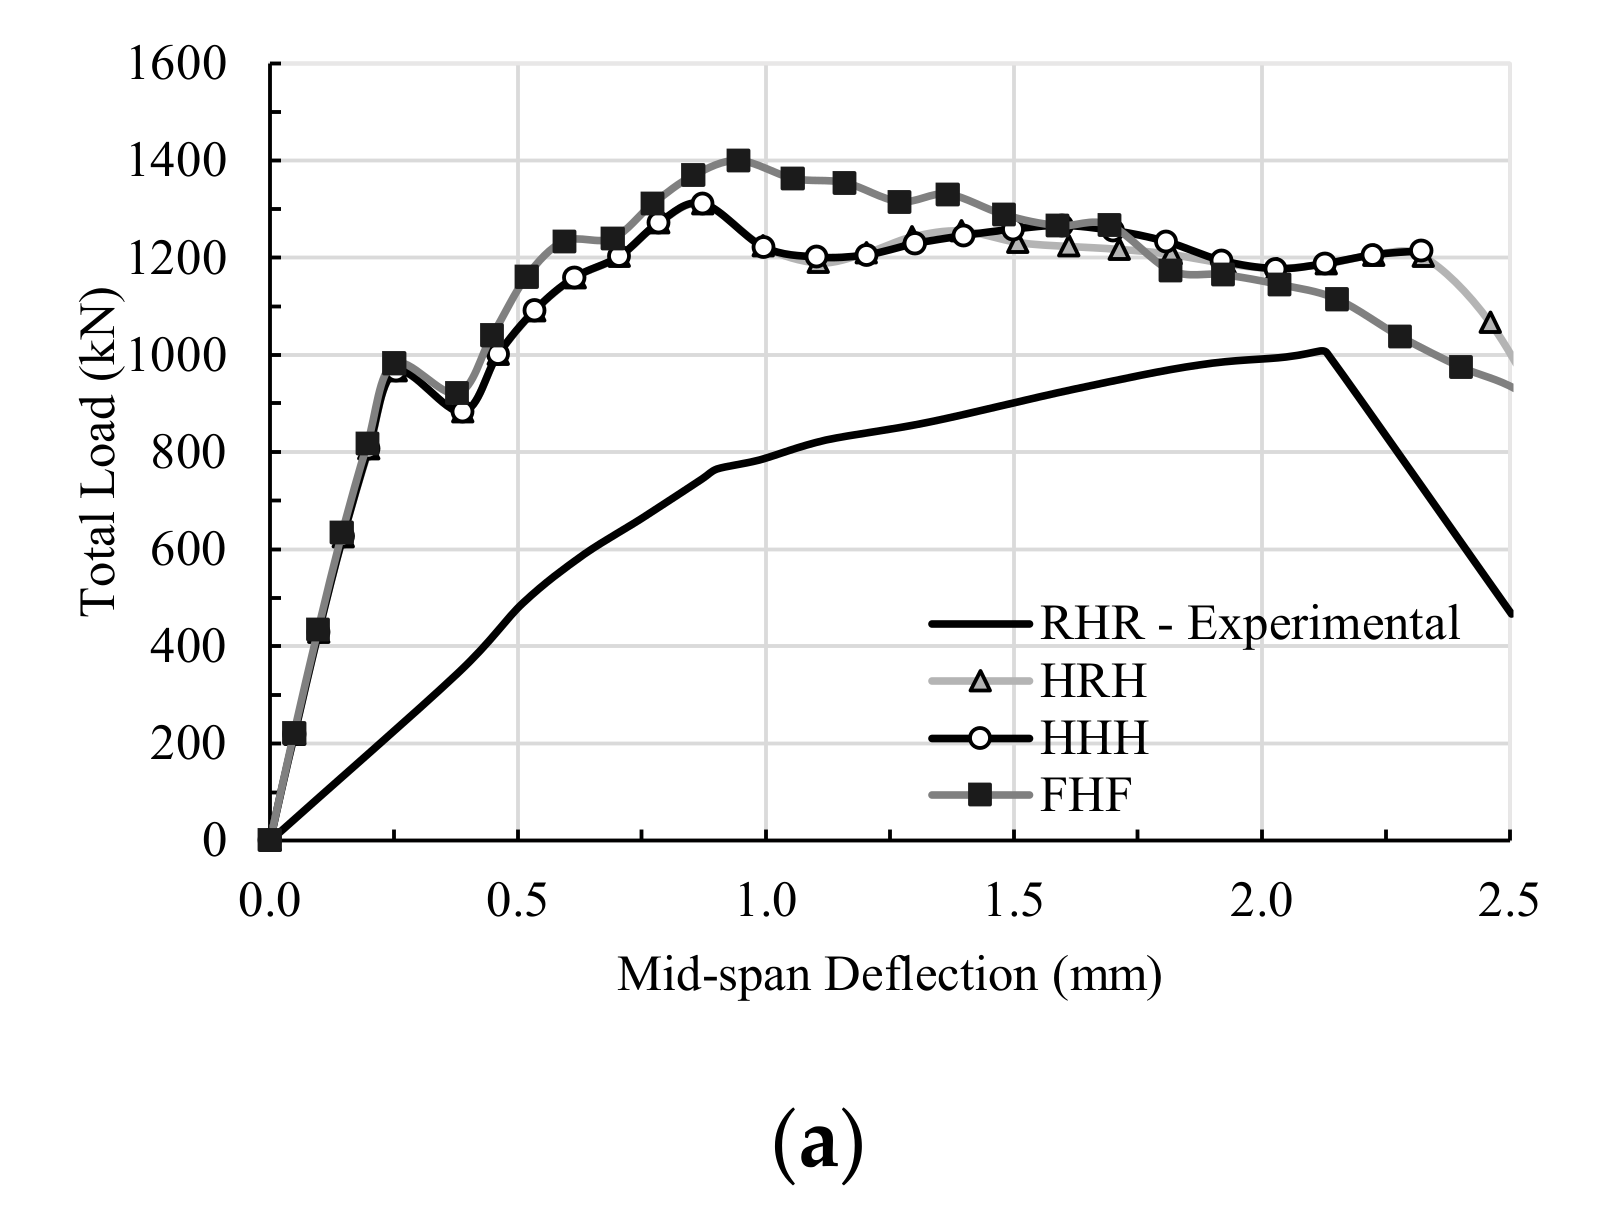
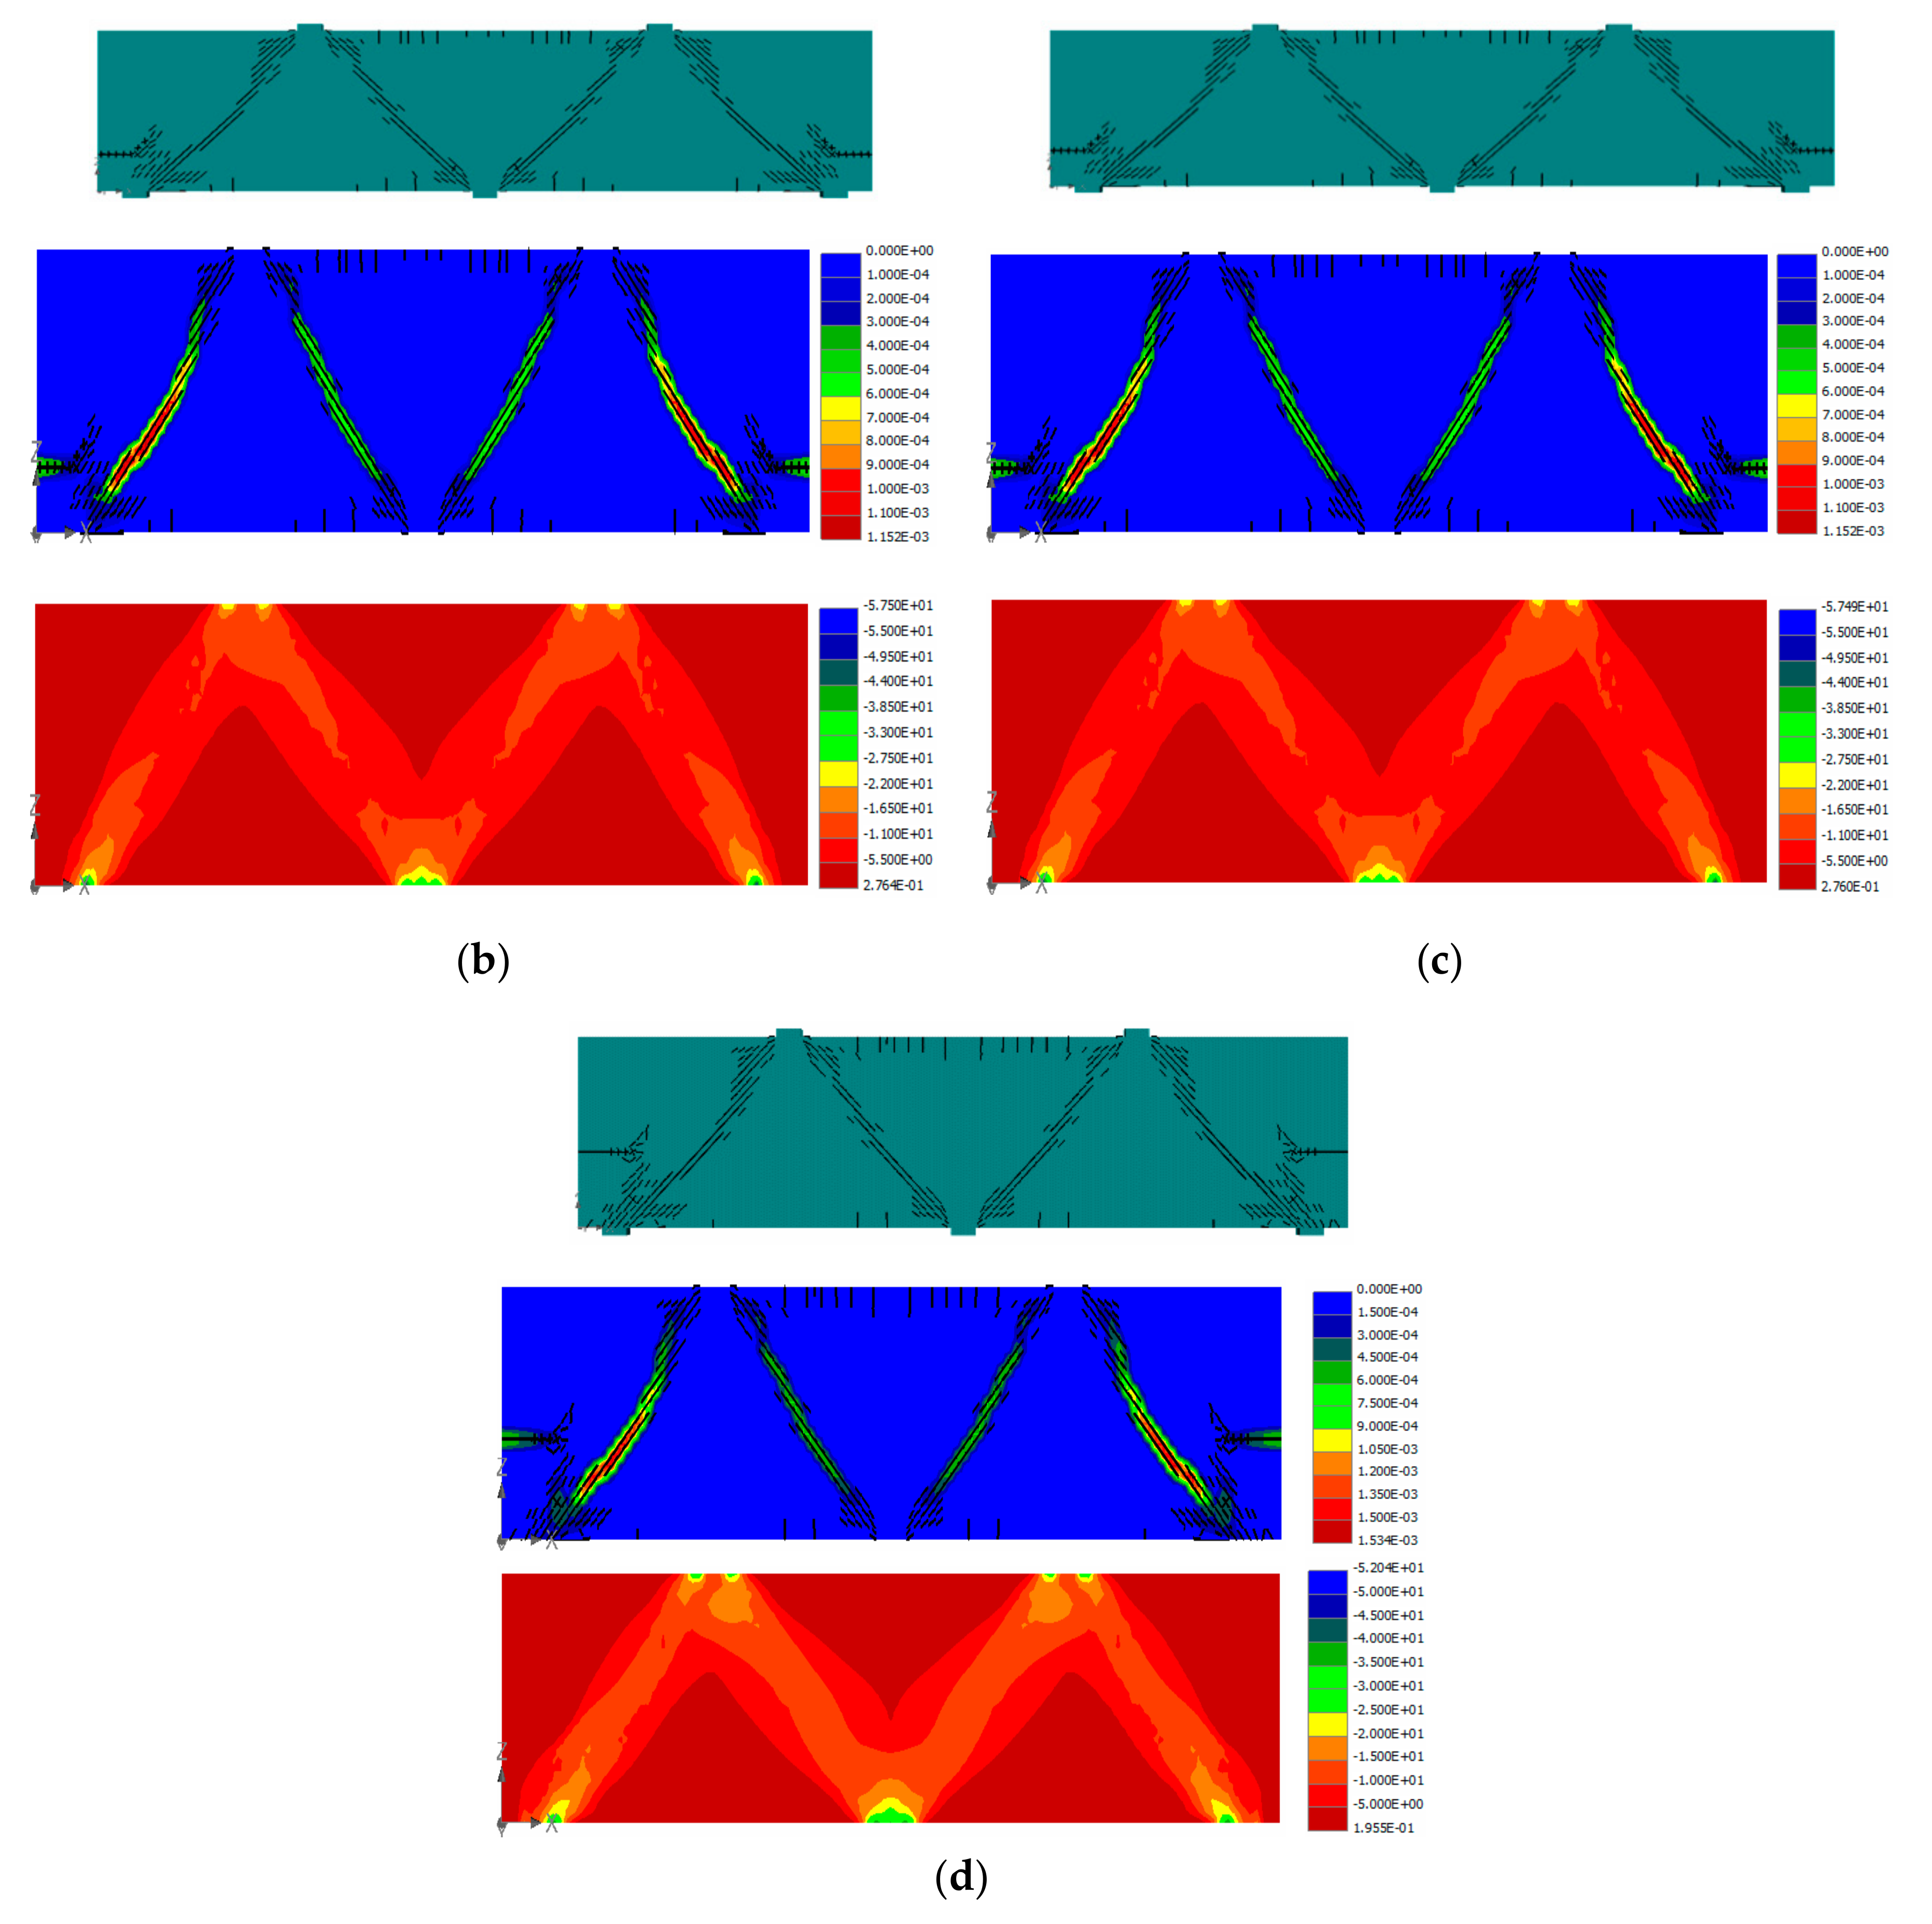
3.4. Changing Specimen L10-72 Support Conditions
4. Conclusions
Author Contributions
Funding
Conflicts of Interest
References
- Mihaylov, B.I.; Hunt, B.; Bentz, E.C.; Collins, M.P. Three-Parameter Kinematic Theory for Shear Behavior of Continuous Deep Beams. ACI Struct. J. 2015, 112, 47–58. [Google Scholar] [CrossRef]
- Liu, J.; Mihaylov, B.I. Macroelement for Complete Shear Behavior of Continuous Deep Girders. ACI Struct. J. Farmington Hills 2018, 115, 1089–1099. [Google Scholar] [CrossRef]
- Liu, J.; Guner, S.; Mihaylov, B.I. Mixed-Type Modeling of Structures with Slender and Deep Beam Elements. ACI Struct. J. 2019, 116, 253–264. [Google Scholar] [CrossRef]
- Mihaylov, B.; Liu, J.; Tvrznikova, K. Two-parameter kinematic approach for complete shear behavior of deep FRC beams. Struct. Concr. 2020, 21, 362–375. [Google Scholar] [CrossRef]
- Rogowsky, D.M.; MacGregor, J.G.; Ong, S.Y. Tests of Reinforced Concrete Deep Beams; Structural Engineering Report, No. 109; Department of Civil Engineering, The University of Alberta: Edmonton, AB, Canada, 1983. [Google Scholar]
- Ashour, A.F. Tests of Reinforced Concrete Continuous Deep Beams. Struct. J. 1997, 94, 3–12. [Google Scholar] [CrossRef]
- Zinkaah, O.H.; Ashour, A.; Sheehan, T. Experimental tests of two-span continuous concrete deep beams reinforced with GFRP bars and strut-and-tie method evaluation. Compos. Struct. 2019, 216, 112–126. [Google Scholar] [CrossRef]
- Zinkaah, O.H.; Ashour, A. Load capacity predictions of continuous concrete deep beams reinforced with GFRP bars. Structures 2019, 19, 449–462. [Google Scholar] [CrossRef]
- Yang, K.-H.; Chung, H.-S.; Ashour, A.F. Influence of section depth on the structural behaviour of reinforced concrete continuous deep beams. Mag. Concr. Res. 2007, 59, 575–586. [Google Scholar] [CrossRef]
- Tuchscherer, R.; Kettelkamp, J. Estimating the Service-Level Cracking Behavior of Deep Beams. ACI Struct. J. 2018, 115, 875–883. [Google Scholar] [CrossRef]
- Rezaei, N.; Klein, G.; Garber, D.B. Effect of Development and Geometry on Behavior of Concrete Deep Beams. ACI Struct. J. 2019, 116, 171–181. [Google Scholar] [CrossRef]
- Chen, H.; Yi, W.-J.; Ma, Z.J.; Hwang, H.-J. Shear Strength of Reinforced Concrete Simple and Continuous Deep Beams. ACI Struct. J. 2019, 116, 31–40. [Google Scholar] [CrossRef]
- Arabzadeh, A.; Hizaji, R. A Simple Approach to Predict the Shear Capacity and Failure Mode of Fix-ended Reinforced Concrete Deep Beams based on Experimental Study. Int. J. Eng. 2019, 32, 474–483. [Google Scholar] [CrossRef]
- Nehdi, M.; Omeman, Z.; El-Chabib, H. Optimal efficiency factor in strut-and-tie model for FRP-reinforced concrete short beams with (1.5 < a/d < 2.5). Mater. Struct. 2008, 41, 1713–1727. [Google Scholar] [CrossRef]
- El Maaddawy, T.; Sherif, S. FRP composites for shear strengthening of reinforced concrete deep beams with openings. Compos. Struct. 2009, 89, 60–69. [Google Scholar] [CrossRef]
- Andermatt, M. Concrete Deep Beams Reinforced with Internal FRP. Master’s Thesis, University of Alberta, Edmonton, AB, Canada, 2010. [Google Scholar]
- Kara, I.F. Prediction of shear strength of FRP-reinforced concrete beams without stirrups based on genetic programming. Adv. Eng. Softw. 2011, 42, 295–304. [Google Scholar] [CrossRef]
- Cho, J.-S.; Kim, M.-S.; Lee, Y.-H.; Kim, H.-C. Experimental Study on Shear Strength of Concrete Deep Beam Reinforced FRP Bars. J. Comput. Struct. Eng. Inst. Korea 2011, 24, 23–31. [Google Scholar]
- El-Sayed, A.K.; El-Salakawy, E.F.; Benmokrane, B. Shear strength of fibre-reinforced polymer reinforced concrete deep beams without web reinforcement. Can. J. Civ. Eng. 2012, 39, 546–555. [Google Scholar] [CrossRef]
- Andermatt, M.F.; Lubell, A.S. Behavior of Concrete Deep Beams Reinforced with Internal Fiber-Reinforced Polymer—Experimental Study. ACI Struct. J. 2013, 110, 585–594. [Google Scholar] [CrossRef]
- Farghaly, A.S.; Benmokrane, B. Shear Behavior of FRP-Reinforced Concrete Deep Beams without Web Reinforcement. J. Compos. Constr. 2013, 17, 04013015. [Google Scholar] [CrossRef]
- Kim, D.-J.; Lee, J.; Lee, Y.H. Effectiveness factor of strut-and-tie model for concrete deep beams reinforced with FRP rebars. Compos. Part B Eng. 2014, 56, 117–125. [Google Scholar] [CrossRef]
- Kim, M.S.; Kim, H.; Park, H.; Ahn, N.; Lee, Y.H. Evaluation of shear behavior of deep beams with shear reinforced with GFRP plate. Sci. Iran. Trans. B Mech. Eng. 2015, 22, 2142. [Google Scholar]
- Thomas, J.; Ramadassa, S. Design for shear strength of concrete beams longitudinally reinforced with GFRP bars. Struct. Eng. Mech. 2015, 53, 41–55. [Google Scholar] [CrossRef]
- Mohamed, K.; Farghaly, A.S.; Benmokrane, B. Strut Efficiency-Based Design for Concrete Deep Beams Reinforced with Fiber-Reinforced Polymer Bars. ACI Struct. J. 2016, 113, 791–800. [Google Scholar] [CrossRef]
- Mohamed, K.; Farghaly, A.S.; Benmokrane, B. Effect of Vertical and Horizontal Web Reinforcement on the Strength and Deformation of Concrete Deep Beams Reinforced with GFRP Bars. J. Struct. Eng. 2017, 143, 04017079. [Google Scholar] [CrossRef]
- Nie, J.-G.; Pan, W.-H.; Tao, M.-X.; Zhu, Y.-Z. Experimental and Numerical Investigations of Composite Frames with Innovative Composite Transfer Beams. J. Struct. Eng. 2017, 143, 04017041. [Google Scholar] [CrossRef]
- Abu-Obaida, A.; El-Ariss, B.; El-Maaddawy, T. Behavior of Short-Span Concrete Members Internally Reinforced with Glass Fiber–Reinforced Polymer Bars. J. Compos. Constr. 2018, 22, 04018038. [Google Scholar] [CrossRef]
- Albidah, A.; Abadel, A.; Abbas, H.; Almusallam, T.; Al-Salloum, Y. Experimental and analytical study of strengthening schemes for shear deficient RC deep beams. Constr. Build. Mater. 2019, 216, 673–686. [Google Scholar] [CrossRef]
- Gergely, V.; Pop, M.; Campian, C.; Chira, N. Finite element modelling of different strengthening strategies for reinforced concrete deep beams. IOP Conf. Ser. Mater. Sci. Eng. 2019, 586, 012023. [Google Scholar] [CrossRef]
- ATENA; Version 5.6; Červenka Consulting s.r.o.: Prague, Czech Republic, 2020.
- El-Maaddawy, T.A.; Sherif, E.-S.I. Response of Concrete Corbels Reinforced with Internal Steel Rebars and External Composite Sheets: Experimental Testing and Finite Element Modeling. J. Compos. Constr. 2014, 18, 04013020. [Google Scholar] [CrossRef]
- Awani, O.; El-Maaddawy, T.; El Refai, A. Numerical Simulation and Experimental Testing of Concrete Beams Strengthened in Shear with Fabric-Reinforced Cementitious Matrix. J. Compos. Constr. 2016, 20, 04016056. [Google Scholar] [CrossRef]
- Alkhalil, J.; El-Maaddawy, T. Finite element modelling and testing of two-span concrete slab strips strengthened by externally-bonded composites and mechanical anchors. Eng. Struct. 2017, 147, 45–61. [Google Scholar] [CrossRef]
- Nilson, A.H.; Darwin, D.; Dolan, C.W. Design of Concrete Structures, 14th ed.; McGraw Hill: New York, NY, USA, 2010; ISBN 0073293490/9780073293493. [Google Scholar]
- Ibrahim, A.M.; Mahmood, M.S. Finite element modeling of reinforced concrete beams strengthened with FRP laminates. Eur. J. Sci. Res. 2009, 30, 526–541. [Google Scholar]
- Obaidat, Y.T.; Heyden, S.; Dahlblom, O. The effect of CFRP and CFRP/concrete interface models when modelling retrofitted RC beams with FEM. Compos. Struct. 2010, 92, 1391–1398. [Google Scholar] [CrossRef]


| Specimen | fc′: MPa | a/h | h | a | d | bw | L | Ast = A′st | |
|---|---|---|---|---|---|---|---|---|---|
| L10-40 | 32.1 | 1.0 | 400 | 400 | 355 | 160 | 800 | 574 | 0.01 |
| L10-60 | 32.1 | 1.0 | 600 | 600 | 555 | 160 | 1200 | 861 | 0.01 |
| L10-72 | 32.1 | 1.0 | 720 | 720 | 653 | 160 | 1440 | 1148 | 0.01 |
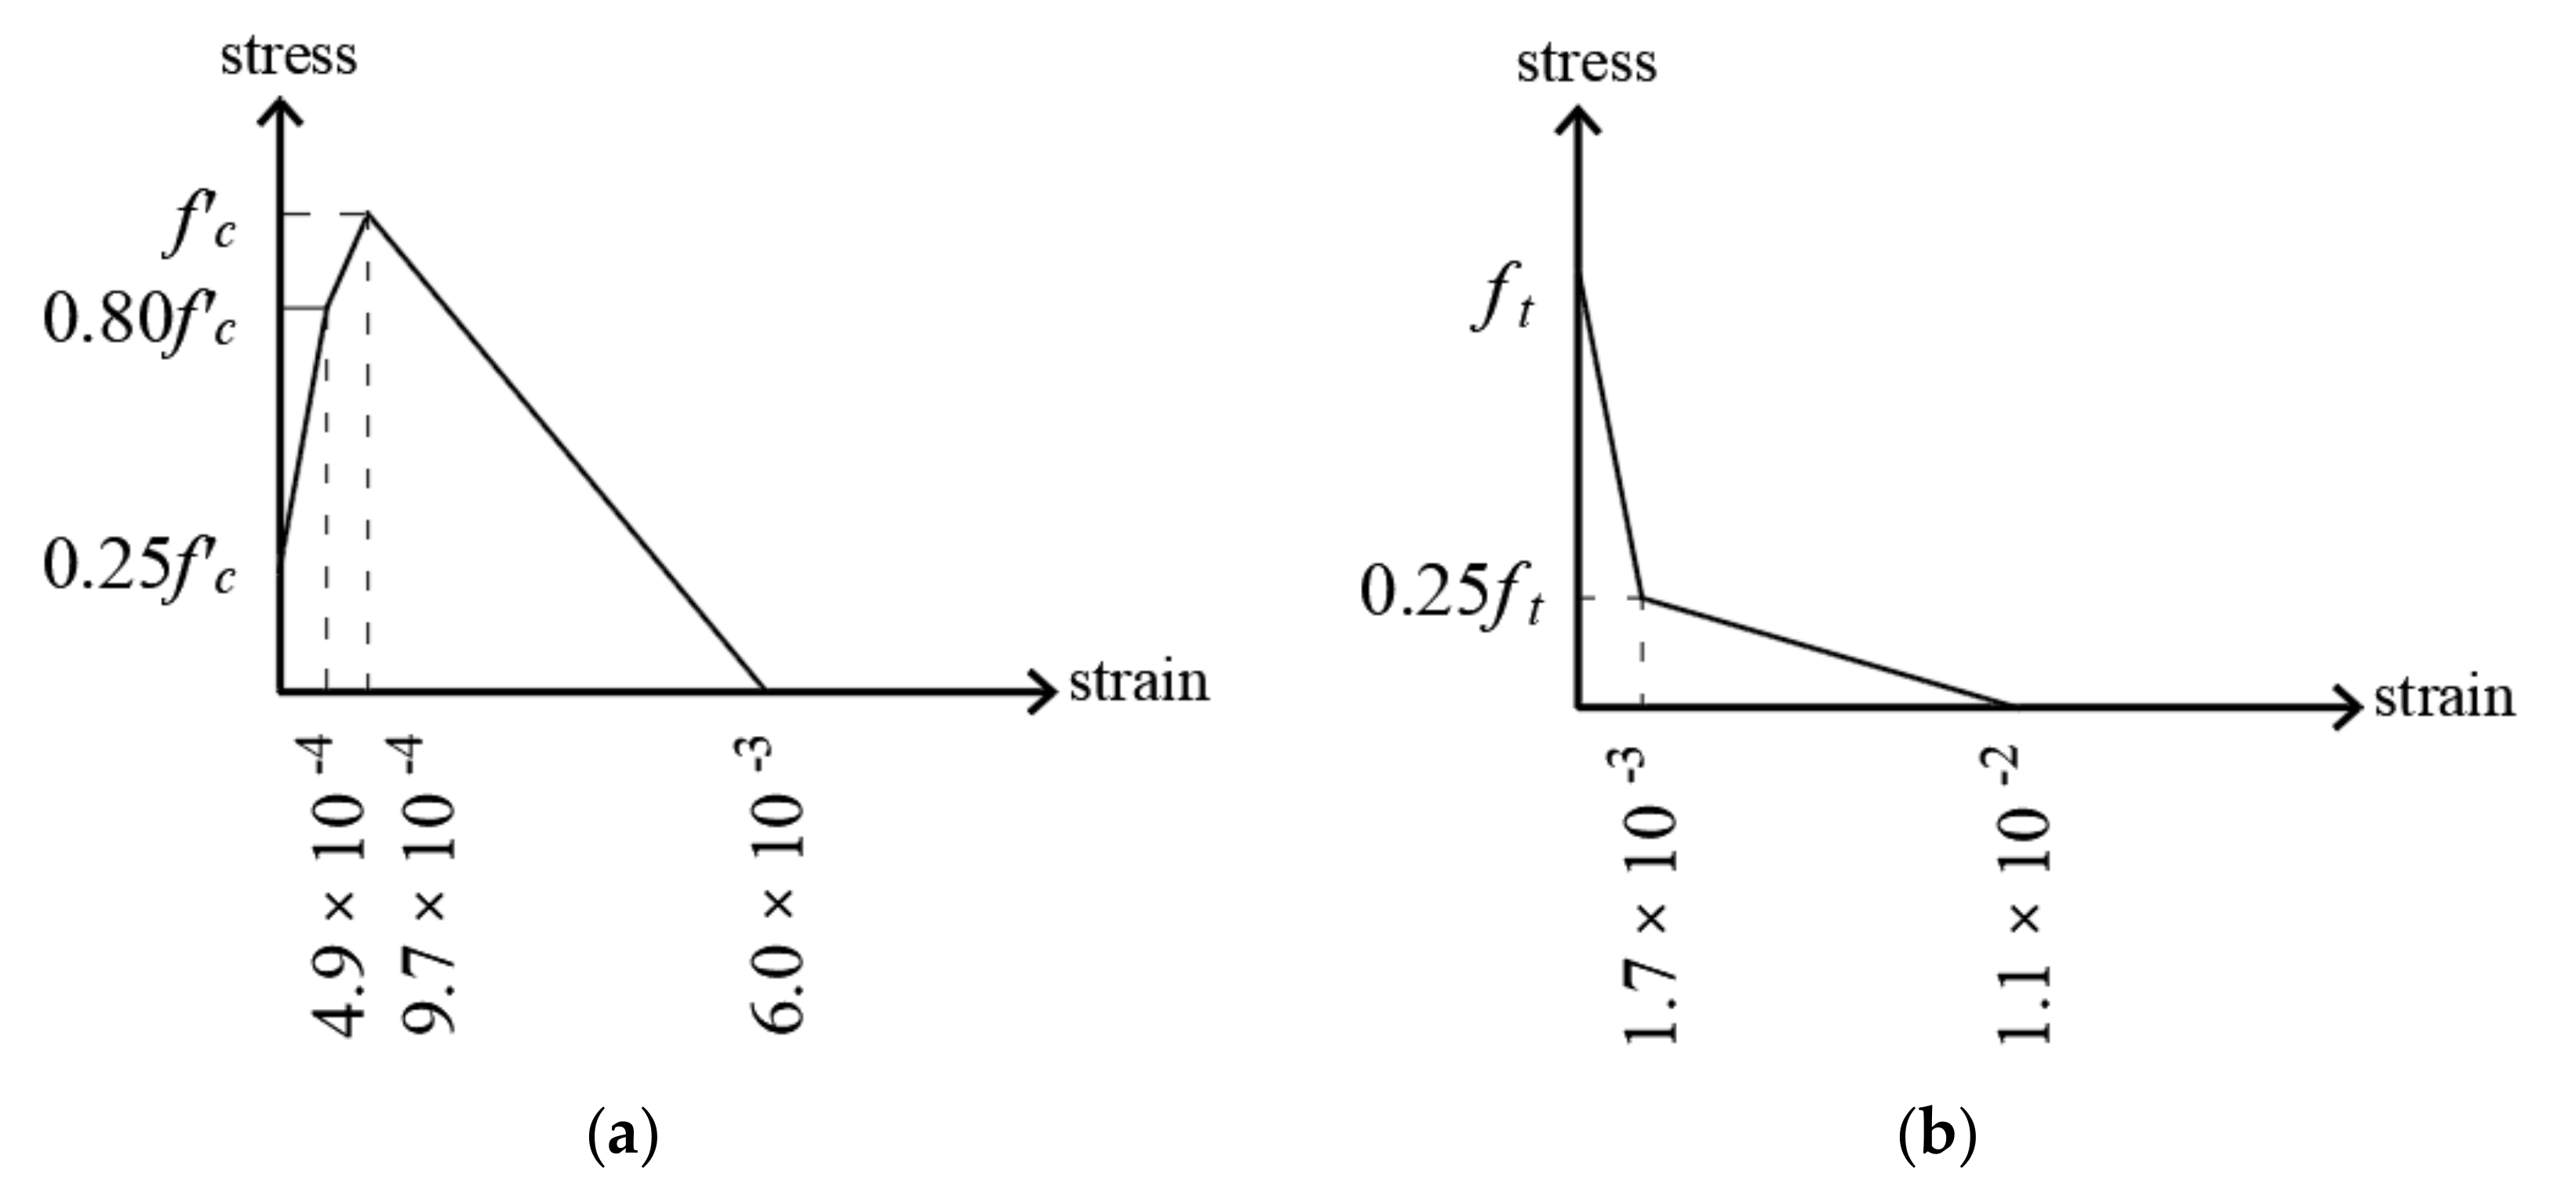
| Parameter | Description | Value |
|---|---|---|
| fcu | Cube compressive strength | 37.8 MPa |
| f′c | Cylinder compressive strength | 32.1 MPa |
| ft | Tensile strength | 1.4 MPa |
| Ec | Elastic modulus | 3.3 × 10⁴ MPa |
| μ | Poisson’s ratio | 0.2 |
| εloc, f | Localized fracturing strain | ≈0 |
| Lch, t | Tensile characteristic length | 0.03 m |
| εloc, p | Localized plastic strain | 9.7 × 10⁻⁴ |
| Lch, c | Compressive characteristic length | 0.1 m |
| Specimen | Support Type * | Numerical Results | Experimental Results | Ratios | |||
|---|---|---|---|---|---|---|---|
| Total Load | Mid-Span Deflection ‴ | Total Load | Mid-Span Deflection ‴ | ||||
| PFE | ΔFE | PExp | ΔExp | PFE/PExp | ΔFE/ΔExp | ||
| (kN) | (mm) | (kN) | (mm) | ||||
| L10-40 | RHR | 781 | 1.4 | 724 | 1.3 | 1.08 | 1.08 |
| HRH | 1394 | 0.8 | 1.93 | 0.62 | |||
| HHH | 1394 | 0.8 | 1.93 | 0.62 | |||
| FHF | 1441 | 0.9 | 1.99 | 0.69 | |||
| L10-60 | RHR | 871 | 1.3 | 883 | 1.6 | 0.99 | 0.81 |
| HRH | 1212 | 1.0 | 1.37 | 0.63 | |||
| HHH | 1219 | 1.0 | 1.38 | 0.63 | |||
| FHF | 1254 | 1.0 | 1.42 | 0.63 | |||
| L10-72 | RHR | 994 | 1.8 | 1008 | 2.1 | 0.99 | 0.86 |
| HRH | 1311 | 0.9 | 1.30 | 0.43 | |||
| HHH | 1311 | 0.9 | 1.30 | 0.43 | |||
| FHF | 1400 | 1.0 | 1.39 | 0.48 | |||
Publisher’s Note: MDPI stays neutral with regard to jurisdictional claims in published maps and institutional affiliations. |
© 2020 by the authors. Licensee MDPI, Basel, Switzerland. This article is an open access article distributed under the terms and conditions of the Creative Commons Attribution (CC BY) license (http://creativecommons.org/licenses/by/4.0/).
Share and Cite
Mansour, M.; El-Ariss, B.; El-Maaddawy, T. Effect of Support Conditions on Performance of Continuous Reinforced Concrete Deep Beams. Buildings 2020, 10, 212. https://doi.org/10.3390/buildings10110212
Mansour M, El-Ariss B, El-Maaddawy T. Effect of Support Conditions on Performance of Continuous Reinforced Concrete Deep Beams. Buildings. 2020; 10(11):212. https://doi.org/10.3390/buildings10110212
Chicago/Turabian StyleMansour, Moustafa, Bilal El-Ariss, and Tamer El-Maaddawy. 2020. "Effect of Support Conditions on Performance of Continuous Reinforced Concrete Deep Beams" Buildings 10, no. 11: 212. https://doi.org/10.3390/buildings10110212
APA StyleMansour, M., El-Ariss, B., & El-Maaddawy, T. (2020). Effect of Support Conditions on Performance of Continuous Reinforced Concrete Deep Beams. Buildings, 10(11), 212. https://doi.org/10.3390/buildings10110212