Article

Upgrading the Smartness of Retrofitting Packages towards Energy-Efficient Residential Buildings in Cold Climate Countries: Two Case Studies

by
Laurina C. Felius
1,
Mohamed Hamdy
1,*,
Fredrik Dessen
2 and
Bozena Dorota Hrynyszyn
1
1
Department of Civil and Environmental Engineering, Faculty of Engineering, NTNU—Norwegian University of Science and Technology, 7491 Trondheim, Norway
2
Department of Engineering Cybernetics, Faculty of Information Technology and Electrical Engineering, NTNU—Norwegian University of Science and Technology, 7491 Trondheim, Norway
*
Author to whom correspondence should be addressed.
Buildings 2020, 10(11), 200; https://doi.org/10.3390/buildings10110200
Submission received: 13 September 2020 / Revised: 28 October 2020 / Accepted: 30 October 2020 / Published: 3 November 2020
(This article belongs to the Section Building Energy, Physics, Environment, and Systems)

Abstract

:
Improving the energy efficiency of existing buildings by implementing building automation control strategies (BACS) besides building envelope and energy system retrofitting has been recommended by the Energy Performance of Buildings Directive (EPBD) 2018. This paper investigated this recommendation by conducting a simulation-based optimization to explore cost-effective retrofitting combinations of building envelope, energy systems and BACS measures in-line with automation standard EN 15232. Two cases (i.e., a typical single-family house and apartment block) were modeled and simulated using IDA Indoor Climate and Energy (IDA-ICE). The built-in optimization tool, GenOpt, was used to minimize energy consumption as the single objective function. The associated difference in life cycle cost, compared to the reference design, was calculated for each optimization iteration. Thermal comfort of the optimized solutions was assessed to verify the thermal comfort acceptability. Installing an air source heat pump had a greater energy-saving potential than reducing heat losses through the building envelope. Implementing BACS achieved cost-effective energy savings up to 24%. Energy savings up to 57% were estimated when BACS was combined with the other retrofitting measures. Particularly for compact buildings, where the potential of reducing heat losses through the envelope is limited, the impact of BACS increased. BACS also improved the thermal comfort.

1. Introduction

One of the key strategies towards an energy-efficient building stock is retrofitting, especially of residential buildings, which have a considerable energy-saving potential. Effective retrofitting measures and achieved savings are climate-specific, and this paper concentrates on retrofitting the residential building stock in cold climate countries, i.e., Norway. Most of the literature on cold climate retrofitting of dwellings focuses on improving the energy efficiency through retrofitting the building envelope and energy systems, as pointed out by Felius et al. [1].

1.1. Building Automation Control Systems

Another category of retrofitting measures that has potential to decrease the energy consumption, though less often mentioned, is building automation control systems (BACS). BACS can lead to a reduction of the operational energy by optimizing the energy use for heating, lighting, ventilation, domestic hot water and blind systems, while, at the same time, maintaining a comfortable indoor climate. The Energy Performance of Buildings Directive (EPBD) amendment of 2018 [2] increased the focus on implementing smart technologies to improve the energy performance and the thermal and visual comfort of buildings. BACS are well-developed for commercial buildings but rarely used to their full potential in residential buildings. BACS can be attractive retrofitting measures, especially when the other energy performance requirements, such as the exterior wall U-value, cannot be improved due to, for example, space restrictions or financial constraints.
Several studies assessed the potential energy savings from BACS for residential buildings in Italy [3,4,5] and Spain [6] and concluded that implementing BACS improved the energy performance of a detached dwelling by one energy class. However, only a few studies have assessed the impact of BACS on the energy consumption using detailed building performance simulation models. Reda et al. [7] investigated the effect of ICT-driven intelligent solutions for heating and ventilation control in an apartment building through energy simulations in IDA-ICE. They concluded that the energy demand was significantly reduced in buildings with mechanical ventilation, especially in a cold climate. When implementing heating, ventilation and air conditioning (HVAC) control that switched off when windows opened, the energy demand was not affected significantly. Felius et al. [8] assessed the impact of retrofitting the building envelope combined with BACS on the energy consumption of a detached house using energy simulations in IDA-ICE. They found that BACS significantly decreased the energy consumption, though it was less effective than building envelope retrofitting. Combining building envelope retrofitting and BACS upgrades resulted in the highest energy savings.
There is still limited literature available on the impact of BACS on the energy consumption of retrofitting (and new-built) residential projects in cold climates. Therefore, this paper focuses on the energy-saving potential of BACS in combination with other retrofitting measures.

1.2. Simulation-Based Optimization

Simulation tools are highly useful in evaluating the impact of retrofitting measures on the energy performance. This can be a difficult and time-consuming task and is often not performed for smaller projects. Therefore, this paper presents optimal retrofitting packages for typical housing typologies, as opposed to an individual case approach, so that many buildings can benefit from the results, to a certain extent. Finding optimal solutions is typically done by adjusting design variables that affect the energy consumption until the objective function(s) is (are) minimized. This can be done through parametric runs, though it is extremely time-consuming to model every possibility, especially when advanced control strategies are implemented. To improve the time efficiency, automatic simulation-based optimization can be used to find the optimal combinations for a set of given parameters as opposed to running all possible combinations.
In this paper, the simulation tool IDA-ICE (version 4.8) with the built-in optimization tool GenOpt is used to perform a single-objective optimization. This combination, where GenOpt was externally linked to IDA-ICE, was successfully verified by Hasan et al. [9] by comparing the optimization results to a brute-force search method.
Many other combinations of simulation and optimization tools can be used, as the selection of the tools should be adapted to the research objective. Hirvonen et al. [10] used multi-objective optimization with IDA-ICE and the Pareto-Archive NSGA-II genetic algorithm in MOBO software to minimize the life cycle cost and CO2 emissions for energy retrofitting of four typical Finnish apartment buildings. The same methodology was used by Niemelä et al. [11] to minimize the net present value of the life cycle cost and the primary energy consumption for retrofitting a typical Finnish apartment building. Both studies defined U-values of the building envelope and various heating systems as their design variables. Tokarik and Richman [12] identified cost-effective design solutions for future improvements to a house located in Toronto using EnergyPlus and a NSGA-II algorithm in jEPlus + EA. La Fleur et al. [13] used the optimization tool OPERA-MILP to identify the optimal life cycle cost for energy retrofitting measures for a Swedish multi-family building.
The number of optimization studies for retrofit cases in cold climates is limited, though several studies performed optimizations for the design of residential buildings. Hamdy et al. [14] proposed a multi-objective optimization approach, based on a genetic algorithm, and combined it with IDA-ICE to minimize the life cycle cost (LCC) and primary energy considering a large-scale solution space for the building envelope and HVAC systems of a Finnish single-family house. The same case study building was used in a study by Hamdy and Mauro [15] that used multi-objective optimization to minimize the CO2 emissions and the discounted payback time.

1.3. Research Objectives

The objective of our current study was to define optimal packages for building envelope retrofitting in combination with building automation control strategies for two typical Norwegian dwellings. The primary focus was to analyze the improvement of energy consumption. In addition, the cost-effectiveness and thermal comfort acceptability were assessed. After validating the building models and control strategies, optimal solutions were found through single-objective optimization of the energy consumption in IDA-ICE with GenOpt. Profitability and feasibility were investigated by assessing the difference in life cycle cost and thermal comfort. These results are presented for each building typology, i.e., a single-family house and an apartment block.

2. Materials and Methods

Figure 1 shows the steps of our methodology for finding optimal retrofitting packages with minimum energy consumption and acceptable levels of thermal comfort and cost-effectiveness. In the first step, the case study is defined, modeled, and validated. In the second step, strategies for control of the heating, ventilation, lighting and blind systems are defined and validated. In the third step, the solution space and objective function are set. In the fourth step, the optimization algorithm is executed for minimizing the predefined objective function. In the fifth step, the associated functions such as thermal comfort level and difference in LCC are evaluated for assessing the feasibility of the optimized solutions.

2.1. Reference Buildings

The Norwegian residential building stock is divided into three groups: single-family houses (57%), apartment blocks (22%) and other small houses (21%) [16]. This last group consists of many different typologies and was not considered in the research. Two typical cases of a single-family house and an apartment block were selected to be studied, illustrated in Figure 2. The majority of these dwellings were built in the 1960s to 1990s, with a peak in the 1970s [17]. Two reference models were used for each case study: one representing the buildings before retrofitting (reference “original”) and one representing the buildings fulfilling minimum energy requirements to evaluate the impact of BACS strategies (reference “TEK 17”). The relevant energy performance characteristics are presented in Table 1. The assumed building envelope characteristics used for the reference models before retrofitting were based on typical values. When no typical values were given, the values from the building code of 1969 or recommended input values from NS 3031 [18] were used.
The reference cases were heated with direct electric heaters, placed in each room, and had mechanical exhaust ventilation in the kitchen and bathrooms. No cooling systems were considered, as Norwegian houses typically have no cooling systems installed. The electrical loads for each room function were as described in Table A1 [19].

2.1.1. Case Study 1

The single-family house has an area of 173 m2, divided over two floors, of which the lower floor is a partial basement. An east-west orientation was assumed, though the orientation can vary. The main living room, kitchen, bathroom and three bedrooms are located on the upper floor (see Figure 3). The lower floor has an extra living room, bathroom, bedroom, laundry room and storage rooms. The external walls and roof are timber frame constructions with 10 and 15 cm of mineral wool, respectively. The external walls of the lower floor, further referred to as basement walls, are constructed of expanded clay pellet blocks without insulation. The floor is a concrete slab on grade (not insulated).

2.1.2. Case Study 2

The apartment block has four floors with a modular floorplan. The blocks can have a varying number of units and orientations. It was assumed that the building had 12 apartments per floor with west-oriented balconies. There are two types of apartments: corner apartments with one bedroom (54 m2) and center apartments with two or three bedrooms (72–85 m2) (see Figure 4). The external walls on the long side are timber frame walls, and the external walls on the short side are load-bearing concrete walls, both insulated with 10-cm mineral wool. The floor is a concrete slab on grade (not insulated). The roof is a concrete construction with 10-cm expanded polystyrene (EPS). Only two representative apartments on the top floor were modeled, surrounded by a building body representing the rest of the building: one corner apartment (54 m2) and one center apartment (85 m2); see Figure 4. This was done to reduce the computational time, which significantly increased due to the implementation of advanced room control strategies. The two apartments with the highest heating and cooling demands, due to high envelope heat losses and high solar heat gains, were selected.

2.2. Building Energy Performance Modeling

The reference buildings were modeled over a one-year period with a time step of one hour using the dynamic multi-zone building performance simulation tool IDA-ICE [22]. Each room function was modeled as an individual zone, and adjacent rooms with the same function were merged to minimize the computational time. Typical schedules for occupancy were implemented (illustrated in Figure 5), adapted from schedules used in a Norwegian study [23]. The occupancy patterns were converted from step schedules to linear schedules to reduce the computational time of the simulations. Two open-source models were used to calculate hourly lighting loads [24] and equipment loads [25]. The hourly schedules were adapted to fit the annual Norwegian normalized values [18]. All internal doors were kept closed to study the thermal comfort at each thermal zone separately. Both cases were placed in the climate of Trondheim, Værnes, Norway.
Window-opening behavior was implemented to consider its significant impact on the thermal comfort and energy consumption. Window opening in dwellings is strongly influenced by the indoor temperature, solar radiation and the CO2 level in the room [26]. In this paper, window opening was modeled by creating a macro in IDA-ICE to provide fresh air and/or cooling; see Figure 6. It was assumed that the windows closed automatically before the temperature dropped below the heating setpoint to minimize energy losses and avoid extra heating (see Figure A1). Windows were opened when the indoor operative temperature exceeded a predefined setpoint, 3.5 °C higher than the heating setpoint (deadband = 3 °C), or when the CO2 level exceeded 1000 ppm (deadband = 200 ppm), though only when an occupant was present in the house. This resulted in windows opening quite often, causing an increased energy consumption. The window-opening behavior was the same in all retrofitting cases.

2.2.1. Model Validation

The representativeness of the simulation models was evaluated in two steps. First, models with a high validity were created using typical and normalized input data (see Table 1). Then, the output of the models (i.e., the simulation results) were compared with theoretical data. Both reference “original” models were simulated twice: with standardized (normative) internal gain loads from NS 3031 [18] and with typical internal gain loads. It is expected that the energy consumption will be below average when NS 3031 input is used, while the energy consumption is expected to be above average when typical internal gains and window-opening behavior are used. As the case studies are representative for a group of buildings, the results were compared to average data from statistics and typical values from other studies [16,27]. They were validated with a direct electrical heating system. The validations results are presented in Section 3.1.

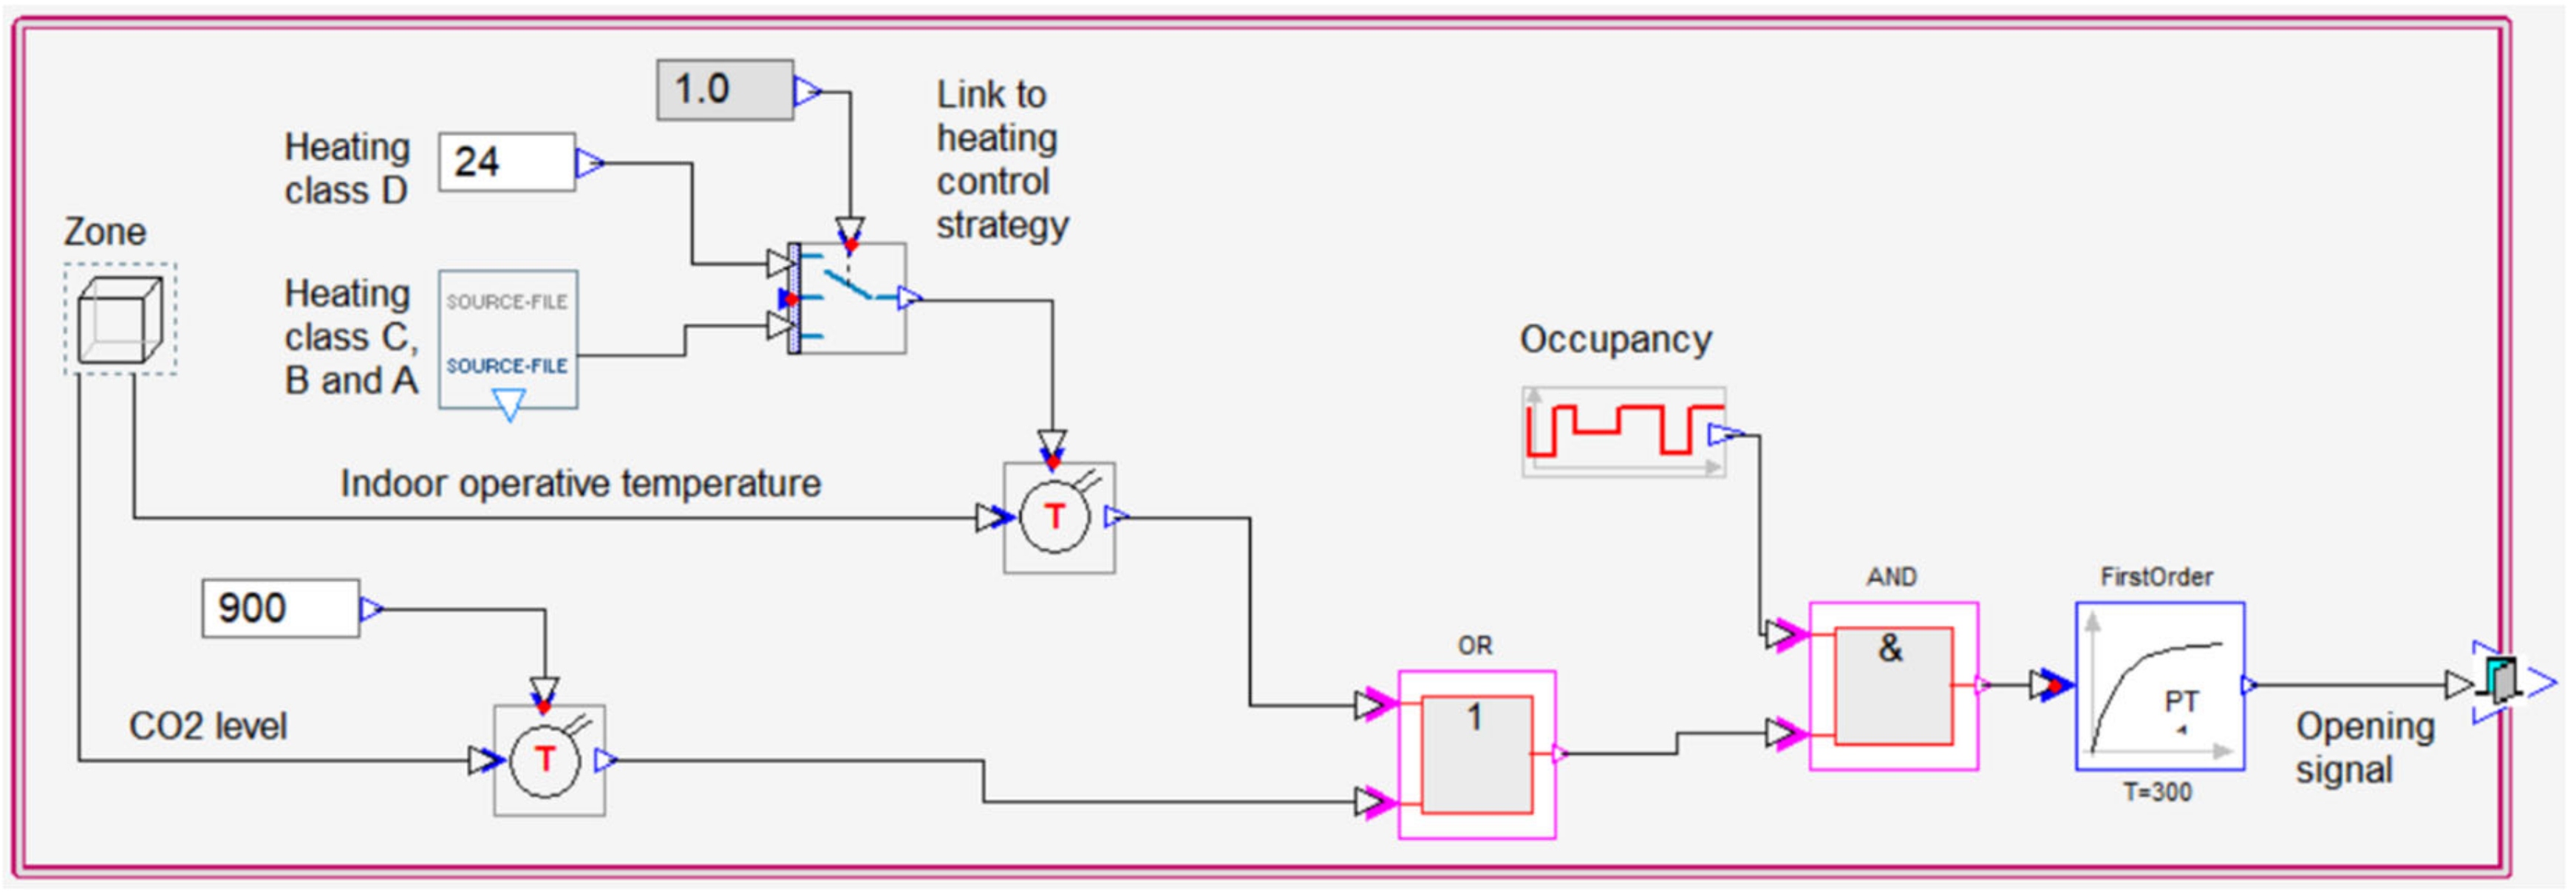
2.2.2. Reference BACS Strategies

Using parametric runs in IDA-ICE, control strategies were changed one by one in the reference “TEK 17” models. In this way, the impact of each individual strategy on the energy use for systems and on the total energy consumption was evaluated, thereby validating the modeled controls and setpoints (i.e., each improved class should decrease the energy use). The validation results are presented in Section 3.2.
Normative loads for equipment and lighting were used [18]. Occupancy patterns and window-opening behavior were implemented, as described in Section 2.2. Space heating was provided by direct electric heaters, and a balanced ventilation system with 80% heat recovery was implemented after retrofitting. Halogen lights bulbs were used before and after retrofitting. Switching to LED lights was not considered so that the effect of control strategies could be compared. In some cases, an air source heat pump (ASHP) was installed in the living room of each dwelling. The complete BACS levels were evaluated as well, where strategies for heating, lighting, ventilation and blinds were set to the same level (C, B or A). The BACS strategy definitions were in-line with the automation standard EN 15232 [28] and are summarized in Table 2. Control of domestic hot water systems and cooling systems were out of the scope.
The normalized heating setpoint of 22 °C was used in class D [18]. The temperature setpoints in class C and higher were assumed variable and followed the neutral adaptive thermal comfort curves defined by Peeters et al. [29]. The curves are a function of the reference temperature (Equation (1)). These criteria are more realistic for residential buildings than the adaptive comfort criteria given in EN 16798 [30]. The maximum potential of the control strategies, i.e., the maximum energy savings that can be achieved, was evaluated by choosing extreme setpoints for when the house/room is not occupied. The adaptive heating setpoints are illustrated in Figure A2, Figure A3 and Figure A4 in Appendix C.
The air flow rates were taken from TEK 17 [20], which specifies the minimum air flow rates for each room function and for not occupied rooms in dwellings. The air supply temperature was constant at 18 °C in classes D and C. In classes B and A, the temperature setpoint varied between 16–18 °C during occupied hours and between 14–16 °C during not occupied hours (see Figure A5 in Appendix C).
T r e f = T e d + 0.8 × T e d 1 + 0.4 × T e d 2 + 0.2 × T e d 3 2.4  
where Tref is the reference external temperature in degrees Celsius, Ted is the arithmetic average of today’s maximum and minimum temperature in degrees Celsius and Ted−i is the arithmetic average of the maximum and minimum temperature of the ith previous day in degrees Celsius.
The manual control of lighting (class D and C) was modeled to follow the occupancy schedule for each room function. In classes B and A, the lights were switched off and dimmed, respectively, when the horizontal daylight illuminance level at the first occupant level exceeded 200 lux. This value was taken from EN 15232 [28].
Manual control of the blinds (classes D and C) was modeled as a function of the indoor operative temperature and room occupancy. In classes B and A, blinds were activated when the solar radiation exceeded 200 W/m2 [28]. In all classes, blinds were only lowered when the outdoor temperature exceeded 15 °C to maximize solar heat gains during the heating season.

2.2.3. Objective Function and Solution Space

The total annual energy consumption was defined as a single-objective function. The objective function was minimized by finding optimal combinations of the discrete and continuous design variables given in Table 3. The values for the thermal envelope were chosen so that the lower limit of the range fulfilled the minimum energy performance requirements from TEK 17 [20]. When no values were specified, the TEK 17 energy-saving requirements were used to define the lower limit. The upper limits were based on the energy performance criteria for Norwegian passive houses [31]. These values are summarized in Table 4. U-value calculations were done to define the thickness of insulation required to achieve the upper and lower limits. It was assumed that the insulation was placed in a timber frame construction. This component had a combined thermal conductivity of λ = 0.044 W/mK. The insulation ranges include the original insulation thickness. The BACS options represent the four automation levels presented in Table 2.

2.2.4. Simulation-Based Optimization

GenOpt [32], a built-in IDA ICE, was used to automate the simulation-based optimization process. GenOpt calls IDA-ICE and calculates the objective function for a given combination of design variables. The design variables are changed in each iteration until the objective function is minimized. GenOpt can use various algorithms, and in this case, a generalized pattern search particle swarm optimization in combination with the Hookes Jeeves algorithm was used. This hybrid algorithm first performs a particle swarm optimization for the design variables and then continues with the Hookes Jeeves algorithm to refine the continuous design variables [9]. The markers lined with black in Figure 7 illustrate when the design variable refining process started.

2.3. Discussion-Based Decision-Making

The associated difference in life cycle cost (dLCC), compared to the reference design, and thermal comfort were calculated for each optimization iteration. This was done using a postprocessing algorithm in Excel.

2.3.1. Difference in Life Cycle Cost Analysis

The economic feasibility of the retrofitting packages was evaluated by calculating the dLCC between the reference model and each retrofitted model, following the methodology introduced by Hamdy et al. [33]. The selection of a reference model impacts the results, and only results with the same reference can be compared. It was assumed that the maintenance costs were equal in each scenario and that no replacement was needed for the building envelope measures within the calculation period of 30 years. The automation measures and the heat pump were replaced once within the calculation period. As a result, the dLCC was simplified to Equation (2). A negative dLCC indicates that the combination of retrofitting measures is more profitable than the reference case (dLCC = 0). Results with a negative dLCC are further defined as “profitable” and results with a positive dLCC as “not profitable”. The profitability is in all cases compared to the reference case, i.e., no retrofitting.
d L C C = d I C + d O C
where dIC is the difference in investment cost in NOK, and dOC is the difference in operational cost in NOK. The difference in investment cost is calculated by summing the cost for each retrofitting measure, as shown in Equation (3).
d I C = j = 1 8 I C j
The difference in operational cost of the total annual energy consumption between the reference model and each retrofitted model is calculated according to Equation (4).
d O C = a × e p × d E j
a = 1 1 + r e n r e
r = i f 1 + f
r e = r e p 1 + e p
where a is the discount factor, calculated according to Equation (5), ep is the energy price for electricity, dEj is the difference in energy consumption, r is the real interest rate, re is the real interest rate including the escalation of the energy price, i is the nominal interest rate, f is the inflation rate and ep is the energy price for electricity. The interest rate was set to 3%, the inflation rate was set to 2.1% and the energy price was set to 1.23 NOK/kWh, with an annual price escalation of 3.15% [19]. All costs were taken from Norsk Prisbok [34] and were price-corrected from February 2019 to December 2019. The investment costs included material and labor costs and the cost for removing the old components of the building envelope. A more detailed description of the included cost can be found in Table A2, Table A3, Table A4 and Table A5. Value-added tax and costs for waste disposal were excluded. The total investment cost was converted from Norwegian Crowns to Euro using the average exchange rate over 2019, i.e., € 1.0 equals 9.85 NOK. The investment cost can be found in the Appendix C.

2.3.2. Thermal Comfort Assessment

To evaluate the thermal comfort, the total number of occupied indoor discomfort degree hours (DDH) was calculated for a one-hour time step according to Equations (8) and (9). The operative temperature, Top, was compared to the upper and lower limits. The limits were defined as the temperature where the percentage of people dissatisfied (PPD) was 20% [29]. These are presented in Table 5, where Tx,u is the upper limit, Tx,l is the lower limit and Tx,n is the neutral comfort temperature. Thermal comfort was assessed for the room with the most overheating hours, i.e., the living room in the corner apartment facing east and the living room on the upper floor of the single-family house facing west. These rooms also have the most heat losses and solar heat gains.
U n d e r c o o l i n g :   D D H = i = 1 8760 T x , l T o p   w h e n   T o p < T x , l
O v e r h e a t i n g :   D D H = i = 1 8760 T o p T x , u   w h e n   T o p > T x , u

3. Results and Discussion

3.1. Validation of the Reference “Original” Building Models

Table 6 shows the energy performance simulation results in comparison to reference values for the single-family house and representative apartments, respectively. The energy consumption for domestic hot water (DHW) was the same in all cases, i.e., 25.0 kWh/m2 year, as the control of the DHW systems was not considered in this paper. The whole apartment block was only simulated with NS 3031 input values, which resulted in a total energy consumption of 149.8 kWh/m2 year, i.e., 8% higher than for the representative apartments. As expected, the energy consumption when using NS 3031 input was lower than the average, while the energy consumption when using typical internal gains and window-opening behavior was higher than the average. There was no reference value for space heating and auxiliary energy (HVAC aux). However, as the other energy consumption parameters and the total energy consumption are acceptable compared to the reference values, it was concluded that the energy use for space heating and auxiliary energy were acceptable.

3.2. Validation of the Reference “TEK 17” Models with BACS Control Strategies

The results from the parametric study are presented for the cases with space heating provided by direct electrical heating in the whole house (Table 7) and with an air ASHP in the living room, supplied by direct electrical heaters in the rest of the house (Table 8). The energy consumption of the case study with no automated control strategies is shown in the first row (“Model D”). The other rows show the relative energy consumption compared to model D achieved by implementing more advanced BACS. Text marked in bold indicates a significant decrease in energy consumption, i.e., more than a 5% decrease.
Energy savings of 10–24% were achieved when BACS was upgraded to a complete class (see rows “complete level” and columns “total”), and savings of 9–20% were achieved when only the heating control strategy was upgraded (see row “heating, level” and column “total”). The achieved energy savings were mostly due to upgrading the heating control strategies, but the highest savings were achieved when all control strategies were upgraded simultaneously (“complete level”).
The total achieved energy savings were 1.5−2 times higher for apartments than for the single-family house (see row “complete level” and column “total”). The control strategies, especially for heating, had a bigger impact on the energy consumption when the heated floor area in relation to the exterior envelope area increased, i.e., more compact buildings, such as apartments. The energy savings for the single-family house were similar to the results from our previous paper [19].
When the heating demand covered by space heaters decreased (for example, due to night setbacks in more advanced BACS classes), the energy use attributed to air heating unit (AHU) and fans increased, as more AHU heating was required to ensure a comfortable temperature (see rows “heating, level” and “ventilation, level” and columns “space heating” and “AHU heating and fans”). The opposite happened when a control strategy with a lower temperature setpoint for the supply air was implemented. When ventilation and heating strategies were upgraded simultaneously (“complete level”), the energy use for AHU heating and fans and for space heating decreased (see row “complete level” and columns “space heating” and “AHU heating and fans”).
When an ASHP was installed, the space heating demand did not necessarily decrease for more advanced levels (see rows “heating, level” and “complete level” and column “space heating” in Table 8). This is because the ASHP only heated up a limited volume due to closed doors and because the efficiency of the ASHP is much higher than of direct electricity (i.e., the space heating demand decreased but not necessarily the total energy consumption).
The lighting control strategies significantly decreased the energy consumption for lighting (see row “lighting, level” and column “lighting”). However, the total energy consumption decreased minimally, as the heating demand increased due to lower internal heat gains (see row “lighting, level” and column “total”). Control of the blinds did not affect the energy consumption. This is most likely because no active cooling systems are installed (see row “blind, level” and column “total”). The cooling demand may be reduced, but it was not investigated, as there are no cooling systems installed. Instead, the thermal comfort was investigated.
Figure 8 shows the number of total occupied indoor discomfort degree hours in the living room compared to the energy consumption. The DDH were mostly overheating hours, except for heating classes B and A in the apartment with direct electricity (2 and 38 DDH of undercooling, respectively). The heating strategies, especially temperature setback, had the biggest impact on the reducing the DDH and energy consumption. The latter is not surprising, as space heating accounted for most of the energy consumption (see Table 6).
Overheating was a bigger issue in the living rooms of the representative apartments than in the living room of the single-family house. This was most likely because of less heat losses through the envelope due to a smaller exterior surface area.
Thermal comfort increased when more advanced automation strategies were implemented, though ventilation had no positive effect. When all control strategies were upgraded simultaneously (“complete level”), there was a significant improvement to the thermal comfort. Combining the BACS strategies resulted in the highest decrease of thermal discomfort.
Figure 9a,b shows the profitability of individual BACS measures. The dLCC was calculated in relation to the reference “TEK 17” models (class D) without an ASHP. The profitability of measures improved when the achieved energy savings increased. The figure shows that, for the single-family house, installing an ASHP was profitable regardless of the automation class. Without the ASHP, no automation measures were profitable. For the apartments, upgrading all automation systems to class C was profitable without an ASHP. When the ASHP was installed, upgrading the heating control systems and upgrading all systems to classes C or B was profitable.

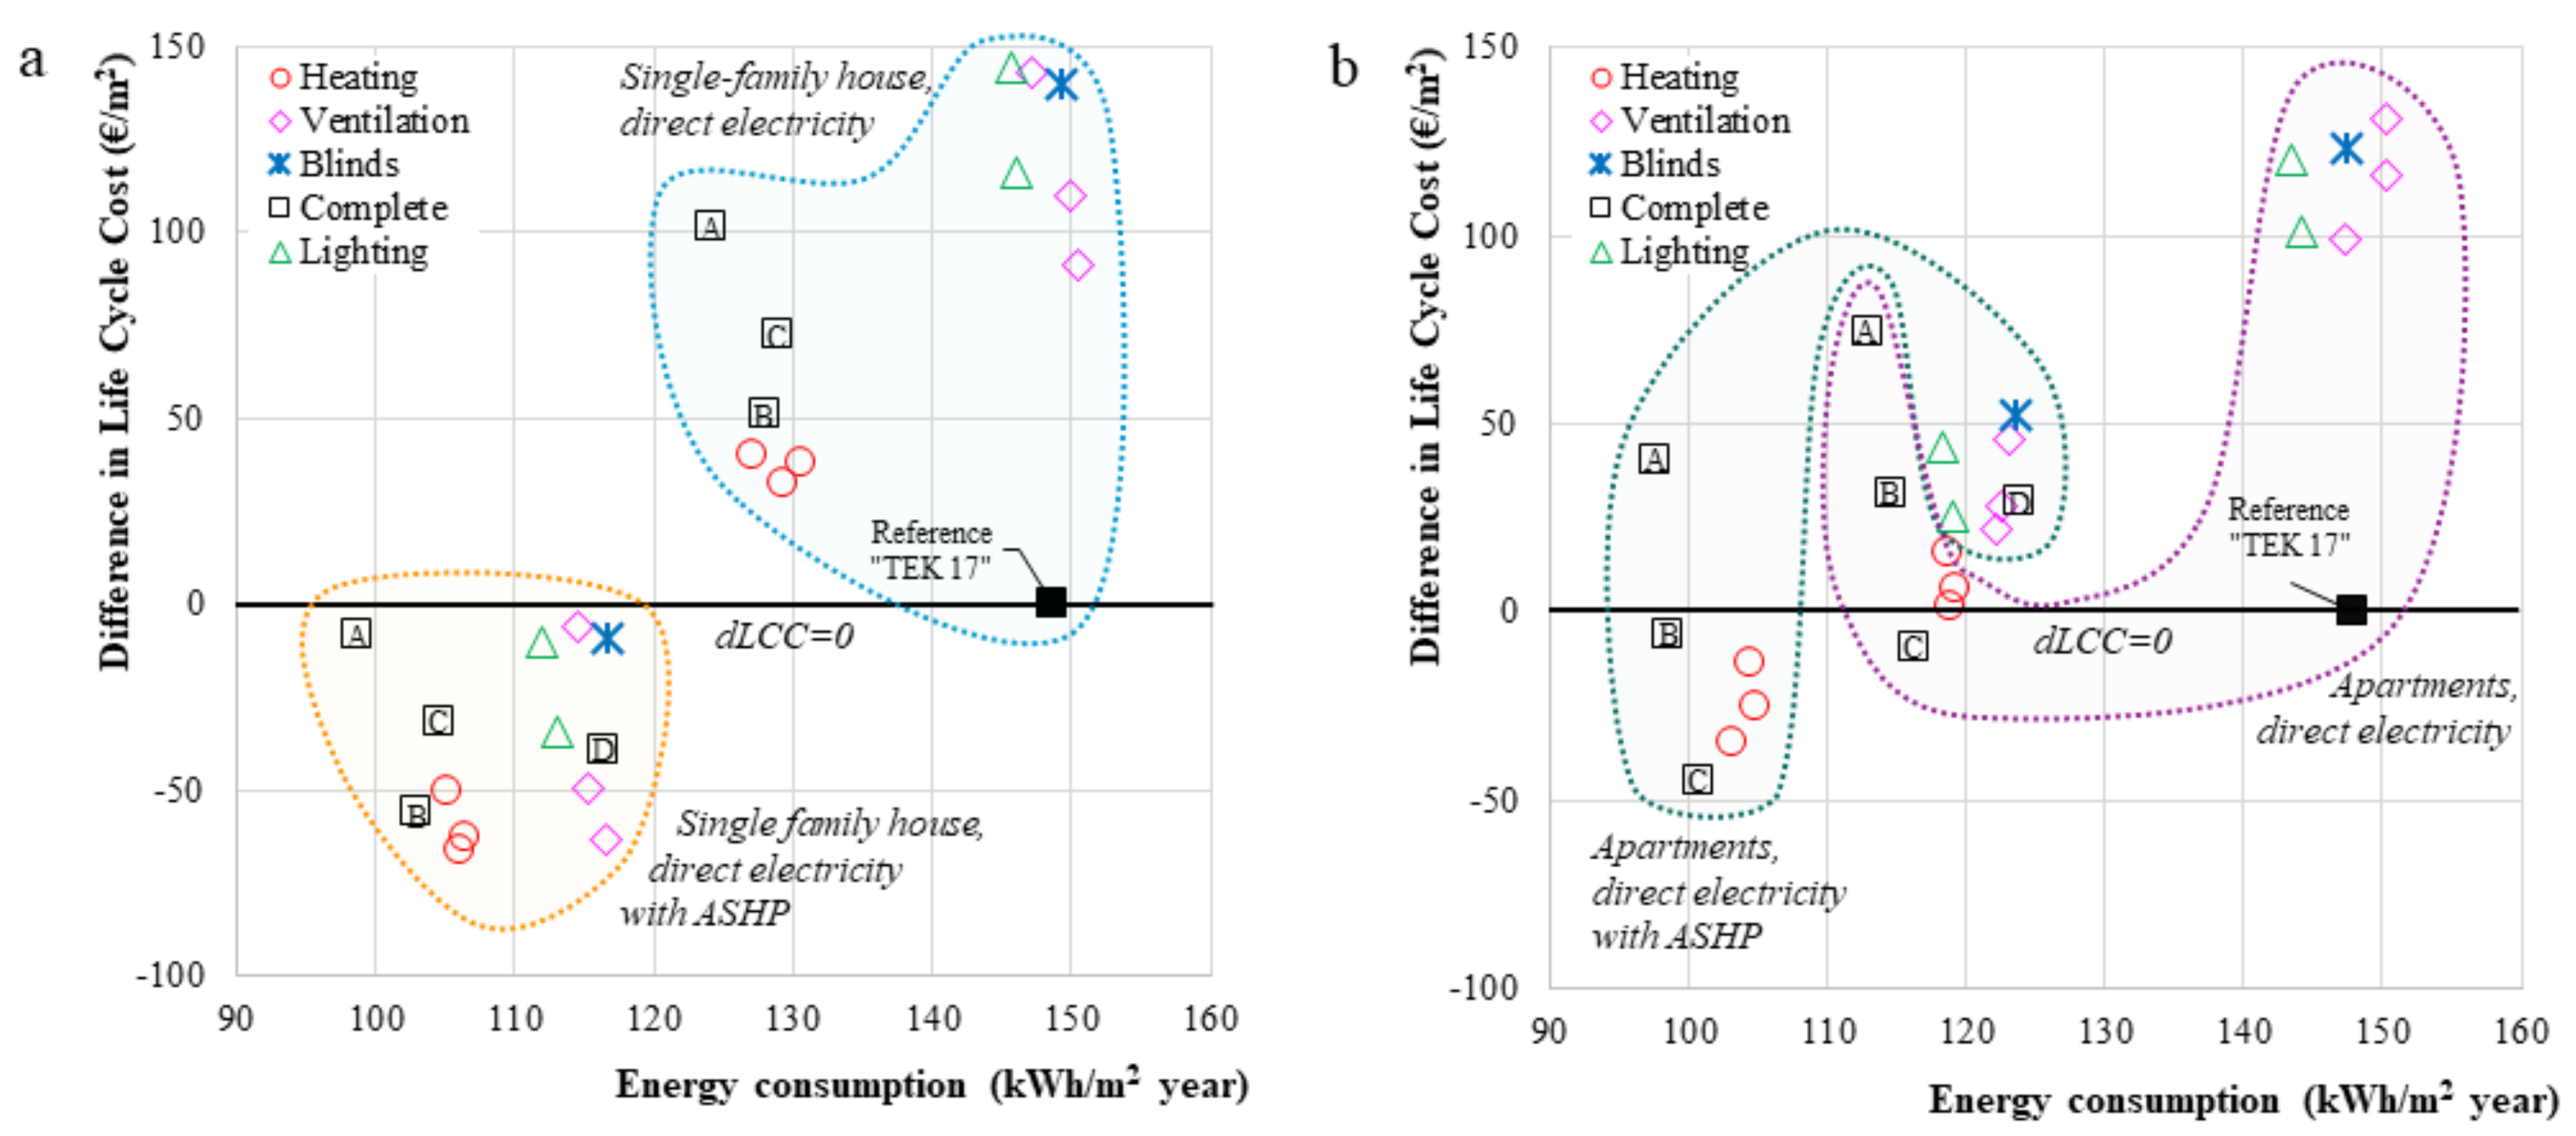
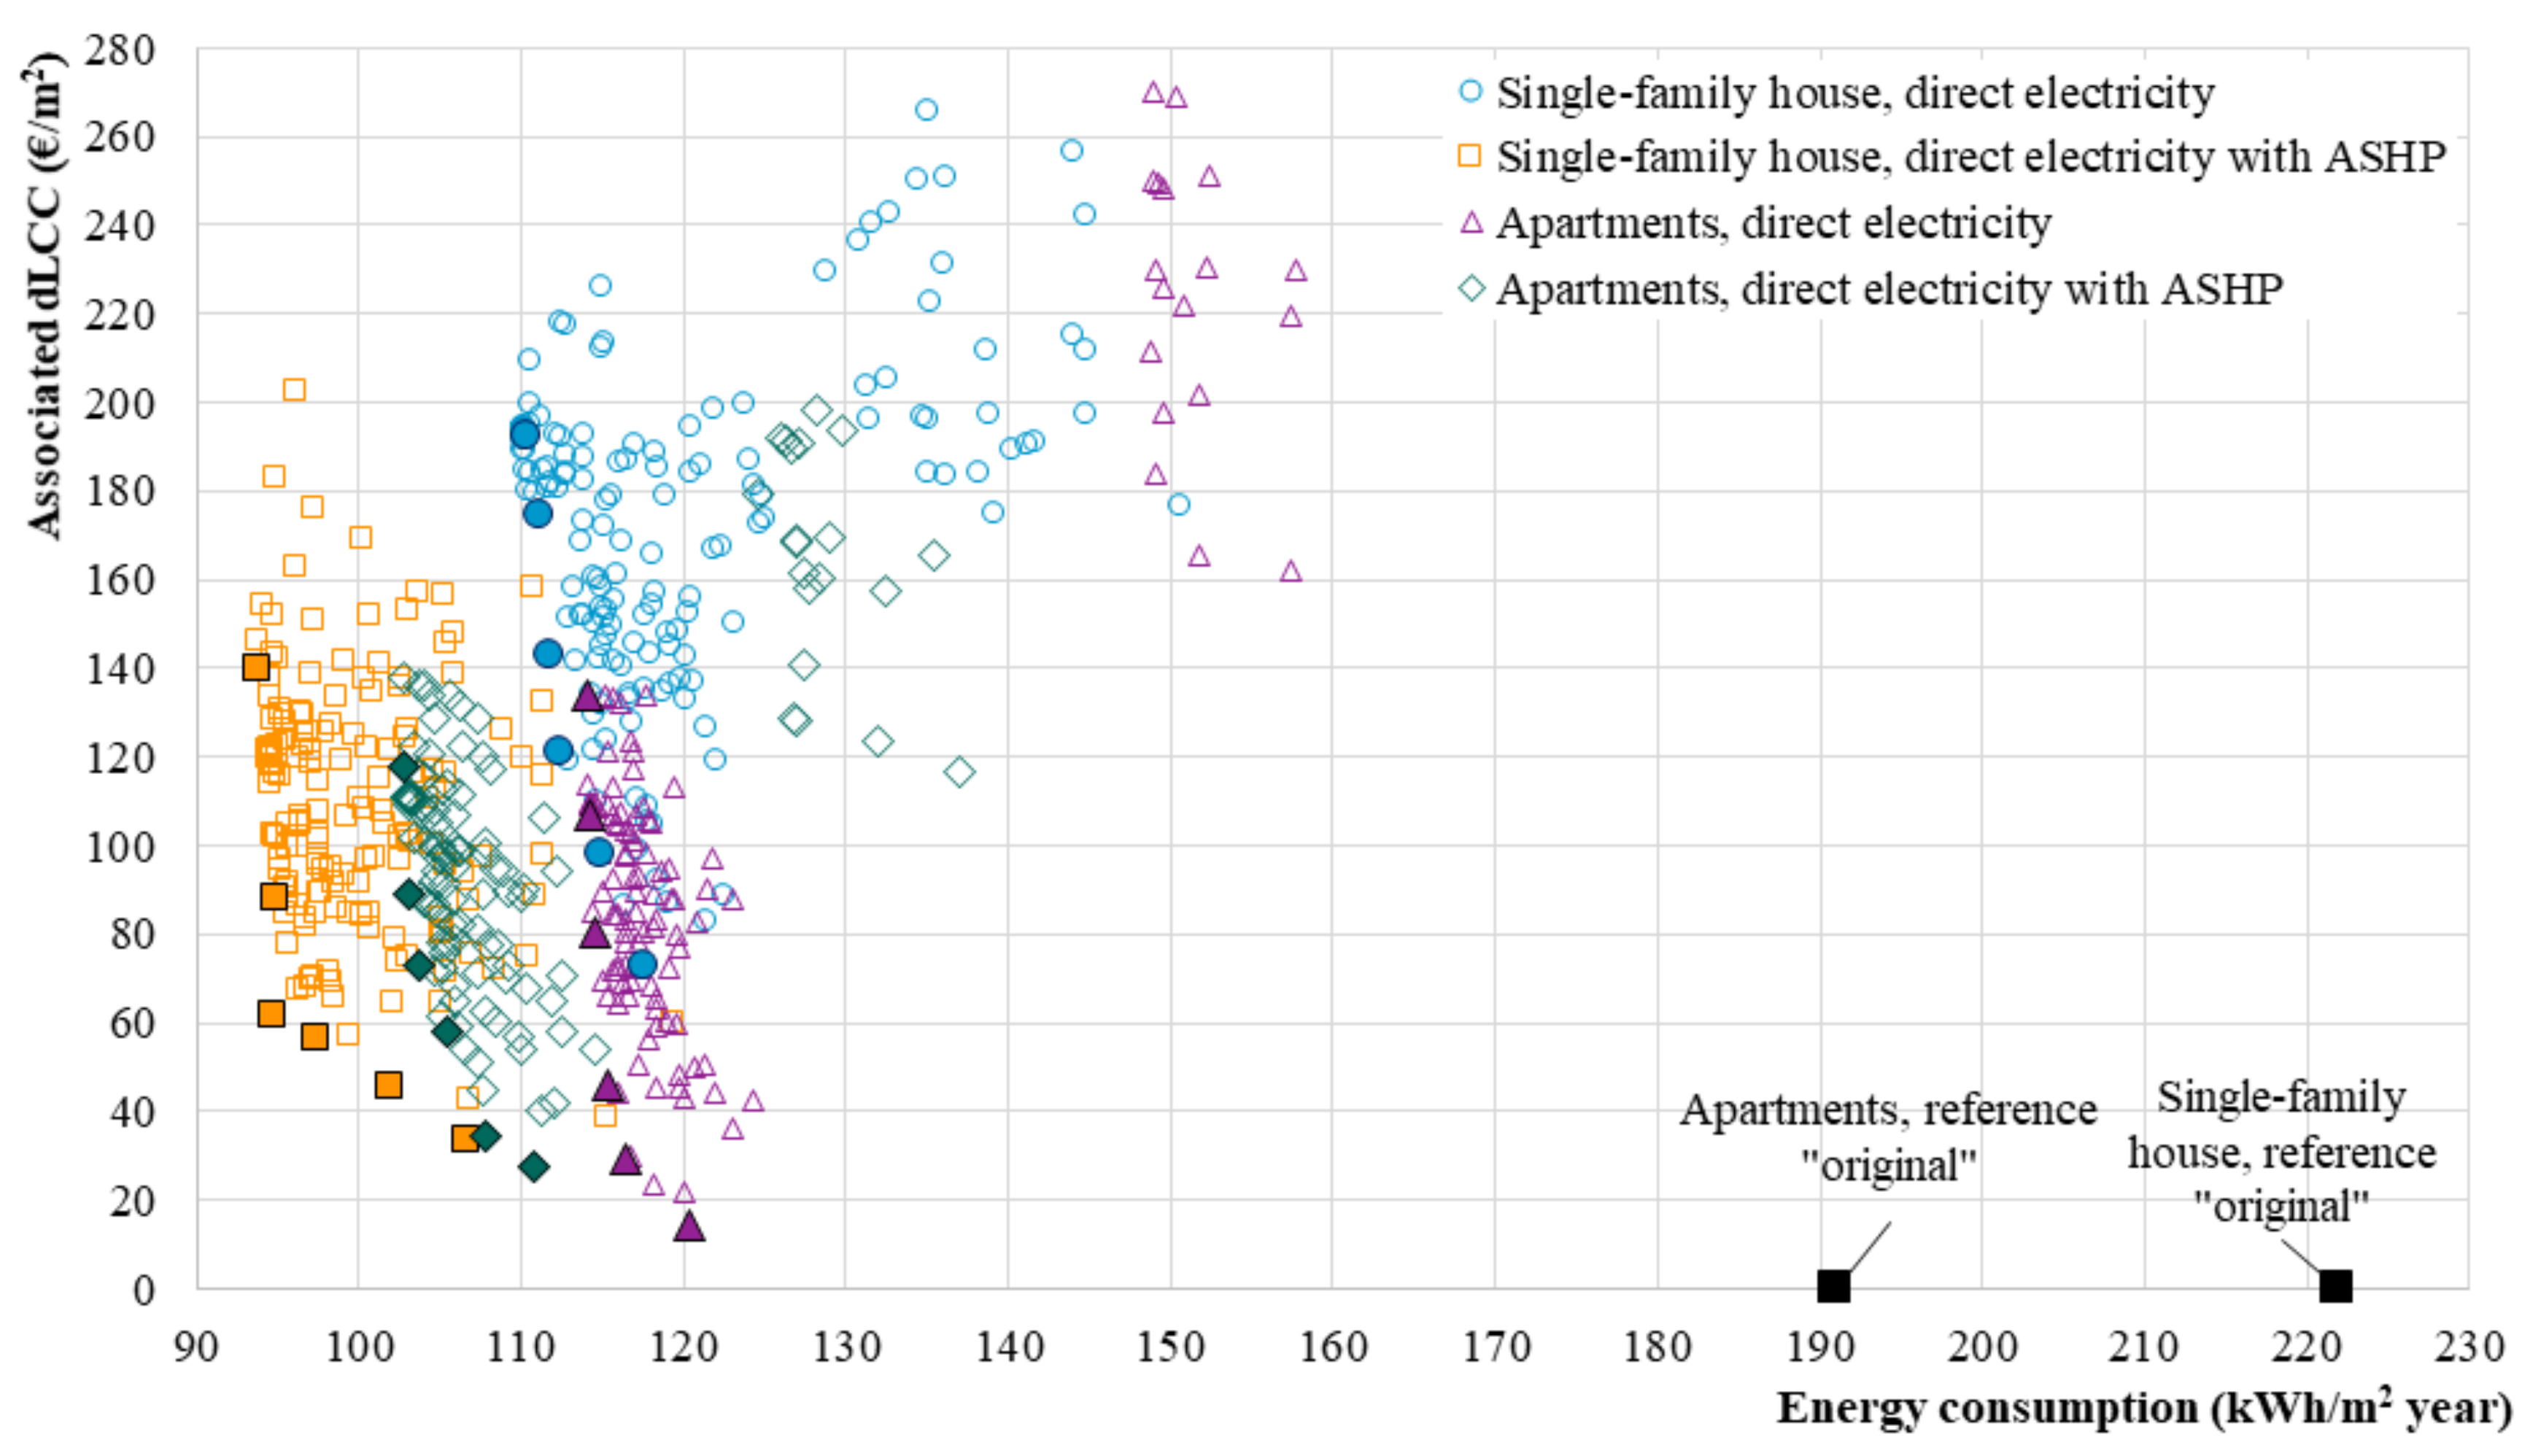
3.3. Simulation-Based Optimization and Economic Assessment

Figure 10 shows the results from the optimization with the dLCC, compared to the reference “original” model, as a function of the energy consumption. The optimal solutions are marked on the pareto fronts. The total energy savings were 32–57% for the single-family house and 17–46% for the representative apartments. Installing an ASHP significantly impacted the energy consumption. In many cases, this impact was larger than what a combination of envelope retrofitting and control strategies achieved. It is expected that the effect of installing an ASHP is larger when internal doors are opened.
Due to the high investment cost and the low energy price for electricity, i.e., a long period to earn back invested cost through energy savings, no solutions were profitable after 30 years (dLCC > 0). When no ASHP was installed, the optimal retrofitting solutions for the apartments were more profitable than for the single-family house. As apartments have a smaller exterior surface area in relation to the heated floor area, i.e., are more compact, it is cheaper to retrofit the building envelope and improve the energy efficiency. However, when an ASHP was installed, the profitability of the single-family house and the apartments was similar. The higher investment costs for retrofitting the building envelope of the single-family house were outweighed by higher energy savings, resulting in more profitable solutions. The probabilities of the retrofitting solutions for the apartments with and without an ASHP indicated that achieved energy savings from installing an ASHP were similar to the reduced operational costs.
Low U-values of the walls and roof, better than the minimum energy performance requirements, were essential for high energy savings for both buildings (see Table 9, Table 10, Table 11 and Table 12). The U-values of windows, basement walls and floors had less impact on the achieved energy savings than the U-values of the external walls and roof, though all were upgraded to fulfil at least the minimum energy performance requirements.
The choice of heating control strategy significantly affected the energy-saving potential, resulting in a visible separation of the retrofitting solutions for three of four cases. A heating control strategy of class C or better was essential to achieve significant energy savings. A detailed analysis showed that the models with class D heating control strategy had, for the single-family house, 8 to 23 kWh/m2 higher energy consumption than models with the same envelope parameters and a class C or higher heating control strategy and 21 to 35 kWh/m2 year higher for the representative apartments.
The results from the representative apartments were used to estimate the energy savings and profitability after retrofitting for the whole apartment block. The following assumptions were made: the energy consumption for the whole block was 8% higher than the energy consumption for the representative apartments (see Section 3.1), and no retrofitting was done to the ground floor. The investment costs were calculated from the total area of the exterior envelope and the total number of windows. The cost for automation was a function of the heated floor area. The optimal solutions for the whole apartment building were similar to those from the representative apartments, but they were more profitable (see Figure 11). This is because the ratio of exterior surface area to heated floor area decreases when the whole building is considered as opposed to two top floor apartments, thus decreasing the investment cost per heated floor area.
Table 9, Table 10, Table 11 and Table 12 show the building envelope and automation parameters of the optimal retrofitting packages (marked on the pareto fronts in Figure 10). The optimal solutions include the solution with the lowest energy consumption and the solution with the lowest associated dLCC. The lowest energy consumption (bottom row) was achieved when the building envelope was retrofitted (almost) to the upper limits (see Table 4) and when the heating and lighting control strategies were upgraded to class A. Upgrading the heating and lighting control strategies to class A was essential to achieve high energy savings. For the apartments, the solutions with the highest energy savings also required the ventilation control strategies to be upgraded to class A. This was less important for the single-family house. The impact of blind control strategies on the energy performance was not significant and resulted in higher investment costs. More profitable solutions had a building envelope with a lower energy performance, though still fulfilling the minimum energy performance requirements.

3.4. Thermal Comfort Assessment

The thermal comfort assessment in Figure 12 shows a significant decrease of DDH after retrofitting. Installing external blinds and using BACS had the highest impact, as all DDH were caused by overheating. Undercooling due to temperature setback occurred only when no occupants were present. No occupied undercooling hours were reported, meaning that the size of the heaters and implemented reheating time (i.e., 1.5 h) were sufficient to ensure a comfortable temperature during occupied hours. There were no significant differences in thermal discomfort between the optimal solutions. In general, the living room in the representative apartments had more discomfort degree hours than the living room in the single-family house.
Overheating can be decreased further by implementing more advanced window-opening control strategies. For example, the openable area can be increased in the summer to maximize cooling by natural ventilation and decreased in the winter to avoid excessive heating. As overheating was not the primary focus of this paper, this was not further investigated. It should also be noted that, for a full thermal comfort analysis, all zones in the house should be considered.

3.5. Limitations and Further Works

This paper presents optimal solutions where the energy consumption was minimized through single-objective optimization. The profitability was calculated during postprocessing to define the cost-effective retrofitting solutions. The presented optimal solutions were therefore not optimized for the difference in life cycle cost. The calculation of the life cycle cost was simplified by not considering the maintenance cost. The energy price was assumed fixed, though it is expected that it will increase in the future and that different grid rent tariffs will be introduced, with energy prices varying during the day and season. With the introduction of such grid rent tariffs, the importance of smart control systems increases. The calculation period was set to 30 years, though no solutions were profitable after this period. The calculation period could be extended to 60 years, including the relevant replacement of components, such as windows, to evaluate the cost-effectiveness over the whole lifetime of the opaque envelope components. For defining cost-optimal retrofitting solutions, it is recommended that a multi-objective optimization is performed to optimize energy consumption and dLCC simultaneously.
Two representative apartments were modeled instead of the whole apartment block. This was done to minimize the computational time needed to run the simulations. Due to this, the results are only valid for these two apartments. The optimization results were used to estimate the energy savings and profitably of retrofitting the whole apartment building. Retrofitting of the ground floor was not taken into account. Corner and middle apartments on the ground floor and middle floor should be modeled as well so as to investigate the energy consumption, dLCC and thermal comfort after retrofitting for the whole block.
The simulation results are valid for the presented residential case studies and cannot be directly used for other building typologies. This paper aimed to propose retrofitting solutions for a housing typology as opposed to an individual case study building. The presented solutions can, to a certain extent, be adopted as optimal for other dwellings of the same typology. Some assumptions, such as climate, orientation and thermal performance of the building envelope, are case-specific. Especially the latter can impact the optimal results and profitability. In this paper, it was assumed that no retrofitting was done to the building. However, dwellings older than 20–30 years are often partly retrofitted (e.g., new windows are installed), and this will result in different optimal combinations of retrofitting solutions. More research is needed to assess the effect of varying assumptions.
Though cost-effective retrofitting solutions were found, some of the proposed building envelope retrofitting solutions might not be realistic. It was assumed that the insulation was added on the exterior side of the construction. However, it might not be desirable or feasible to add insulation to the exterior side, for example, for floors. It would require removing the original concrete floor to place the insulation below the floor. For heritage buildings or buildings close to other buildings, it could be difficult to add exterior insulation to the walls and/or roof. Therefore, the proposed optimized results might not be suitable for every house in the investigated housing typologies.

4. Conclusions

Optimal retrofitting packages that combine retrofitting of the envelope and energy systems with building automation control systems (BACS) were presented for two typical Norwegian dwellings: a single-family house and an apartment block. The reference models and BACS strategies were modeled and validated in IDA-ICE. The building envelope and automation parameters were optimized for energy consumption using GenOpt. The associated differences in life cycle cost and thermal comfort assessments were conducted using a post-processing algorithm in Excel. An air source heat pump, in combination with a high-performance building envelope and high-performance automation, was essential for cost-effective retrofitting. More profitable solutions had a building envelope with a lower energy performance, though still fulfilling the minimum energy performance requirements. Energy savings of 32–57% were achieved for the single-family house, and savings between 17–46% were achieved for the representative apartments. Upgrading BACS—in particular, the heating control strategies—accounted for up to 24% energy savings. Ventilation and blind control strategies did not significantly affect the energy consumption. When the potential of reducing heat losses through the envelope was limited, i.e., for more compact buildings with a low exterior surface area compared to heated floor area, the impact of BACS increased. A negative difference in life cycle cost was achieved faster for more compact buildings, as upgrading the BACS was significantly cheaper than building envelope retrofitting. The thermal comfort in the living room improved significantly after retrofitting, though no significant differences were identified between the optimal solutions. In general, the following can be concluded for residential buildings in cold climates: if the primary goal is to optimize the energy consumption (i.e., minimize it), an air source heat pump in combination with a high-performance building envelope and advanced heating and lighting control strategies is the most cost-effective solution. For more profitable solutions, or when a retrofit of the complete building envelope is not possible, high-performance BACS are an attractive retrofitting measure.

Author Contributions

Conceptualization, L.C.F., M.H., F.D. and B.D.H.; methodology, L.C.F.; software, L.C.F.; validation, L.C.F.; formal analysis, L.C.F.; writing—original draft preparation, L.C.F.; writing—review and editing, L.C.F., M.H., F.D. and B.D.H.; visualization, L.C.F.; supervision, M.H., F.D. and B.D.H..; funding acquisition, F.D. and B.D.H. All authors have read and agreed to the published version of the manuscript.

Funding

This research was funded by the Norwegian University of Science and Technology via the strategic research program ENERSENSE (grant number 68024013).

Acknowledgments

The authors would also like to thank Mika Vuolle for his help with the software. This work has been done in cooperation with the Research Center on Zero Emission Neighborhoods in Smart Cities (FMEZEN). The authors gratefully acknowledge the support of ZEN partners and the Research Council of Norway.

Conflicts of Interest

The authors declare no conflict of interest.

Appendix A. Electrical Loads and Installed Space Heating Power

Table A1. Electrical loads and installed space heating power for the single-family house (SF) and the apartments (AP) [19].
Room FunctionEquipmentCase StudyOrientationArea (m2)Lighting (W)Heating (W)
Kitchens Freezer, fridge, oven, microwave, kettle, small cooking, dishwasherSFE8.5461000
APS6.646800
APW1
Living roomsTelevision, TV receiver, HiFi, clock, personal computerSFW37.423800
SFE&W40.323500
APE22.62800
APW33.021200
BedroomsClock, cordless phone SFE&W20.42 × 462000
SFE9.1461000
SFW11.2461000
APE11.2461200
APE35.13 × 463000
Bathrooms SFE3.546500
SFE1.630250
SF1.930250
AP6.546500
AP9.846500
LaundryIron, vacuum cleaner, washing machine, dryerSFE6.446
AP333
AP333
Halls SFE7.446500
SFW4.830250
AP6.530500
AP7.430500
StairsSF2.530
StorageSFE19.230
1 There was no separate kitchen in the middle apartment. The equipment loads for the kitchen were added to the living room. 2 The lighting loads for living rooms were calculated using the model developed by Richardson et al. [24] and fit to the standardized yearly lighting load in NS 3031 [18]. 3 There was no laundry room in the apartments. The equipment loads for laundry were added to the bathroom.

Appendix B. Variable Temperature Setpoints

Figure A1. Adaptive temperature setpoints for opening the windows in the bedrooms, bathrooms and other rooms.
Buildings 10 00200 g0a1
Figure A2. Adaptive heating temperature setpoints with night setback in the bathrooms.
Buildings 10 00200 g0a2
Figure A3. Adaptive heating temperature setpoints with night setback in the bedrooms.
Buildings 10 00200 g0a3
Figure A4. Adaptive heating temperature setpoints with night setback in the other rooms.
Buildings 10 00200 g0a4
Figure A5. Variable air supply temperature setpoints with night setback.
Buildings 10 00200 g0a5

Appendix C. Investment Cost

Table A2. Investment cost for the building envelope retrofitting measures.
Retrofitting MeasureOptionsCost (€/m2)
Additional external wall insulation (original 10 cm)
Including: removing the original cladding, adding a wind barrier, adding mineral wool insulation (variable thickness) and timber frame, adding cladding
10 + 10 cm118.2
10 + 15 cm129.0
10 + 20 cm157.6
10 + 25 cm172.7
10 + 30 cm180.4
Additional insulation sloped roof, single-family house (original 10 cm)
Including: demolition of the roof cladding, removing insulation from the loft, adding mineral wool insulation (variable thickness) and timber frame to the sloped roof, adding wind and vapor barriers, adding cladding
0 + 20 cm193.9
0 + 25 cm203.7
0 + 30 cm211.8
0 + 35 cm218.8
0 + 40 cm225.1
Additional insulation flat roof, apartments (original 10 cm)
Including: demolition of the roof cladding and insulation, adding expanded polystyrene (EPS) insulation (variable thickness), adding new cladding
10 + 10 cm68.3
10 + 15 cm76.4
10 + 20 cm85.4
10 + 25 cm91.9
10 + 30 cm98.5
Additional insulation basement walls (original 0 cm)
Including: digging out mass, adding EPS insulation (variable thickness)
0 + 15 cm65.5
0 + 20 cm85.6
0 + 25 cm96.6
0 + 30 cm107.7
Additional insulation basement floor (original 0 cm)
Including: demolition of flooring and concrete floor, digging out mass, adding EPS insulation (variable thickness), adding new concrete floor and flooring
0 + 10 cm259.1
0 + 15 cm270.6
0 + 20 cm275.1
0 + 25 cm286.6
0 + 30 cm291.2
0 + 35 cm302.6
Table A3. Investment cost for the window retrofitting measures and air source heat pump.
Retrofitting MeasureOptions Cost (€)
Replacement of all windows, single-family house (original U = 2.8 W/m2)
Including: removing old windows, placing new windows
U = 1.2 W/m219,984
U = 0.8 W/m222,978
Replacement of all windows, apartments (original U = 2.8 W/m2)
Including: removing old windows, placing new windows
U = 1.2 W/m28437
U = 0.8 W/m29983
Air source heat pump, including installation2234
Table A4. Investment cost for the building automation control systems retrofitting measures.
Automation MeasureOptionsCost (€)
Overall automation, single-family house716
Overall automation, apartments1027
Heating control, single-family house
Including: smart heaters, sensors
Class C2450
Class B2571
Class A3375
Heating control, apartments
Including: smart heaters, sensors
Class C2206
Class B2447
Class A3410
Ventilation control, single-family house
Including: balanced ventilation system, sensors
Class D8554
Class C12,295
Class B12,502
Class A12,678
Ventilation control, apartments
Including: balanced ventilation system, sensors
Class D7672
Class C7672
Class B8085
Class A8438
Lighting control, single-family house
Including: sensors
Class B1926
Class A4571
Lighting control, apartments
Including: sensors
Class B1284
Class A3047
Blind control, single-family house
Including: motorized blinds, sensors
Class B2497
Blind control, apartments
Including: motorized blinds, sensors
Class B2110
Table A5. Sensors used for the different BACS strategies.
Control StrategyOptionsSensors
Heating control Class CWeather sensor
Class BWeather sensor, occupancy sensor
Class AWeather sensor, motion sensor in every room
Ventilation control Class C-
Class BWeather sensor, temperature sensor
Class AWeather sensor, temperature sensor, motion sensor in every room
Lighting controlClass BDaylight sensor in every room
Class ADaylight sensor in every room, motion sensor in every room
Blind controlClass BSolar radiation sensor on every facade

References

  1. Felius, L.C.; Dessen, F.; Hrynyszyn, B.D. Retrofitting towards energy-efficient homes in European cold climates: A review. Energy Effic. 2019, 13, 1–25. [Google Scholar]
  2. European Parliament, Council of the European Union. Directive (EU) 2018/844 of the European Parliament and of the Council of 30 May 2018 amending Directive 2010/31/EU on the energy performance of buildings and Directive 2012/27/EU on energy efficiency (Text with EEA relevance). Off. J. Eur. Union 2018, 156, 75–91. [Google Scholar]
  3. Ippolito, M.; Sanseverino, E.R.; Zizzo, G. Impact of building automation control systems and technical building management systems on the energy performance class of residential buildings: An Italian case study. Energy Build. 2014, 69, 33–40. [Google Scholar] [CrossRef]
  4. Sanseverino, E.R.; Zizzo, G.; La Cascia, D. Economic impact of BACS and TBM systems on residential buildings. In Proceedings of the 2013 International Conference on Clean Electrical Power (ICCEP), Alghero, Italy, 11–13 June 2013; pp. 591–595. [Google Scholar]
  5. Vallati, A.; Grignaffini, S.; Romagna, M.; Mauri, L. Effects of different building automation systems on the energy consumption for three thermal insulation values of the building envelope. In Proceedings of the 2016 IEEE 16th International Conference on Environment and Electrical Engineering (EEEIC), Florence, Italy, 7–10 June 2016; pp. 1–5. [Google Scholar]
  6. López-González, L.M.; López-Ochoa, L.M.; Las-Heras-Casas, J.; García-Lozano, C. Update of energy performance certificates in the residential sector and scenarios that consider the impact of automation, control and management systems: A case study of La Rioja. Appl. Energy 2016, 178, 308–322. [Google Scholar] [CrossRef]
  7. Reda, F.; Pasini, D.; Laitinen, A.; Vesanen, T. ICT intelligent support solutions toward the reduction of heating demand in cold and mild European climate conditions. Energy Effic. 2019, 12, 1443–1471. [Google Scholar] [CrossRef] [Green Version]
  8. Felius, L.C.; Lamb, J.J.; Hrynyszyn, B.D.; Dessen, F. Smart components and systems. In Energy-Smart Buildings; IOP Publishing: Bristol, UK, 2020; pp. 4-1–4-16. [Google Scholar]
  9. Hasan, A.; Vuolle, M.; Sirén, K. Minimisation of life cycle cost of a detached house using combined simulation and optimisation. Build. Environ. 2008, 43, 2022–2034. [Google Scholar] [CrossRef]
  10. Hirvonen, J.; Jokisalo, J.; Heljo, J.; Kosonen, R. Towards the EU emissions targets of 2050: Optimal energy renovation measures of Finnish apartment buildings. Int. J. Sustain. Energy 2019, 38, 649–672. [Google Scholar] [CrossRef] [Green Version]
  11. Niemelä, T.; Kosonen, R.; Jokisalo, J. Cost-effectiveness of energy performance renovation measures in Finnish brick apartment buildings. Energy Build. 2017, 137, 60–75. [Google Scholar] [CrossRef] [Green Version]
  12. Tokarik, M.S.; Richman, R.C. Life cycle cost optimization of passive energy efficiency improvements in a Toronto house. Energy Build. 2016, 118, 160–169. [Google Scholar] [CrossRef]
  13. La Fleur, L.; Rohdin, P.; Moshfegh, B. Investigating cost-optimal energy renovation of a multifamily building in Sweden. Energy Build. 2019, 203, 109438. [Google Scholar] [CrossRef]
  14. Hamdy, M.; Sirén, K. A multi-aid optimization scheme for large-scale investigation of cost-optimality and energy performance of buildings. J. Build. Perform. Simul. 2016, 9, 411–430. [Google Scholar] [CrossRef]
  15. Hamdy, M.; Mauro, G.M. Multi-objective optimization of building energy design to reconcile collective and private perspectives: CO2-eq vs. Discounted payback time. Energies 2017, 10, 1016. [Google Scholar] [CrossRef]
  16. Thyholt, M.; Pettersen, T.D.; Haavik, T.; Wachenfeldt, B.J. Energy analysis of the Norwegian dwelling stock. IEA Task 2009, 37, 1–66. [Google Scholar]
  17. Statistics Norway. Dwellings. Available online: https://www.ssb.no/en/bygg-bolig-og-eiendom/statistikker/boligstat (accessed on 12 March 2020).
  18. NS 3031 Energy Performance of Buildings: Calculation of Energy Needs and Energy Supply; Standard Norge: Oslo, Norway, 2016.
  19. Felius, L.; Hamdy, M.; Hrynyszyn, B.; Dessen, F. The impact of building automation control systems as retrofitting measures on the energy efficiency of a typical Norwegian single-family house. In Proceedings of the IOP Conference Series: Earth and Environmental Science, Thessaloniki, Greece, 23–25 October 2019; p. 012054. [Google Scholar]
  20. Direktoratet for byggkvalitet. Regulations on Technical Requirements for Construction Works (TEK17). 2017. Available online: https://dibk.no/byggereglene/byggteknisk-forskrift-tek17 (accessed on 11 December 2018).
  21. Direktoratet for byggkvalitet. Regulations on Technical Requirements for Construction Works. 1969. Available online: https://dibk.no/globalassets/byggeregler/tidligere_regelverk/historisk-arkiv-1949---1987/byggeforskrift-1969.pdf (accessed on 26 May 2020).
  22. EQUA. IDA Indoor Climate and Energy, 4.1. Available online: https://www.equa.se/en/ida-ice (accessed on 5 November 2019).
  23. Nord, N.; Tereshchenko, T.; Qvistgaard, L.H.; Tryggestad, I.S. Influence of occupant behavior and operation on performance of a residential Zero Emission Building in Norway. Energy Build. 2018, 159, 75–88. [Google Scholar] [CrossRef]
  24. Richardson, I.; Thomson, M.; Infield, D.; Delahunty, A. Domestic lighting: A high-resolution energy demand model. Energy Build. 2009, 41, 781–789. [Google Scholar] [CrossRef] [Green Version]
  25. Richardson, I.; Thomson, M.; Infield, D.; Clifford, C. Domestic electricity use: A high-resolution energy demand model. Energy Build. 2010, 42, 1878–1887. [Google Scholar] [CrossRef] [Green Version]
  26. Andersen, R.; Fabi, V.; Toftum, J.; Corgnati, S.P.; Olesen, B.W. Window opening behaviour modelled from measurements in Danish dwellings. Build. Environ. 2013, 69, 101–113. [Google Scholar] [CrossRef]
  27. Hagen, H. Byggforsk 552.103 Heating of dwellings. Energy consumption and cost. 1990. Available online: https://www.byggforsk.no/dokument/519/oppvarming_av_boliger_energiforbruk_og_kostnader (accessed on 12 March 2020).
  28. Energy Performance of Buildings—Part 1: Impact of Building Automation, Controls and Building Management; EN 15232-1:2017; European Committee for Standardization: Brussels, Belgium, 2017.
  29. Peeters, L.; De Dear, R.; Hensen, J.; D’haeseleer, W. Thermal comfort in residential buildings: Comfort values and scales for building energy simulation. Appl. Energy 2009, 86, 772–780. [Google Scholar] [CrossRef] [Green Version]
  30. Energy Performance of Buildings—Ventilation for Buildings–Part 1: Indoor Environmental Input Parameters for Design and Assessment of Energy Performance of Buildings Addressing Indoor Air Quality, Thermal Environment, Lighting and Acoustics; EN 16798-1; European Committee for Standardization: Brussels, Belgium, 2019.
  31. Criteria for Passive Houses and Low Energy Buildings—Residential Buildings; NS 3700; Standard Norge: Oslo, Norway, 2013.
  32. Lawrence Berkeley National Laboratory. GenOpt, 3.1.1. Available online: https://simulationresearch.lbl.gov/GO/ (accessed on 5 November 2019).
  33. Hamdy, M.; Hasan, A.; Siren, K. A multi-stage optimization method for cost-optimal and nearly-zero-energy building solutions in line with the EPBD-recast 2010. Energy Build. 2013, 56, 189–203. [Google Scholar] [CrossRef]
  34. Jensen, A.R.; Olle, R. Norwegian Pricebook 2018; Norconsult Informasjonssystemer AS: Sandvika, Norway; Bygganalyse AS: Oslo, Norway, 2018. [Google Scholar]
  35. Statistics Norway. Energy Consumption in Households. Available online: https://www.ssb.no/en/energi-og-industri/statistikker/husenergi (accessed on 12 March 2020).
Figure 1. Proposed research methodology. LCC: life cycle cost.
Buildings 10 00200 g001
Figure 2. Models of the single-family house (left) and apartment block (right), created in IDA-ICE.
Buildings 10 00200 g002
Figure 3. Floor plans of the single-family house.
Buildings 10 00200 g003
Figure 4. Floor plan of the apartment block.
Buildings 10 00200 g004
Figure 5. Occupancy patterns on weekdays (top) and weekends (bottom) for each room function.
Buildings 10 00200 g005
Figure 6. Macro for window-opening behavior created in IDA-ICE.
Buildings 10 00200 g006
Figure 7. Minimization of the objective function in the simulation-based optimization (i.e., IDA ICE plus GenOpt).
Buildings 10 00200 g007
Figure 8. Parametric analysis results—indoor discomfort degree hours (occupied) versus energy consumption. ASHP: air source heat pump.
Buildings 10 00200 g008
Figure 9. Parametric analysis results: difference in life cycle cost (dLCC) versus the energy consumption of building automation control strategies (BACS) (a) in a single-family house and (b) in representative apartments.
Buildings 10 00200 g009
Figure 10. Results of single-objective optimization runs: energy consumption versus the associated difference in life cycle cost, where the optimal retrofitting combinations are marked on the pareto fronts.
Buildings 10 00200 g010
Figure 11. Results of the single-objective optimization runs: energy consumption versus the associated difference in life cycle cost estimated for the apartment block, with the optimal retrofitting combinations marked on the pareto fronts.
Buildings 10 00200 g011
Figure 12. Discomfort degree hours of the optimal retrofitting combinations.
Buildings 10 00200 g012
Table 1. Input parameters for the energy performance characteristics of the reference models.
ParameterReference “Original”:
Reference Models Built between 1969 and 1985 before Retrofitting
Reference “TEK 17”:
Reference Models according to the Minimum Energy Performance Requirements 1 in TEK 17 [20]
U-value external wall (W/(m2K))0.38 20.22
U-value roof (W/(m2K))0.20 20.18
U-value basement wall (W/(m2K))0.81 30.22
U-value basement floor (W/(m2K))0.36 20.18
U-value windows (W/(m2K))2.8 41.2
Infiltration rate (h−1) 4.0 41.5
Normalized thermal bridge value (W/(m2K))0.07/0.13 4
Specific fan power (kW/(m3s))2.0 4
1 These requirements are in addition to a requirement for maximum delivered energy. 2 Typical values for residential buildings built in 1971–1980 [16]. 3 Minimum requirements for walls belowground given in 1969–1985 [21]. 4 Recommended input values for single-family houses and apartments, respectively, built in 1969–1985 [18].
Table 2. Definition and setpoints for the building automation control strategies (BACS), based on the descriptions in EN 15232 [28].
ClassHeating ControlVentilation ControlLighting ControlBlind Control
DProportional–integral (PI) control with a constant temperature setpoint (22 °C)Constant air volume (CAV) with a constant supply air temperature setpoint (18 °C)Manual on/off lighting controlManual control
CProportional–integral (PI) control with a variable temperature setpoint depending on room function with night setback (variable)Variable air volume (VAV) with day/nighttime schedule and a constant supply air temperature setpoint (18 °C)As level DAs level D
BProportional–integral (PI) control with occupancy detection and a variable temperature setpoint depending on room function with night setback (variable) and extreme setback (16 °C) when the house is not occupiedVariable air volume (VAV) with a day/nighttime schedule and a variable supply air temperature setpoint (16–18 °C)Automatic on/off control with a day/night schedule, sweeping extinction signal (23:00–06:00) and automatic off-switch when enough daylight (>200 lux) is presentAutomatic control based on incoming solar radiation (active when >200 W/m2)
AProportional–integral (PI) control with demand detection and a variable temperature setpoint depending on room function with night setback (variable) and extreme setback (16 °C) when the zone is not occupiedVariable air volume (VAV) based on demand and with a variable supply air temperature setpoint (16–18 °C) with setback for when the house is not occupied (14–16 °C)Automatic control with dimming following a day/night schedule, sweeping extinction signal = (23:00–06:00) and automatic off-switch when enough daylight (>200 lux) is present and/or when the room is not occupiedAs level B
Table 3. Solution space with the design variables for the optimization process.
Design VariableSingle-Family HouseApartment Block
Options RangeStep SizeNr. of StepsOptions RangeStep SizeNr. of Steps
Building Envelope optionsInsulation thickness external walls (m)0.2…0.40.0550.2…0.40.055
Insulation thickness roof (m)0.25…0.40.0540.2…0.40.055
Insulation thickness basement walls (m)0.15…0.30.054
Insulation thickness basement floor (m)0.1…0.350.056
Infiltration rate (h−1)0.6…1.5110.6…1.511
Normalized thermal bridge value (W/(m2K))0.03…0.05110.05…0.0711
-OptionsNr. of optionsOptionsNr. of options
Windows (t = 0.7, g = 0.5)U = 1.2 W/(m2K)
U = 0.8 W/(m2K)
2U = 1.2 W/(m2K)
U = 0.8 W/(m2K)
2
Automation levelsHeating controlLevel D
Level C
Level B
Level A
4Level D
Level C
Level B
Level A
4
Ventilation controlLevel D
Level C
Level B
Level A
4Level D
Level C
Level B
Level A
4
Lighting controlLevel D (and C)
Level B
Level A
3Level D (and C)
Level B
Level A
3
Solar shading controlLevel D (and C)
Level B (and A)
2Level D (and C)
Level B (and A)
2
Total possible combinations 115,200 4800
1 The normalized thermal bridge value and the infiltration rate were a function of the insulation levels. These values improved when the insulation levels increased.
Table 4. Reference values for upper and lower limits of the continuous variables.
ParameterTEK 17 Minimum Energy Performance Requirements [20]TEK 17 Energy-Saving Requirements [20]Norwegian Passive House Criteria [31]
U-value external wall (W/(m2K))≤0.22≤0.180.10–0.12 1
U-value roof (W/(m2K))≤0.18≤0.130.08−0.09 1
U-value basement wall (W/(m2K))≤0.22≤0.180.10−0.12 1
U-value basement floor (W/(m2K))≤0.18≤0.100.08 1
U-value windows (W/(m2K))≤1.2≤0.8≤0.8
Infiltration rate (h−1)≤1.5≤0.6≤0.6
Normalized thermal bridge value (W/(m2K))≤0.05/0.070.03
Specific fan power (kW/(m3s))≤1.5≤1.5
Ventilation heat recovery (%)≥ 80≥ 80
1 Recommended U-values for building components, not minimum requirements.
Table 5. Lower and upper limits for evaluating the thermal comfort [29]. PPD: percentage of people dissatisfied.
RoomLower Limit (PPD = 20%)Upper Limit (PPD = 20%)
Bedrooms T b e d , l = max   16 ,   T b e d , n 2.1 T b e d , u = min 26 ,   T b e d , n + 4.9
Bathrooms, living rooms and other rooms T o t h e r , l = max   18 ,   T o t h e r , n 2.1 T o t h e r , u = T o t h e r , n + 4.9
Table 6. Validation of the single-family house model (SF) and representative apartments (AP) before retrofitting. HVAC: heating, ventilation and air conditioning.
Energy-NS 3031TypicalNS 3031 Reference ValuesTypical Reference Values 1Statistical Reference Values 2
Space heating
(kWh/m2 year)
SF118.0160.4---
AP76.9129.8
HVAC aux
(kWh/m2 year)
SF7.67.6---
AP7.17.1
Lighting
(kWh/m2 year)
SF11.411.911.4 [18]--
AP11.511.7
Equipment
(kWh/m2 year)
SF17.417.717.5 [18]--
AP17.517.6
Total energy consumption
(kWh/m2 year)
SF179.0222.1-225196.8
AP137.9191.1-165–190153.9
1 The typical value is 165 kWh/m2 year for apartment blocks built in 1970–1980 and 190 kWh/m2 year for apartment blocks built before 1970 [16]. 2 Estimated statistical reference based on statistics of the energy consumption for each built year and the energy consumption for each housing typology, weighed for the number of houses in each typology and built year [35].
Table 7. Energy savings achieved by implementing BACS in a single-family house and apartment block with direct electricity as a space-heating source.
Direct Electricity Single-Family HouseRepresentative Apartments
Space HeatingAHU Heating and FansLightingTotalSpace HeatingAHU Heating and FansLightingTotal
Model D (kWh/m2)84.410.711.4148.679.015.011.4147.8
Energy consumption compared to model D
Heating, level C78%106%100%88%62%105%100%80%
Heating, level B76%109%100%87%62%107%100%81%
Heating, level A72%123%100%86%61%109%100%80%
Ventilation, level C100%86%100%99%102%85%100%100%
Ventilation, level B105%74%100%101%110%66%100%102%
Ventilation, level A106%65%100%101%110%66%100%102%
Lighting, level B102%100%65%98%100%100%65%97%
Lighting, level A105%101%39%98%102%101%45%97%
Blinds, level A101%100%100%100%99%100%100%100%
Complete level C79%91%100%87%62%90%100%79%
Complete level B86%77%64%86%69%70%61%78%
Complete level A86%72%39%84%70%71%40%76%
Table 8. Energy savings achieved by implementing BACS in a single-family house and apartment block with direct electricity and an air source heat pump as space-heating sources.
Direct Electricity with an Air Source Heat Pump Single-Family HouseRepresentative Apartments
Space HeatingAHU Heating and FansLightingTotalSpace HeatingAHU Heating and FansLightingTotal
Model D (kWh/m2)48.714.111.4116.352.917.211.4123.9
Energy consumption compared to model D
Heating, level C79%99%100%91%60%102%100%83%
Heating, level B80%100%100%92%63%103%100%85%
Heating, level A74%109%100%90%62%104%100%84%
Ventilation, level C99%89%100%98%101%87%100%99%
Ventilation, level B106%82%100%100%107%71%100%99%
Ventilation, level A104%78%100%99%108%71%100%99%
Lighting, level B101%101%65%97%98%100%65%96%
Lighting, level A105%102%39%96%101%101%45%95%
Blinds, level A100%100%100%100%99%100%100%100%
Complete level C79%88%100%90%60%88%100%81%
Complete level B87%78%64%88%70%71%61%79%
Complete level A85%77%39%85%72%72%40%79%
Table 9. Optimal combinations of envelope retrofitting and building automation control strategies for the single-family house with direct electricity. dLCC: difference in life cycle cost.
NameEnergy (kWh/m2 Year)dLCC (€/m2)Insulation Thickness (m)U-Value Glazing (W/m2K)Control Strategies Class
External WallRoofBasement WallFloorHeatingVentilationLightingBlinds
S-005117.573.10.350.30.150.20.8ABDD
S-256114.998.40.40.350.20.20.8ABBD
S-258112.4121.40.40.40.20.30.8ABAD
S-226111.7143.10.40.40.20.30.8ADAD
S-296111.1174.80.40.40.20.20.8ACAD
S-307110.4192.80.40.40.30.350.8ACAD
Table 10. Optimal combinations of envelope retrofitting and building automation control strategies for the single-family house with direct electricity and an air source heat pump.
NameEnergy (kWh/m2 Year)dLCC (€/m2)Insulation Thickness (m)U-Value Glazing (W/m2K)Control Strategies Class
External WallRoofBasement WallFloorHeatingVentilationLightingBlinds
S-HP-035106.633.60.250.40.20.251.2BDDD
S-HP-005101.945.90.30.30.250.150.8ABDD
S-HP-19097.357.10.350.350.250.250.8ABBD
S-HP-26294.788.60.350.40.250.250.8AAAD
S-HP-25794.662.10.40.40.20.30.8ABAD
S-HP-16493.8140.40.40.40.20.30.8ACAD
Table 11. Optimal combinations of envelope retrofitting and building automation control strategies for the representative apartments with direct electricity.
NameEnergy (kWh/m2 Year)dLCC (€/m2)Insulation Thickness (m)U-Value Glazing (W/m2K)Control Strategies Class
External WallRoofHeatingVentilationLightingBlinds
A-100120.314.10.40.31.2BCDD
A-235116.429.40.40.41.2CBBD
A-042115.446.10.350.41.2CCBB
A-046114.580.70.40.40.8ACAD
A-160114.2106.60.40.40.8AABB
A-105114.1133.90.40.40.8AAAB
Table 12. Optimal combinations of envelope retrofitting and building automation control strategies for the representative apartments with direct electricity and an air source heat pump.
NameEnergy (kWh/m2 Year)dLCC (€/m2)Insulation Thickness (m)U-Value Glazing (W/m2K)Control Strategies Class
External WallRoofHeatingVentilationLightingBlinds
A-HP-102110.827.30.40.31.2BCDD
A-HP-231107.834.60.40.31.2CBBD
A-HP-042105.557.90.350.41.2CCBB
A-HP-066103.873.20.40.41.2ABAD
A-HP-227103.189.00.40.41.2AAAD
A-HP-014102.8117.70.40.41.2AAAB
Publisher’s Note: MDPI stays neutral with regard to jurisdictional claims in published maps and institutional affiliations.

