Effect of Nanoparticle Content on the Microstructural and Mechanical Properties of Forged and Heat-Treated TiC/2219 Nanocomposites


Abstract
1. Introduction
2. Materials and Methods
3. Results and Discussion
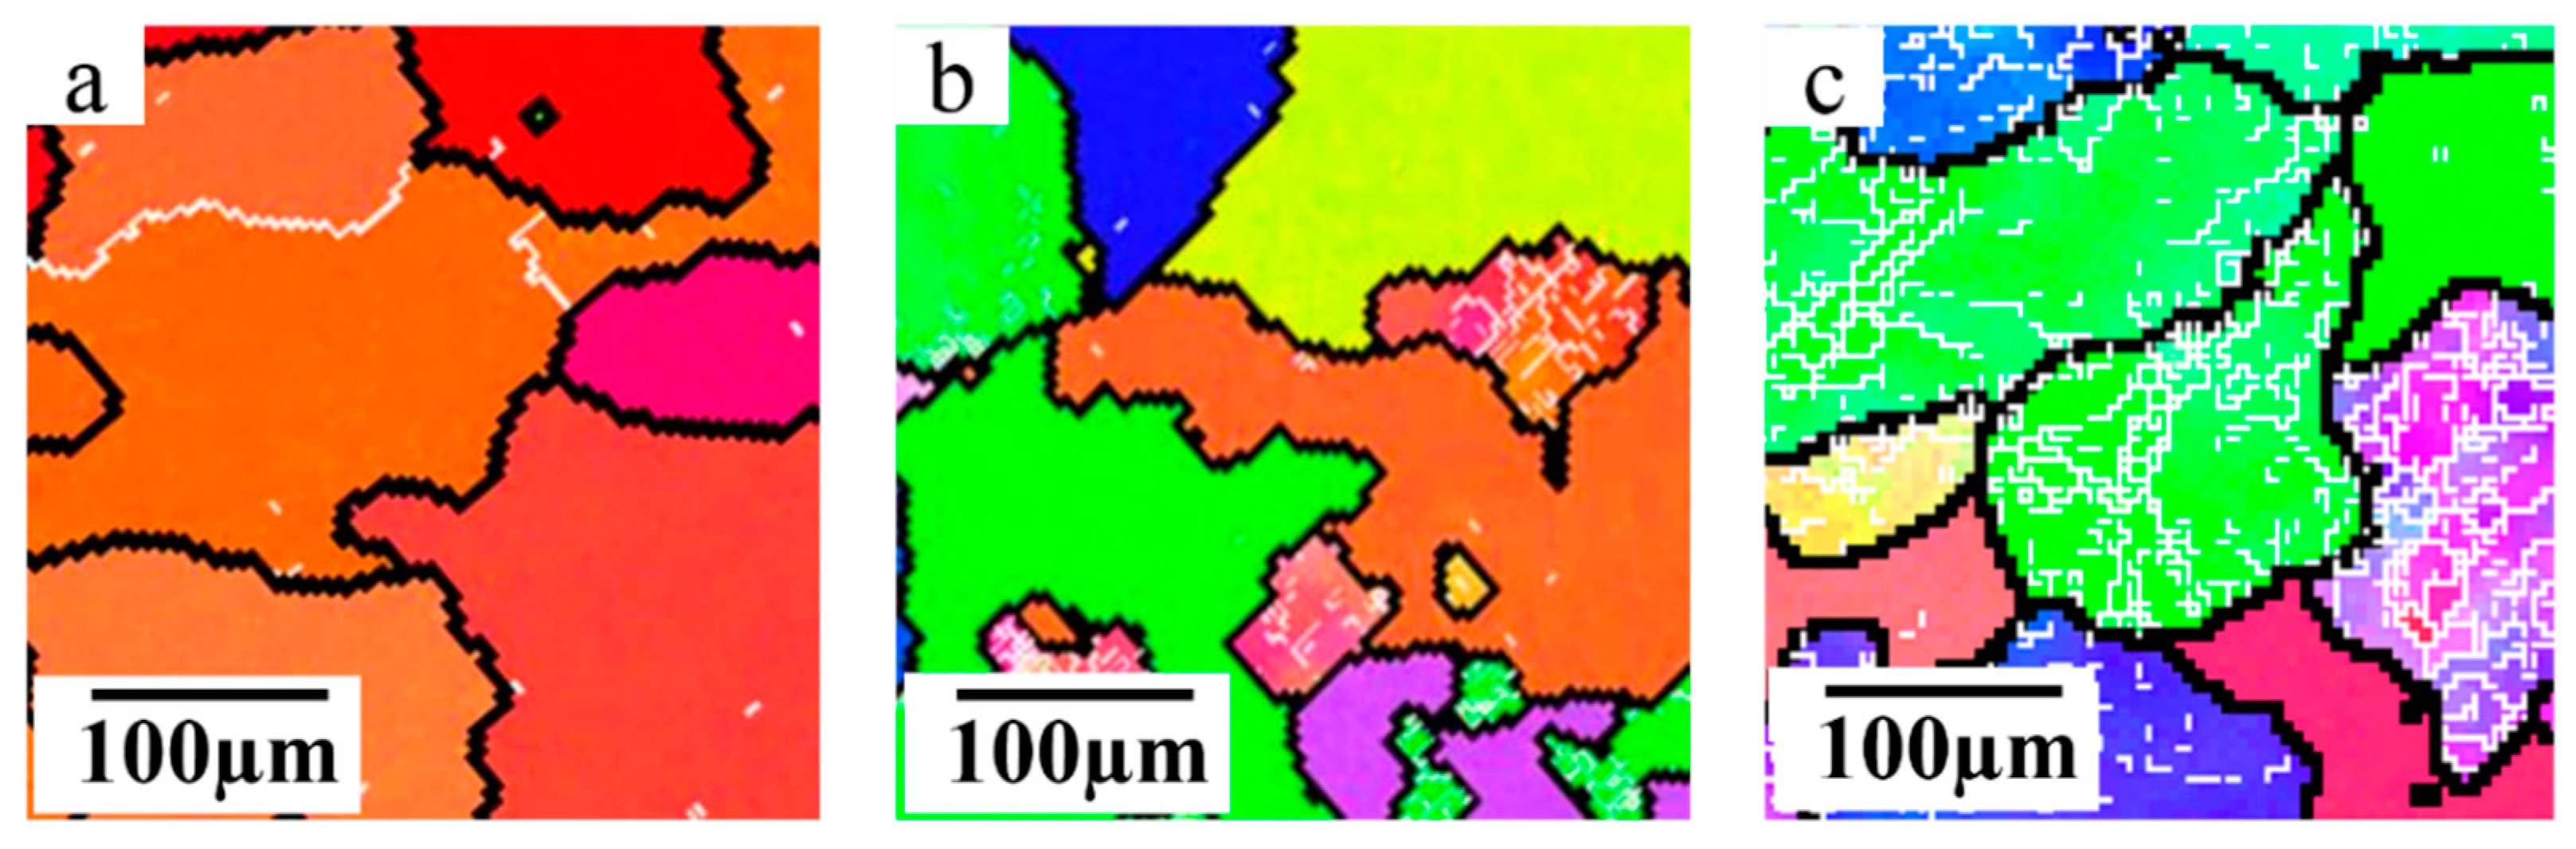
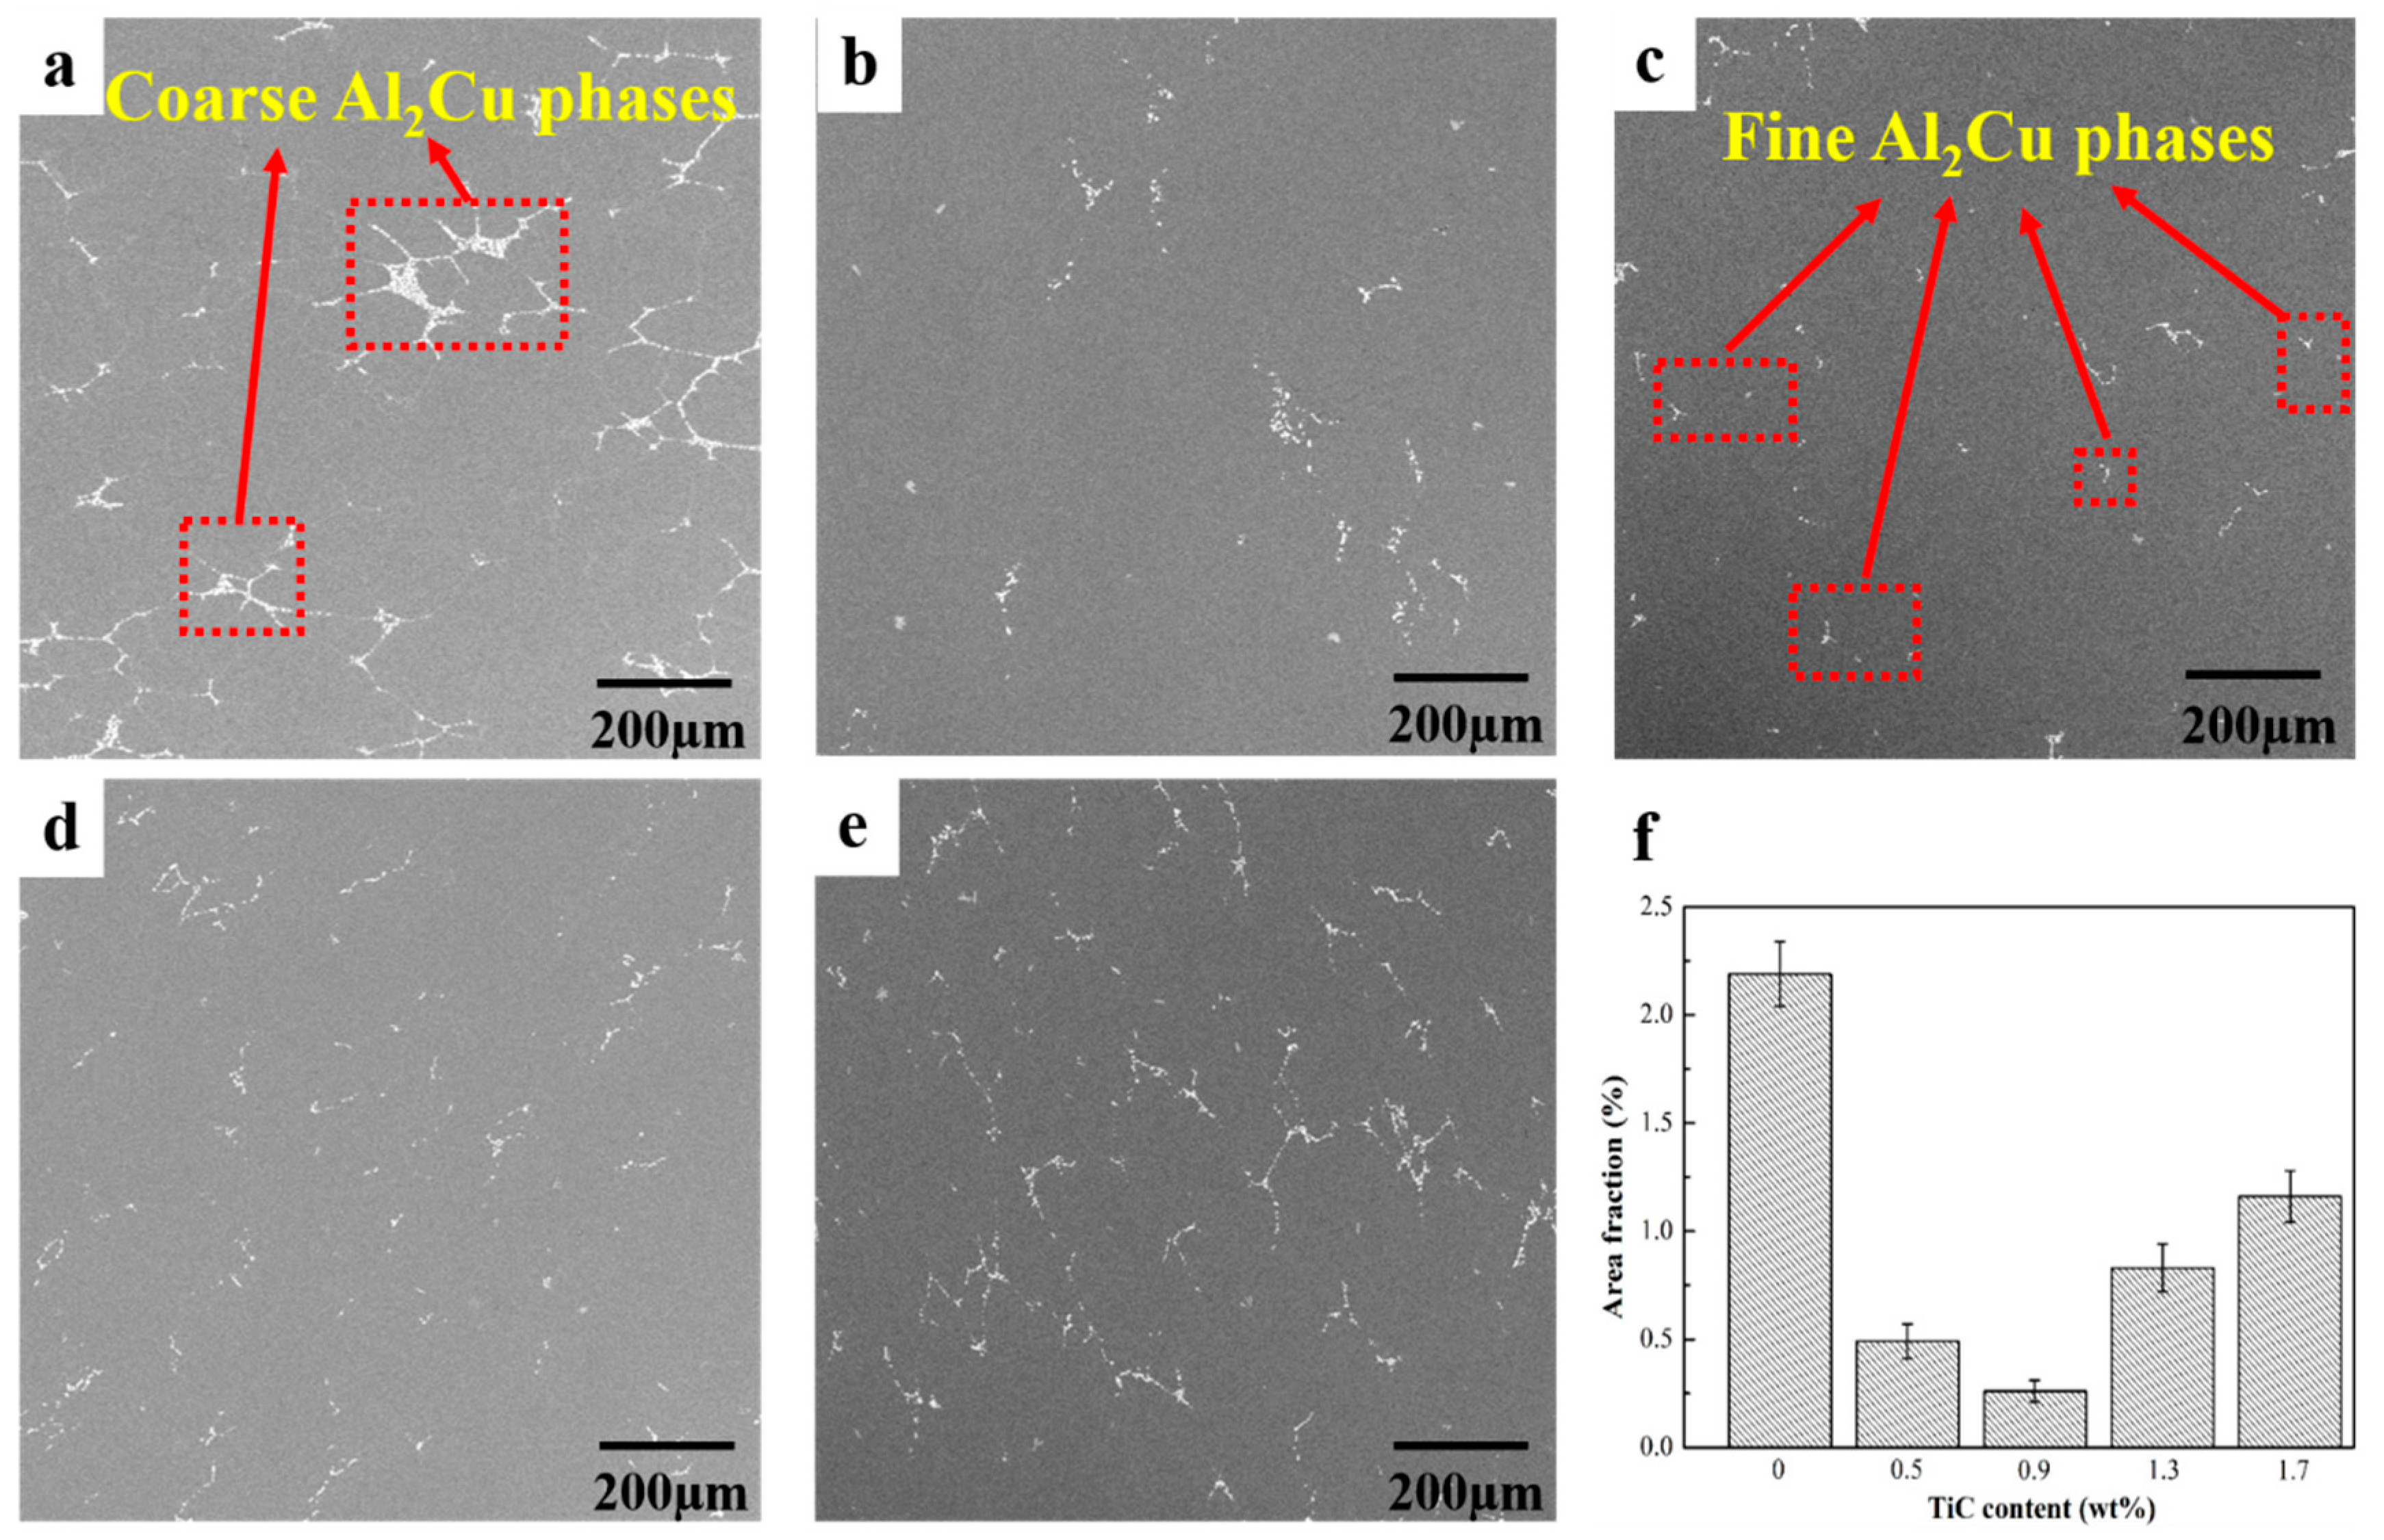
3.1. Microstructure
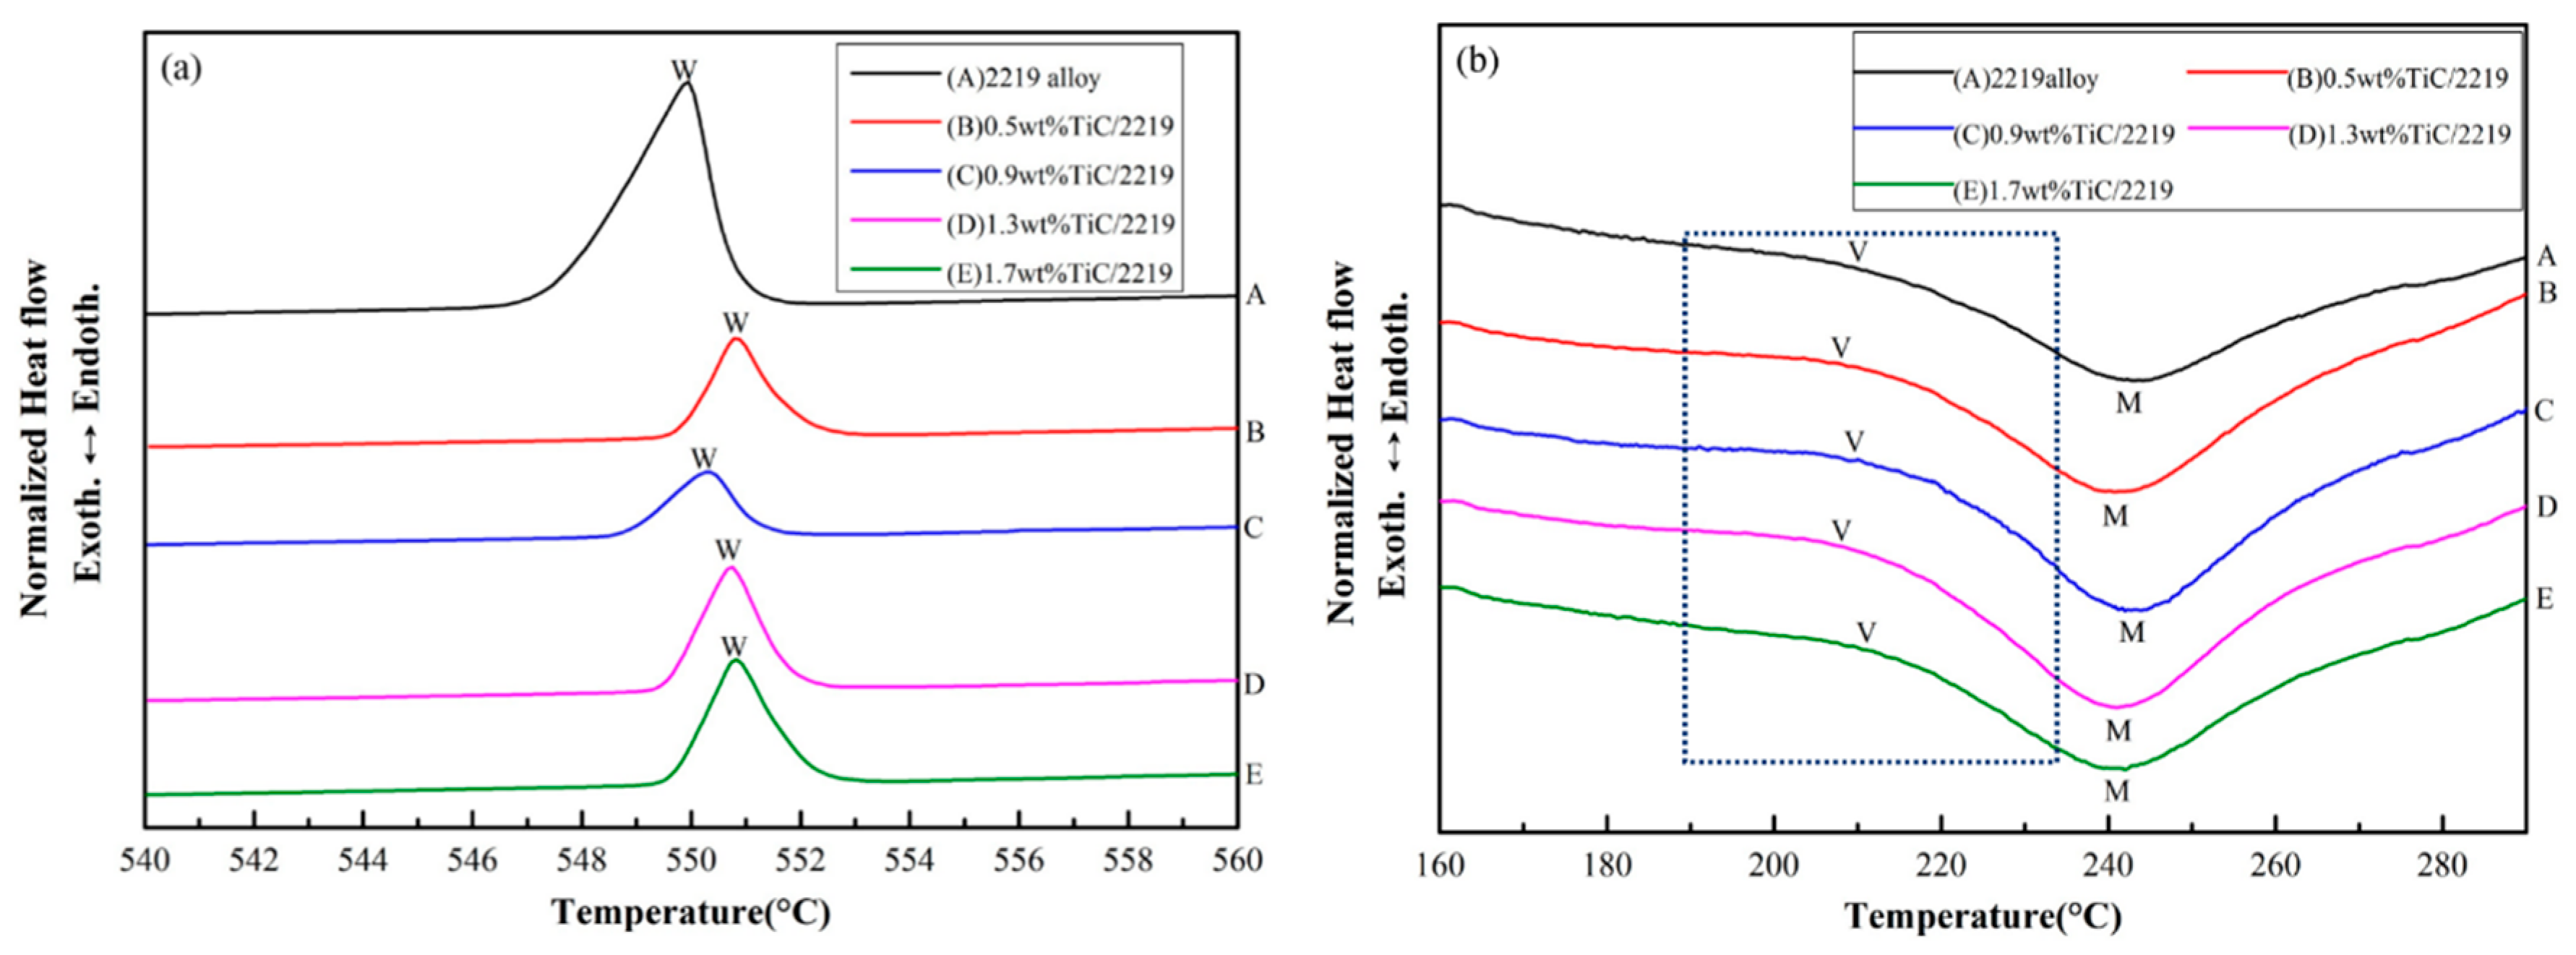
3.2. DSC Analysis
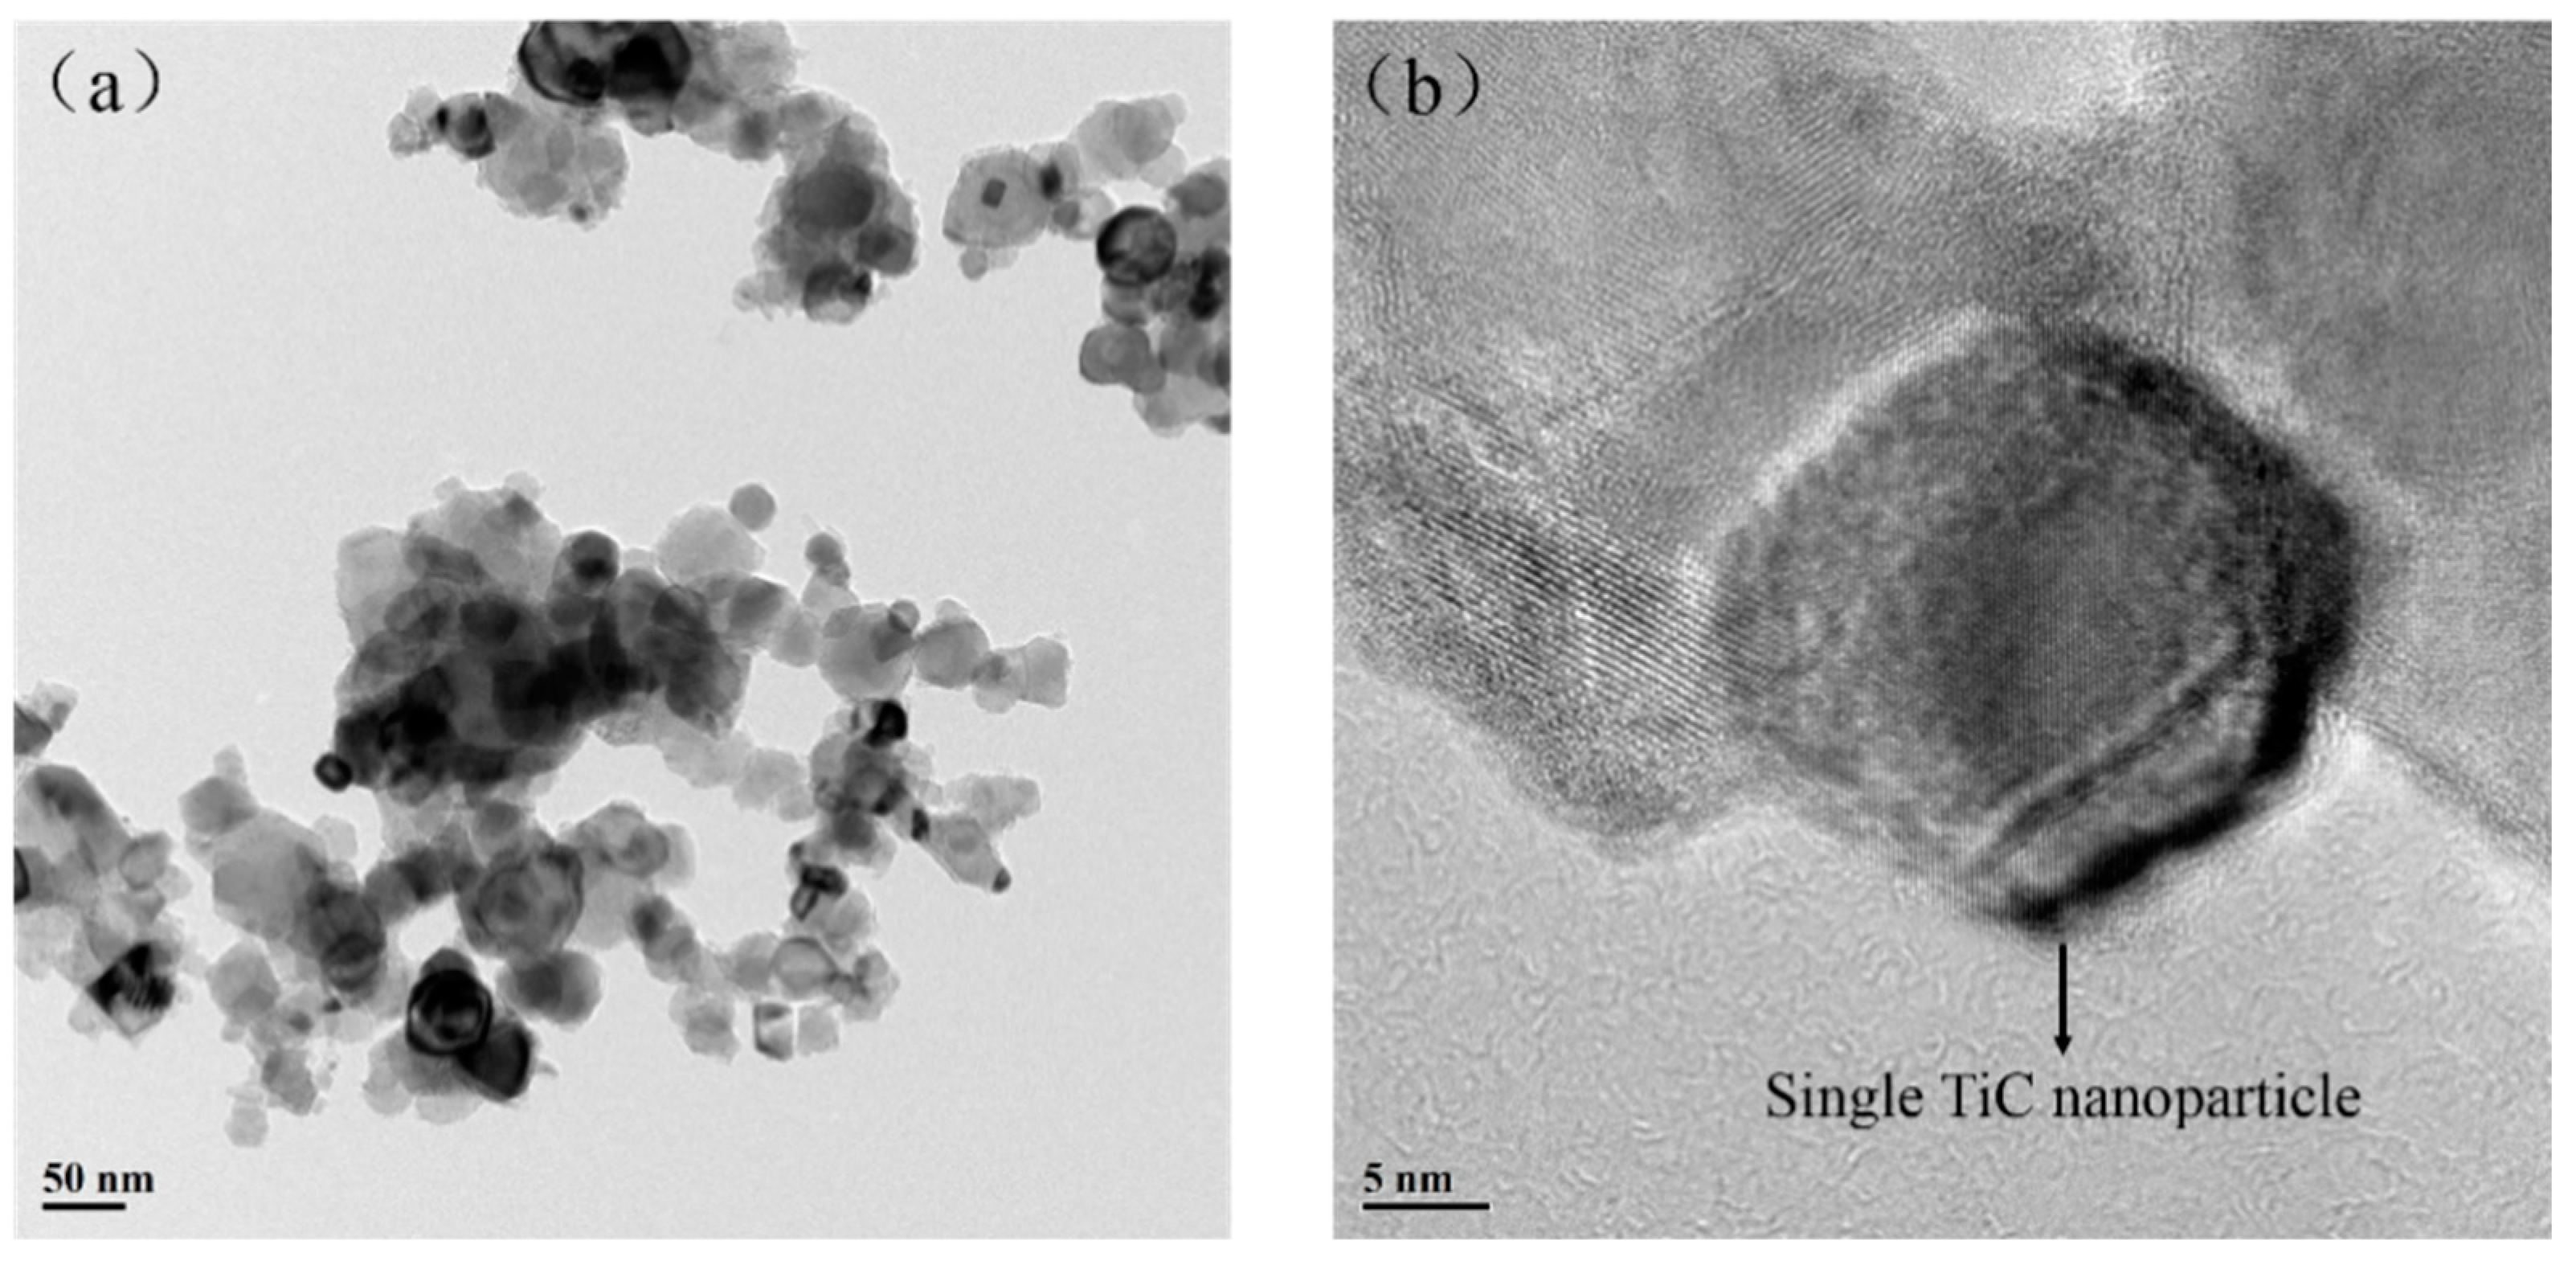
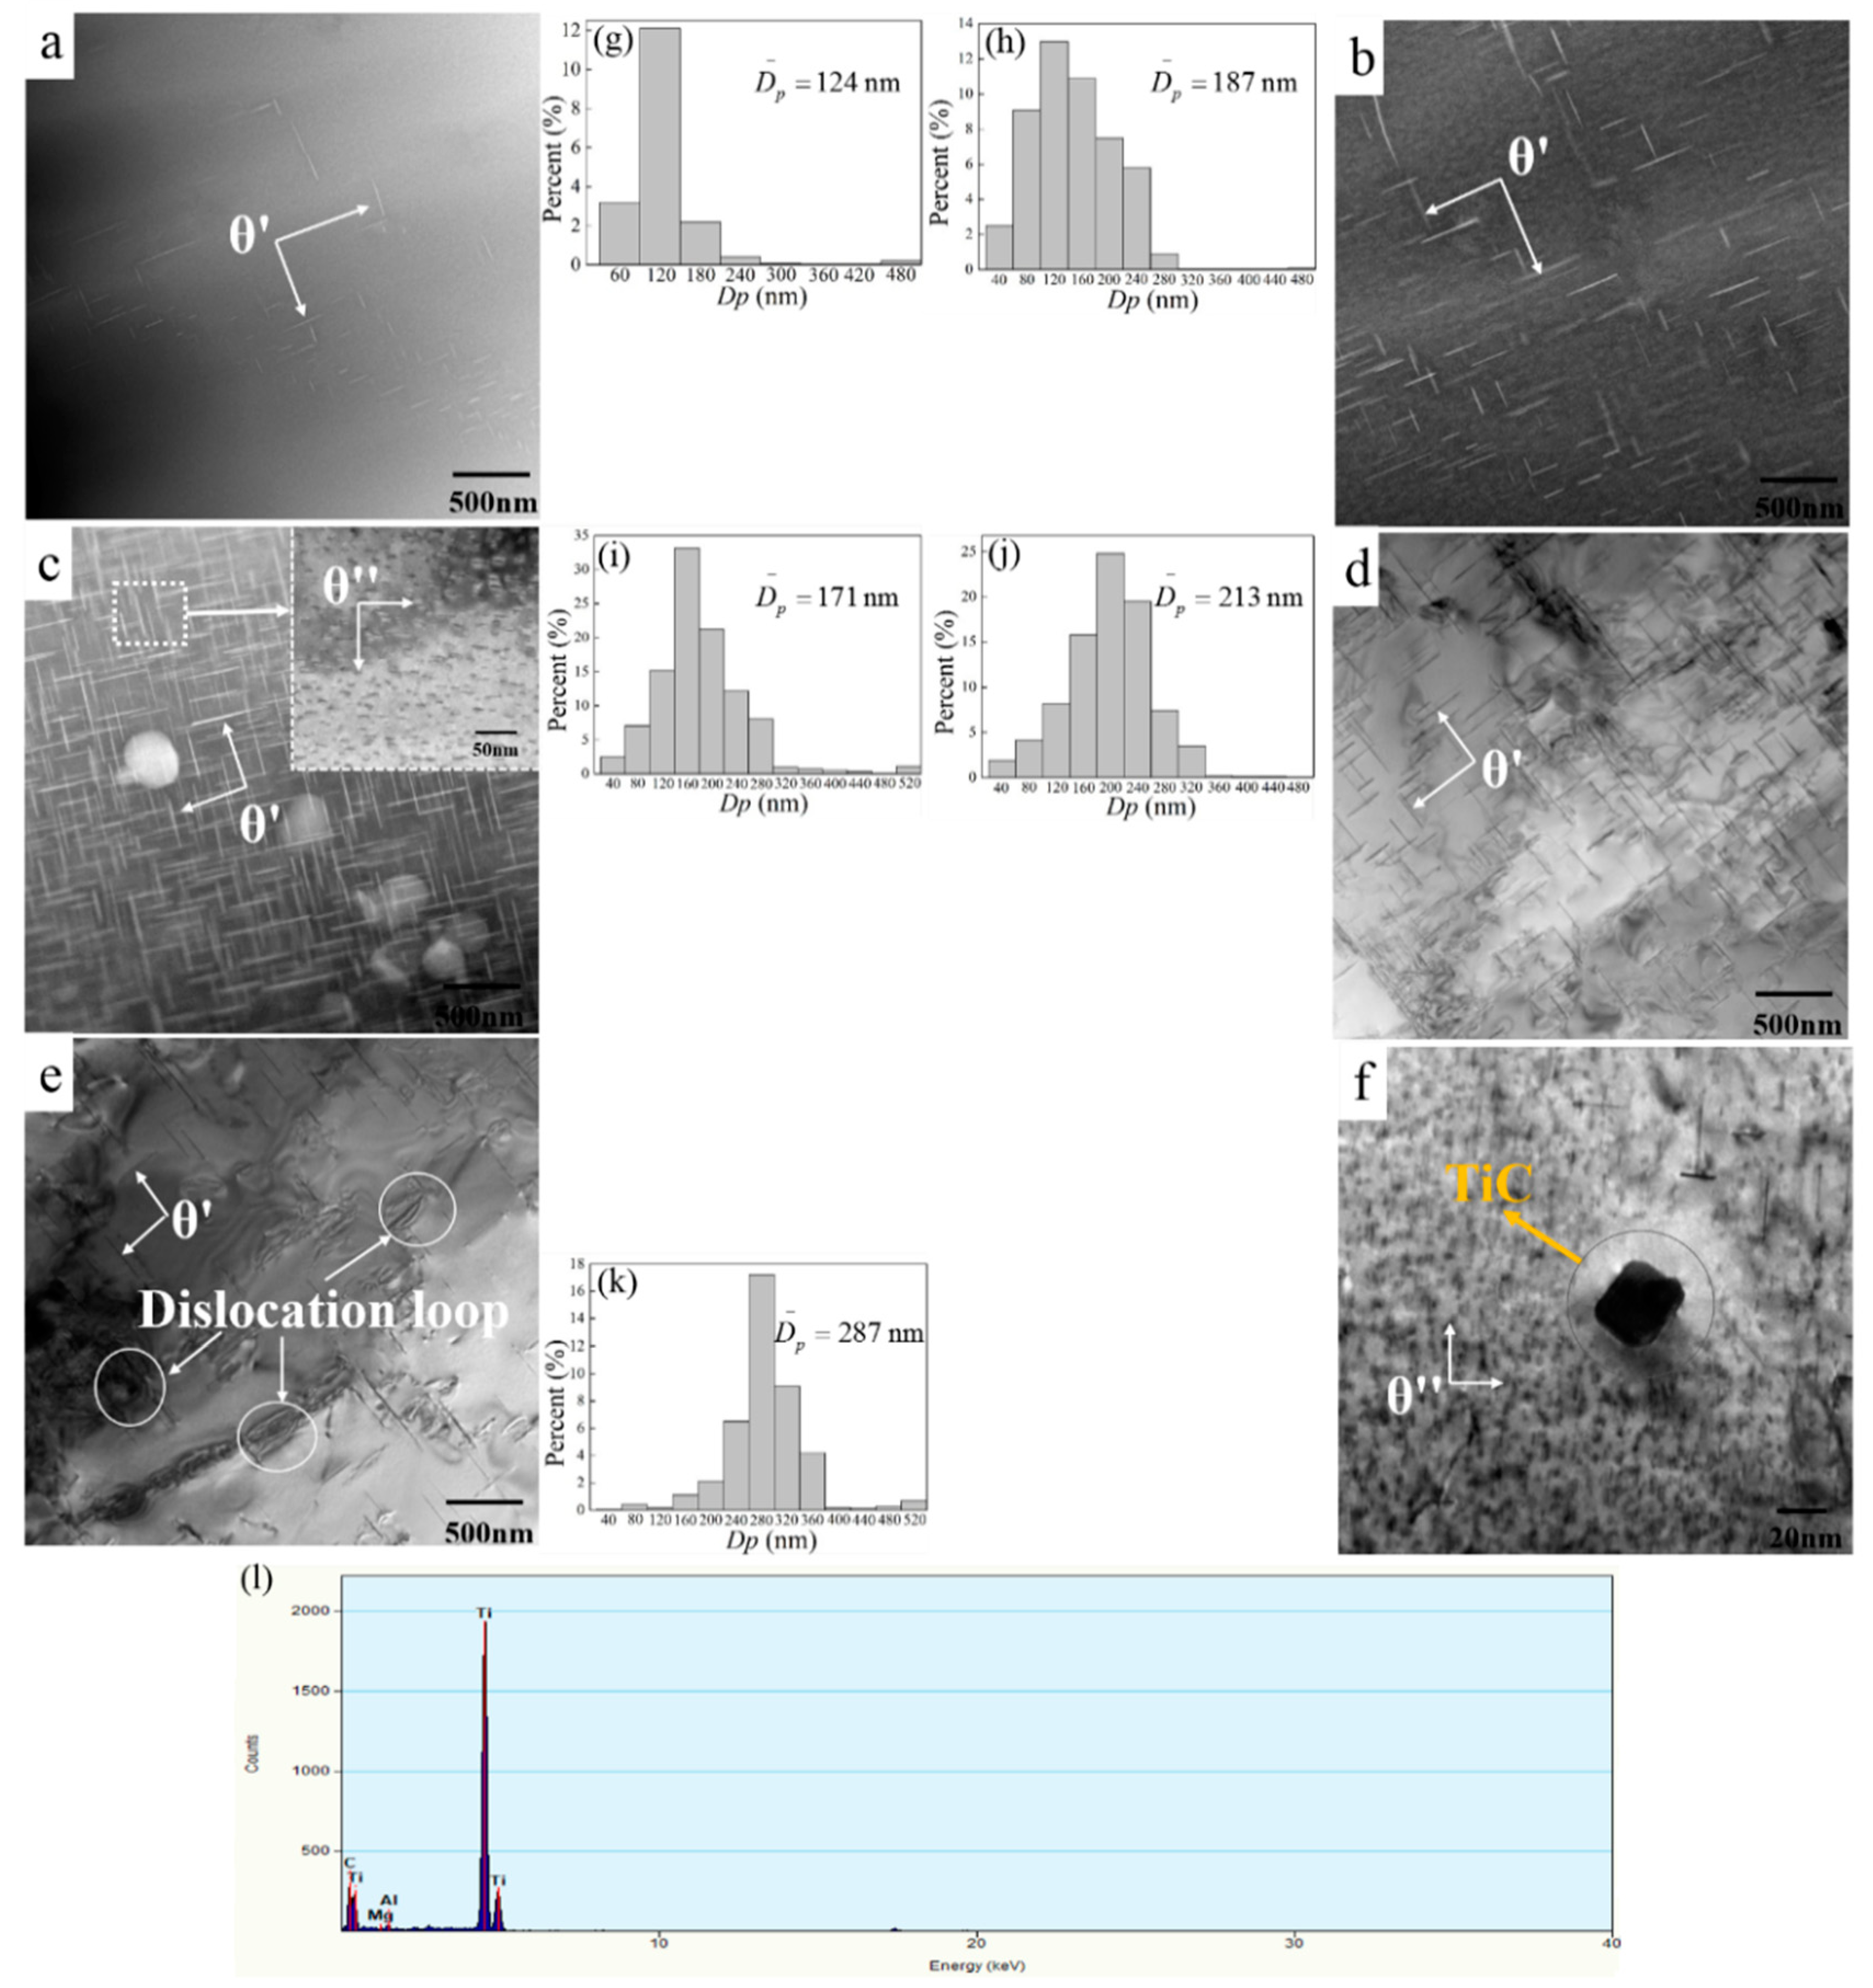
3.3. TEM Observations
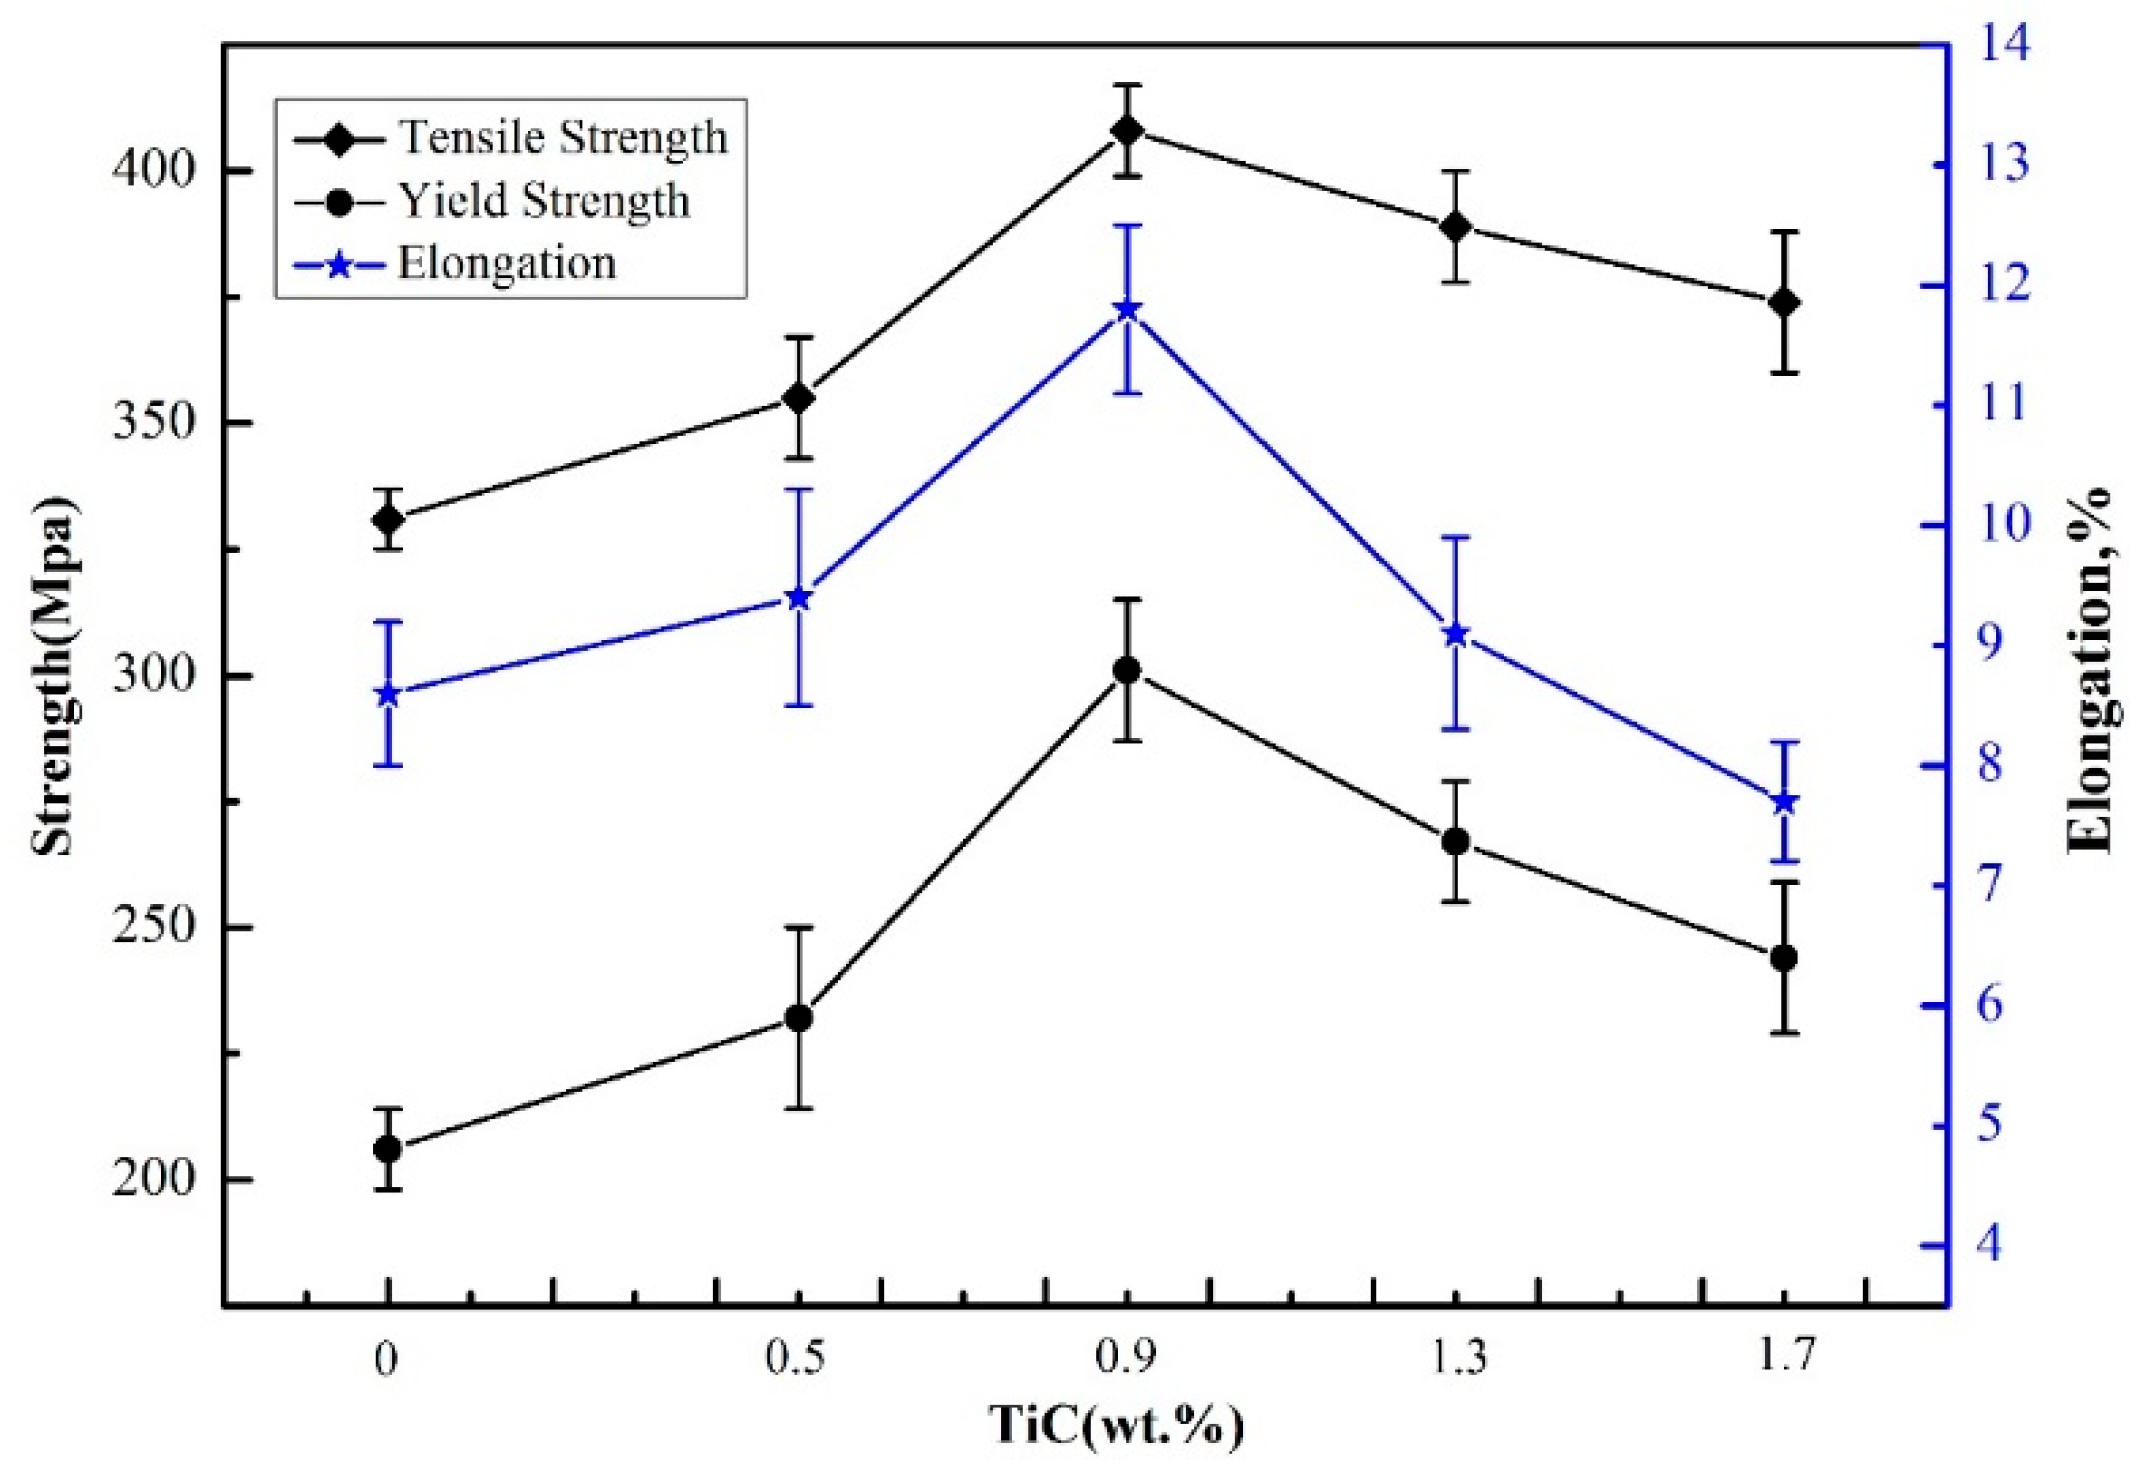
3.4. Mechanical Properties
3.5. Strengthening of TiC/2219 Nanocomposite
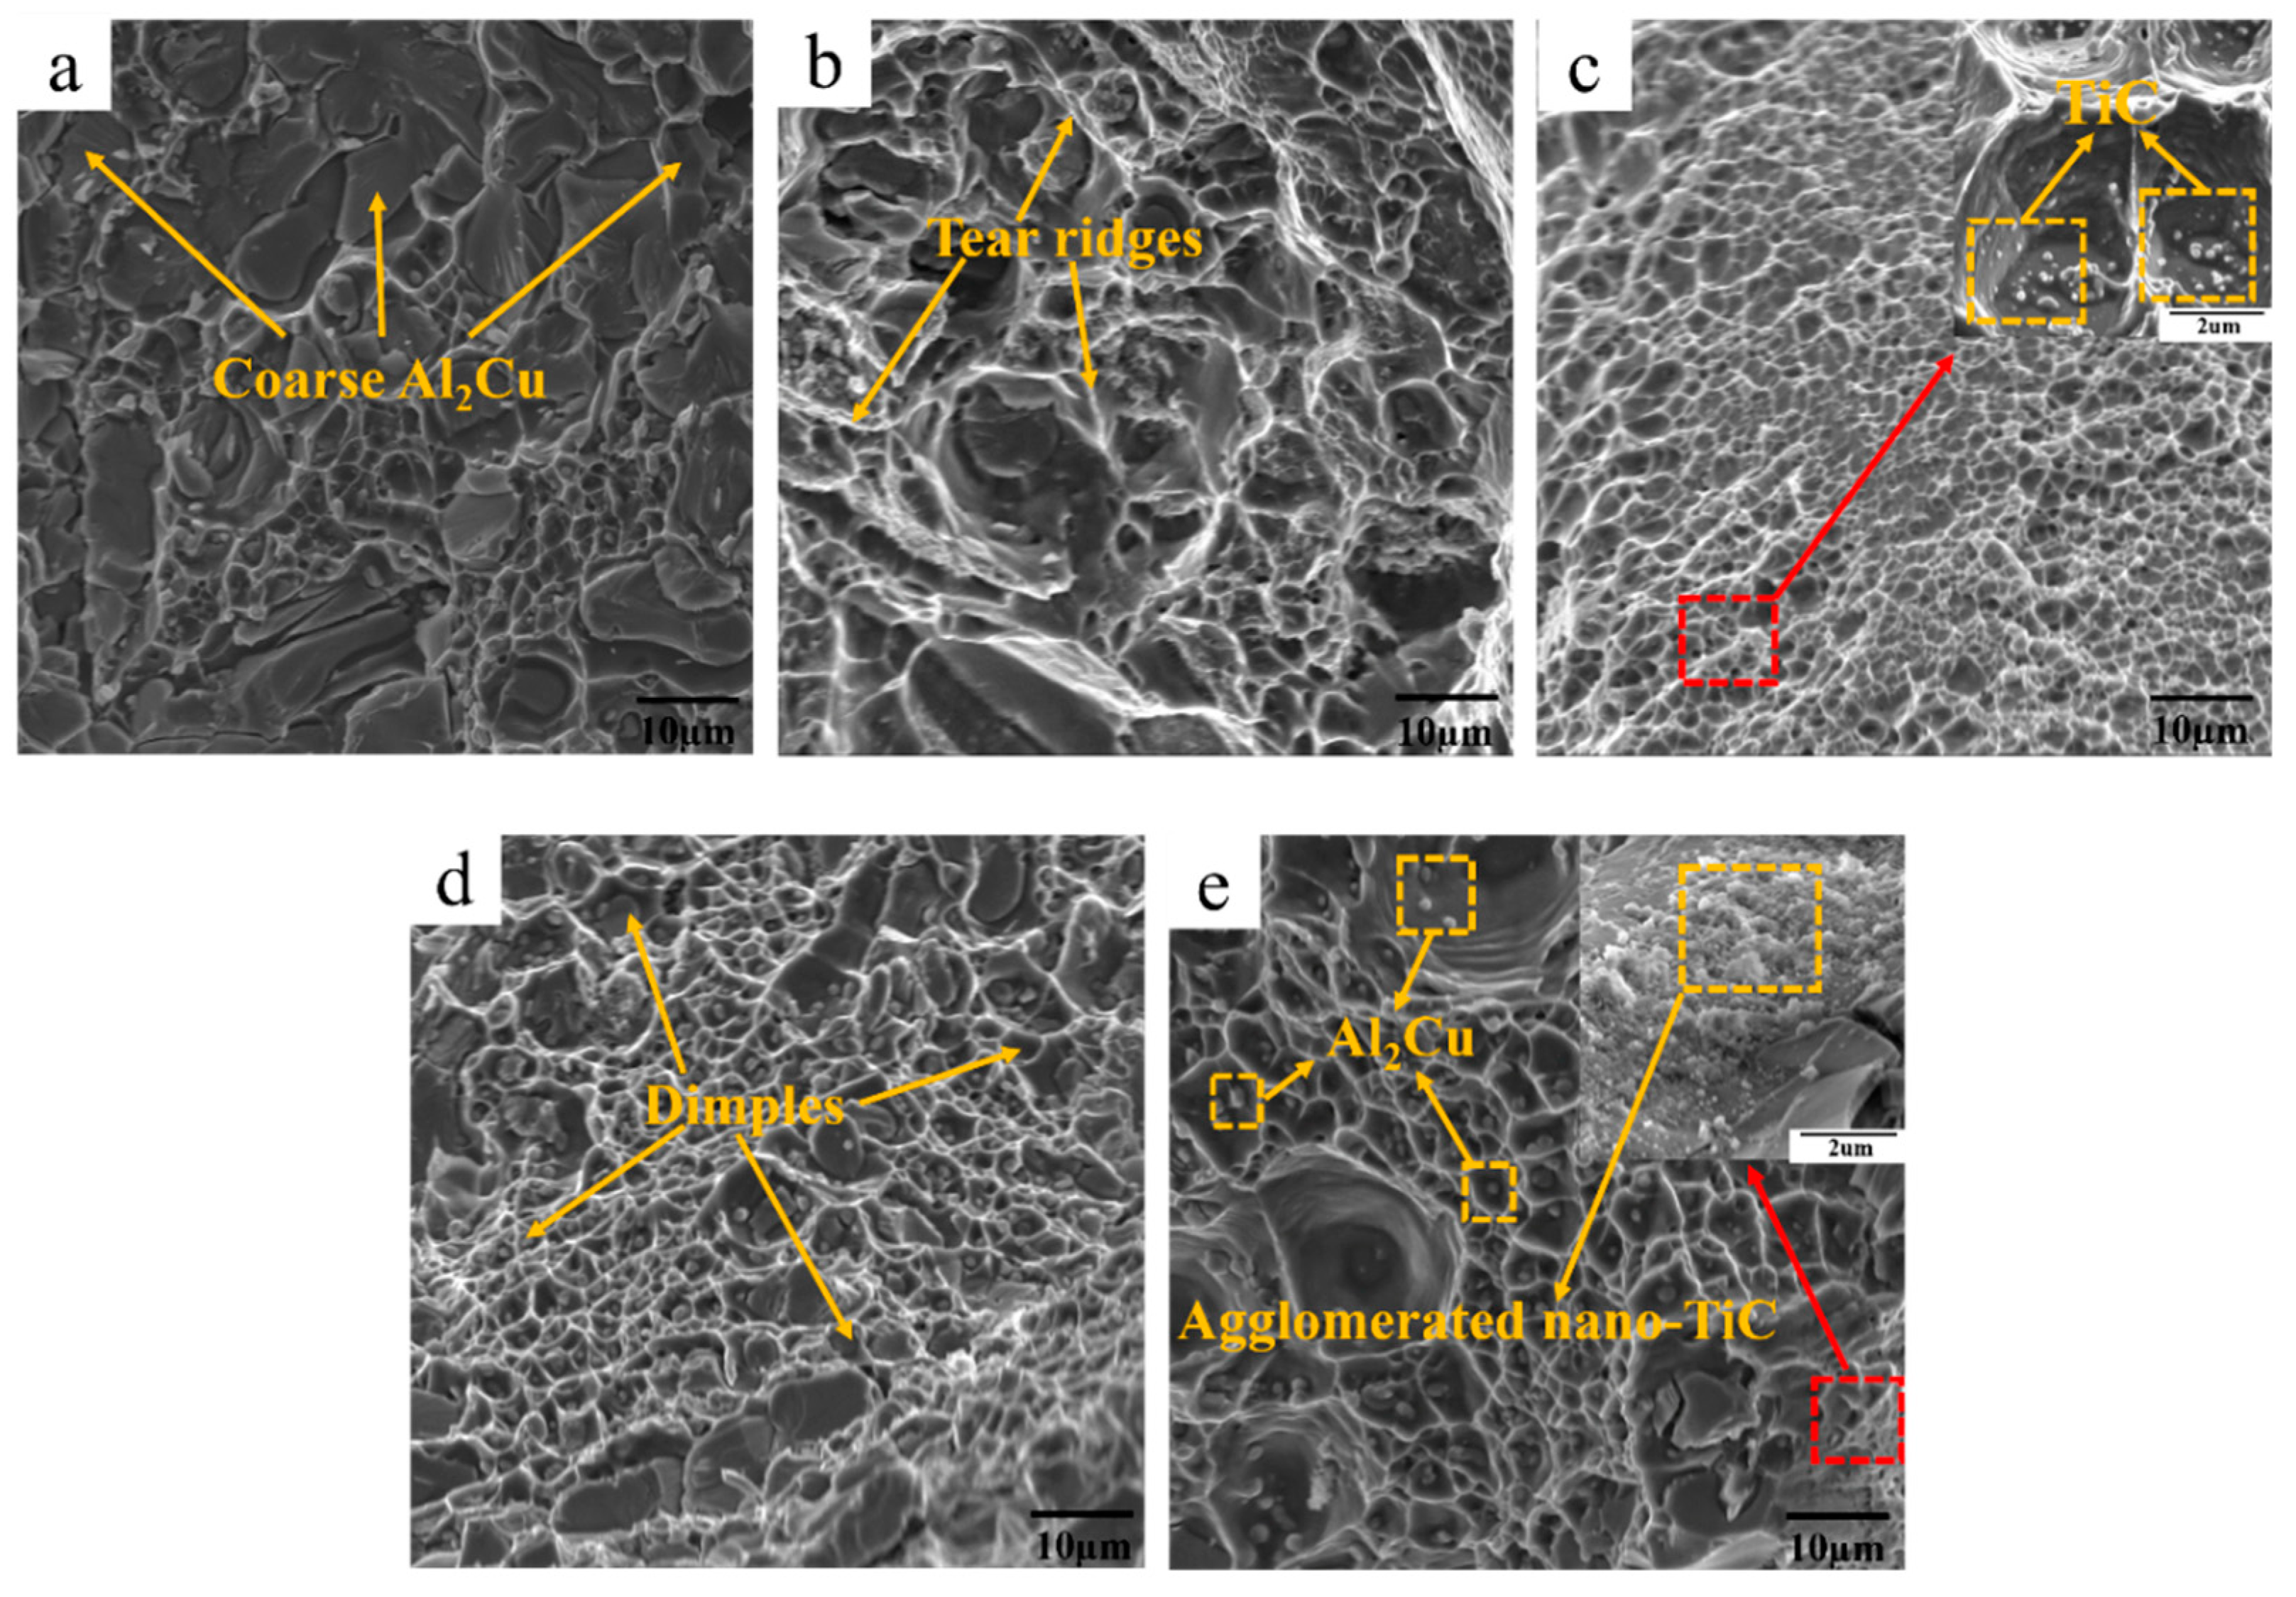
3.6. Fracture Behavior
4. Conclusions
- (1)
- After solution aging, usually very few sub-grains would exist in the matrix for the 2219 alloy. However, there were still many sub-grains in composites with 1.3 wt.% TiC and 1.7 wt.% TiC as shown in the EBSD.
- (2)
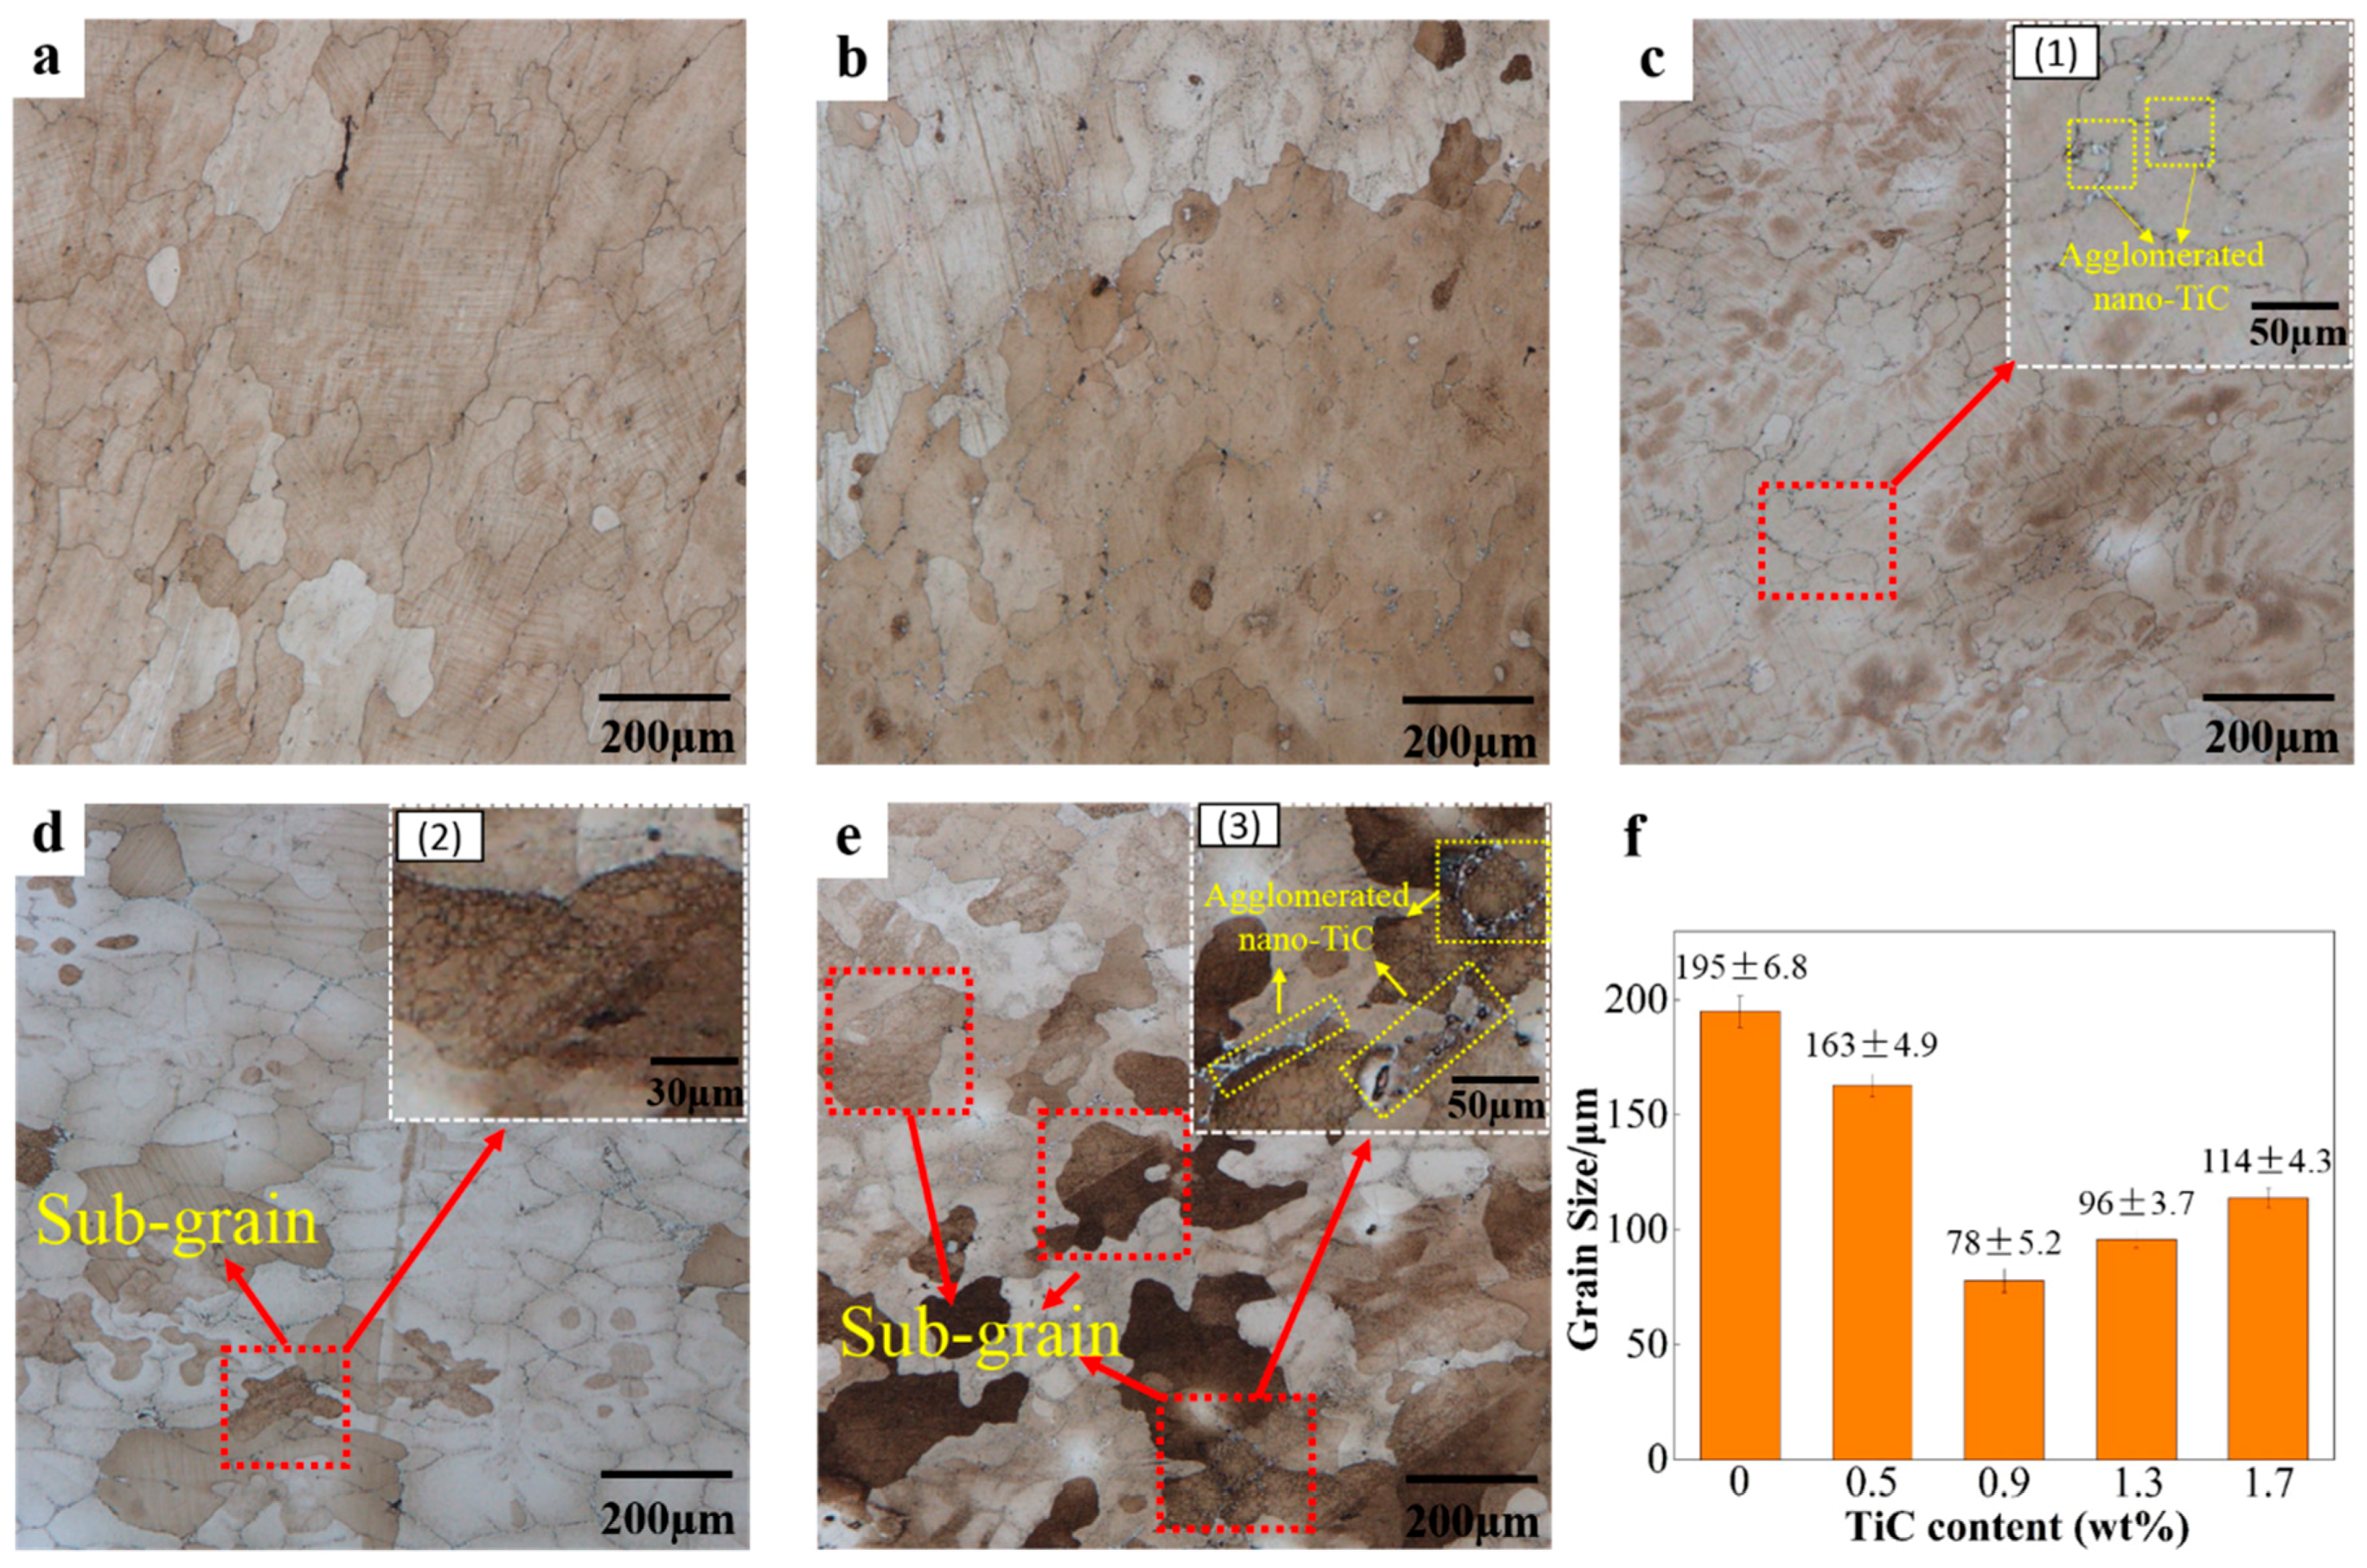
- An appropriate amount of TiC nanoparticles could promote the dissolution of Al2Cu particles during heat treatment. With increasing TiC nanoparticle content from 0 wt.% to 0.9 wt.%, the area fraction of the Al2Cu phases decreased from 2.19% to 0.26% due to dissolution into the matrix. However, with increasing TiC nanoparticle content from 1.3 wt.% to 1.7 wt.%, the area fraction of the Al2Cu phases increased from 0.83% to 1.16%.
- (3)
- For the forged and heat-treated composites, the addition of TiC nanoparticles facilitated the precipitation of θ″ and θ′ phases during aging. At a nanoparticle content of 0.9 wt.%, the largest amounts of θ″ and the θ′ phases precipitated in the matrix. However, with a further increase in TiC nanoparticles content, the precipitation of the precipitated phase was inhibited. When TiC nanoparticles entered the Al matrix, it inevitably caused crystal lattice distortion and increased the system’s energy. To maintain low system energy, more oversaturated vacancies might aggregate around the TiC nanoparticles. This was the reason for the many precipitates in the 0.9 wt.% TiC/2219 nanocomposite.
- (4)
- The mechanical properties of the forged and heat-treated 0.9 wt.% TiC/2219 nanocomposite were better than those of the 2219 alloy and other composites. The tensile strength, yield strength, and elongation of the forged 0.9 wt.% TiC/2219 nanocomposite increased by 24.2%, 46.1%, and 37.2%, respectively, than those of the forged 2219 alloy.
Author Contributions
Funding
Conflicts of Interest
References
- Jiang, J.; Dodd, B. Workability of aluminum-based metal-matrix composites in cold compression. Composites 1995, 26, 62–66. [Google Scholar] [CrossRef]
- Ibrahim, I.A.; Mohamed, F.A.; Lavernia, E.J. Particulate reinforced metal matrix composites—A review. J. Mater. Sci. 1991, 26, 1137–1156. [Google Scholar] [CrossRef]
- Vencl, A.; Bobic, I.; Arostegui, S.; Bobic, B.; Marinkovic, A.; Babic, M. Structural, mechanical and tribological properties of A356 aluminum alloy reinforced with Al2O3, Si-C and SiC + graphite particles. J. Alloy. Compd. 2010, 506, 631–639. [Google Scholar] [CrossRef]
- Yang, C.; Zhang, P.; Shao, D.; Wang, R.H.; Cao, L.F.; Zhang, J.Y.; Sun, J. The influence of Sc solute partitioning on the microalloying effect and mechanical properties of Al-Cu alloys with minor Sc addition. Acta Mater. 2016, 119, 68–79. [Google Scholar] [CrossRef]
- Wang, Z.; Xinbo, T.L.; Shao, H.H. Fabrication and properties of the TiC reinforced high-strength steel matrix composite. Int. J. Refract. Met. Hard Mater. 2016, 58, 14–21. [Google Scholar] [CrossRef]
- Hugo, M.O.; Peter, E.; Hans, K. The history of the technological progress of hardmetals. Int. J. Refract. Met. Hard Mater. 2014, 44, 148–159. [Google Scholar] [CrossRef]
- Huang, Z.Y.; Zhang, X.X.; Xiao, B.Y.; Ma, Z.Y. Hot deformation mechanisms and microstructure evolution of SiCp/2014Al composite. J. Alloy. Compd. 2017, 722, 145–157. [Google Scholar] [CrossRef]
- Wu, K.; Deng, K.K.; Nie, K.B.; Wu, Y.W.; Wang, X.J.; Hu, X.S.; Zheng, M. Microstructure and mechanical properties of SiCp/AZ91 composite deformed through a combination of forging and extrusion process. Mater. Des. 2010, 31, 3929–3932. [Google Scholar] [CrossRef]
- Ezatpour, H.R.; Sajjadi, S.A.; Sabzevar, M.H.; Huang, Y.Z. An investigation of the tensile and compressive properties of Al6061 and its nanocomposites in as-cast state and in extruded condition. Mater. Sci. Eng. A 2014, 607, 589–595. [Google Scholar] [CrossRef]
- Zhang, L.J.; Qiu, F.; Wang, J.G.; Jiang, Q.C. High strength and good ductility at elevated temperature of nano-SiCp/Al2014 composites fabricated by semi-solid stir casting combined with hot extrusion. Mater. Sci. Eng. A 2015, 626, 338–341. [Google Scholar] [CrossRef]
- Jahedi, M.; Mani, B.; Shakoorian, S.; Pourkhorshid, E.; Paydar, M.H. Deformation rate effect on the microstructure and mechanical properties of Al-SiCp composites consolidated by hot extrusion. Mater. Sci. Eng. A 2012, 556, 23–30. [Google Scholar] [CrossRef]
- Zhang, W.L.; Wang, J.X.; Yang, F.; Sun, Z.Q.; Gu, M.Y. Recrystallization kinetics of col-d-rolled squeeze-cast Al/SiC/15w composites. J. Compos. Mater. 2006, 40, 1117–1131. [Google Scholar] [CrossRef]
- Kaur, L.; Pabla, B.S.; Dhami, S.S. A review on field areas of research in forging process using FEA. Int. J. Eng. Tech. Res. 2016, 5. [Google Scholar] [CrossRef]
- Ozdemir, I.; Cocen, U.; Onel, K. The effect of forging on the properties of particulate-SiC-reinforced aluminum-alloy composites. Compos. Sci. Technol. 2000, 60, 411–419. [Google Scholar] [CrossRef]
- Bharathesha, T.P.; Rameshb, C.S.; Keshavamurthyc, R.; Verma, S.M. Effect of Hot forging on Mechanical Characteristics of Al6061-TiO2 Metal Matrix Composite. Mater. Today Proc. 2015, 2, 2005–2012. [Google Scholar] [CrossRef]
- Ceschini, L.; Minak, G.; Morri, A. Forging of the AA2618/20 vol.% Al2O3p composite: Effects on microstructure tensile properties. Compos. Sci. Technol. 2009, 69, 1783–1789. [Google Scholar] [CrossRef]
- Murty, S.V.S.N.; Rao, B.N.; Kashyap, B.P. On the hot working characteristics of 6061Al–SiC and 6061–Al2O3 particulate reinforced metal matrix composites. Compos. Sci. Technol. 2003, 63, 119–135. [Google Scholar] [CrossRef]
- Narayan, S.; Rajeshkannan, A. Hardness, tensile and impact behaviour of hot forged aluminum metal matrix composites. J. Mater. Res. Technol. 2017, 6, 213–219. [Google Scholar] [CrossRef]
- Gaisin, R.A.; Imayev, V.M.; Imayev, R.M. Effect of hot forging on microstructure and mechanical properties of near a titanium alloy/TiB composites produced by casting. J. Alloy. Compd. 2017, 723, 385–394. [Google Scholar] [CrossRef]
- Kumar, G.B.V.; Rao, C.S.P.; Selvaraj, N. Mechanical and Tribological Behavior of Particulate Reinforced Aluminum Metal Matrix Composites—A review. J. Min. Mater. Charact. Eng. 2011, 10, 59–91. [Google Scholar] [CrossRef]
- Li, R.Q.; Liu, Z.L.; Dong, F.; Li, X.Q.; Chen, P.H. Grain refinement of a large-scale Al alloy casting by introducing the multiple ultrasonic generators during Solidification. Metall. Mater. Trans. A 2016, 47, 3790–3796. [Google Scholar] [CrossRef]
- Dong, G.; Li, X.Q.; Zhang, L.H.; Ma, L.Y.; Li, R.Q. Cavitation erosion mechanism of titanium alloy radiation rods in aluminum melt. Ultrason. Sonochem. 2016, 31, 150–156. [Google Scholar] [CrossRef] [PubMed]
- Yang, Y.Y.; Liu, Z.L.; Jiang, R.P.; Li, R.Q.; Li, X.Q. Microstructural evolution and mechanical properties of the AA2219/TiC nanocomposite manufactured by ultrasonic solidification. J. Alloy. Compd. 2019, 811, 151991. [Google Scholar] [CrossRef]
- He, H.L.; Yia, Y.P.; Huang, S.Q.; Zhang, Y.X. Effects of deformation temperature on second-phase particles and mechanical properties of 2219 Al-Cu alloy. Mater. Sci. Eng. A 2018, 712, 414–423. [Google Scholar] [CrossRef]
- GB/T 228.1. Metallic Materials-Tensile Testing-Part 1: Method of Test at Room Temperature; Standards Press of China: Beijing, China, 2010. [Google Scholar]
- Hu, H.E.; Zhen, L.; Zhang, B.Y.; Yang, L.; Chen, J.Z. Microstructure characterization of 7050 aluminum alloy during dynamic recrystallization and dynamic recovery. Mater. Charact. 2008, 59, 1185–1189. [Google Scholar] [CrossRef]
- Elgallad, E.M.; Zhang, Z.; Chen, X.G. Effect of two-step aging on the mechanical properties of AA2219 DC cast alloy. Mater. Sci. Eng. A 2015, 625, 213–220. [Google Scholar] [CrossRef]
- Biswas, A.; Siegel, D.J.; Wolverton, C.; Seidman, D.N. Precipitates in Al–Cu alloys revisited: atom-probe tomographic experiments and first-principles calculations of compositional evolution and interfacial segregation. Acta Mater. 2011, 59, 6187–6204. [Google Scholar] [CrossRef]
- Ma, P.P.; Liu, C.H.; Wu, C.L.; Liu, L.M.; Chen, J.H. Mechanical properties enhanced by deformation-modified precipitation of θ′-phase approximants in an Al-Cu alloy. Mater. Sci. Eng. A 2016, 676, 138–145. [Google Scholar] [CrossRef]
- Zhou, D.S.; Qiu, F.; Jiang, Q.C. Simultaneously increasing the strength and ductility of nano-sized TiN particle reinforced Al–Cu matrix composites. Mater. Sci. Eng. A 2014, 596, 98–102. [Google Scholar] [CrossRef]
- Hardy, H.K.; Heal, T.J. Report on precipitation. Prog. Met. Phys. 1954, 5, 143–278. [Google Scholar] [CrossRef]
- Malaki, M.; Xu, W.; Kasar, A.K.; Menezes, P.L.; Dieringa, H.; Varma, R.S.; Gupta, M. Advanced metal matrix nanocomposites. Metals 2019, 9, 330. [Google Scholar] [CrossRef]
- Kim, C.S.; Sohn, I.; Nezafati, M.; Ferguson, J.; Schultz, B.F.; Bajestani-Gohari, Z.; Rohatgi, P.K.; Cho, K. Prediction models for the yield strength of particle-reinforced unimodal pure magnesium (Mg) metal matrix nanocomposites (MMNCs). J. Mater. Sci. 2013, 48, 4191–4204. [Google Scholar] [CrossRef]
- Wang, T.; Chen, Z.; Zheng, Y.; Zhao, Y.; Kang, H.; Gao, L. Development of TiB2 reinforced aluminum foundry alloy based in situ composites—Part II: Enhancing the practical aluminum foundry alloys using the improved Al-5wt.% TiB2 master composite upon dilution. Mater. Sci. Eng. A 2014, 605, 22–32. [Google Scholar] [CrossRef]
- Liu, L.; Wu, Y.; Gong, H.; Li, S.; Ahmad, A. A physically based constitutive model and continuous dynamic recrystallization behavior analysis of 2219 aluminum alloy during hot deformation process. Materials 2018, 11, 1443. [Google Scholar] [CrossRef]
- Dunand, D.C.; Mortensen, A. On plastic relaxation of thermal stresses in reinforced metals. Acta Metall. Mater. 1991, 39, 127–139. [Google Scholar] [CrossRef]
- Zhang, Q.; Chen, D.L. A model for predicting the particle size dependence of the low cycle fatigue life in discontinuously reinforced MMCs. Scr. Mater. 2004, 51, 863–867. [Google Scholar] [CrossRef]


| TiC (wt.%) | σ0.2 (MPa) | σUTS (MPa) | δf (%) |
|---|---|---|---|
| 0 | 206 | 331 | 8.6 |
| 0.5 | 232 | 355 | 9.4 |
| 0.9 | 301 | 411 | 11.8 |
| 1.3 | 267 | 389 | 9.1 |
| 1.7 | 244 | 374 | 7.7 |
© 2019 by the authors. Licensee MDPI, Basel, Switzerland. This article is an open access article distributed under the terms and conditions of the Creative Commons Attribution (CC BY) license (http://creativecommons.org/licenses/by/4.0/).
Share and Cite
Yang, Y.; Jiang, R.; Li, X.; Zhang, Y.; Li, R. Effect of Nanoparticle Content on the Microstructural and Mechanical Properties of Forged and Heat-Treated TiC/2219 Nanocomposites. Metals 2019, 9, 982. https://doi.org/10.3390/met9090982
Yang Y, Jiang R, Li X, Zhang Y, Li R. Effect of Nanoparticle Content on the Microstructural and Mechanical Properties of Forged and Heat-Treated TiC/2219 Nanocomposites. Metals. 2019; 9(9):982. https://doi.org/10.3390/met9090982
Chicago/Turabian StyleYang, Yilong, Ripeng Jiang, Xiaoqian Li, Yun Zhang, and Ruiqing Li. 2019. "Effect of Nanoparticle Content on the Microstructural and Mechanical Properties of Forged and Heat-Treated TiC/2219 Nanocomposites" Metals 9, no. 9: 982. https://doi.org/10.3390/met9090982
APA StyleYang, Y., Jiang, R., Li, X., Zhang, Y., & Li, R. (2019). Effect of Nanoparticle Content on the Microstructural and Mechanical Properties of Forged and Heat-Treated TiC/2219 Nanocomposites. Metals, 9(9), 982. https://doi.org/10.3390/met9090982