Article

A Comparative Study of the Diffuse-Interface Model and Sharp-Interface Model in the Soldering Related Wetting Spreading Systems

1
Key Lab for Robot &Welding Automation of Jiangxi Province, Mechanical & Electrical Engineering School, Nanchang University, Nanchang 330031, China
2
The Engineering Training Center of Nanchang University, Mechanical & Electrical Engineering School, Nanchang University, Nanchang 330031, China
*
Authors to whom correspondence should be addressed.
Metals 2019, 9(9), 944; https://doi.org/10.3390/met9090944
Submission received: 25 July 2019 / Revised: 17 August 2019 / Accepted: 22 August 2019 / Published: 28 August 2019
(This article belongs to the Special Issue Multiscale Modeling of Materials and Processes)

Abstract

:
A typical dissolution wetting system, Bi-Sn eutectic filler metal over a Bi substrate in a high-purity argon atmosphere was investigated first using real-time in situ hot stage microscopy for the extensive use of the sharp-interface model and the diffuse-interface model in the modeling of brazing/soldering related wetting systems. Subsequently, the similarities and differences between the aforementioned models in describing the issues of the wetting and spreading interfaces were discussed in terms of soldering definition and theoretical formula derivation. It is noted that (i) the mutual dissolution diffusion between the liquid Bi-Sn solder and Bi substrate were obvious. As a result, the composition and volume of the liquid solder is constantly changing during the wetting and spreading process; (ii) the sharp-interface model is a special case of the diffuse-interface model of the Cahn-Hilliard nonlinear diffuse-equation under the convective dominant condition; (iii) although there are differences between the sharp-interface model and the diffuse-interface model, both of them could be used in brazing/soldering related processes; and, (iv) the agreement between the experimental and simulation results of the sharp-interface model is not as good as that of the diffuse-interface model, which can be attributed to the effects of the elements’ diffusion and the phase transformation.

1. Introduction

The wetting and spreading behaviors of molten liquid on both reactive and non-reactive surfaces have been extensively studied [1,2,3]. The non-reactive wetting process has been described by conventional hydrodynamic modeling, e.g., Tanner established a wetting and spreading model for a non-reactive wetting system that is based on the lubrication approximation theory, which describes the spreading process of silicone oil on a glass surface [4]. The process of reactive wetting is much more complicated and is often accompanied by strong or weak chemical reactions, including fluid flow, heat transfer, diffusion-induced solute transfer, capillary phenomena, and even new phase formation. Accordingly, the mathematical analysis of the reactive wetting process is very complicated, and revealing its inherent mechanism has become a research focus and a more difficult topic in the field of wetting and spreading [5]. There are usually two types of reactive wetting: one is purely dissolutive wetting and the other is accompanied by the formation of intermetallic compounds (IMC) during the process of dissolutive wetting [6,7]. The sharp-interface model that is based on traditional hydrodynamic theory and the diffuse-interface model based on phase field theory have been gradually developed to reveal the mechanism that is involved in reactive wetting and describe the process through modeling [8,9,10,11]. There are many studies on the application of these two models in the field of metal solidification [12,13,14,15]; however, the above models have been seldom discussed in the field of soldering or brazing.
The solid substrate can be considered as a viscous fluid, so that we can describe the changes in the liquid-solid interface while using the basic theory of fluids to analyze the wetting process of molten metal on a solid substrate. The nature of the interface between the two fluids has been an important topic over the past two centuries. The interface is also considered from an initial thickness of zero (a sharp interface), i.e., the physical parameters are considered to be discontinuous through the interface, to a specific thickness (a diffuse interface), i.e., the physical parameters change smoothly and rapidly through the interface [16]. The sharp-interface model and the diffuse-interface model, which were established for the two different understandings of interface thickness, have been widely used in many fields [17,18,19].
Based on the sharp-interface model, Warren simulated the wetting and spreading process of Bi-20Sn (wt.%) alloy on the Bi substrate. For this typical dissolutive wetting process, the author described the changes of the liquid-solid interface with time and gave the changes of the velocity field and the concentration field of the Bi-20Sn alloy during the wetting and spreading process [20]. Subsequently, Yin and Su modeled the spreading process of Bi-Sn alloy with different Sn contents on Bi while using the model established by Warren. The results show that, when the Sn content was low, the experimental data was well fitted, and when the Sn content was relatively higher, the deviation from the experimental data was larger [21,22].
Based on the phase field theory, the diffuse-interface model has been widely used in the fields of metal solidification, solid phase transformation, grain growth, and coarsening for many years [23,24,25,26]. Recently, this theory has been applied in the brazing/soldering related spreading of molten metal on the surface of solid metal or ceramic. Huh and Hong et al. used the phase field theory to simulate the formation of Cu6Sn5 IMC during the spreading of the Sn-Cu alloy on Cu, which well revealed the scallop-like growth pattern of Cu6Sn5 [27,28]. Villanueva established a multicomponent and multiphase model with liquid flow, which revealed the two stages of the general molten liquid spreading process: the convection dominant stage and the diffusion dominant stage [29]. Subsequently, Villanueva used the approximate data of the Sn-Cu system to simulate the spreading process of Sn on Cu, and the changes in the liquid-solid interface during the process of dissolutive wetting were described in detail for the case where IMC were ignored [30].
According to the above analysis, the similarities and differences between the sharp-interface model and diffuse-interface model should be taken into account in the field of brazing and soldering. We have compared the relations and differences of the interface models using two typical systems to address this aim, i.e., Bi-Sn/Bi and Sn/Cu dissolutive wetting systems, respectively. Note that the Bi-Sn/Bi soldering system is a typical example of dissolutive wetting and that the Sn/Cu system is also a type of dissolutive wetting when neglecting IMC. The two interface models are analyzed from the aspects of soldering definition and theoretical formula derivation.

2. Experimental Procedure and Wetting Kinetics

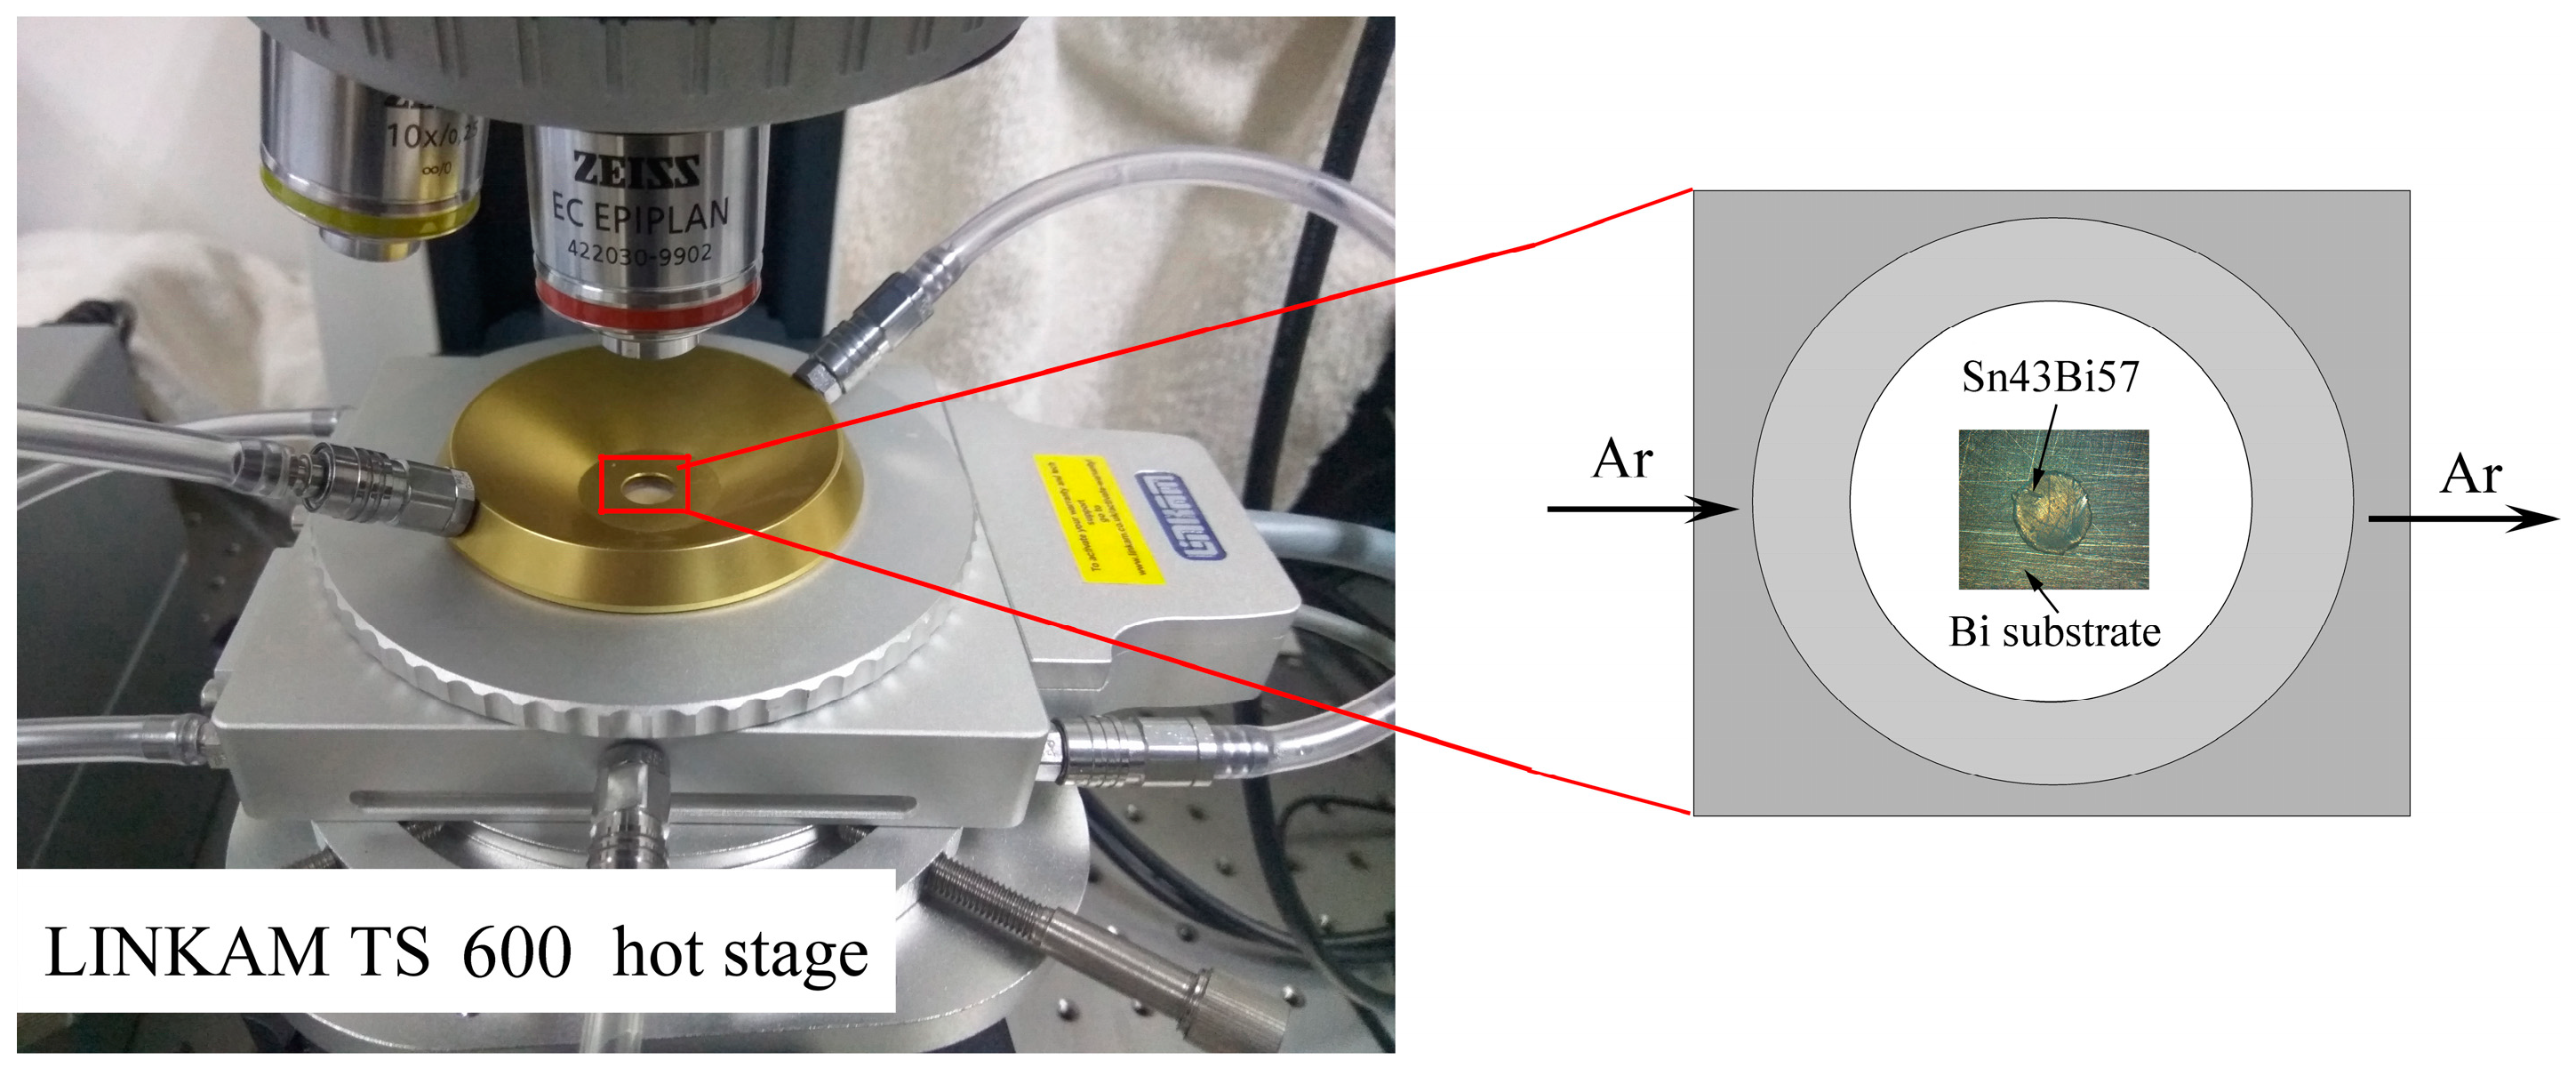
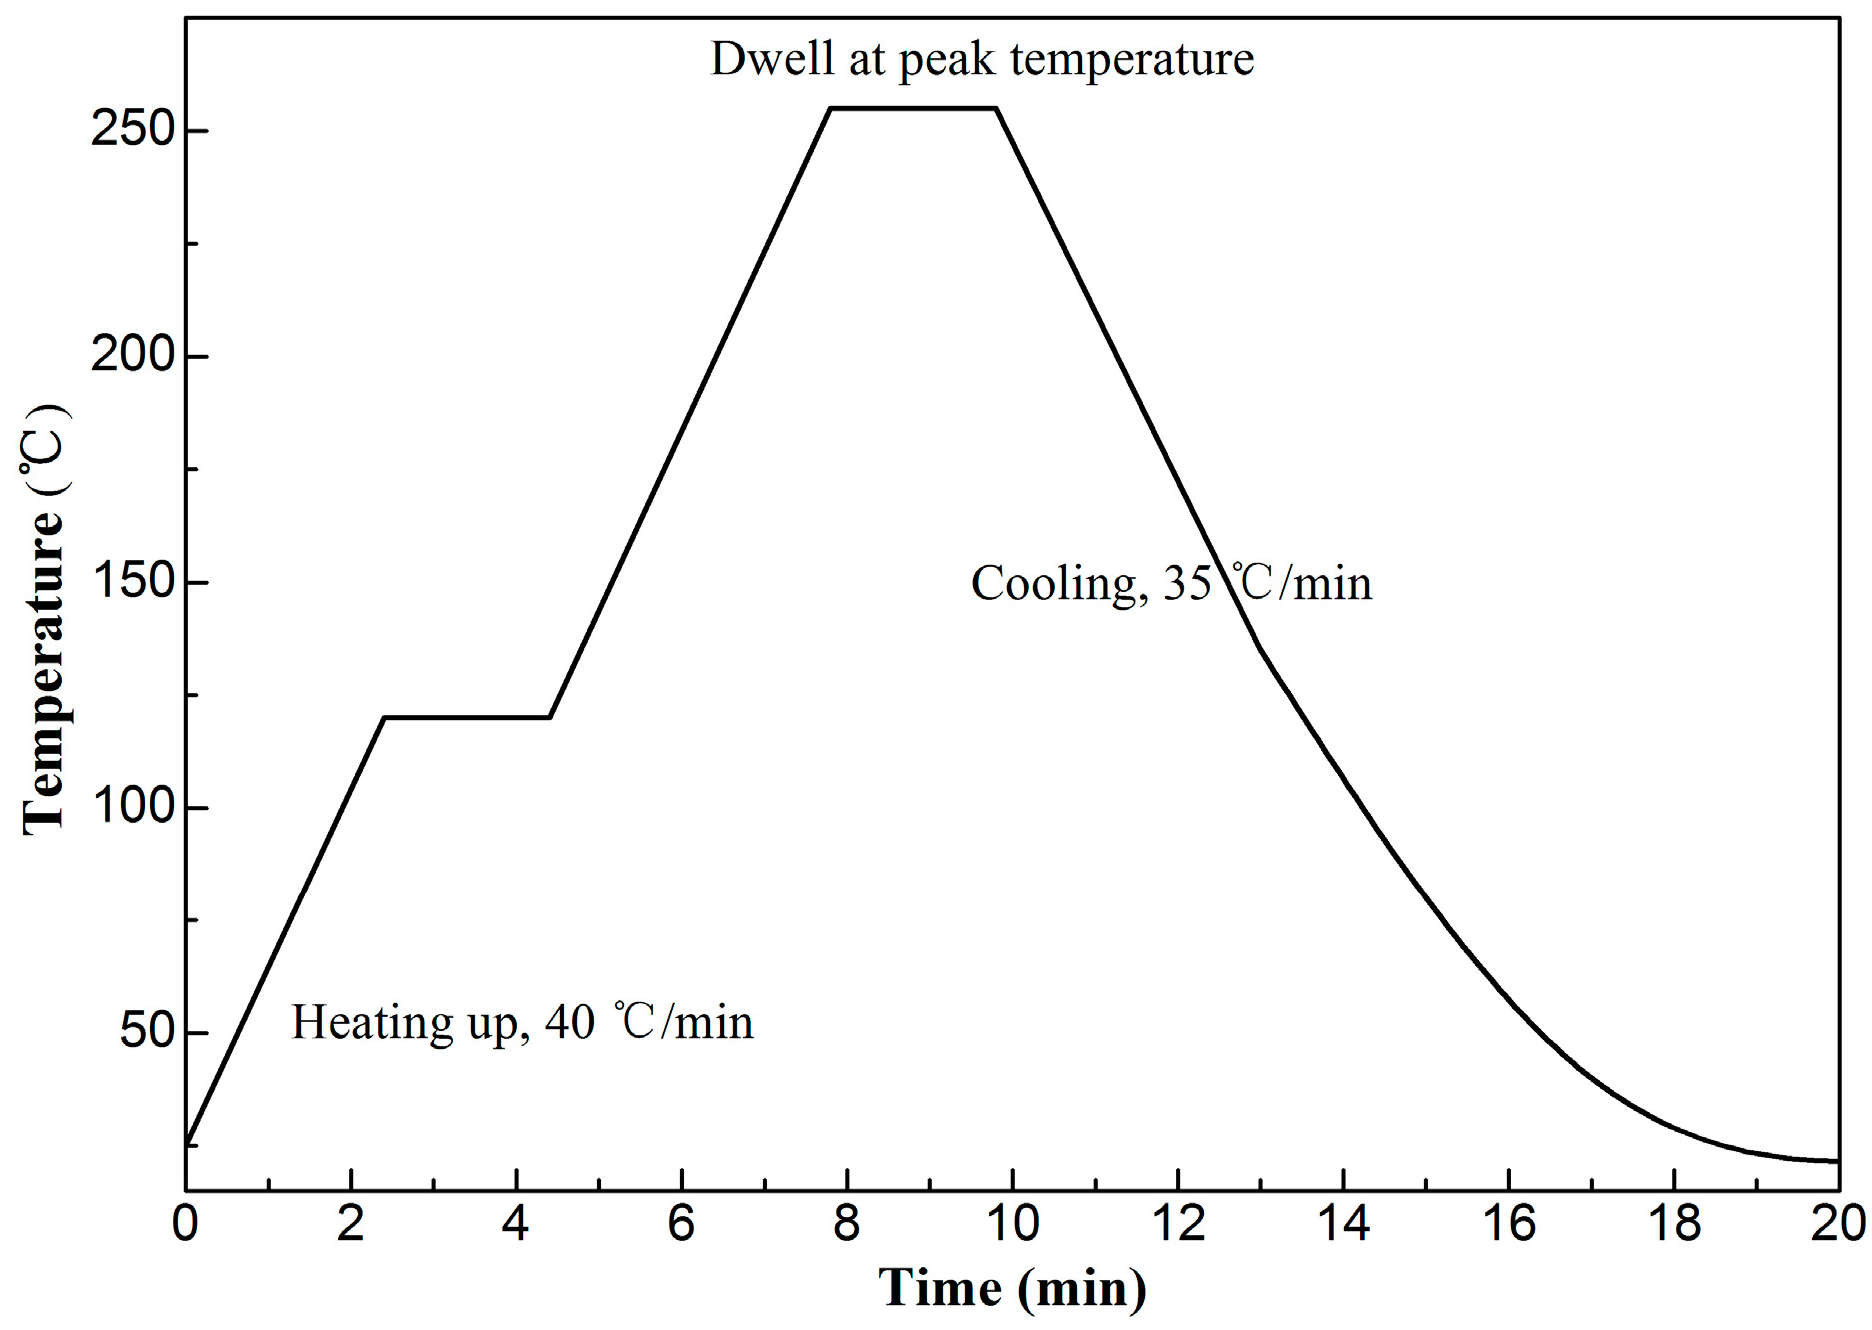
2.1. Experimental Procedure

A Linkam THMS 600 hot stage that was installed on a Carl Zeiss optical microscope system was used to record the wetting and spreading data of 57Bi43Sn filler metal over Bi substrates. The working chamber was supplied with ultra-high-purity nitrogen (99.999%). A Bi substrate with overall dimensions of 10 mm × 10 mm × 0.8 mm was positioned in the chamber over the silver stage, as shown in Figure 1. The substrates were mechanically polished to an average r.m.s roughness of approximately 0.25 µm. The Bi-Sn eutectic filler metal in the form of a solid pellet with the dimensions of ~Ø1.1 mm × 0.04 mm was positioned on the Bi substrate. The melting temperature of the solder piece was 139 °C [21]. The substrates and filler specimens were ultrasonically cleaned in acetone and then dried in an argon stream. Figure 2 shows the temperature profiles for the wetting experiments. The hot-stage chamber was purged with pure argon for 120 min. before the initiation of the heating cycle, which consisted of ramp up, dwell, and quench stages. The heating ramp-up was 40 °C/min. followed by a cooling ramp-down of 35 °C/min. The peak temperature and dwell time was set to be 255 °C and 2 min, respectively. The actual temperature of the liquid solder was slightly lower than the temperature reading from the control unit due to thermal contact resistance between the heating element and the sample. The digital imaging capture speed was 20 frames/s. The triple line was closely approximated with an equivalent radius of the sessile drop instantaneous locus of points, which represents the molten metal spread perimeter. Measurements of the triple-line locations were performed while using Image-Pro PLUS software. The uncertainty in determining the linear dimensions was less than 3% for the given length scale. The calibration of microscope readings was performed while using a linear graduated micrometer scale to estimate the pixel count within a 10 µm partition.

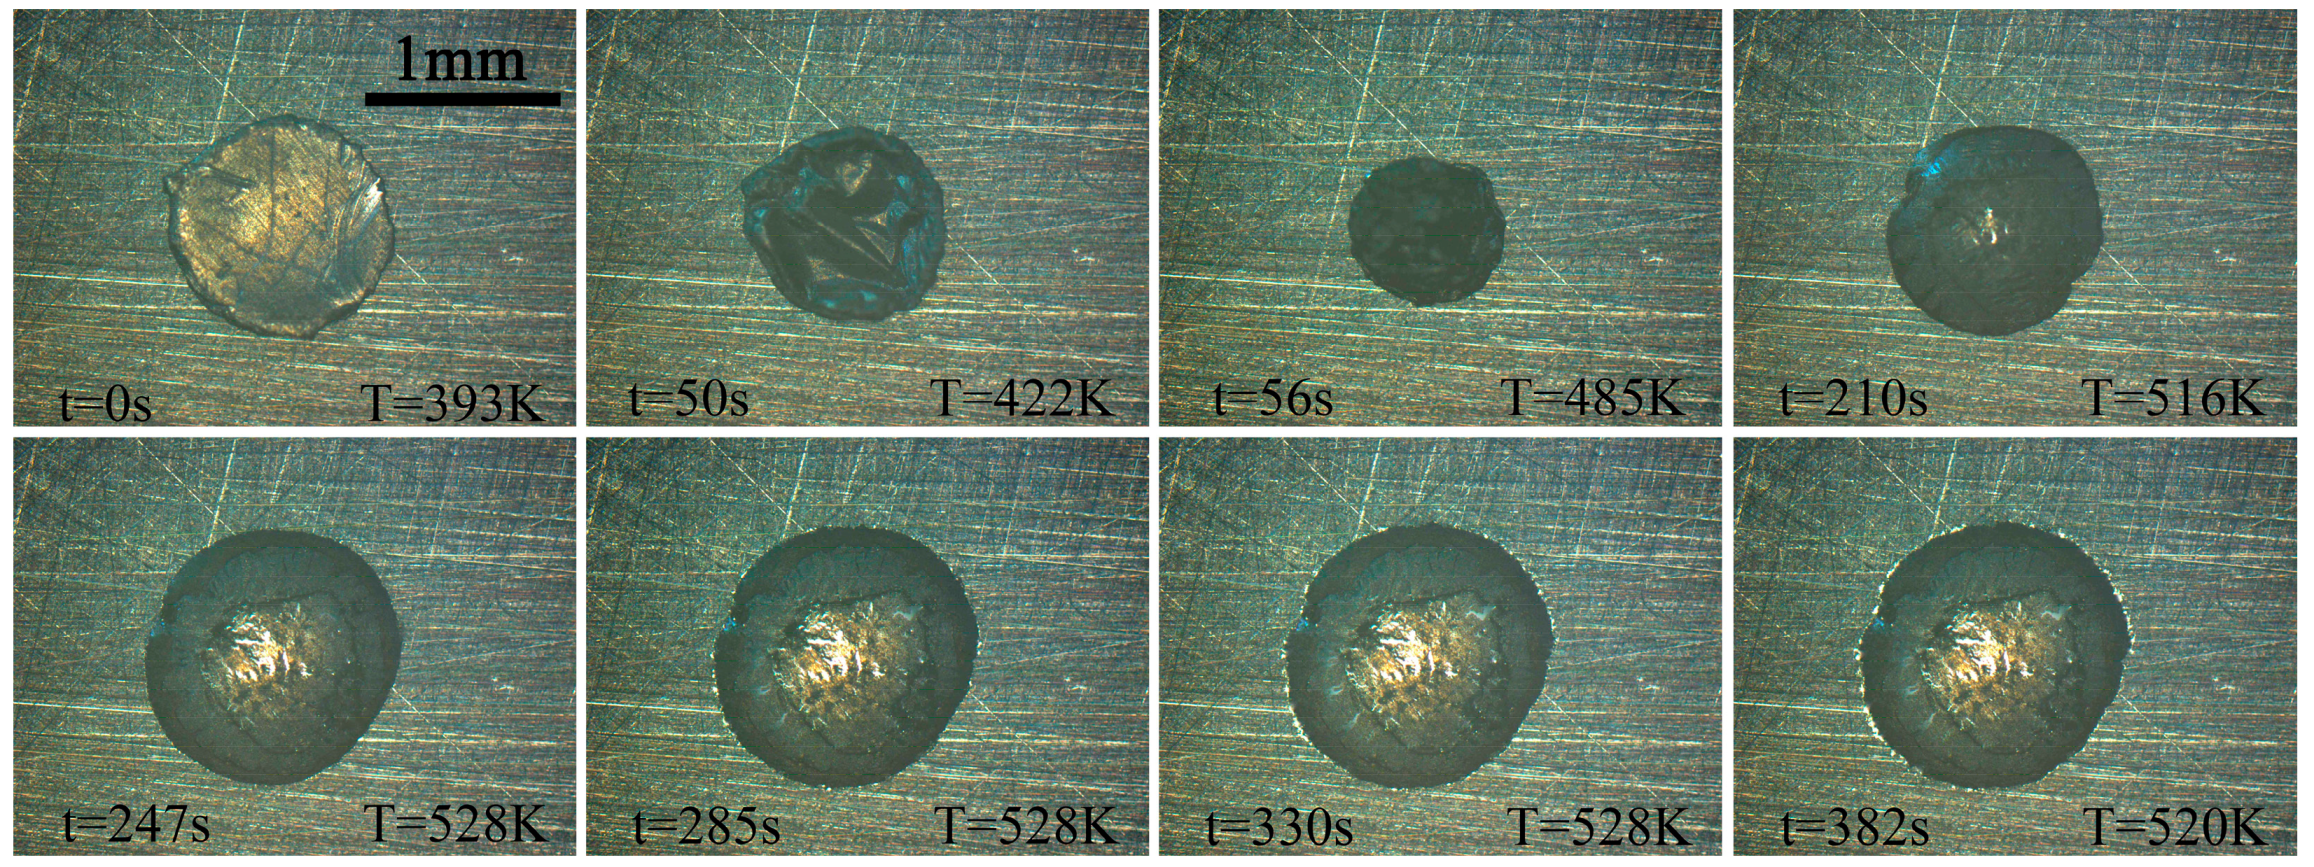
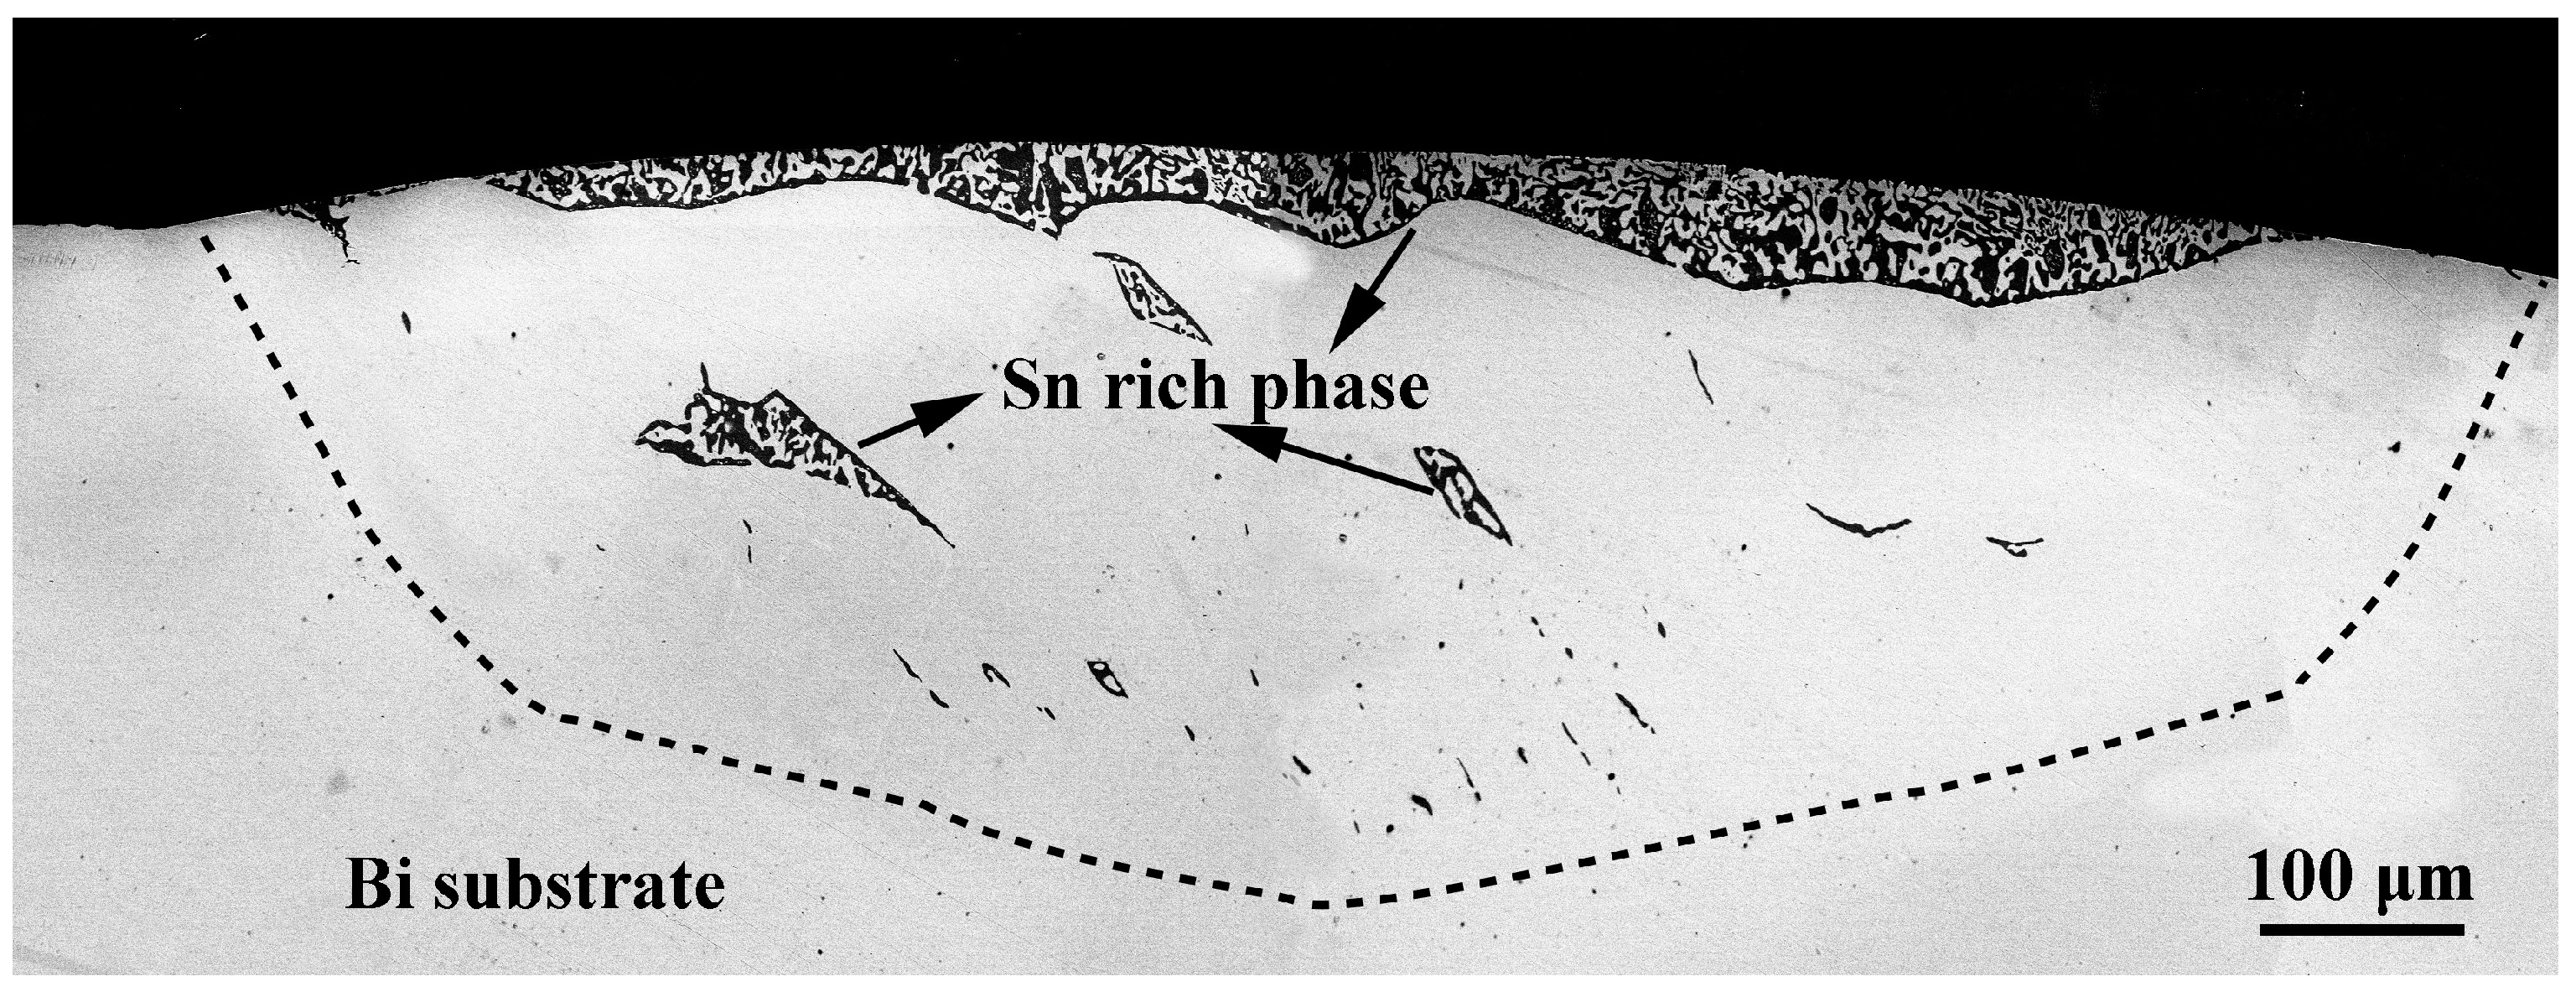
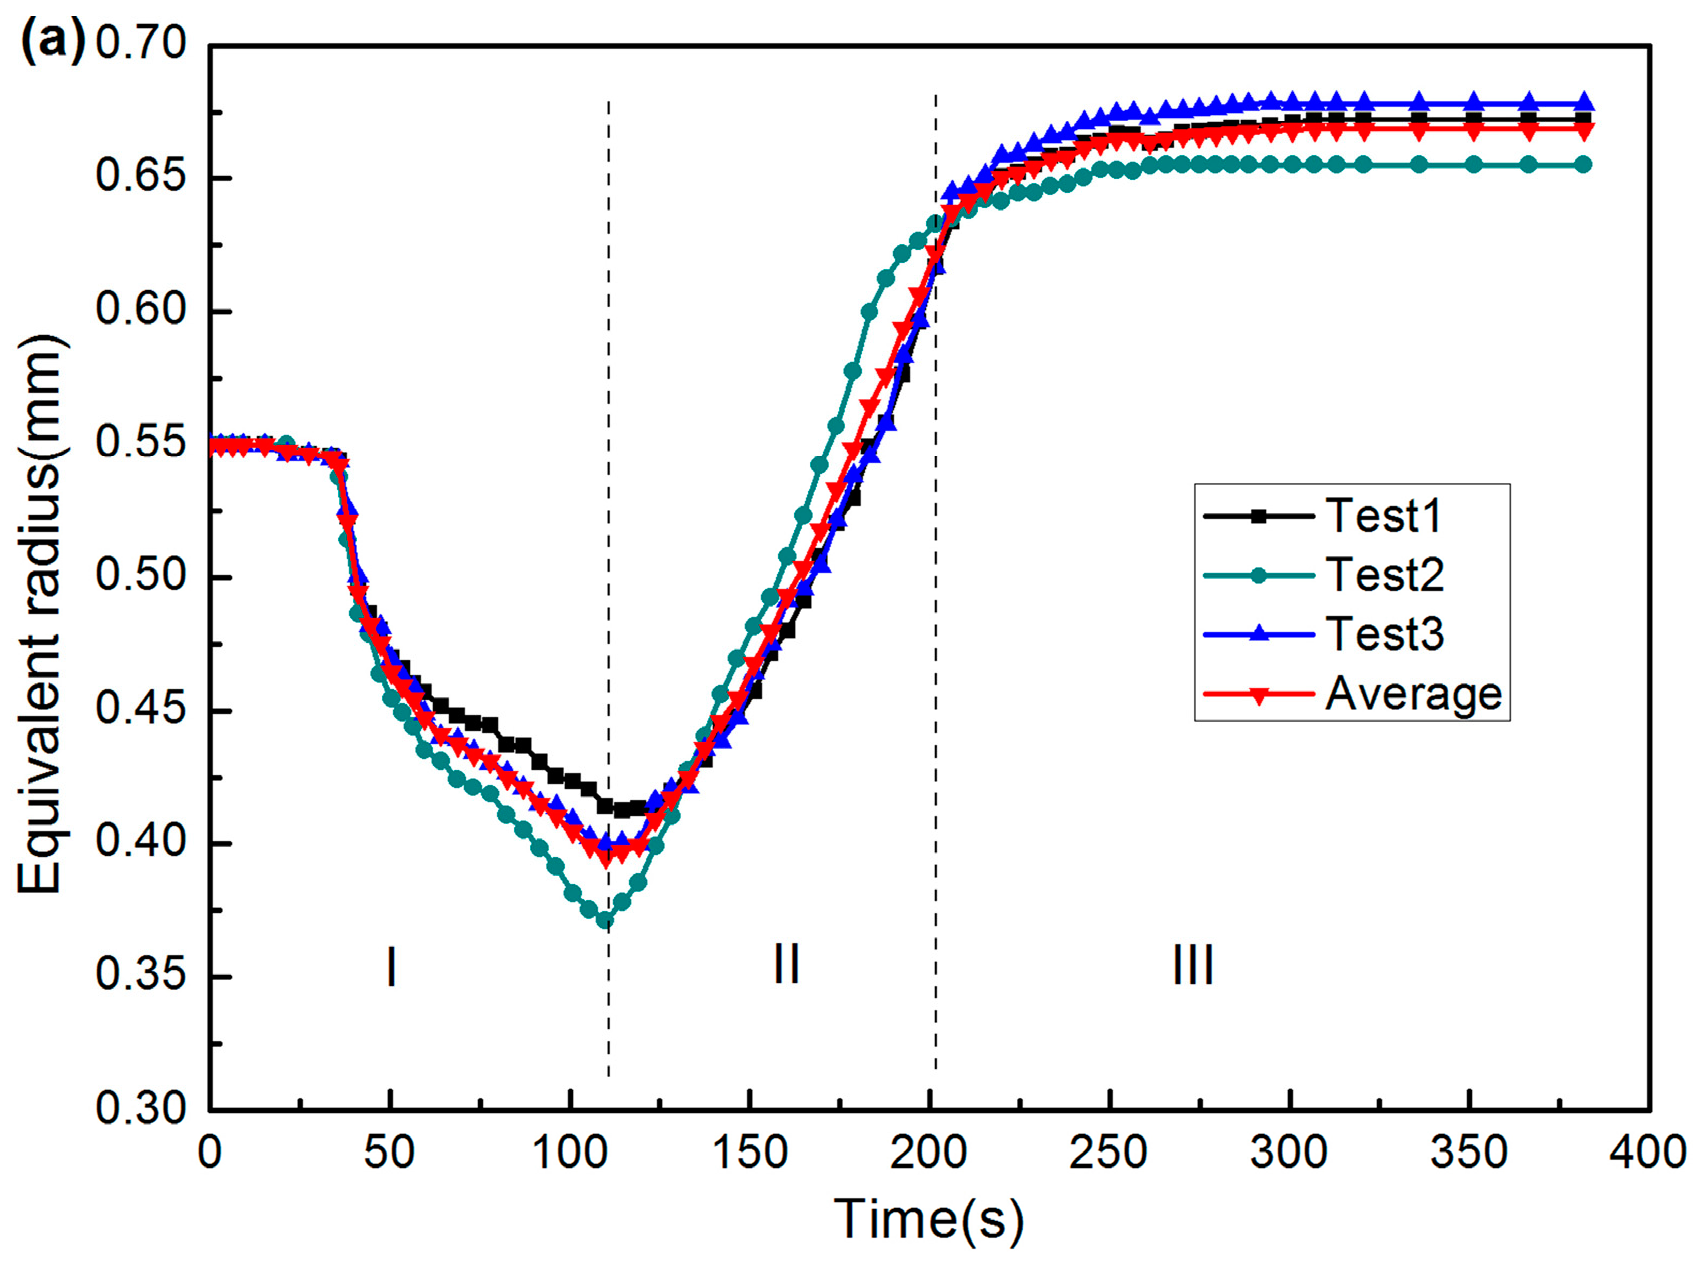
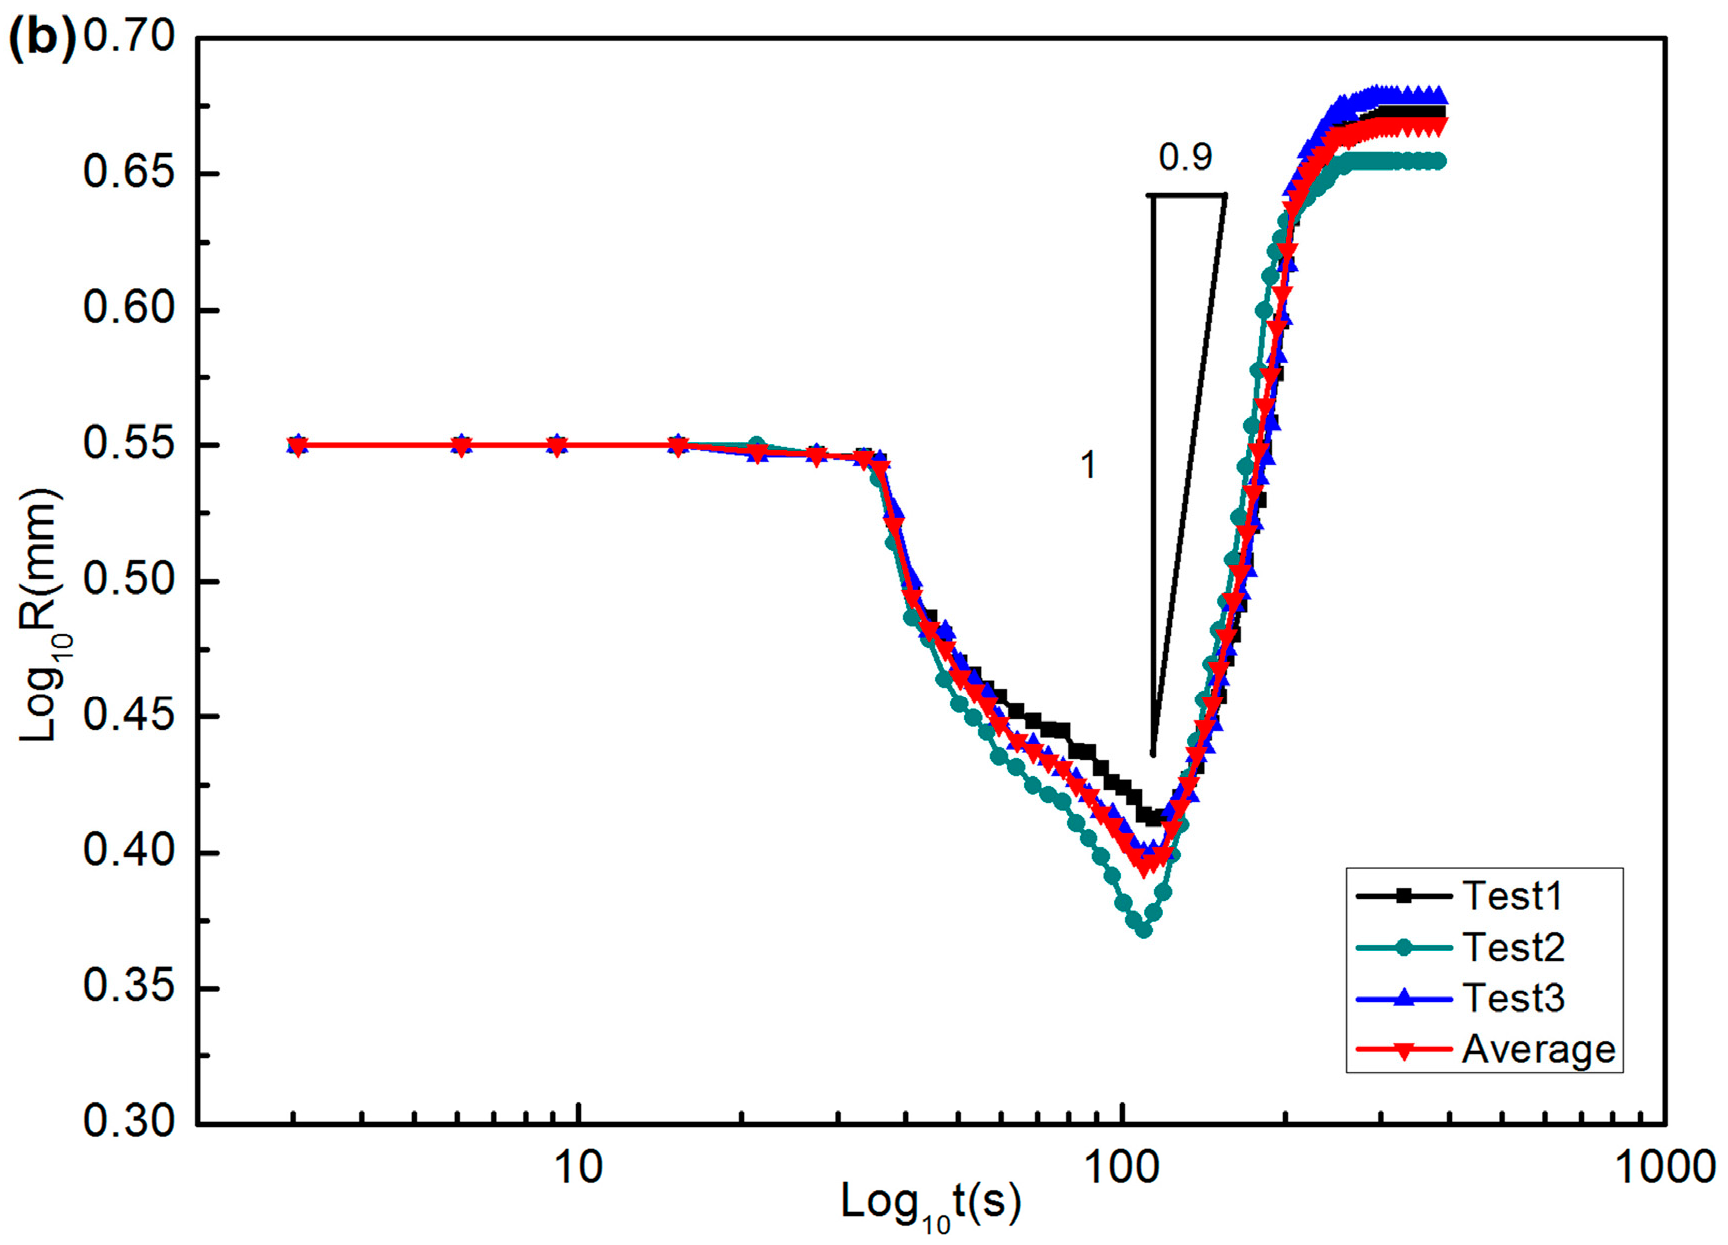
2.2. Results and Wetting Kinetics

Figure 3 presents a sequence of instantaneous frames that were extracted from a video clip, illustrating the surface morphology and the location of the triple line throughout 57Bi43Sn solder spreading on a Bi surface. Figure 4 shows a micrograph of the final spreading state of the Bi-Sn eutectic alloy on the Bi substrate. Figure 5 shows the relation between the equivalent spreading radius and time in the form of a linear and a logarithm plot, respectively, for three tests that were performed under the same experimental conditions. It is noted from the linear plot (Figure 5a) that the kinetics of the spreading process features three distinguishable stages, marked as stages I–III in Figure 5a, i.e., the initial stage, rapid spreading stage and asymptotic stage.
In the initial stage, when the temperature reaches the vicinity of the melting point of the filler metal, the filler metal experiences a slight shrinkage due to the small amount of oxides on the surface of the solder/substrates. In the main stage, i.e., the rapid spreading stage, the melting solder spreads with a high spreading rate, showing a rapid increase in the spreading radius. Mutual dissolution and solute transfer between the molten solder and the substrate occurs as the temperature continues increasing in this stage. In the asymptotic stage, the equilibrium spreading radius becomes almost constant with time. Consequently, the spreading of the molten solder gradually slows down and ultimately shows an asymptotic trend. As shown in the Figure 4, the black dotted line is the contour line between the solder and the substrate that dissolves and diffuses from each other. It can be seen that the Bi substrate has a significant amount of dissolution after spreading, and the Sn element in the BiSn solder is continuously diffused into the Bi substrate during the spreading process. The black region in Figure 4 represents the Sn-rich phase.
The equivalent spreading radius versus time is plotted on a logarithmic scale for a better understanding of the wetting kinetics, as shown in Figure 5b. Equivalent spreading radius is an important parameter to characterize the spreading dynamics. Since the fronts of the spreading molten metal is not a standard circle, the actual spreading area is obtained by measuring the locations of the triple line; then, the area is equivalent to the area of a standard circle. After that, the radius can be calculated according to the equivalent circle, which is the so-called equivalent spreading radius. Based on this, the kinetics of the reactive wetting can be primarily discussed in terms of the empirical power law models [31,32], as indicated by Equation (1):
R n ~ t
where R is the equivalent radius of the spreading at the time t . In non-reactive systems, the wetting kinetics has been thoroughly investigated by Tanner [4] and De Gennes [33]. In their studies, the exponent n was calculated as 10 for the sessile drop case.
For non-reactive systems, the spreading of a liquid metal and organic liquids over rough inert surfaces that are associated with a roughness on the order of 100 µm [33,34,35] can be characterized with R n ~ t , n = 2. For chemical-reaction-controlled reactive wetting systems, similar relations of R vs. t have been reported previously [2,36], R n ~ t with n = ~1. In this study, the value of n for the rapid spreading stage is calculated as 0.9, which is close to the value for chemical reactive systems [34].
The empirical power law model was also used in experiments we previously performed AgCu on Ti-6Al-4V substrates [35]. The empirical power law that was used for the data fitting and experimental results appeared to have a large deviation. The study pointed out that the R(t) models for the spreading kinetics of liquids on solids are based on the assumption that both the composition and the volume of the liquid are constant during the wetting process. Since the spreading of Bi-Sn solder on the Bi substrate is a typical dissolutive wetting, there is evidence of both diffusion of liquid solder into the solid substrate and dissolution of the substrate. As a result, the composition and volume of the liquid solder is constantly changing. The R(t) models should be used with great caution in this reactive wetting situation. Therefore, two models of the sharp-interface and the diffuse-interface are compared and then further studied for extensive use in brazing/soldering related wetting and spreading systems.

3. The Differences and Relations between the Sharp-Interface and Diffuse-Interface

3.1. The Differences between the Basic Theories

In the field of metal solidification, the grains are usually treated as viscous fluids, which also use the properties of the interface between two immiscible fluids. It is necessary to consider three entities in a solidification process: grains, molten liquid, and the interface. For the sharp-interface in the solidification, the interface is modeled as having zero thickness and it can be described as a changing surface controlled by the boundary conditions [36], in which the phase boundary is a smooth manifold of co-dimension 1. Specifically, it is assumed that the interface has a surface tension. An interface boundary condition is generated when a stress balance is applied to the interface. As indicated in Equation (2), the Young–Laplacian equation, the pressure jump through the interface is related to the product of surface tension and curvature [16].
σ n ^ | + = γ κ n ^
where σ is the stress tensor, γ is the surface tension, κ is the mean curvature of the interface, and n ^ is the unit vector normal to the interface. In addition, the mass conservation through the interface is that in Equation (3) due to the impermeable characteristics of the interface between two immiscible fluids. From Equation (3), it can be seen that, in fluid dynamics, the instantaneous velocity of the fluid at the interface is equal to the velocity normal to the interface, which indicates that they are moving together, i.e., the movement of the interface is the result of the flow field (convection), independent of the phase changes or diffusion [30].
ν n ^ = u n ^
where u represents the velocity of the fluid and ν is the velocity of the interface.
In the diffuse-interface model, the entire microstructure in the metal solidification process is represented by an order parameter ϕ . Thus, during the growth of the grains, ϕ = 1 , ϕ = 0 , 0 < ϕ < 1 are used to represent the solidified grains, molten liquid, and grain growth front surface, respectively. The range of the order parameter ϕ is the thickness of the interface, i.e., the interface is no longer a non-zero thickness [23]. Equation (4) is the expression of the stress tensor σ in the diffuse-interface. It can be seen from Equation (4) that the stress tensor σ in the diffuse-interface is only related to the density of the fluid, which is different from the surface tension of the sharp-interface [16].
σ ( ρ 2 ρ + 1 2 | ρ | 2 ) I ρ ρ
where σ is the stress tensor, ρ is the fluid density, and I is the tensor identity, ρ ρ given by ( ρ / x i ) ( ρ / x j ) which is also called the capillary tensor that was proposed by Korteweg. The derivation of the density that appears in the stress tensor is derived from the nonlocal interaction of the molecules within the interface. The diffuse-interface model using the phase field theory takes the effect of phase changes into account. For example, the movement of the liquid-vapor interface is driven by convection and phase changes (evaporation, condensation). In addition, due to the high viscosity of the solid, the solid-vapor interface and solid-liquid interface can only be driven by the phase changes, i.e., sublimation and condensation and melting and solidification, respectively [30]. The movement of the interface is no longer given by the expression of Equation (3), but is given by Equation (5)
S = ν n u n ^
where ν n represents the normal velocity of the fluid interface, where we know that S > 0 for condensation and dissolution, and S < 0 for evaporation.

3.2. The Relations between the Basic Theories

The diffuse-interface model based on phase field theory avoids real-time tracking of the interface, and the range of the order parameter ϕ is the thickness of the diffuse-interface. Theoretically, a sharp-interface model can replace the diffuse-interface model when the thickness of the diffuse-interface is small enough [23]. Elder et al. used the projection operator method to derive a sharp-interface model from a phase field model with a diffuse-interface thickness of ξ [37]. The diffuse-interface model can be transformed into a sharp-interface model when the parameter ξ κ 1 and ξ ν / D 1 , where κ is the curvature of the interface, ν is the velocity of the fluid interface, and D is the diffusion constant of the fluid.
For a binary alloy, the concentration is discontinuous across the interface in a sharp interface model. Caginalp deduced the traditional sharp-interface model from the simplest phase field theory [38]. The concentration c needs to satisfy the following conditions:
[ ln [ c / ( 1 c ) ] ] + = 2 M
σ ( α ν + κ ) = [ S ] E { T T B [ ( T T B ) / 2 M ] ln [ ( 1 c + ) / 1 c ] }
where c + represents the limit of c from the liquid side (and c the solid side) while [ ] + is the difference between the limits from the liquid and solid sides, σ is the surface tension, ν is the velocity of the interface, κ is the surface curvature, [ S ] E represents the entropy density jump between the two phases, T A and T B are the melting temperature of the two materials, M is a phase-dependent constant, and α is the kinetics constant. It can be seen from the above equations that the sharp-interface model can be derived from the phase field theory when the concentration c of the alloy solution meets certain conditions.

4. The Sharp-Interface Model and Diffuse-Interface Model in the Practical Applications

The simulation of the changes of the liquid-solid interface in Su [22] and Villanueva [30] using the sharp-interface model and diffuse-interface model were analyzed, which used the Sn-Bi/Bi and Sn/Cu systems, respectively, to compare the relations and differences of the two interface models under pure dissolutive wetting conditions. Villanueva only simulated the changes of three phases, i.e., the changes between liquid, solid, and vapor, and did not involve the formation of the fourth phase—the intermediate compound (Cu6Sn5). Therefore, the essence of the experiment was the simulation of the process of liquid-solid interface changes under dissolutive wetting. Figure 6 shows a schematic diagram of the molten liquids spreading in a pure dissolutive wetting and spreading process. The upper contact angle is defined as θ 1 , which represents the angle between the liquid-vapor interface and the horizontal. The lower contact angle is defined as θ 2 , which represents the angle between the liquid-solid interface and the horizontal.

4.1. Practical Application of Sharp-Interface Model

In the sharp-interface model, Su used the theoretical equation that was deduced by Warren, where the conservation equation of the solute is as follows in the process of a droplet spreading [20].
D 2 c u c = c t
where c is the concentration (the mass fraction of Sn in the Sn-Bi alloy), D is the diffusion constant of the fluid, and u is the velocity of the fluid flow. The mass boundary condition of the liquid-vapor interface is given by Equation (3), and the solute boundary condition is
c n ^ = 0
At the liquid-solid interface, when assuming the density of the liquid is equal to the solid, and then the mass boundary condition and the solute boundary condition are as Equations (10) and (11), respectively
u n ^ = 0
( D l c l + D s c s ) n ^ = v n ( c l c s )
where the subscripts l and s represent the liquid and solid, respectively. The author assumed that the solute is insoluble in the solid phase and ignored the diffusion of the solute in the solid phase. Thus, Equation (11) becomes
D c n ^ = ν n c b
where ν n = ν n ^ , c b is the concentration of the liquid at the liquid-solid interface. To describe the changes of the liquid-solid interface and establish the equations of the concentration field and velocity field, it is necessary to determine all of the physical quantities that are involved in Figure 6, i.e., h 1 ( r , t ) , h 2 ( r , t ) , R ( t ) , θ 1 , and θ 2 (for discussion, see reference [20]).

4.2. Practical Application of Diffuse-Interface Model

In the diffuse-interface model, its basic equations, namely, the Cahn–Hilliard nonlinear diffusion equation and the Allen–Cahn relaxation equation, describe the changes of the conserved quantity c and the non-conserved quantity ϕ with time, respectively. Coupled with the basic thermodynamic and kinetics equations, the phase field method can predict the evolution of arbitrary morphologies and complex microstructures without having to explicitly track the position of the interface [23].
In practical application, Villanueva used the approximate data of a Sn-Cu system to simulate the dissolution and wetting process of Sn on Cu, and then established governing equations containing solid, liquid, and vapor, including the Cahn–Hilliard nonlinear diffusion equation, the Allen–Cahn relaxation equation, the mass continuous equation, and the Navier–Stokes equation. It is possible to simulate the actual situation in which Sn is spreading on Cu (for discussion, see reference [30]).

5. Comparison of the Simulation Results Based on the Two Interface Models

The following conclusions can be drawn from the comparison of the simulation results and the experimental results of the sharp-interface model and the diffuse-interface model that was used by two researchers. (i) Su used the sharp-interface model to simulate the process of Bi-Sn solder spreading on Bi substrates. The results show that, when the content of Sn in Bi-Sn solder is less than 20% (wt.%), the simulation agrees well with the experimental results. As the Sn content increases, the deviation between the simulation and the experimental results also increases. (ii) Villanueva used the diffuse-interface model to simulate the wetting and spreading process of Sn on Cu. The simulation is in good agreement with the experimental results. Previously, the differences in the applications of the sharp-interface model and diffuse-interface model have been seldom discussed, especially in soldering-related wetting and the spreading process. In the following, we will analyze the reasons for the differences from two aspects, namely, the definition of soldering and the derivation of the basic theoretical formula.
For soldering, it is a process in which the solder and the base material are wetted and mutually diffused to achieve the bonding. Therefore, the wettability of the solder has important influence on soldering [39]. The diffusion of the solder and base material presents in two ways: one is the diffusion of the base material into the liquid solder, i.e., the dissolution; the other is the diffusion of the solder elements into the base material. In the general soldering process, these two kinds of diffusion occur simultaneously. In the model of the sharp-interface that was obtained by traditional hydrodynamics theory, i.e., the model used by Su and Warren, the dissolution of the solid phase and the convection in the liquid phase are taken into account. Further, the authors made the assumption that the solute does not diffuse into the solid substrate [20]. However, it should be noted that, if the Sn content in Sn-Bi continues to increase, the diffusion ability of the Bi-Sn alloy would be enhanced correspondingly. Based on the above analysis, it can be understood that the solute diffusion effects were neglected in the simulation of Su and Warren, which resulted in a large difference between the simulation and the experimental data. However, the diffuse-interface model that was used by Villanueva considered the diffusion of the solid matrix into the liquid soldering filler metal, the diffusion of the soldering filler metal component into the solid matrix, and the influence of the phase changes [30]. Therefore, the interface model derived from the phase field theory is in good agreement with the experimental results.
The reason of this deviation can also be seen from the basic theoretical formulas of the sharp-interface model and the diffuse-interface model. The dimensionless form of the Cahn–Hilliard nonlinear diffusion equation is given when the element x A is only considered in the liquid phase of the diffusion interface model [30]. There is also the same form for x B .
x A t + u ^ x A = 1 P e x A J A
P e x A = U C L R 0 M A L R T
where U C L is the speed of the three-phase line and R 0 is the initial spreading radius of the droplet. M A L represents the amount of dissolution of element A in the liquid phase L , which is a specific value. R is the gas constant and T is the temperature. P e x A represents the ratio of solute transfer that is caused by convection and solute transfer caused by solute diffusion. The larger the ratio is, the greater the proportion of solute transport by the convective flow during the spreading process.
The expression of the flux J A of A atom in the liquid phase given by Villanueva is:
J A = D A V M x A
where V M is the molar volume of the vapor, with a value of V M = 1.0 × 10 5 m 3 mol 1 .
Substituting Equation (15) into Formula (13), we create the following equation.
x A t + u ^ x i = 1 P e x A 1 V M D A 2 x A
Comparing Equation (16) and the traditional dynamical Equation (6), we can see that the two equations are exactly the same in physical form (both x A and c represent the mass fraction of solute in the liquid phase). Therefore, we get 1 P e x A V M = 1 , and thus P e x A = 10 5 1 , which indicates that the solute transfer that is caused by convection is much larger than the solute transfer that is caused by diffusion. This shows that the theoretical equation in the sharp-interface model demonstrates that solute transfer relies on convection rather than diffusion, which is consistent with the inferences that we have previously obtained from the soldering definition.
In addition, it can be seen from Equation (16) that the sharp-interface model is a special case of the Cahn–Hilliard nonlinear diffusion equation under convective dominant conditions. The relationship between the sharp-interface model and the Cahn–Hilliard nonlinear diffusion equation is also obtained during the study of the contact line movement between two insoluble fluids by Yue [40]. When the thickness of the interface is lower than a critical value and the other parameters remain constant, a sharp-interface model that is based on the Cahn–Hilliard equation can be obtained, and we also reach a similar conclusion with our comparison of the basic equations of the sharp-interface model and the diffuse-interface model.

6. Conclusions

The wetting and spreading of Bi-Sn eutectic alloy on Bi substrate, was conducted while using real-time in situ hot stage microscopy. According to the analysis, the Sn elements in the BiSn solder continuously diffused into the Bi substrate; at the same time the Bi substrate also continuously dissolved and diffused into the solder. As a result, the composition and volume of the liquid solder constantly changed.
To depict such a dissolution controlled soldering process, the sharp-interface model and diffuse-interface model were compared and the following conclusions were obtained: (i) the process of derivation from the theoretical formula shows that the sharp-interface model is a special case of the Cahn–Hilliard nonlinear diffusion equation under the convective dominant condition, which is consistent with the definition of soldering; (ii) although there are differences between the sharp-interface model and the diffuse-interface model, both of them could be used in brazing/soldering related processes; and, (iii) the agreement between the experimental and simulation results of the sharp-interface model is not as good as that of the diffuse-interface model. This is attributed to the effects of the elements’ diffusion and the phase transformation.

Author Contributions

Y.L., J.Z. and G.L. conceived and designed the experiments; G.L. and X.L. performed the experiments; Y.L. and M.L. analyzed the data; J.Z. contributed sample fabrication; G.L. wrote the paper. All authors contributed to the data analysis and discussion.

Funding

This research received no external funding.

Acknowledgments

This work was sponsored by the National Natural Science Foundation of China (No. 51665038), the Key Project of the Natural Science Foundation of Jiangxi Province (20171ACB21011), the Academic and Technical Leaders Founding Project of Major Disciplines of Jiangxi Province (20182BCB22001).

Conflicts of Interest

The authors declare no conflict of interest.

References

  1. Dezellus, O.; Eustathopoulos, N. Fundamental issues of reactive wetting by liquid metals. J. Mater. Sci. 2010, 45, 4256–4264. [Google Scholar] [CrossRef] [Green Version]
  2. Li, Y.L.; Wang, Z.L.; Long, W.F.; Lei, M.; Hu, X.W. Wetting kinetics and spreading phenomena of Sn-35Bi-1Ag solder on different substrates. J. Mater. Sci. Mater. Electron. 2018, 29, 13914–13924. [Google Scholar] [CrossRef]
  3. Liu, W.; Sekulic, D.P. Capillary driven molten metal flow over topographically complex substrates. Langmuir 2011, 27, 6720–6730. [Google Scholar] [CrossRef] [PubMed]
  4. Tanner, L.H. The spreading of silicone oil drops on horizontal surfaces. J. Phys. D Appl. Phys. 1979, 12, 1473. [Google Scholar] [CrossRef]
  5. Eustathopoulos, N.; Voytovych, R. The role of reactivity in wetting by liquid metals: A review. J. Mater. Sci. 2016, 51, 425–437. [Google Scholar] [CrossRef]
  6. Landry, K.; Rado, C.; Voitovich, R.; Eustathopoulos, N. Mechanisms of reactive wetting: The question of triple line configuration. Acta Mater. 1997, 45, 3079–3085. [Google Scholar] [CrossRef]
  7. Mortensen, A.; Drevet, B.; Eustathopoulos, N. Kinetics of diffusion-limited spreading of sessile drops in reactive wetting. Scr. Mater. 1997, 36, 645–651. [Google Scholar] [CrossRef] [Green Version]
  8. Ding, H.; Spelt, P.D.M. Wetting condition in diffuse interface simulations of contact line motion. Phys. Rev. E 2007, 75, 046708. [Google Scholar] [CrossRef]
  9. Liu, H.R.; Gao, P.; Ding, H. Fluid–structure interaction involving dynamic wetting: 2D modeling and simulations. J. Comput. Phys. 2017, 348, 45–65. [Google Scholar] [CrossRef]
  10. Khatavkar, V.V.; Anderson, P.D.; Meijer, H.E.H. Capillary spreading of a droplet in the partially wetting regime using a diffuse-interface model. J. Fluid Mech. 2007, 572, 367–387. [Google Scholar] [CrossRef] [Green Version]
  11. Jacqmin, D. Contact-line dynamics of a diffuse fluid interface. J. Fluid Mech. 2000, 402, 57–88. [Google Scholar] [CrossRef]
  12. Leo, P.H.; Lowengrub, J.S.; Jou, H.J. A diffuse interface model for microstructural evolution in elastically stressed solids. Acta Mater. 1998, 46, 2113–2130. [Google Scholar] [CrossRef]
  13. Subhedar, A.; Steinbach, I.; Varnik, F. Modeling the flow in diffuse interface methods of solidification. Phys. Rev. E 2015, 92, 023303. [Google Scholar] [CrossRef] [PubMed]
  14. Wang, H.; Liu, F.; Herlach, D.M. Kinetics of triple-junctions in eutectic solidification: A sharp interface model. J. Mater. Sci. 2015, 50, 176–188. [Google Scholar] [CrossRef]
  15. Theillard, M.; Gibou, F.; Pollock, T. A sharp computational method for the simulation of the solidification of binary alloys. J. Sci. Comput. 2015, 63, 330–354. [Google Scholar] [CrossRef]
  16. Anderson, D.M.; McFadden, G.B.; Wheeler, A.A. Diffuse-interface methods in fluid mechanics. Annu. Rev. Fluid. Mech. 1998, 30, 139–165. [Google Scholar] [CrossRef]
  17. Collins, J.B.; Levine, H. Diffuse interface model of diffusion-limited crystal growth. Phys. Rev. B 1985, 31, 6119. [Google Scholar] [CrossRef] [PubMed]
  18. Galenko, P.; Jou, D. Diffuse-interface model for rapid phase transformations in nonequilibrium systems. Phys. Rev. E 2005, 71, 046125. [Google Scholar] [CrossRef] [PubMed] [Green Version]
  19. Wang, H.; Liu, F.; Zhai, H.; Wang, K. Application of the maximal entropy production principle to rapid solidification: A sharp interface model. Acta Mater. 2012, 60, 1444–1454. [Google Scholar] [CrossRef]
  20. Warren, J.A.; Boettinger, W.J.; Roosen, A.R. Modeling reactive wetting. Acta Mater. 1998, 46, 3247–3264. [Google Scholar] [CrossRef]
  21. Yin, L.; Murray, B.T.; Singler, T.J. Dissolutive wetting in the Bi–Sn system. Acta Mater. 2006, 54, 3561–3574. [Google Scholar] [CrossRef]
  22. Su, S.; Yin, L.; Sun, Y.; Murray, B.T.; Singler, T.J. Modeling dissolution and spreading of Bi–Sn alloy drops on a Bi substrate. Acta Mater. 2009, 57, 3110–3122. [Google Scholar] [CrossRef]
  23. Chen, L.Q. Phase-field models for microstructure evolution. Annu. Rev. Mater. Res. 2002, 32, 113–140. [Google Scholar] [CrossRef]
  24. Drolet, F.; Elder, K.R.; Grant, M.; Kosterlitz, J.M. Phase-field modeling of eutectic growth. Phys. Rev. E 2000, 61, 6705. [Google Scholar] [CrossRef] [PubMed]
  25. Loginova, I.; Odqvist, J.; Amberg, G.; Ågren, J. The phase-field approach and solute drag modeling of the transition to massive γ→α transformation in binary Fe-C alloys. Acta Mater. 2003, 51, 1327–1339. [Google Scholar] [CrossRef]
  26. Warren, J.A.; Boettinger, W.J. Prediction of dendritic growth and microsegregation patterns in a binary alloy using the phase-field method. Acta Mater. 1995, 43, 689–703. [Google Scholar] [CrossRef]
  27. Huh, J.Y.; Hong, K.K.; Kim, Y.B.; Kim, K.T. Phase field simulations of intermetallic compound growth during soldering reactions. J. Electron. Mater. 2004, 33, 1161–1170. [Google Scholar] [CrossRef]
  28. Hong, K.K.; Huh, J.Y. Phase field simulations of morphological evolution and growth kinetics of solder reaction products. J. Electron. Mater. 2006, 35, 56–64. [Google Scholar] [CrossRef]
  29. Villanueva, W.; Granhagen, K.; Amberg, G.; Ågren, J. Multicomponent and multiphase modeling and simulation of reactive wetting. Phys. Rev. E 2008, 77, 056313. [Google Scholar] [CrossRef]
  30. Villanueva, W.; Boettinger, W.J.; Warren, J.A.; Amberg, G. Effect of phase change and solute diffusion on spreading on a dissolving substrate. Acta Mater. 2009, 57, 6022–6036. [Google Scholar] [CrossRef]
  31. Eustathopoulos, N. Dynamics of wetting in reactive metal/ceramic systems. Acta Mater. 1998, 46, 2319–2327. [Google Scholar]
  32. Zhao, H.; Nalagatla, D.R.; Sekulic, D.P. Wetting kinetics of eutectic lead and lead-free solders: Spreading over the Cu Surface. J. Electron. Mater. 2009, 38, 284–291. [Google Scholar] [CrossRef]
  33. De Gennes, P.G. Wetting: Statics and dynamics. Rev. Mod. Phys. 1985, 57, 827. [Google Scholar] [CrossRef]
  34. Asthana, R.; Sobczak, N. Wettability, spreading, and interfacial phenomena in high-temperature coatings. JOM-e 2000, 52, 1–19. [Google Scholar]
  35. Yu, X.; Yang, J.; Yan, M.; Hu, X.W.; Li, Y.L. Kinetics of wetting and spreading of AgCu filler metal over Ti–6Al–4V substrates. J. Mater. Sci. 2016, 51, 10960–10969. [Google Scholar] [CrossRef]
  36. Qin, R.S.; Bhadeshia, H.K. Phase field method. Mater. Sci. Technol. 2010, 26, 803–811. [Google Scholar] [CrossRef]
  37. Elder, K.R.; Grant, M.; Provatas, N.; Kosterlitz, J.M. Sharp interface limits of phase-field models. Phys. Rev. E 2001, 64, 021604. [Google Scholar] [CrossRef] [PubMed] [Green Version]
  38. Caginalp, G.; Xie, W. Phase-field and sharp-interface alloy models. Phys. Rev. E 1993, 48, 1897. [Google Scholar] [CrossRef]
  39. Song, X.G.; Cao, J.; Wang, Y.F.; Feng, J.C. Effect of Si3N4-particles addition in Ag-Cu-Ti filler alloy on Si3N4/TiAl brazed joint. Mater. Sci. Eng. A 2011, 528, 5135–5140. [Google Scholar] [CrossRef]
  40. Yue, P.; Zhou, C.; Feng, J.J. Sharp-interface limit of the Cahn-Hilliard model for moving contact lines. J. Fluid Mech. 2010, 645, 279–294. [Google Scholar] [CrossRef]
Figure 1. The experimental setup (a sessile drop sample is positioned within the chamber of the hot stage).
Metals 09 00944 g001
Figure 2. Temperature profile for wetting experiments.
Metals 09 00944 g002
Figure 3. A sequence of instantaneous frames recorded during the spreading of 57Bi43Sn solder over the Bi substrate.
Metals 09 00944 g003
Figure 4. The cross-section of the resolidified Bi-Sn eutectic alloy on the Bi substrate.
Metals 09 00944 g004
Figure 5. Kinetics data of the triple line for the 57Bi43Sn filler metal spreading on rough Bi substrates (a) in a linear scale, (b) in a logarithm scale.
Metals 09 00944 g005aMetals 09 00944 g005b
Figure 6. Schematic illustration of a pure dissolutive wetting spreading process.
Metals 09 00944 g006

