Article

Accelerated Ferrite-to-Austenite Transformation During Intercritical Annealing of Medium-Manganese Steels Due to Cold-Rolling

Advanced Steel Processing and Products Research Center, Colorado School of Mines, Golden, CO 80401, USA
*
Authors to whom correspondence should be addressed.
Metals 2019, 9(9), 926; https://doi.org/10.3390/met9090926
Submission received: 5 July 2019 / Revised: 5 August 2019 / Accepted: 16 August 2019 / Published: 23 August 2019
(This article belongs to the Special Issue Physical Metallurgy of High Manganese Steels)

Abstract

:
Prior cold deformation is known to influence the ferrite-to-austenite (α → γ) transformation in medium-manganese (Mn) steels that occurs during intercritical annealing. In the present study, a 7Mn steel with ultra-low residual carbon content and varying amounts of prior cold deformation was intercritically annealed using various heating rates in a dilatometer. The study was conducted using an ultra-low carbon steel so that assessments of austenite formation during intercritical annealing would reflect the effects of cold deformation on the α → γ transformation and Mn partitioning and not effect cementite formation and dissolution or paraequilibrium partitioning induced austenite growth from carbon. Increasing prior cold deformation was found to decrease the Ac1 temperature, increase austenite volume fraction during intercritical annealing, and increase the amount of austenite nucleation sites. Phase field simulations were also conducted in an attempt to simulate the apparent accelerated α → γ transformation with increasing prior cold deformation. Mechanisms for accelerated α → γ transformation explored with phase field simulations included an increase in the amount of austenite nucleation sites and an increased Mn diffusivity in ferrite. Simulations with different amounts of austenite nucleation sites and Mn diffusivity in ferrite predicted significant changes in the austenite volume fraction during intercritical annealing.

1. Introduction

Intercritical annealing of medium-manganese (Mn) steels, containing 4–10 weight percent (wt%) Mn, is an advanced high-strength steel concept primarily intended for automobile components. Due to the high hardenability of medium-Mn steels, a microstructure primarily consisting of martensite is generally observed upon cooling from hot-rolling [1]. Prior to cold-rolling, tempering is often employed to soften the steel, resulting in a microstructure consisting of deformed ferrite/tempered martensite immediately prior to intercritical annealing. Upon intercritical annealing, austenite forms, and carbon (C) and Mn partitioning to austenite occurs, allowing all or some of the austenite to be stabilized to ambient temperatures upon cooling [1,2,3]. The mechanical performance of intercritically annealed medium-Mn steels is dependent on the austenite content, composition, and stability [3]. To develop medium-Mn steel grades of various strength levels, it is crucial to control the austenite content and composition resulting from intercritical annealing heat treatments.
It has been shown that increasing the amount of cold deformation prior to intercritical annealing accelerates the ferrite-to-austenite (α → γ) transformation [4]. Studies of austenite formation upon heating and intercritical annealing of conventional Fe-Mn-C alloys with leaner Mn content suggest that interplay between ferrite recrystallization and austenite formation affects the austenite amount and dispersion formed during intercritical annealing [5,6,7]. Carbon bearing alloys have additional complexity associated with austenite nucleation and growth during intercritical annealing relative to binary Fe-Mn alloys due to the presence of cementite. Studies on austenite formation during intercritical annealing have reported austenite to form at ferrite boundaries [5,8] as well as at cementite-ferrite interfaces [9]; it is reasonable to expect that austenite formation under these different conditions would not be associated with identical growth rates or compositions. Considerable Mn enrichment of cementite during intercritical annealing has also been reported [8]. Mn enrichment in cementite likely influences the cementite dissolution behavior and therefore the amount of Mn and C solute available to partition to austenite. In the absence of carbon, austenite formation assessments should enable a clearer understanding of the effects of cold-rolling on austenite nucleation and growth during intercritical annealing.
The work presented herein pertains to a two part study on intercritical annealing of a 7Mn steel with an ultra-low residual carbon concentration; the study is comprised of an experimental section that includes austenite formation assessments and a simulation section that explores some possible mechanisms for the accelerated α → γ transformation upon intercritical annealing due to increased prior cold deformation. For the experimental portion of this study, three different conditions of the 7Mn steel were produced, each with a different amount of prior cold deformation, so that the effects of prior cold deformation on austenite formation during intercritical annealing may be distinguished.
For the simulation portion of this study, phase field simulations were conducted for the prediction of microstructural evolution during intercritical annealing of a 7Mn steel. Phase field simulations give a visual output for the translation of domain boundaries over space and time. For the purpose of simulating microstructural evolution, domains are specified to be specific phases or constituents present in the microstructure. Each domain in a phase field simulation is designated a unique order parameter, which is a function of position and time. When the order parameters are plotted as a function of their positions, the output is analogous to a micrograph. The evolution of the order parameter distribution over time is motivated by the minimization of the local free energy of the system. A derivation for the free energy functional of the system and how order parameter transitions are derived from the minimization of the local free energy can be found in a review of the phase field method by Steinbach et al. [10]. The temporal evolution of the order parameter distribution is solved by a set of coupled differential equations commonly referred to as the ‘phase field equation’. Additionally, solute concentration fields and diffusivities can also be coupled to the phase field equation to influence the migration of the order parameter domain boundaries. For more information on the application of phase field method to modeling of microstructure evolution in steels, the reader is referred to a review article by Militzer [11].
Simulations in this study were conducted using the phase field simulation software MICRESS®. Various simulations were conducted using different values for select parameters in an attempt to incorporate mechanisms that may lead to accelerated α → γ transformation due to prior cold deformation. The mechanisms considered include an increase in the number of austenite nucleation sites due to increased ferrite grain boundary area and an increase in the Mn diffusivity in ferrite due to the high defect density anticipated in cold-worked ferrite.

2. Materials and Methods

The composition of the steel used in this study was 0.0005C-7.19Mn-0.25Si wt% The as-received material was cast from a vacuum melt, reheated to 1230 °C, hot-rolled to a thickness of 2.87 mm and furnace-cooled from 650 °C, before being cold-rolled to a thickness of 1.42 mm (50 pct reduction). Three different conditions of the 7Mn steel were used in this study. The condition denoted from here on as ‘CR50′ is the material in its as-received, cold-rolled condition. Some of the CR50 material was further cold-rolled to a thickness of 0.97 mm (66 pct total reduction); these samples are denoted as ‘CR66′. Additionally, to provide a uniform initial microstructure for comparison to the cold-rolled conditions, samples were cut from the CR50 sheet, austenitized under vacuum at 850 °C for 300 s and quenched to 30 °C at 100 °C/s with Helium (He) gas before being placed in liquid nitrogen for 300 s; these samples are denoted as ‘AQ’ (as-quenched).
Rectangular samples measuring 4.0 mm × 10.0 mm of each material condition were machined with the long axis parallel to the rolling direction and processed under vacuum in a DIL 805A dilatometer (TA Instruments, New Castle, DE, USA). For in situ austenite volume fraction assessments during intercritical annealing, samples were heated to 650 °C at rates ranging from 0.05 to 96 °C/s and held for 1000 s. Subsequently, the samples were heated to 850 °C at a rate of 10 °C/s.
Samples for metallography were either heated to 650 °C and quenched or heated to 500 °C and held for 10,000 s and quenched. The Ac1 temperature was determined via dilatometry by applying a linear offset corresponding to one volume pct austenite formation from the heating portion of the dilation data prior to the Ac1 temperature. The Ac1 temperature was determined to be the temperature where the experimental dilation curve intersected the linear offset. For samples with heating rates exceeding 3 °C/s, heating continued to 900 °C to ensure the Ac1 temperature was realized upon heating. Ac1 temperature measurements were taken on three samples for each condition and heating rate. The austenite volume fraction during intercritical annealing was assessed by application of a lever rule to dilation measurements [6,12]. 
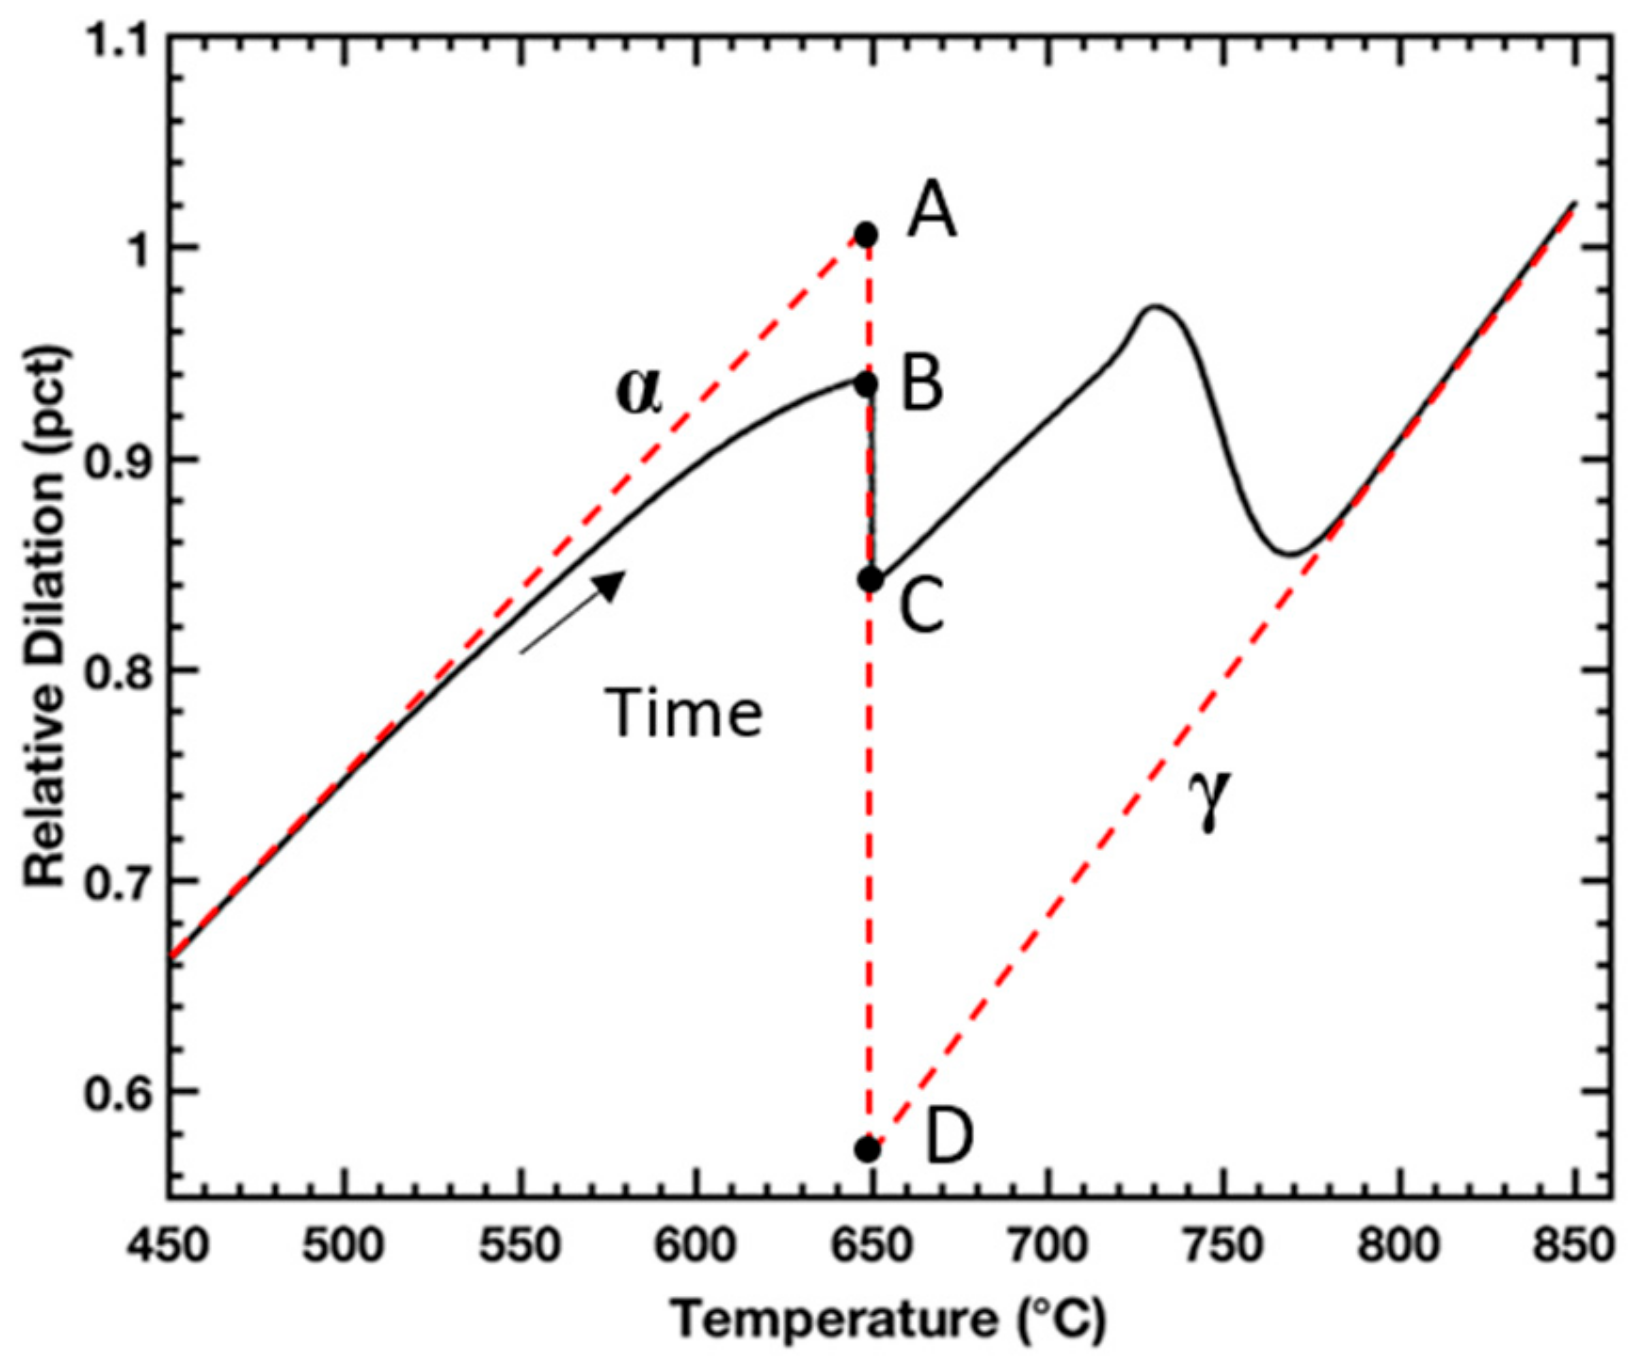
Figure 1 shows exemplary dilatometry data for a sample heated to 650 °C and held for 1000 s followed by heating to 850 °C. Overlaid on the data are dashed lines that extrapolate thermal expansion of the sample corresponding to regions when the sample is fully ferritic/tempered martensite and fully austenitic, labeled α and γ, respectively. Another overlaid line, vertical at 650 °C and bounded by points A and D, corresponds to the relative dilation of the sample corresponding to complete α→γ transformation. The length of line A-B divided by the length of line A-D corresponds to the austenite volume fraction formed upon heating, the length of line B-C divided by the length of line A-D corresponds to the austenite fraction formed during isothermal holding, the length of line A-C divided by the length of line A-D corresponds to total austenite fraction formed during intercritical annealing, and the length of line C-D divided by the length of line A-D corresponds to the fraction of additional austenite formed upon heating to 850 °C, after intercritical annealing.
For metallography, samples were sectioned with the cross-section normal perpendicular to the rolling direction. Samples were then mounted, polished, and etched with a one pct Nital solution and analyzed with a JOEL 7000 field-emission scanning electron microscope (FESEM) (JOEL USA, Peabody, MA, USA) using a 15 kV accelerating voltage and a working distance of 10 mm.
Simulations of microstructural evolution during intercritical annealing were conducted using the phase field simulation software MICRESS® (version 7.117, ACCESS e.V., Aachen, Germany) utilizing the TQ module which allows MICRESS® to interface with Thermo-Calc® Software databases; the TCFE9 Steels/Fe-alloys database was used for all MICRESS® simulations. All MICRESS® simulations conducted were for intercritical annealing at 650 °C and a heating rate of 96 °C/s for a steel with a composition of 7.19Mn-0.25Si wt%. The 5 μm × 5 μm area simulated had an initial microstructure consisting of elongated ferrite which contained a specified amount of stored strain energy; this initial microstructure was constructed with the intent of representing cold-rolled ferrite. As time progressed in each simulation, the elongated ferrite was consumed concurrently by nucleation and growth of both strain-free ferrite and austenite. Strain-free ferrite nucleation was specified to nucleate within the initial elongated ferrite grains while austenite was specified to nucleate at ferrite grain boundaries, including grain boundaries between strain-free and deformed ferrite. The number of austenite nucleation sites was limited to a specified number of nucleation events. To reduce simulation time, all simulations began with heating from 400 °C. Table 1 lists values used for the initial simulation relating to interfaces, austenite nucleation, Mn diffusivity in ferrite, and stored strain energy of ferrite. Interfacial energy values are identical to those used by Zhu and Militzer for a phase field simulation developed for predicting the microstructural evolution during intercritical annealing of dual-phase steels [13]. The α-γ interface mobility pre-factor, M0, and activation energy, ∆G*, used by Zhu and Militzer were initially adopted for all interfaces in the simulation. The mobility pre-factor was adjusted to produce simulations that predicted stable austenite growth at 650 °C. The number of austenite nucleation sites was chosen to reflect qualitative metallography observations. The diffusivity pre-factor and activation energy for Mn in ferrite were adopted from De Cooman and Speer [14]. The stored strain energy in ferrite was chosen to be greater than that use by Zhu and Militzer (2 J/cm3) by approximately a factor of six and was specified as a range to reflect inhomogeneity in the amount of stored strain energy in cold-rolled ferrite.
Additional simulations were conducted using variations of select input parameters in an attempt to incorporate mechanisms that may cause accelerated α → γ transformation due to prior cold deformation; these parameter variations are listed in Table 2. The number of austenite nucleation sites was varied from 10–40 to reflect a potential increase in ferrite grain boundary area, which serves as an austenite nucleation site. The diffusivity pre-factor for Mn in ferrite was varied from 0.756–7560 cm2/s to reflect a potential increase in the effective bulk diffusivity of Mn through ferrite due to pipe diffusion in deformed ferrite. Initially, the stored strain energy in ferrite was also varied in order to reflect a potential increase in driving force due to stored strain energy in deformed ferrite, however, it was discovered that MICRESS® does not consider the stored strain energy in ferrite to contribute to the driving force for the α → γ transformation. Stored strain energy is apparently only considered for like-phase grain boundary migration (e.g., recrystallization).

3. Results

Samples of each condition of the steel were intercritically annealed at 650 °C in a dilatometer using various heating rates to observe austenite formation during the intercritical anneal. The Ac1 temperatures for each condition and heating rate were also determined using dilatometry. Some samples were cross-sectioned and metallographically prepared for FESEM analysis to assess the austenite formation upon heating to 650 °C or heating to 500 °C and holding for 10,000 s. Phase field simulations were conducted that incorporated variation of some parameters in an attempt to simulate α → γ transformation due to prior cold deformation.

3.1. Dilatometry

Austenite formed during intercritical annealing was found to transform to martensite upon cooling. Figure 2 shows the relative dilation response for the CR50 condition upon heating to 900 °C at 12 °C/s followed by cooling to 30 °C at 100 °C/s. Upon heating it is evident that the sample passes through Ac1 and Ac3, while upon cooling the martensite start (Ms) temperature is distinguished at approximately 380 °C. Figure 3 shows the relative dilation response produced from the CR50 condition upon heating to 650 °C and holding for 50,000 s followed by quenching to 30 °C at 100 °C/s. Austenite growth is evident from the contraction during the isothermal hold; the Ms temperature can be distinguished at approximately 230 °C. The lower Ms temperature observed for the sample isothermally held at 650 °C suggests that Mn partitioning has occurred in this sample, stabilizing the austenite to a lower temperature.
Figure 4 shows the variation in Ac1 temperature observed via dilatometry for each condition and heating rate. Increasing prior cold deformation is shown to decrease the Ac1 temperature, suggesting that cold deformation accelerates austenite formation upon heating. This is consistent with the findings of Azizi-Alizamini et al. [15], where Ac1 temperatures observed upon heating a plain low-carbon steel were lower for an as-cold-rolled condition relative to an as-hot-rolled condition. Figure 5 shows austenite volume fraction assessments during intercritical annealing for each condition and for heating rates of 0.05 °C/s (Figure 5a), 3 °C/s (Figure 5b), and 96 °C/s (Figure 5c). The time shown on the x-axis has been adjusted in each figure so that 0 s in the figures corresponds to the time when the sample reached 400 °C. The shaded portion of each plot corresponds to the isothermal holding portion of each intercritical anneal. Austenite formation prior to reaching the isothermal holding temperature of 650 °C is consistent with the Ac1 measurements in Figure 4; considerable austenite formation is detected in the samples heated at 0.05 °C/s, a small amount of austenite is detected in the samples heated at 3 °C/s, and virtually no austenite is detected prior to reaching the isothermal holding temperature for the samples heated at 96 °C/s. For each heating rate, increasing prior cold deformation corresponds to increasing the α → γ transformation rate.

3.2. Metallography

Figure 6 shows two magnifications of the microstructure of the CR50 condition after being heated to 650 °C at 0.05 °C/s followed by quenching to 30 °C at 100 °C/s. Considering the corresponding austenite volume fractions shown in Figure 5a and the dilation response indicating a martensite transformation upon cooling from a 650 °C isothermal hold shown in Figure 3, the dark etching phase is identified as martensite which was previously austenite that formed upon heating. The microstructure indicates that austenite formed as a fine dispersion amongst the deformed ferrite grains. Austenite appears to have formed predominantly at deformed ferrite grain boundaries. In some instances, elongated regions of martensite (previously austenite) are distinguished that have grown preferentially along the deformed ferrite grain boundaries. Other areas of the microstructure evidence more equiaxed growth of austenite.
Figure 7 shows microstructures for each condition after being heated to 500 °C at 12 °C/s and isothermally held for 10,000 s followed by quenching to 30 °C at 100 °C/s. Based on the Ac1 temperatures shown in Figure 4, austenite in these samples is anticipated to have formed isothermally at 500 °C. The dark etching areas are identified as either martensite or austenite, corresponding to austenite that formed during the isothermal hold, however, there may be more retained austenite in these samples due to the greater Mn enrichment in austenite that is anticipated with lower intercritical annealing temperatures. For the AQ condition, shown in Figure 7a, austenite has formed predominantly on prior austenite grain boundaries. Alternatively, for the CR50 and CR66 conditions, austenite has formed predominantly on deformed ferrite grain boundaries. It can be distinguished that a greater number of austenite grains had formed in the CR66 condition than the CR50 condition, and that a far greater number of austenite grains had formed in both cold-rolled conditions relative to the AQ condition, reflecting that increasing prior cold deformation increases the number of austenite nucleation sites.

3.3. MICRESS® Phase Field Simulation

Figure 8 shows microstructural evolution results predicted by MICRESS®. The simulation was developed to simulate concurrent austenite growth and ferrite recrystallization. As time progresses in the simulation, the deformed ferrite in the initial microstructure is replaced by strain-free recrystallized ferrite and austenite. Recovery phenomena are not considered in the simulation; stored strain energy is only reduced by growth of a strain-free grain into the ferrite with stored strain energy. Recrystallizing ferrite nucleates homogenously and austenite nucleates at ferrite grain boundaries. Austenite forms interfaces with both deformed and recrystallized ferrite grains. Austenite growth occurs with an enriched Mn concentration, while the Mn content in the ferrite is depleted.
Similar to the argument for increased Mn diffusivity in martensite [16,17], the high density of defects in deformed ferrite likely increases the effective bulk diffusivity of Mn in deformed ferrite relative to recrystallized ferrite. Thus, it is considered that austenite may grow more rapidly into deformed ferrite than recrystallized ferrite due to this increased diffusivity of Mn to the α-γ interface. Diffusivity (D) of a solute is described by the following Arrhenius-type relation:
D = Do e(−Q/RT)
where Do is the diffusivity pre-factor, Q is the activation energy, and RT takes its usual meaning of thermal energy per mole [18]. Figure 9 shows austenite volume fraction plotted against time for MICRESS® simulations incorporating the different diffusivity pre-factors for Mn diffusivity in ferrite listed in Table 2. Increasing the diffusivity pre-factor for Mn in ferrite is shown to increase the predicted austenite volume fraction. However, the amount of increase in the austenite volume fraction decreases with increasing Mn diffusivity. It should be noted that the greatest diffusivity pre-factor is two orders of magnitude greater than the second greatest, while the other diffusivity pre-factors are only one order of magnitude difference.
Figure 10 shows predictions for the Mn distributions across α-γ interfaces at 500 s for the MICRESS® simulations incorporating different Mn diffusivity pre-factors in ferrite. The interface width for the simulations was 0.06 μm; the center of the interface is overlaid in the appropriate locations on the figure. For the two lowest Mn diffusivity pre-factors in ferrite the Mn concentration in ferrite was predicted to decrease approaching the interface, while the simulations for the two greater Mn diffusivity pre-factors predict virtually no gradient in the Mn concentration in the ferrite. The difference in Mn gradients in ferrite ahead of the advancing interface corresponds to austenite growth transitioning from more diffusion controlled to more interface controlled. It is also interesting to note that the austenite is predicted to grow with a greater Mn enrichment for simulations with greater Mn diffusivity pre-factors. This suggests that there is driving force for a range of austenite compositions for the α → γ transformation and that the Mn concentration of the growing austenite can be altered by the Mn diffusivity in ferrite.
An increased number of austenite nucleation sites due to an increase in grain boundary area in cold-rolled ferrite was considered as a factor contributing to accelerated α → γ transformation. MICRESS® simulations incorporating the different amounts of austenite nucleation sites listed in Table 2 were conducted to assess the change in the predicted austenite volume fraction. Figure 11 shows the predicted austenite volume fraction plotted against time for these simulations. As expected, increasing the number of austenite nucleation sites increased the predicted austenite volume fraction during intercritical annealing.

4. Discussion

4.1. Martensite Formation Upon Cooling

Generally, the intent of intercritical annealing for medium-Mn steels is for the austenite to become enriched in C and/or Mn to the extent that it is stabilized to room temperature. However, the intercritical annealing heat treatments applied in this study led to martensite transformation upon cooling. Comparing the dilation curves upon cooling in Figure 2 and Figure 3, it is evident that the austenite formed during isothermal holding at 650 °C underwent martensite transformation at a considerably lower temperature than the austenite that formed upon heating to 900 °C (above the Ac3 temperature). In the absence of carbon, the lower Ms temperature exhibited by the intercritically annealed sample is interpreted to reflect Mn partitioning to austenite during intercritical annealing.

4.2. Ac1 Temperature

Increasing prior cold deformation was found to decrease the Ac1 temperature for low heating rates. It is suggested that the decrease in Ac1 temperature may be attributed to increased ferrite grain boundary area caused by cold rolling, and/or an increased driving force for austenite nucleation due to stored strain energy in ferrite. The prior mechanism is consistent with a previously formulated austenite nucleation mechanism during intercritical annealing of so-called manganese-partitioning dual-phase steels proposed by Navara et al. [8]. They proposed that austenite preferentially forms in a Mn enriched zone behind a migrating ferrite grain boundary, and not at cementite-ferrite interfaces. Migration of the ferrite boundary was suggested to be caused by diffusion-induced grain boundary migration which leaves a solute enriched zone behind the migrating boundary [19]. In the present study, it was found that austenite is capable of ample nucleation in the absence of cementite. With increasing cold deformation there will be increased ferrite grain boundary area. With a greater amount of ferrite grain boundary area serving as possible austenite nucleation sites, it would be expected that a greater number of austenite nuclei would form and that austenite detection upon heating would therefore be realized at lower temperatures.
The latter mechanism mentioned can be visualized by the schematic shown in Figure 12, where the deformed ferrite (αDef) Gibbs free energy curve is raised relative to the undeformed ferrite (α) curve by an amount equivalent to the stored strain energy induced by cold deformation (∆GSSE). Using the criteria for driving force for nucleation of a phase with a different composition [20] it is shown that for the arbitrary temperature and alloy composition C0 in the schematic, there is driving force for austenite nucleation from deformed ferrite whereas there is no driving force for austenite nucleation from ferrite without stored strain energy. Considering this schematic, austenite should form upon heating at lower temperatures from ferrite with greater amounts of stored strain energy.

4.3. Austenite Growth

Consistent with Miller’s work [4], the α → γ transformation during intercritical annealing was shown in Figure 6 to increase with increasing prior cold deformation. Possible mechanisms for the increased austenite growth rate are discussed herein which were also incorporated into phase field simulations. The first mechanism discussed is essentially identical to the argument for decreased Ac1 temperatures due to an increased number of austenite nucleation sites resulting from increased ferrite grain boundary area produced from prior cold deformation. The microstructures shown in Figure 7 indicate that increasing prior cold deformation results in a greater number of austenite grains upon intercritical annealing. Additionally, phase field simulations with variations in the amount of austenite nucleation sites show that increasing the number of austenite nucleation sites is predicted to accelerate the α → γ transformation; the predicted austenite volume fraction after a 1000 s isothermal hold at 650 °C is increased approximately 330 pct by increasing the amount of austenite nucleation sites from 10 to 40.
Another potential mechanism for the observed increase in the α → γ transformation rate is based on how an increase in Mn diffusivity in ferrite may affect the α-γ interface velocity. As the intent of intercritical annealing of medium-Mn steels is to partition Mn to austenite, intercritical annealing should be conducted at temperatures that require austenite to grow with an enriched Mn concentration, as opposed to a partitionless α → γ transformation (e.g., massive). Partitioning of Mn after austenite growth has been predicted to require very long isothermal hold times due to the low diffusivity of Mn in austenite [21]. Austenite growth that occurs with an enriched Mn concentration requires the transport of Mn through ferrite to the α-γ interface. Figure 8 and Figure 10 indicate that the MICRESS® simulations predict the growth of austenite to occur with an enriched Mn concentration. Under this condition, the migration of the α-γ interface may be described as being under mixed control from diffusion of Mn to the interface and the mobility of the interface. Figure 13 depicts a Mn concentration gradient in ferrite ahead of an advancing α-γ interface for mixed control of interface migration as well as the two extreme cases of diffusion-controlled and interface-controlled [22], where X0, Xi, and Xα are the nominal Mn concentration of the steel, the actual Mn concentration at the interface, and the equilibrium Mn concentration in ferrite. The Mn gradient in ferrite should be expected to reside closer to the diffusion controlled growth curve if there is low Mn diffusivity in ferrite or the interface is highly mobile, whereas the Mn gradient in the ferrite would be expected to reside near the interface controlled line if the Mn diffusivity in ferrite is great or the interface mobility is low.
The consideration of increased Mn diffusivity through ferrite due to the high defect density in deformed ferrite was incorporated into MICRESS® simulations by input of a range of different diffusivity pre-factors for Mn in ferrite. Increasing the Mn diffusivity pre-factor in simulations corresponded to an increase in the α → γ transformation rate. The amount of increase in the transformation rate decreased with increasing Mn diffusivity as the predicted α-γ interface migration transitioned from more diffusional controlled to more interface controlled; which is evidenced by the predicted Mn distributions in ferrite ahead of the advancing α-γ interface.

5. Conclusions

In situ austenite growth assessments indicate that increasing prior cold deformation is associated with accelerated α → γ transformation during intercritical annealing for an ultra-low carbon medium-Mn steel. Ac1 temperatures were also observed to decrease with increasing prior cold deformation at low heating rates. Metallography indicates that upon intercritical annealing austenite forms readily along deformed ferrite boundaries for the CR50 and CR66 conditions and along prior austenite grain boundaries for the AQ condition. An increase in the number of austenite grains formed during intercritical annealing was observed for samples with increasing prior cold deformation.
MICRESS® simulations for the prediction of microstructural evolution during intercritical annealing were conducted with the intent of incorporating mechanisms that may contribute to accelerated α → γ transformation during intercritical annealing. Simulations with variation in the number of austenite nucleation sites predicted an accelerated α → γ transformation with increasing number of austenite nucleation sites. Consistent with metallography and in situ austenite volume fraction assessments during intercritical annealing for conditions with varying amounts of prior cold deformation, simulations suggest that an increased austenite nucleation site density is a significant factor in accelerating α → γ transformation caused by increased prior cold deformation. Simulations including variations of the diffusivity pre-factor of Mn in ferrite were conducted based on the expectation that increasing prior cold deformation will increase the dislocation density in ferrite and thus provide accelerated transport of Mn through ferrite. The α → γ transformation rate was predicted to increase with increasing diffusivity pre-factor for Mn in ferrite, suggesting that changes in Mn diffusivity in ferrite due to prior cold deformation could be significant in accelerating α → γ transformation during intercritical annealing. The predicted increase in the α → γ transformation rate diminished as the Mn diffusivity in ferrite increased due to the predicted α-γ interface migration transitioning from diffusion controlled to interface controlled.

Author Contributions

Author contributions for this article are as follows: conceptualization, J.J.M., J.G.S., D.K.M., and E.D.M.; methodology, J.J.M.; formal analysis, J.J.M., J.G.S., D.K.M., and E.D.M.; investigation, J.J.M., J.G.S., D.K.M., and E.D.M.; writing—original draft preparation, J.J.M.; writing—review and editing, J.J.M., J.G.S., D.K.M., and E.D.M.; supervision, E.D.M.;

Funding

The authors gratefully acknowledge the support of Pacific Northwest National Laboratory, the sponsors of the Advanced Steel Processing and Products Research Center at the Colorado School of Mines, and the ASM Material Genome Toolkit. This work was funded by the Department of Energy’s Office of Vehicle Technologies under the Automotive Lightweighting Materials Program.

Conflicts of Interest

The authors declare no conflicts of interest.

References

  1. Merwin, M.J. Microstructure and Properties of Cold Rolled and Annealed Low-Carbon Manganese TRIP Steels. Iron Steel Technol. 2008, 5, 66–84. [Google Scholar]
  2. De Moor, E.; Matlock, D.K.; Speer, J.G.; Merwin, M.J. Austenite Stabilization Through Manganese Enrichment. Scr. Mater. 2011, 64, 185–188. [Google Scholar] [CrossRef]
  3. Gibbs, P.J.; De Moor, E.; Merwin, M.J.; Clausen, B.; Speer, J.G.; Matlock, D.K. Austenite stability effects on tensile behavior of manganese-enriched- austenite transformation-induced plasticity steel. Metall. Mater. Trans. A 2011, 42, 3691–3702. [Google Scholar] [CrossRef]
  4. Miller, R.L. Ultrafine-Grained Microstructures and Mechanical Properties of Alloy Steels. Metall. Trans. 1972, 3, 905–912. [Google Scholar] [CrossRef]
  5. Yang, D.Z.; Brown, E.L.; Matlock, D.K.; Krauss, G. Ferrite Recrystallization and Austenite Formation in Cold-Rolled Intercritically Annealed Steel. Metall. Trans. A 1985, 16, 1385–1392. [Google Scholar] [CrossRef]
  6. Huang, J.; Poole, W.J.; Militzer, M. Austenite Formation During Intercritical Annealing. Metall. Mater. Trans. A 2004, 35, 3363–3375. [Google Scholar] [CrossRef]
  7. Chbihi, A.; Barbier, D.; Germain, L.; Hazotte, A.; Gouné, M. Interactions Between Ferrite Recrystallization and Austenite Formation in High-Strength Steels. J. Mater. Sci. 2014, 49, 3608–3621. [Google Scholar] [CrossRef]
  8. Navara, E.; Bengtsson, B.; Easterling, K.E.; Easterling, K.E. Austenite Formation in Manganese-Partitioning Dual-Phase Steel. Mater. Sci. Technol. 1986, 2, 1196–1201. [Google Scholar] [CrossRef]
  9. Lee, S.; De Cooman, B.C. Influence of Carbide Precipitation and Dissolution on the Microstructure of ultra-fine-grained intercritically annealed medium manganese steel. Metall. Mater. Trans. A 2016, 47, 3263–3270. [Google Scholar] [CrossRef]
  10. Steinbach, I.; Pezzolla, F.; Nestler, B.; Seeßelberg, M.; Prieler, R.; Schmitz, G.J.; Rezende, J.L.L. A Phase Field Concept for Multiphase Systems. Phys. D 1996, 94, 135–147. [Google Scholar] [CrossRef]
  11. Militzer, M. Phase Field Modeling of Microstructure Evolution in Steels. Curr. Opin. Solid State Mater. Sci. 2011, 15, 106–115. [Google Scholar] [CrossRef]
  12. ASTM Int. Standard Practice for Quantitative Measurement and Reporting of Hypoeutectoid Carbon and Low-Alloy Steel Phase Transformations; ASTM International: West Conshohocken, PA, USA, 2004. [Google Scholar]
  13. Zhu, B.; Militzer, M. Phase-Field Modeling for Intercritical Annealing of a Dual-Phase Steel. Metall. Mater. Trans. A 2014, 46, 1073–1084. [Google Scholar] [CrossRef]
  14. De Cooman, B.C.; Speer, J.G. Fundamentals of Steel Product Physical Metallurgy; Association for Iron & Steel Technology: Materials Park, OH, USA, 2011; ISBN 978-1-935117-16-2. [Google Scholar]
  15. Azizi-Alizamini, H.; Militzer, M.; Poole, W.J. Austenite Formation in Plain Low-Carbon Steels. Mater. Sci. Eng. A 2011, 42, 1544–1557. [Google Scholar] [CrossRef]
  16. Mueller, J.J.; De Moor, E. Austenite growth and retention simulations in intercritically annealed medium manganese steels. In Proceedings of the Materials Science and Technology Conference and Exhibition 2017, Pittsburgh, PA, USA, 8–12 October 2017; Material Science and Technology: Warrendale, PA, USA, 2017. [Google Scholar]
  17. Dmitrieva, O.; Ponge, D.; Inden, G.; Millán, J.; Choi, P.; Sietsma, J.; Raabe, D. Chemical Gradients Across Phase Boundaries Between Martensite and Austenite in Steel Studied by Atom Probe Tomography and Simulation. Acta Mater. 2011, 59, 364–374. [Google Scholar] [CrossRef]
  18. Shewmon, P. Diffusion in Solids; The Minerals, Metals & Materials Society: Pittsburgh, PA, USA, 1989; ISBN 9780873391054. [Google Scholar]
  19. Balluffi, R.W.; Cahn, J.W. Mechanism for Diffusion Induced Grain Boundary Migration. Acta Metall. 1980, 29, 493–500. [Google Scholar] [CrossRef]
  20. Hillert, M. Phase Equilibria, Phase Diagrams and Phase Transformations: Their Thermodynamic Basis; Cambridge University Press: Cambridge, UK, 2007. [Google Scholar]
  21. De Moor, E.; Kang, S.; Speer, J.G.; Matlock, D.K. Manganese Diffusion in Third Generation Advanced High Strength Steels. In Proceedings of the International Conference on Mining, Materials and Metallurgical Engineering, Prague, Czech Republic, 11–12 August 2014. Keynote Lecture II. [Google Scholar]
  22. Porter, D.A.; Easterling, K.E. Phase Transformations in Metals and Alloys; CRC Press: Boca Raton, FL, USA, 1992. [Google Scholar]
Figure 1. Schematic depicting method for in situ austenite volume fraction assessments from dilatometry during intercritical annealing. Overlaid on the dilation data are dashed lines that extrapolate thermal expansion of the sample corresponding to regions when the sample is fully ferritic/tempered martensite and fully austenitic labeled α and γ, respectively. The line length fraction AC/AD corresponds to austenite volume fraction formed during heating and isothermal holding.
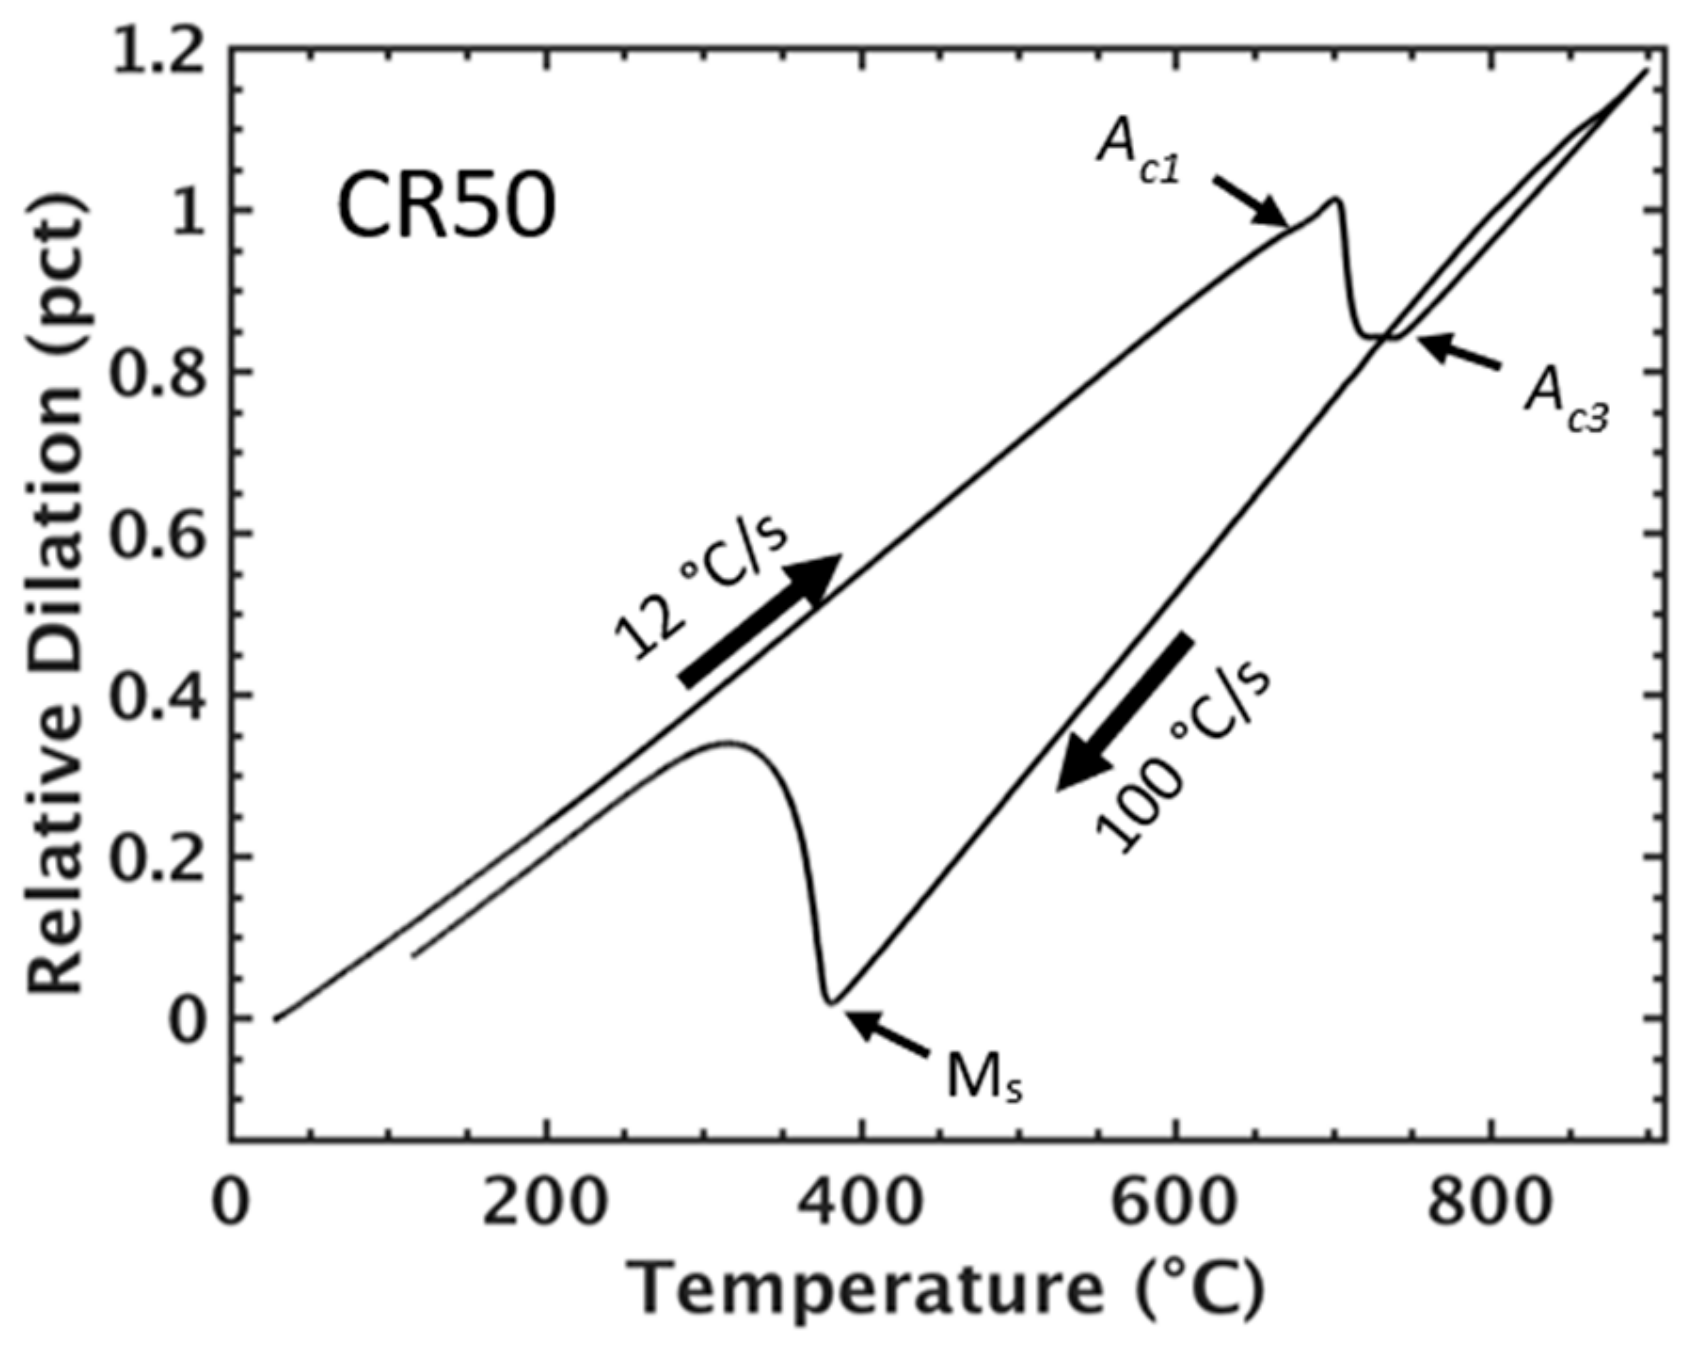
Metals 09 00926 g001
Figure 2. Dilation response of the CR50 condition during heating to 900 °C followed by quenching to 30 °C at 100 °C/s.
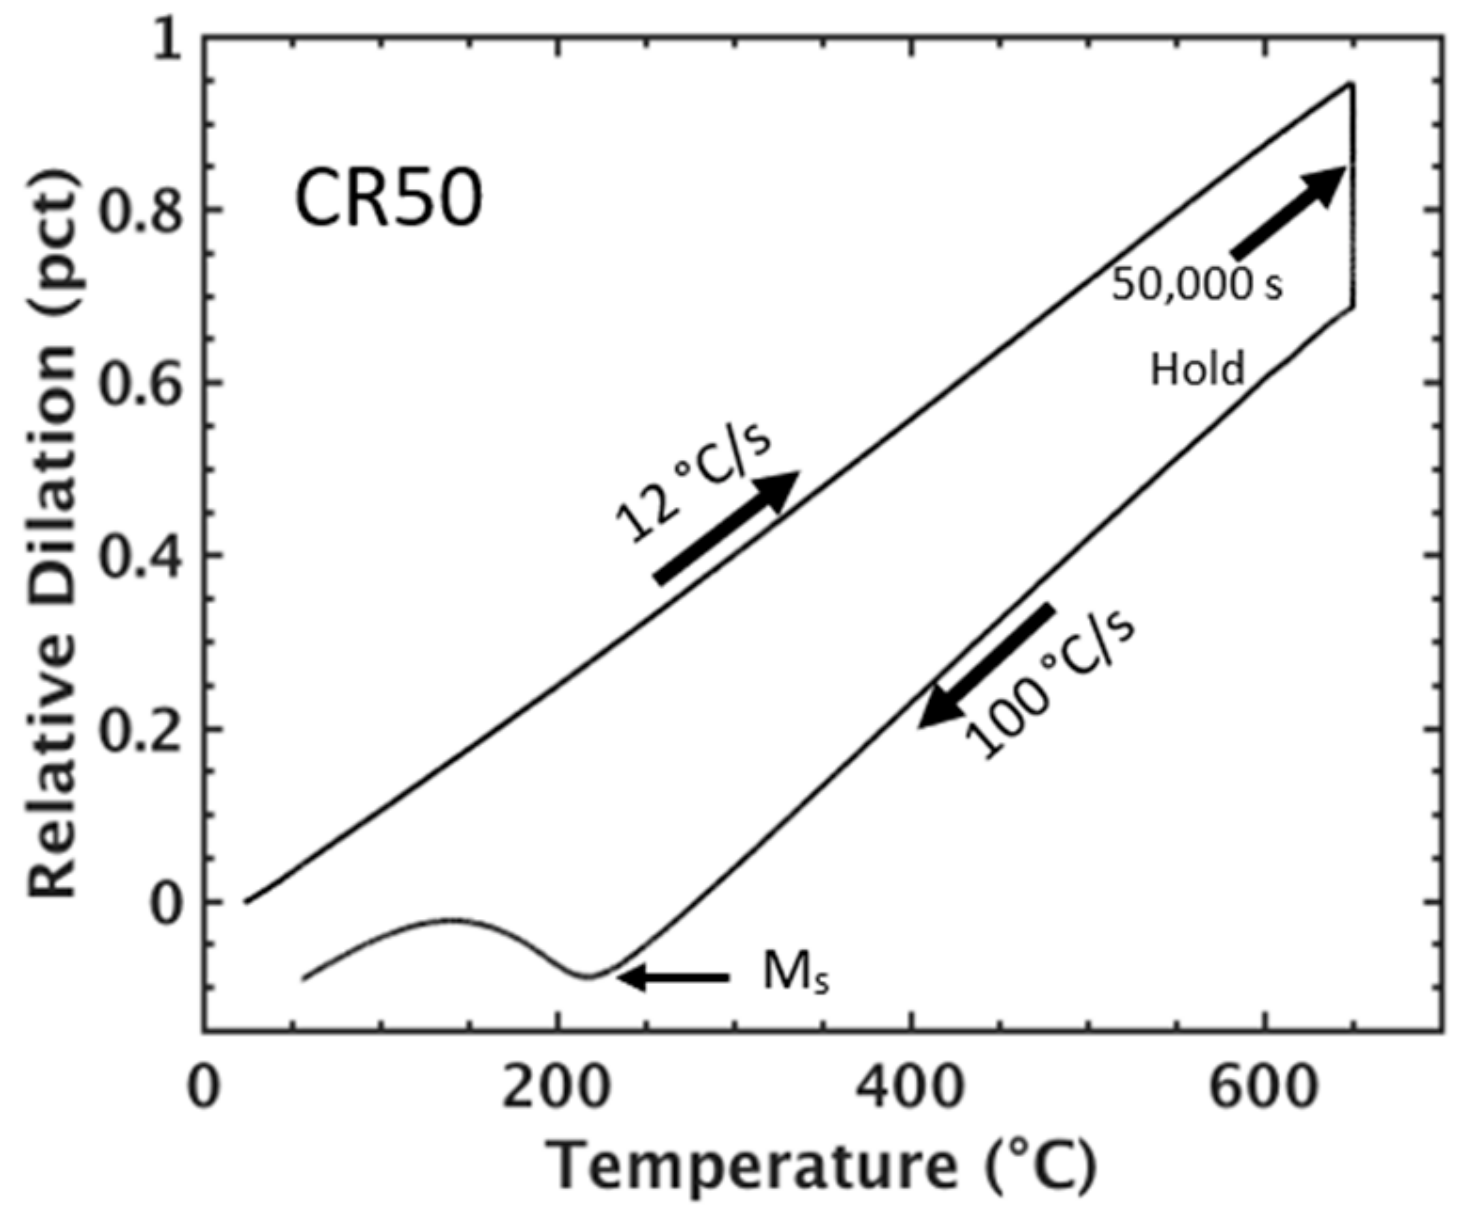
Metals 09 00926 g002
Figure 3. Dilation response of the CR50 condition during heating and isothermal holding at 650 °C for 50,000 s followed by quenching to 30 °C at 100 °C/s.
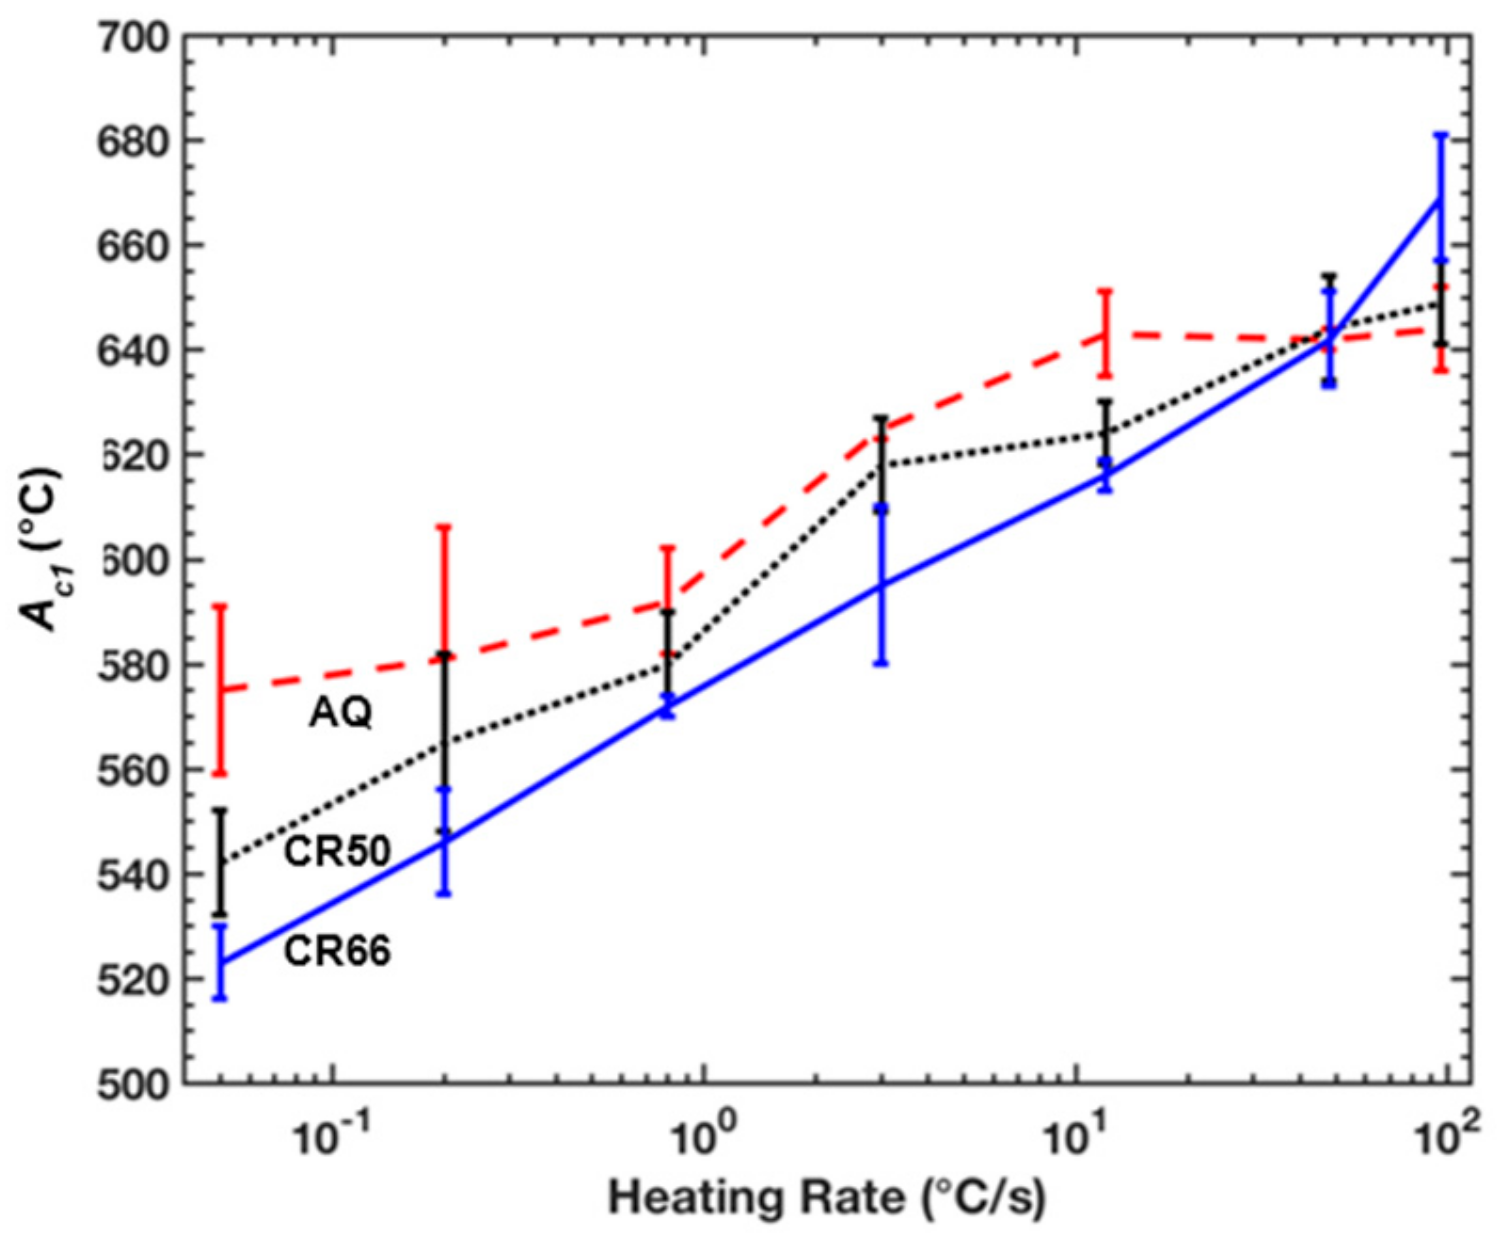
Metals 09 00926 g003
Figure 4. Ac1 temperatures assessed via dilatometry for each condition and heating rate.
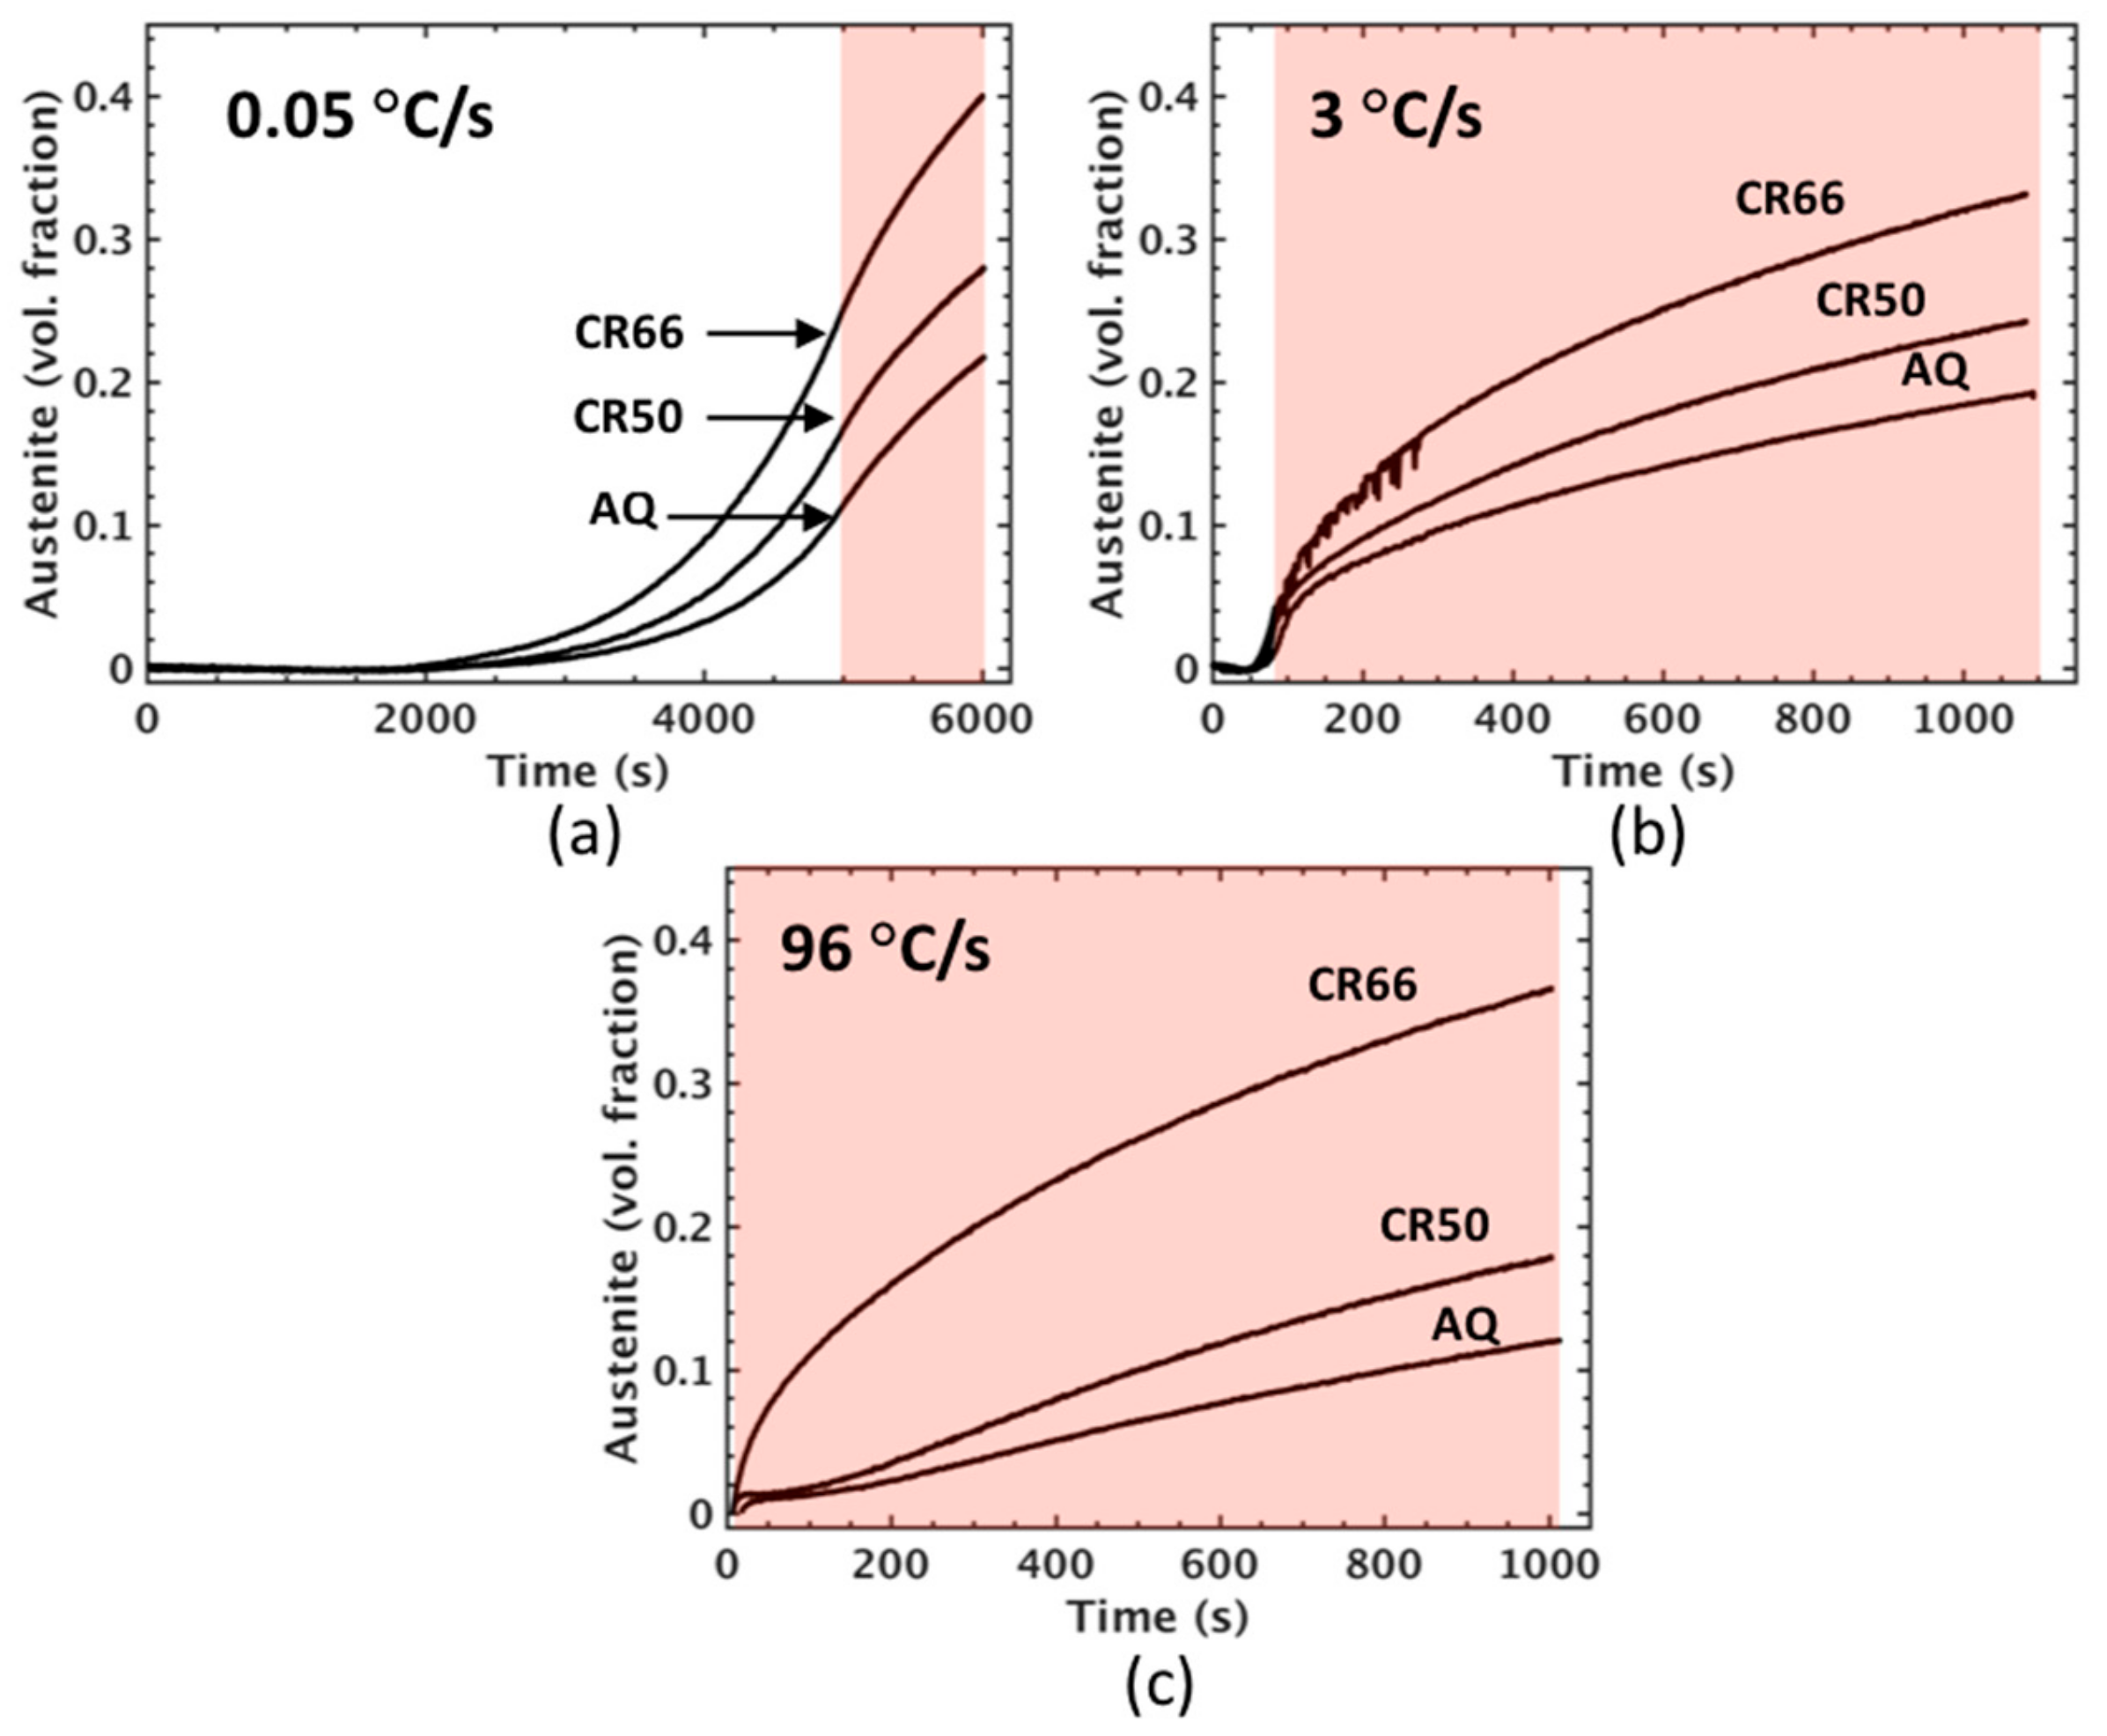
Metals 09 00926 g004
Figure 5. In situ austenite volume fraction assessments from dilatometry for intercritical annealing at 650 °C for each condition and heating rates of 0.05 °C/s (a), 3 °C/s (b), and 96 °C/s (c). Shaded areas indicate approximate duration of isothermal hold at 650 °C.
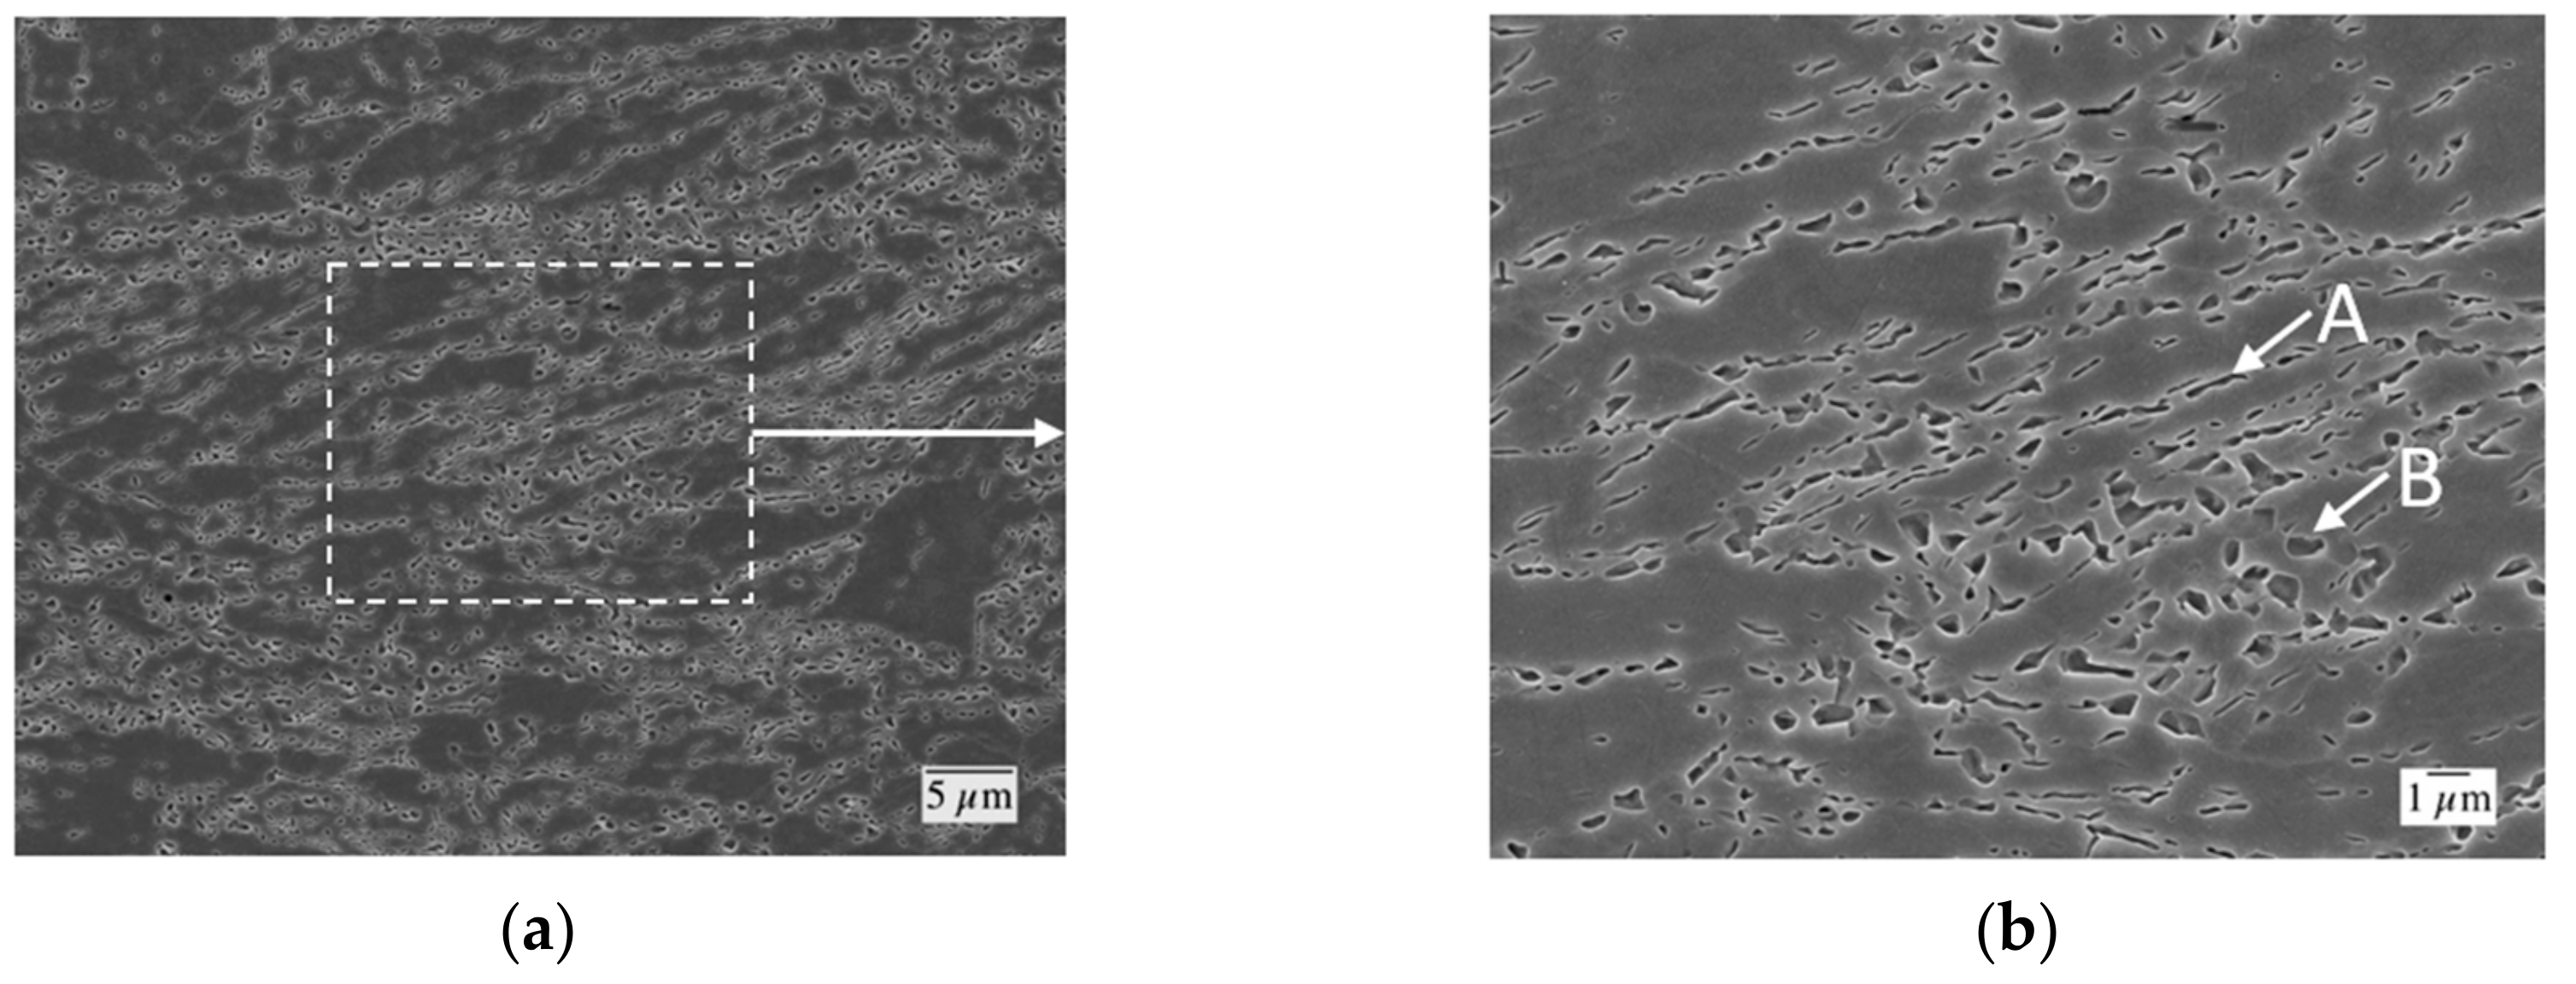
Metals 09 00926 g005
Figure 6. Field-emission scanning electron microscope (FESEM) images of the CR50 condition after heating to 650 °C at 0.05 °C/s followed by quenching to 30 °C at 100 °C/s. Higher magnification of the boxed region in (a) is shown in (b). Elongated regions of martensite (previously austenite) at deformed ferrite grain boundaries are labeled A. More equiaxed regions of martensite (previously austenite) are labeled B. One pct Nital Etch.
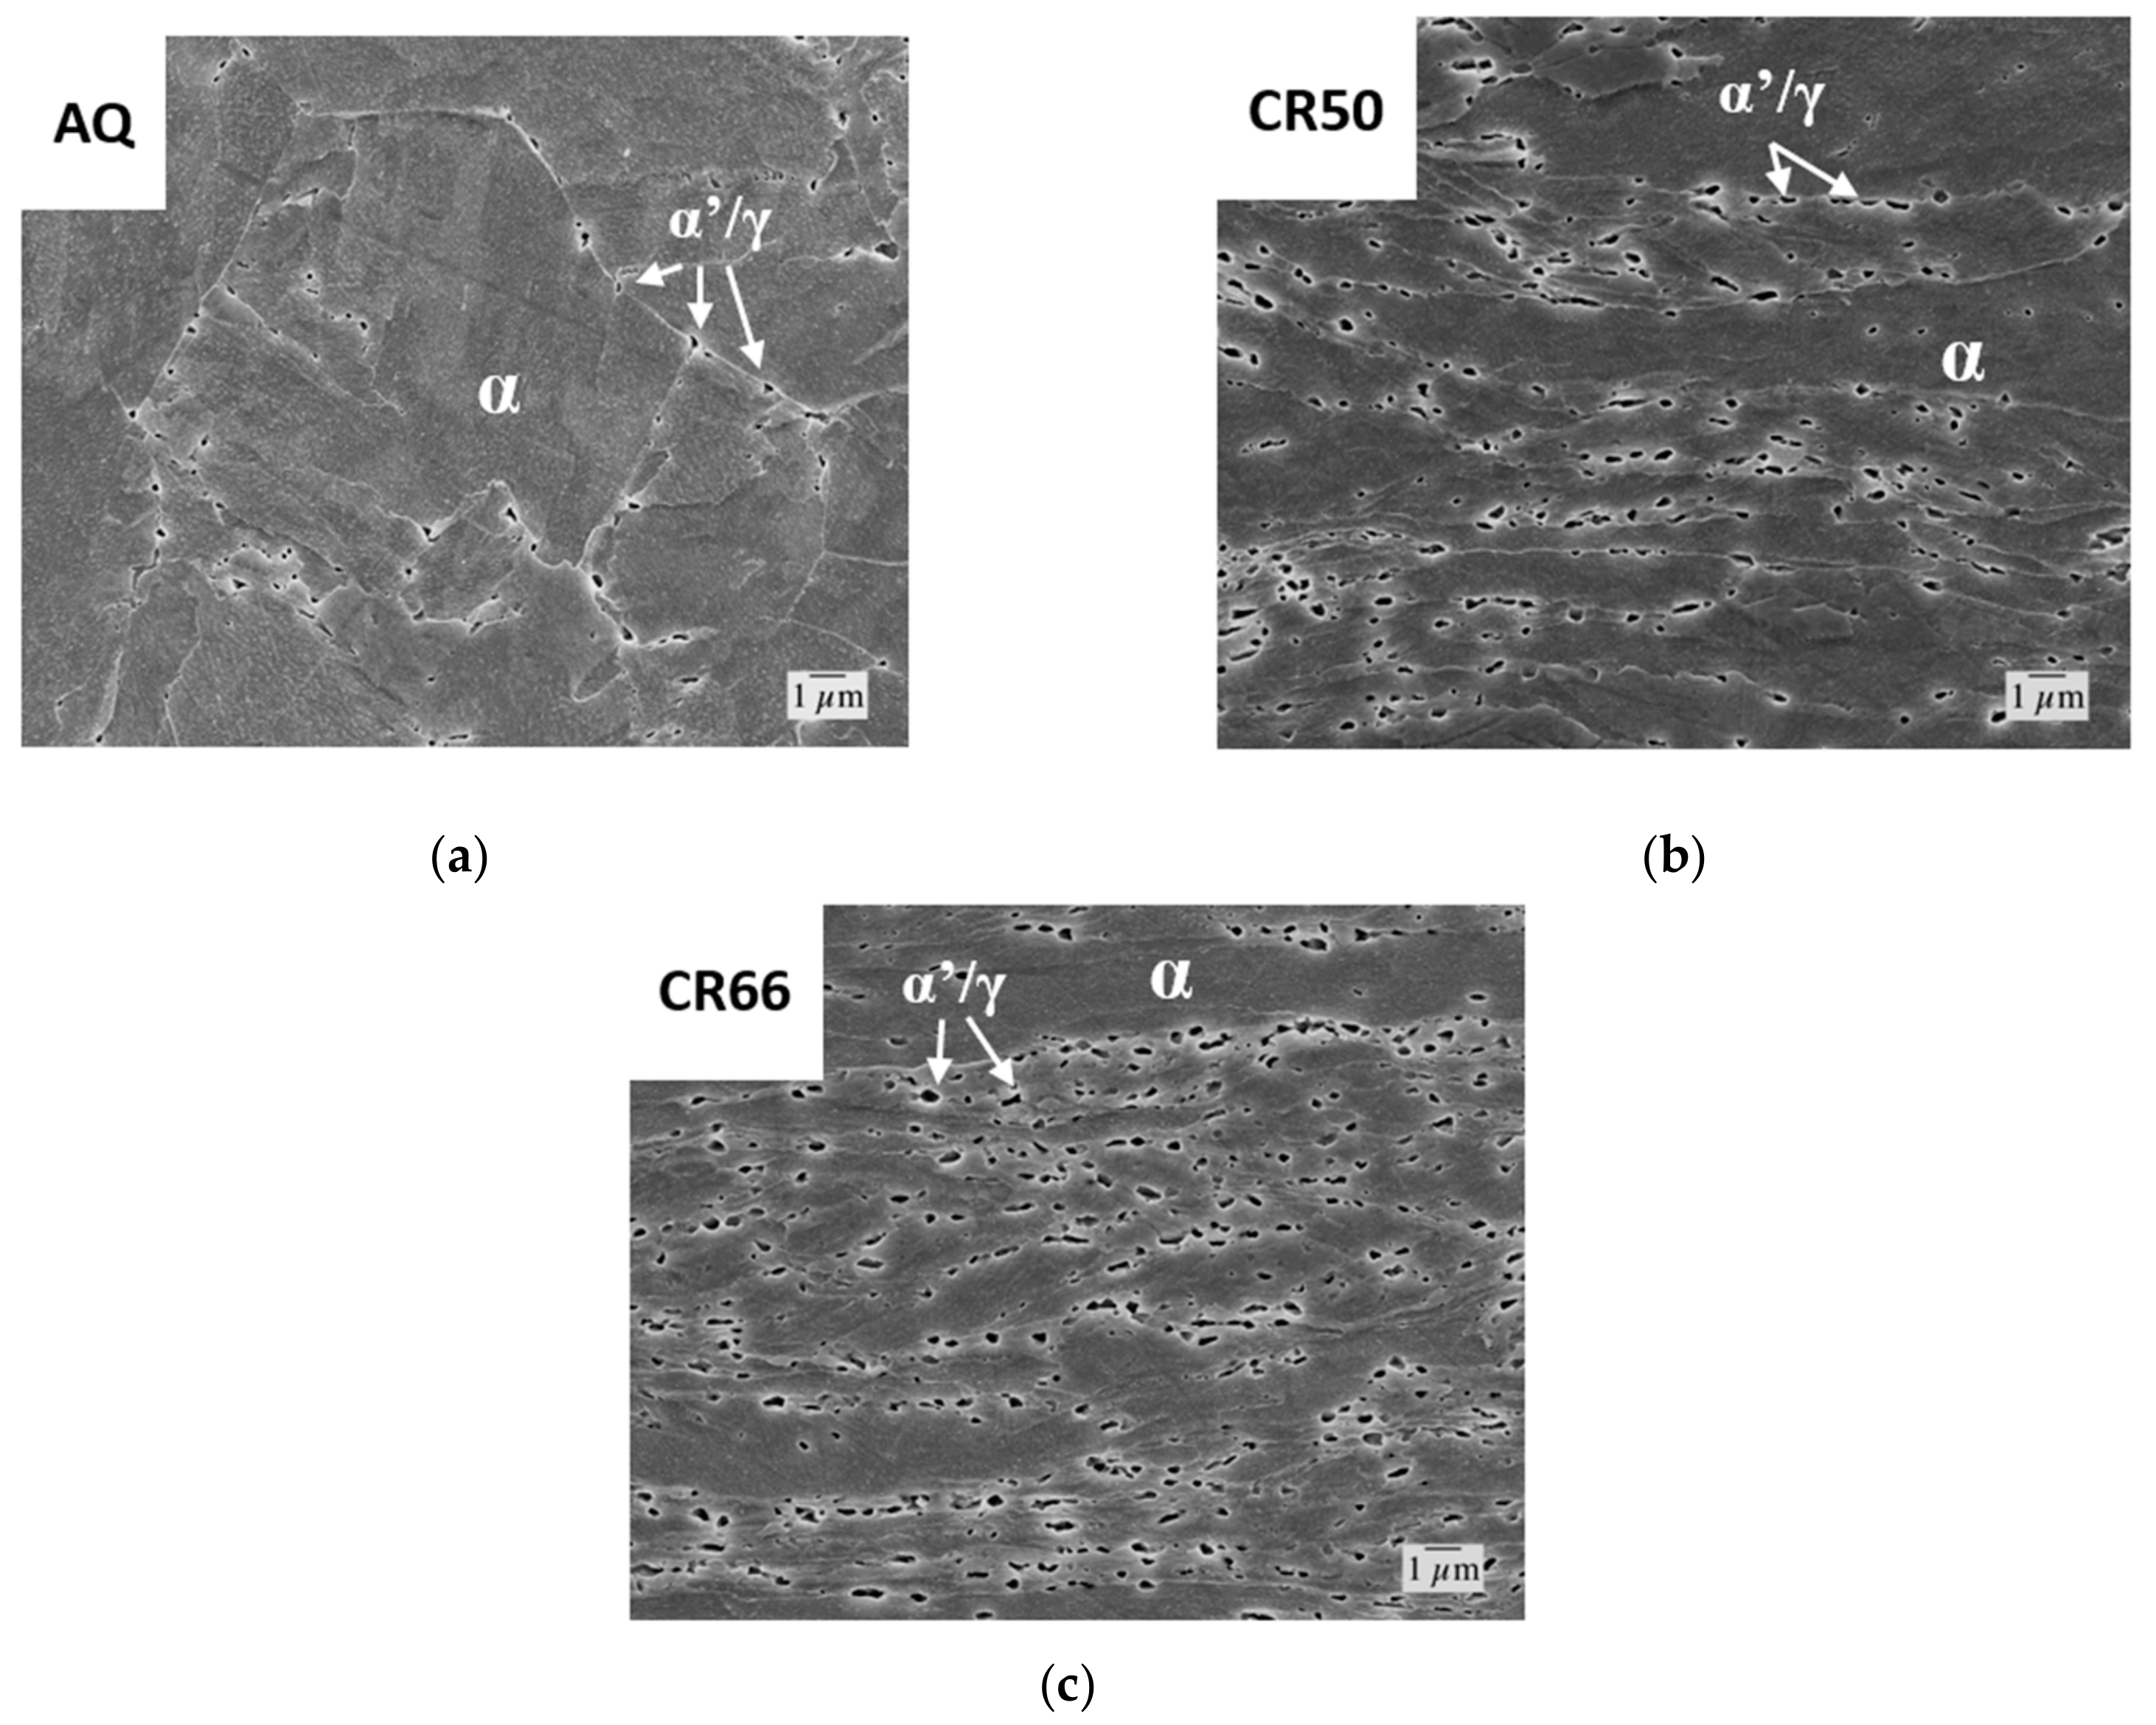
Metals 09 00926 g006
Figure 7. FESEM images of the (a) as-quenched (AQ), (b) CR50, and (c) CR66 conditions after heating to 500 °C at 12 °C/s and isothermal holding for 10,000 s followed by quenching to 30 °C at 100 °C/s. Regions of martensite (previously austenite) are labeled α’/γ. Regions of ferrite are labeled α. One pct Nital Etch.
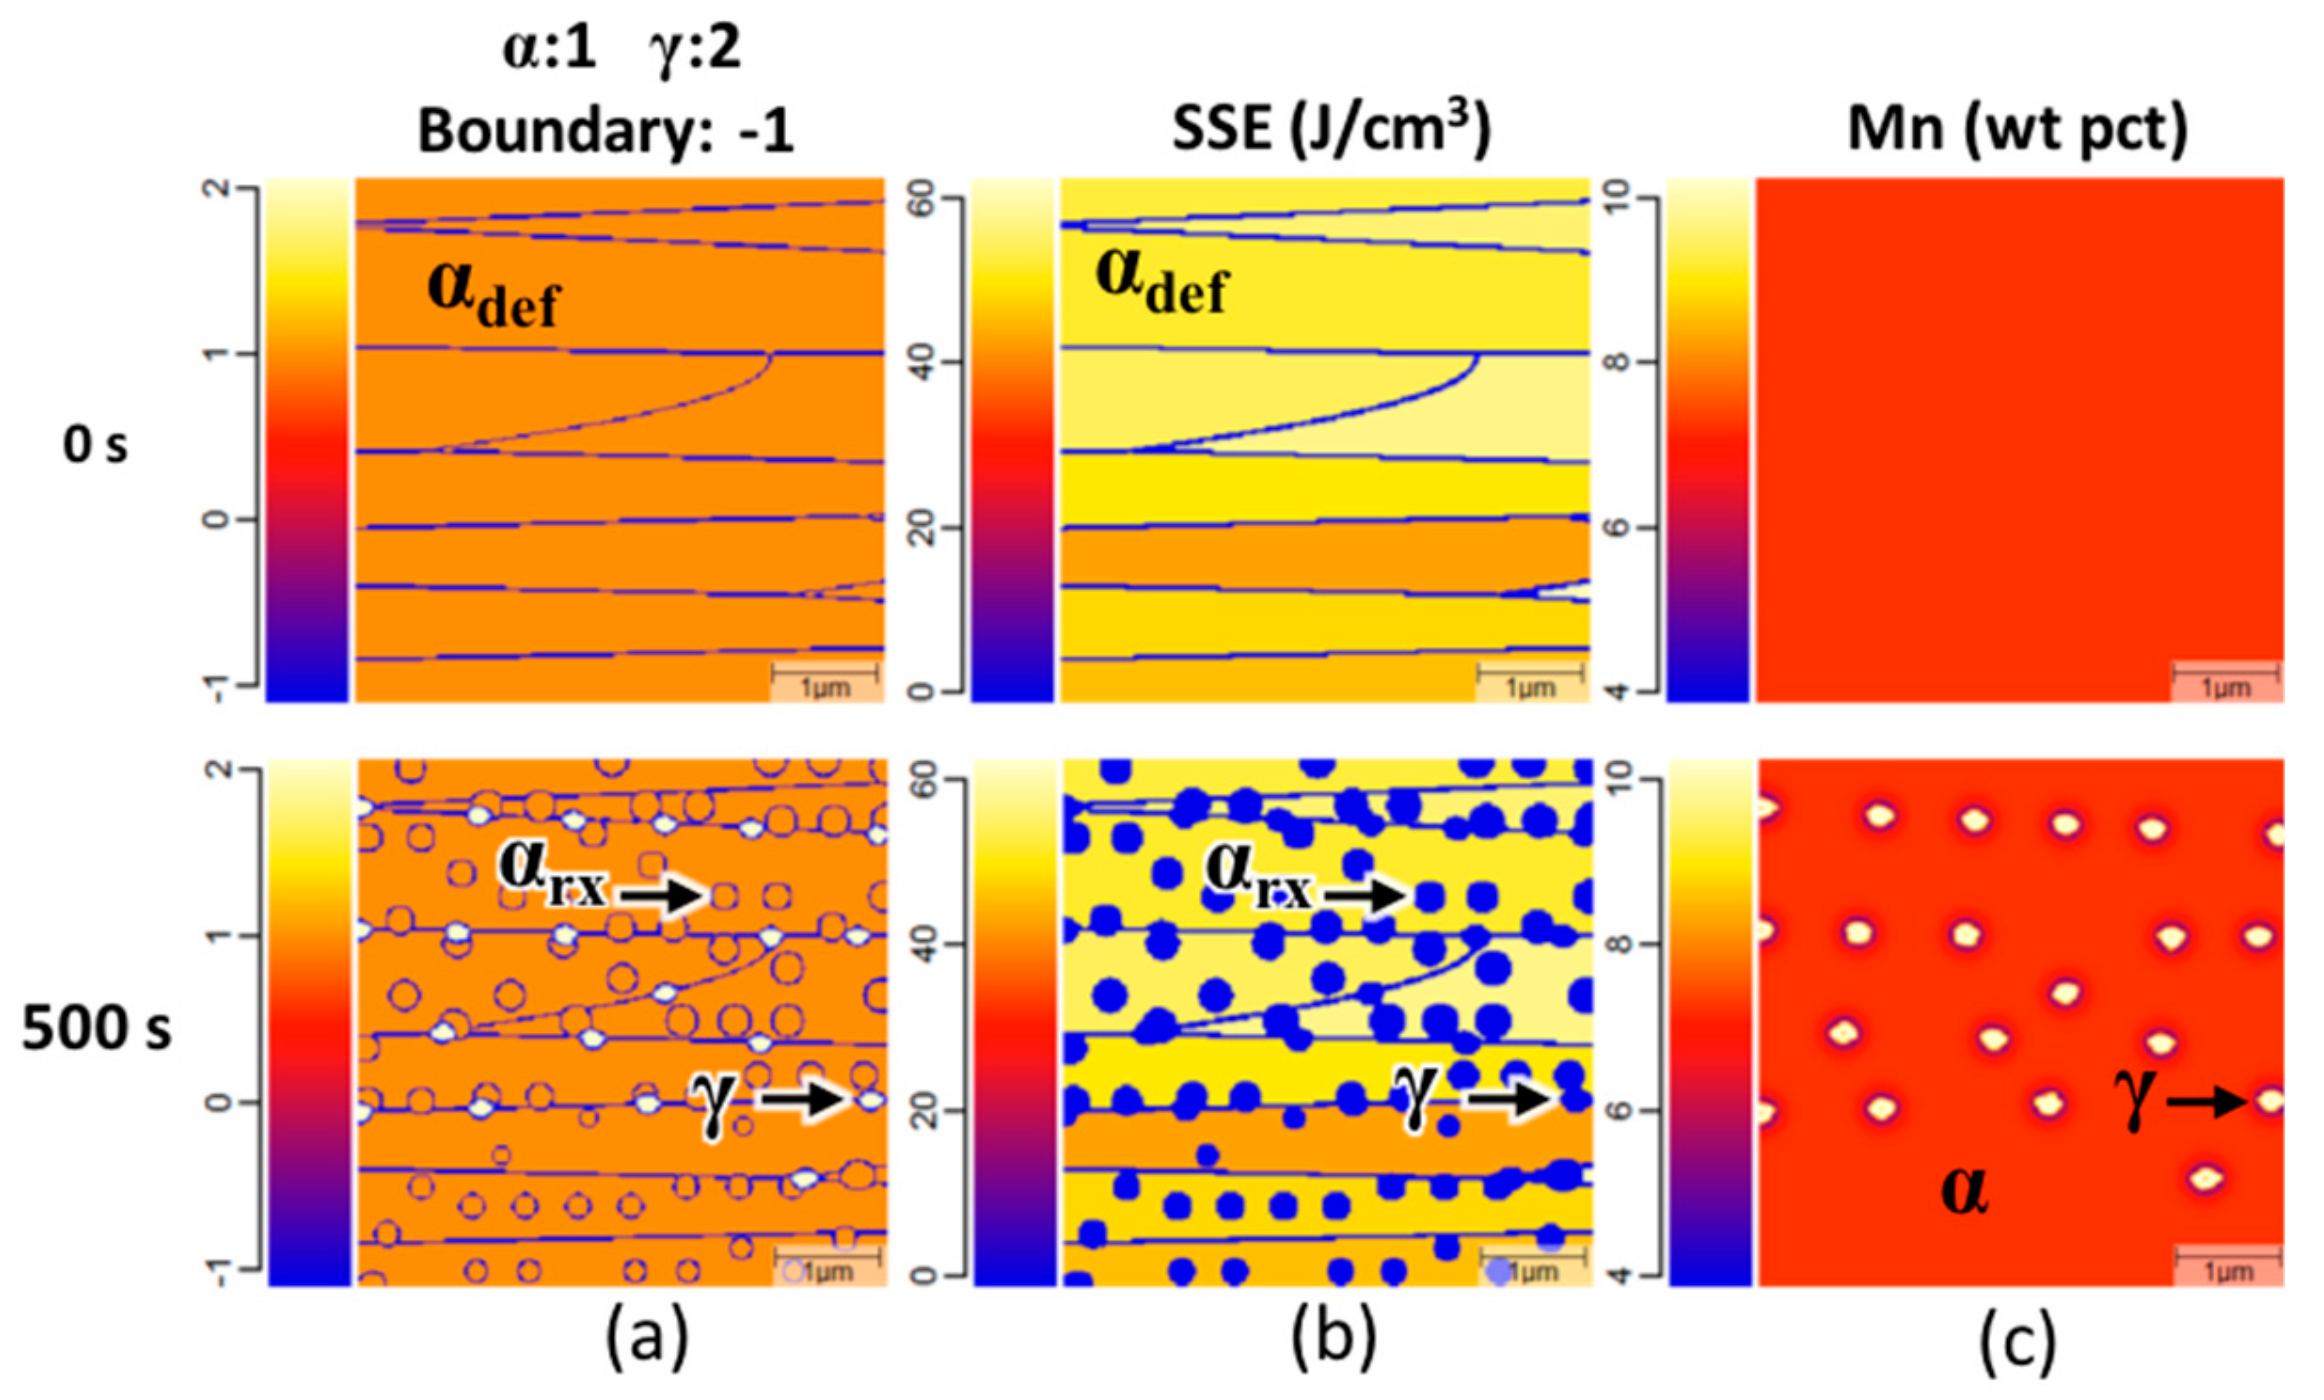
Metals 09 00926 g007
Figure 8. Exemplary MICRESS® simulation results of intercritical annealing with an isothermal holding temperature of 650 °C and a heating rate of 96 °C/s. Timesteps are shown at 0 and 500 s. In the phase maps: (a) The simulation is shown to initially contain only deformed ferrite; after 500 s the phase map shows the presence of homogenously nucleated recrystallized ferrite and ferrite grain boundary nucleated austenite. The stored strain energy maps (b) shows that the deformed ferrite has a distribution of stored strain energy and that recrystallized ferrite and austenite have no stored strain energy. The medium-manganese (Mn) distribution map (c) shows the simulation initially has a homogenous distribution of Mn and that austenite growth occurs with an enriched Mn concentration.
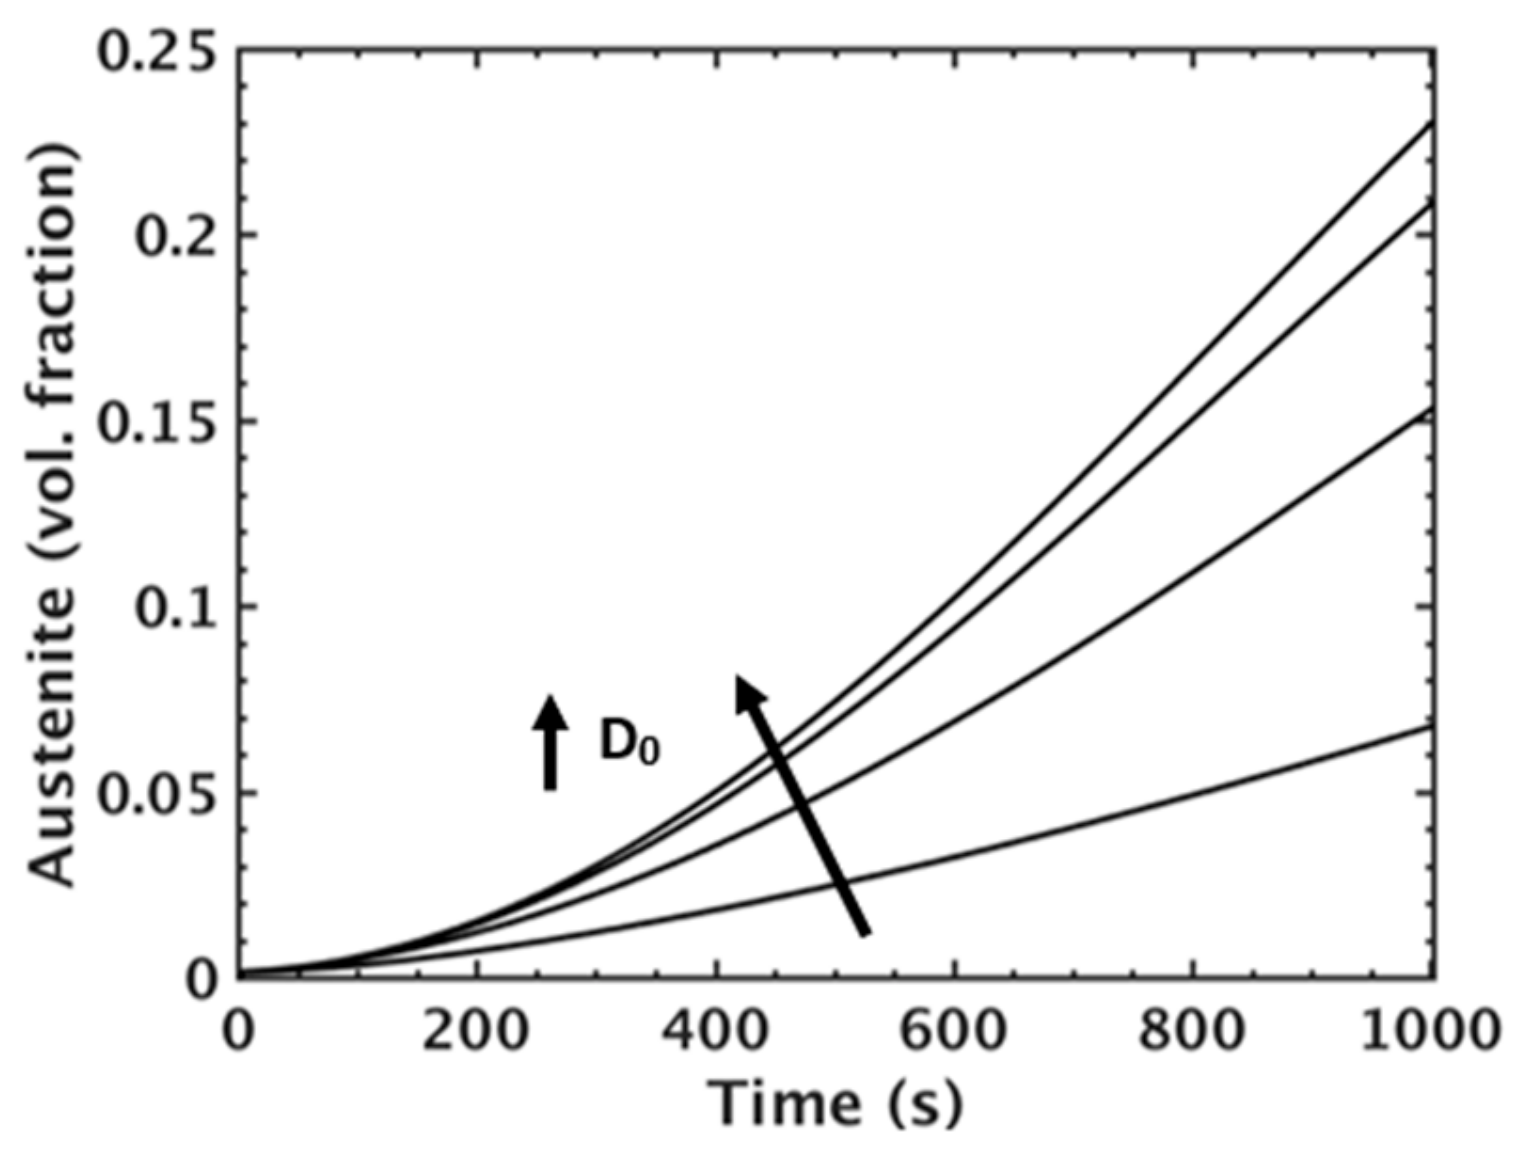
Metals 09 00926 g008
Figure 9. MICRESS® simulation results for austenite volume fraction during intercritical annealing for simulations incorporating different Mn diffusivity pre-factors for Mn diffusivity in ferrite (D0).
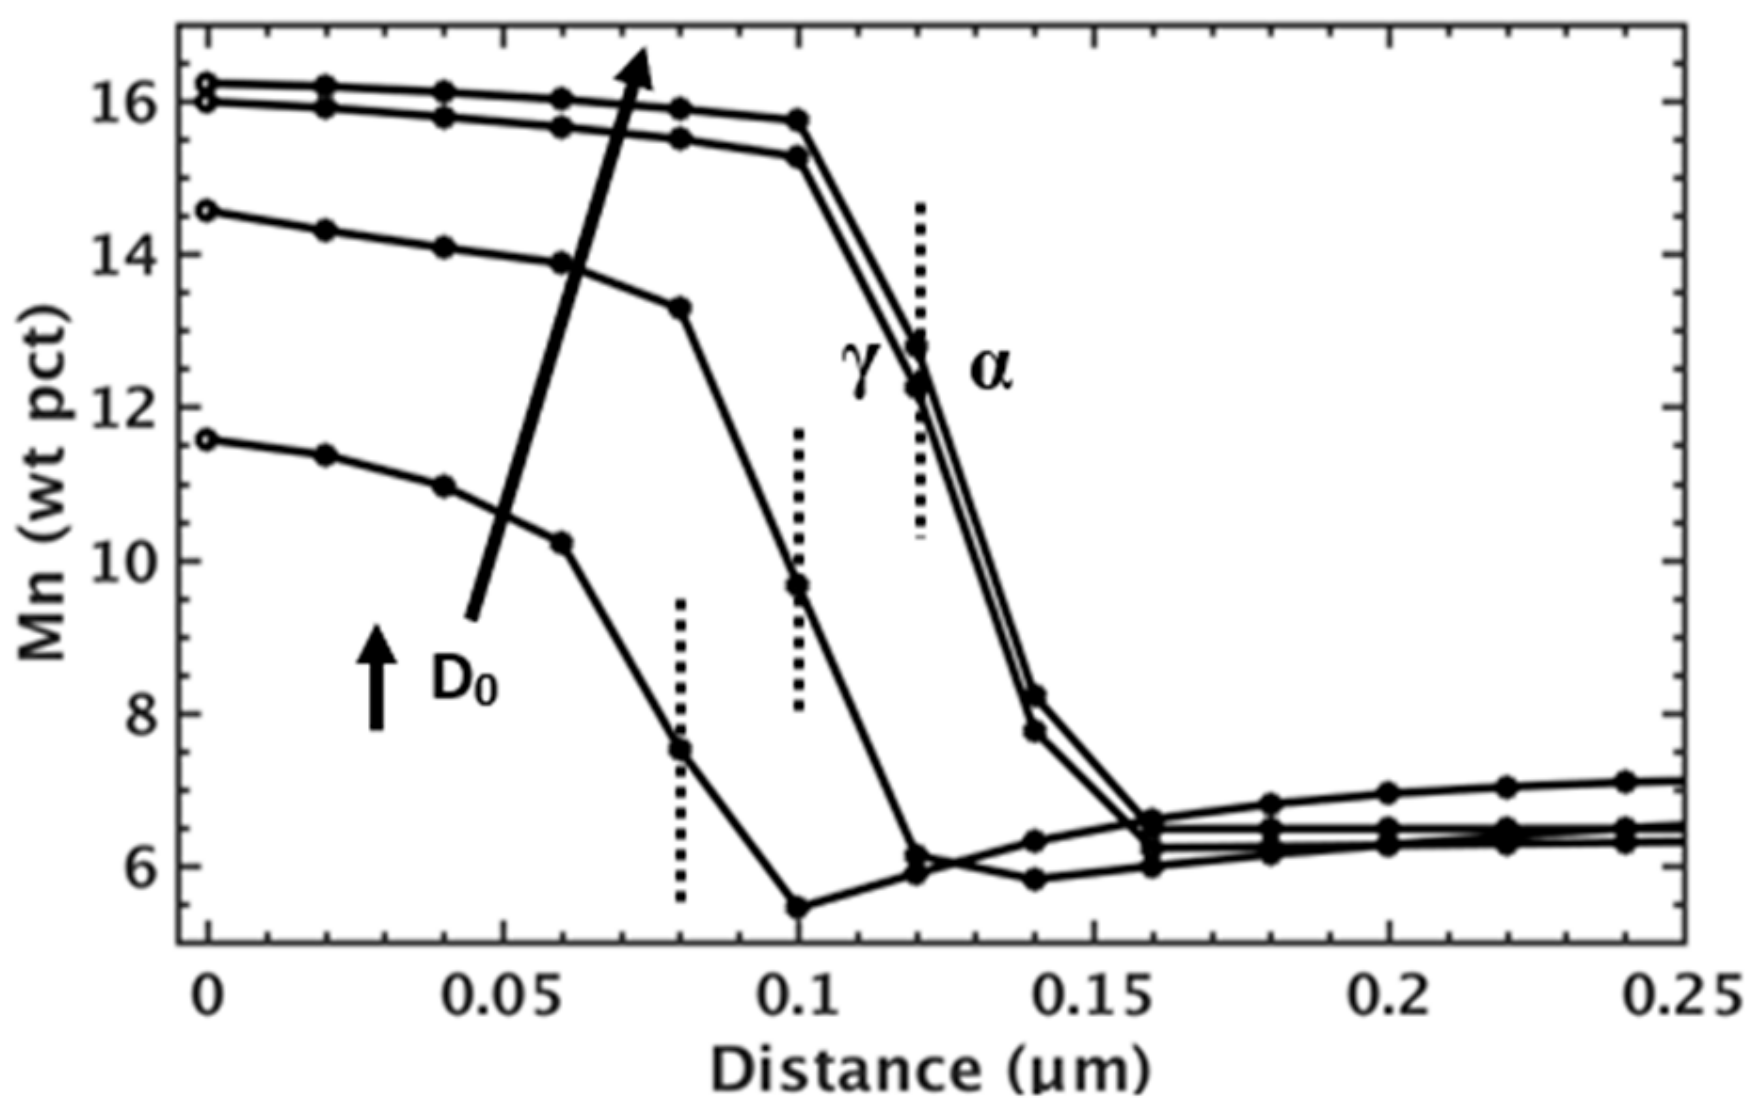
Metals 09 00926 g009
Figure 10. MICRESS® predictions for Mn distributions across the α-γ interface after a 500 s isothermal hold at 650 °C for simulations incorporating different Mn diffusivity pre-factors (D0) for Mn diffusivity in ferrite.
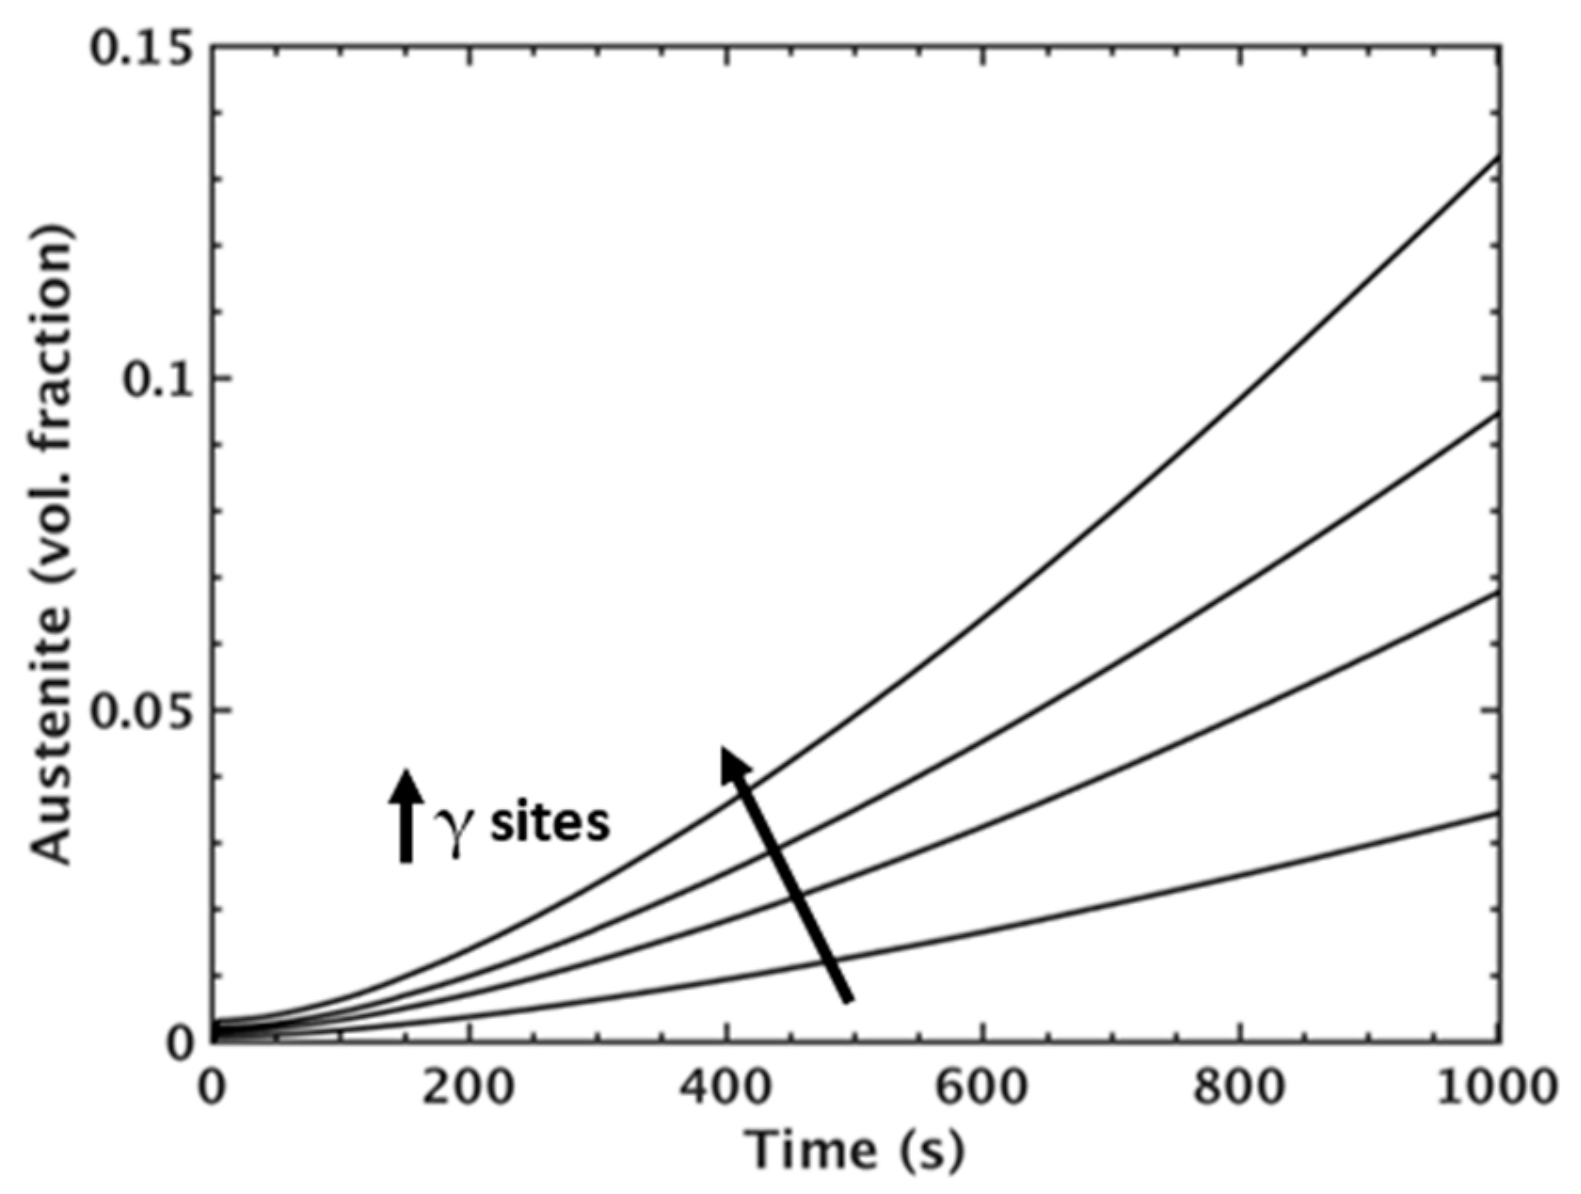
Metals 09 00926 g010
Figure 11. MICRESS® simulation results for austenite volume fraction during intercritical annealing for simulations incorporating different amounts of austenite nucleation sites (γ sites).
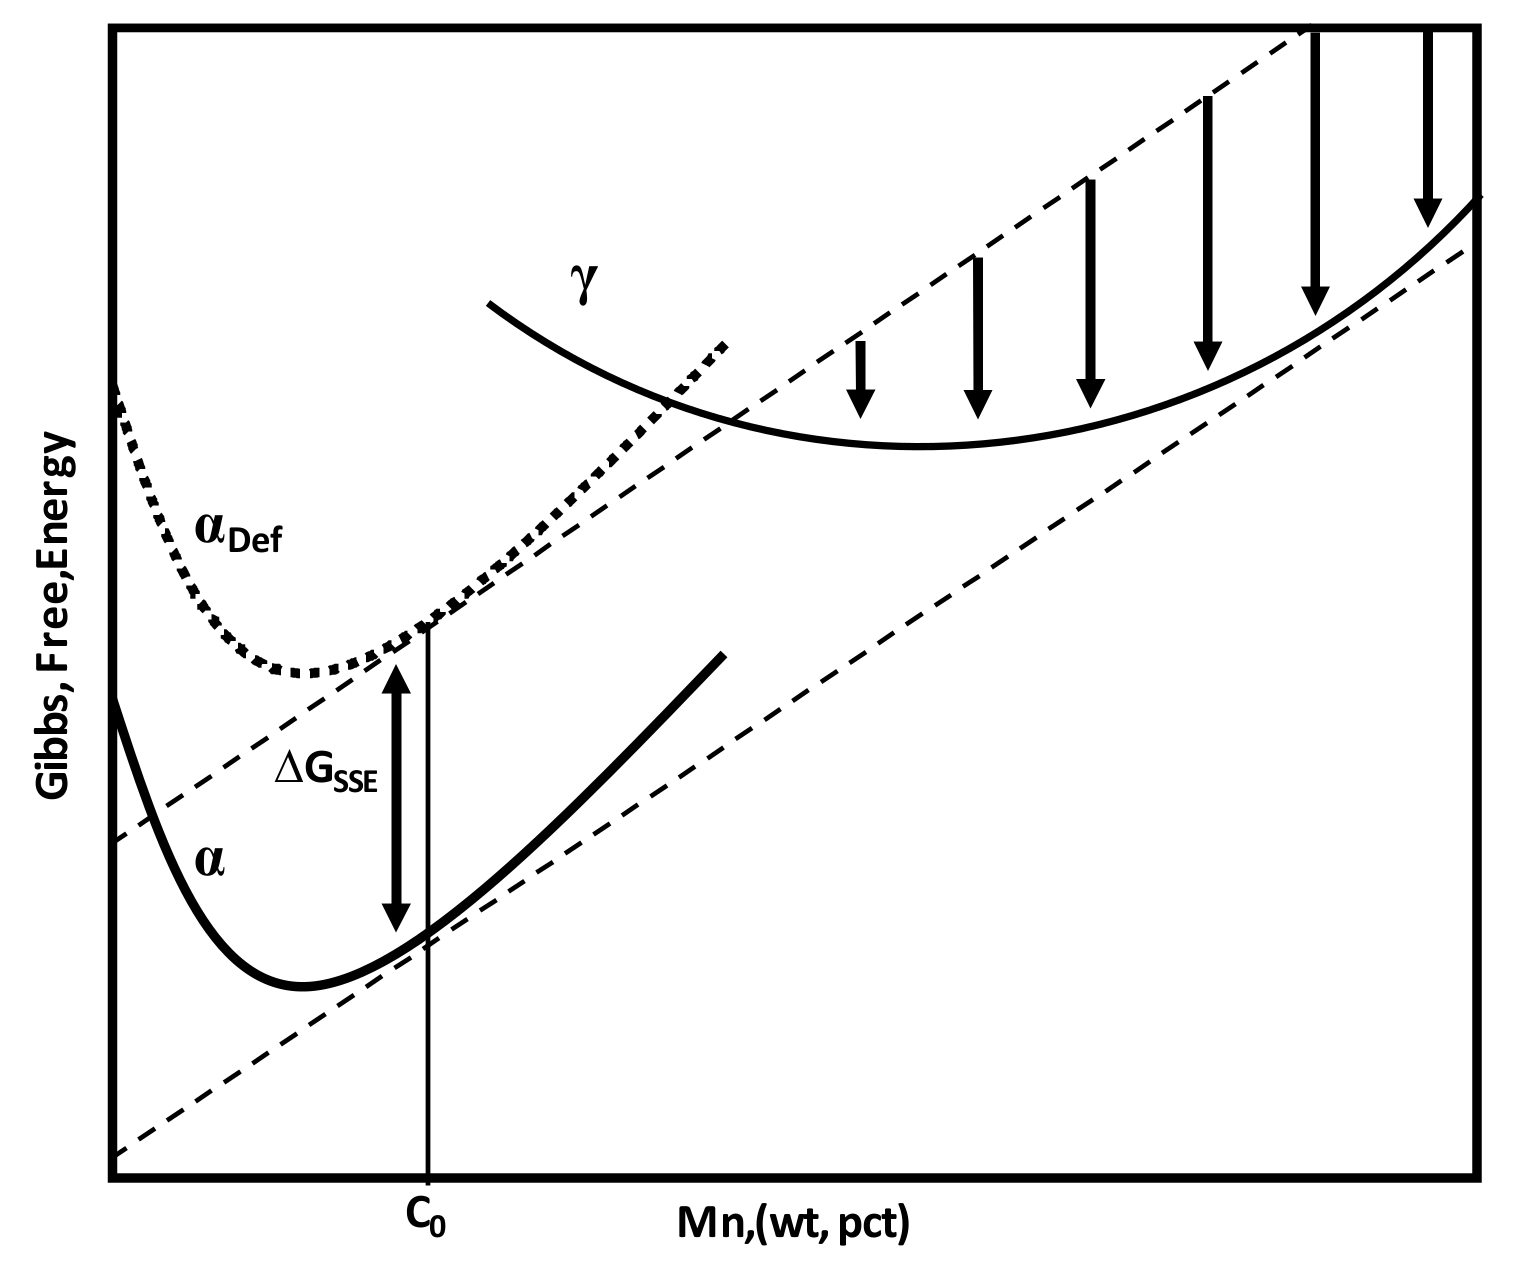
Metals 09 00926 g011
Figure 12. Schematic of Gibbs free energy curves for ferrite, deformed ferrite, and austenite showing driving force for austenite nucleation only from deformed ferrite.
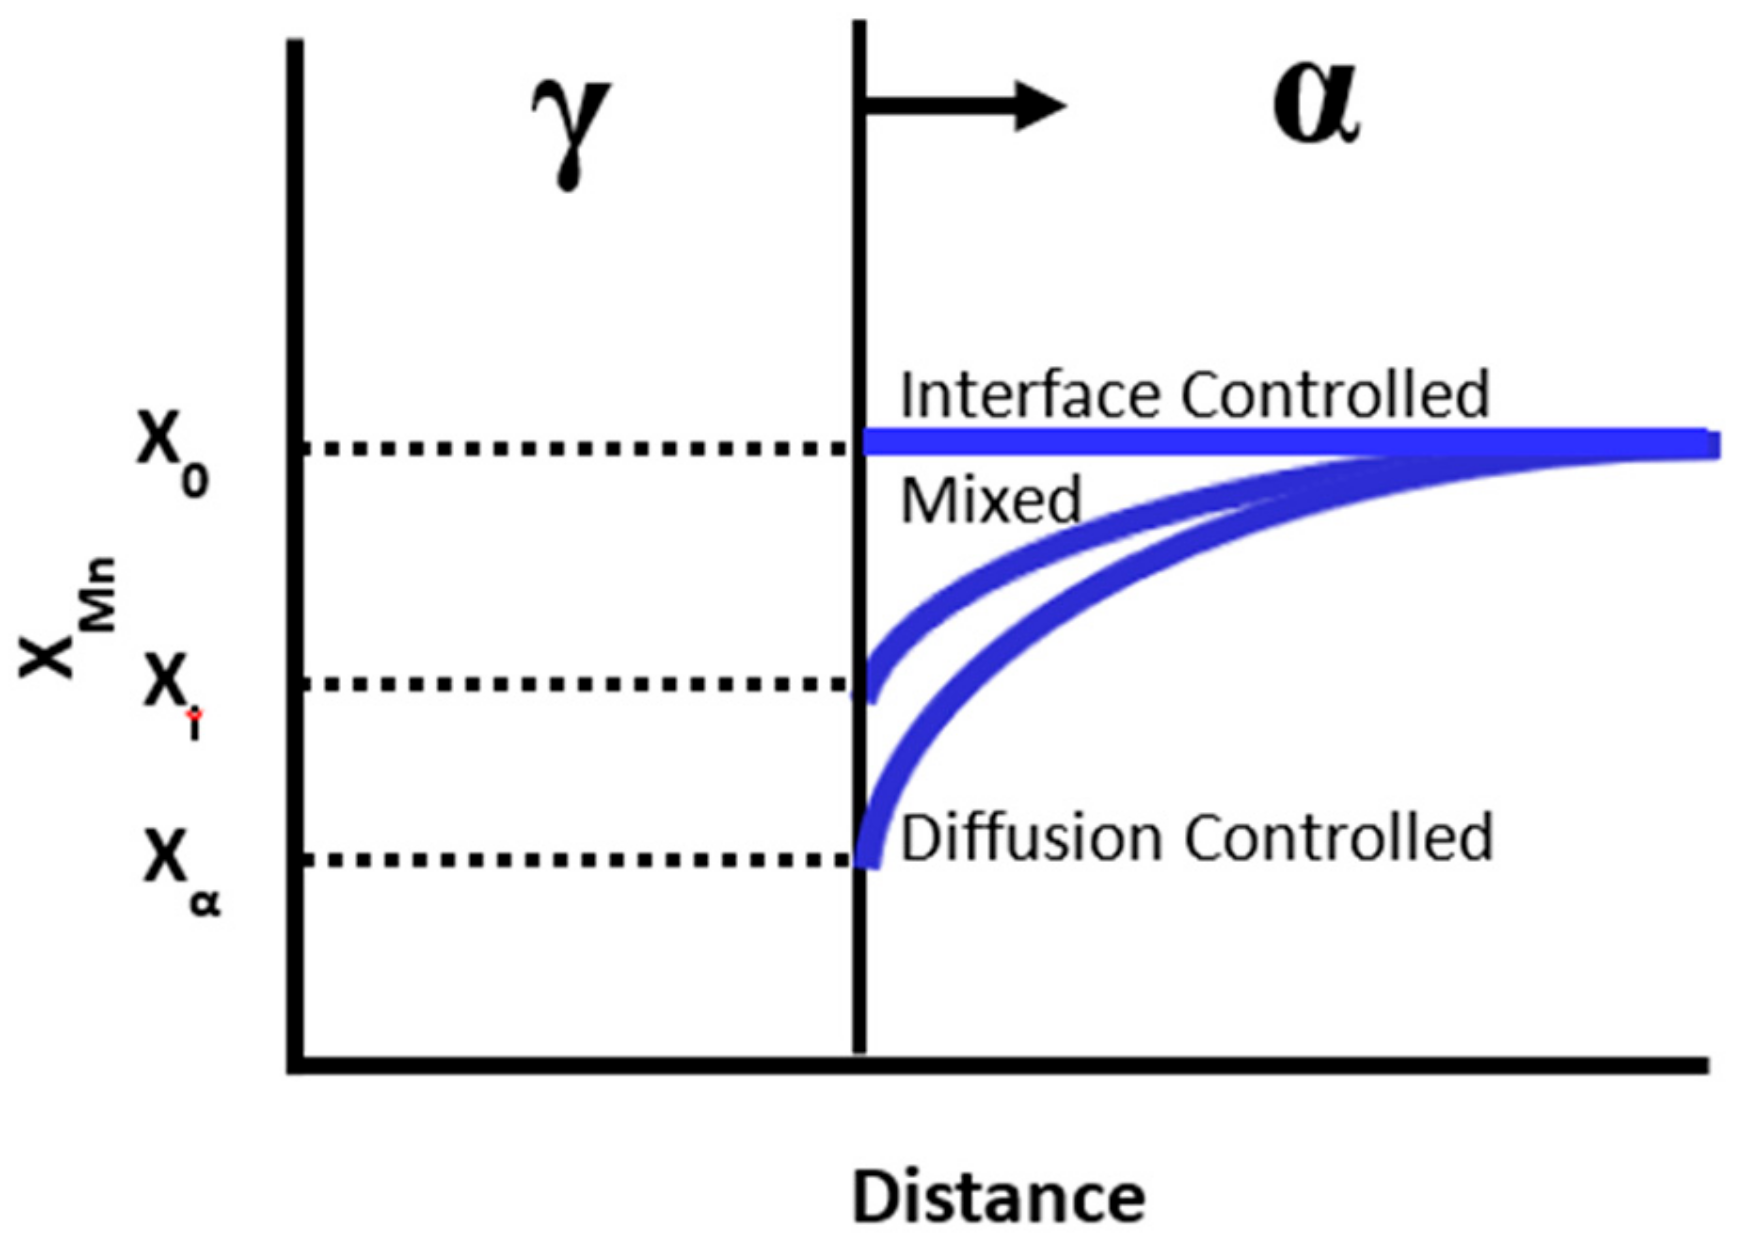
Metals 09 00926 g012
Figure 13. Schematic showing the Mn concentration in ferrite ahead of an advancing α-γ boundary.
Metals 09 00926 g013
Table 1. Parameters for Initial MICRESS® Simulation.
ParameterValue
Interface Energy (J/cm2)-
α-α8.0 × 10⁻⁵
γ-γ5.0 × 10⁻⁵
α-γ7.0 × 10⁻⁵
Interface Mobility (α-α/γ-γ/α-γ)-
M0 (cm4/J s)0.05
G* (J/mol)140,000
Number of γ Nucleation Sites20
Mn Diffusivity in α-
D0 (cm2/s)0.756
Q (J/mol)224,500
Stored Strain Energy in α (J/cm3)10–15
Table 2. Parameter Variations for MICRESS® Simulations.
ParameterValue
Number of γ Nucleation Sites10, 20, 30, 40
Mn Diffusivity Pre-Factor in α-D0 (cm2/s)0.756, 7.56, 75.6, 7560

