Article

Light-Weight Topological Optimization for Upper Arm of an Industrial Welding Robot

1
College of Electromechanical Engineering, Guangdong Polytechnic Normal University, Guangzhou 510635, China
2
School of Mechanical and Automotive Engineering, South China University of Technology, Guangzhou 510640, China
3
School of Mechatronical Engineering, Beijing Institute of Technology, Beijing 100081, China
*
Author to whom correspondence should be addressed.
Metals 2019, 9(9), 1020; https://doi.org/10.3390/met9091020
Submission received: 12 July 2019 / Revised: 5 September 2019 / Accepted: 16 September 2019 / Published: 19 September 2019

Abstract

:
To reduce weight and improve overall performance of the industrial welding robot, light-weight design using the finite element method and structural topological optimization is presented in this paper. The work analyzed an upper arm of an industrial welding robot in the most unfavorable working condition, both under static and dynamic working situations, using ABAQUS and ADAMS software tools. Then the Tosca unit in ABAQUS was employed to accomplish the structural topological optimization, in order to reduce weight and improve the natural frequencies under the situation of low orders. The analyses results showed that the actual weight had been reduced to 17.9%, and the natural frequencies in low orders had increased. The maximum Mises stress, tensile stress, and elastic displacement of the gyration center had decreased. Lastly, an actual product was produced according to the model obtained from preceding analyses. The experiments of the repeatability tests showed that the overall performance of the optimized upper arm had been improved when compared to the original one. This research can present references and foundations for the kinetic analyses under the static and dynamic working conditions, and structural topological optimization designs for relative industrial welding robots.

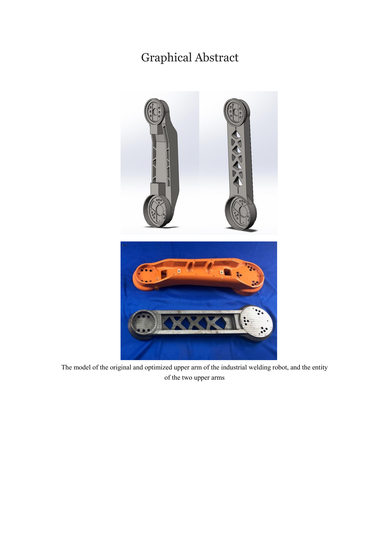
Graphical Abstract

1. Introduction

Recently, industrial robots are more commonly used in different kinds of applications [1,2], such as for automating the shaping of food [3], in automating medical assistant facilities [4,5], in the assembly of flexible objects [6], and more. Robotics can help human workers accomplish various difficult jobs. There are many welding robots working in different industrial occasions, such as in rapidly forming metals [7], shipbuilding engineering [8], and components manufacturing [9]. During these applications, industrial robots can improve the welding process in various kinds of functions, such as in detecting and localizing tooth saw shape for the butt joint [10], assisting the welding process following a straight line [11], and more. However, traditional robots, which have no light-weight design, have unwieldy structures, which may induce the robots that require more energy to complete some unnecessary movements. In addition, the maximum weight of loads and the working environment can be significantly restricted. In general, some clear drawbacks of the commonly employed industrial robots included high power consumption, low payload-weight ratio, bulky structure, and complex auxiliary [12]. The light-weight design can solve many of these problems, and improve the working efficiency and actual production rate. Hence, it is necessary to take measures to reduce the weights and energy losses, so as to improve the performance and increase the ratio between loads and self-weight.
Corresponding research studies were conducted by many companies, or scholars and experts. Some research studies focused on the application of new types of materials or structural optimization. For example, industrial machine tools and corresponding robots using carbon fiber composite materials were developed by the Advanced Manufacturing Research Center (AMRC) of the University of Sheffield and Exechon Enterprises LLC in United Arab Emirates. The detailed introductions can be found on their websites [13,14]. In addition to the new types of materials in the light-weight designing and manufacturing of industrial robots, more research studies focused on structural optimization. In general, the industrial robots are composed of homogeneous metal materials, and this kind of robotics has some special characteristics, such as multiple degrees of freedom (DOF). More repetitive works are required to execute these degrees of freedom. Corresponding structural designs have some special difficulties [15,16,17,18]. Traditional methods rely on experts’ experiences and these kinds of experiments may increase the costs of production and the randomness of the products [19]. To solve the problems, a structural finite element optimization design is more likely employed in this area. A flexible link robotic manipulator was developed and considered as a Euler-Bernoulli beam by Hegde et al. [20], and then the finite element model was used to maximize the stiffness and minimize the mass. Frecker et al. [21] presented a new method for topological synthesis of single-piece compliant mechanisms. They used a truss ground structure and a two-dimensional continuum as design examples to illustrate the mechanisms and methods. Kaveh and Talatahari [22] employed particle swarm ant colony optimization to design the truss structures. The method can create an optimum solution and rapidly attain the feasible solution space for optimizing the truss topological structural designs. Song et al. [23] presented a static kinetic analysis and topology optimization for a six-DOF industrial welding robot. Corresponding theoretical analysis and the final results showed the effectiveness of the structural design and topology optimization using corresponding software. Based on the finite element method, Xu [24] analyzed the structure of an arc welding robot, and the arm of the robot was successfully reduced through size and topological optimization designing. Guan et al. [25] proposed a method for the structural analysis and optimal design for an industrial series handling robots based on the software of ADAMS and ANSYS. In the end, the optimized robot could achieve a total static deformation decrement of 78.1%, and achieve a first-order natural frequency improvement of 49.6% at the cost of a mass increment of only 6%, which meant that the method of using software tools to complete topological and structural optimization was effective and feasible.
However, even though there were many previous works contributing to light-weight design for the structure of the industrial robot, and some important achievements have been gained [26,27,28], the majority of these works only focused on employing software tools to do numerical analysis and simulation optimization. Since the actual manufacturing and production processes were seldom considered, many optimized models cannot be used in actual applications in relative areas [29,30]. In addition, because lacking an actual production process, the availability of the optimized model cannot be effectively validated, and actual performance parameters cannot be obtained, which significantly affects the popularization of the light-weight structures. Hence, combining the numerical calculation using a finite element method and validation by means of actual products is an effective method to explore how to employ structural topological optimization to serve the practical industrial production.
This work focused on the light-weight design of an RB20 industrial robot, which was manufactured by GSK CNC Equipment Co. Ltd. (Guangzhou, China) and usually employed to do arc welding operations. Hence, the objective of this work is designing relative light-weight structures to replace the original ones, so as to make the welding torch flexibly and accurately move, and be able to effectively track the preliminary trajectory to obtain weld beads with a satisfactory quality. Therefore, the research can improve the welding efficiency and save costs in reality, and then extend the application of this type of welding industrial robot to various applications. The rest of this paper is organized as follows. In Section 2, the rigid-flexible coupled kinetic simulation of this industrial welding robot was realized using both ABAQUS (ABAQUS 2016, Simuleon BV, 's-Hertogenbosch, Netherlands) and ADAMS (ADAMS 2015, MSC Software, Newport Beach, CA, USA), and stress analysis in the most unfavorable working condition and modal analysis under static and dynamic circumstances were conducted. Section 3 provided the topological optimization theory, procedure, and actual operation. The corresponding dynamic analysis for the optimized model was also provided. The actual experimental validation for the actual product processed based on the optimized model was presented in Section 4. Lastly, Section 5 offered some concluding remarks and suggestions for future works.

2. Static Analysis and Kinetic Analysis of the Industrial Robot

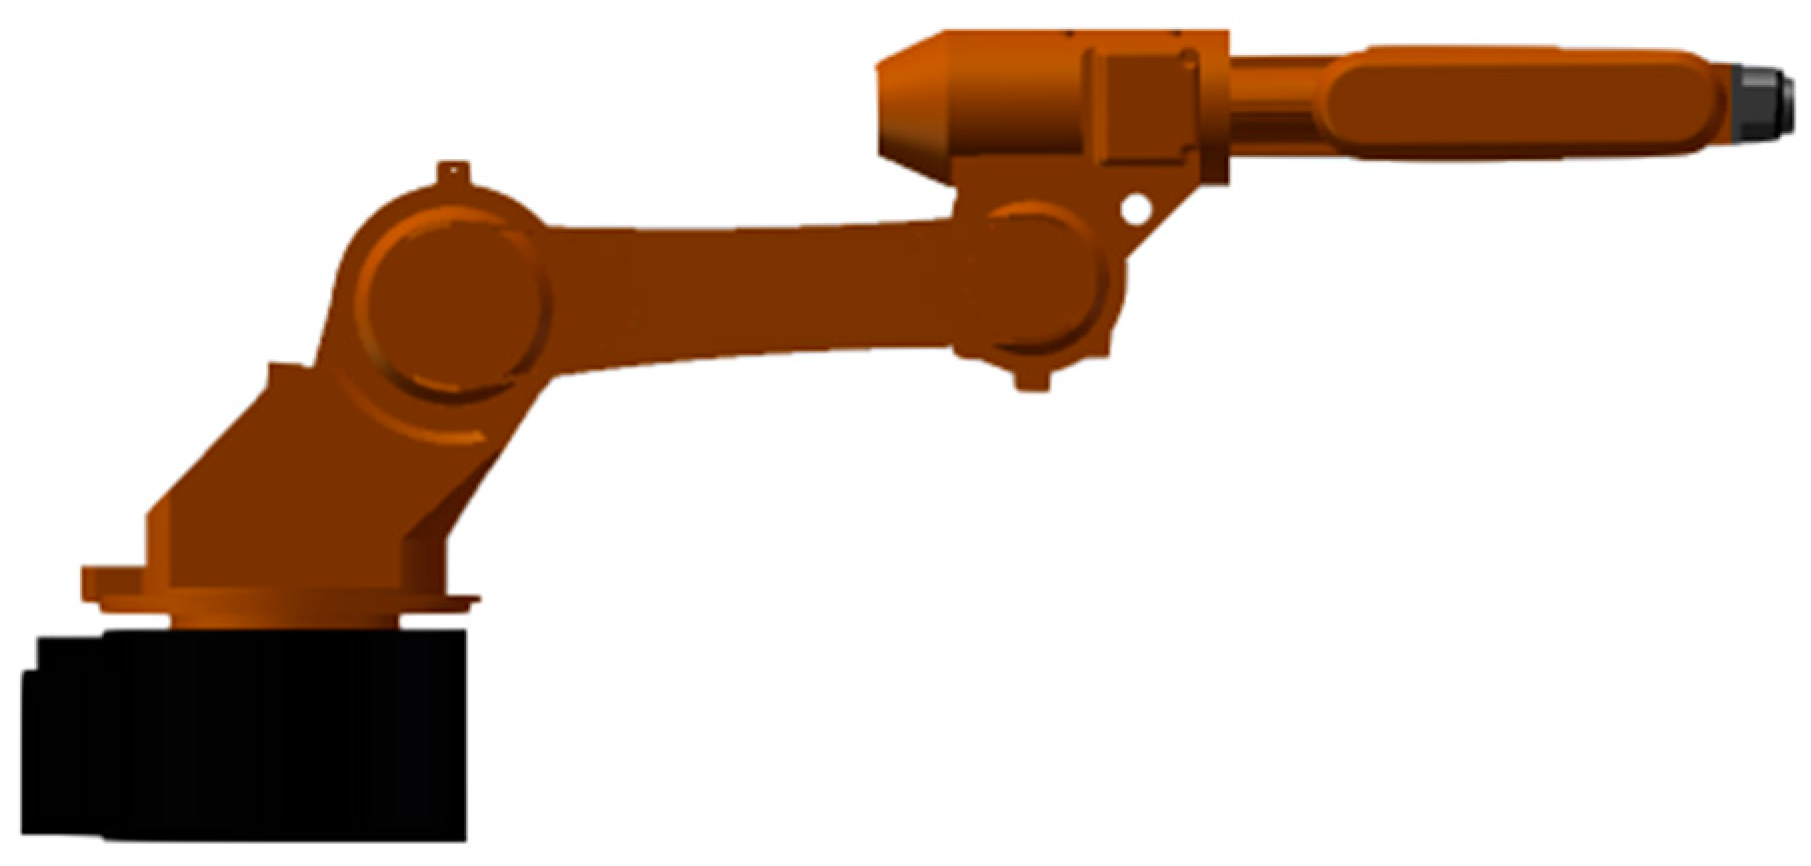
In the work, an RB20 industrial palletizing welding robot, whose mass was 20 kg, was employed. This robot is a parallel robot, which has many connecting shafts. In general, this type of robot used side-mounted or a pendulum structure so that the operating range of the arms is large enough. Under this circumstance, the operating range can achieve an integrated circle, which is suitable to some complex working occasions. In addition, this type of robot can be hung upside down for working, which can decrease the floor area of the robot setup, and is very suitable for the arc welding operation. An integrated industrial robot RB20 is composed of a base, an upper arm, an elbow joint, a forearm, a wrist, and an end effector, which can be shown in Figure 1. In addition, there are six axes in this structure. Among these kinds of components, the upper arm, which is the main moving component, occupies large weight and volume. Its weight has a significant effect on the total robot. Therefore, in this work, the upper arm was chosen to complete a light-weight structural topological optimization design. Figure 2 showed the original model of the upper arm.

2.1. Pretreatment of the Model

Before conducting structural topological optimization for the upper arm of the RB20 welding robot, some necessary pretreatments should be completed.
(1)
Effective simplification of the original model.
(2)
Highly effective and accurate mesh.
(3)
Confirmation of the boundary and load conditions.
Then, after doing static and kinetic analyses, the designing variables, objective functions, and constraints, as well as the corresponding geometric limitations of the topologic optimization can be confirmed. The detailed procedures were as follows.
Model simplification: there are many fillets and small grooves that have little influence on the subsequent analysis existing in the original model of the upper arm. These parts result from model de-moulding or other industrial processing, and they may significantly increase the burden of the calculation. To obtain a more uniform meshing and decrease the burden of the calculations, the model can be first simplified using SOLIDWORKS, and then transmitted into ABAQUS, which is a powerful finite element analysis and computer-aided engineering software suite commonly used to solve the nonlinear issue, for further analyses.
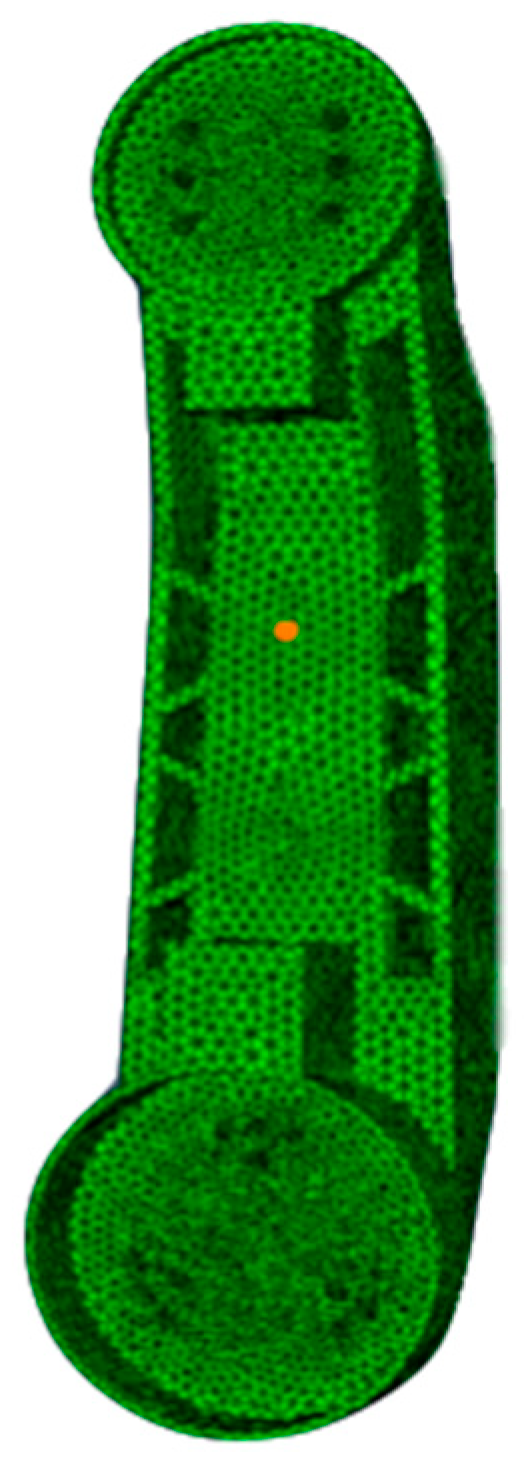
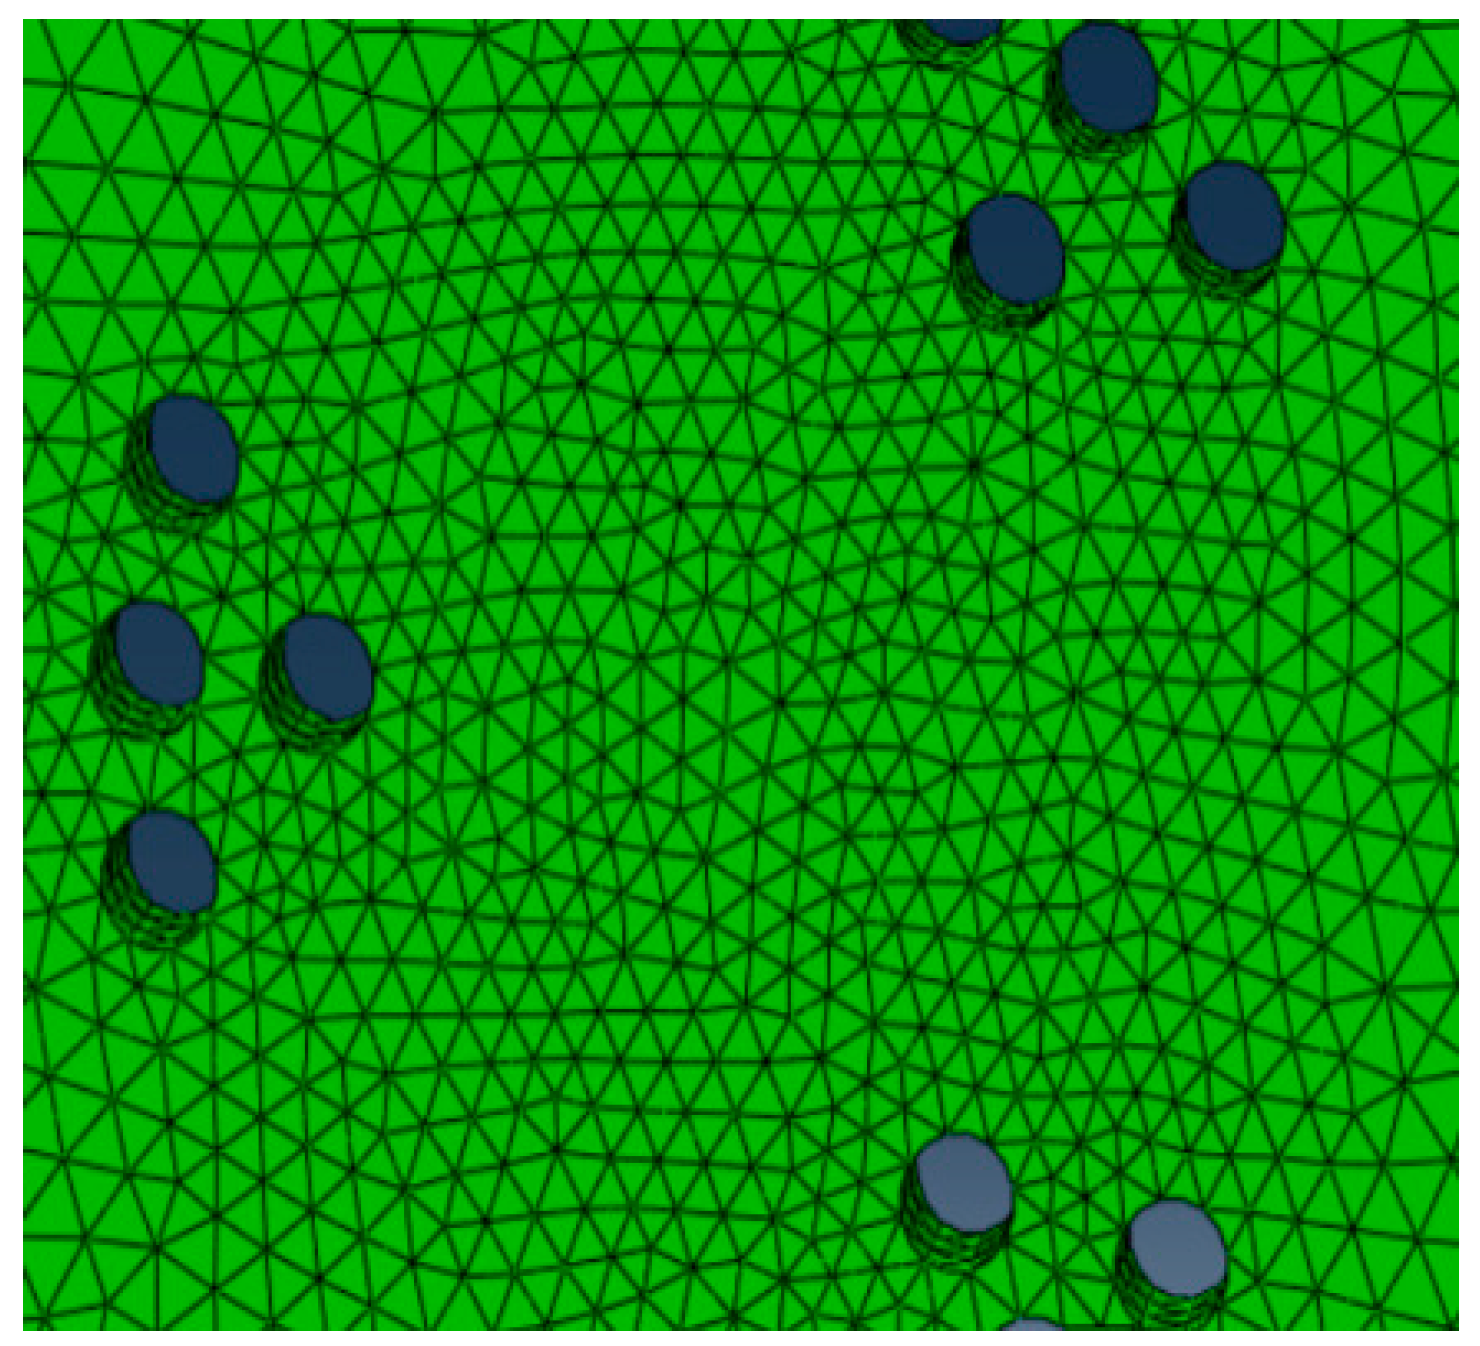
Meshing: obtaining more accurate convergence gains depends on the accuracy of the model and errors of a numerical calculation. An expected model requires both high quality meshing and a proper element type. The tetrahedron mesh element was commonly employed in a complex model, which requires large displacements or hard contacts. In addition, a second-order integer calculation can improve the accuracy of calculation and avoid self-locking. Hence, the C3D10M element was employed in this work, and then the accurate contact pressure was obtained. To assure the accuracy of the calculation and avoid long-time calculation or difficulty with convergence because of the over-high-density mesh, a density threshold of 12 was set based on the actual size of the model. To assure uniform shape and size of the element, the location of the sideline seed should be significantly adjusted to avoid the element dividing through the center algorithm deviate from the seed. The mesh of the simplified model was shown in Figure 3. It can be seen that, because the force conditions of the through-hole and curved surface was more complex, these corresponding parts should be more seriously considered, which was shown in Figure 4.
The dots in Figure 4 were screw holes in the structure. In the end, the number of elements of the mesh was 66,033, and 129,117 nodes were included.
Confirmation of the boundary and load conditions: the material of the upper arm was spheroidal graphite cast iron QT500–7. Corresponding material characteristics were shown in Table 1.
The upper arm was connected with other components by means of a hinged bolt hole. In this work, the structural coupling method was employed to couple all the bolt surfaces and reference points. Then the load and boundary conditions can be imposed on the reference points, so that the points can bear the constraints and loads from tangential and axial directions. Figure 5 showed the schematic figure of the constraints and loads imposed on the upper arm.
According to Figure 5, and the force and moment equilibrium conditions, the following equations can be obtained.
{ M y ( F ) = 0 ; M z ( F ) = 0 ; M x ( F ) = 0 ; F x = 0 ; F y = 0 ; F z = 0 ;
and
{ F o z G 0 G 1 G 2 = 0 ; M o x G 0 w 0 G 1 ( w 1 + w 2 ) G 2 ( w 1 + w 3 ) = 0 ; M o y G 0 l 0 G 1 l 1 G 2 ( l 1 + l 2 ) = 0 ;
Then, according to the self-weight and load conditions of each component, the values of the following variables can be confirmed, which were G0 = 350 N, G1 = 750 N, G2 = 250 N, w0 = 250 mm, w1 = 650 mm, w2 = 210 mm, w3 = 800 mm, l0 = 4 mm, l1 = 102 mm, l2 = 52 mm. Then the following results can be obtained: Foz = 1350 N, Mox = 918,000 Nmm, and Moy = 85,600 Nmm.
In addition, because the right side of the upper arm is connected with the third axis by means of a bolt set, it can be considered as the type of cantilever beam under the special boundary condition, and can be regarded as absolutely fixed under the static condition.
Figure 6 showed the most unfavorable working condition of the upper arm under the static condition. The most unfavorable working condition means that the upper arm requires bearing the greatest stress. The strongest stiffness and the largest moment conditions should be effective. It can be seen that the force condition of the upper arm can be approximately the same as a cantilever beam, which was that one terminator was fixed, while the other bore gravities of other components and loads. Under the dynamic working circumstance, it can be considered the most unfavorable working condition of the upper arm, which was the same as that under the static condition. However, the upper arm was also required to bear the inertial force of the components in a high-speed moving state.

2.2. Static Analysis

An industrial welding robot is composed of mutually connected components, which can undergo large translational and rotary movements, and elastic deformation may occur at the same time. The finite element method was usually employed in theoretical modeling for the mechanical system. The gravity of each component on the upper arm can easily be simulated using ABAQUS by setting different mass points. However, it can only simulate the component deformation instead of rigid body movement. Therefore, the effect of component elastic deformation on large displacement movement cannot be reflected, and the mechanic behavior cannot be correspondingly presented. To overcome these drawbacks, the integrated model can be transmitted into ADAMS, which is a multi-body dynamic simulation software and proved very essential to VPD (Virtual Prototype Development) by reducing the product time to market and product development costs. Then the rigid-flexible coupled multi-component large displacement static kinetic analysis can be conducted by combining ADAMS and ABAQUS.
The stress analysis results can be considered using the following two rules.
(1)
The fourth failure criteria (von Mises yield criterion, also known as maximum distortion): though this theory can be suitable for the plastic material, the integrated stress distribution can be clearly shown in the Mises stress cloud map. The Mises stress is proposed to be a comprehensive criterion that determine whether the material (steel) under complex stress situations is plastic or not [31,32].
(2)
The first failure criteria: when the materials are brittle, such as the spheroidal graphite cast iron QT500-7, which is used for the upper arm, the maximum tensile stress in this theory should be employed to be a parameter for Yield calibration, and then should be compared with the allowable stress of the material.
In this work, the Mises stress and maximum tensile stress under the static and the most unfavorable working conditions were analyzed below.
(1)
After pretreatment of the model, all obtained load information can be transmitted into the ABAQUS, and then the Mises stress under static load can be analyzed. The equations employed by Standard Solver to be used for stress strain issue are as follows.
{ ε = Δ u / L P + I = 0 P = { K } { U }
where ε is the strain of the node result from the total extern force P, Δu is the difference between displacements of two adjacent nodes, L is the element size of the node, and I is the total internal force generated by total external force P under static equilibrium. Therefore, the total internal force should be equal to the total external force. {K} is the total stiffness matrix, while {U} is the total displacement matrix. Then the stress can be calculated by means of strain obtained through displacements.
(2)
Researchers transmitted the model of the industrial robot into ADAMS, and analyzed the Mises stress cloud map of the rigid–flexible coupled multi-component large displacement system. Then the most unfavorable working condition can be confirmed through dynamic simulation and static kinetic analysis, and through observing the Mises stress variation.
(3)
The Mises stress data and dynamic load data under the most unfavorable working condition in ADAMS can be obtained, and then the dynamic load under this condition can be transformed into an equivalent static load.
(4)
Transmitted the loads obtained from analyses in ADAMS into ABAQUS for accurately calculating and correspondingly analyzing the obtained criterions such as Mises stress and maximum tensile stress, and then these criterions can be compared to the stress distribution from ADAMS. Lastly, the systematic static analysis can be realized.
According to the above procedures, the integrated static analysis can be conducted as follows.
(1)
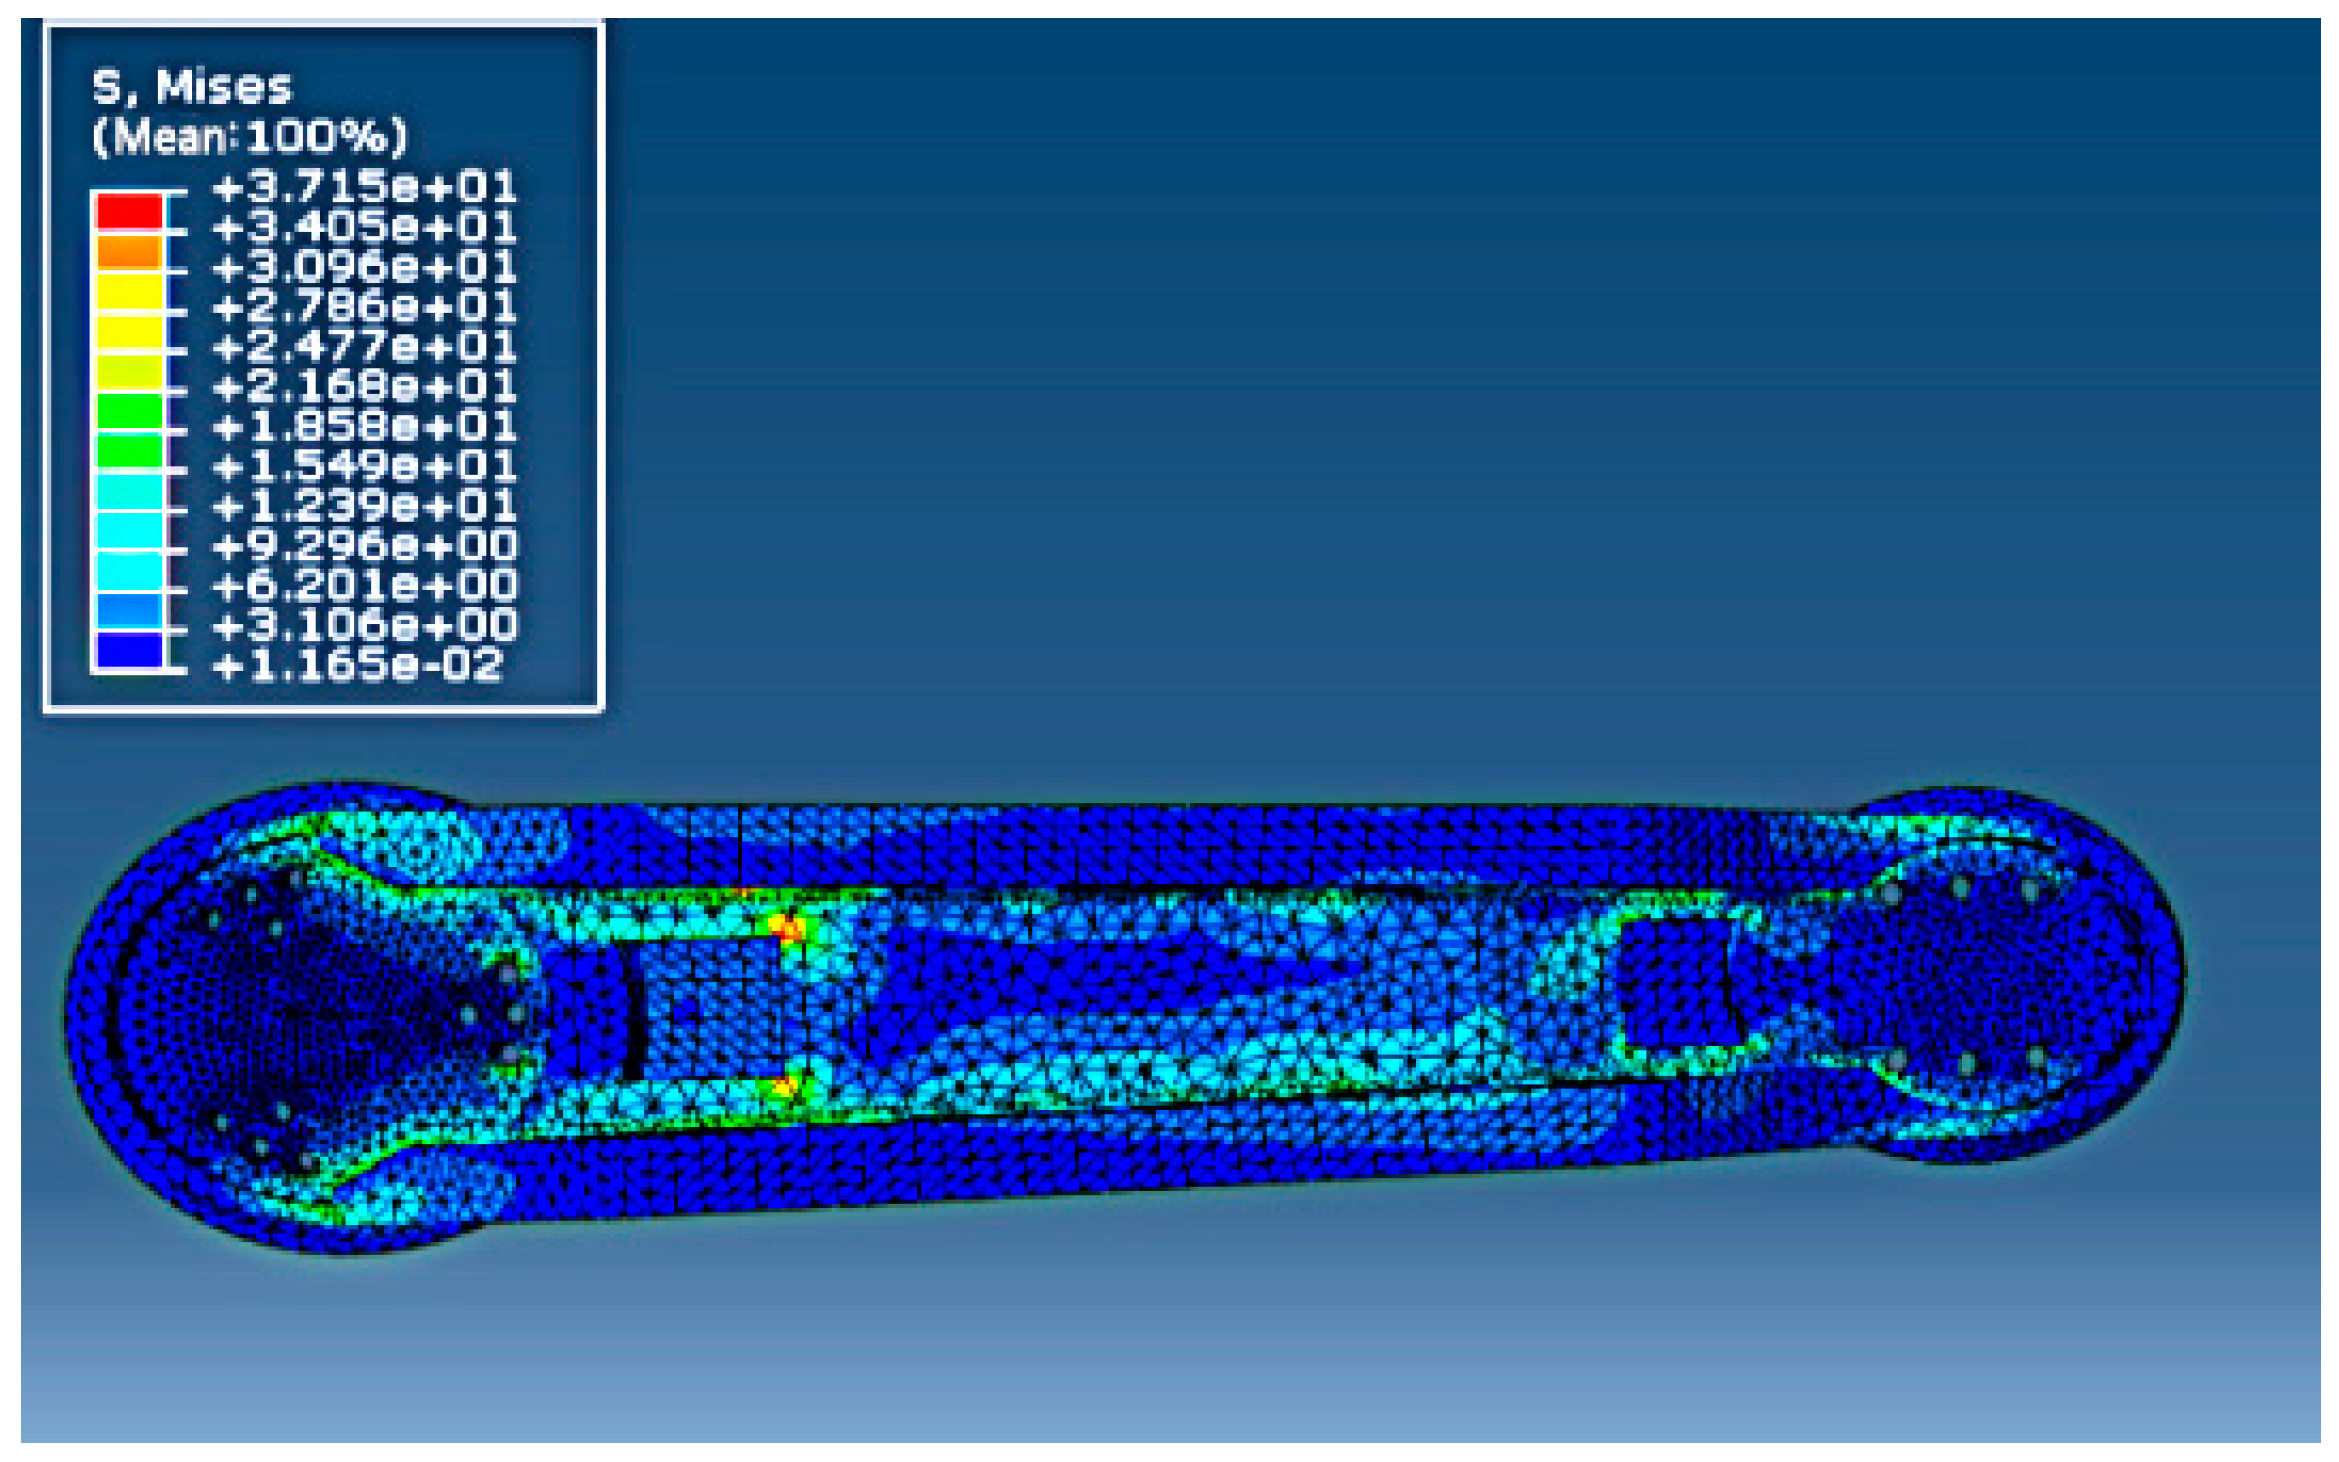
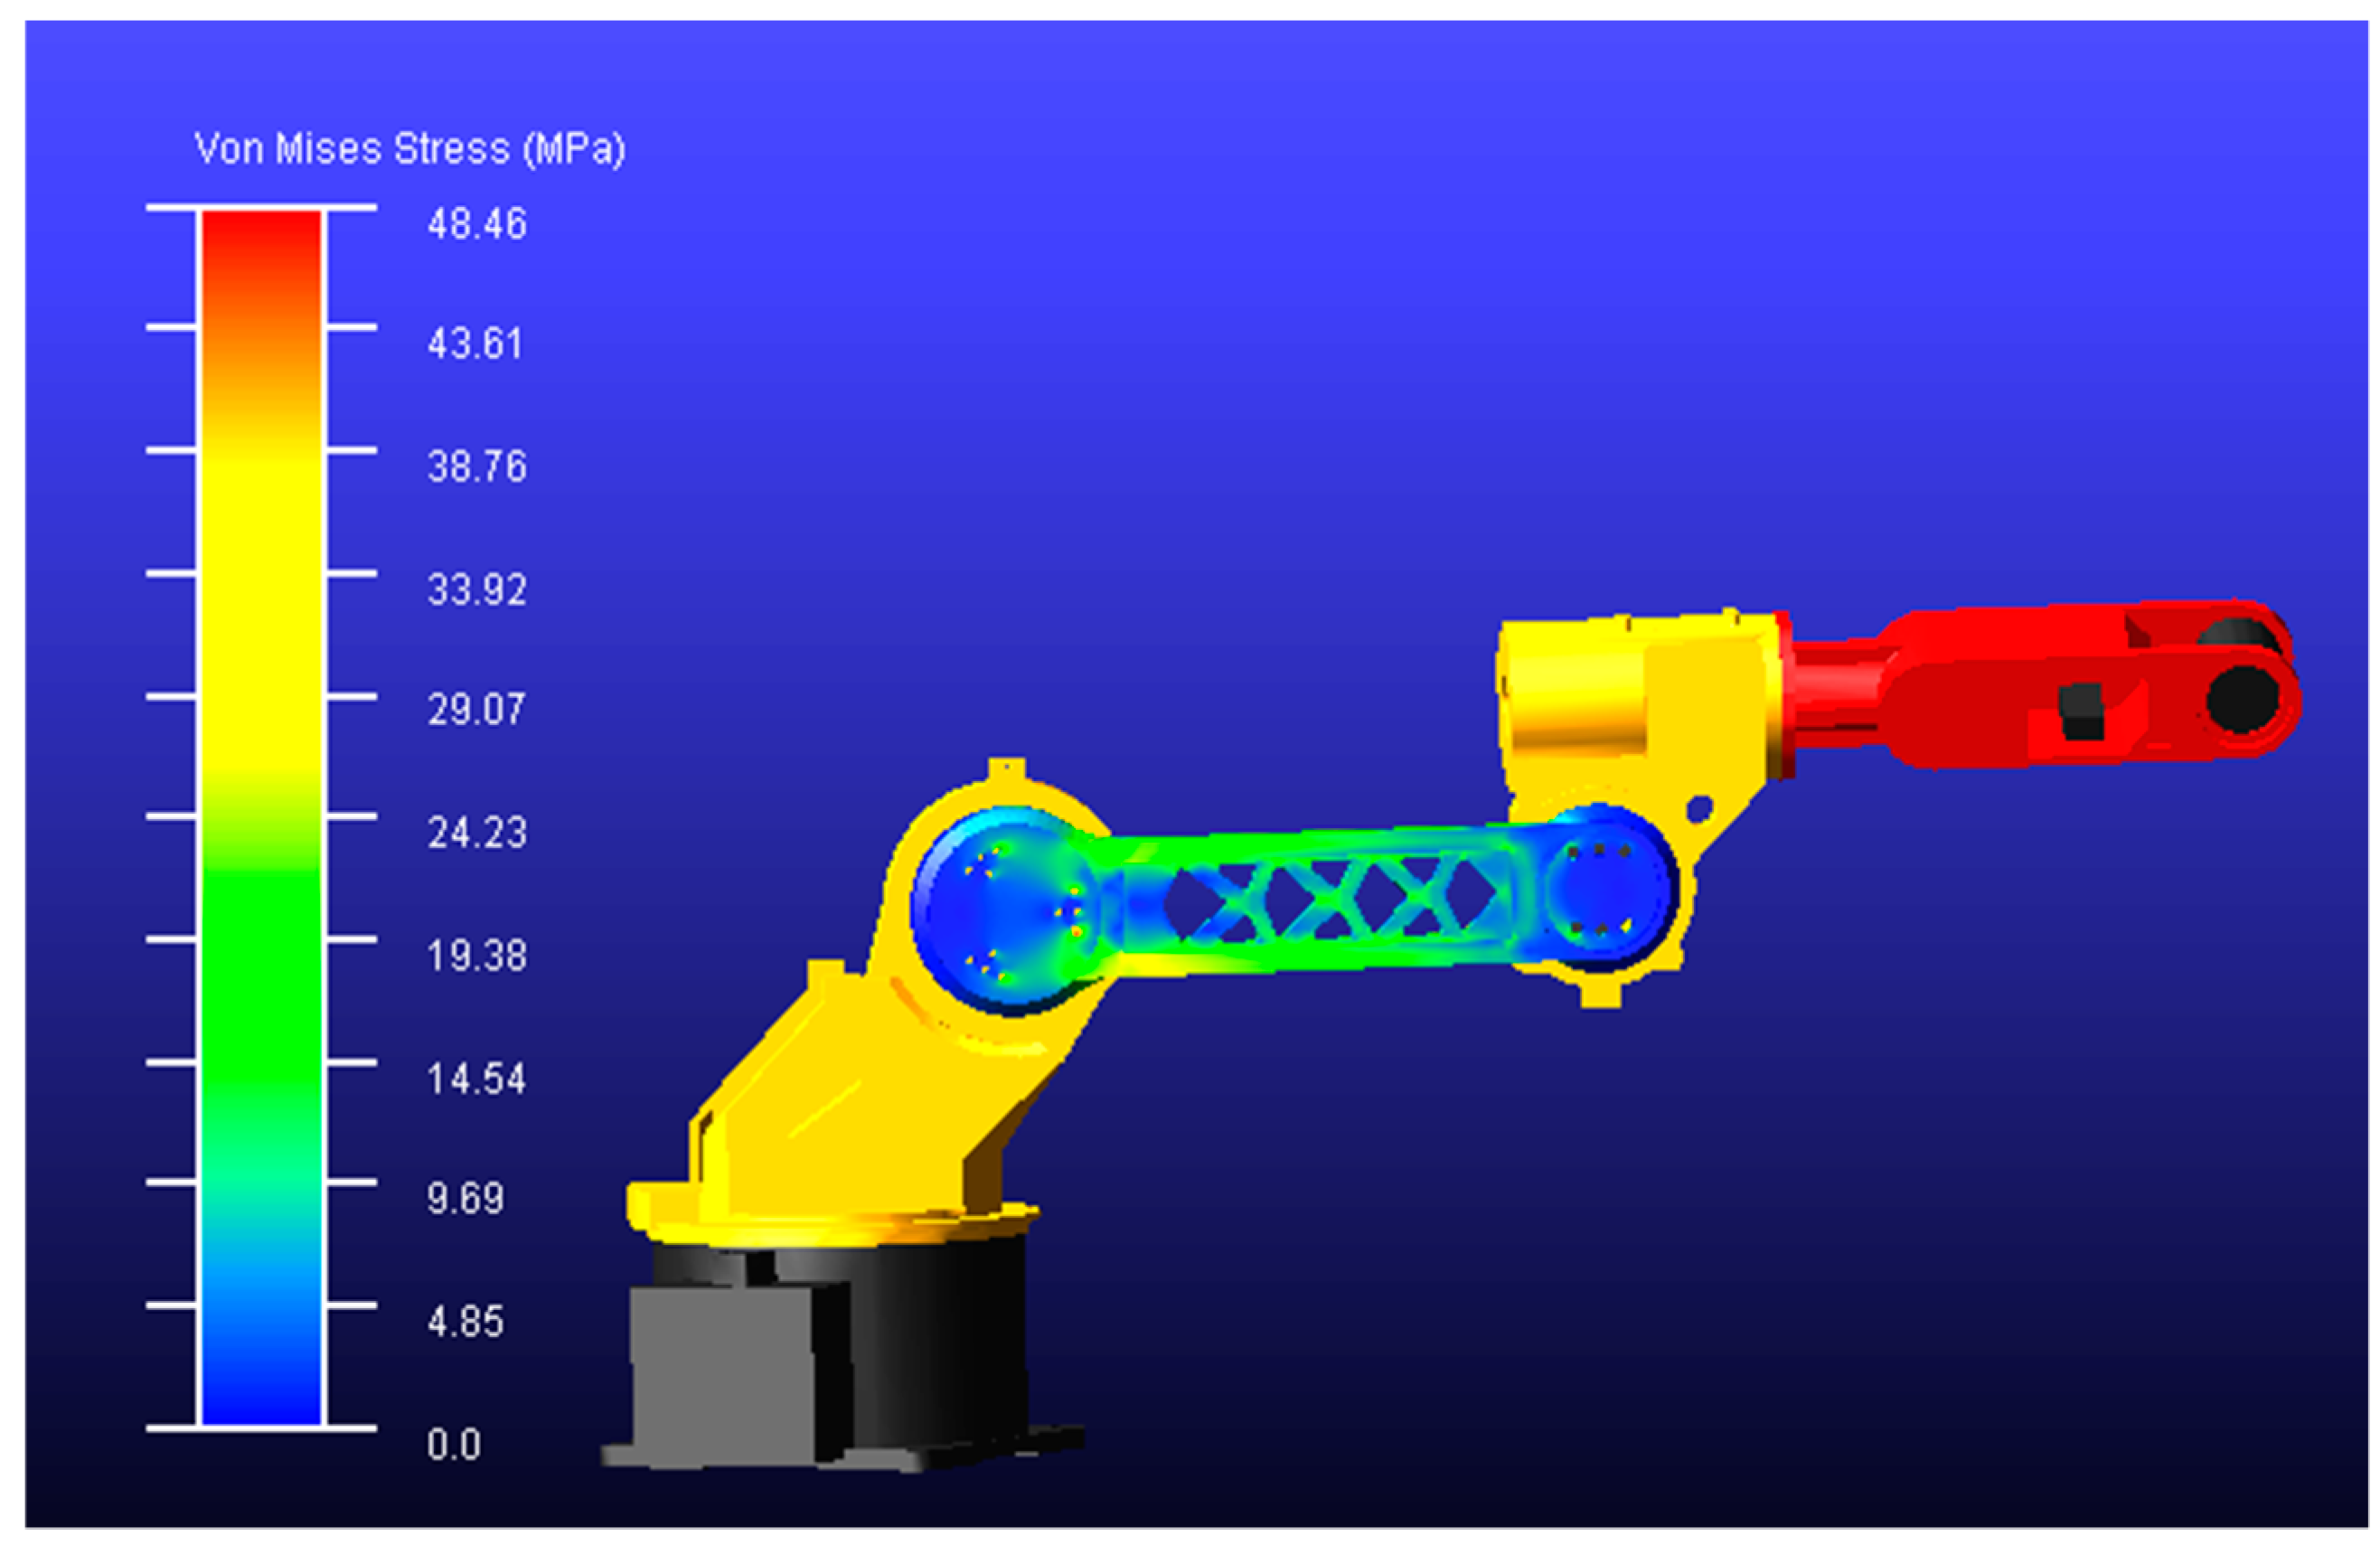
Transmitted the model of the upper arm into ABAQUS and obtained the Mises stress distribution under static load. The result is shown in Figure 7, where it can be observed that the maximum Mises stress was 37.15 MPa.
(2)
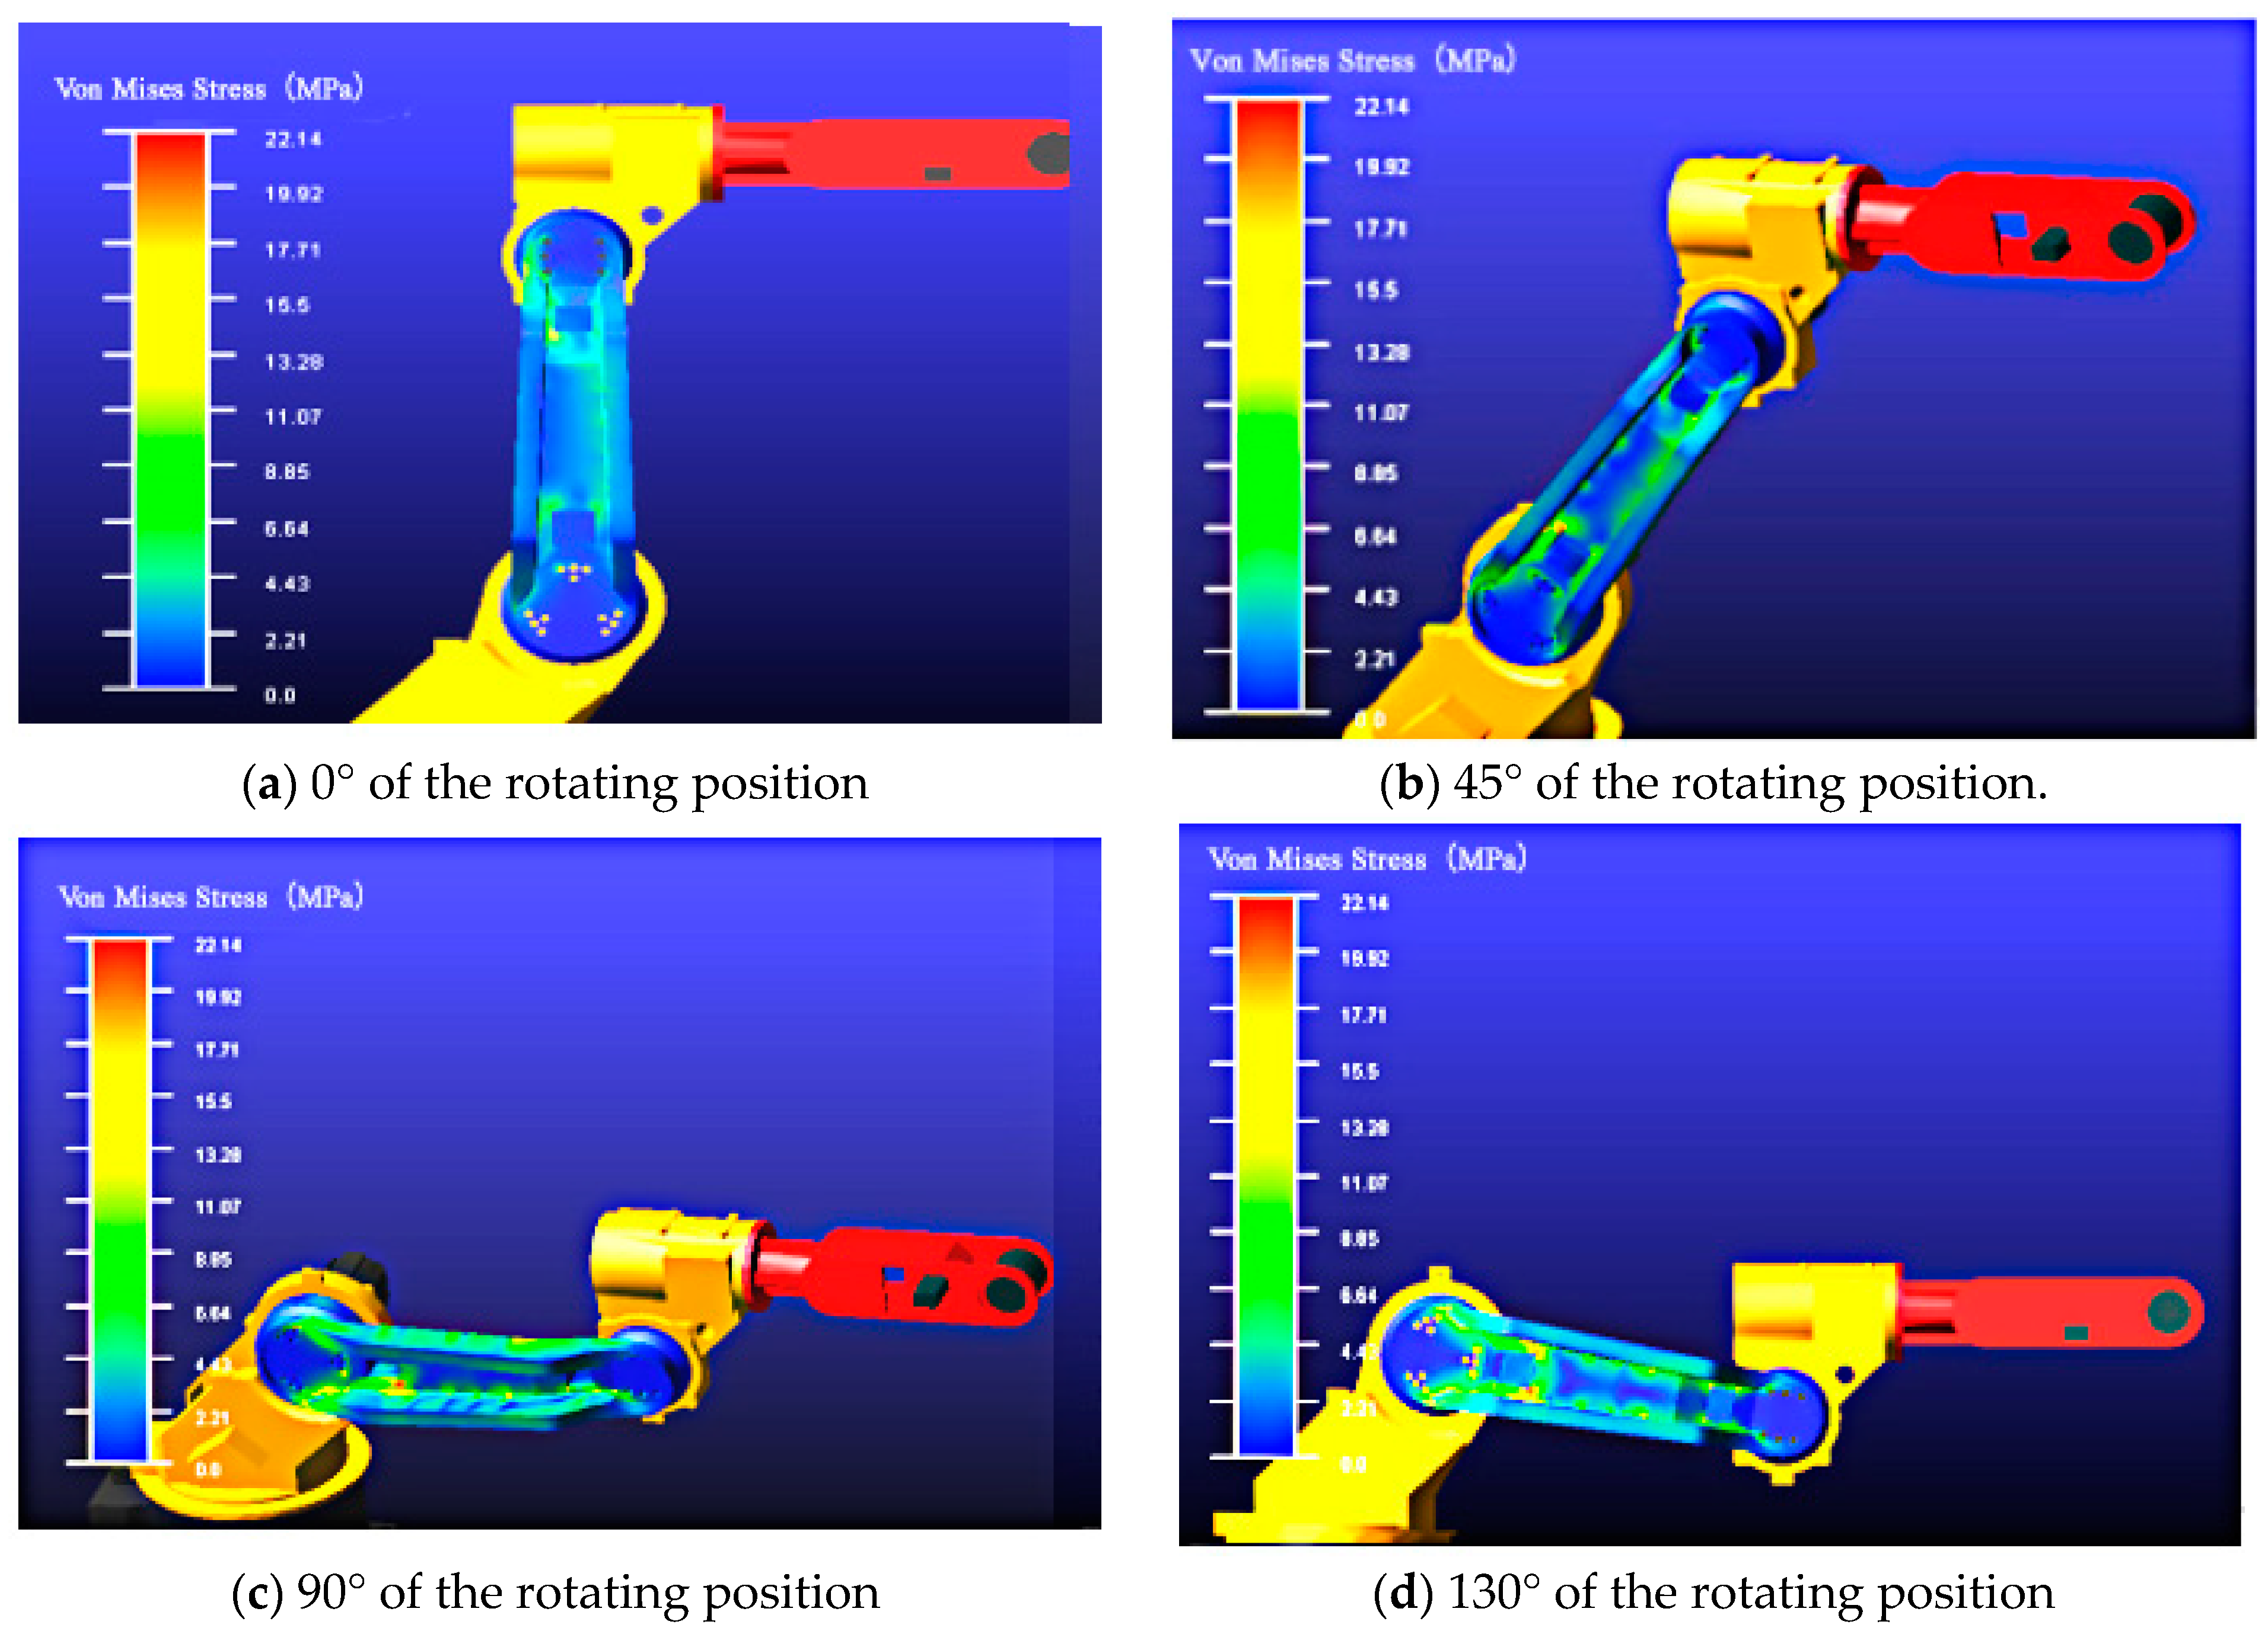
Based on the preliminary predictions, the static force conditions under different positions within the working range of the upper arm can be obtained using ADAMS to seek the most unfavorable working condition of the upper arm. Because the model of the upper arm is symmetric, we used the constant speed of 5°/s to rotate the upper arm within the range between 0° and 130° to approximately simulate the working condition under the static circumstance. The simulation process can be shown in Figure 8.
The initial position was shown in Figure 8a, and the force was very small under this circumstance. Figure 8b showed the rotating position was 45°. It can be observed that the affected zone in the cloud map increased. Figure 8c showed the rotating position was 90°. It can be seen that the force was large, and colors of many parts changed. The stress achieved a maximum value. The rotating position was 130°, as shown in Figure 8d. In this figure, the stress value was large, and the affected zones are more than that in Figure 8a,b. In addition, large stress concentration zones appeared, but these were less than that in Figure 8c. According to the of Mises stress variation pattern, it can be confirmed that the rotating position was 90°, when the forearm was vertical and the upper arm went forward to the limited condition, which was the most unfavorable working condition. Under this circumstance, the stress of the upper arm can achieve a maximum value.
Table 2 showed the maximum stress at different rotating positions.
(3)
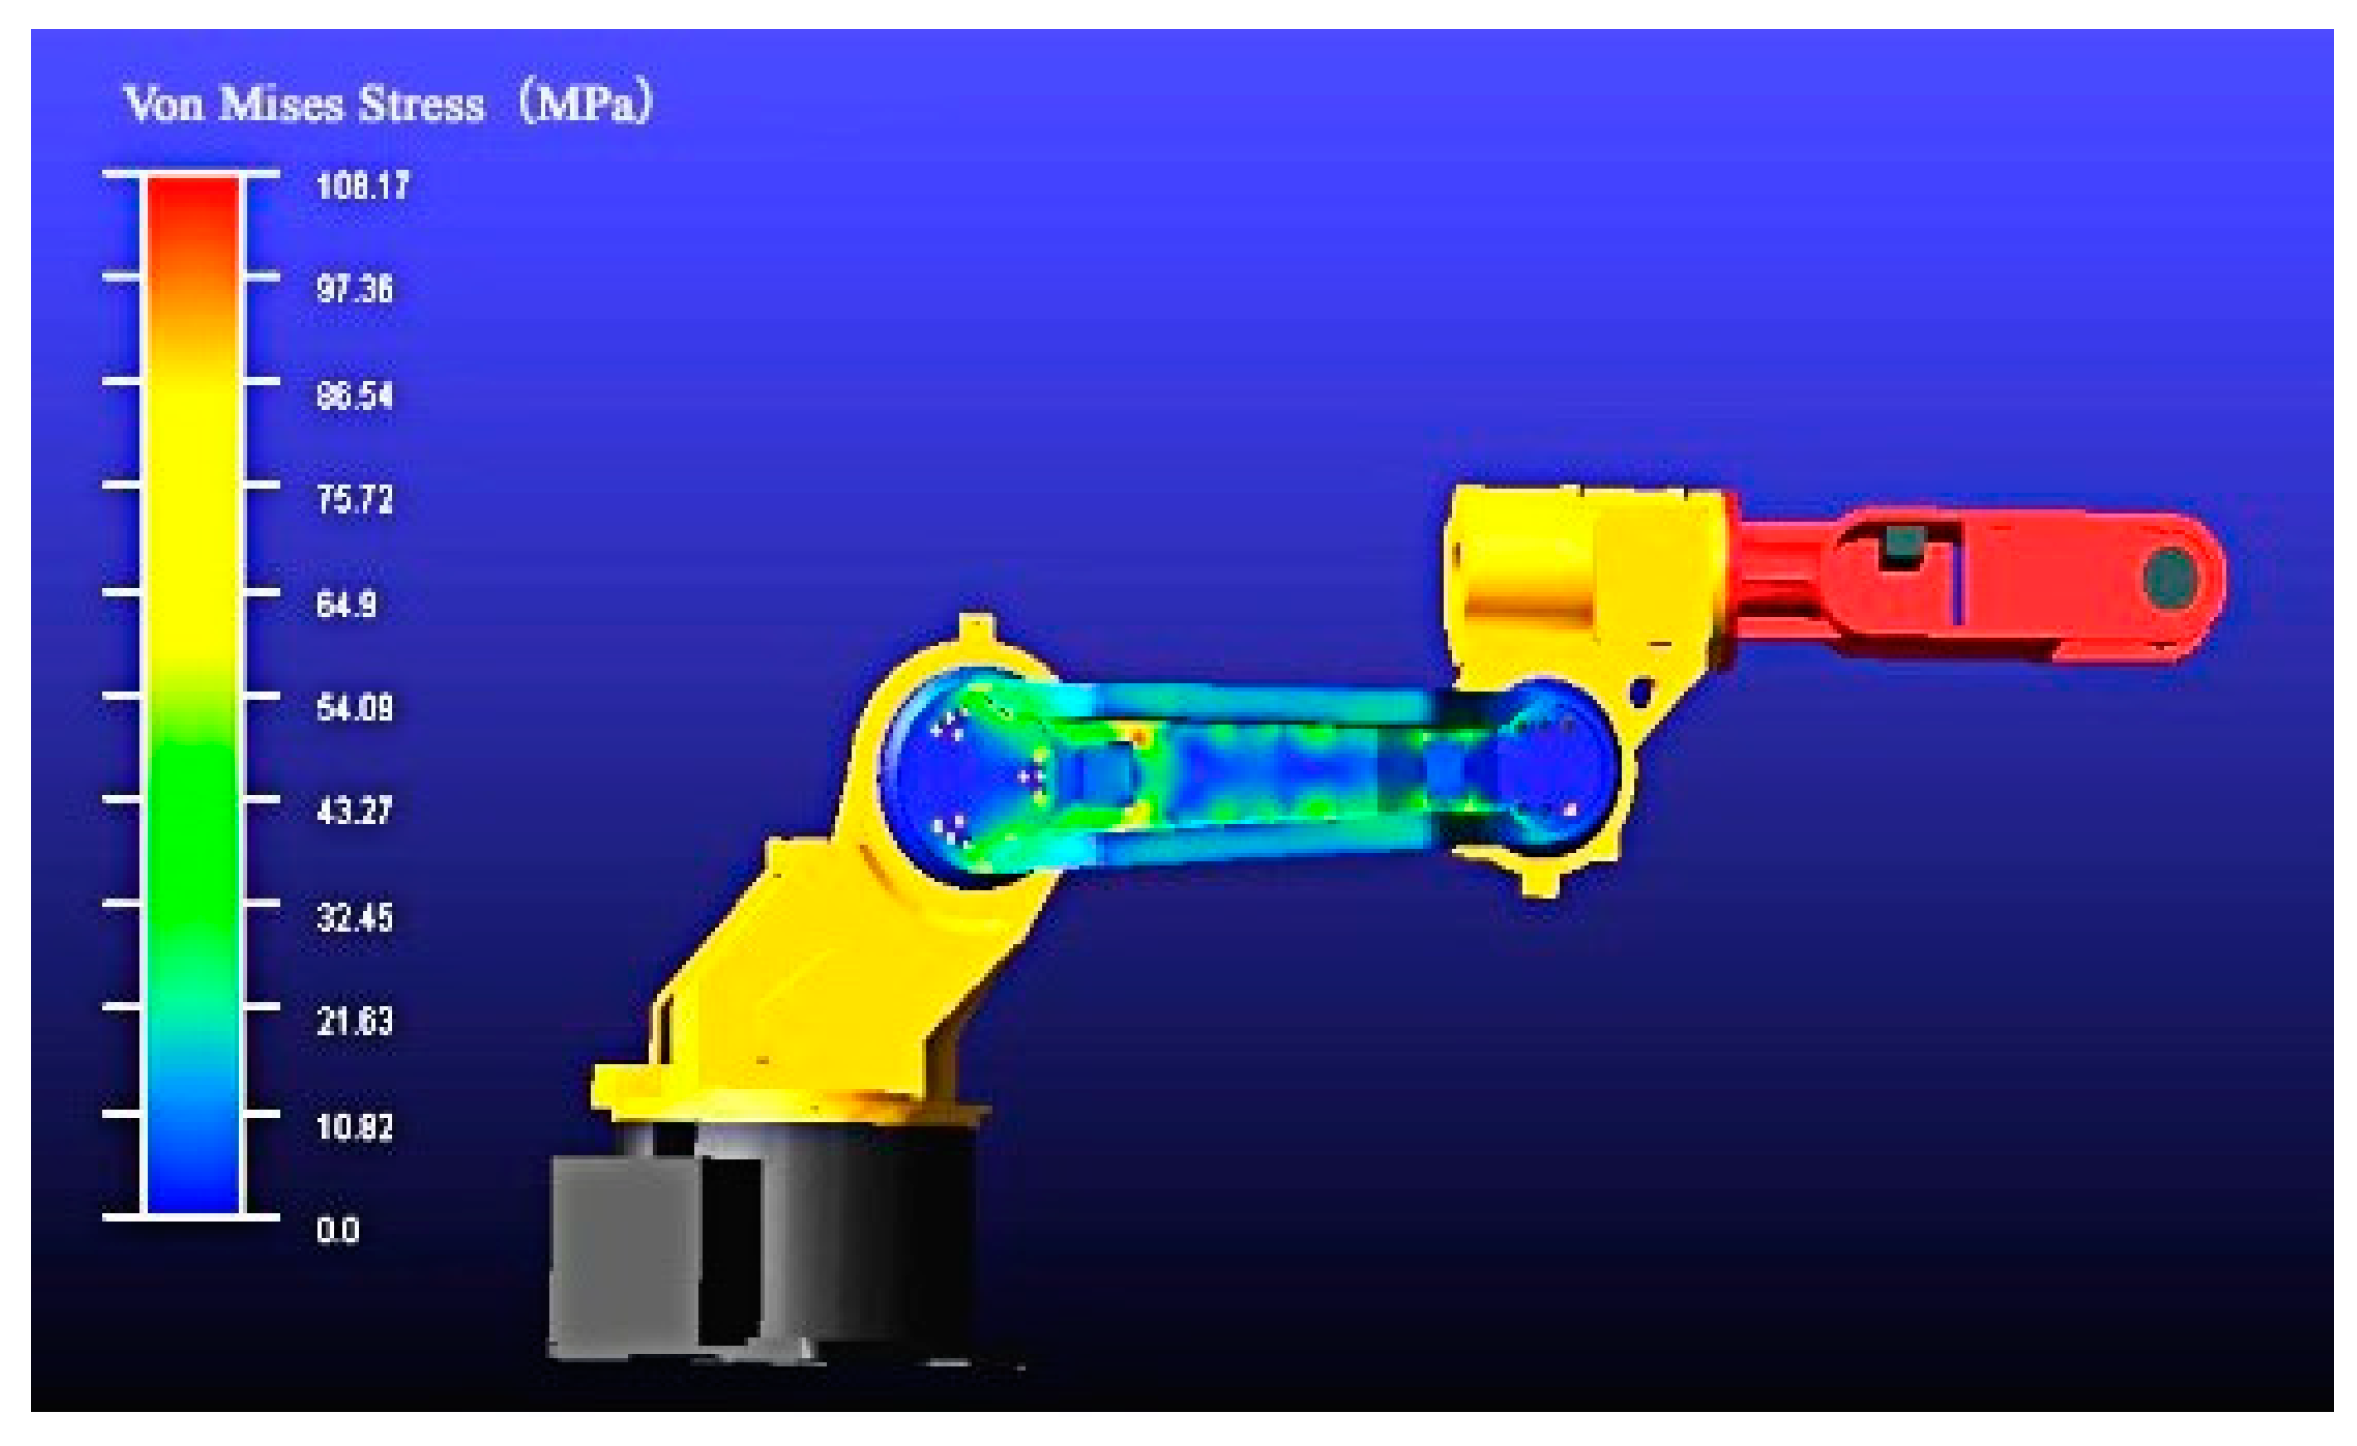
Obtained the Mises stress data and dynamic load data in the most unfavorable working condition in ADAMS, and then transmitted the dynamic loads into corresponding static loads, as shown in Figure 9.
(4)
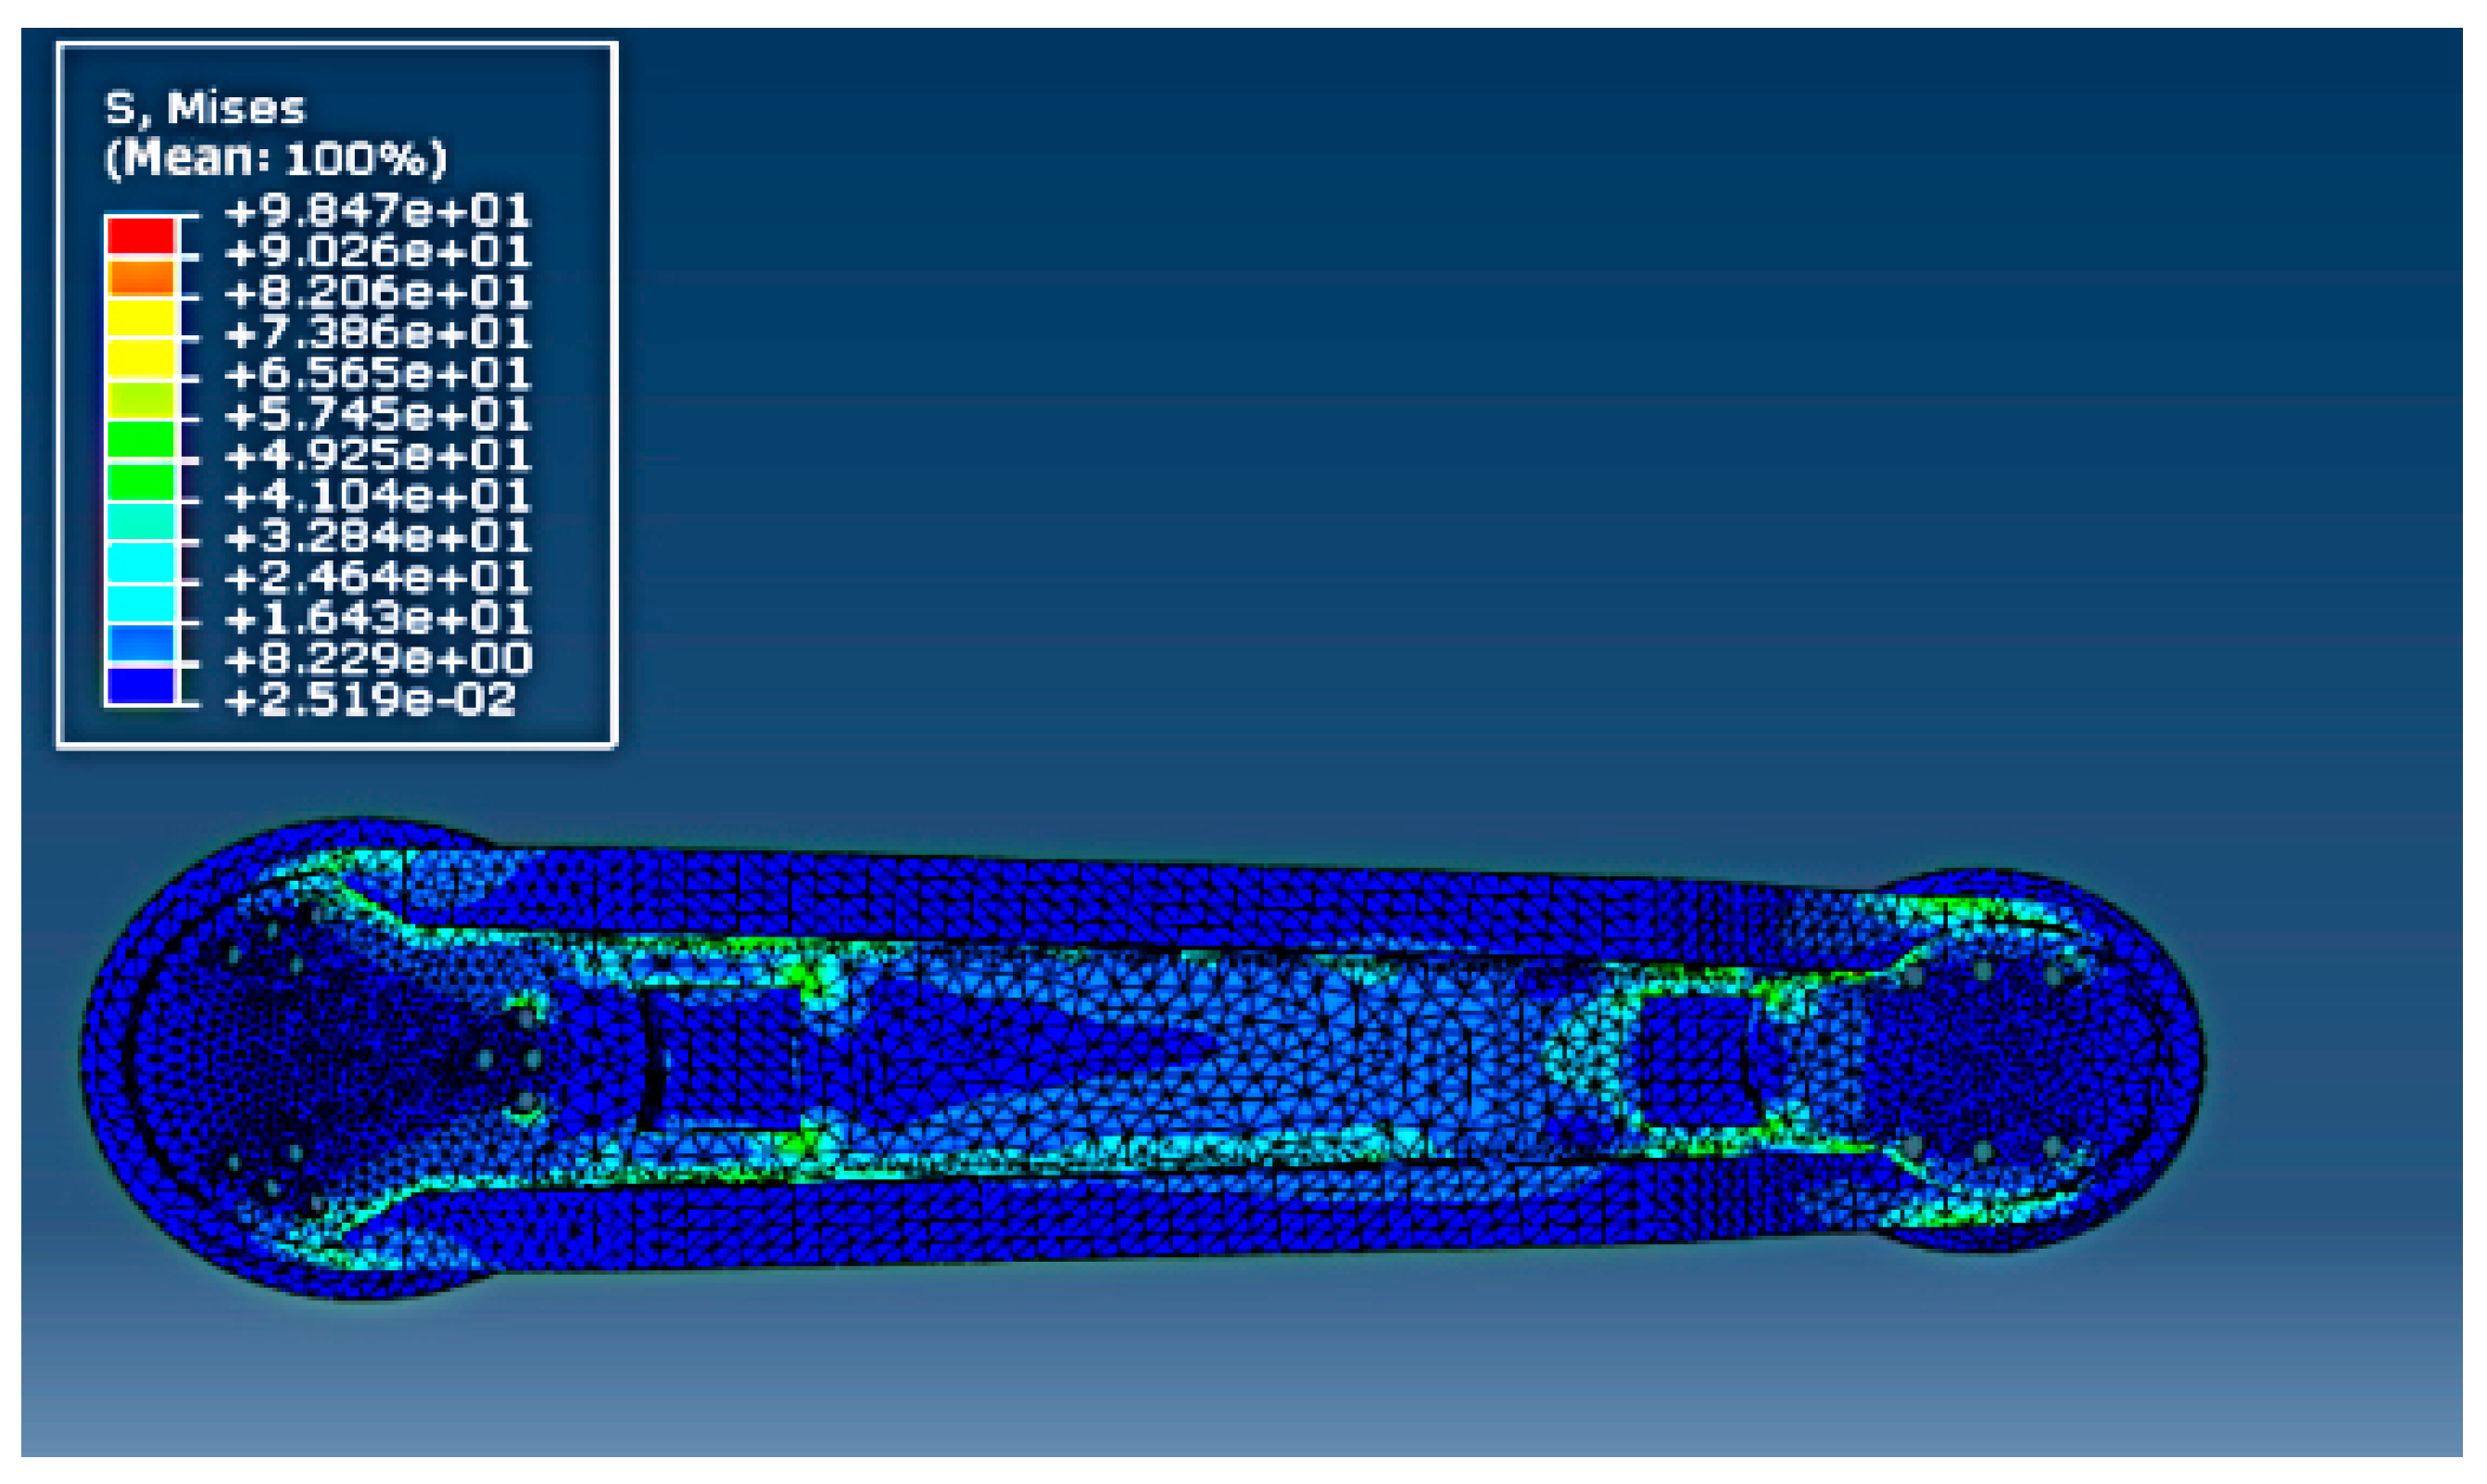
Transmitted the loads into ABAQUS and obtained accurate calculations and analyses results. Then the transient Mises stress cloud map only for the upper arm is shown in Figure 10. The maximum Mises stress was 98.4 MPa.
Because the spheroidal graphite cast iron is a type of brittle material, it is required to analyze the allowable stress. This stress should be calculated using Equation (4), which means that, to achieve enough safety, the stress can be obtained using the Yield stress divided by a suitable safety coefficient.
[ σ ] = σ s / n
The Yield stress σs of the spheroidal graphite cast iron QT500–7 was 365 MPa. The safety coefficient n used is 2.5. Therefore, the allowable stress [σ] was 146 MPa. The analysis result from ABAQUS was 109.6 MPa, as shown in Figure 11, which meant that the maximum stress of this structure can meet the requirement of allowable stress.
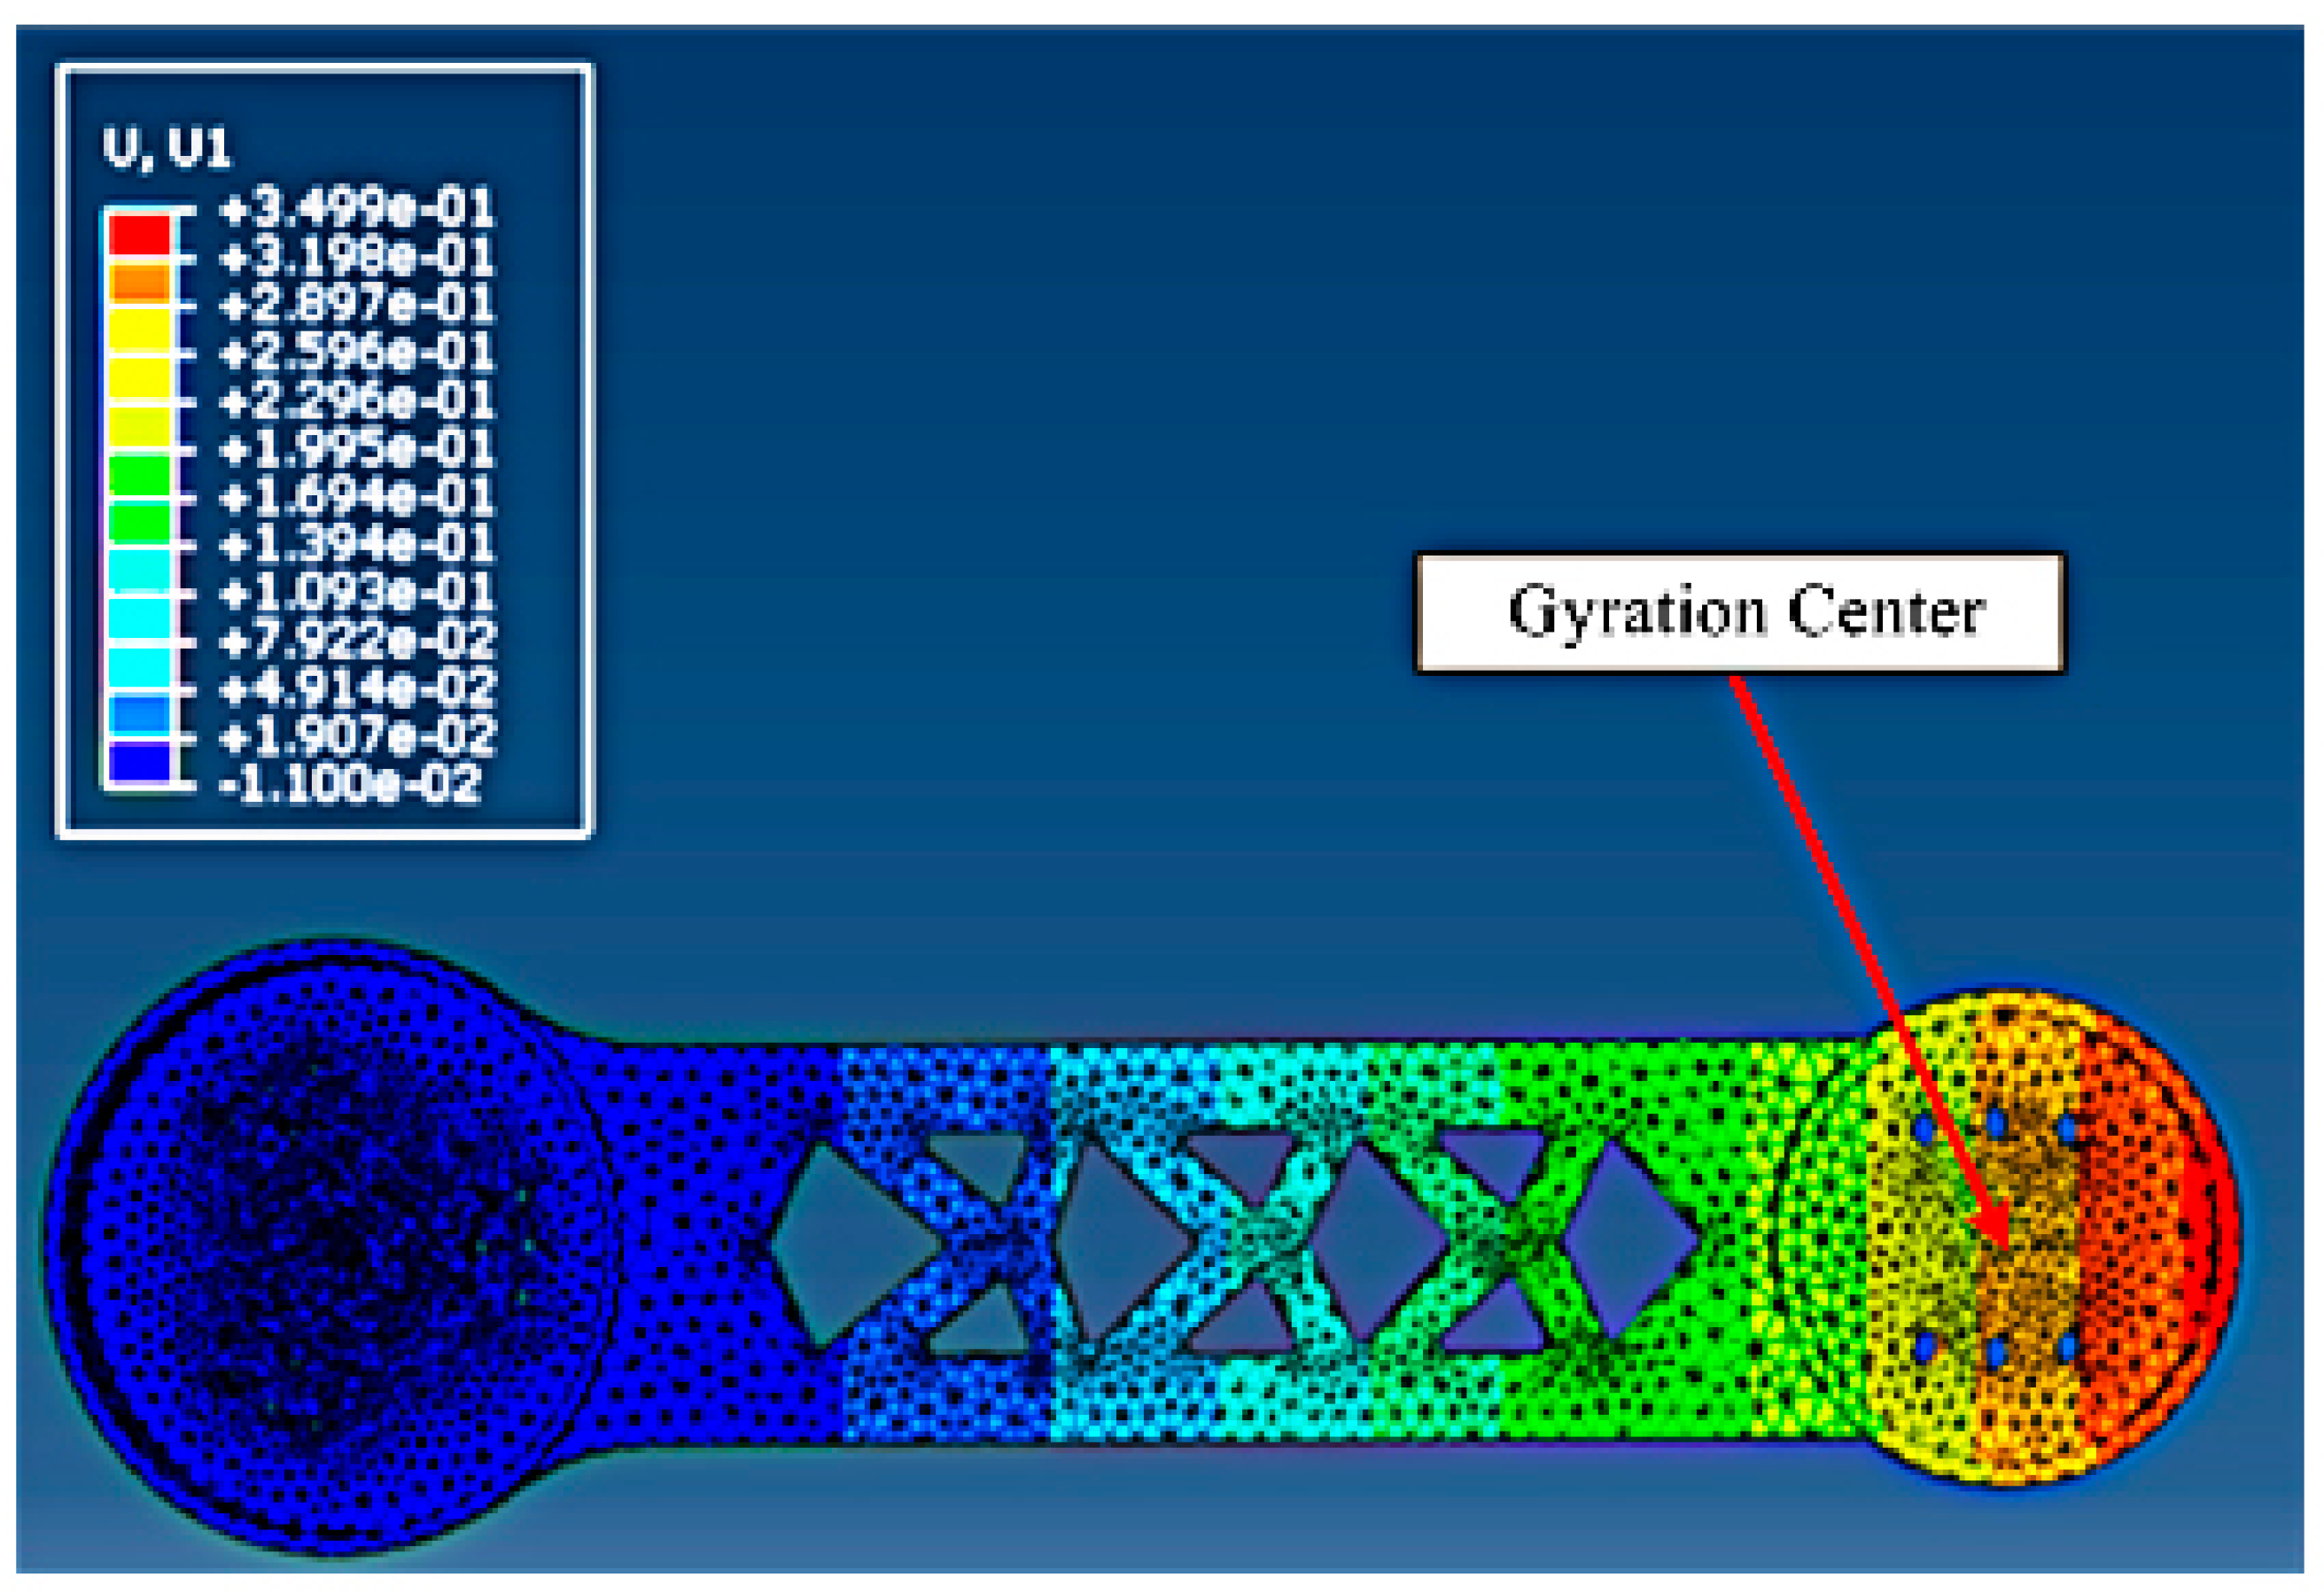
Figure 12 showed that the maximum elastic displacement of the gyration center of the upper arm in the extreme moving direction under the static, most unfavorable working condition. In this condition, the maximum elastic displacement of the gyration center in the extreme moving direction between the upper arm and the third axis (which the red array pointed in Figure 12) was 0.277 mm. Because the criterion from the robot manufacturer was 0.352 mm, this design can meet the requirement.
Table 3 showed some important data obtained from static analysis using ABAQUS, which were important references for the subsequent topological optimization design.

2.3. Modal Analysis

The modality refers to the natural vibration characteristics of a mechanical structure, and each modality has a specific natural frequency, damping ratio, and vibration mode. The modal analysis is one of the most effective methods of exploring the structural dynamic characteristics. By means of modal analysis, the dynamic characteristics at each order modality in a specific frequency range can be obtained. Then the actual vibration responses resulting from internal or external vibrations during the frequency range can be correspondingly obtained. To avoid the same load frequency as the natural frequency of the system, or adjacent frequency doubling occurring, the preliminary modal design should be accomplished to avoid resonance from occurring. In addition, the natural frequency of the system under small order circumstances should be increased when to optimize the mechanical structure, in order to avoid resonances. Hence, the final goal is to identify the modal parameters, and then provide references for vibration characteristics analysis, vibration fault diagnosis and prediction, and optimize design of the structural kinetic characteristics. In general, the frequencies of the loads in an industrial robot are very low. Hence, only the modal characteristics of the preceding small orders should be seriously considered to confirm whether the resonance will occur.
As improvement of computer science and technology, as well as the finite element theory occurs, the modal analysis unit have been integrated into a usual calculating tool for finite element methods. The analysis process was establishing a modal model first, and then conducting numerical analysis and solution.
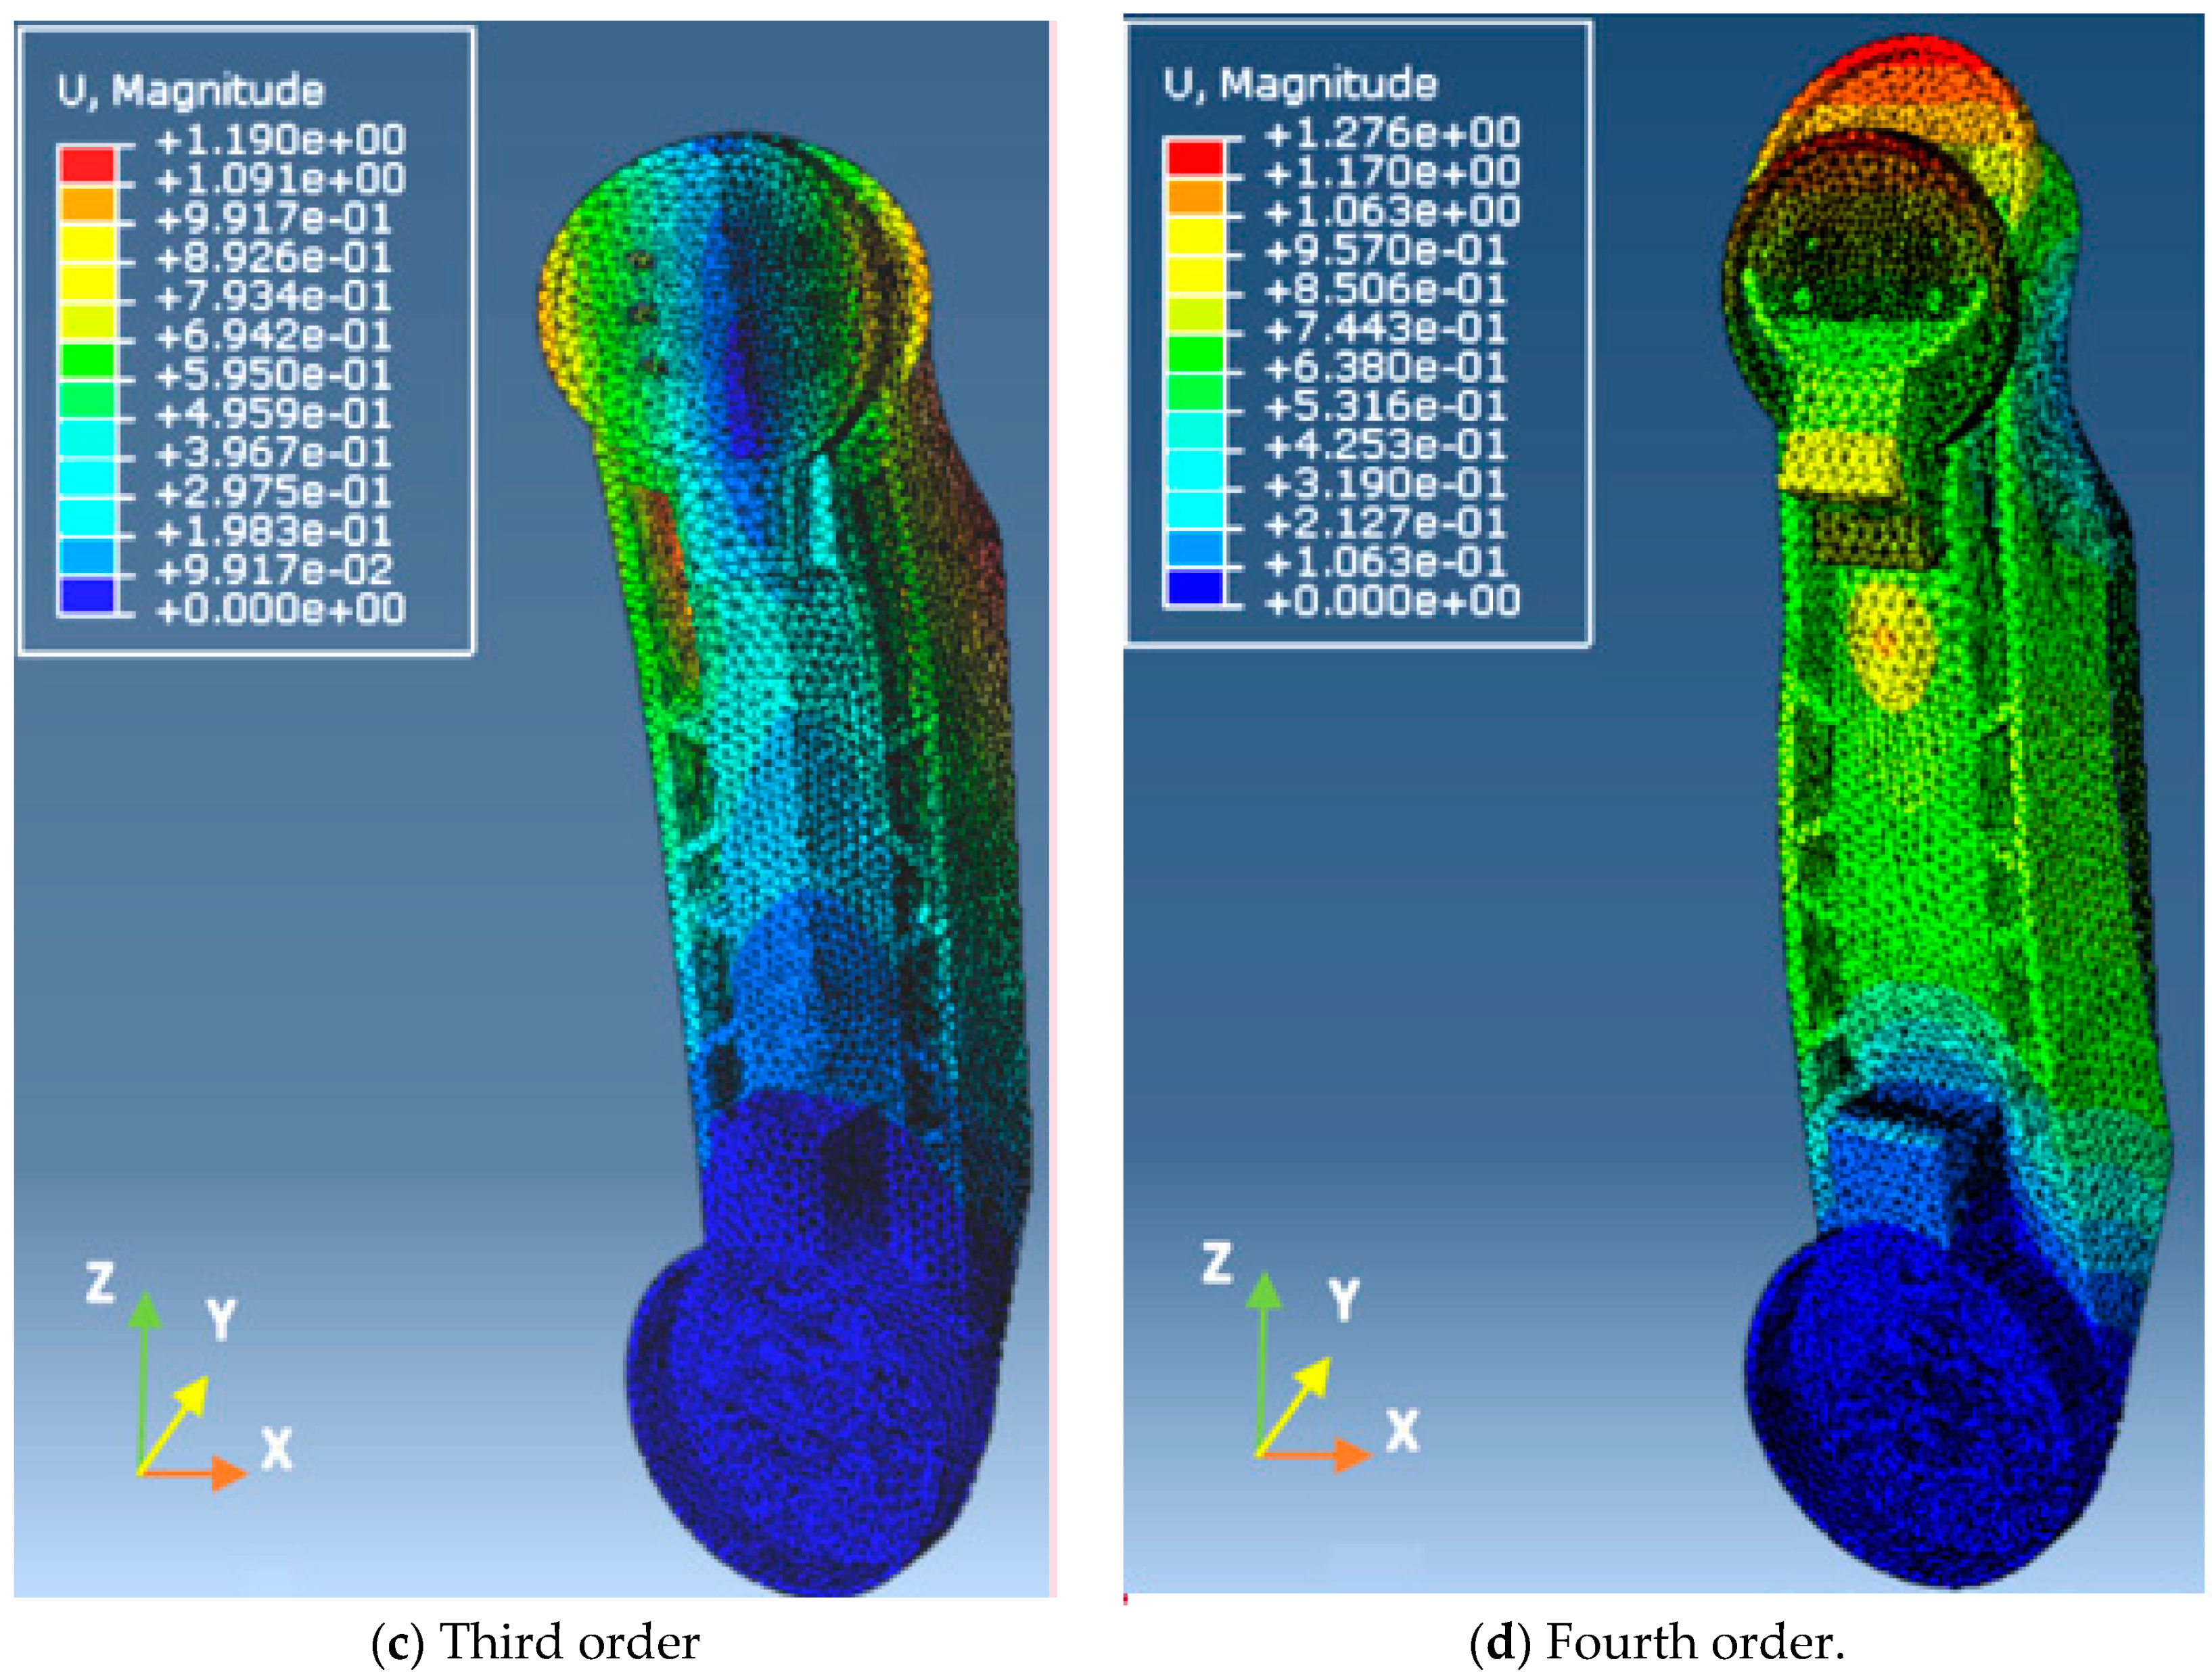
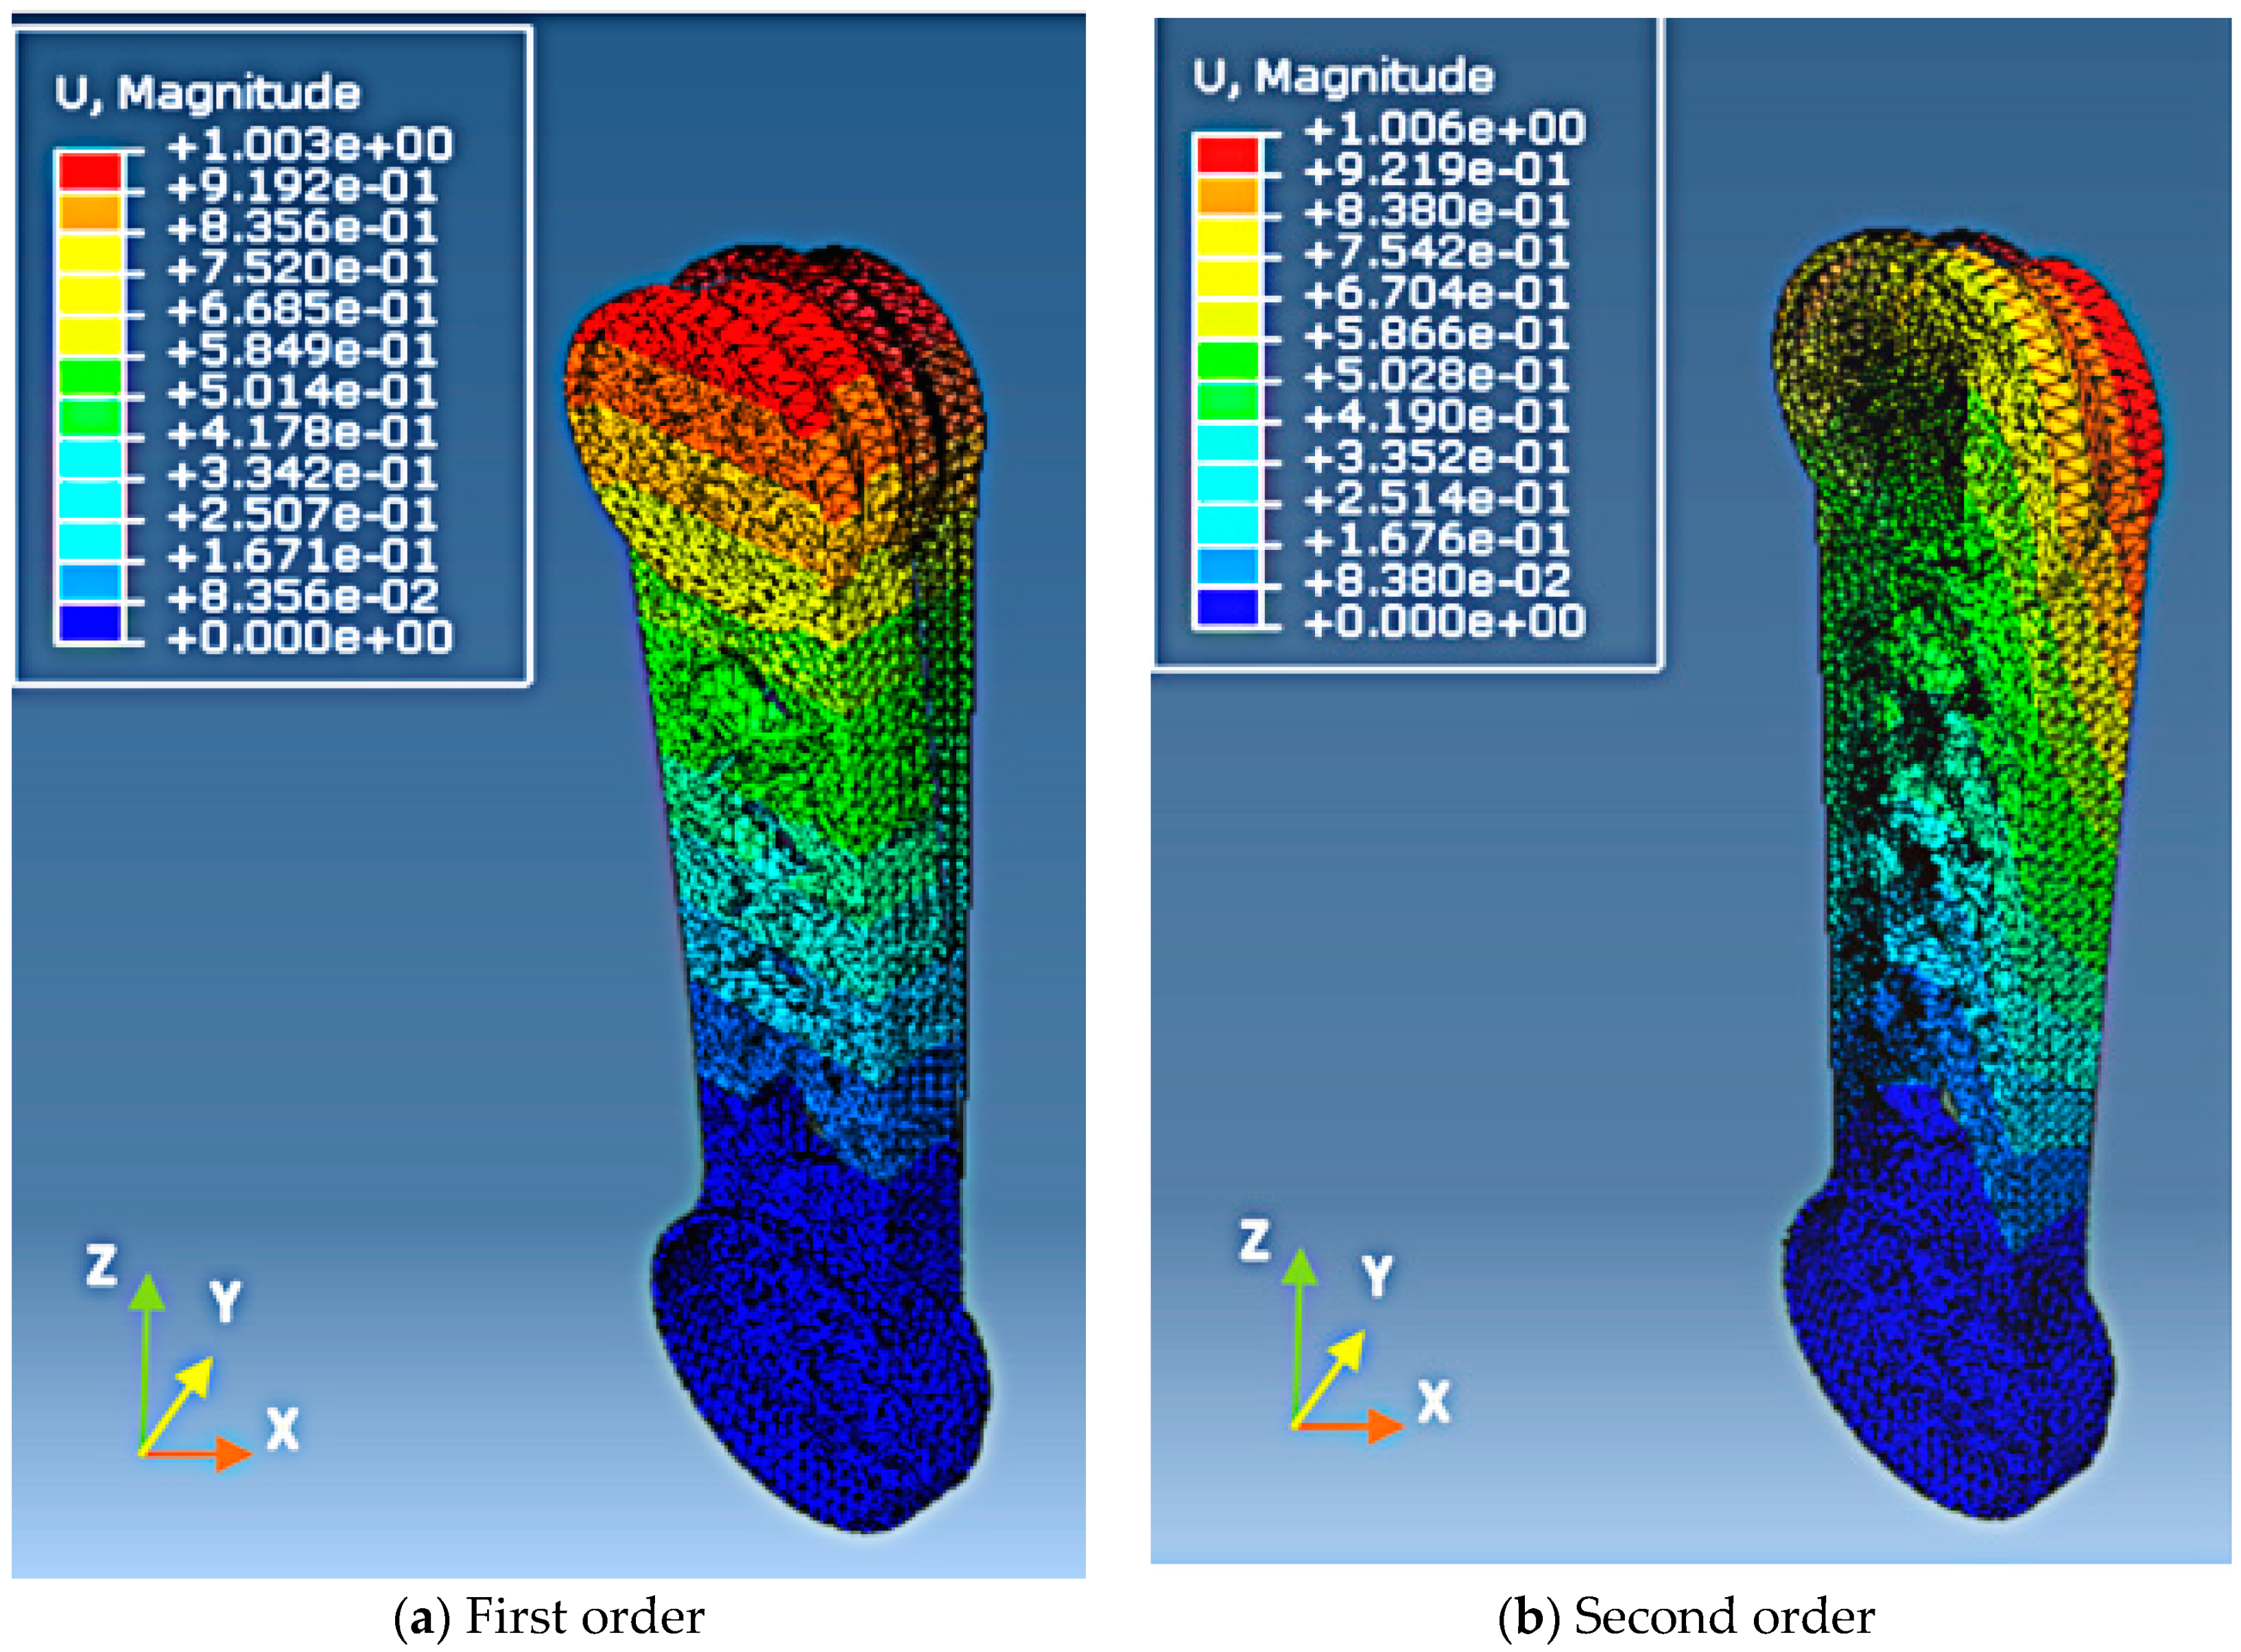
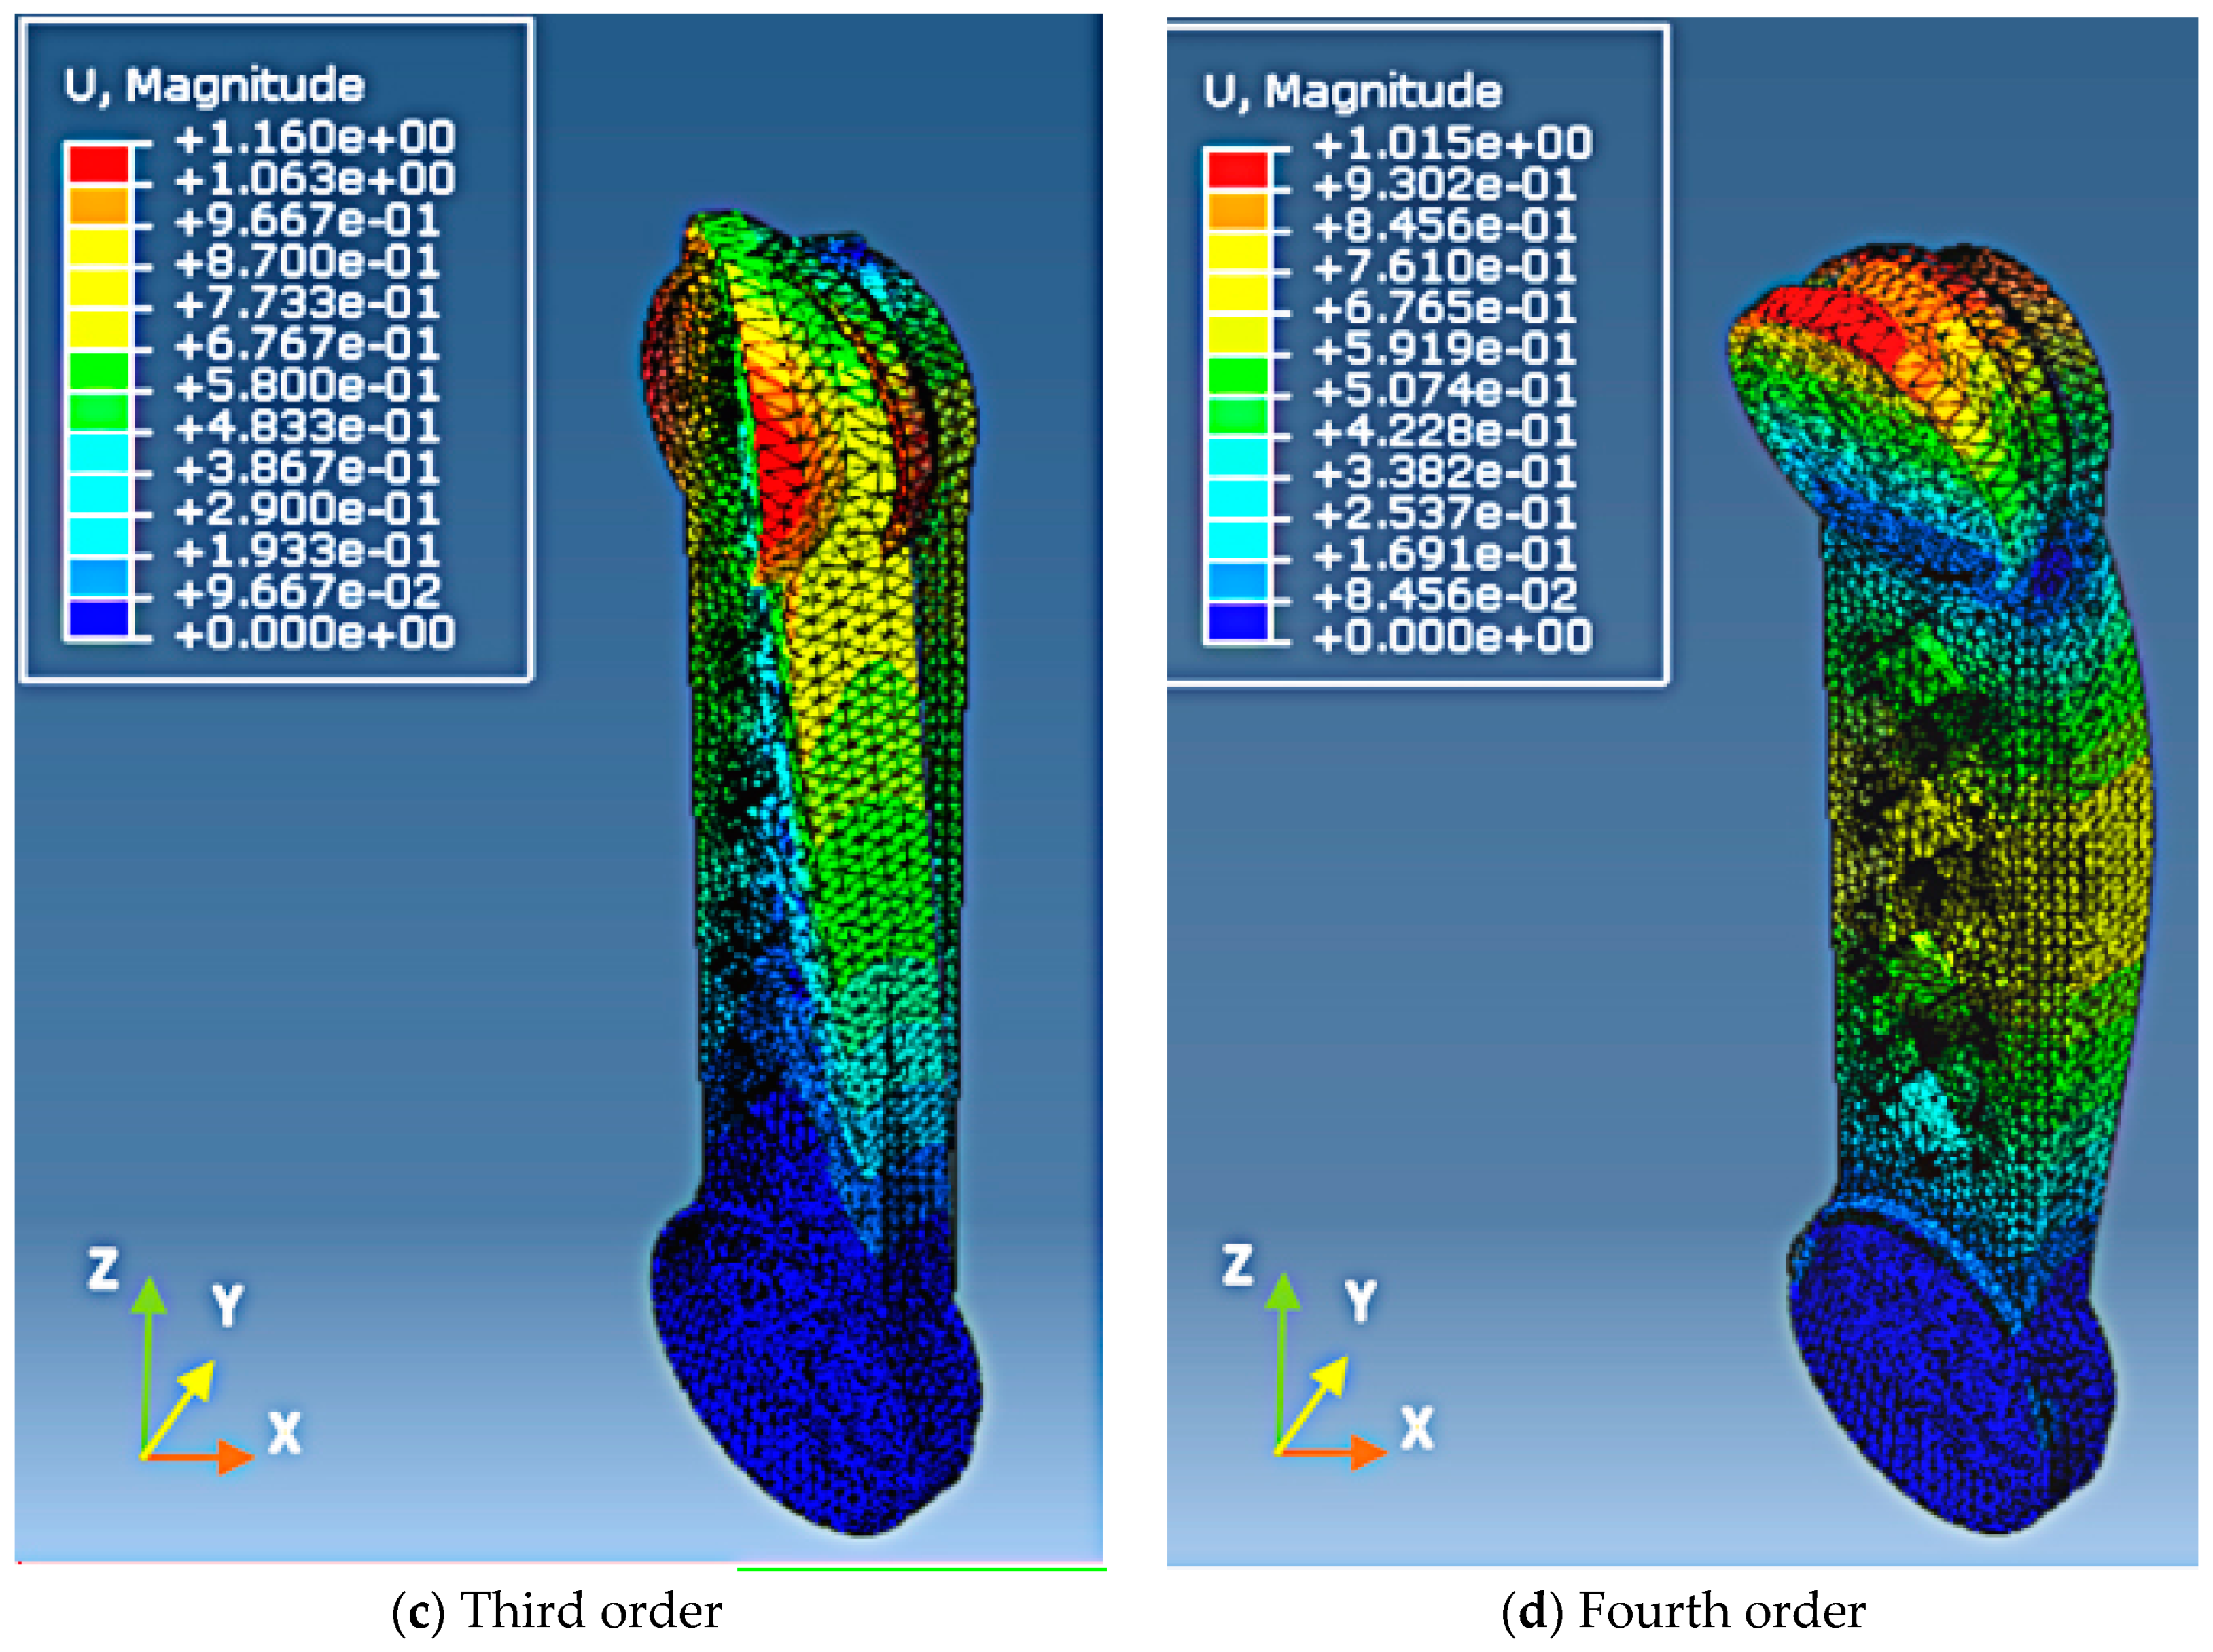
In this work, ABAQUS was employed to do modal analysis for the upper arm of the industrial robot. During the modal analysis process, the effect of the external forces was not considered, and one terminator of the upper arm was fixed and the other was free. Therefore, a fixed constraint was imposed on one terminator. The preceding four order vibration modes can be shown in Figure 13.
In Figure 13, the four figures used the format of comparative figures to present the variations before and after a vibration. The dark shadow and shadow entities denoted the structure was in a different position. Therefore, the vibration modes can be detected by means of position variation. In addition, to make the observation clear, an amplification factor was employed in Figure 13 because the actual magnitude was so small that it was difficult to observe. In this work, the amplification factor was 60.
According to results from Figure 13, some important points can be obtained as follows.
(1)
In the first order vibration mode, the center of the vibration was the junction between the upper arm and the reducer in the second axis, and the vibration occurred along the Y axis, according to the comparison of the figures in different positions. The vibration may easily induce the fatigue failure of the junction. Hence, the rigidity of the junction should be further improved. Under the circumstance, as the distance away from the gyration center increases, the elastic displacement also increases, and the junction between the upper arm and the forearm has the largest elastic displacement.
(2)
In the second order vibration mode, which had the same benchmark as that in the first variation mode, the upper arm had a certain swing in the Y axis, and had a certain reverse in the Z axis. The largest elastic displacement occurred at the edge of the joint between the upper arm and the forearm.
(3)
In the third order vibration mode, the vibration was overall torsion, and the center was the middle of the upper arm, which may induce the fatigue of the middle and easily destroy the structure. The large elastic displacement was in two sides of the symmetrical axis centered on the Z axis, and the force in the back of the upper arm was very large.
(4)
In the fourth order vibration mode, the positioning benchmark includes the two terminates of the upper arm, the vibration occurred in the middle of the upper arm and was along the Y axis, and the largest elastic displacement occurred at the edge of the joint between the upper arm and the forearm.
Then the preceding 12 orders modal analyses can be correspondingly conducted using ABAQUS. The results were shown in Table 4.
It can be observed that the natural frequencies in different orders were high enough. Apart from the first and the second orders, the resonance cannot occur in other orders. Hence, in a subsequent optimization process, the goal was increasing the natural frequency of the upper arm so as to avoid the resonance from occurring.

3. Topological Optimization Design

3.1. Topological Optimization Theory and Procedures

In this work, a plug-in unit Tosca (Topology Orchestration Specification for Cloud Applications) in ABAQUS was employed to conduct the structural optimization design. This is a flexible, modular, structural optimization plug-in unit, which can provide various types of optimization such as topology and shape, and support ABAQUS solver based on industrial-standard finite element analyses solutions. During the analyzing process, the formal analysis results obtained in the most unfavorable working condition were transmitted into the optimization deign of stress/strain. Therefore, the optimized structure can be suitable for the movement with high speed and high load. In addition, the analysis result of modal analysis can be transmitted into the natural frequency optimization analysis, and then as bases of the optimized modal analysis.
Tosca conducted the topological optimization based on a varying density method. For the majority of topological optimization issues, the Solid Isotropic Microstructures with Penalization (SIMP) method [33] is employed for calculation. A general mathematical model is as follows.
{ F i n d   x = ( x 1 , x 2 , x n ) T M i n   C ( x ) = F T U S u b j e c t   t o . { V V * F = K U 0 < x min x i 1   ( x = 1 , 2 , 3 n )
where xi is the design variable, which denotes the relative density, and its value range is [xmin, 1]. n is the number of the design variables, K is the total rigidity matrix, U is the displacement vector, F is the force vector, V is the volume of the structure before optimization, and V* is the volume of the structure after optimization.

3.2. Topological Optimization

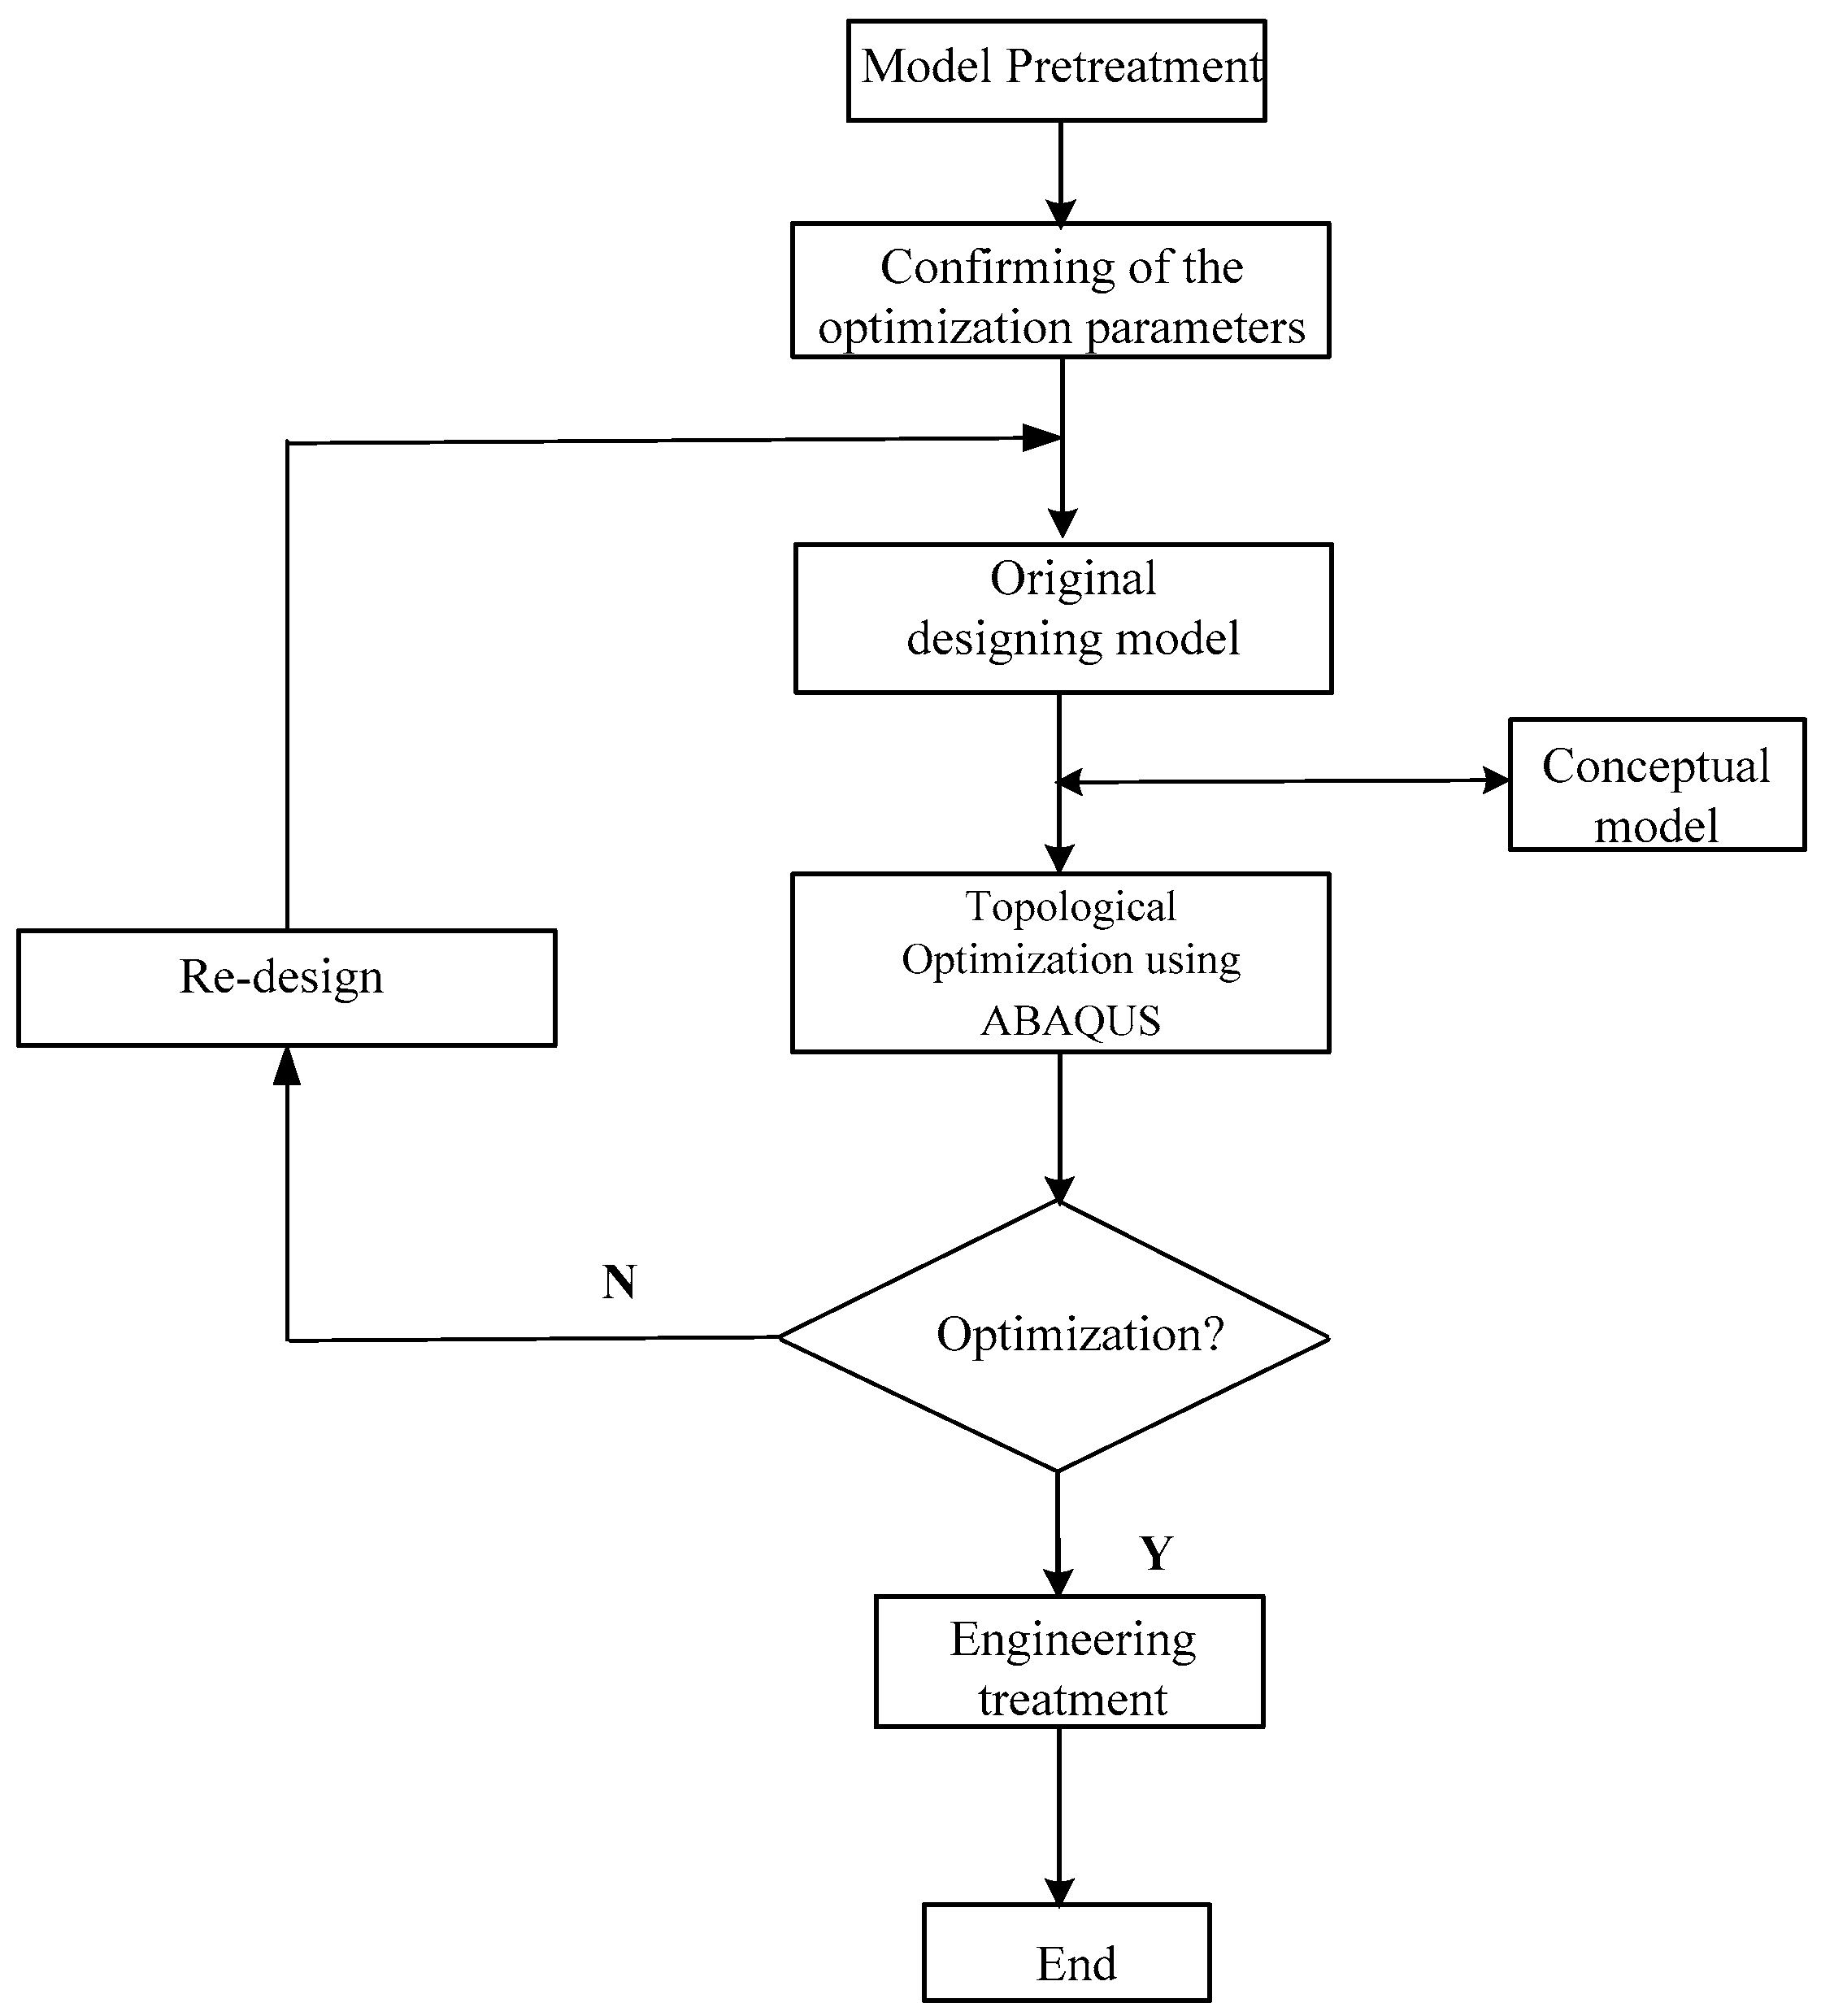
In general, topological optimization can follow the procedure shown in Figure 14.
After obtaining the new model structure, a new analysis procedure should be conducted so as to evaluate the optimization results by comparing the original model and the model after optimization.

3.2.1. Division of the Design Area

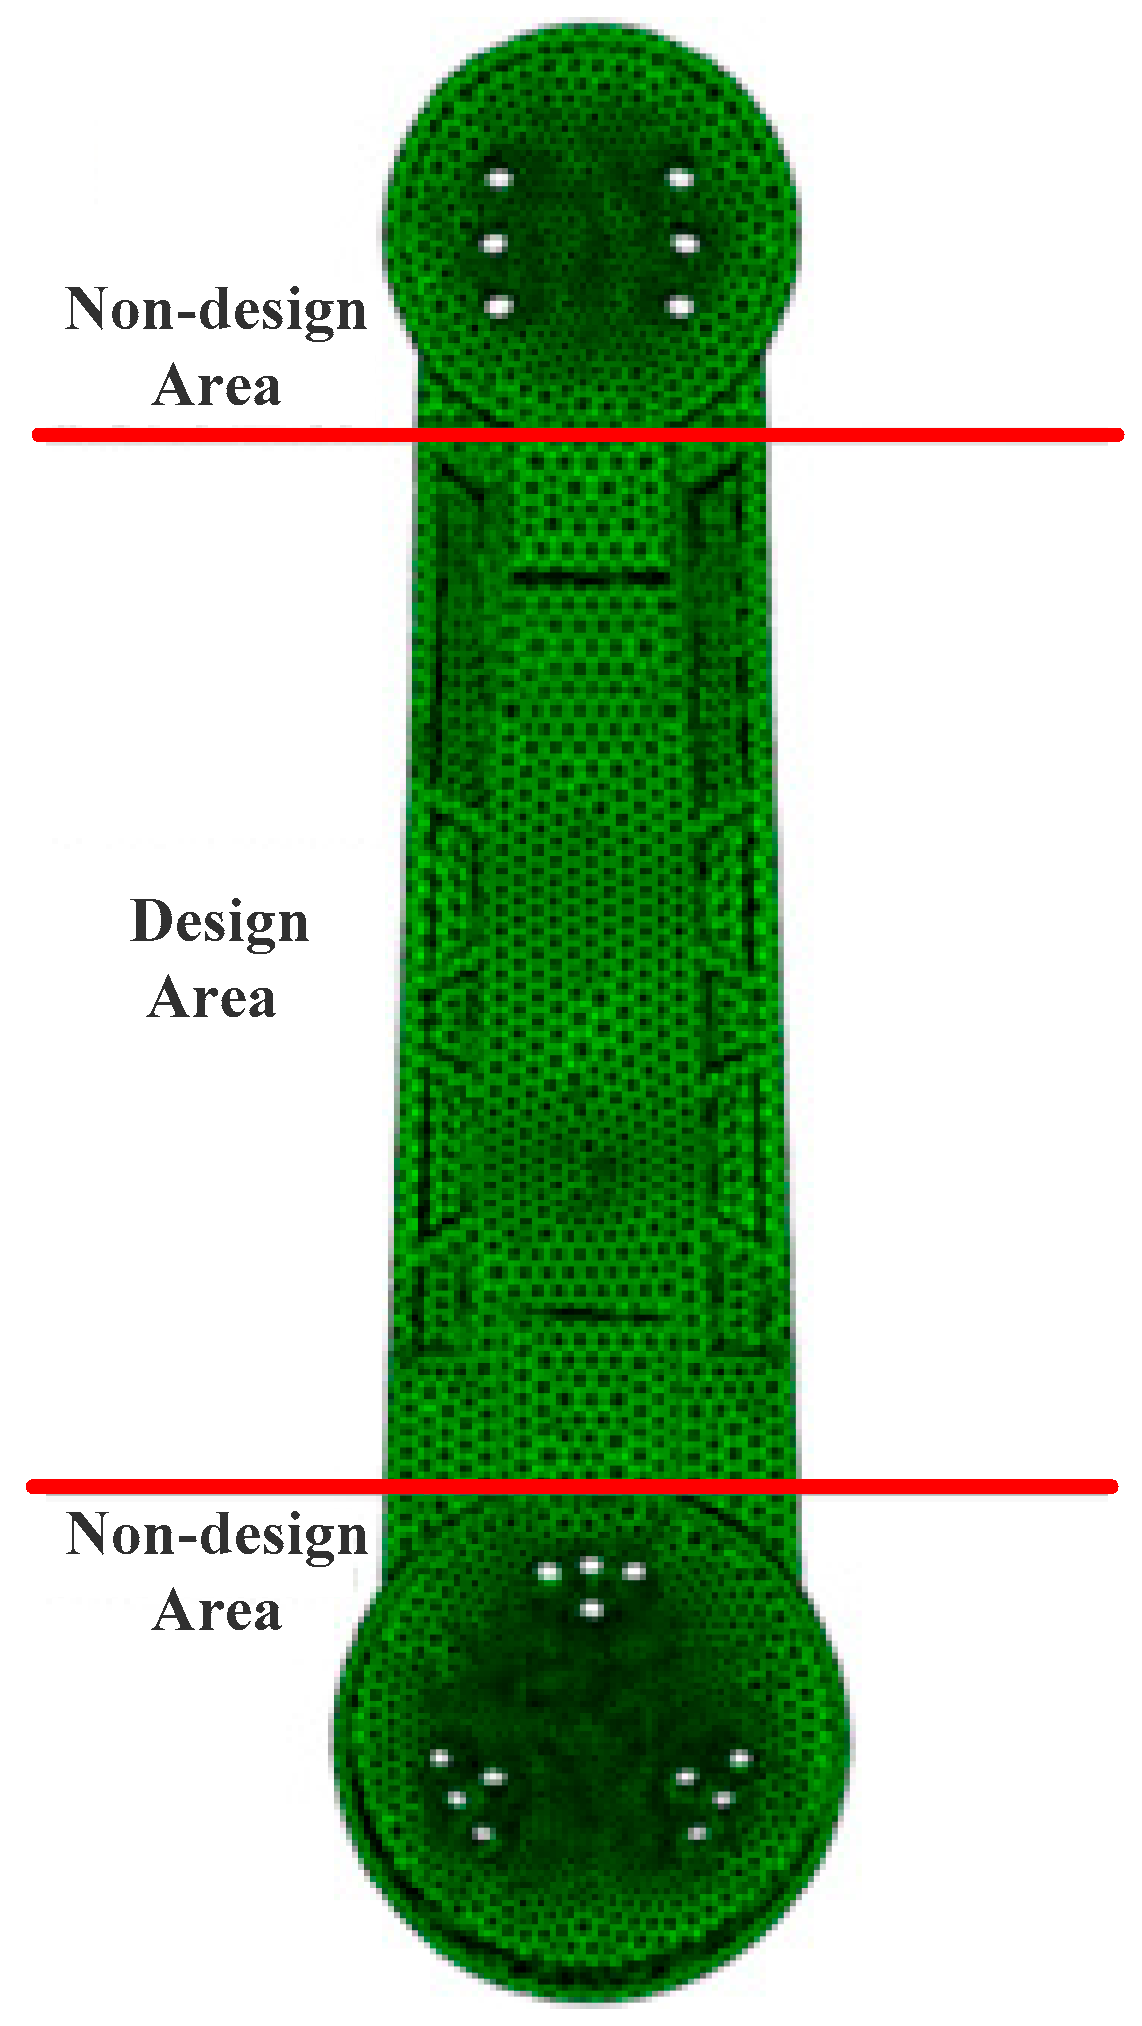
For a task of optimization analysis and design, it is important to separate the design area from the total area. In other words, it is important to distinguish between the design area and non-design area. The non-design area is the area where the structure is too complicated and difficult to process, or cannot be processed because a tight assembling relation exists, as shown in Figure 15. On the other hand, the design area has none of these limitations. To obtain more effective mechanical structure and spatial layout, material filling should be conducted as shown in Figure 16.

3.2.2. Confirmation of the Optimization Parameters

Some optimization parameters were required to be repeatedly adjusted during the process. These parameters were as follows: to maintain the material densities within the design area and not achieve 0, which can induce the calculation terminate. The minimum and maximum values of the material densities were respectively 0.001 and 1. The varying rate of the material density during the iterating calculations was set to be 1, which may make the number of iteration increase. However, the corresponding effect of the optimization will be close to that of the expectation. For the topological optimization of the continuum, the SIMP interpolation model was optimal after several trials. The value of the penalty factor should be between 3 and 5. If the value is too large, it can induce divergent or unsatisfactory results. Therefore, this value should be confirmed after corresponding trails. To avoid the re-calculation of the area where the material density approaches 0, the method of deleting the soft element was employed, and the judgement threshold was 0.05. The terminate criterion of the calculation used the priority setting of the objective function terminate criterion. The variation value used the default setting, which was 0.001, and the number was 100.
The design variables, objective functions, constraints, and corresponding geometry limitations were as follows.
Design response: total stress, volume (under the homogeneous condition, it can be equivalent to the quality), the natural frequency in the preceding four orders, and the elastic displacement in the direction, which has the largest displacement.
Objective function: minimum overall stress, which was also the maximum overall rigidity, under the condition that other conditions were satisfied.
Constraints: the volume was less than 85% of the original volume, which is larger than or equal to the natural frequencies in the preceding four orders, and less than or equal to the original elastic displacement in the direction that has the largest displacement.
Geometry limitation: freezing the non-design area or plane symmetry.

3.2.3. Design of Topological Optimization

In general, the results of topological optimization can instruct the actual system structural design, which can stimulate how the materials distribute in the model in order to achieve an optimal performance. Hence, for a 3D solid structure, the optimization shape from the results of topological optimization was not clear, and it required some other additional operations, such as adjusting the size, boundary, or contour in order to obtain proper shapes.
As shown in Figure 17, if the penalty factor used 5, the calculation cannot be convergent and an unsatisfactory result was obtained. After several analyses and trials, the value 3 of this factor was confirmed. Then the calculated topological optimization structure can be shown in Figure 18. Additionally, the boundary of the structure should be reasonably processed. For example, the saw-tooth boundary was changed to be the clear ones, as shown in Figure 19. In addition, for some transitional area, which included some unreasonable holes or vacancies, some additional materials should be filled because the mathematical gains obtained from topological optimization may not meet the requirements under the actual engineering situation. Taking these measures, the products that meet the industrial requirement can be obtained. The final model can be shown in Figure 20.
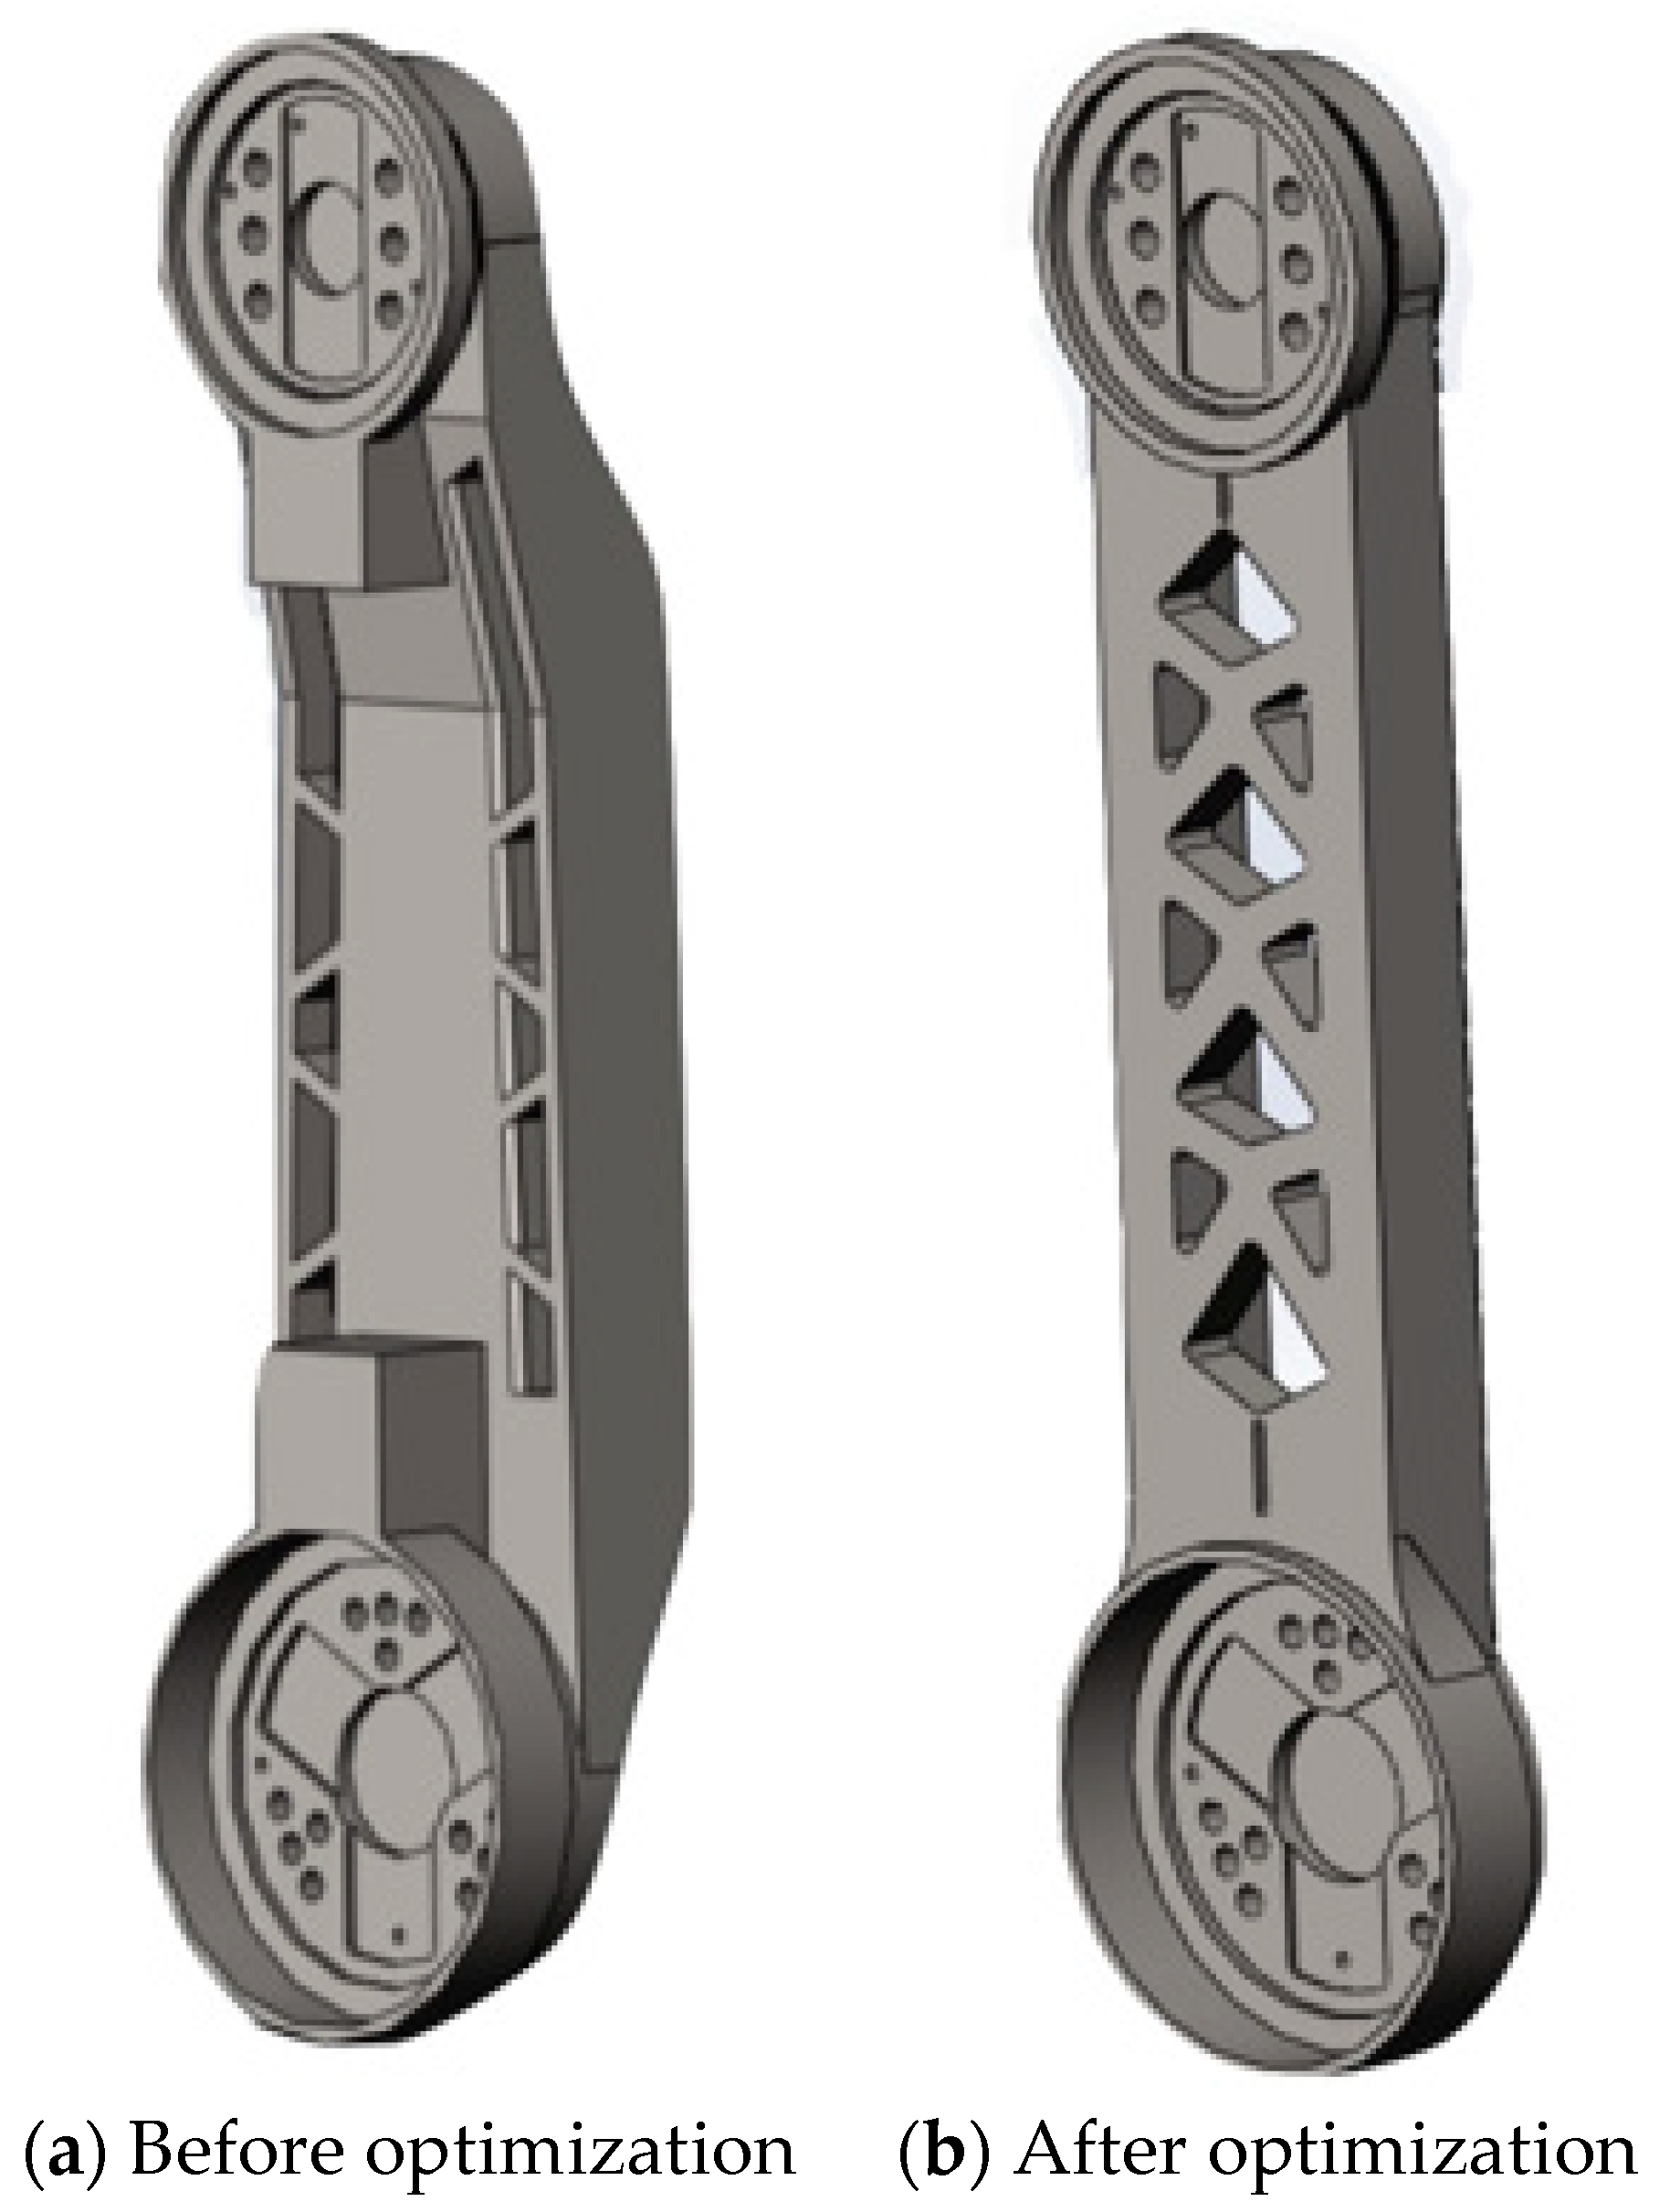
Then, for the overall upper arm, the entity model can be shown in Figure 21. According to the comparison between the models before and after optimization, it can be observed that the effect of the light-weight design was clear. The topological optimization can optimize the material distribution by means of optimal calculations. As the model shown in Figure 21b, which was so different from that in Figure 21a, the optimized model employed some regular mesh structures to replace the original sandwich support and backboard support, which can significantly reduce the processing difficulty and decrease the weight.

3.3. Static Analysis of the Upper Arm after Optimization

Then, for the model of the upper arm shown in Figure 21b, a corresponding static analysis in Section 2 was required.
(1)
Transmitted the model into ADAMS in order to obtain the Mises stress distribution analysis in the most unfavorable working condition, and then obtained the load information under this condition. The position of the optimized upper arm in this condition can be shown in Figure 22.
(2)
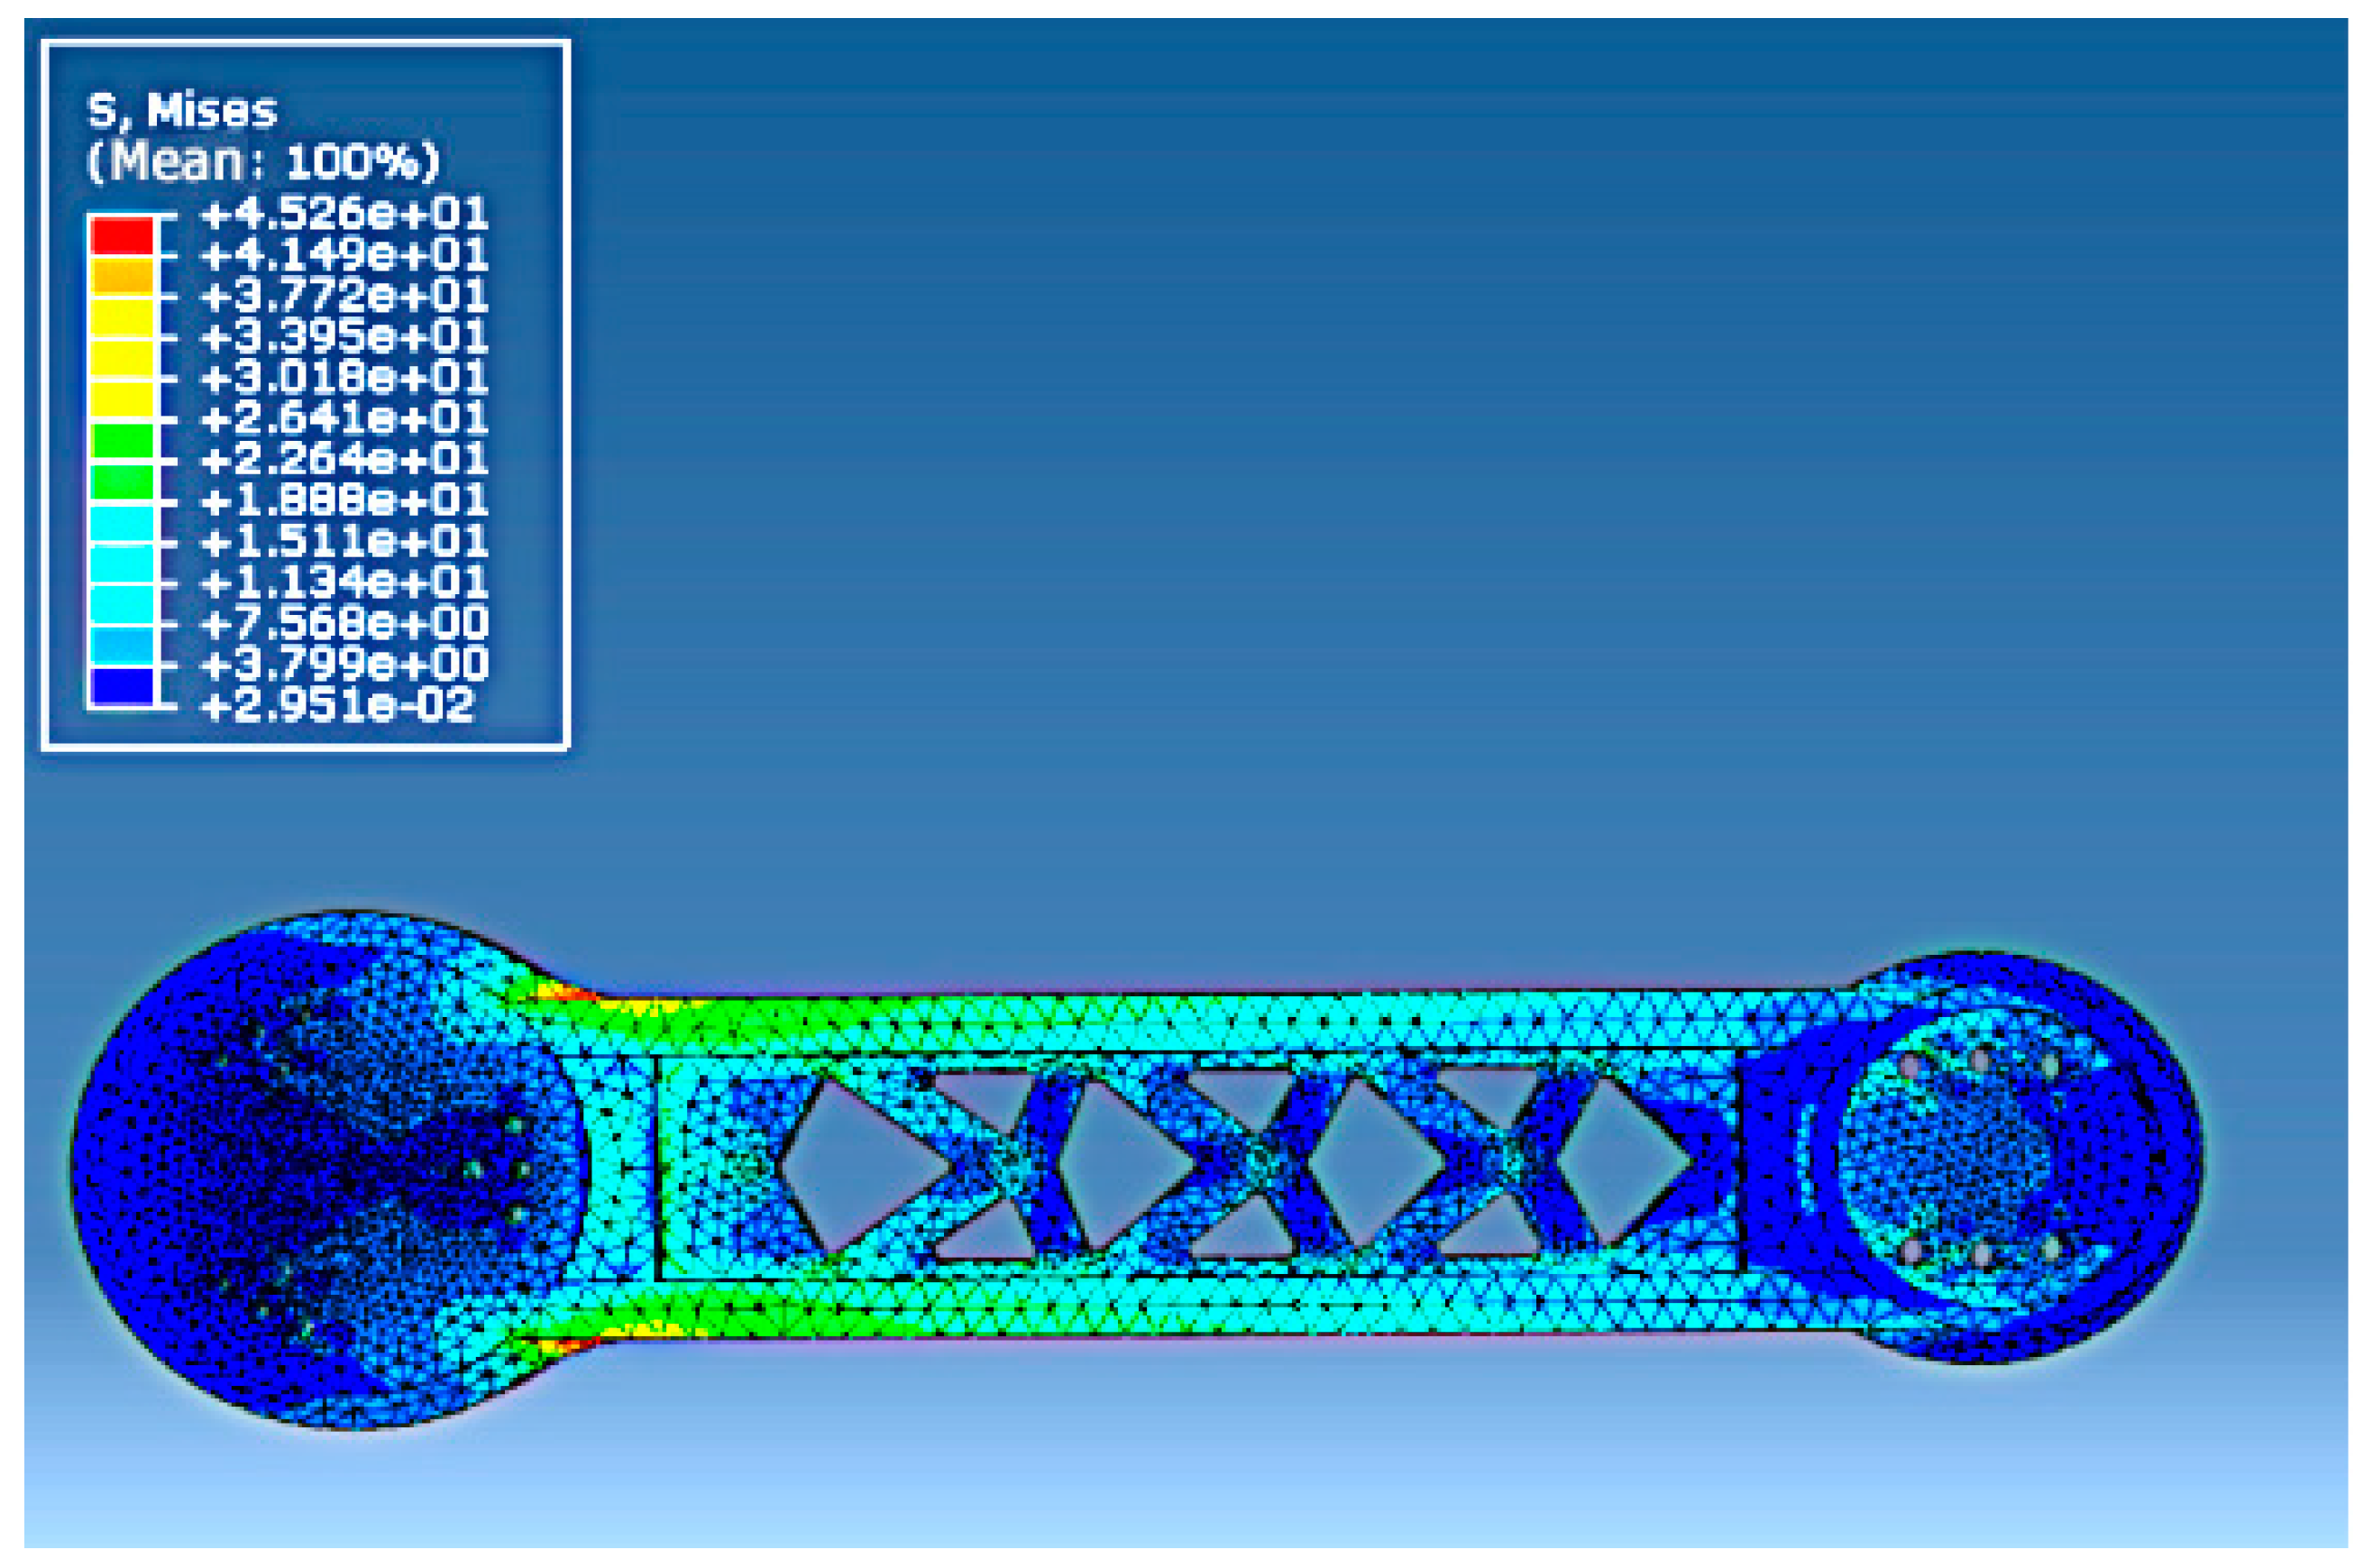
Transmitted the model and load information of the optimized upper arm in the most unfavorable working condition into ABAQUS and obtained the corresponding Mises stress distribution analysis. The result was shown in Figure 23. Under this circumstance, the maximum Mises stress of the optimized upper arm was 45.26 MPa.
(3)
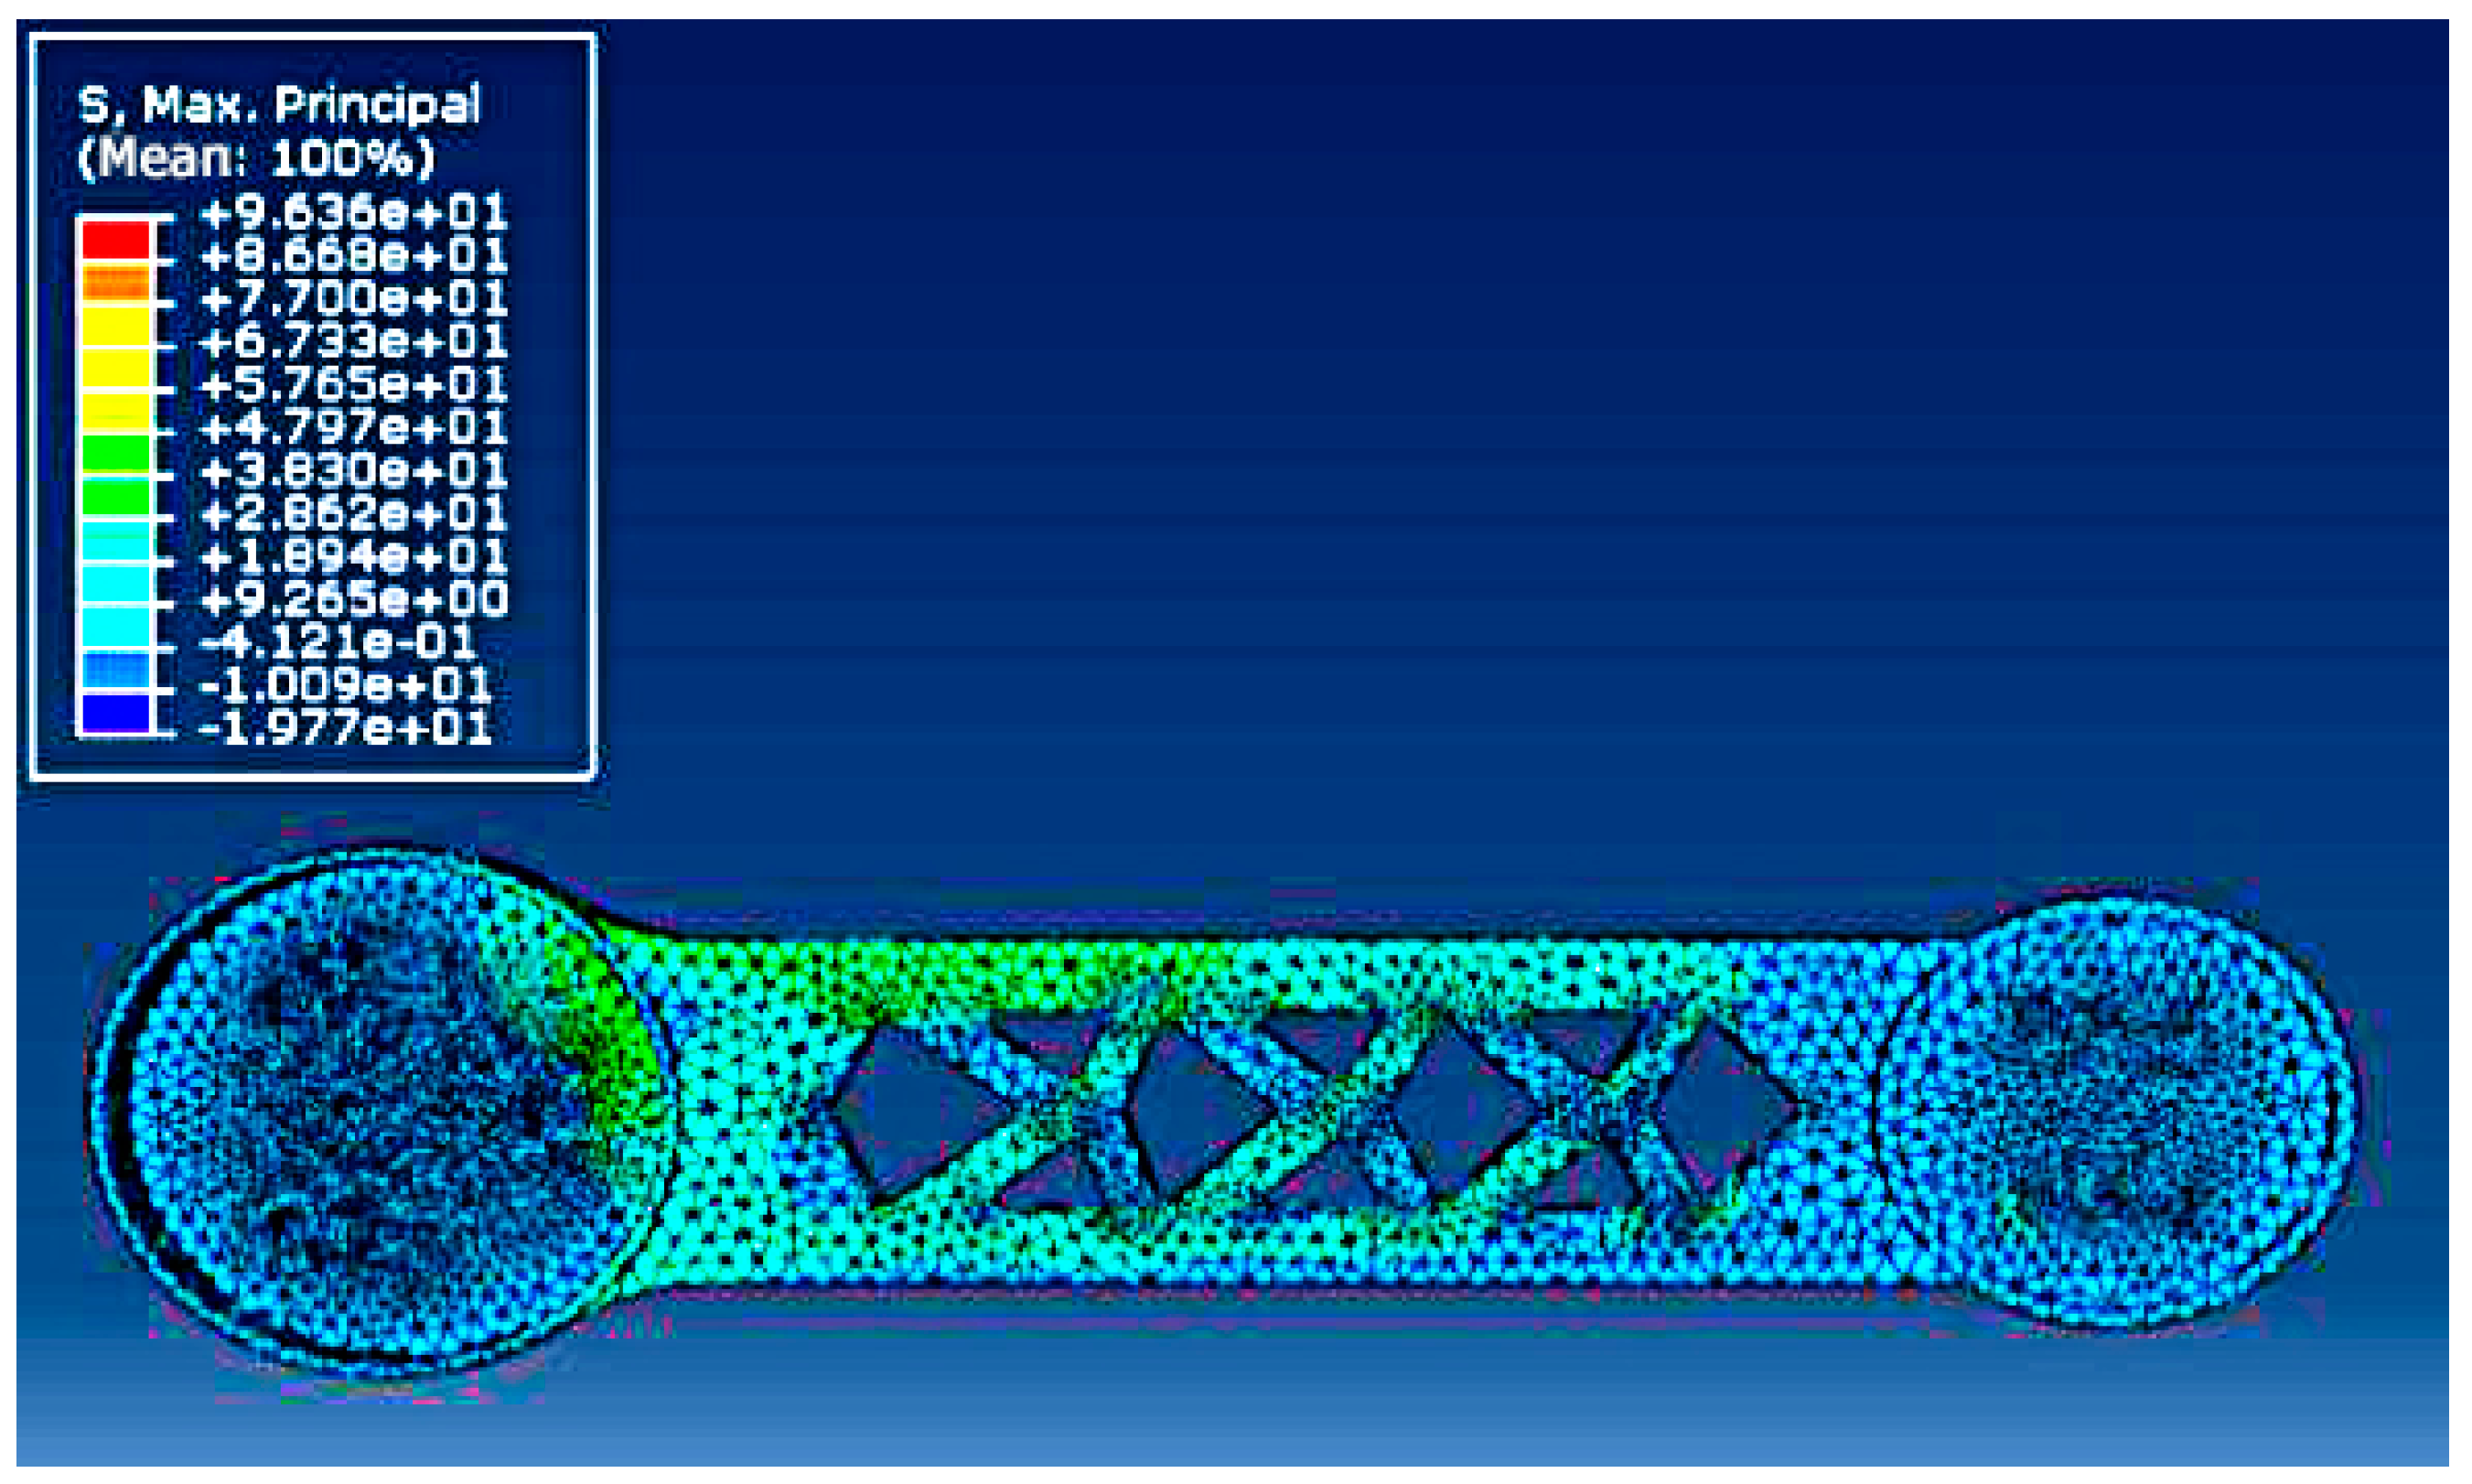
The maximum tensile stress analysis cloud map of the optimized upper arm was shown in Figure 24. The maximum tensile stress was 96.36 MPa. The yield strength of the spheroidal graphite cast iron QT500–7 was 365 MPa, the safety coefficient of the brittle material used was 2.5, and the allowable stress was 146 MPa based on a calculation from Equation (4). It meant that the maximum force of this structure was within the allowable range of the yield strength, and the overall stress value was smaller than that before optimization.
As shown in Figure 25, in the most unfavorable working condition, the maximum elastic displacement of the gyration center in the extreme moving direction was 0.267 mm, which was smaller than that before optimization (0.277 mm).
The static analysis result of the optimized upper arm in the most unfavorable working condition was shown in Table 5.
(4)
When conducting the modal analysis of the optimized upper arm, the results of the first four orders vibration modes were shown in Figure 26. It can be observed that the results were approximately the same as those before optimization.
Similar to Figure 13, the amplification factor in Figure 26 was still 60. The vibration format of the optimized model of the upper arm is approximately the same as that of the upper arm before optimization design, and the positions which had the largest elastic displacement are the same. However, apart from the natural frequencies in different orders decreasing, the largest elastic displacements of the optimized model in every order were smaller than those of the model before the optimization design. Especially in the fourth order, the largest elastic displacement changed from 1.276 mm to 1.015 mm. The decreasing percent achieved 20.45%, which meant that the dynamic performance was better after the optimization design. In addition, the first 12 orders of nature frequencies for the optimized upper arm were correspondingly calculated. The results were shown in Table 6. It can be seen that the nature frequencies in the lower orders were also increased, when compared to those before optimization.
After material filling, the structure of the upper arm after topological optimization had large changes when compared to that before optimization. According to Table 7, it can be observed that the weight of the upper arm of the industrial robot was 17.9% less than that of the original structure, and some criterions, such as the maximum Mises stress, maximum tensile stress, and maximum elastic displacement of the gyration center, were decreased. On the other hand, the lower order nature frequencies increased. Table 7 showed the comparison of some key criteria between the upper arm before and after optimization.
The analysis results showed that, after employing the topological optimization, the overall performance is the same as or above that of the original structure, and the ratio between load and self-weight can also be increased, which meant that the optimization has achieved the expected goal.

4. Experimental Validation

The repeatability is one of the most important performance criteria of the industrial robot, and the position repeatability is also only a positioning performance indicator specified by many industrial robot manufacturers. Especially for the arc welding operation, the high repeatability can assure the welding robot accurately seeks the position that requires energy. In this work, to further evaluate the effect of the light-weight structural topological optimization design of the upper arm, the comparison of the position repeatability between the original robot and the robot after a light-weight design was conducted in this section.

4.1. Experimental Platform and Method

4.1.1. The Comparison between the Upper Arm before and after Optimized Design

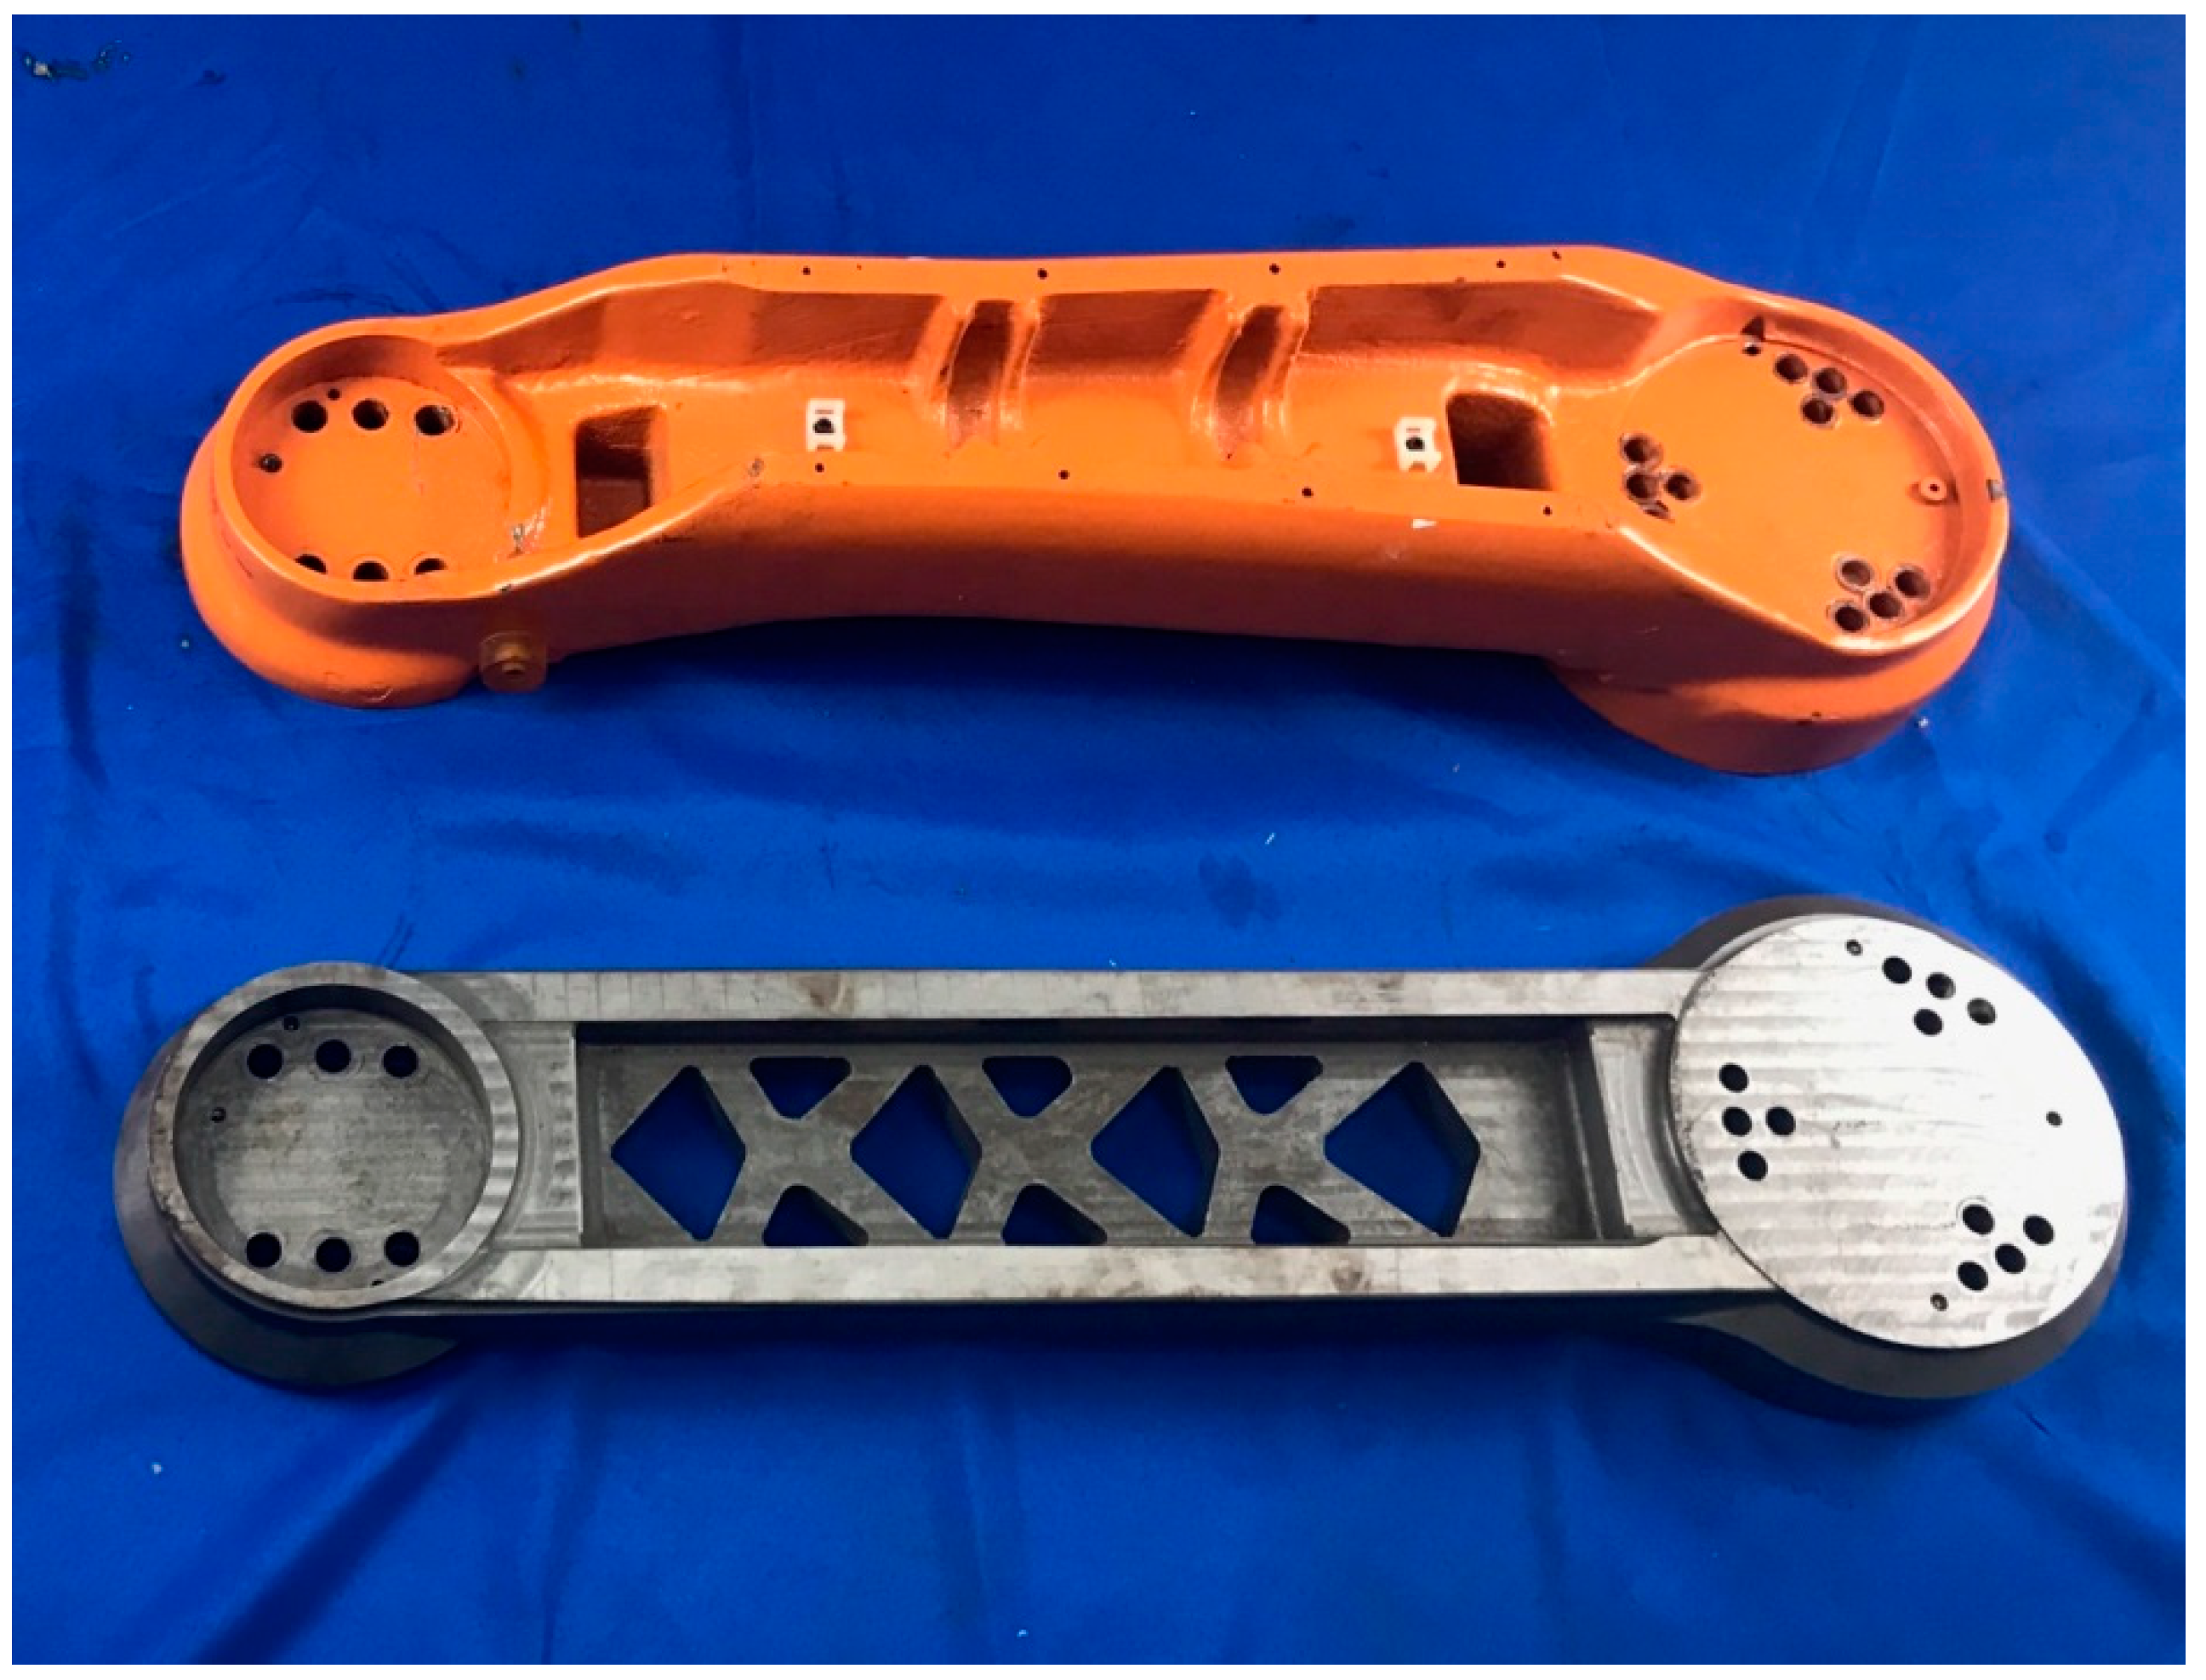
After obtaining the optimized upper arm, corresponding physical processing was also conducted. Then, the actual products obtained from the optimized model and the original one can be shown in Figure 27 for comparison, which can correspond to their model comparison. This was shown in Figure 20.
It can be seen from Figure 27 that the structure of the upper arm after topological optimization was more regular than that of the original upper arm. Through an actual measurement, the weights of these two upper arms were the same as the calculations, as shown in Table 7. In addition, the original strength rib, side panel, and back panel structures had been removed, and the main structure was supported using the mesh structure. Hence, this structure was easier to process when compared to the original structure.

4.1.2. Experimental Platform and Procedure

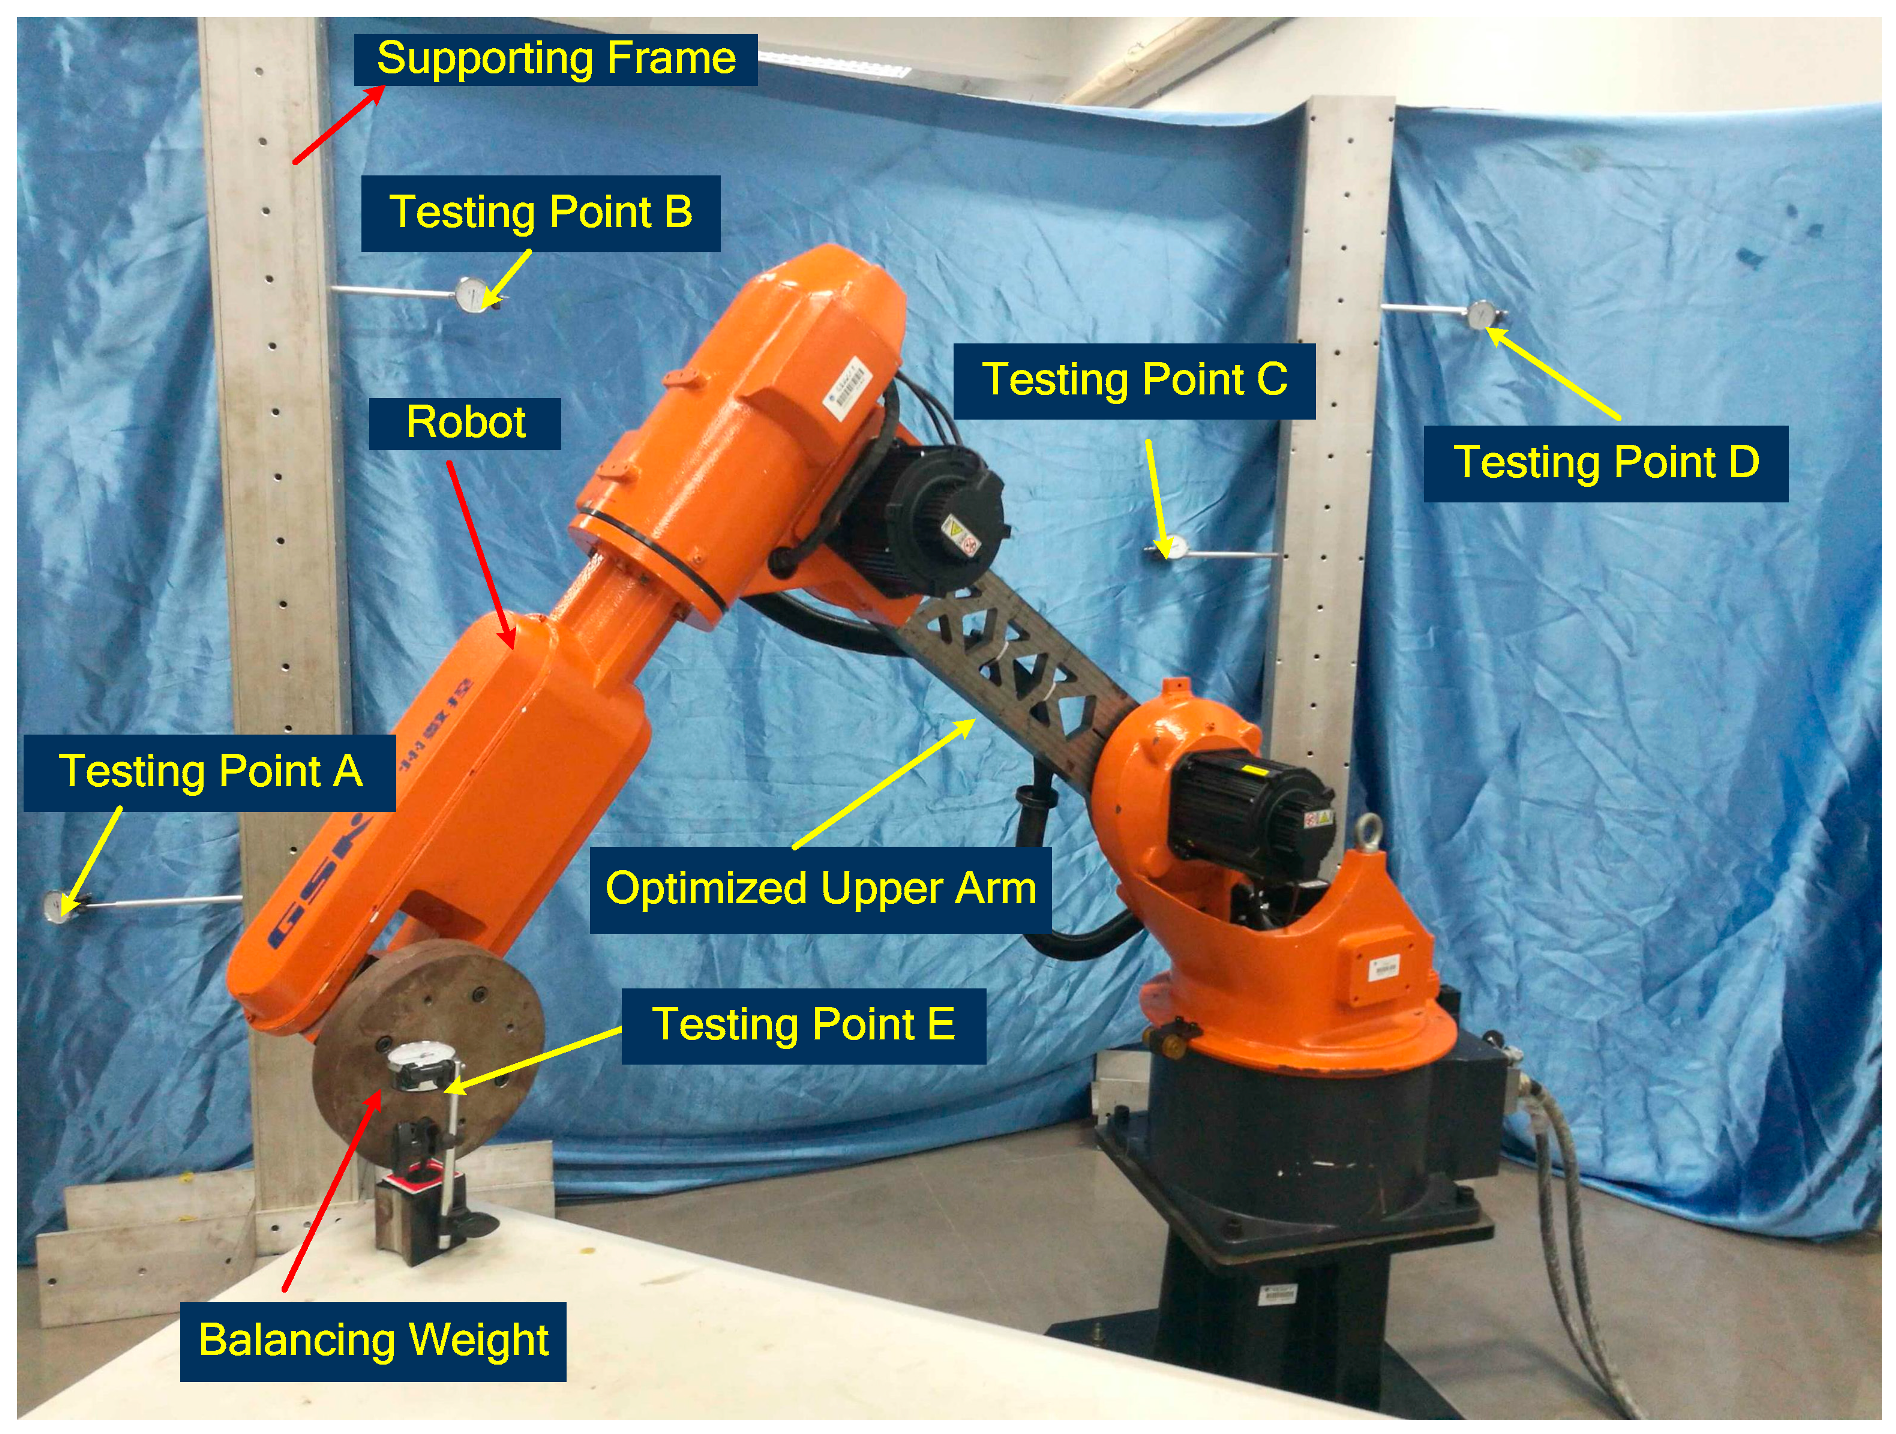
To validate the effectiveness of the topological optimization of the structure, a self-designed actual experimental platform had been employed. The platform included a supporting frame, five dial gauges, a balancing weight, and a robot. The accuracy of the dial gauge can achieve 1 micron, and the measuring range was between 0 and 1 mm. The validation experiment followed the general industrial robots-performance criteria and related test methods [34]. For the five testing points, which were chosen from a regular hexahedral space, 100 repeatability tests were conducted. To obtain effective experimental results and make the results reasonable for the actual industrial welding robot, the testing points should include normal and extreme working points. The normal working points should be scattered as much as possible. The five points in this experiment were chosen as follows: extreme bottom of the working position A, extreme highest working position B, and normal working position C, D, and E. The experimental platform and the corresponding five testing points can be shown in Figure 28.
The stability of the supporting frame was very important for the experiment. It should be assured that the supporting frame was stable and unwavering enough when the industrial robot collided at 100% of the maximum running speed. Five dial gauges were mounted on the supporting frame to obtain the values in the corresponding testing points in the experiment.
The detailed measurement procedures were as follows. When the experiment began, the robot moved following the preliminary teaching program. When the end of the robot approached the chosen testing point, the speed of the robot decreased and approached the testing head of the dual gauge. After it touched the testing head, the speed was further decreased, and the force was slowly applied. Then the data of the dual gauge was recorded when the data was stable. Then the robot left this testing point and moved toward the next testing point and used the same method to record the corresponding data. When one array of data was recorded, the robot was set to repeat the same procedure to record the next array of data.
Because the analyses and optimizations in Section 2 and Section 3 were conducted in the most unfavorable working condition, which was the moving speed of the industrial robot. This was 100% of the rated maximum speed and the load was 20 kg, which was also the rated maximum mass. In this experiment, the repeatability of the robot in different moving speeds and loads was further validated.
To obtain more general results, the masses of the loads in the tests should employ from a very small value to the rated value, in the premise that the robot end assembly relation was seriously considered. Three mass gradients were used in the test: 2 kg, 10 kg, and 20 kg. In addition, the moving speeds also used three gradients: 10%, 50%, and 100% of the rated speed. During the actual experimental process, the experiment of the robot with the original upper arm was conducted. Then the upper arm was replaced by the optimized one to repeat the same experiment. The detailed experimental arrangement was shown in Table 8.
Hence, for each point, 100 repeatability tests were conducted, and the total 1800 measurements were employed.

4.2. Experimental Results

For each point, both maximum and minimum values were removed, and then the mean values were recorded. Table 9 showed corresponding experimental results.
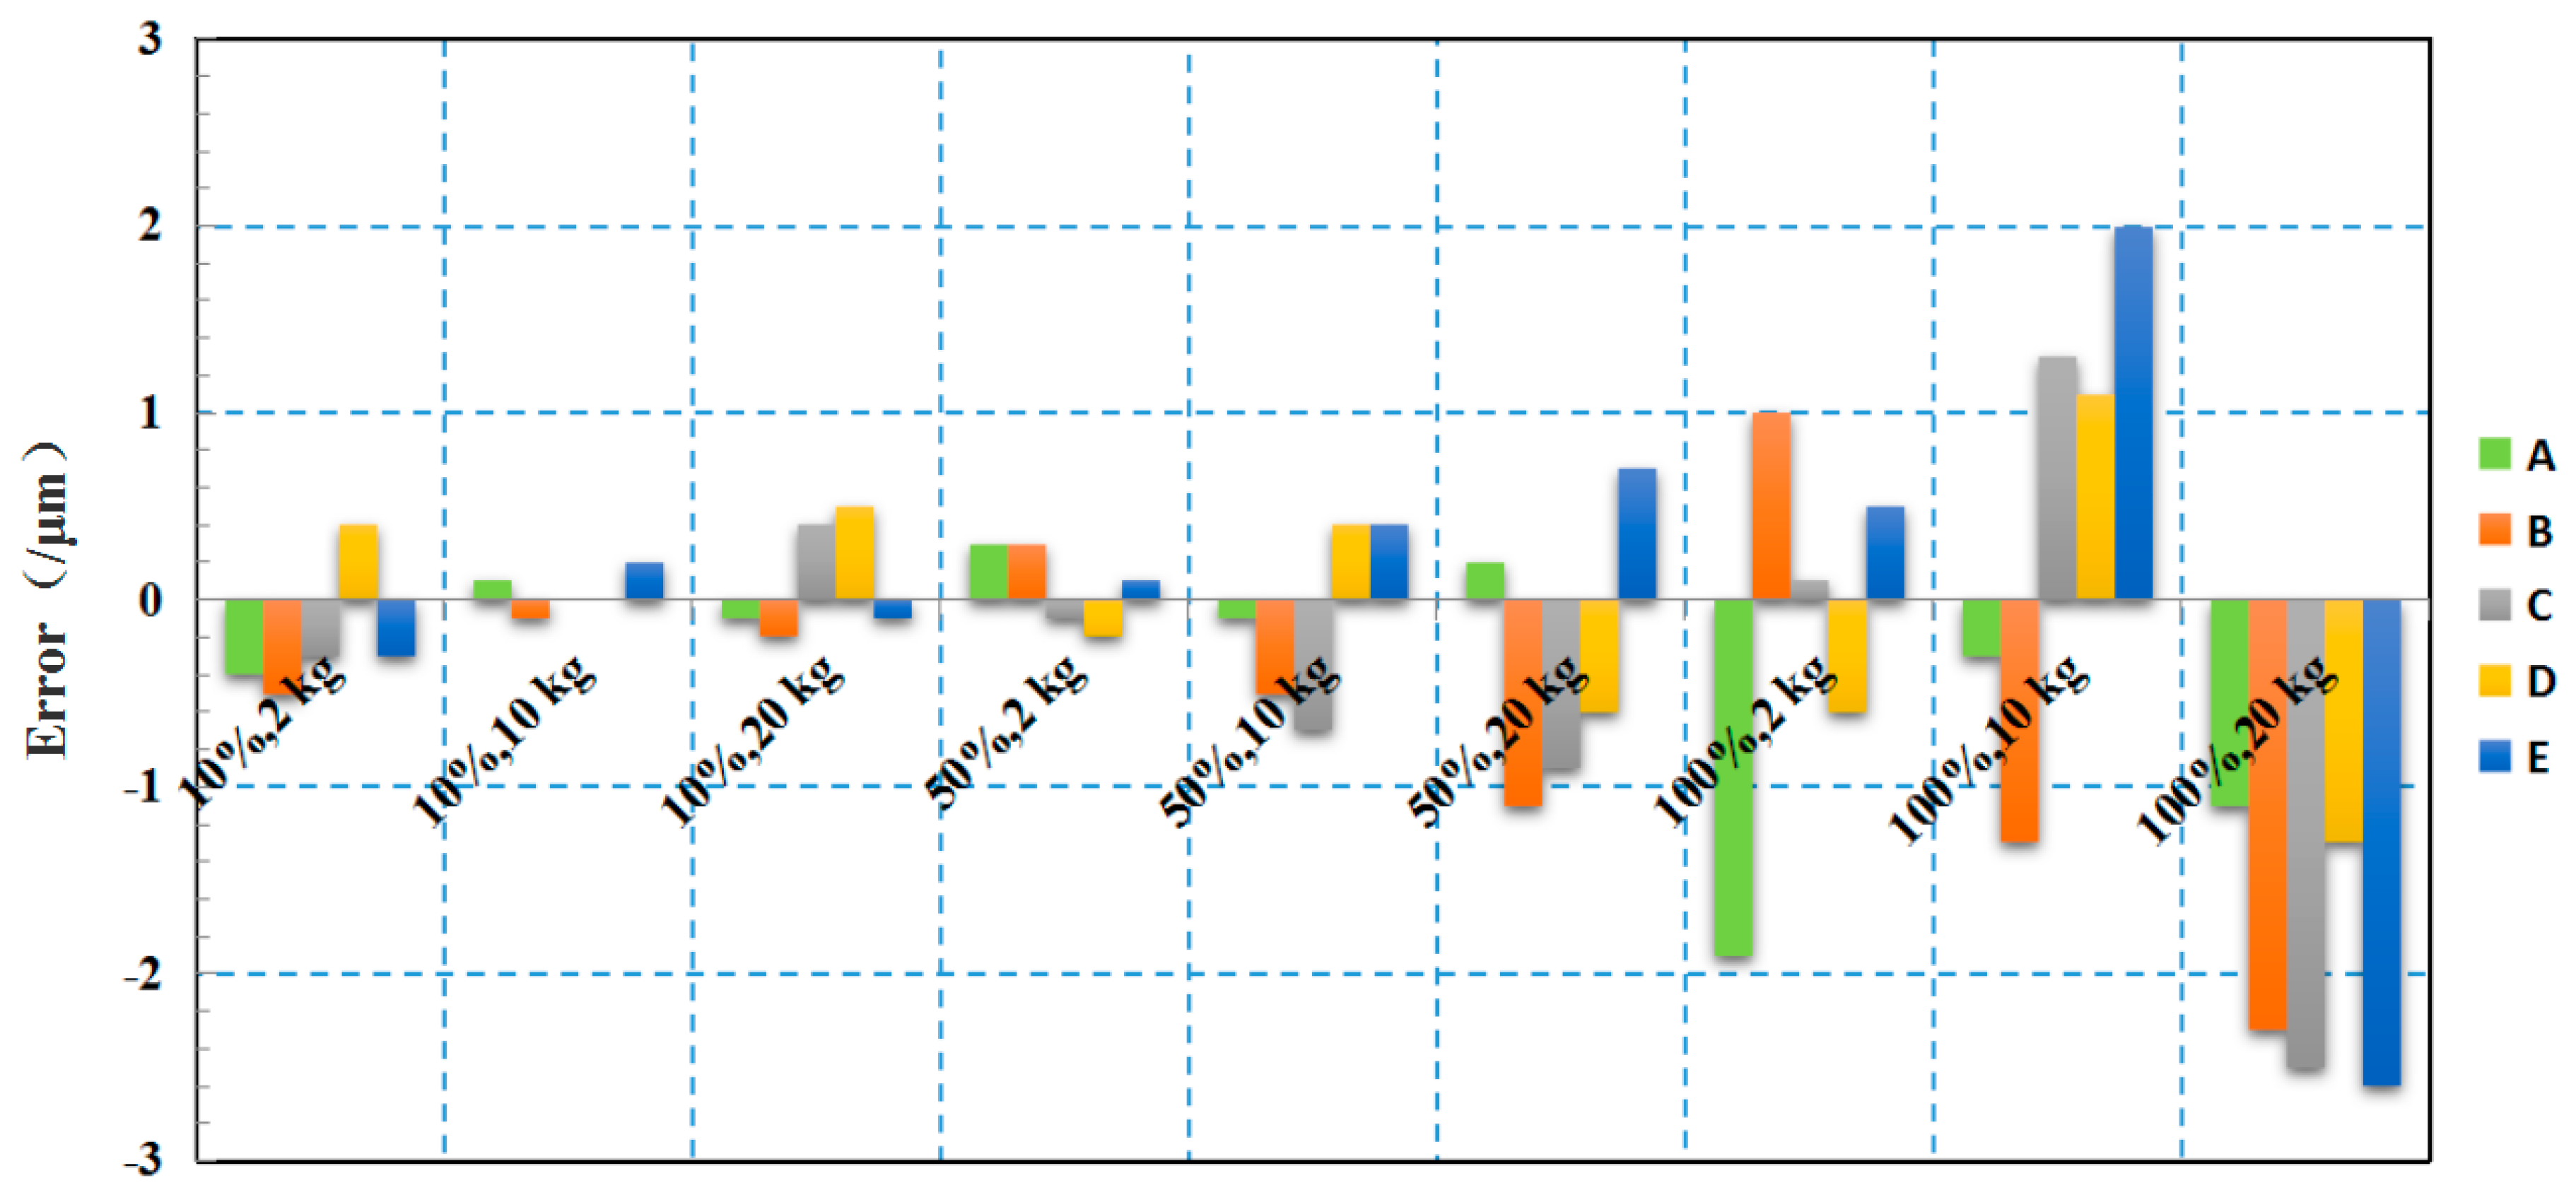
According to the repeatability test using different moving speeds and masses of the loads, it can be observed that the difference of the repeatability between the original upper arm and the optimized upper arm was very small. To make the comparison clearer, Figure 29 showed the corresponding error of repeatability of each testing point in a different condition.
According to Figure 29, the maximum error of the comparisons was below 3 μm, and the majority of the errors was below 1.5 μm. For 45 comparisons in Table 9, 25 comparisons of the original upper arm were bigger than that of the optimized upper arm. Additionally, 18 comparisons were smaller than that of the optimized upper arm, and the former magnitudes were evidently bigger than that of later magnitudes. Moreover, the remaining two comparisons of the original and optimized upper arm were the same. It meant that the performance of the upper arm after topological optimization was approximately the same as that of the original upper arm. Though the weight had been reduced, the optimization can improve the repeatability of the robot, and the topological optimization can improve the repeatability of this industrial welding robot. Hence, the topological optimization can achieve the expected goal.

5. Conclusions

In this work, to reduce the weight of the industrial welding robot and energy loss, and, at the same time, improve performance, a light-weight structural topological optimization for the upper arm of the RB20 type industrial welding robot was conducted. Three important studies had been accomplished and some significant achievements were gained.
(1)
This work employed ABAQUS to conduct the static kinetic analysis, and confirmed which part of the upper arm bore the largest stress, and then employed ADAMS to simulate the static stress situation when the upper arm was at different rotating positions within its working range. According to relative numerical calculations, comparisons, and analyses, the 90° of the rotating position was confirmed as the most unfavorable working condition. At this position, the stress and elastic displacement can achieve maximum values. Then transient static kinetic analysis was conducted when the upper arm worked in the most unfavorable working condition and the dynamic load was transmitted into static load. Under this circumstance, the maximum elastic displacement of the gyration center was 0.277 mm and the Mises stress was 98.47 MPa. Using the same methods, the corresponding analyses for the optimized upper arm were also conducted, and the corresponding maximum elastic displacement was 0.267 mm with 0.01 decreasing when compared to that of the upper arm before optimization. The Mises stress was 84.2 MPa with 14.27 MPa of it decreasing.
(2)
The modal analyses for the upper arm in the most unfavorable working condition before and after optimization were conducted. It was observed that the natural frequency of the upper arm was very high, reaching beyond 100 Hz. In general cases, resonances cannot occur by the external urges under this condition. The natural frequencies of the optimized upper arm in different orders increased, especially after the third order. The increase was very clear.
(3)
The structural topological optimization for the upper arm had been conducted using the plug-in unit Tosca in the ABAQUS. Through the topological calculation and corresponding optimization, an optimized model can be obtained, and then an actual product processed based on the optimized model was obtained. The results of corresponding static kinetic analyses showed that the weight can be reduced 17.9% and lower order nature frequencies were increased. At the same time, the working performance remained.
(4)
A self-designed experimental platform and corresponding experimental method were employed to validate the effectiveness of the topological optimization of the structure. The repeatability tests using three different loads and three different moving speeds for the upper arm were conducted. The results showed that the repeatability of the optimized upper arm of the industrial robot was approximately the same as that of the original robot.
This work can provide a method and actual experience for light-weight topological optimization of a typical industrial welding robot. However, this design was for one specific industrial robot and some structural restrictions must be subjected. Further light-weight industrial robot design should be more general. For the different requirements of light-weight design, general model designing and mathematical solutions should be achieved so as to further improve the effective light–weight design for various industrial welding robots.

Author Contributions

There are four authors contributed to this work. The corresponding contributions were as follows: conceptualization, P.Y. and K.Z.; methodology, P.Y. and Y.T.; software, Y.L.; validation, P.Y., K.Z. and Y.L.; formal analysis, P.Y.; resources, P.Y. and Y.T.; data curation, Y.L.; writing—original draft preparation, K.Z.; writing—review and editing, K.Z.; supervision, P.Y. and K.Z.; project administration, P.Y. and Y.T.; funding acquisition, P.Y., K.Z. and Y.T.

Funding

This research was funded by National Natural Science Foundation of China (51805099, 51605103), Science and Technology Planning Project of Guangdong Province, China (2017B090914005), Science and Technology Program of Guangzhou, China (201805010001), and the Beijing Institute of Technology Research Fund Program for Young Scholars.

Conflicts of Interest

The authors declare no conflict of interest.

References

  1. Merckaert, K.; Beir, A.D.; Adriaens, N.; Makrini, I.E.; Ham, R.V.; Vanderborght, B. Independent Load Carrying and Measurement Manipulator Robot Arm for Improved Payload to Mass Ratio. Robot. Comput. Integr. Manuf. 2018, 53, 135–140. [Google Scholar] [CrossRef]
  2. Zhou, K.; Yao, P. Overview of Recent Advances of Process Analysis and Quality Control in Resistance Spot Welding. Mech. Syst. Signal. Process. 2019, 124, 170–198. [Google Scholar] [CrossRef]
  3. Tokumoto, S.; Hirar, S. Deformation Control of Rheological Food Dough using a Forming Process Model. In IEEE International Conference. Robots Autonomous; IEEE: Washington, DC, USA, 2002; pp. 1457–1464. [Google Scholar]
  4. Mallapragada, V.; Sarkar, N.; Podder, T. Toward a Robot-Assisted Breast Intervention System. IEEE/ASME Trans. Mechatron. 2016, 16, 1011–1020. [Google Scholar] [CrossRef]
  5. Alvarez, N.; Yamazaki, K. An Interactive Simulator for Deformable Linear Objects Manipulation Planning. In IEEE International Conference on Simulation, Modeling, and Programming for Autonomous Robots (SIMPAR); IEEE: San Francisco, CA, USA, 2016. [Google Scholar]
  6. Park, E.; Mills, J. Static Shape and Vibration Control of Flexible Payloads with Applications to Robotic Sssembly. IEEE/ASME Trans. Mechatron. 2005, 10, 675–687. [Google Scholar] [CrossRef]
  7. Zhu, S.; Liu, J.; Yin, F.-L.; Meng, F.-J.; Chang, T.-Q. An Innovative Forming Method based on an Arc Welding Robot. Int. J. Adv. Manuf. Technol. 2016, 84, 1531–1538. [Google Scholar] [CrossRef]
  8. Ku, N.; Ha, S.; Roh, M.-I. Design of Controller for Mobile Robot in Welding Process of Shipbuilding Engineering. J. Comput. Des. Eng. 2014, 1, 243–255. [Google Scholar] [CrossRef]
  9. Wang, Z.-Y.; Liu, F.-Q.; Wang, X.-J. An Ear Plate Reinforced Ring Welding Robot System with Intelligent Recognition Function. In Proceedings of the 2016 IEEE Workshop on Advanced Robotics and its Social Impacts (ARSO), Shanghai, China, 8–10 July 2016. [Google Scholar]
  10. Shah, H.N.M.; Sulaiman, M.; Shukor, A.Z.; Kamis, Z. An Experiment of Detection and Localization in Tooth Saw Shape for Butt Joint using KUKA Welding Robot. Int. J. Adv. Manuf. Technol. 2018, 97, 3153–3162. [Google Scholar] [CrossRef]
  11. Kermorgant, O. A Magnetic Climbing Robot to Perform Autonomous Welding in the Shipbuilding Industry. Robot. Comput. Integr. Manuf. 2018, 53, 178–186. [Google Scholar] [CrossRef]
  12. Tao, Z.; Zhang, T.; Qi, M.; Ji, J. Research and Implementation of a new 6-DOF Light-weight Robot. In Proceedings of the IOP Conference Series, Earth and Environmental Science, Chengdu, China, 26–28 May 2017. [Google Scholar]
  13. AMRC Sheffield 2019, “Composite Center”. Available online: https://www.amrc.co.uk/facilities/composite-centre (accessed on 3 September 2019).
  14. 2018 Exechon Enterprises, L.L.C, “XMINI Integration”. Available online: http://www.exechon.com/integration (accessed on 3 September 2019).
  15. Shi, L.; Tian, X.; Zhang, C. Automatic Programming for Industrial Robot to Weld Intersecting Pipes. Int. J. Adv. Manuf. Technol. 2015, 81, 2099–2107. [Google Scholar] [CrossRef]
  16. Kawakami, K.; Ohkura, K.; Ueda, K. Reinforcement Learning Approach to Cooperation Problem in a Homogeneous Robot Group. In Proceedings of the ISIE 2001 2001 IEEE International Symposium on Industrial Electronics Proceedings (Cat. No.01TH8570), Pusan, Korea, 12–16 June 2001. [Google Scholar]
  17. Hemami, A. Studies on a Light Weight and Flexible Robot Manipulator. Robotics 1985, 1, 27–36. [Google Scholar] [CrossRef]
  18. Tørdal, S.S.; Hovland, G.; Tyapin, I. Efficient Implementation of Inverse Kinematics on a 6-DOF Industrial Robot using Conformal Geometric Algebra. Adv. Appl. Clifford Algebras 2017, 27, 2067–2082. [Google Scholar] [CrossRef]
  19. Park, C.; Jang, J.; Zhang, L.; Jung, J. Light-weight Visual Place Recognition Using Convolutional Neural Network for Mobile Robots. In Proceedings of the 2018 IEEE International Conference on Consumer Electronic, Las Vegas, NV, USA, 12–15 January 2018. [Google Scholar]
  20. Hegde, G.S.; Vinod, M.S.; Shankar, A. Optimum Dynamic Design of Flexible Robotic Manipulator. Int. J. Mech. Mater. Des. 2009, 5, 315–325. [Google Scholar] [CrossRef]
  21. Frecker, M.I.; Ananthasuresh, G.K.; NJshiwaki, S.; Kikuchi, N.; Kota, S. Topological Synthesis of Compliant Mechanisms using Multi-Criteria Optimization. Trans. ASME J. Mech. Des. 1997, 119, 238–245. [Google Scholar] [CrossRef]
  22. Kaveh, A.; Talatahari, S. A Hybrid Particle Swarm and Ant Colony Optimization for Design of Truss Structures. Asian J. Civ. Eng. 2008, 9, 329–348. [Google Scholar]
  23. Song, H.; Xue, H.; Yu, Z. Statics and Dynamics Analysis and Topology Optimization for A Six-DOF Welding Robot SR3-600. Mach. Des. Res. 2016, 32, 50–53. [Google Scholar]
  24. Xu, X. Strutural Analysis of Arc-welding Robot based on Finite Element Method. Master’s Thesis, Jiangnan University, Wuxi, China, 2012. [Google Scholar]
  25. Guan, Y.-S.; Deng, X.; Li, H.-Z.; Yin, Z.-N.; Wu, W.-Q.; Jiang, L. Structural Analysis and Optimization of Industrial Robot. J. South China Univ. Technol. (Nat. Sci. Ed.) 2013, 41, 126–131. [Google Scholar]
  26. Chen, G.; Wang, L.; Jia, Q.; Wang, S. Calibration Method and Simulation of Kinematic Parameters for Light-Weight Robot Based on Flexible Error Analysis. In Proceedings of the 2017 2nd International Conference on Cybernetics, Robotics and Control, Chengdu, China, 21–23 July 2017. [Google Scholar]
  27. Albu-Schäffer, A.; Haddadin, S.; Ott, C..; Stemmer, A.; Wimböck, T.; Hirzinger, G. The DLR lightweight robot: design and control concepts for robots in human environments. Ind. Robot Int. J. 2007, 34, 376–385. [Google Scholar] [Green Version]
  28. Meenakshi, S.; Srinivas, N.; Siddarth, Y.S.; Kamal, C.V.S.; Sudheendra, K.; Bhowmik, S.; Pitchan, M.K.; Epaarachchi, J.A. Numerical Analysis of State of the Art High Performance Thermoplastic Composite as Light Weight Bullet Proof Material. Mater. Res. Express 2019, 6, 095333. [Google Scholar]
  29. Santolaria, J.; Aguilar, J.J.; Samper, D.; Brosed, F.J.; Majarena, A.C. Software Simulation Platform for Learning Techniques for Identifying Kinematic Parameters of Industrial Robots. In Proceedings of the 2011 Promotion and Innovation with New Technologies in Engineering Education (FINTDI 2011), Teruel, Spain, 5–6 May 2011. [Google Scholar]
  30. de Diego-Calderón, I.; Issaoui, A.; Hell, J.-C.; Zuazo, I. Phase Stability Investigation of Light-weight Alloys based on the FeMnAlC System. Metall. Res. Technol. 2019, 116, 424. [Google Scholar] [CrossRef]
  31. Yu, H.; Yoshimine, M.; Qiang, H.; Zan, Y.; Xiao, Y.; Li, L.; Sheng, Z. Advances and Prospects for Strength Theory. Eng. Mech. 2004, 21, 1–20. (In Chinese) [Google Scholar]
  32. Mises, R.V. Mechanik der festen Körper im plastisch-deformablen Zustand. Nachrichten von der Gesellschaft der Wissenschaften zu Gottingen (Mathematisch-physikalische Klasse 1913, 1, 582–592. [Google Scholar]
  33. Rietz, A. Sufficiency of a Finite Exponent in SIMP (power law) Methods. Struct. Multidiscip. Optim. 2001, 21, 159–163. [Google Scholar] [CrossRef]
  34. Liu, A.; Tang, X.; Lu, F. Study on Welding Process and Prosperities of AA5754 Al-alloy Welded by Double Pulsed Gas Metal Arc Welding. Mater. Des. 2013, 50, 149–155. [Google Scholar] [CrossRef]
Figure 1. Overall contour map of the RB20 industrial robot.
Metals 09 01020 g001
Figure 2. Original model of the upper arm.
Metals 09 01020 g002
Figure 3. Overall mesh of the model.
Metals 09 01020 g003
Figure 4. Detailed subdivision of the mesh.
Metals 09 01020 g004
Figure 5. Schematic figure of the constraints and loads imposed on the upper arm.
Metals 09 01020 g005
Figure 6. The most unfavorable working condition of the upper arm.
Metals 09 01020 g006
Figure 7. The Mises stress cloud map under static load in ABAQUS.
Metals 09 01020 g007
Figure 8. Simulation of the upper arm at different positions, (a) 0° of the rotating position, (b) 45° of the rotating position, (c) 90° of the rotating position, (d) 130° of the rotating position.
Metals 09 01020 g008
Figure 9. Mises stress cloud map in the most unfavorable working condition (dynamic loads) in ADAMS.
Metals 09 01020 g009
Figure 10. Mises stress cloud map in the most unfavorable working condition (dynamic loads) in ABAQUS.
Metals 09 01020 g010
Figure 11. Maximum tensile stress distribution in the most unfavorable working condition.
Metals 09 01020 g011
Figure 12. The maximum elastic displacement in the most unfavorable working condition.
Metals 09 01020 g012
Figure 13. The vibration modes of the upper arm, (a) first order, (b) second order, (c) third order, and (d) fourth order.
Metals 09 01020 g013aMetals 09 01020 g013b
Figure 14. Flowchart of the topological optimization.
Metals 09 01020 g014
Figure 15. Design area and non-design area.
Metals 09 01020 g015
Figure 16. Material filling.
Metals 09 01020 g016
Figure 17. Failure topological structure.
Metals 09 01020 g017
Figure 18. Usable topological structure.
Metals 09 01020 g018
Figure 19. One part of the topological structure.
Metals 09 01020 g019
Figure 20. Modified topological structure.
Metals 09 01020 g020
Figure 21. Comparison of the upper arm between before and after optimizations: (a) before optimization and (b) after optimization.
Metals 09 01020 g021
Figure 22. The position of the optimized upper arm in the most unfavorable working condition.
Metals 09 01020 g022
Figure 23. Mises stress distribution in the most unfavorable working condition.
Metals 09 01020 g023
Figure 24. Maximum tensile stress distribution in the most unfavorable working condition.
Metals 09 01020 g024
Figure 25. The maximum displacement of the gyration center in the most unfavorable working condition.
Metals 09 01020 g025
Figure 26. The first four order vibration modes of the optimized upper arm, (a) First order, (b) second order, (c) third order, (d) fourth order.
Metals 09 01020 g026aMetals 09 01020 g026b
Figure 27. The actual upper arm products before and after optimization.
Metals 09 01020 g027
Figure 28. A self-designed experimental platform and testing point.
Metals 09 01020 g028
Figure 29. The errors of repeatability of the testing points between the original and the optimized upper arm.
Metals 09 01020 g029
Table 1. Material characteristics of spheroidal graphite cast iron QT500-7.
MaterialQT500–7
Density (Kg/m3)7300
Young’s (elastic) Modulus (Pa)1.9 × 10¹¹
Poisson Ratio0.28
Tensile Strength (MPa)500
Yield Strength (MPa)365
Table 2. Maximum stress at different rotating positions of the upper arm.
Positions (°)Mises Stress (MPa)
06.56
4515.491
9022.137
13019.843
Table 3. Analysis results of static analysis and transient analysis in the most unfavorable working condition.
ItemStaticTransient in the Most Unfavorable Working Condition
Maximum Mises Stress (MPa)37.1598.47
Maximum Tensile Stress (MPa)38.9109.6
Maximum Displacement of the Gyration Center (mm)0.1420.277
Table 4. Natural frequency of the upper arm in the first 12 order modal analysis.
Order1st2nd3rd4th5th6th
Frequency/Hz104.62190.08251.45566.28702.10709.38
Order7th8th9th10th11th12th
Frequency/Hz1309.01385.61410.71452.81536.71647.8
Table 5. The static analysis result of the optimized upper arm in the most unfavorable working condition.
ItemTransient in the Most Unfavorable Working Condition
Max Mises Stress (MPa)84.2
Maximum Tensile Stress (MPa)96.36
Maximum Displacement of the Gyration Center (mm)0.267
Table 6. Nature frequencies of the first 12 orders of nature frequencies of the optimized upper arm.
Order1st2nd3rd4th5th6th
Frequency/Hz107.42216.75363.53587.681143.81274.0
Order7th8th9th10th11th12th
Frequency/Hz1363.61567.72427.72519.22686.42924.8
Table 7. Criteria comparison of the upper arm before and after optimization.
Criterion (Unit)OriginalOptimizedComparison
Mass (Kg)33.527.5Decreased 17.9%
Maximum Mises Stress (MPa)98.4784.2Decreased 14.27 MPa
Maximum Tensile Stress (MPa)109.696.36Decreased 12.64 MPa
Maximum Elastic Displacement of the Gyration Center (mm) 0.2770.266Decreased 0.01 mm
First Order Nature Frequency (Hz)104.62107.42Increased 2.8 Hz, about 2.68%
Second Order Nature Frequency (Hz)190.8216.75Increased 25.95 Hz, about 13.6%
Third Order Nature Frequency (Hz)251.45363.53Increased 112.08 Hz, about 44.57%
Fourth Order Nature Frequency (Hz)566.28587.68Increased 21.4 Hz, about 3.71%
Table 8. The experimental arrangement of the robot with original and optimized upper arms.
SpeedMass of the LoadOriginal Upper Arm (times)Optimized Upper Arm (times)
10%2 kg100100
10 kg100100
20 kg100100
50%2 kg100100
10 kg100100
20 kg100100
100%2 kg100100
10 kg100100
20 kg100100
Total times900900
Table 9. Repeatability test records of the upper arm before and after optimizations (Unit: μm).
Testing PointsABCDE
SpeedMass of the LoadBefore AfterBefore AfterBefore AfterBefore AfterBefore After
10%2 kg7.26.810.29.79.59.27.27.68.88.5
10 kg8.38.410.510.49.79.77.87.89.29.4
20 kg9.29.11110.89.810.28.99.410.210.1
50%2 kg9.49.71212.39.69.57.57.39.29.3
10 kg9.89.713.412.910.59.87.88.29.810.2
20 kg10.210.414.613.514.313.413.512.99.810.5
100%2 kg16.614.719.520.515.615.717.216.616.617.1
10 kg2221.725.624.319.921.218.419.518.720.7
20 kg30.429.33330.732.329.832.631.331.228.6