Analysis of the Fatigue Crack Evolution of Corrugated Web Girders

Abstract
:1. Introduction
2. Theory Background
2.1. Conventional Approaches to Predicting Life for Welded Joints
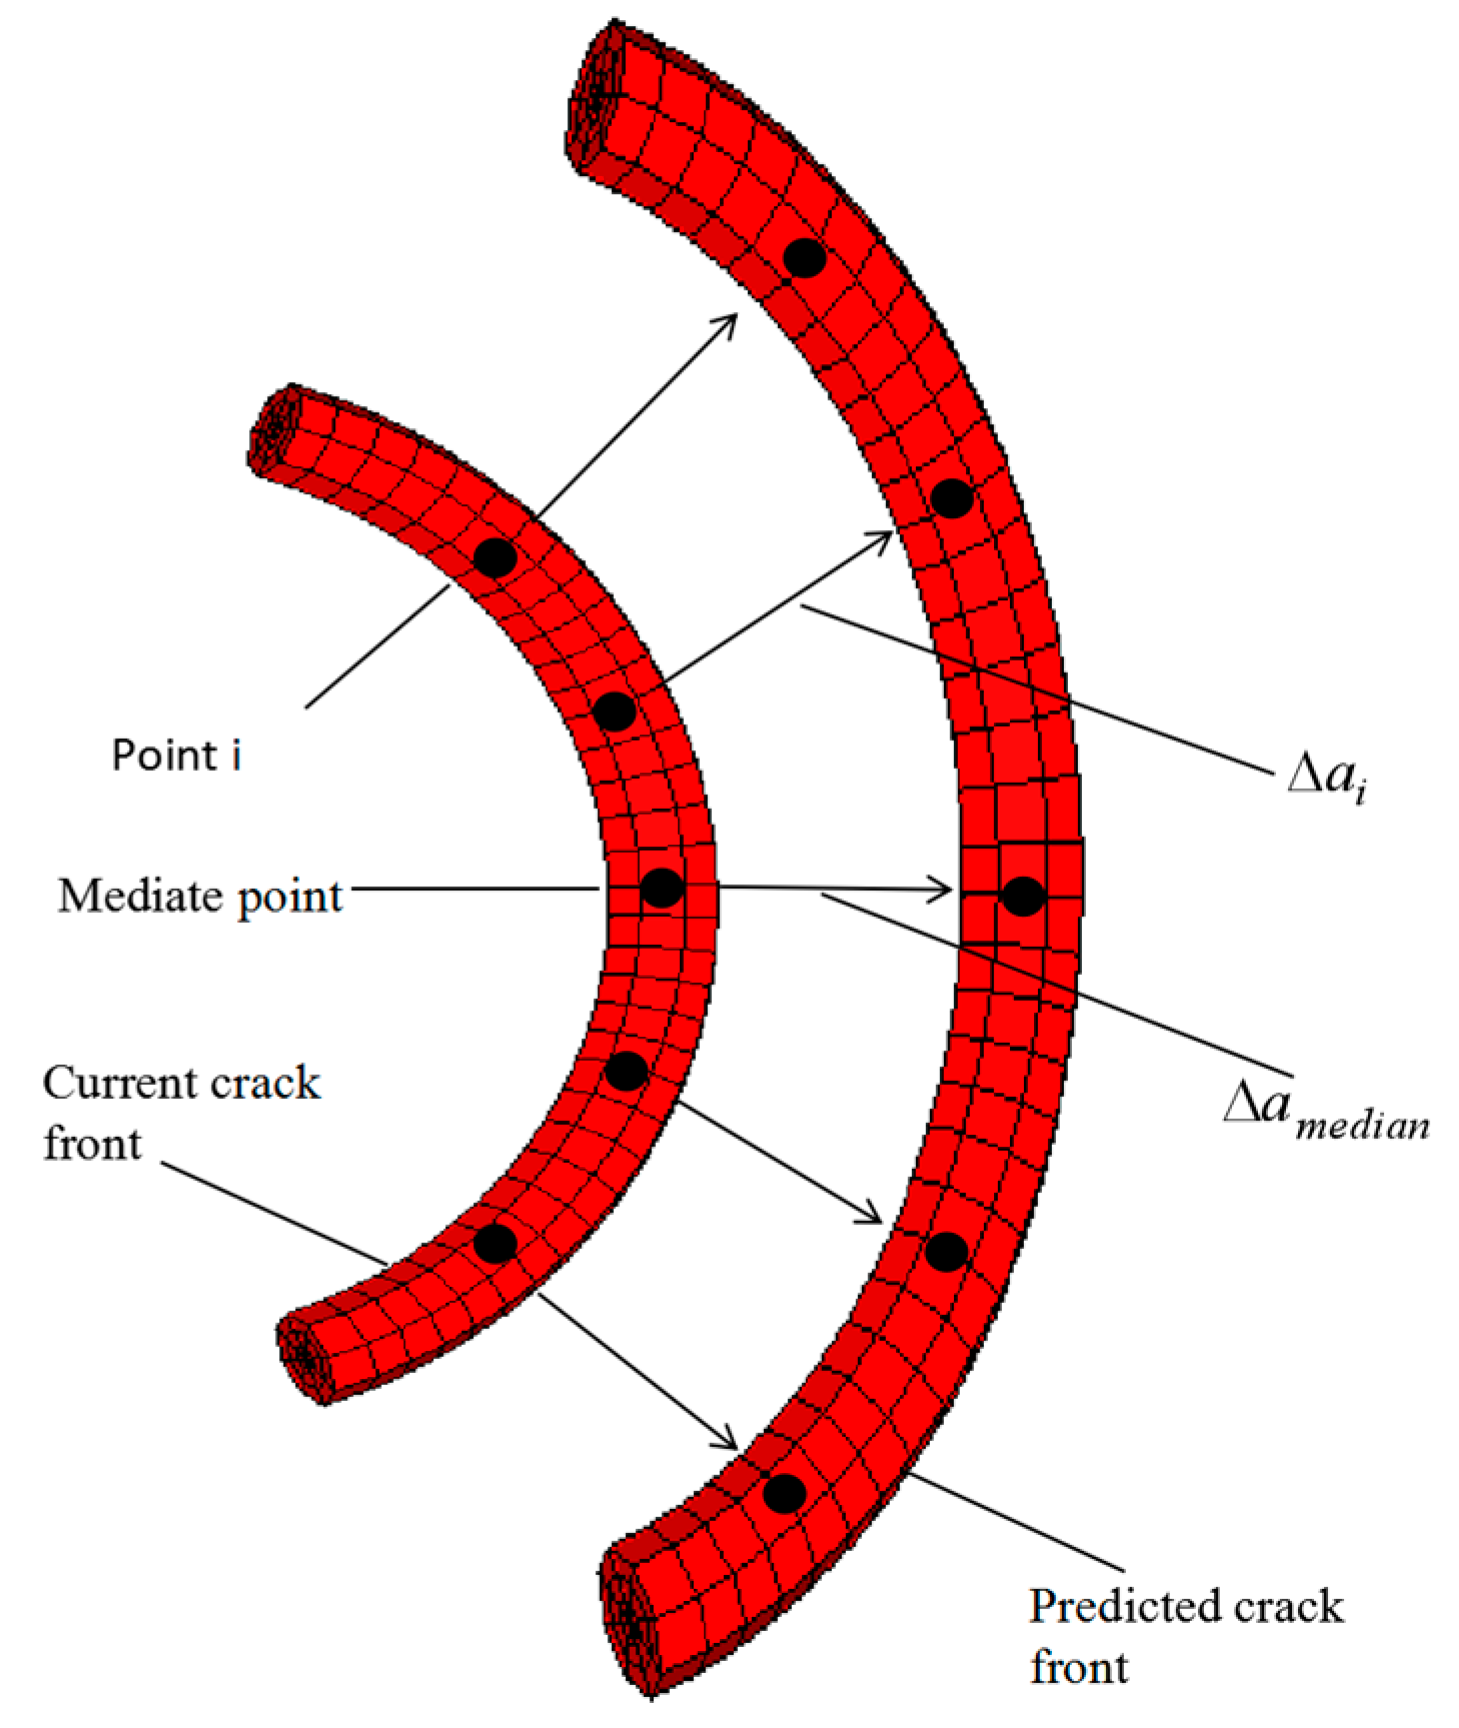
2.2. Approach to Simulating Crack Propagation
2.3. Key Technologies
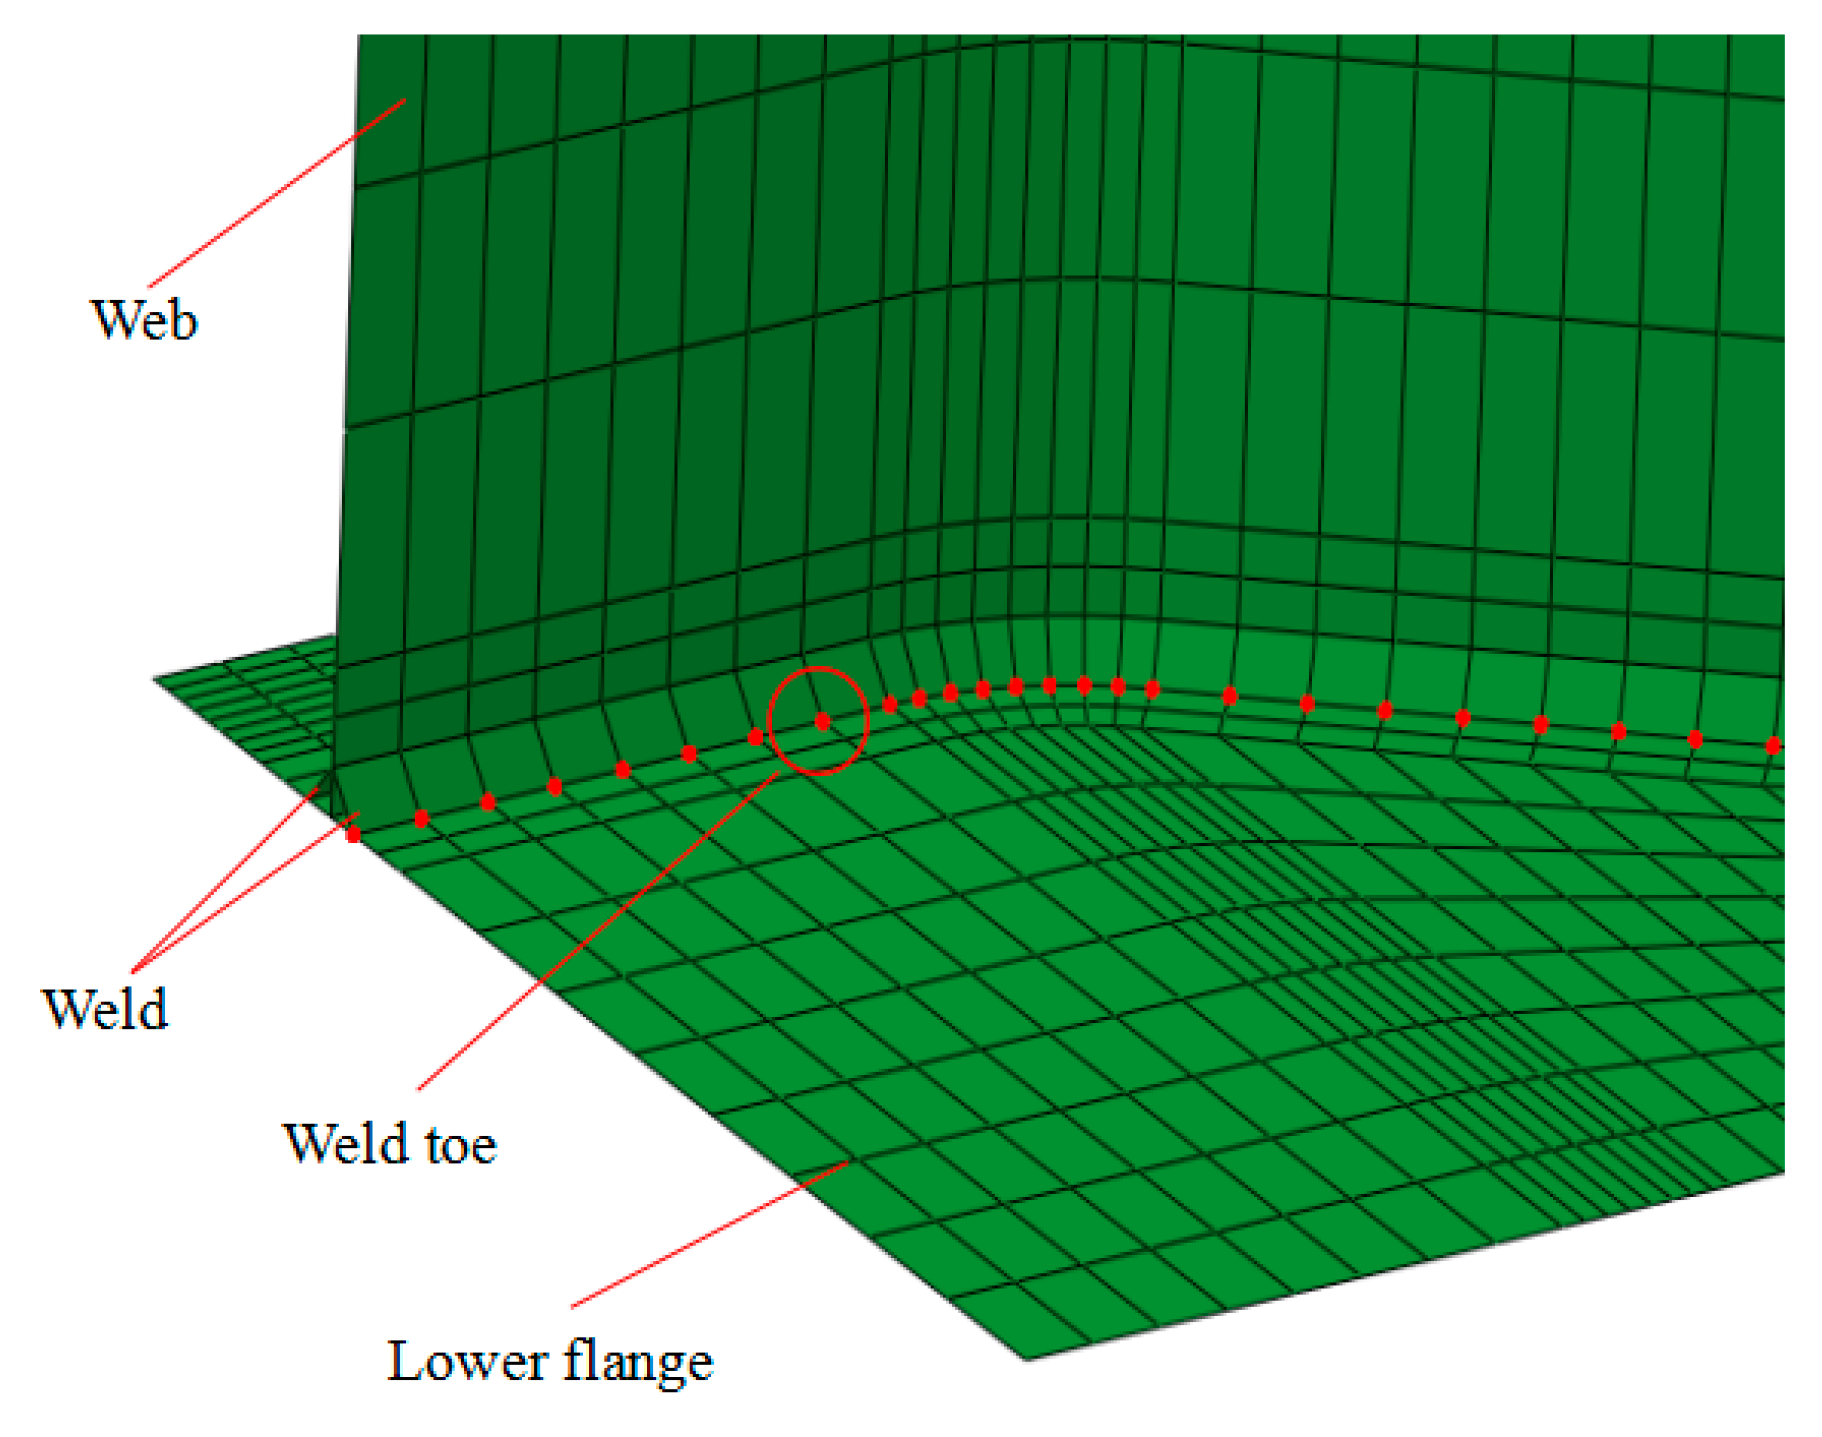
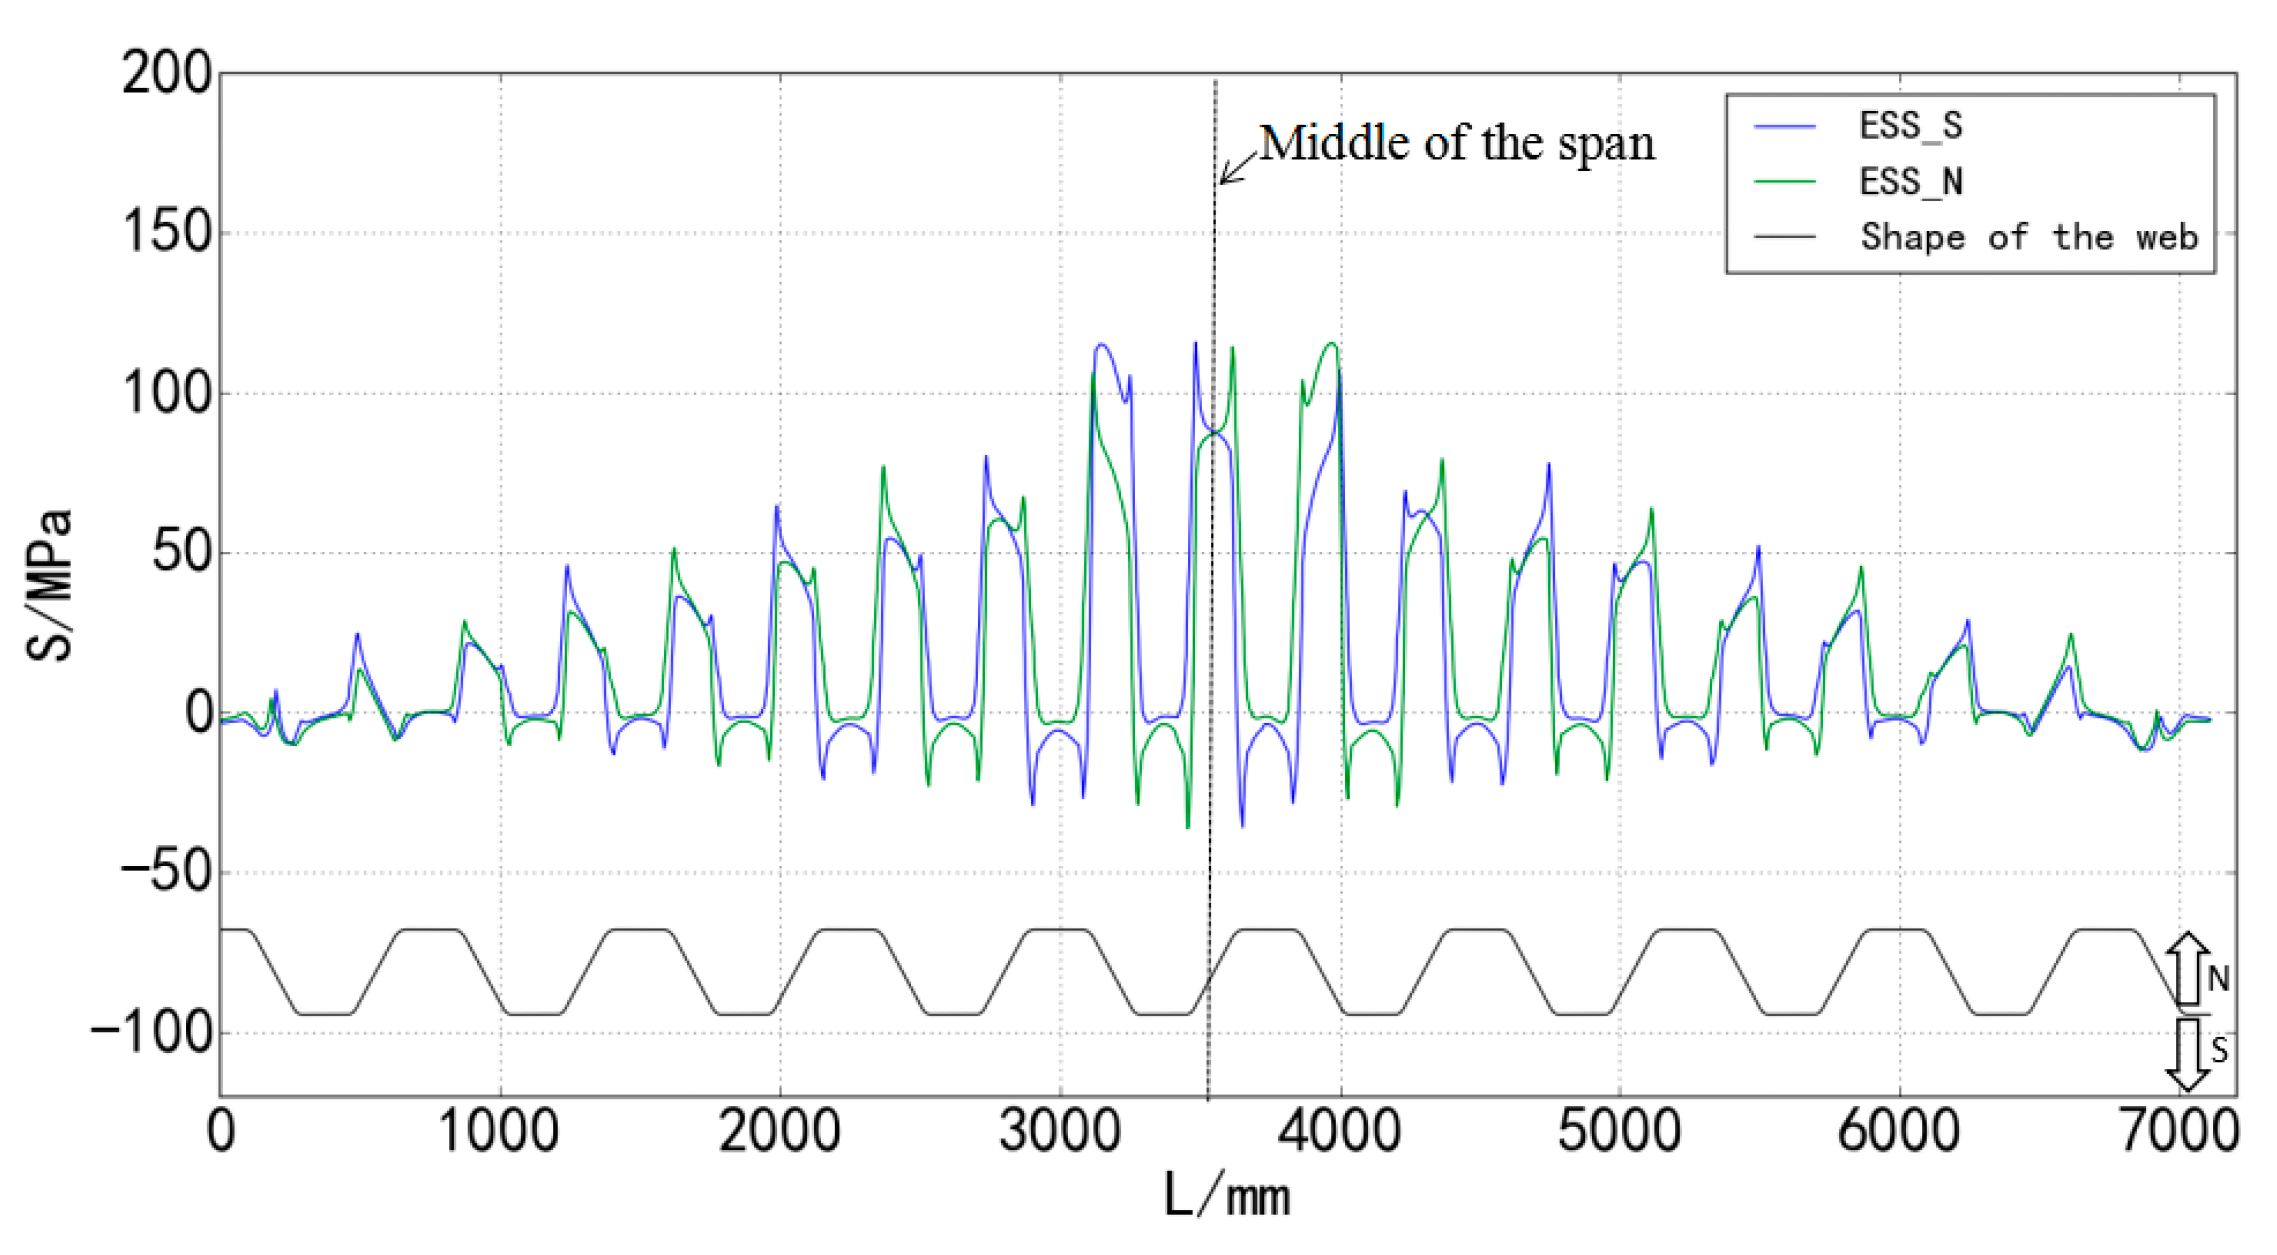
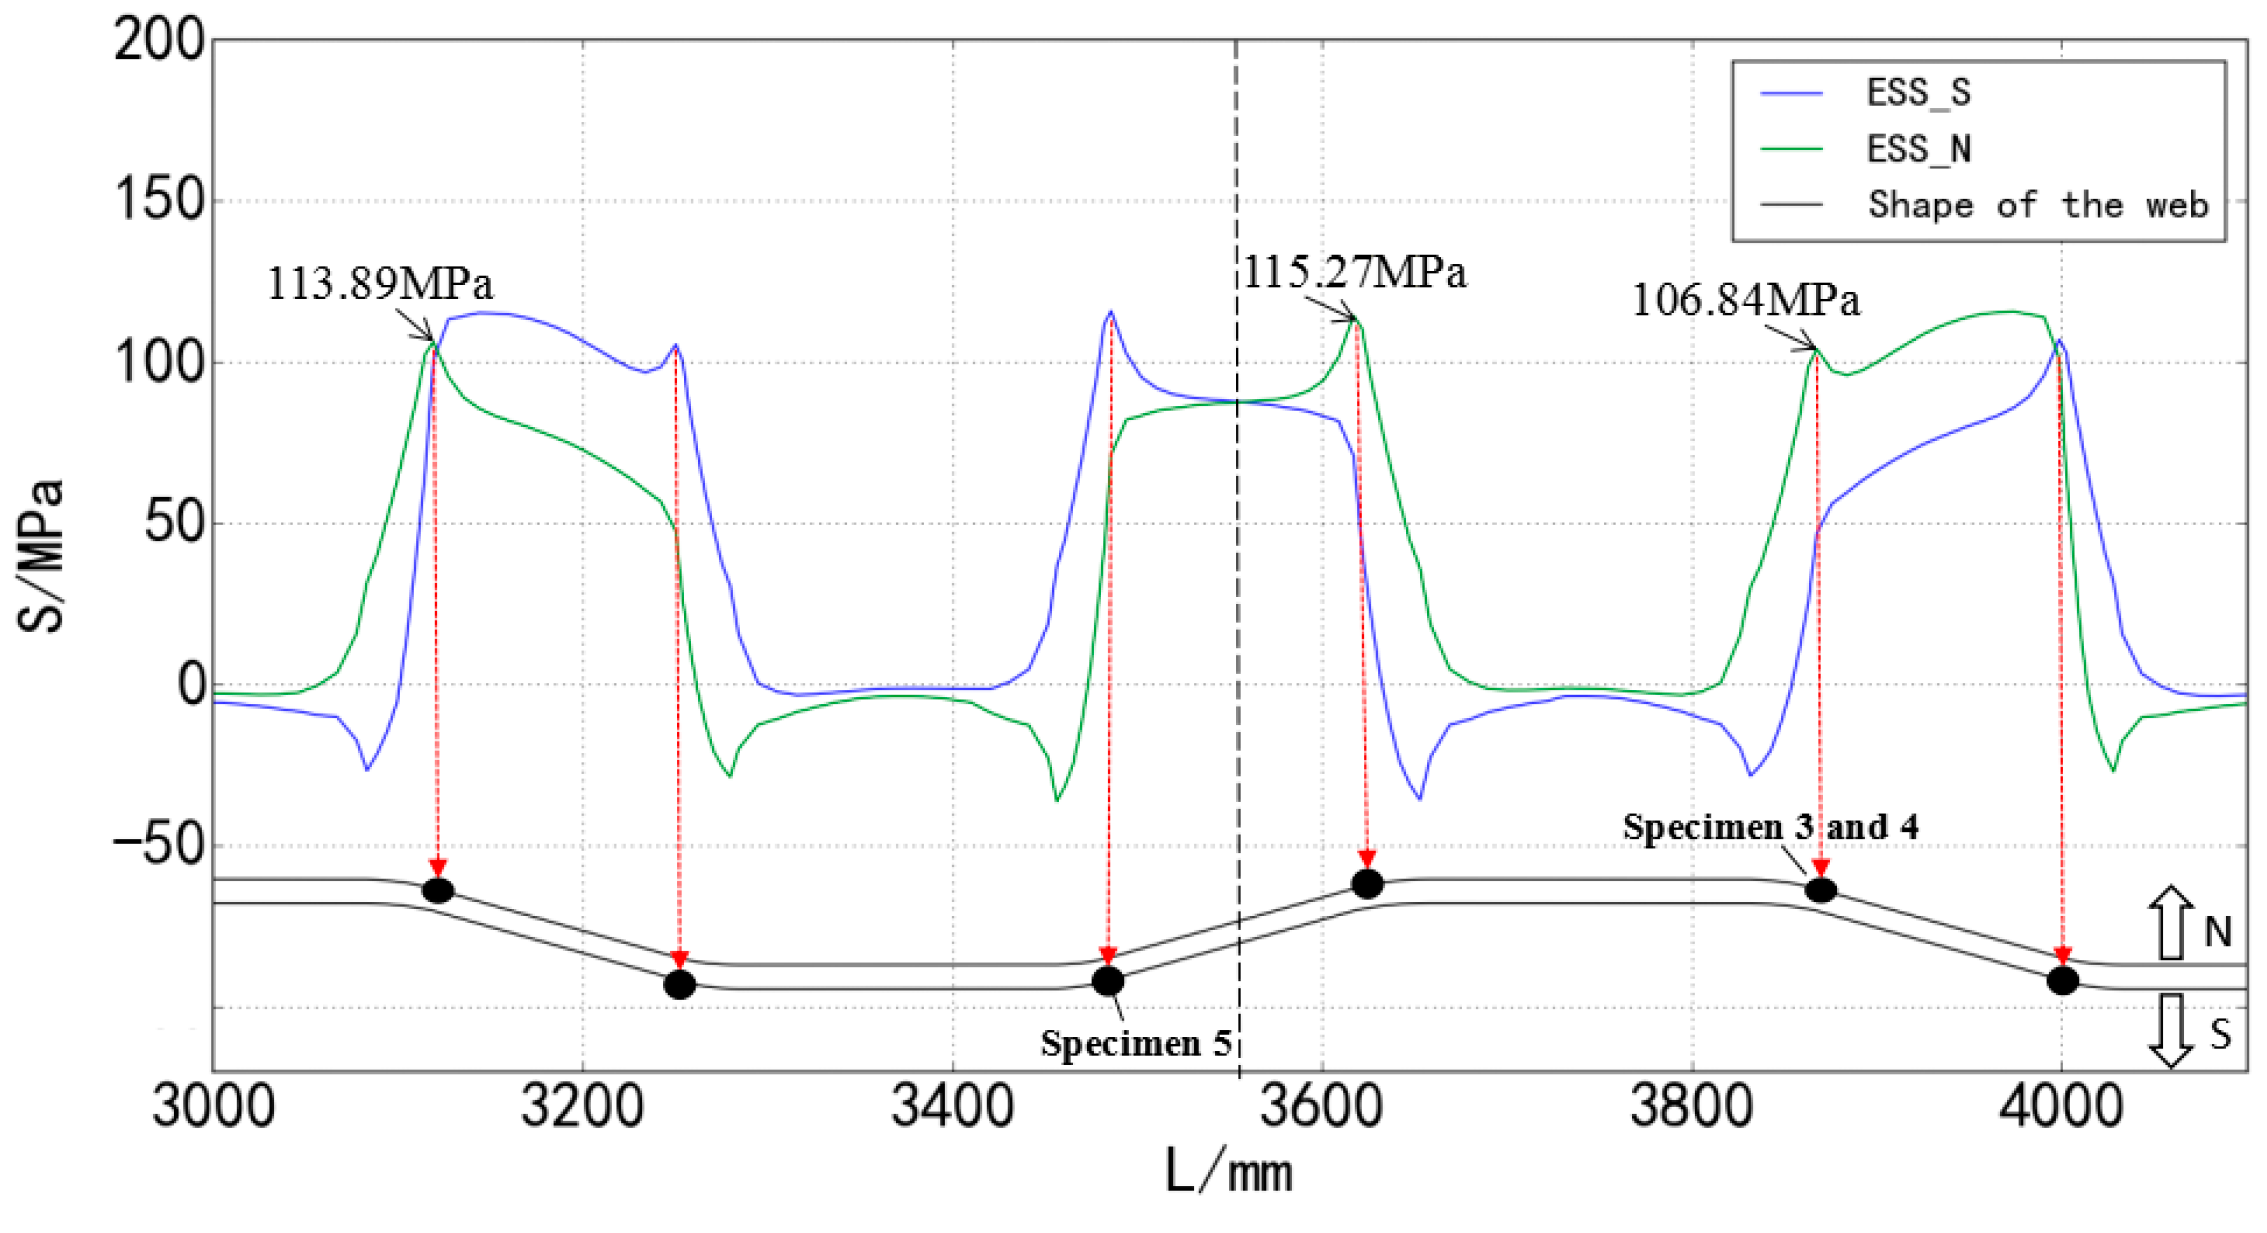
2.3.1. Initial Crack Location
2.3.2. Crack Propagation Driving Force
2.3.3. Crack Kink Criterion
MTS (Max Tensile Stress) criterion
MSS (Max Shear Stress) criterion
GEN (Generalized Stress) criterion
SERR (Strain Energy Release Rate) criterion
3. Case Study
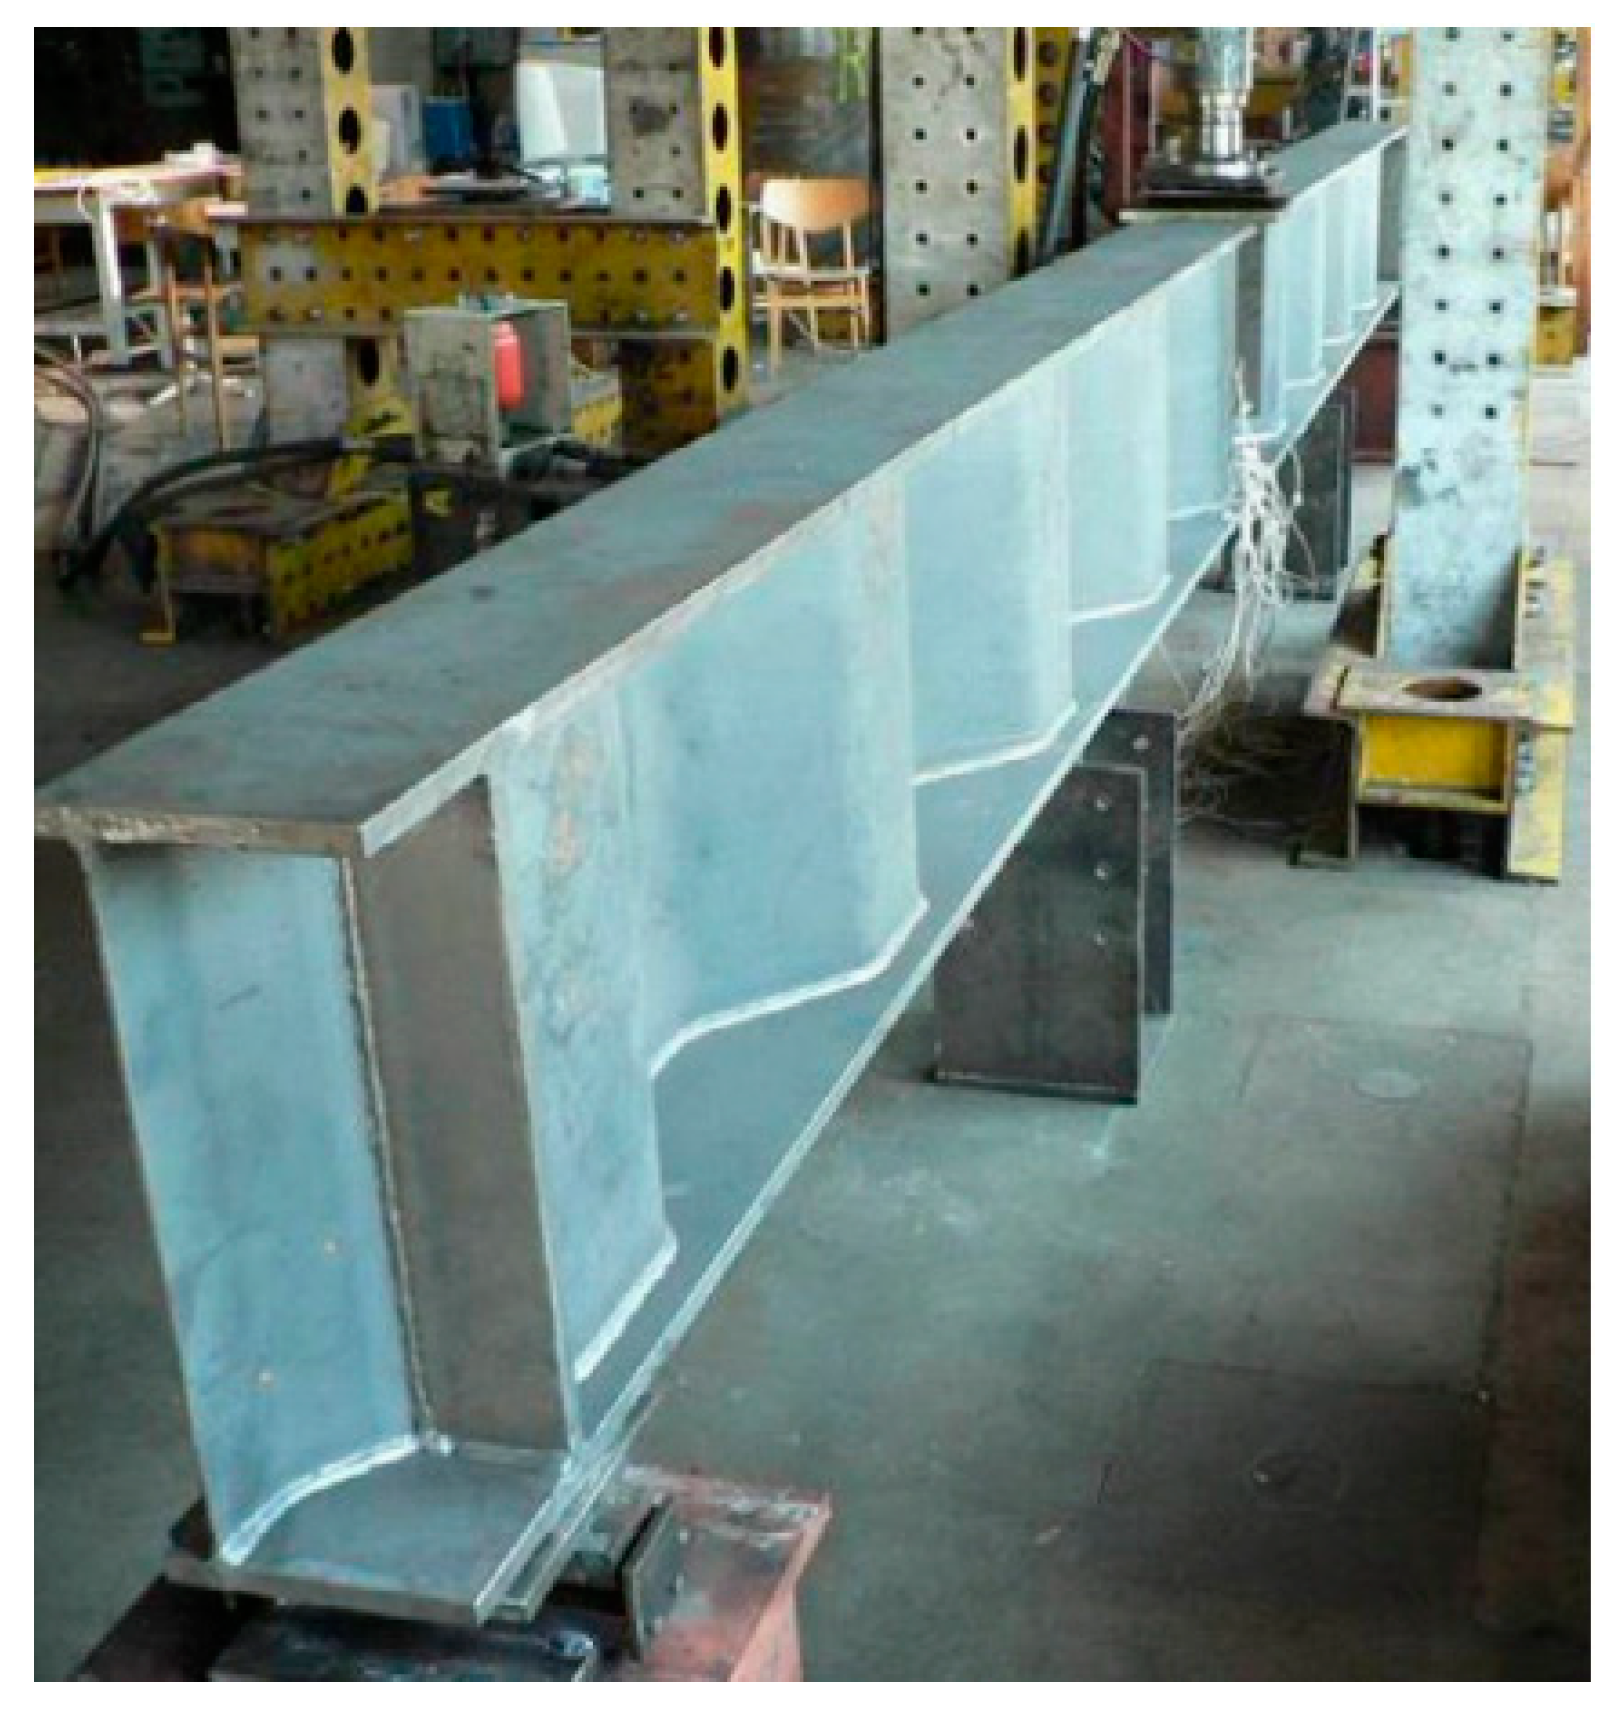
3.1. Case Description
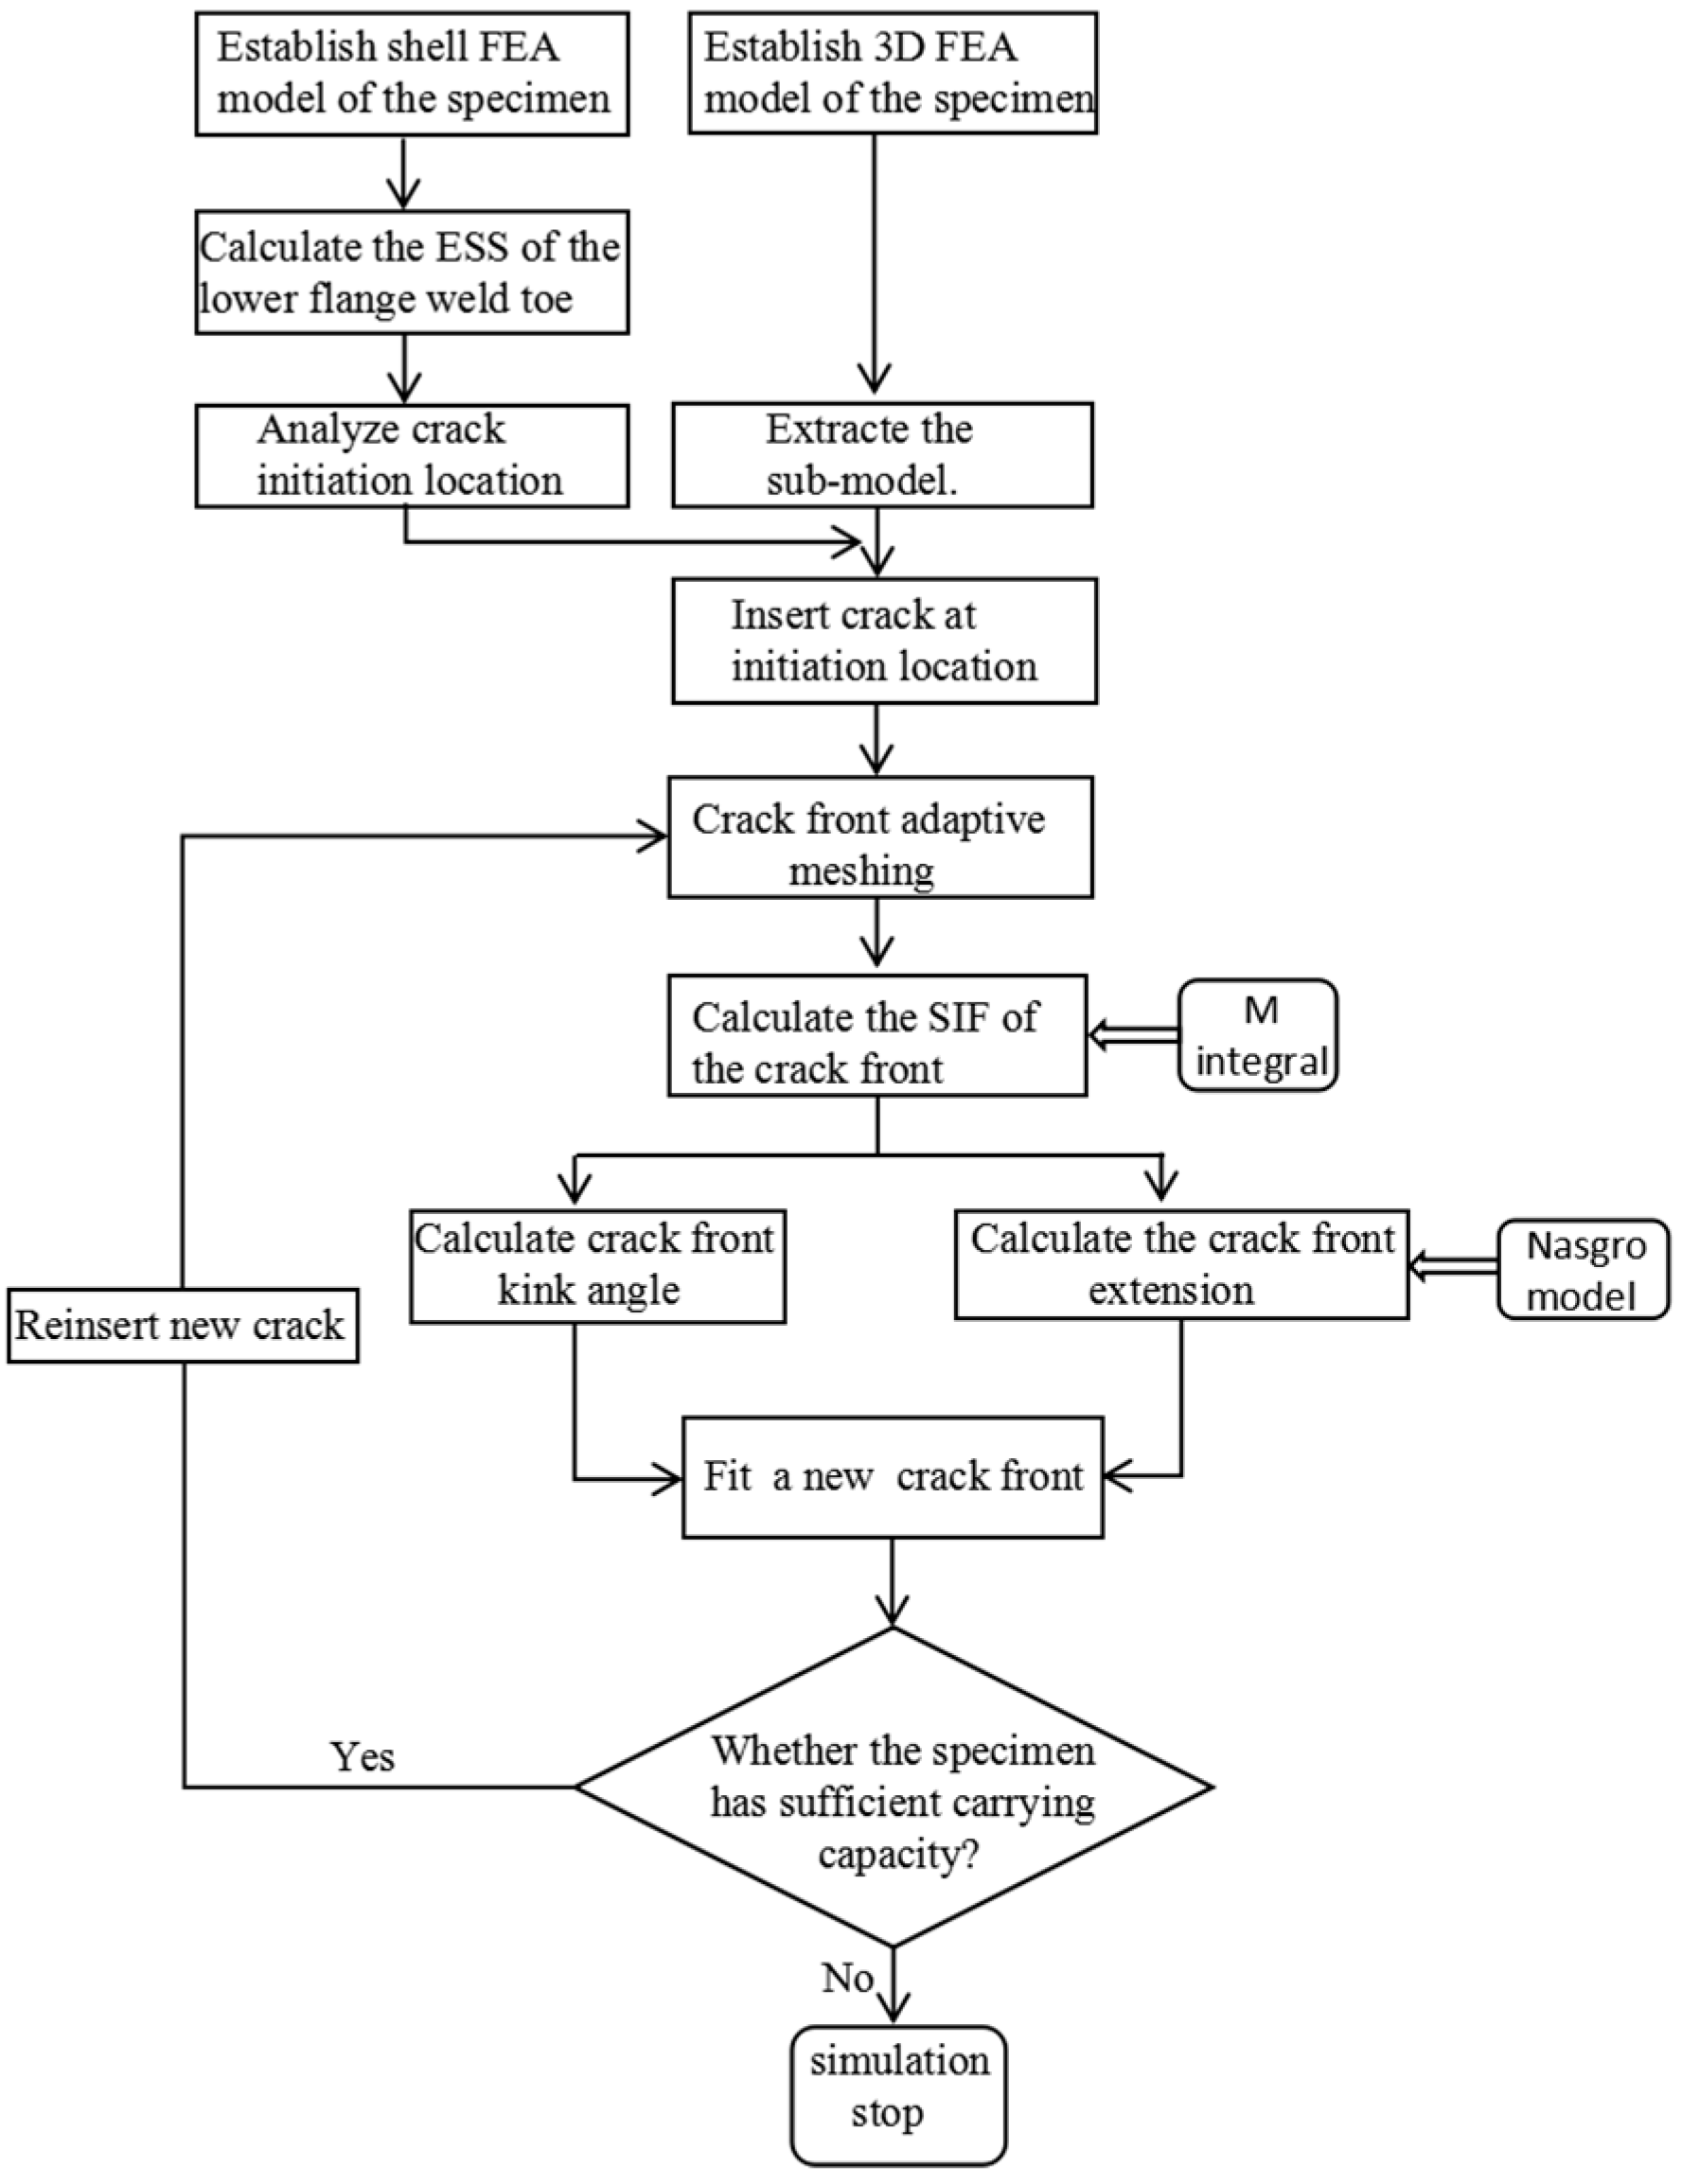
3.2. Proposed Simulation Procedure
3.3. Predicted Crack Initiation Location
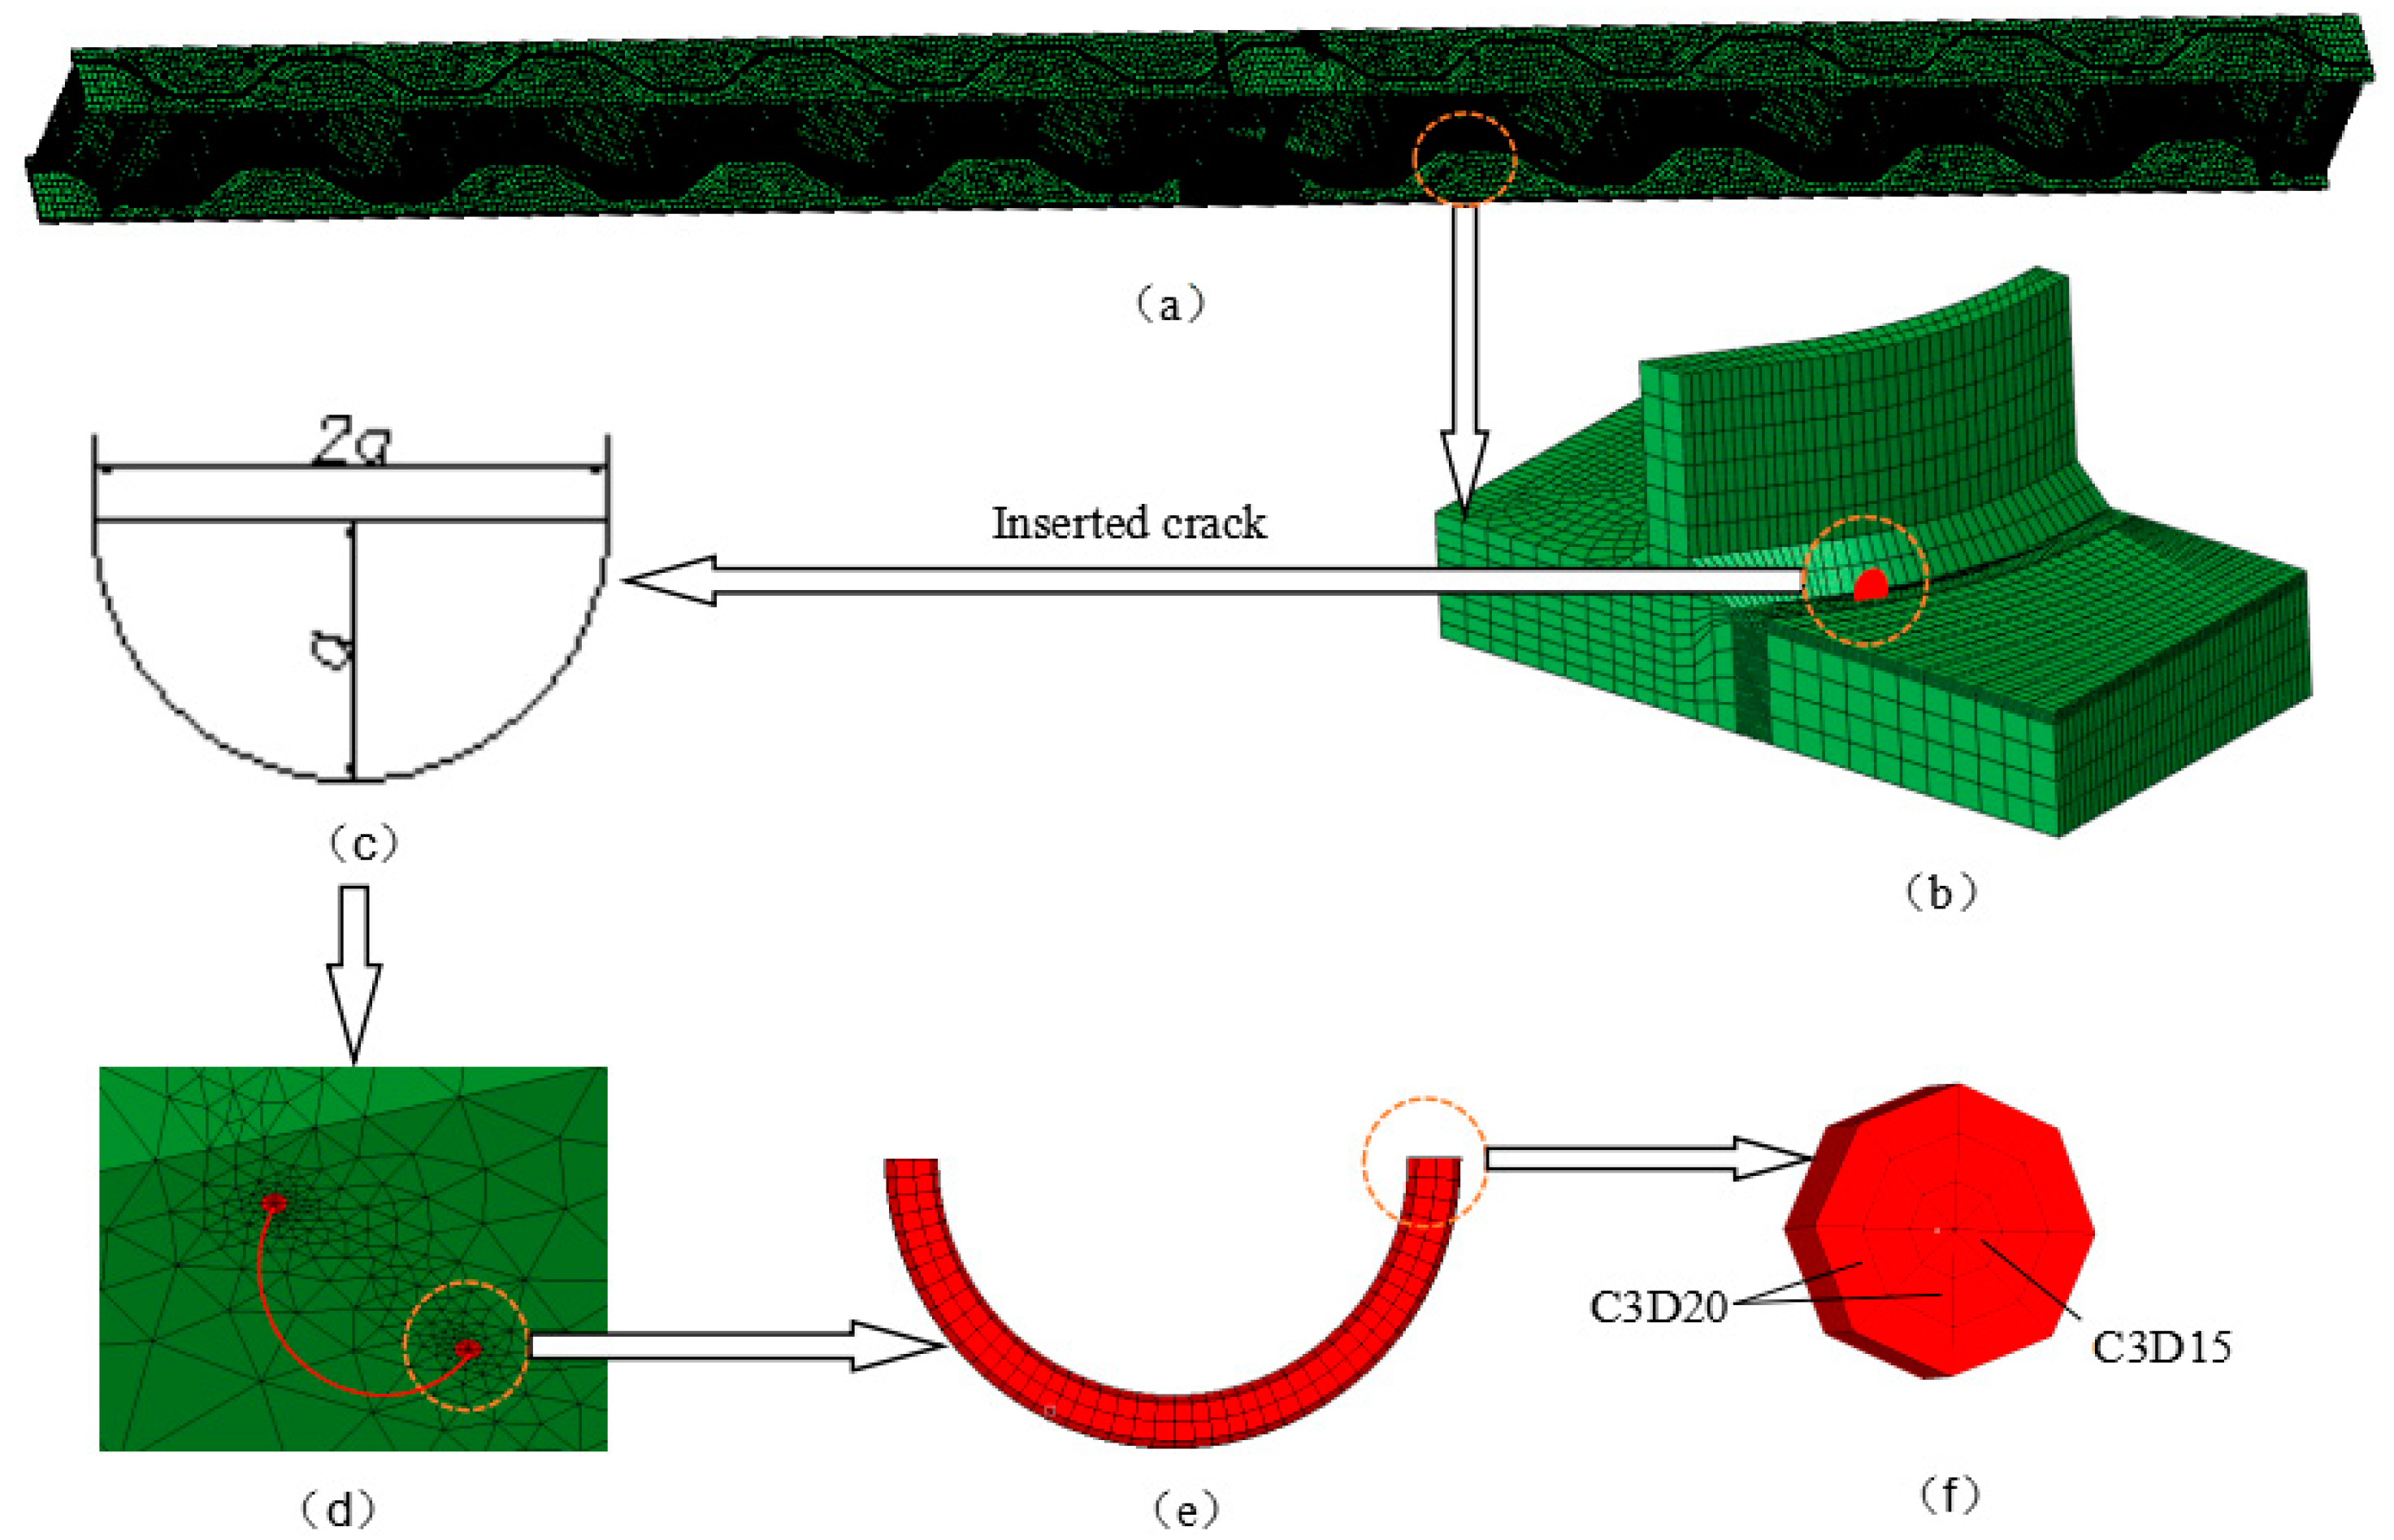
3.4. Modeling of Initial Crack
3.5. Simulation Parameters
4. Results and Discussion
4.1. Crack Front Shape Evolution
4.2. Key Parameters Evolution
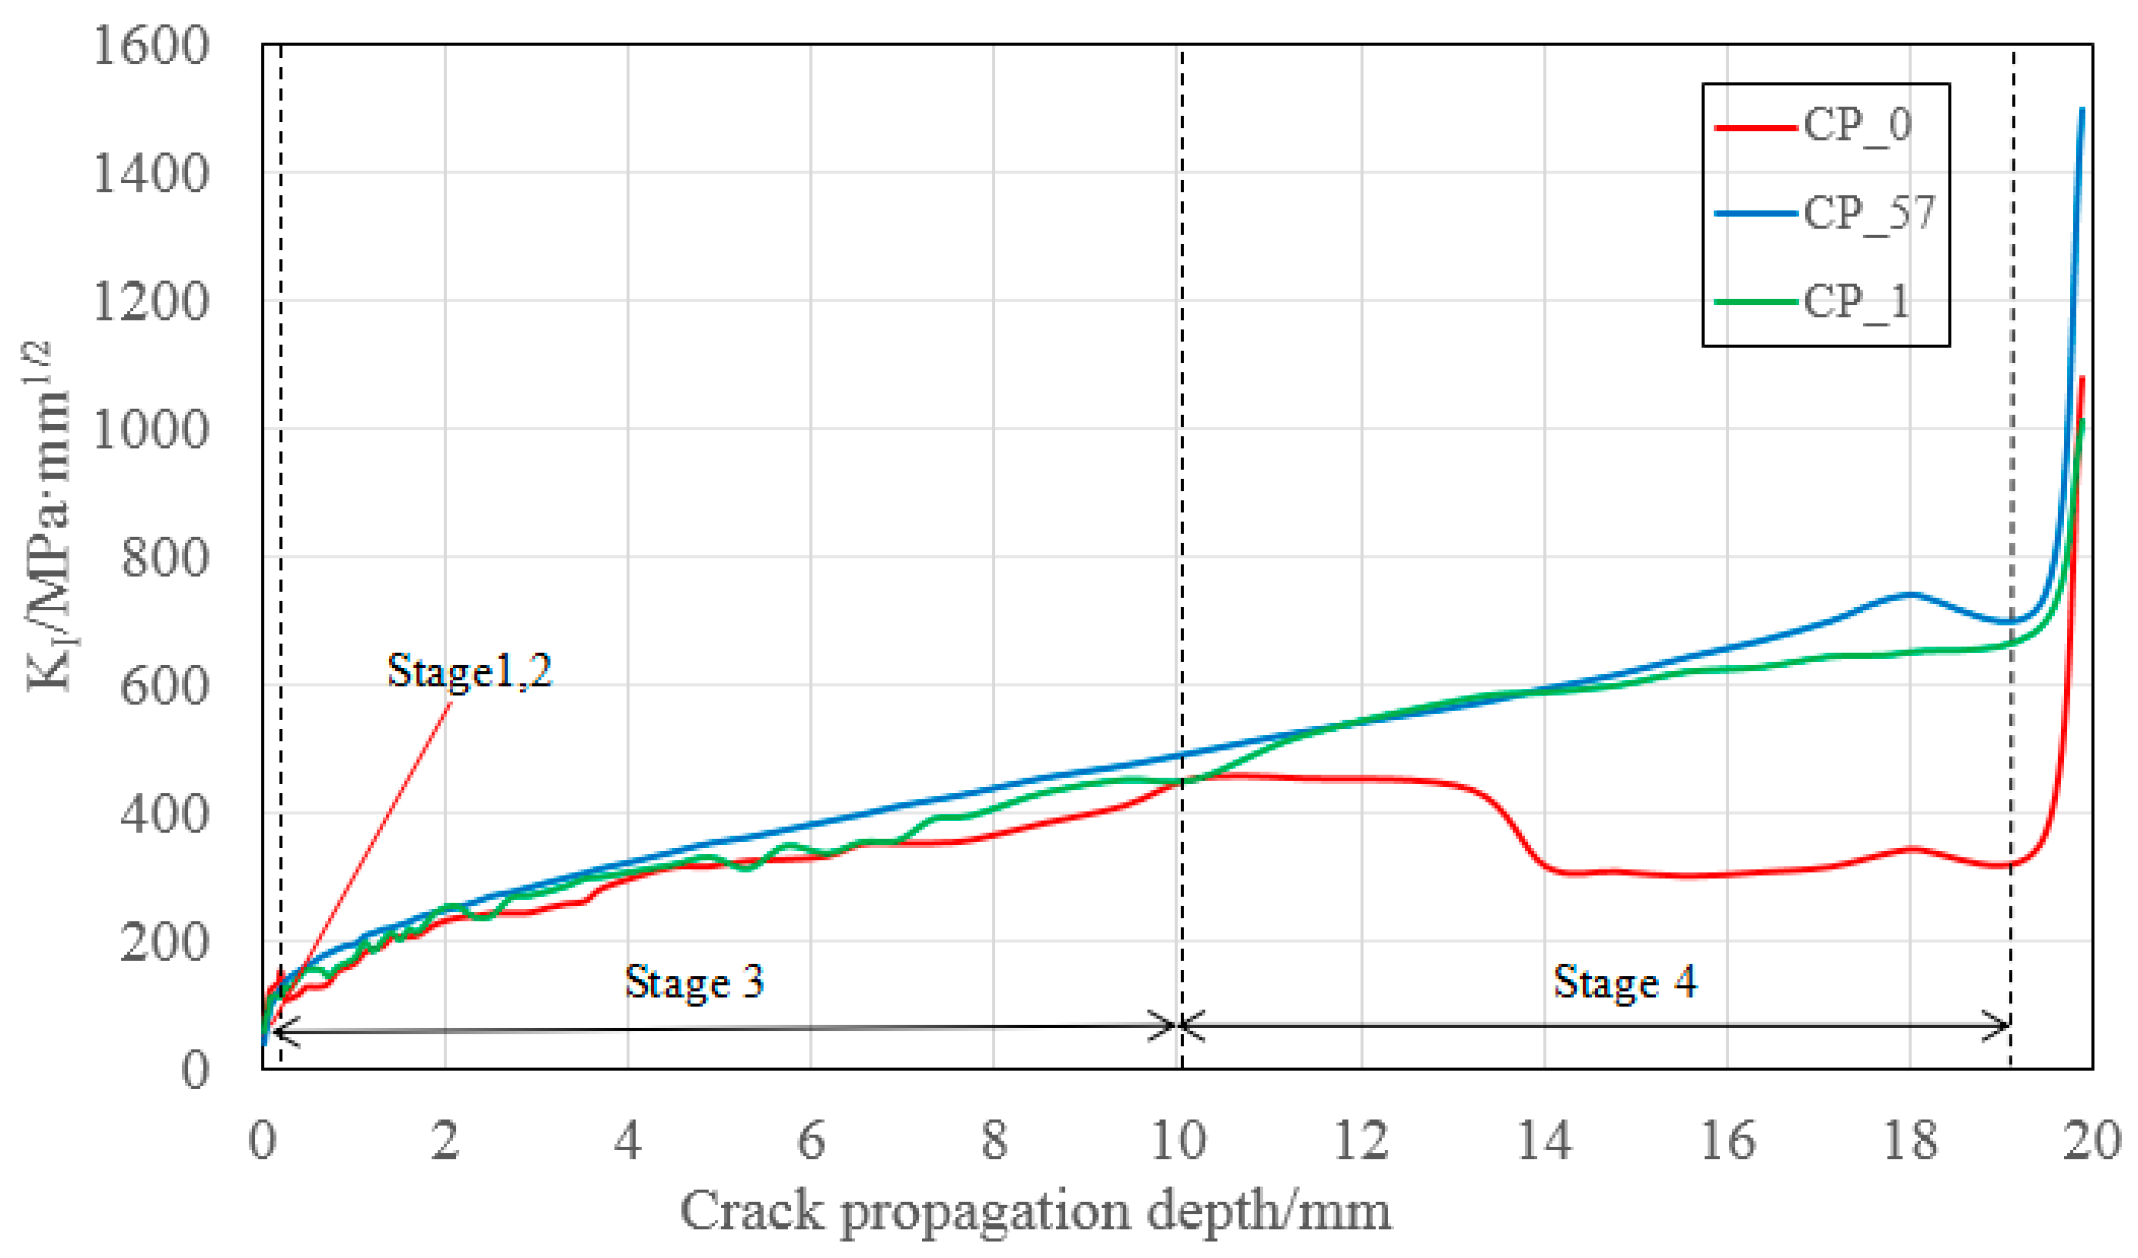
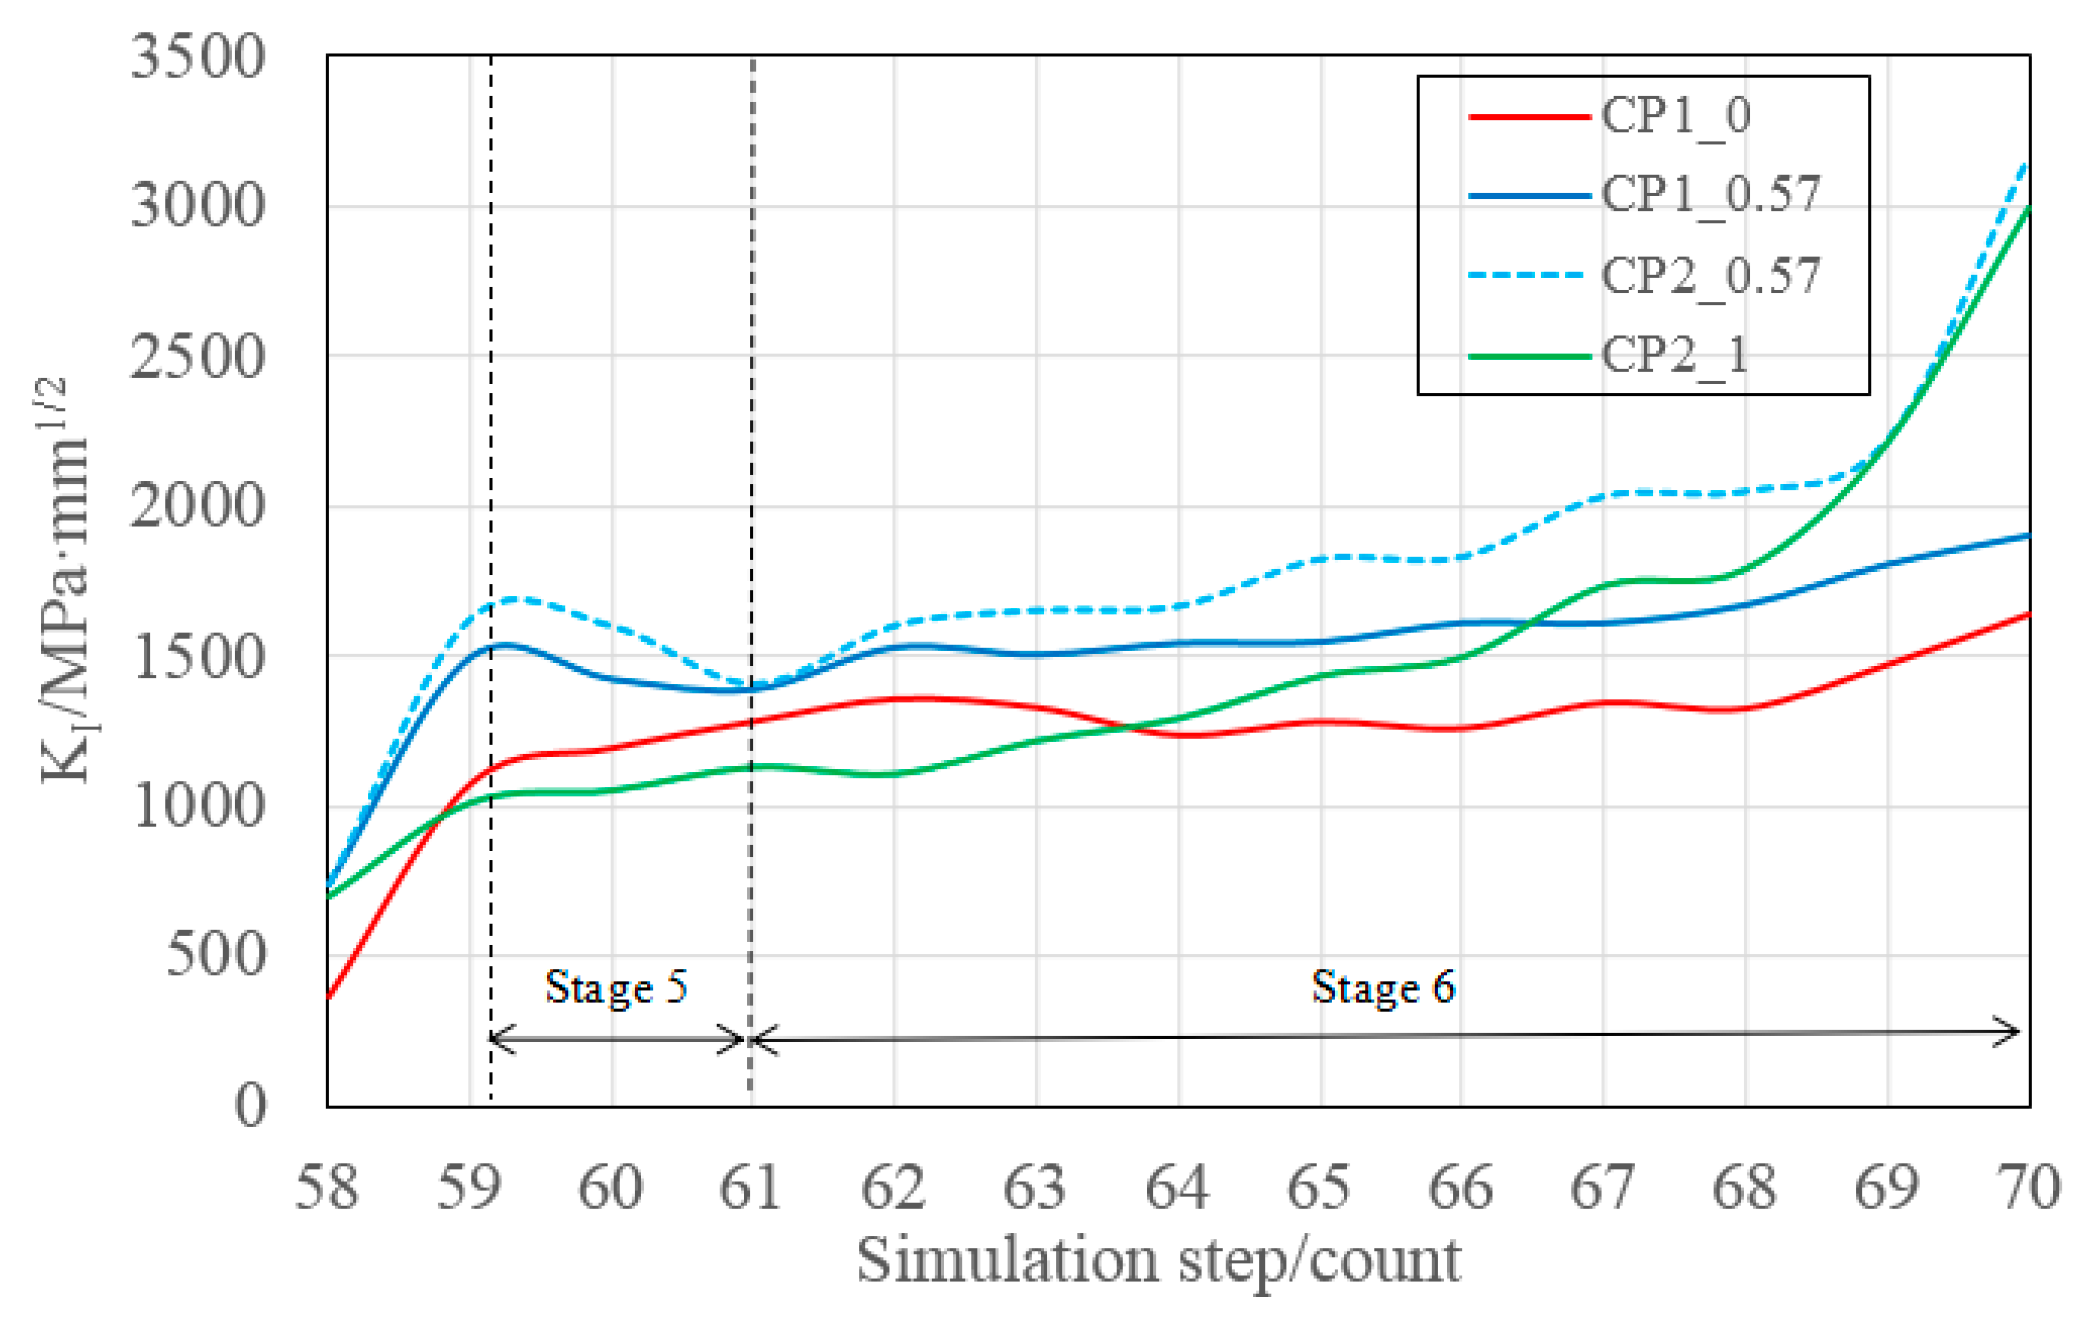
4.2.1. Characteristic Points along the Crack Front
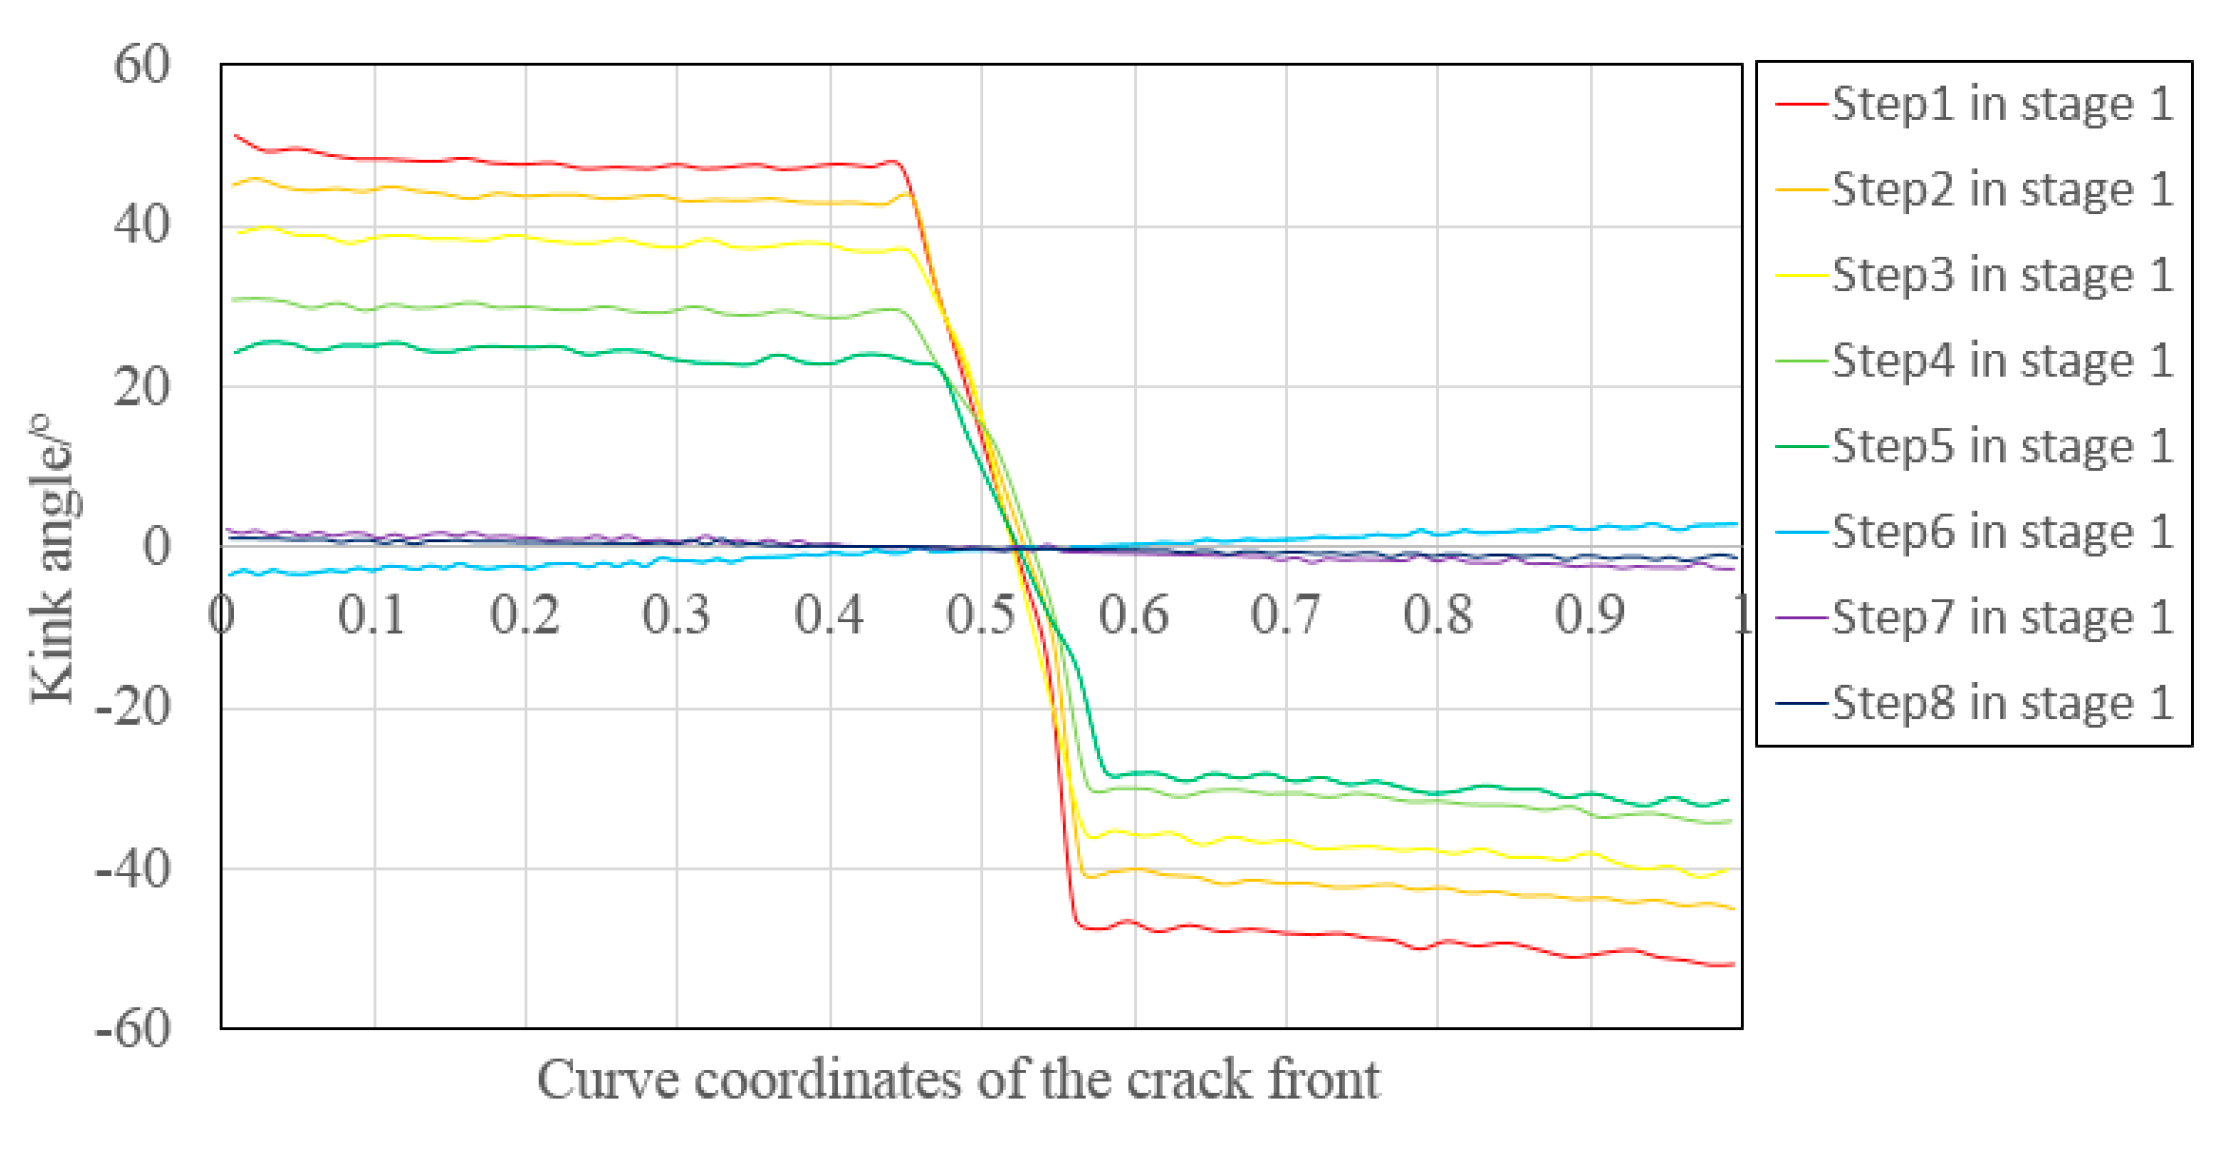
4.2.2. Kink Angle
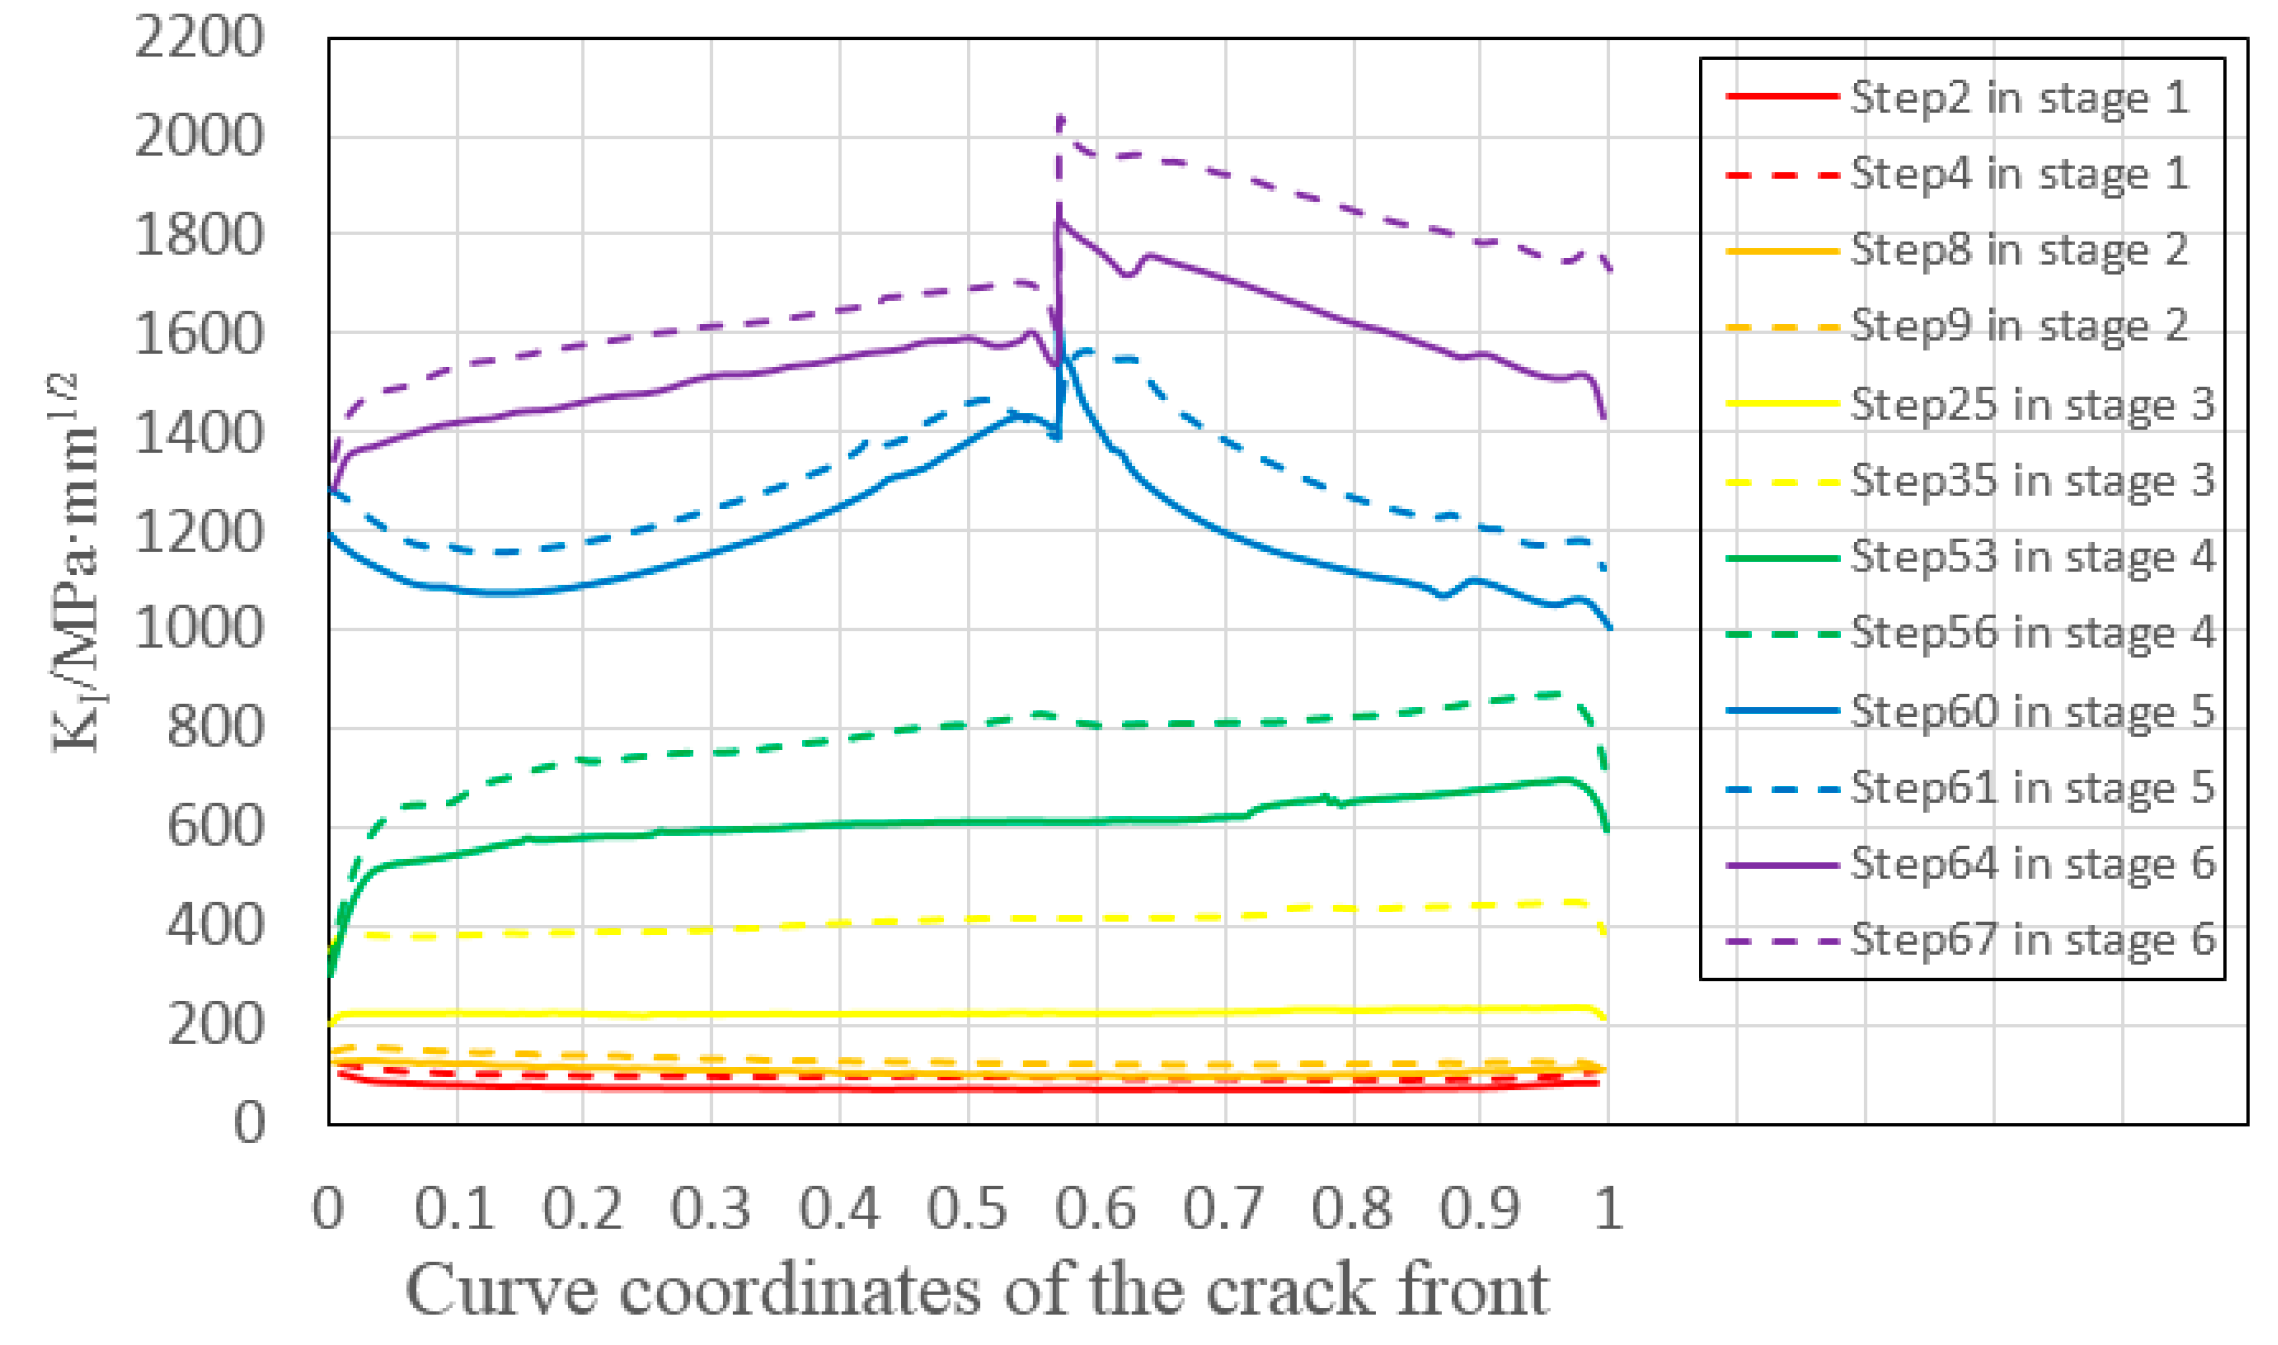
4.2.3. KI
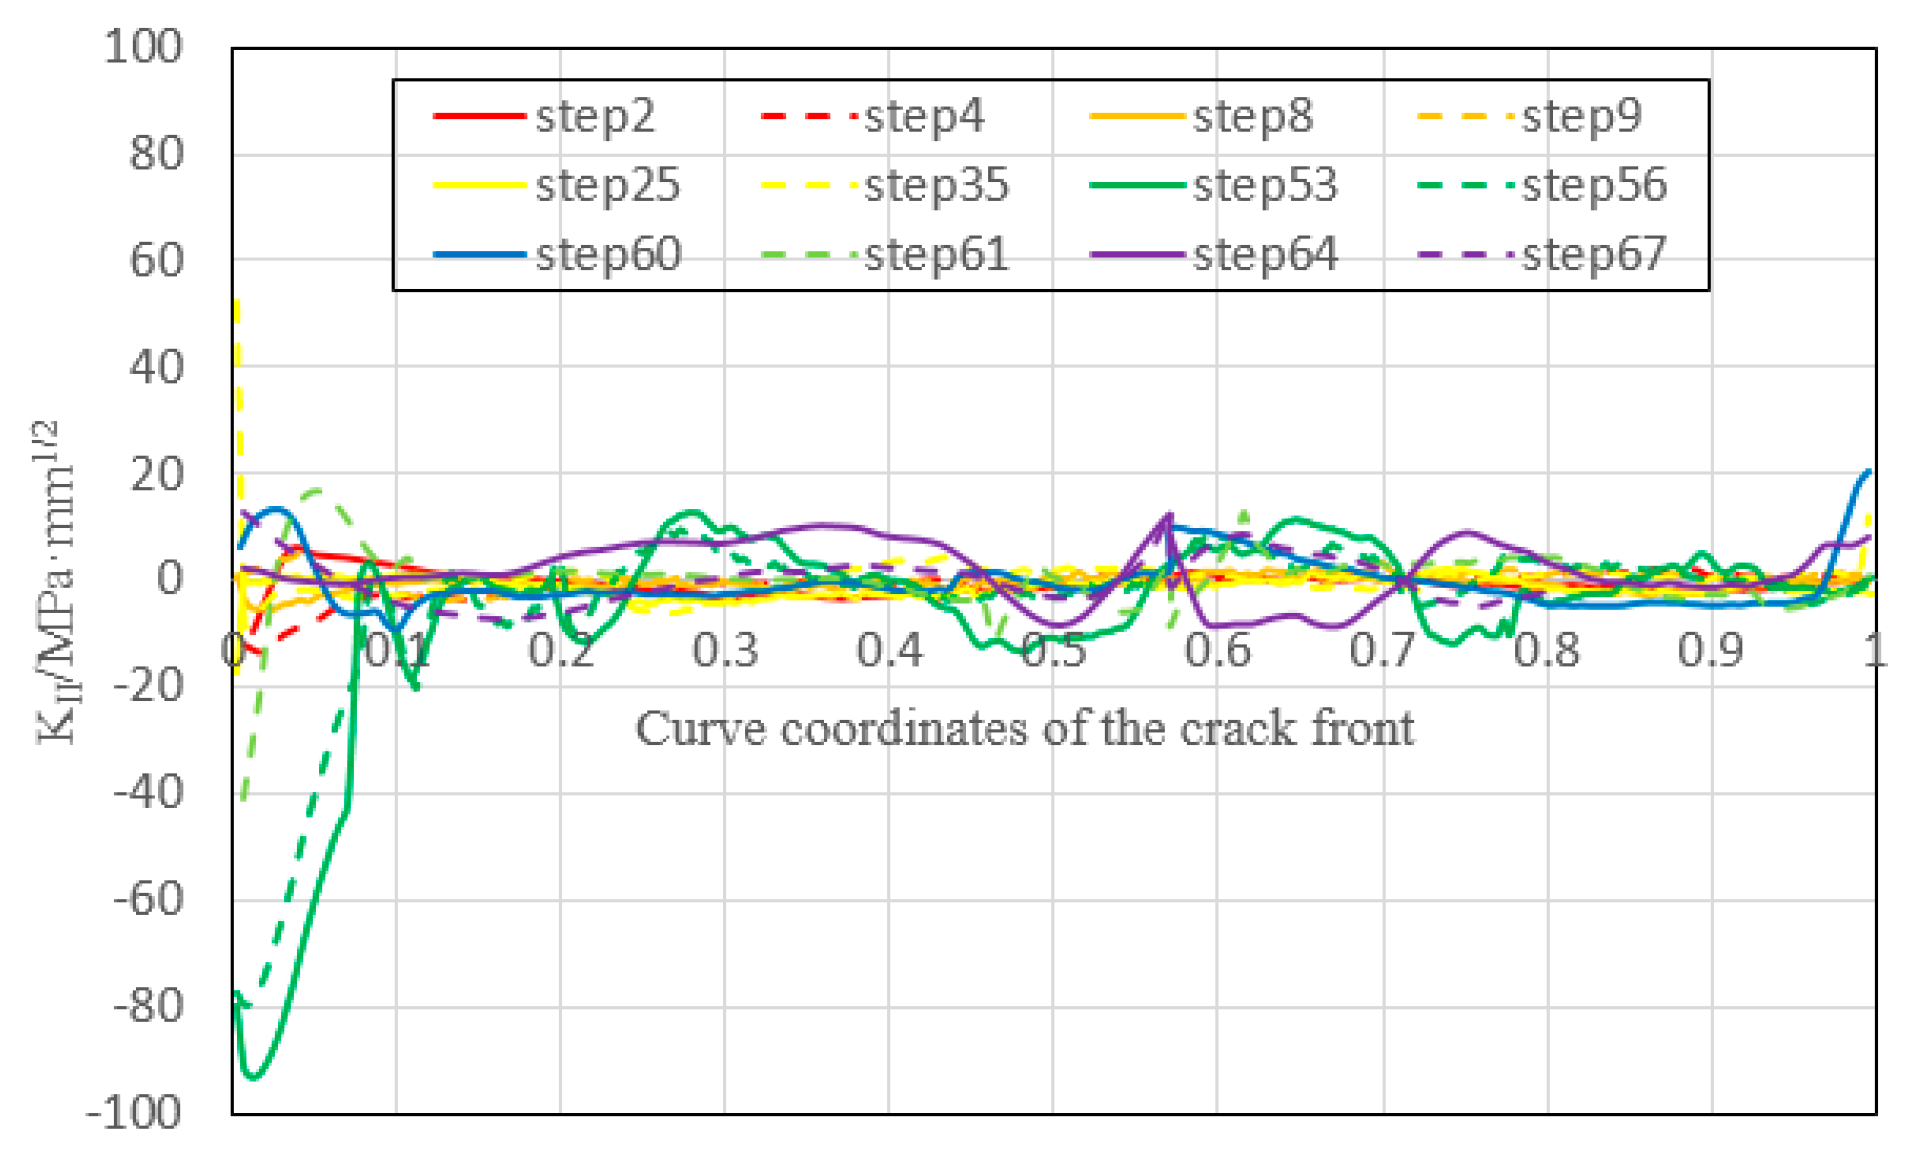
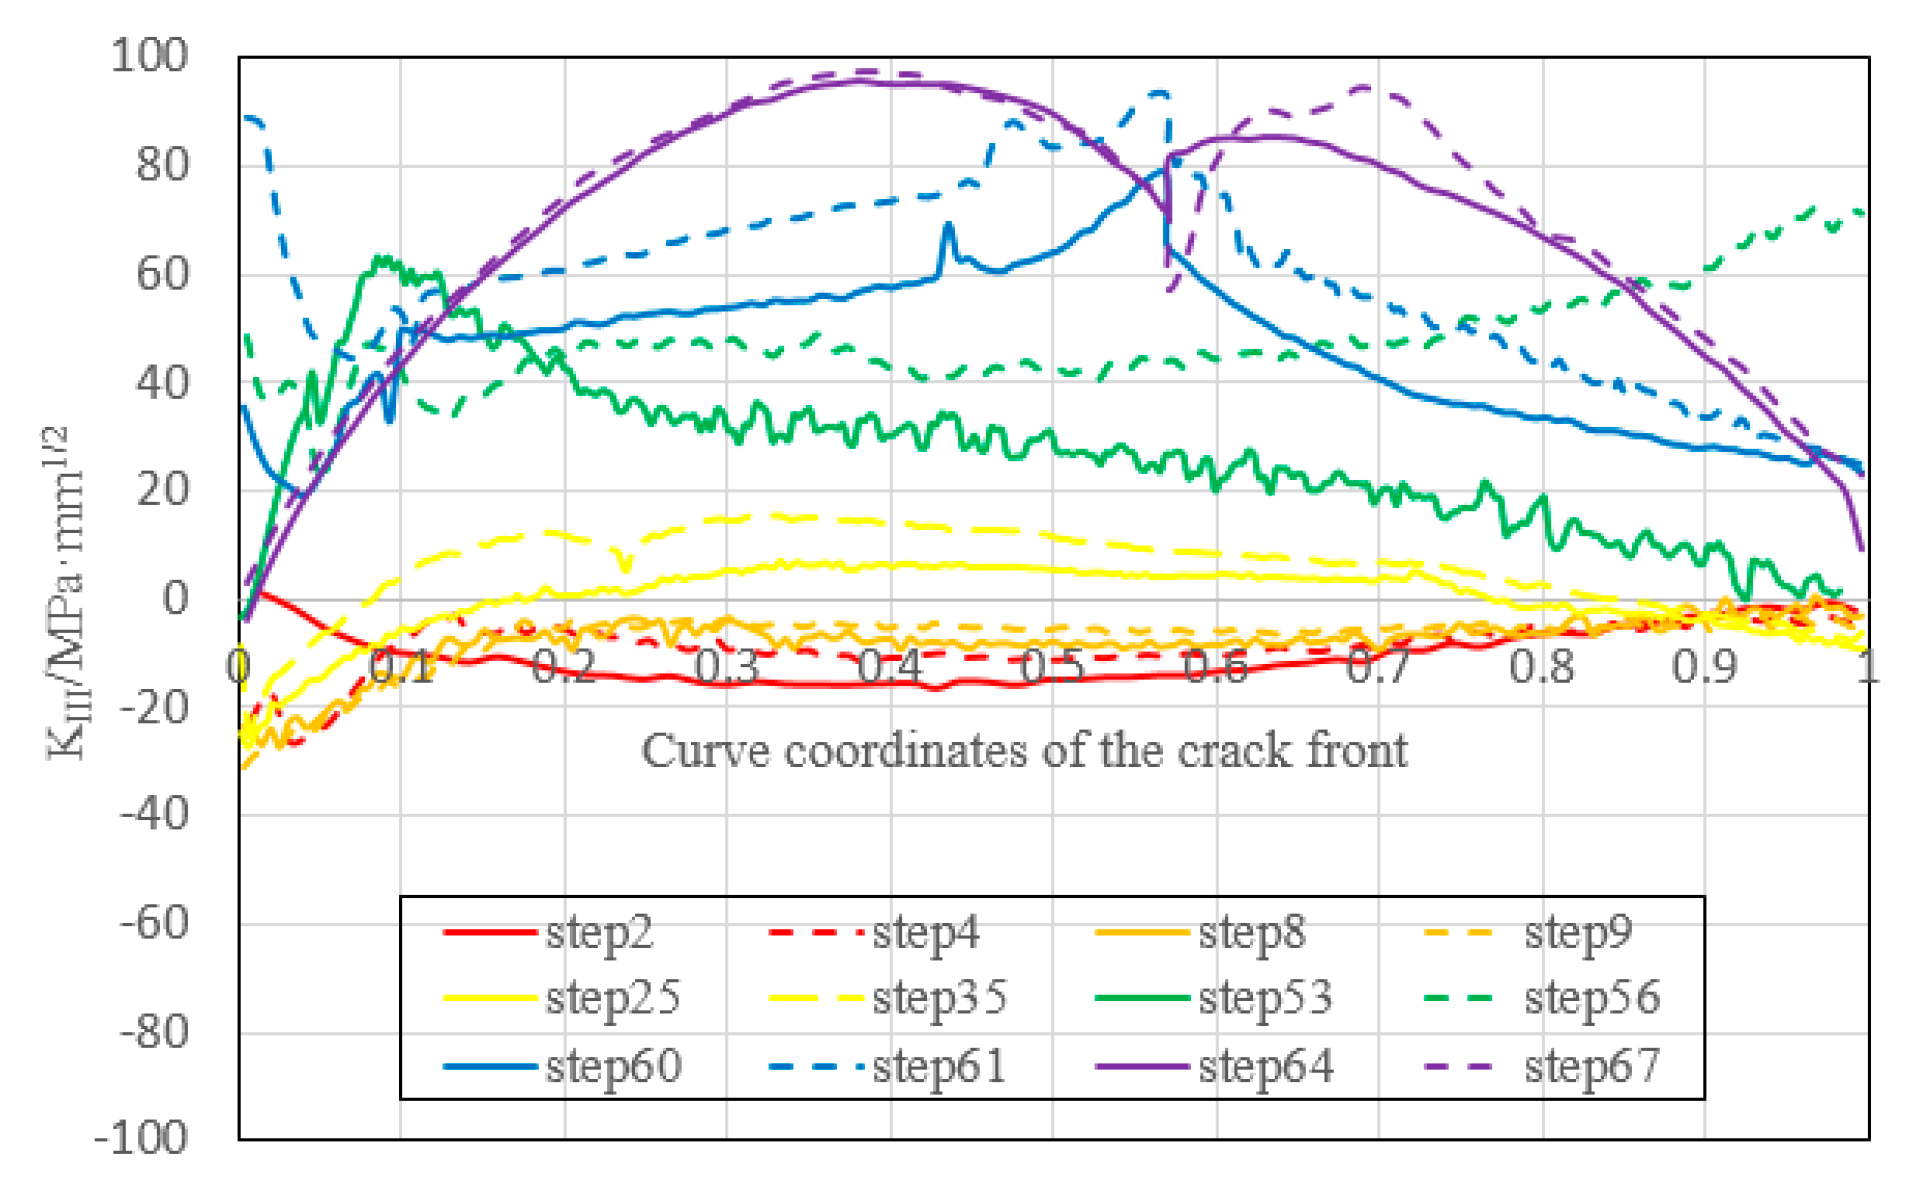
4.2.4. KII and KIII
4.3. Fatigue Life
5. Conclusions
- (1)
- Under the cyclic bending load, the fatigue crack of the corrugated web girder appears mainly in the weld toe of the flange side, which is at the intersection of the inclined section and the bending radius section in the middle part of the girder span. The ESS method can accurately capture the initiation location of the weld toe crack, but the predicted fatigue life is unsatisfying.
- (2)
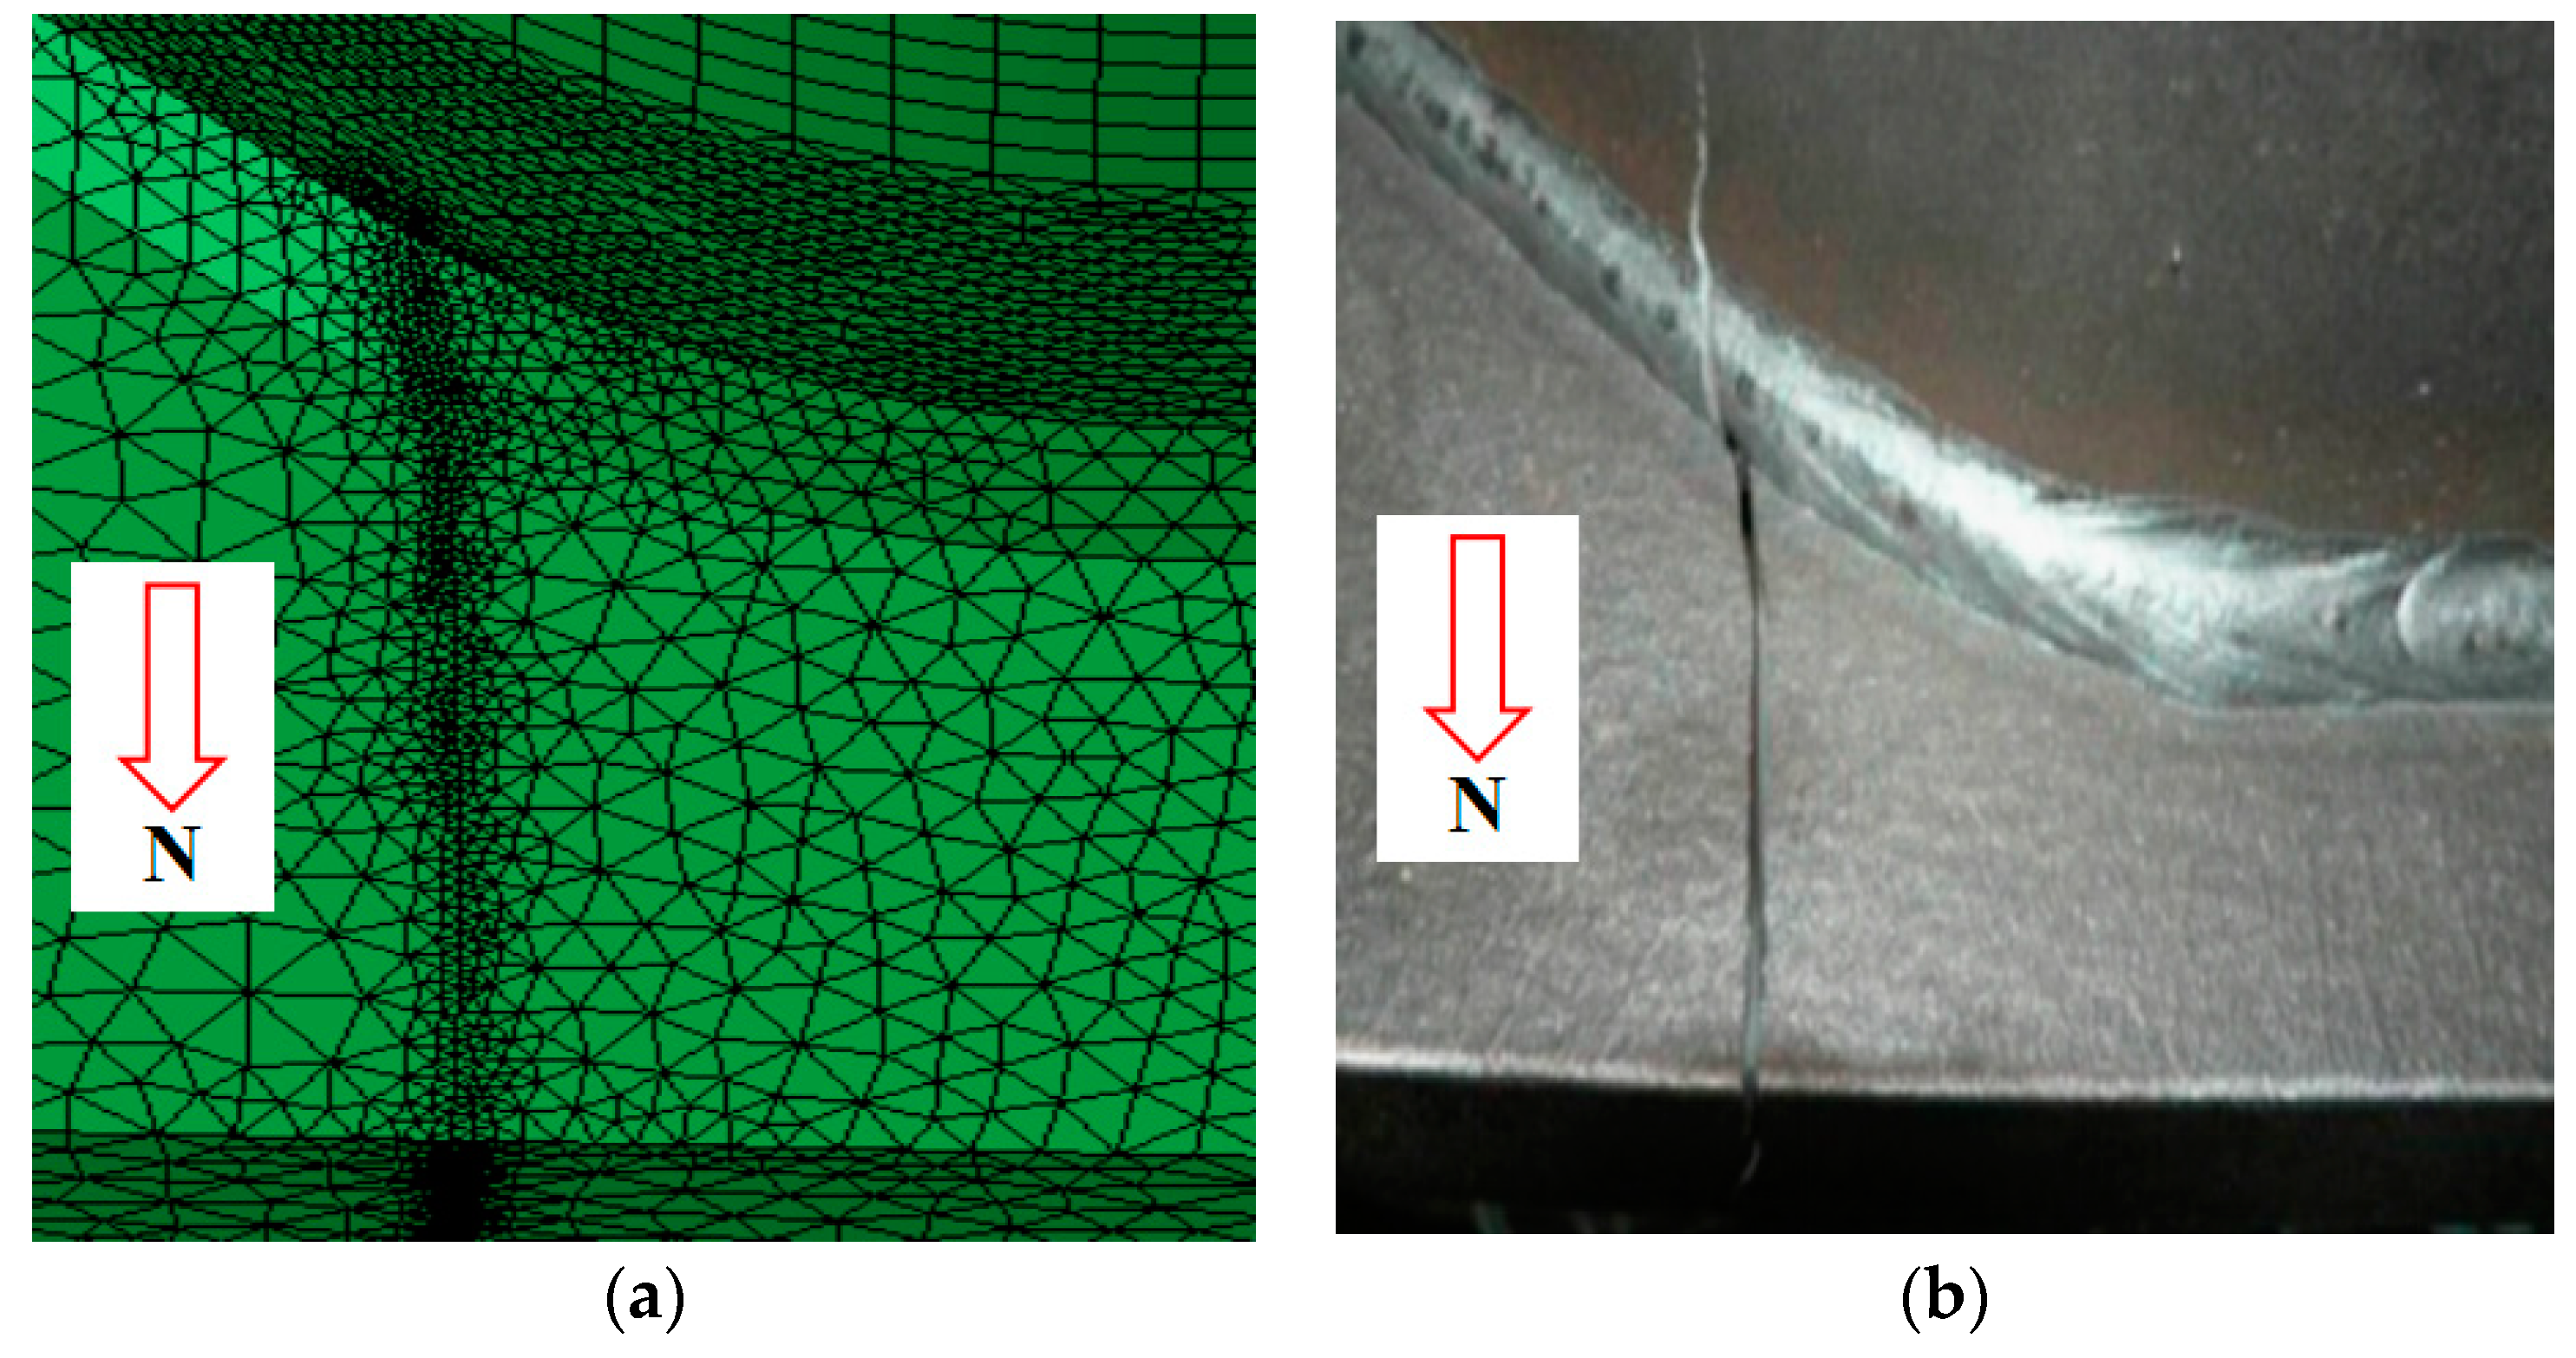
- A semi-circle initial crack with a = 0.1 mm was inserted at the crack initiation location and the evolution processes under different schemes were simulated. The simulation results show that the MTS and SERR kink criteria are consistent with the test results. Therefore, it is considered that the crack in this investigation is of opening mode, in which KI is the dominating propagation driving force.
- (3)
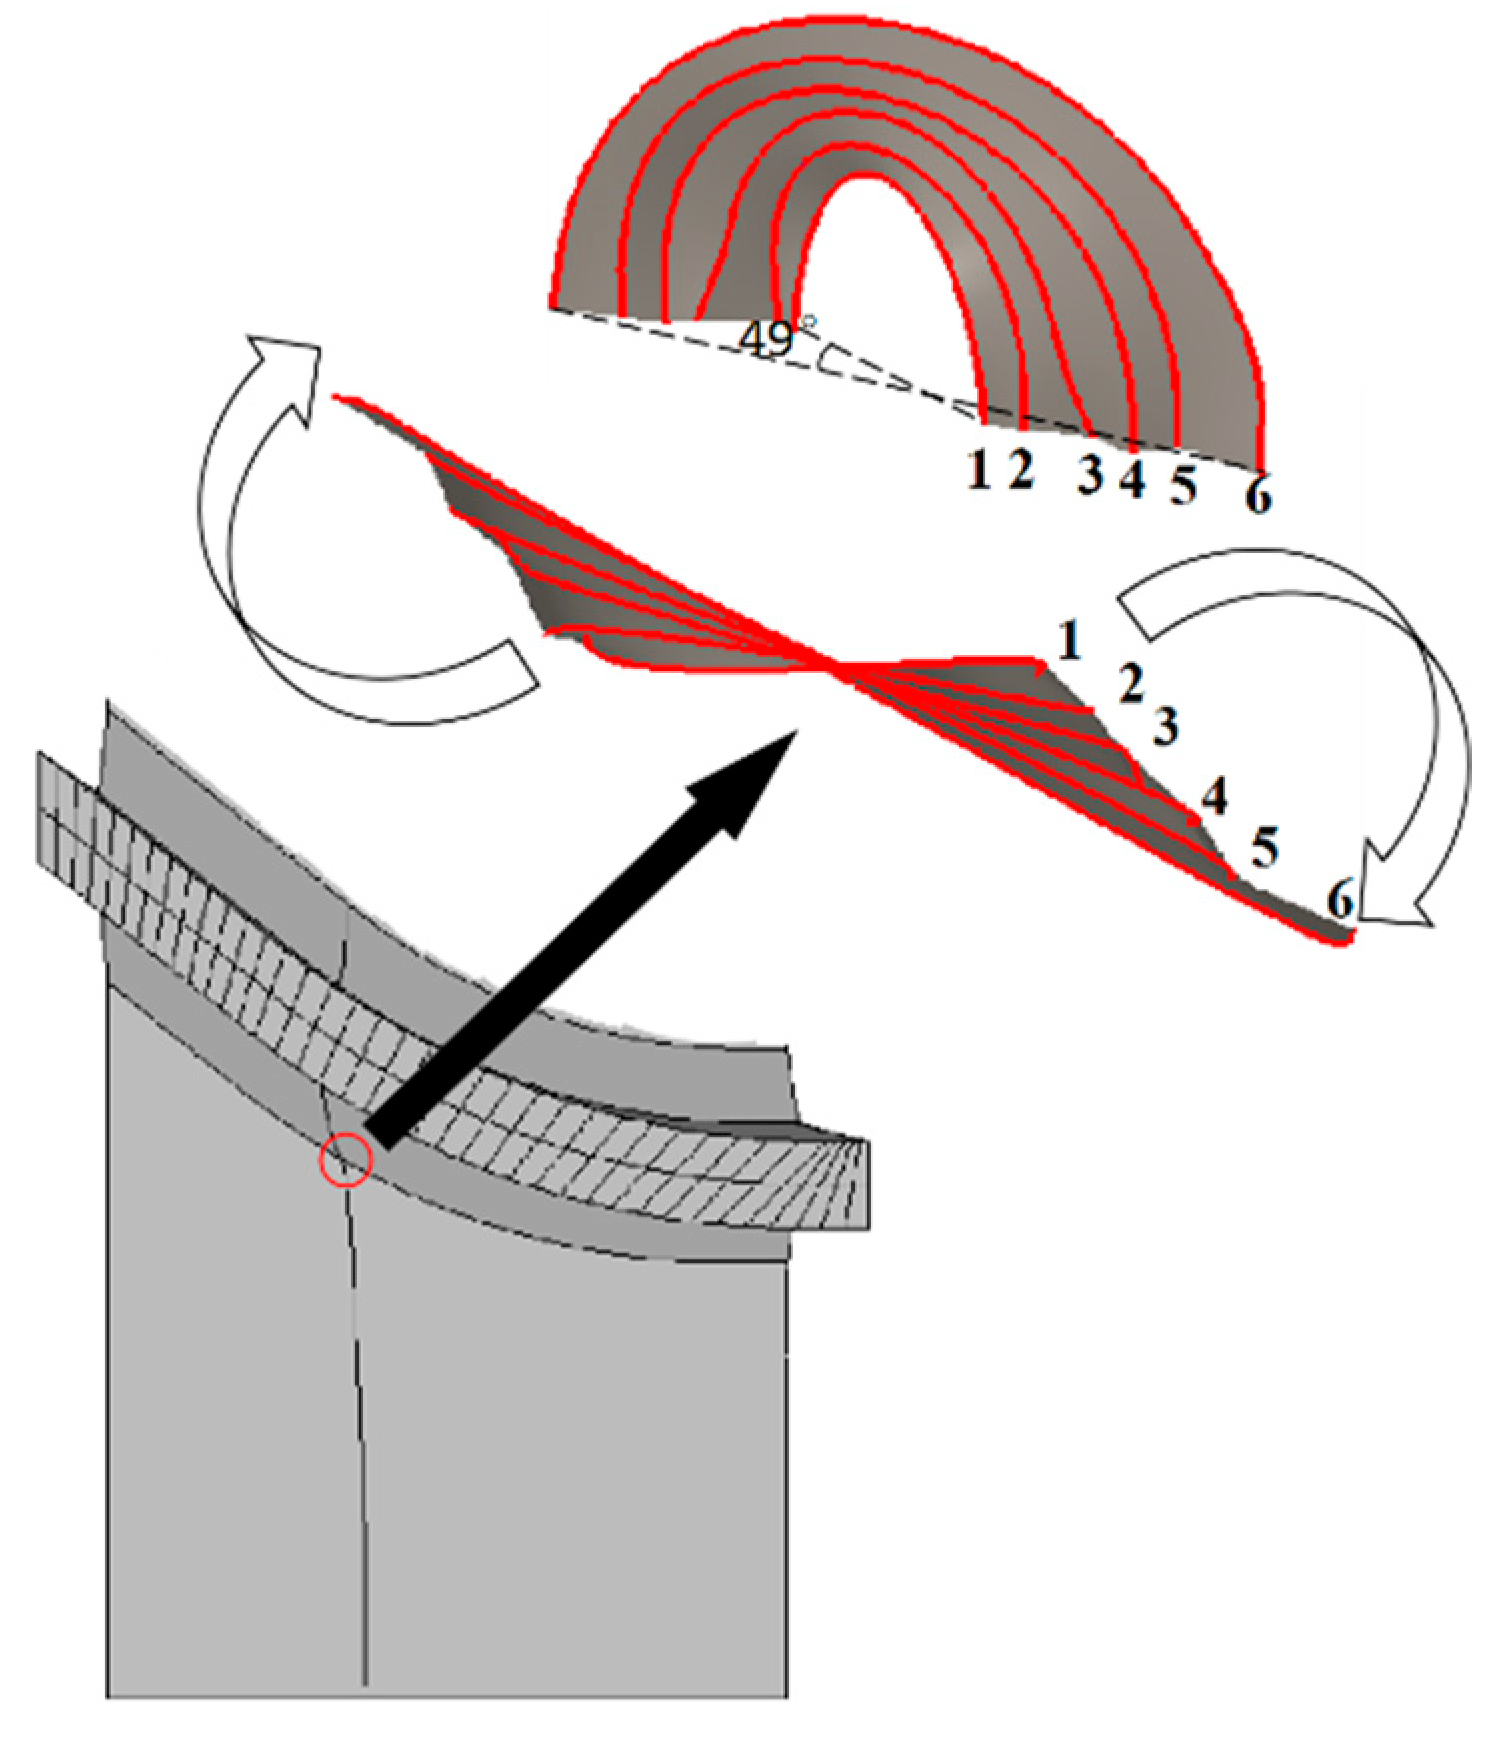
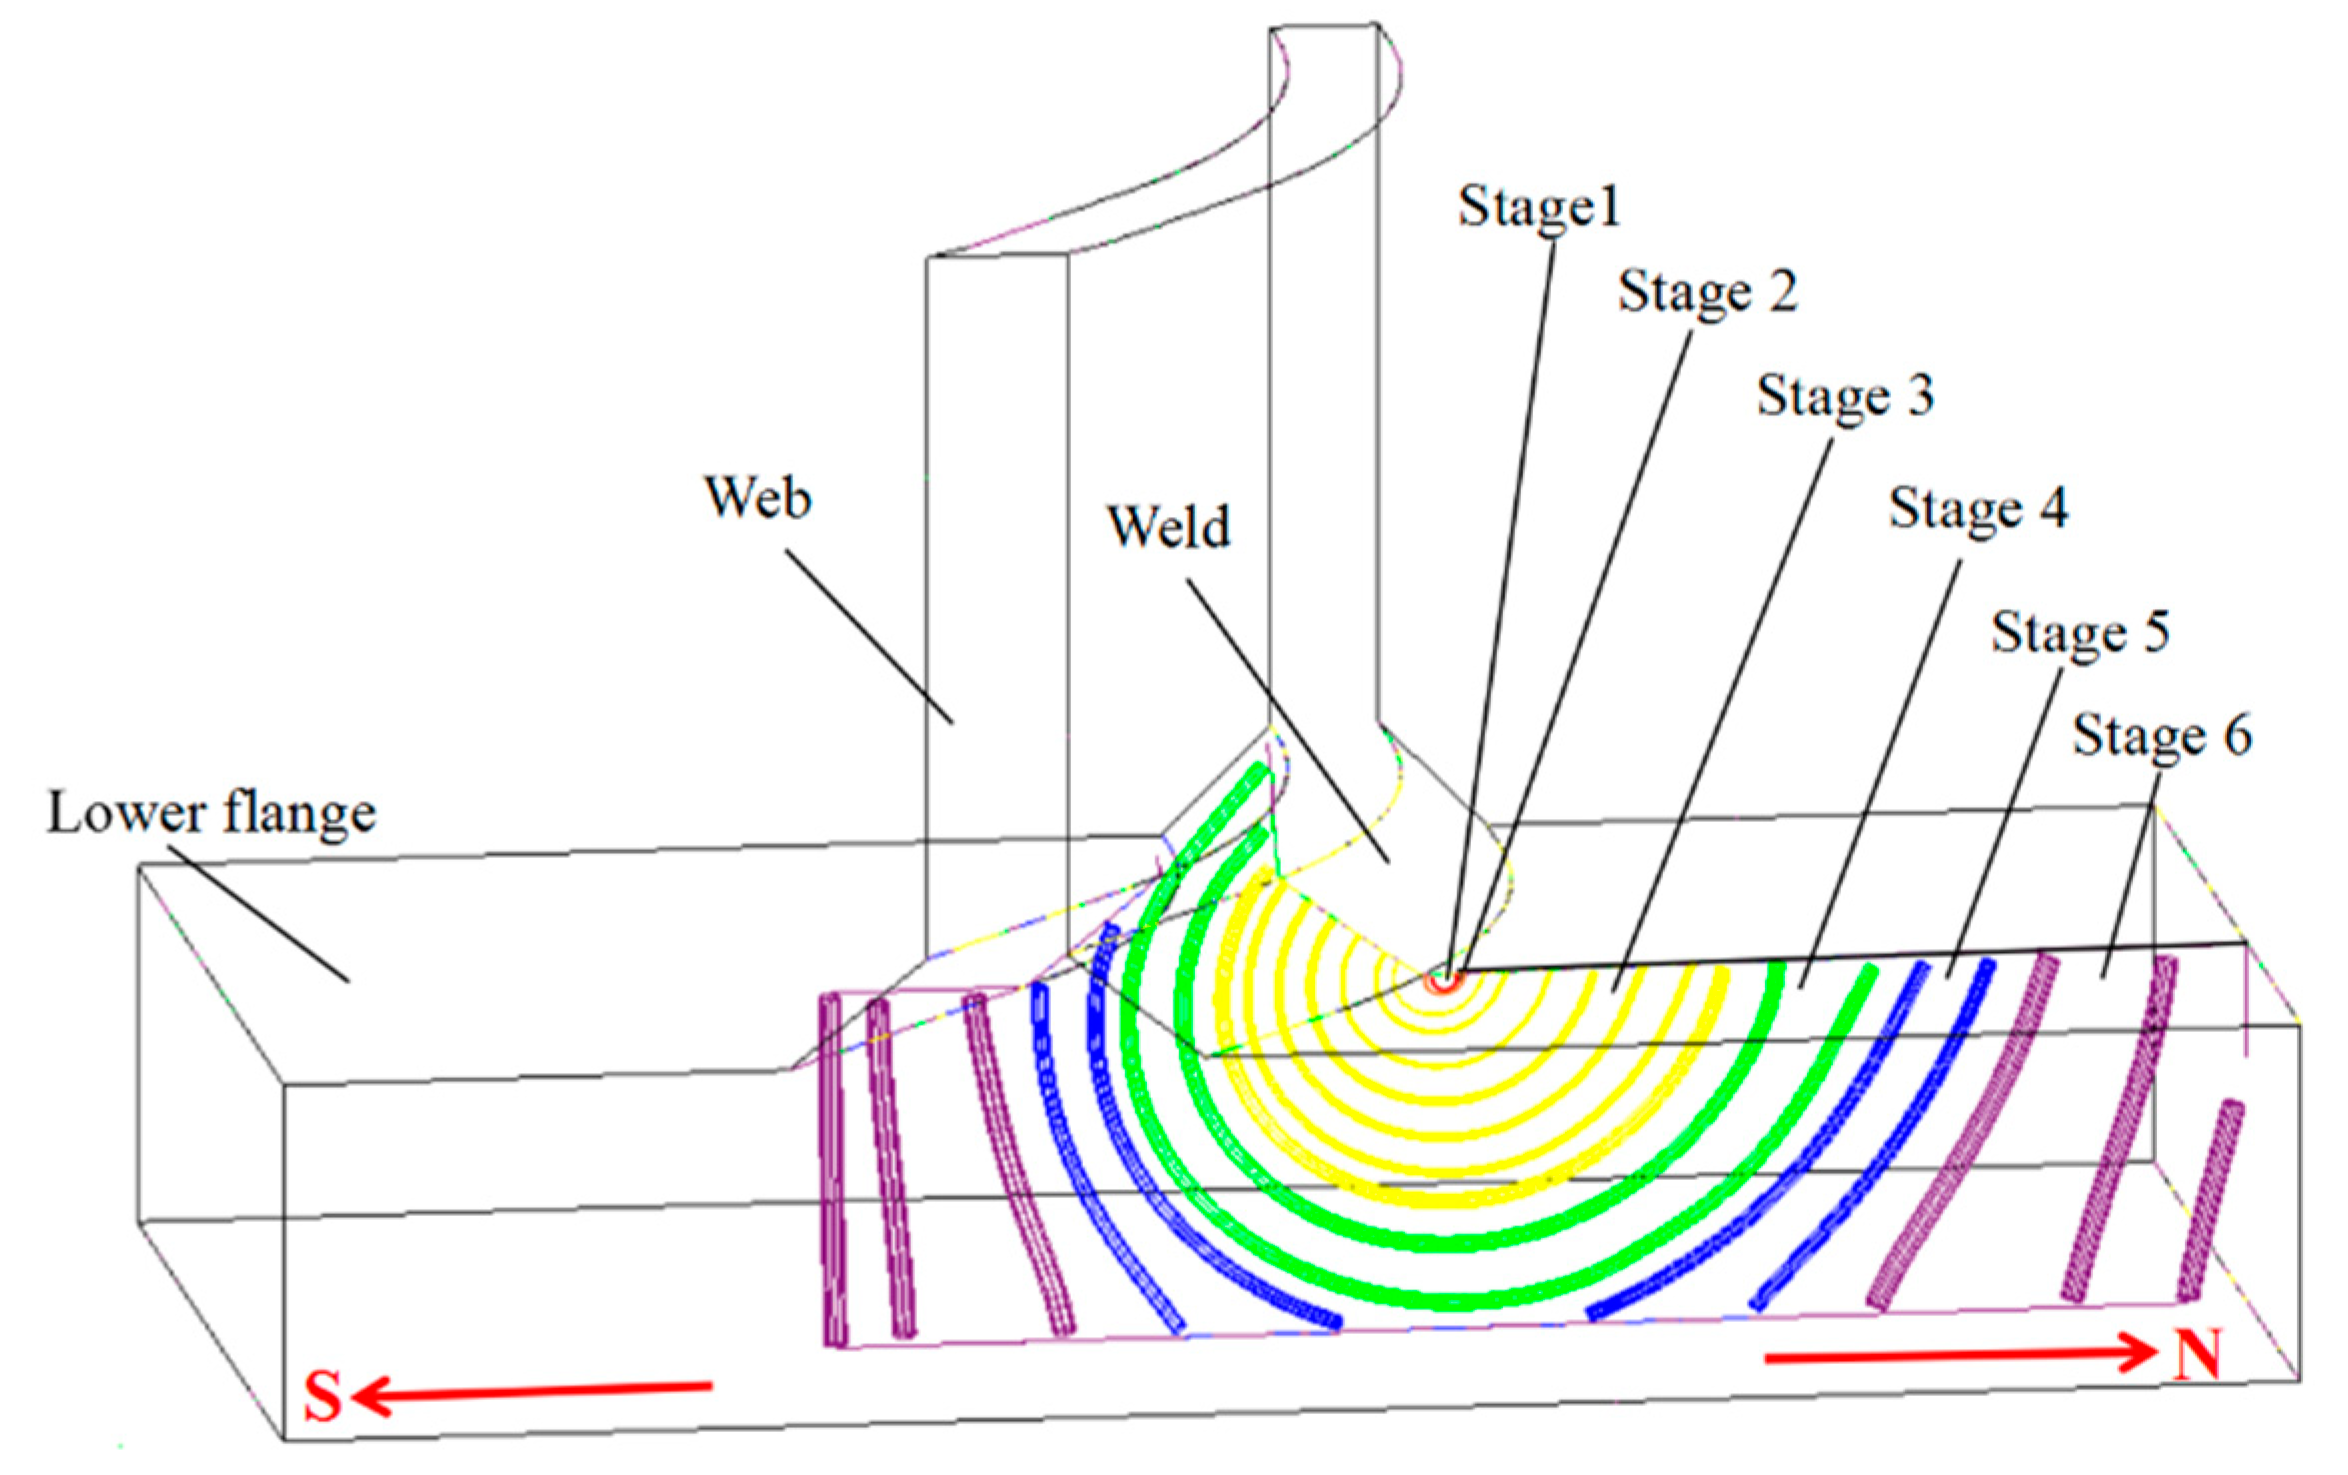
- In terms of the crack front shape and the location of the end points, the entire crack propagation process can be divided into six stages. In stage 1, the crack kinked and the kink angle was related to the inclined angle of the corrugation profile and the principal stress direction of the lower flange. In all the following stages, the crack propagated approximately in the same plane.
- (4)
- In a very short time, the crack with semi-circle shape quickly evolved into a semi-ellipse crack in stage 1 and finally evolved into two line-shape cracks in the last two stages. The weld and the web are the geometry factors influencing the crack shape and its propagation behavior.
- (5)
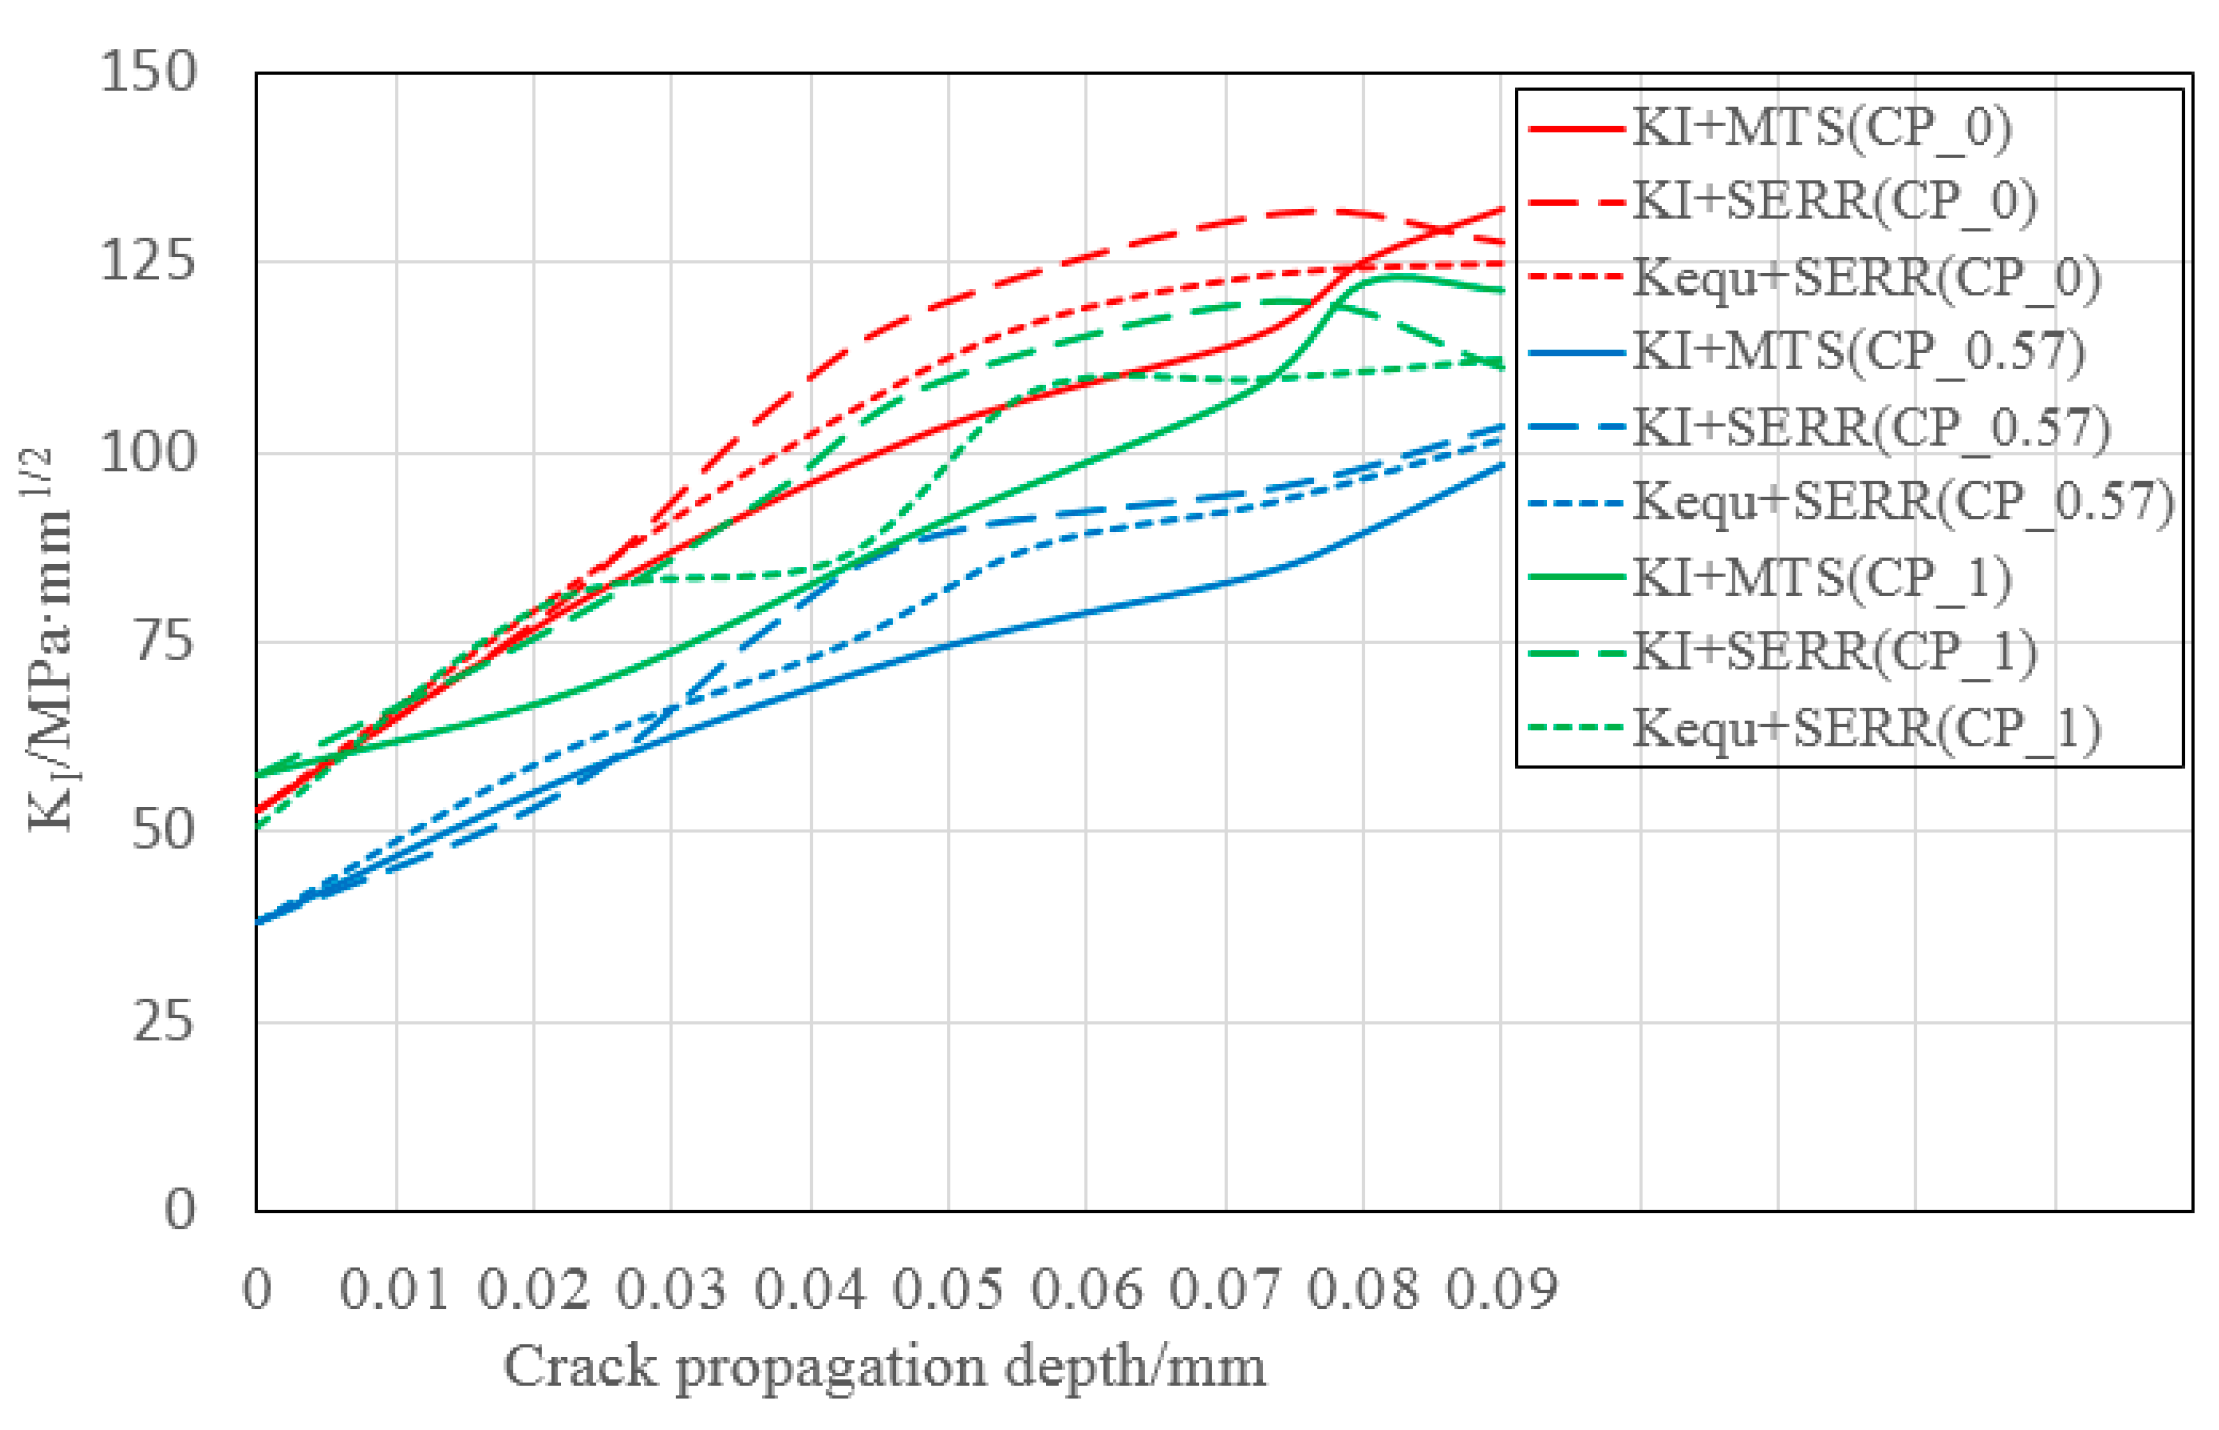
- SIF of three characteristic points at the crack front are analyzed. KI is the key driving force and its distribution directly affects the propagation rates of characteristic points. Compared with KI, the values of KII and KIII are lower, and thus can be ignored.
- (6)
- For different simulation schemes, the propagation life of every stage was calculated, in which the life in stage 3 is the longest, with the life ratio is as high as 81.43%. The life covering stages 2, 3, and 4 is about 95% of the total life, in which the crack almost propagates through the total thickness of the bottom flange. Therefore, the propagating life of an initial semi-circle crack with a depth of 0.1 mm propagating through the thickness of the flange can be used to predict the life of corrugated web girders under three-point bending with sufficient accuracy.
Author Contributions
Funding
Conflicts of Interest
References
- Luo, R.; Edlund, B. Shear capacity of plate girders with trapezoidally corrugated webs. Thin Walled Struct. 1996, 26, 19–44. [Google Scholar] [CrossRef]
- Elgaaly, M.; Hamilton, R.W.; Seshadri, A. Shear strength of girders with corrugated webs. J. Struct. Eng. 1996, 122, 390–398. [Google Scholar] [CrossRef]
- Moon, J.; Yi, J.; Choi, B.H.; Lee, H.E. Shear strength and design of trapezoidally corrugated steel webs. J. Constr. Steel Res. 2009, 65, 1198–1205. [Google Scholar] [CrossRef]
- Elgaaly, M.; Seshadri, A. Girders with corrugated webs under partial compressive edge loading. J. Struct. Eng. 1997, 123, 783–791. [Google Scholar] [CrossRef]
- Höglund, T. Shear buckling resistance of steel and aluminium plate girders. Thin Walled Struct. 1997, 29, 13–30. [Google Scholar] [CrossRef]
- Elgaaly, M. Post-buckling behavior of thin steel plates using computational models. Adv. Eng. Software 2000, 31, 511–517. [Google Scholar] [CrossRef]
- Ren, T.; Tong, G.S. Elastic buckling of web plates in I-girders under patch and wheel loading. Eng. Struct. 2005, 27, 1528–1536. [Google Scholar] [CrossRef]
- Liu, S.; Ding, H.; Taerwe, L.; De Corte, W. shear strength of trapezoidal corrugated steel webs for horizontally curved girder bridges. Appl. Sci. 2019, 9, 1942. [Google Scholar] [CrossRef]
- Abbas, H.H.; Sause, R.; Driver, R.G. Simplified analysis of flange transverse bending of corrugated web I-girders under in-plane moment and shear. Eng. Struct. 2007, 29, 2816–2824. [Google Scholar] [CrossRef]
- Korrani, H.R.K.N. Lateral bracing of I-girder with corrugated webs under uniform bending. J. Constr. Steel Res. 2010, 66, 1502–1509. [Google Scholar] [CrossRef]
- Kim, K.S.; Lee, D.H. Flexural behavior of prestressed composite girders with corrugated web: Part ii. Experiment and verification. Composites Part B 2011, 42, 1617–1629. [Google Scholar] [CrossRef]
- Nguyen, N.D.; Han, S.R.; Lee, G.S.; Kang, Y.J. Moment modification factor of I-girder with trapezoidal-web-corrugations considering concentrated load height effects. J. Constr. Steel Res. 2011, 67, 1773–1787. [Google Scholar] [CrossRef]
- Chu, X.T.; Ye, Z.M.; Li, L.Y.; Kettle, R. Local and distortional buckling of cold-formed zed-section girders under uniformly distributed transverse loads. Int. J. Mech. Sci. 2006, 48, 378–388. [Google Scholar] [CrossRef]
- Moona, J.; Yib, J.-W.; Choic, B.H.; Leea, H.-E. Lateral torsional buckling of I-girder with corrugated webs under uniform bending. Thin Walled Struct. 2009, 47, 21–30. [Google Scholar] [CrossRef]
- Nguyen, N.D.; Kim, S.N.; Han, S.R.; Kang, Y.J. Elastic lateral-torsional buckling strength of I-girder with trapezoidal web corrugations using a new warping constant under uniform moment. Eng. Struct. 2010, 32, 2157–2165. [Google Scholar] [CrossRef]
- Elgaaly, M.; Seshadri, A.; Hamilton, R.W. Bending strength of steel girders with corrugated webs. J. Struct. Eng. 1997, 123, 772–782. [Google Scholar] [CrossRef]
- Chan, C. Finite element analysis of corrugated web girders under bending. J. Constr. Steel Res. 2002, 58, 1391–1406. [Google Scholar] [CrossRef]
- Khalid, Y.A.; Chan, C.L.; Sahari, B.B.; Hamouda, A.M.S. Bending behaviour of corrugated web girders. J. Mater. Process. Technol. 2004, 150, 242–254. [Google Scholar] [CrossRef]
- Korashy, M.; Varga, J. Comparative investigation of fatigue strength of girders with web plate stiffened in the traditional way and by corrugation. Acta Tech. 1979, 89, 309–346. [Google Scholar]
- Anami, K.; Sause, R.; Abbas, H.H. Fatigue of web-flange weld of corrugated web girders: 1. Influence of web corrugation geometry and flange geometry on web-flange weld toe stresses. Int. J. Fatigue 2005, 27, 373–381. [Google Scholar] [CrossRef]
- Anami, K.; Sause, R. Fatigue of web-flange weld of corrugated web girders: 2. Analytical evaluation of fatigue strength of corrugated web-flange weld. Int. J. Fatigue 2005, 27, 383–393. [Google Scholar] [CrossRef]
- Wang, Z.; Tan, L.; Wang, Q.Y. Fatigue strength evaluation of welded structural details in corrugated steel web girders. Int. J. Steel Struct. 2013, 13, 707–721. [Google Scholar] [CrossRef]
- Wang, Z.; Wang, Q.Y. Fatigue assessment of welds joining corrugated steel webs to flange plates. Eng. Struct. 2014, 73, 1–12. [Google Scholar] [CrossRef]
- Wang, Z.Y.; Wang, Q.Y.; Liu, Y.J.; Sun, M. Fatigue behaviour of welded joints assembled by longitudinal corrugated plates. J. Cent. S. Univ. 2015, 22, 2752–2760. [Google Scholar] [CrossRef]
- Wang, Z.Y.; Wang, Q.Y. Fatigue strength of CFRP strengthened welded joints with corrugated steel plates. Composites Part B 2015, 72, 30–39. [Google Scholar] [CrossRef]
- Ibrahim, S.A.; Eldakhakhni, W.W.; Elgaaly, M. Behavior of bridge girders with corrugated webs under monotonic and cyclic loading. Eng. Struct. 2006, 28, 1941–1955. [Google Scholar] [CrossRef]
- Pyttel, B.; Grawenhof, P.; Berger, C. Application of different concepts for fatigue design of welded joints in rotating components in mechanical engineering. Int. J. Fatigue 2012, 34, 35–46. [Google Scholar] [CrossRef]
- Smith, I.F.C.; Smith, R.A. Defects and crack shape development in fillet welded joints. Fatigue Fract. Eng. Mater. Struct. 1982, 5, 151–165. [Google Scholar] [CrossRef]
- Signes, E.G.; Baker, R.G.; Harrison, H.D.; Burdekin, F.M. Factors affecting the fatigue strength of welded high strength. Weld. J. 1967, 14, 108–116. [Google Scholar]
- Watkinson, F.; Bodger, P.H.; Harrison, J.D. The fatigue strength of welded joints in high strength steels and methods for its improvement. In Proceedings of the Conference on Fatigue of Welded Structures; The Welding Institute: Brighton, UK, 1970; pp. 97–113. [Google Scholar]
- Kindrachuk, V.; Fedelich, B.; Rehmer, B.; Peter, F. Computational methods for lifetime prediction of metallic components under high-temperature fatigue. Metals 2019, 9, 390. [Google Scholar] [CrossRef]
- Alencar, G.; Jesus, A.M.P.D.; Calçada, R.A.B.; Silva, J.G.S.d. Fatigue life evaluation of a composite steel-concrete roadway bridge through the hot-spot stress method considering progressive pavement deterioration. Eng. Struct. 2018, 166, 46–61. [Google Scholar] [CrossRef]
- Torabi, A.R.; Berto, F.; Sapora, A. Finite fracture mechanics assessment in moderate and large scale yielding regimes. Metals 2019, 9, 602. [Google Scholar] [CrossRef]
- Pao, Y.H. A fracture mechanics approach to thermal fatigue life prediction of solder joints. I EEE Trans. Compon. Hybrid. Manuf. Technol. 1990, 203, 559–570. [Google Scholar]
- Pettersson, G.; Barsoum, Z. Finite element analysis and fatigue design of a welded construction machinery component using different concepts. Eng. Fail. Anal. 2012, 26, 274–284. [Google Scholar] [CrossRef]
- Dong, P. A structural stress definition and numerical implementation for fatigue analysis of welded joints. Int. J. Fatigue 2001, 23, 865–876. [Google Scholar] [CrossRef]
- Knowles, J.K.; Eli, S. On a class of conservation laws in linearized and finite elastostatics. Arch. Ration. Mech. Anal. 1972, 44, 187–211. [Google Scholar] [CrossRef]
- Kövesdi, B.; Dunai, L. Fatigue life of girders with trapezoidally corrugated webs: An experimental study. Int. J. Fatigue 2014, 64, 22–32. [Google Scholar] [CrossRef]
- Kyuba, H.; Dong, P. Equilibrium-equivalent structural stress approach to fatigue analysis of a rectangular hollow section joint. Int. J. Fatigue 2005, 27, 85–94. [Google Scholar] [CrossRef]
- Hobbacher, A.F. Recommendations for fatigue design of welded joints and components; Springer: Basel, Switzerland, 2016. [Google Scholar]


| Failure Probability | A | B | Calculated Life (×104) |
|---|---|---|---|
| 1% | 11.185448 | −3.055853 | 10.12 |
| 5% | 11.442309 | 17.49 | |
| 20% | 11.817708 | 41.51 | |
| 50% | 12.185448 | 96.81 | |
| 80% | 12.553188 | 225.74 | |
| 95% | 12.928587 | 535.89 | |
| 99% | 13.166404 | 926.60 | |
| 61.79% | 12.316647 | −3.055853 | 130.95 |
| Plate Thickness (mm) | Yield Strength (MPa) | Tensile Strength (MPa) | Remarks |
|---|---|---|---|
| 6 | 373 | 542 | Web |
| 20 | 379 | 517 | Flange |
| Propagation Driving Force | Kink Criteria | Remarks |
|---|---|---|
| KI | MTS | * |
| MSS | ||
| GEN | ||
| SERR | * | |
| Kequ | MTS | |
| MSS | ||
| GEN | ||
| SERR | * |
| Number of Stages | Simulation Step | Remarks |
|---|---|---|
| 1 | 1~6 | Crack kinks |
| 2 | 7~9 | Crack approaches the weld toe |
| 3 | 10~50 | Crack enters the weld and approaching the web |
| 4 | 51~58 | Crack enters the web and the other side weld |
| 5 | 59~61 | Two edge cracks propagate toward different sides |
| 6 | 62~70 | One crack tears the north side flange |
| Propagation Scheme | Stage 1 | Stage 2 | Stage 3 | Stage 4 | Stage 5 | Stage 6 | Calculated Life | Test life | Error/% |
|---|---|---|---|---|---|---|---|---|---|
| KI + MTS | 3.57 | 8.80 | 100.71 | 7.89 | 0.86 | 0 | 121.83 | 130.95 | –6.96 |
| KI + SERR | 4.07 | 12.03 | 102.11 | 6.89 | 1.27 | 0 | 126.36 | –3.51 | |
| Kequ + SERR | 3.44 | 11.35 | 100.69 | 7.01 | 1.16 | 0 | 123.65 | –5.57 |
| Propagation Scheme | Stage 1 | Stage 2 | Stage 3 | Stage 4 | Stage 5 | Stage 6 | Stages 2, 3, and 4 |
|---|---|---|---|---|---|---|---|
| KI + MTS | 2.93 | 7.22 | 82.66 | 6.48 | 0.71 | 0 | 96.36 |
| KI + SERR | 3.21 | 9.52 | 80.81 | 5.45 | 1.01 | 0 | 95.75 |
| Kequ + SERR | 2.78 | 9.18 | 81.43 | 5.67 | 0.94 | 0 | 86.25 |
| Propagation Scheme | Stage 1 | Stage 2 | Stage 3 | Stage 4 | Stage 5 | Stage 6 | Stages 2, 3, and 4 |
|---|---|---|---|---|---|---|---|
| KI + MTS | 0.12 | 0.06 | 10.71 | 8.43 | / | / | 19.14 |
| KI + SERR | 0.09 | 0.08 | 11.41 | 7.53 | / | / | 18.67 |
| Kequ + SERR | 0.09 | 0.08 | 11.18 | 7.63 | / | / | 18.81 |
© 2019 by the authors. Licensee MDPI, Basel, Switzerland. This article is an open access article distributed under the terms and conditions of the Creative Commons Attribution (CC BY) license (http://creativecommons.org/licenses/by/4.0/).
Share and Cite
Wei, G.; Ye, F.; Li, S.; Chen, S. Analysis of the Fatigue Crack Evolution of Corrugated Web Girders. Metals 2019, 9, 869. https://doi.org/10.3390/met9080869
Wei G, Ye F, Li S, Chen S. Analysis of the Fatigue Crack Evolution of Corrugated Web Girders. Metals. 2019; 9(8):869. https://doi.org/10.3390/met9080869
Chicago/Turabian StyleWei, Guoqian, Fan Ye, Shanshan Li, and Siwen Chen. 2019. "Analysis of the Fatigue Crack Evolution of Corrugated Web Girders" Metals 9, no. 8: 869. https://doi.org/10.3390/met9080869
APA StyleWei, G., Ye, F., Li, S., & Chen, S. (2019). Analysis of the Fatigue Crack Evolution of Corrugated Web Girders. Metals, 9(8), 869. https://doi.org/10.3390/met9080869