Abstract
The effects of the Y- and Ti-containing inclusions on the tensile and impact properties of reduced activation ferritic martensitic (RAFM) steels were evaluated. Four steels with different Y and Ti contents were produced via vacuum induction melting. The size and quantity of inclusions in the steels were analyzed using scanning electron microscopy, and the oxide particle formation mechanism was clarified. These inclusions helped to enhance the pinning effect of the austenite grain boundaries based on the Zener pinning force. The average prior austenite grain sizes, measured via the linear intercept method, were 12.34 (0 wt.% Ti), 9.35 (0.010 wt.% Ti), 10.22 (0.030 wt.% Ti), and 11.83 (0.050 wt.% Ti) μm for the four steels, in order of increasing Ti content, respectively. Transmission electron microscopy was conducted to observe the fine carbides. The strength and impact properties of the steel containing 0.010 wt.% Ti were improved, and the ductile-to-brittle-transition temperature was reduced to −70.5 °C. The tensile strength and impact toughness of the steel with 0.050 wt.% Ti were significantly reduced due to the coarsening of both the inclusions and grain size, as well as the precipitation of large TiN inclusions. The RAFM steel with approximately 0.015 wt.% Y and 0.010 wt.% Ti exhibited an optimized combination of microstructures, tensile properties, and impact properties among the four steels.
1. Introduction
Reduced activation ferritic martensitic (RAFM) steels have been widely investigated as potential candidates for structural materials in future nuclear fusion reactors [1,2]. Several types of RAFM steels, such as Japanese F82H (8Cr-2W) and JLF-1 (9Cr-2W), European Eurofer97 (9Cr-1W), American 9Cr-2WVTa, and Chinese CLAM (China Low Activation Martensitic steel) and CLF-1, have been developed in various countries [3,4]. However, the elements that can be added to RAFM steel are limited due to its reduced activation [5], with current research primarily focusing on the addition of yttrium (Y) and titanium (Ti) to RAFM steel. Ou and Lai [6] and Danielson and Hin [7] reported that the Y2O3 or Y–Ti–O particles in oxide dispersion-strengthened (ODS) RAFM steel can endure a high concentration of vacancies, thereby improving the radiation resistance of RAFM steels. This is because the vacancies could migrate to dispersion-distributed Y2O3 or Y–Ti–O particles and form stable clusters rather than grain boundaries, resulting in reduced vacancies in the matrix and improving the radiation resistance and mechanical properties of the alloys. Li and Huang [8] reported that the addition of 0.2 wt.% Y to CLAM steel can degrade the mechanical properties of the steel; however, this increases its radiation resistance. Shi [9] added the microscale Y2O3 particles directly into steel via vacuum casting; the alloy matrix is strengthened because of the presence of complex oxides, and Y2O3 positively affects the inhibition of dislocation gliding. Lee [10] and Kim [11] investigated the effects of Ti on the microstructural stability and tensile properties of the RAFM steel and noted that the yield strength of the Ti-added RAFM steel (Ti–RAFM) is high because of additional precipitation hardening from the Ti-rich MX particles. However, the aforementioned studies only dealt with a single element (Y or Ti). Only few reports exist on RAFM steel with Y and Ti and the formation mechanism of the inclusions during the smelting process [8,9,12]. Hence, understanding the role of Y and Ti in the evolution of inclusions as well as the microstructure and properties of the RAFM steel is necessary. This study aimed to elucidate the oxide particle formation mechanism in steel with different Y and Ti contents and study the effects of the inclusions on the mechanical properties of 9Cr-RAFM steel.
2. Materials and Experiments
2.1. Materials
The chemical compositions of the analyzed steels are listed in Table 1. The steel was first melted using a vacuum induction furnace to form a 25-kg ingot that was hot forged and rolled. Before operating the vacuum induction furnace, pure iron, chromium (99.98 wt.%), tungsten (99.95 wt.%), and tantalum (99.91 wt.%) were inserted into the crucible. These alloys were melted under low pressure (below 15 Pa). Then the molten alloy was refined for 60 min at 1570 °C. Hereafter, C (99.5 wt.%), Si (99.95 wt.%), Mn (99.98 wt.%), V (99.95 wt.%), Ti (99.99 wt.%), and Y (99.9 wt.%) were sequentially added at 2-min intervals. After 5 min, all the alloys were observed to melt, and the molten steel was cast under argon protection at 1520 °C. All the pure alloys were provided by boyu company. Post high-temperature diffusion homogenization at 1200 °C for 60 min, the ingots were forged into 35 mm × 50 mm plates at an initial forging temperature of 1150 °C and a final forging temperature of 950 °C; further, they were hot-rolled into 12-mm-thick plates at temperatures ranging from 950 °C to 1150 °C. The steel alloys were designated C1, C2, C3, and C4 (Table 1). The total O contents of the alloys were 24, 17, 12, and 10 ppm, respectively, with each possessing a N content of approximately 29 ppm. The heat treatment included austenitization at 1050 °C for 30 min, followed by air quenching, then tempering at 750 °C for 90 min, and finally air cooling to room temperature.

Table 1.
Chemical composition of the analyzed steel alloys (wt.%).
2.2. Inclusion Statistics
The particle size distribution in the polished cross-section of each sample cut from the ingots was observed using a scanning electron microscope (SEM, Zeiss, Jena, Germany) at 1000× magnification to obtain the inclusion density of the alloys. The observed area (Aobs) of each SEM image was 125 μm × 94 μm, and the total observed area of each sample (ATobs) ranged from 0.53 to 0.59 mm2, with 45–50 SEM images acquired for each sample. The number of particles per unit area (NA) and cross-sectional area of each particle (SA(i)) were measured using a semi-automatic image analyzer (Sience, Suzhou, China), where the diameter of each particle cross-section (dA(i)) was estimated to be [13]:
The NA value was determined using the measured number of particles (n) across Aobs, such that NA = n/Aobs. The method employed here was essentially the cross-section method.
The spatial (dV) and mean spatial () diameters of the spherical particles can be written as [14]:
and
where the π/2 coefficient is determined by the geometric relationship between a given three-dimensional diameter and the two-dimensional sections of the sphere, and is the harmonic mean diameter of the particle cross-section.
The number of particles per unit volume (NV) was calculated using [14]:
The formula for obtaining the volume fraction (fV) of spherical particles can be given as [14]:
The non-metallic inclusions were then analyzed using the SEM images.
2.3. High-Temperature Confocal Laser Scanning Microscopy (CLSM)
The VL2000DX–SVF17SP CLSM (Yonekura, Osaka, Japan) was used in an inert gas atmosphere (argon, 6N) to obtain high-quality sample micrographs, and the effect of inclusions on austenitization was investigated. The cylindrical samples (diameter 4 mm, thickness 6 mm) were first heated to 1050 °C during controlled heating at a rate of 5 °C/s and subsequently held for 10 min. SEM images of the samples were then acquired after air cooling to room temperature.
2.4. Mechanical Properties
The specimens that were spark machined from the 12-mm-thick heat treatment plates, parallel to the rolling direction, were used for tensile tests from room temperature to 650 °C. Round-bar tensile specimens, with a 5 mm × 25 mm gauge section, were tested. The yield strength was defined as the 0.2% proof strength in this study. An AG-X250kN electronic universal material testing machine (Shimadzu, Kyoto, Japan) was used for the tensile tests. The Charpy impact test was conducted with full-size V-notched samples (10 × 10 × 55 mm) using an MTS-ZBC2452-B pendulum impact tester (MTS, Eden Prairie, MN, USA); the ductile–brittle transition behavior of the samples was evaluated using a pendulum impact tester in the range of −130 °C to 25 °C. A CDY-80A cryogenic container (Beiyou, Beijing, China) was used to cool the V-notched samples.
2.5. Microscopy Observation
The specimens are etched with a mixed solution of alcohol (100 mL) and muriatic acid (5 mL) and picric acid (1 g) for optical microscopy (Leica, Solms, Germany) and scanning electron microscopy (Zeiss, Jena, Germany). The macro- and micro-views of the fracture surfaces were observed using SEM–energy dispersive X-ray spectroscopy (EDS). The fine carbides in the steel were observed using a transmission electron microscope (TEM) (FEI, Hillsboro, OR, USA). The TEM samples were first mechanically polished and then subjected to twin-jet-polishing with a 7-vol.% perchloric acid ethanol solution. TenuPol-5 jet polishing (Struers, Copenhagen, Denmark) was used to prepare the TEM samples.
3. Results and Discussion
3.1. Inclusions in the Steel Ingots
Figure 1 and Table 2 provide the statistical results of the micron dimension inclusions in ingots. There were few inclusions that were larger than 5 μm in the C1, C2, and C3 alloys, as shown in Figure 1, with a majority of the inclusions in these three alloys (>85% in every sample) smaller than 2 µm. The inclusions in the C4 alloy were much larger than those in the other three steel alloys, with some inclusions larger than 5 μm. Table 2 shows the statistical results (, fV, and NV) of the observed inclusions in the ingots. An increase in was observed from 1.35 to 1.89 μm and a decrease in NV was observed from 4.63 × 10¹⁴ to 1.93 × 10¹⁴ m−3 with increasing Ti content. Similar results were also observed in ODS steels containing Y and Ti [10]. The 9Cr-RAFM steels with Y and Ti primarily contain microscale inclusions that are much smaller than those reported in RAFM steels containing Y [9]. These latter steels contained some inclusions that were larger than 10 μm. As shown in Table 2, the average spacing of inclusions () decreased with the increasing Ti content, which indicates that the dispersion of inclusions deteriorated.
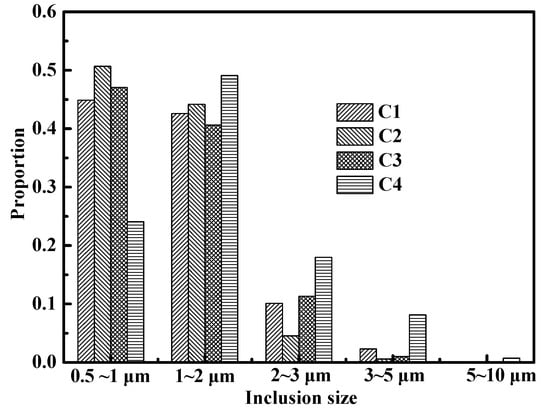
Figure 1.
Inclusion size distribution for the four steel alloys.
Table 2.
Statistics of the inclusions in the steel ingots.
The composition of the inclusions in these alloys was determined via SEM–EDS. More than 30 inclusions were checked in each sample. Figure 2 shows the micromorphology and composition of typical inclusions in ingots. The inclusions in the C1 alloy were generally regular spherical particles with a core and a shell, as shown in Figure 2a. They were primarily composed of a Y–O–S core covered with Y–O (Figure 2a), indicating that Y may first react with S and then with O. The typical inclusions in the C2 alloy were Y–Ti–O inclusions (Figure 2b) and inclusions that contained a Y–Ti–Mn–O–S core covered with MnS (Figure 2c). MnS inclusions was precipitated during solidification, which has been shown by many researchers [15,16]. In addition, Y might be easier to combine with Ti and O. Similar types of inclusions were observed in the C3 and C4 alloys. These contained a Y–Ti–O core covered with Y–O (Figure 2d), a Y–Ti–O–S core covered with Y–O–S (Figure 2e,h), a Y–Ti–S–O core covered with Y–O (Figure 2g), and a Y–Ti–O–S core covered with square TiN (Figure 2f,i), which precipitated during solidification [17,18]. The Ti mass fraction for the inclusions in the C3 alloy was higher than that for the inclusions in the C4 alloy.
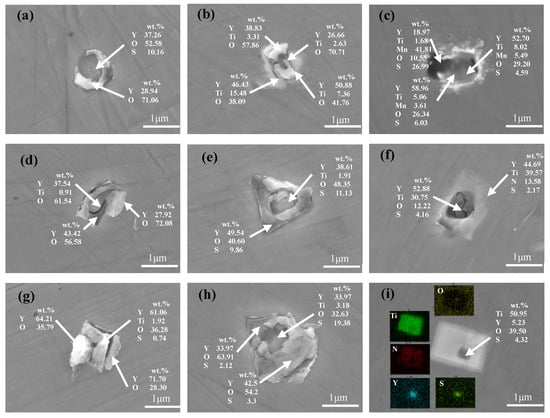
Figure 2.
Typical inclusion morphologies in the alloys: (a) C1; (b,c) C2; (d–f) C3; and (g–i) C4.
Line scanning was conducted to study the inclusions and further elucidate the oxide particle formation mechanism. Figure 3 shows the line scanning results of the typical inclusion. A Y–Ti–Mn–O–S core covered with MnS is shown in Figure 3a, while a Y–Ti–O–S core covered with square TiN is shown in Figure 3b. The Ti mass fraction was parabolic across the inclusion, with the lowest mass fraction observed in the center of the inclusion. A small N mass fraction was also observed on the right side of the inclusion. These cladded inclusions are generally considered detrimental to the mechanical properties of RAFM steel [19]. The primary type of inclusion, a Y–Ti–S–O core covered with Y–O, as shown in Figure 3c, possessed an O mass fraction with three peaks across the inclusion that correspond to its center and edges. A small Ti mass fraction was also observed in the center of the inclusion, as well as more uniform distributions of Y and S. Figure 4 shows schematics of the evolution of the inclusions during the steel fabrication process. Rare earth elements added into the steel would react with [S], [O], and Ti–O in the molten steel. Y first reacted with [S] to form the Y–S core then reacted with [O] to form the Y–O shell, which is shown in Figure 4a. When Ti was added, Y reacted with Ti–O to form Y–Ti–O (Figure 4b). As shown in Figure 4c, MnS precipitated as a shell for Y–Ti–O during solidification, which is often found in steels containing Mn [20]. The Y–Ti–O–S phase in steel continued to react with [O] and [S] in steel to form Y–O or Y–S–O inclusions (Figure 4d). When excessive Ti was added, [Ti] reacted with [N] to form TiN, which is shown in Figure 4e.
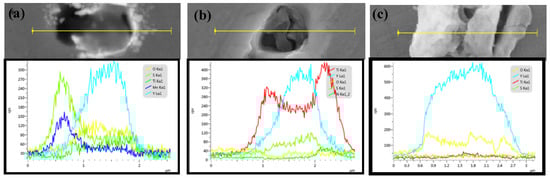
Figure 3.
The line scanning results of the typical inclusions in the steel alloys: (a) C2, (b) C3, and (c) C4.
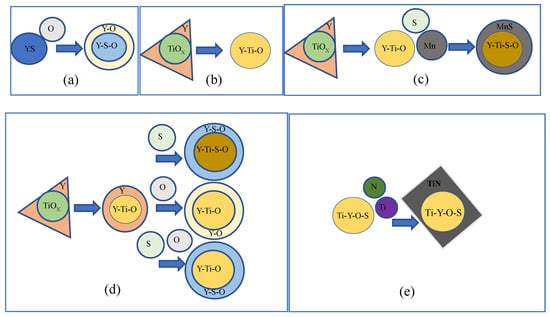
Figure 4.
Schematic of the evolution of various inclusions in the experimental steel alloys. (a) Y-S-O; (b) Y-Ti-O; (c) Y-Ti-Mn-S-O; (d) Y-Ti-S-O; (e) Y-Ti-O-S-N.
3.2. Particle Effects on Austenite Grain Size
The grain size of all specimens remained the same after 5 min of heating. The CSLM and SEM results of the samples heated for 10 min at 1050 °C are shown in Figure 5. Numerous inclusions were observed at the grain boundary of the steel alloys (Figure 5e–h). Many investigators have revealed the inhibiting effect of the second phase particles on grain growth, both theoretically and experimentally [21,22]. These inclusions could help to strengthen the pinning effect of the austenite grain boundaries based on the Zener pinning force. Gladman [23] indicated the pinning effect of second-phase particles on austenite grains and expressed the pinning effect as:
where DC is the grain diameter and Z is the inhomogeneity factor. This relationship suggests that fV has an inverse effect on DC, whereas has a similar effect on DC. Based on the data in Table 2, the grain sizes of the steels can be expressed as , , and for the four steels, in order of increasing Ti content, respectively, where A is a constant, 10−8. This result is considered to be agreeable with the observed grain size in Figure 5a–d. The grain sizes of the alloys were 25, 15, 19, and 22 μm for the C1, C2, C3, and C4 alloys, respectively.
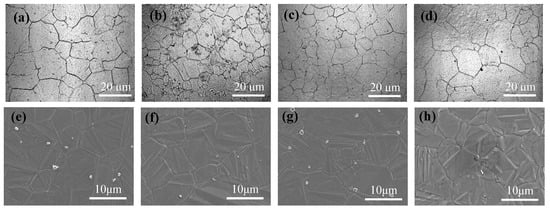
Figure 5.
CLSM and SEM results of the samples heated for 10 min at 1050 °C: (a–d) CLSM; (e–h) SEM; (a,e) C1; (b,f) C2; (c,g) C3; and (d,h) C4.
The types of inclusions near the grain boundary were also ascertained using SEM–EDS, as shown in Figure 6. The largest inclusion size was observed in the C4 alloy, with smaller inclusions observed in the C2 (Figure 6b) and C3 (Figure 6c) alloys. Based on the results in Section 3.1, the inclusions in the C1 alloy primarily contained a Y–O–S core covered with MnS (Figure 6a). No inclusions containing MnS were found in the other alloys. The inclusions in the C4 alloy primarily contained a Y–Ti–O core covered with TiN (Figure 6d). These inclusions had a pinning effect, which could refine the structure, and the refining effect exhibited the Zener relation.
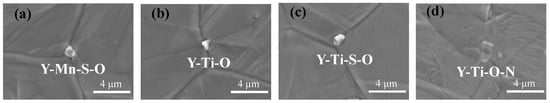
Figure 6.
SEM images of the inclusions observed in experiment: (a) C1, (b) C2, (c) C3, and (d) C4.
3.3. Microstructure and Precipitates
The microstructures of the steels are shown in Figure 7a–d. Typical martensitic structures were observed, with no evidence of delta-ferrite in these four steels. The average initial austenite grain sizes, measured using the linear intercept method, were 12.34 (0 wt.% Ti), 9.35 (0.010 wt.% Ti), 10.22 (0.030 wt.% Ti), and 11.83 (0.050 wt.% Ti) μm for the four steels, in order of increasing Ti content, respectively, which were significantly smaller than the CLAM grain sizes (20–30 μm) [24]. The inclusions in the alloys significantly affected the austenite grain sizes of the steels, as indicated by the CLSM results. As shown in Figure 7e–h, M23C6 precipitated both in the lath and prior austenite grain boundaries, and a few MC carbides were randomly distributed in the matrix, in agreement with observations in other ferritic/martensitic steels [25]. It is well known that MX precipitates play a significant role in determining the mechanical properties of steel. More MX can be observed in the Ti–RAFM steels [8,9,12]. The carbides in the C2 alloy were much finer than those in the other alloys. Some M23C6 carbides larger than 0.5 μm could be found in the C3 and C4 alloys.
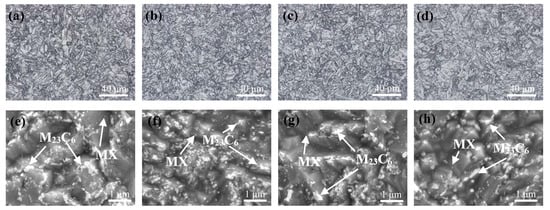
Figure 7.
Microstructures (a–d) and precipitates (e–h) of the tempered RAFM steels: (a,e) C1; (b,f) C2; (c,g) C3; and (d,h) C4.
The precipitated phases in RAFM steels were primarily considered to be type M23C6 and MX carbides [26]. The average particle size of MX precipitation was 20–50 nm, which could effectively improve its high-temperature creep performance. For example, Ta-rich MX carbides possess the most effective heat-strengthened phase in heat-resistant steel. Figure 8 indicates typical TEM micrographs of the normalized and tempered steels.
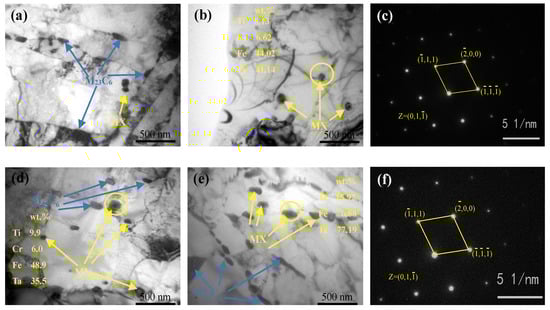
Figure 8.
Precipitates of the tempered RAFM steels: (a) C1 and (b) C2; (c) corresponding fast Fourier transform (FFT) image of the MX carbides in C2, (d) C3, and (e) C4; and (f) corresponding FFT image of the MX carbides in C4.
Figure 8a reveals the M23C6 (50–200 nm) and MX (15–30 nm) carbides in the C1 alloy, and only a small amount of MX precipitates were present. Figure 8b,d,e present the precipitate distribution in the C2, C3, and C4 alloys, respectively, which have more MX carbides in their intragranular regions than the C1 alloy. No significant difference was observed in the size of M23C6 in the alloys. The MX carbide size increased with increasing Ti content, with MX carbides that were larger than 200 nm present in the C4 alloy. The size of MX in the C2 alloy was 20–50 nm and that of C3 was 20–100 nm. This suggests that Ti promoted MX precipitation, which is in agreement with C. H. Lee [10], H. K. Kim [11], and Y. P Zhang [27]. EDS showed that Ti and Ta elements were present in the MX carbides in the C2–C4 alloys. The corresponding fast Fourier transform (FFT) images of the MX carbides in the C2 and C4 alloys are presented in Figure 8c,f, which highlight the face-centered cubic structure of these precipitates. Based on EDS and the diffraction pattern, the precipitates were identified as (Ti, Ta) C. Coarsened MX would harm the strength and fracture toughness of the alloy. In addition, the larger inclusions in C3 and C4 alloys should have the most damaging effect on mechanical properties.
3.4. Tensile Test
Figure 9 shows the comparison of the tensile performances between the RAFM steels at different test temperatures. The tensile strength (TS) and 0.2% offset yield strength (YS) of all the steels showed a decreasing trend with increasing temperature, as shown in Figure 9a,b. The elongation (Figure 9c) first decreased and then increased as the temperature increased, with an inflection point at 300 °C, as observed in other RAFM steels [28,29]. The room temperature tensile properties of these samples were closely related with the Ti content. As shown in Figure 9b, the YS increased from 559.6 to 575.4 MPa when 0.010% Ti was added. An increase in the Ti content from 0.010 wt.% to 0.050 wt.% yielded a decrease in YS and TS from 575.4 to 491.7 MPa and from 703.1 to 618.8 MPa, respectively. The mechanical performance of the C4 alloy was the poorest among the four alloys. However, the TS and YS of the other three steels were all higher than those of CLAM [28], EUROFER 97 [30], and JLF-1 [31] steels. The RAFM steels with Y and Ti had good plasticity, with the smaller grain size and finer inclusions being the main reasons for this improvement.
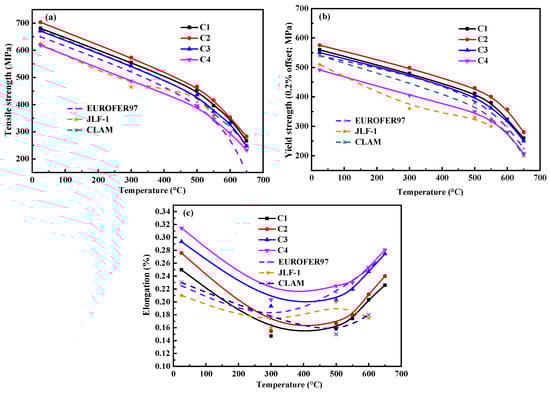
Figure 9.
Tensile properties of the steels: (a) tensile strength, (b) YS, and (c) elongation. The data for Eurofer 97 [30], JLF-1 [31], and CLAM [28] are provided for comparison to the steel alloys analyzed in this study.
As the inclusions (I) and matrix (M) have different structures and characteristics, they perform differently during stretching. The contradiction between inclusions (I) and matrix (M) is often intensified at the interface to form stress concentration, such that holes being formed, causing fracture. The characteristics of inclusions in the steels are summarized as follows [32]: Small elastic modulus, low YS, plastic deformation, and weak I–M interface bonding force belong to sulfides. The characteristics of oxide and nitride are large elastic modulus and YS, respectively. The main cracking mode of sulfide is self-cracking [33]. The larger the size of the sulfide, the more are the cracking strips. Cracks can be formed in two ways in nitride inclusions: self-cracking and interface cracking, which vary with the size of the nitride [33]. Inclusions with high I–M interfacial bonding force could avoid early stress concentration to hinder or delay the formation of primary and regenerated micropores such that greater plasticity and deformation strengthening are obtained for the alloy. Therefore, improving purity; reducing inclusions; controlling the shape, size, and distribution of inclusions in steel; and adding rare earth and other surface-active elements to improve the I–M interface bonding force could suppress the adverse effects of inclusions, thereby improving the strength and toughness of steel.
The microstructures of the tensile fracture of the tested steel alloys at room temperature are shown in Figure 10. Tear fractures (Figure 10a–d) were observed in each of the steels, with fiber, radiation, and shear lip areas present in each specimen. Microviews of the fracture surfaces are shown in Figure 10e–h. The spiral bands resulting from the accumulation of shear stress around the particles were observed in the dimple walls, and the sample exhibited increasing ductility and toughness as the dimples expanded and deepened under tensile stress. There were primarily larger equiaxial dimples on the C1 and C3 alloys, with some dimples greater than 5 μm in size. However, the dimples on the C2 alloy were smaller and more uniform in size, possessing the smallest dimples of the analyzed alloys. The C2 alloy also exhibited good mechanical properties. Some square (1–3 μm) inclusions were observed in the C4 alloy, which may be the main reason why the C4 alloy exhibited the worst mechanical properties, even though it possessed a small grain size. More details of the inclusions in the dimples are shown in Figure 10i–l with the compositions of the typical inclusions. The typical inclusions in the C1 alloy were mainly Y–Mn–Ta–O–S–C inclusions that were larger than 3 μm. These inclusions with weak I–M interface bonding forces broke during stretching to form holes. The addition of Ti yielded primarily fine Y–Ti–Mn–Ta–O–S–C inclusions in the C2 that were less than 2 μm. Shi et al. [9] reported that these inclusions had a remarkable effect on the dispersion strengthening of steel. The Ti content in the inclusions increased as the Ti content of the steel increased, and the inclusions coarsened. Some larger inclusions that contained N were observed in the C3 and C4 alloys. The larger square TiN inclusions in the C3 and C4 alloys easily caused a stress concentration at the I–M interface, thus forming cracks.
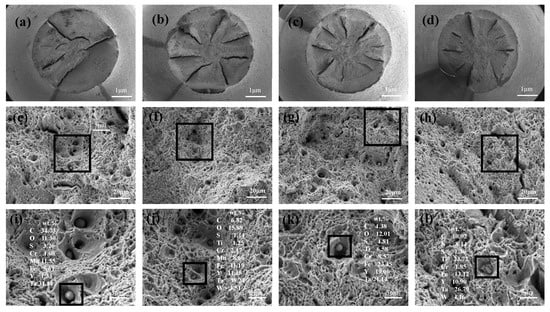
Figure 10.
Macro- and micro-views of the fracture surfaces: (a,e,i) C1; (b,f,j) C2; (c,g,k) C3; and (d,h,l) C4.
The fracture process of a given material occurs in three stages: crack initiation, crack propagation in an individual grain, and crack propagation through the grain boundary to an adjacent grain boundary. The shapes of the large secondary particles had a significant impact on microcrack formation, with stress concentrations more readily occurring along the sharp edges and corners of brittle secondary particles, thereby facilitating microcracking. The TiN inclusions, which possessed a square geometry, were found in the dimples of the C4 alloy. Cracks can easily initiate at a corner of a TiN inclusion and/or at the inclusion–matrix interface, and then propagate through the steel. The fracture propagation stress (σf) of a crack that nucleates within a second particle is given by [34]:
where E is the elastic modulus, is the effective surface energy of the matrix, is the Poisson’s ratio, and is the mean second-particle thickness. Large TiN inclusions reduce the energy required for crack propagation, thereby facilitating crack propagation. The C4 alloy, which contained the largest TiN content in the matrix, possessed the worst mechanical properties among the four steel alloys.
3.5. Charpy Impact Test
The presence of low angle block and lath boundaries, and dislocation substructures in martensitic steels, were ineffective in resisting cleavage crack propagation, which reduced the Charpy toughness of the material. The Charpy impact transition curves of the samples with different Y and Ti contents are presented in Figure 11. The transition curves were determined by fitting the “Boltzmann” function [35] to the average values of the Charpy impact energy–test temperature data (Figure 11). The upper shelf regime and the transition temperature regime can be obtained from Figure 11. As shown in Table 3, the upper shelf energies (USE) first increased and then decreased with an increase in the Ti content, with the C2 alloy possessing the maximum USE value. The ductile-to-brittle-transition temperatures (DBTTs) followed a similar trend. The USEs of these four steel samples were higher than those for F82H and EURFER97 steels, as seen in a comparison graph (Figure 11) between C1–4 and CLAM [28], EUROFER97 [30], and F82H [28,36] steels. It can be seen that the impact energies of C2 and C3 alloys were higher than these of CLAM, EUROFER97, and F82H steels at all the test temperatures. The impact energies of EUROFER97 and F82H alloys were lower than those of C1 and C4 alloys at all the test temperatures. The factors affecting the Charpy toughness of the material included: (a) the grain size, with smaller grain sizes increasing the Charpy toughness in the cleavage-dominated fracture regions; and (b) the type of inclusion boundaries, with regular boundaries hindering the initiation of cracks between the inclusions and matrix, thereby improving the Charpy toughness. The best impact properties belonged to the C2 alloy, which had the smallest grain size, and the finest regular inclusions and carbides. The USEs and DBTTs results are summarized in Figure 12, with the C2 alloy clearly identified as having an excellent impact toughness.
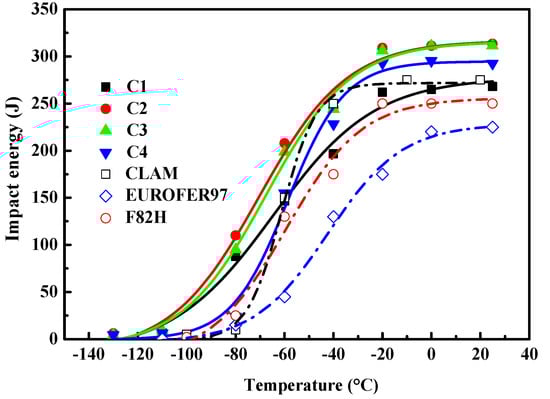
Figure 11.
The variation in impact energy of the RAFM steels with test temperature.
Table 3.
Upper shelf energies (USEs) and ductile-to-brittle-transition temperatures (DBTTs) obtained from the Charpy impact tests.
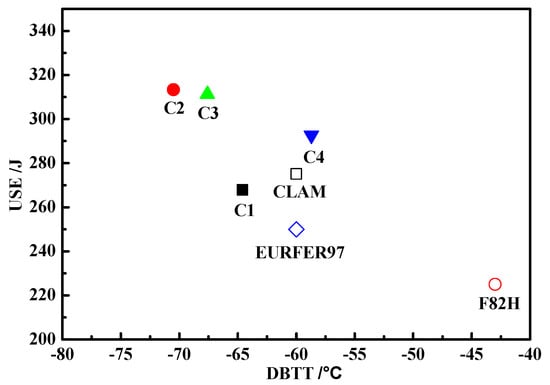
Figure 12.
USEs and DBTTs of the alloys.
4. Conclusions
The effects of alloying elements on inclusions, microstructures, and the mechanical performances of 9Cr-RAFM steels were extensively illustrated, with the following results obtained from this analysis:
- (1)
- The 9Cr-RAFM steels primarily contained microscale inclusions. The addition of Ti decreased the average spatial diameter of the inclusions for the formation of new particles with Y and Ti. The average spatial diameter of the inclusions decreased from 1.44 to 1.35 μm and the inclusion densities increased from 2.84 × 10¹⁴ to 4.63 × 10¹⁴ m−3.
- (2)
- The addition of Y led to reactions with the Ti–O inclusions to form inclusions with a Ti–Y–O core. Y then continued to react with O or S to form the outer layer of the inclusion. Some TiN inclusions were precipitated during solidification.
- (3)
- The addition of Ti could precipitate as fine (Ti, Ta) C carbide that was 50–200 nm in size, with much finer carbides observed in the C2 alloy.
- (4)
- The addition of Ti (0.010 wt.%) improved the tensile strength (TS) and impact toughness of the steel alloys and reduced the DBTT, which could be attributed to the refinement of the austenite grains and the inclusions. However, the TS and the impact toughness remarkably decreased as the Ti content increased from 0.01 wt.% to 0.050 wt.%, owing to the coarsening of both the inclusions and grain size, as well as the precipitation of large TiN inclusions.
Author Contributions
Data curation, G.Q., M.Q. and Y.Y.; Funding acquisition, D.Z. and H.Z.; Investigation, G.Q.; Project administration, C.L.; Resources, C.L. and Z.J.; Supervision, M.Q. and Y.Y.; Writing—original draft, G.Q.; Writing—review & editing, D.Z. and H.Z.
Funding
The authors are grateful for the support from the National Natural Science Foundation of China (No. 51574063, 51874081), Fundamental Research Funds for the Central Universities (N150204012), and Liaoning Province Doctoral Research Initiation Fund Guidance Project (No. 20170520079).
Conflicts of Interest
The authors declare no conflict of interest.
References
- Sandim, M.J.R.; Souza Filho, I.R.; Bredda, E.H.; Kostka, A.; Raabe, D.; Sandim, H.R.Z. Coarsening of Y-rich oxide particles in 9%Cr-ODS Eurofer steel annealed at 1350 °C. J. Nucl. Mater. 2017, 484, 283–287. [Google Scholar] [CrossRef]
- Oliveira, V.B.; Zilnyk, K.D.; Sandim, H.R.Z. Thermodynamic Simulation of Reduced Activation Ferritic–Martensitic Eurofer-97 Steel. J. Phase Equilib. Diff. 2017, 38, 1–9. [Google Scholar] [CrossRef]
- Sokolov, M.A.; Kimura, A.; Tanigawa, H.; Jitsukawa, S. Fracture toughness characterization of JLF-1 steel after irradiation in HFIR to 5 dpa. J. Nucl. Mater. 2007, 367, 644–647. [Google Scholar] [CrossRef]
- Wang, B.; Liu, L.B.; Xiang, L.X.; Rao, Y.C.; Ye, X.Q.; Chen, C.A. Diffusive transport parameters of deuterium through China reduced activation ferritic-martensitic steels. J. Nucl. Mater. 2016, 470, 30–33. [Google Scholar] [CrossRef]
- Shankar, V.; Mariappan, K.; Nagesha, A.; Reddy, G.P.; Sandhya, R.; Mathew, M.D.; Jayakumar, T. Low Cycle Fatigue and Creep-Fatigue Interaction Behaviour of Reduced Activation Ferritic Martensitic (RAFM) Steels with Varying W and Ta Contents. Adv. Mater. Res. 2014, 891–892, 383–388. [Google Scholar]
- Ou, Y.D.; Lai, W.S. Vacancy formation and clustering behavior in Y2O3 by first principles. Nucl. Instrum. Meth. B 2011, 269, 1720–1723. [Google Scholar] [CrossRef]
- Danielson, T.; Hin, C. Structural and electronic effects of helium interstitials in Y2Ti2O7: A first-principles study. J. Nucl. Mater. 2014, 452, 189–196. [Google Scholar] [CrossRef]
- Huang, Q.; Li, C.; Li, Y.; Chen, M.; Zhang, M.; Peng, L.; Zhu, Z.; Song, Y.; Gao, S. Progress in development of China low activation martensitic steel for fusion application. J. Nucl. Mater. 2007, 367–370, 142–146. [Google Scholar] [CrossRef]
- Shi, Z.M.; Han, F. The microstructure and mechanical properties of micro-scale Y2O3 strengthened 9Cr steel fabricated by vacuum casting. Mater. Design 2015, 66, 304–308. [Google Scholar] [CrossRef]
- Lee, C.H.; Park, J.Y.; Seol, W.K.; Moon, J.; Lee, T.H.; Kang, N.H.; Kim, H.C. Microstructure and tensile and Charpy impact properties of reduced activation ferritic–martensitic steel with Ti. Fusion Eng. Des. 2017, 124, 953–957. [Google Scholar] [CrossRef]
- Kim, H.K.; Lee, J.W.; Moon, J.; Lee, C.H.; Hong, H.U. Effects of Ti and Ta addition on microstructure stability and tensile properties of reduced activation ferritic/martensitic steel for nuclear fusion reactors. J. Nucl. Mater. 2018, 500, 327–336. [Google Scholar] [CrossRef]
- Zhan, D.P.; Qiu, G.X.; Jiang, Z.H.; Zhang, H.S. Effect of Yttrium and Titanium on Inclusions and the Mechanical Properties of 9Cr RAFM Steel Fabricated by Vacuum Melting. Steel Res. Int. 2017, 88, 1–8. [Google Scholar] [CrossRef]
- Sakata, K.; Suito, H. Grain-growth-inhibiting effects of primary inclusion particles of ZrO2, and MgO in Fe-10 mass pct Ni alloy. Metall. Mater. Trans. A 2000, 31, 1213–1223. [Google Scholar] [CrossRef]
- Karasev, A.; Suito, H. Analysis of size distributions of primary oxide inclusions in Fe-10 mass Pct Ni-M, (M=Si, Ti, Al, Zr, and Ce) alloy. Metall. Mater. Trans. B 1999, 30, 259–270. [Google Scholar] [CrossRef]
- Wakoh, M.; Sawai, T.; Mizoguchi, S. Effect of S Content on the MnS Precipitation in Steel with Oxide Nuclei. ISIJ Int. 1996, 36, 1014–1021. [Google Scholar] [CrossRef]
- Oikawa, K.; Ohtanl, H.; Ishids, K.; Nishizawa, T. The Control of the Morphology of MnS Inclusions in Steel during Solidification. ISIJ Int. 2007, 35, 402–408. [Google Scholar] [CrossRef]
- Chou, W.J.; Yu, G.P.; Huang, J.H. Mechanical properties of TiN thin film coatings on 304 stainless steel substrates. Surf. Coat Technol. 2002, 149, 7–13. [Google Scholar] [CrossRef]
- Arai, T.; Fujita, H.; Oguri, K. Plasma-assisted chemical vapour deposition of TiN and TiC on steel: Properties of coatings. Thin Solid Films 1988, 165, 139–148. [Google Scholar] [CrossRef]
- Paik, S.M.; Hong, S.I.; Kim, T.K. Effects of N concentration on the tensile and impact properties of 9Cr-lW steels. J. Korean Inst. Met. MA 2013, 52, 713–719. [Google Scholar]
- Meng, Q.; Frankel, G.S.; Colijn, H.O.; Goss, S.H. Metallurgy: Stainless-steel corrosion and MnS inclusions. Nature 2003, 424, 389–390. [Google Scholar] [CrossRef]
- Qiu, G.X.; Zhan, D.P.; Li, C.S.; Qi, M.; Jiang, Z.H.; Zhang, H.S. Effects of yttrium on microstructure and properties of reduced activation ferritic martensitic steel. Mater. Sci. Tech. 2018, 34, 2018–2029. [Google Scholar] [CrossRef]
- Zhu, K.; Jang, Y.; Wang, R.Z.; Yang, Z.G. Effect of Mg Addition on Inhibiting Austenite Grain Growth in Heat Affected Zones of Ti-Bearing Low Carbon Steels. J. Iron Steel Res. Int. 2011, 18, 60–64. [Google Scholar] [CrossRef]
- Isselin, J.; Kasada, R.; Kimura, A. Corrosion behaviour of 16%Cr–4%Al and 16%Cr ODS ferritic steels under different metallurgical conditions in a supercritical water environment. Corros. Sci. 2010, 52, 3266–3270. [Google Scholar] [CrossRef]
- Zhong, Z.Y.; Saka, H.; Kim, T.H.; Holm, E.A.; Han, Y.F.; Xie, X.S. The Structure and Properties of Low Activation Ferritic/Martensitic Steels. Mater. Sci. Forum 2005, 475–479, 1383–1386. [Google Scholar]
- Kaneko, K.; Matsumura, S.; Sadakata, A.; Fujita, K.; Moon, W.J.; Ozaki, S.; Nishimura, N.; Tomokiyo, Y. Characterization of carbides at different boundaries of 9Cr-steel. Mater. Sci. Eng. A 2004, 374, 82–89. [Google Scholar] [CrossRef]
- Chen, J.G.; Liu, Y.C.; Xiao, Y.T.; Liu, Y.H.; Liu, C.X.; Li, H.J. Improvement of High-Temperature Mechanical Properties of Low-Carbon RAFM Steel by MX, Precipitates. Acta Metall. Sin. 2018, 31, 706–712. [Google Scholar] [CrossRef]
- Zhang, Y.P.; Zhan, D.P.; Qi, X.W.; Jiang, Z.H.; Zhang, H.S. Effect of the Combined Addition of Y and Ti on the Second Phase and Mechanical Properties of China Low-Activation Martensitic Steel. J. Mater. Eng. Perform. 2018, 27, 2239–2246. [Google Scholar] [CrossRef]
- Li, H.J.; Wu, H.B.; Tang, D. Microstructure, properties and strengthening mechanism of China low activation Martensitic steel. Chin. J. Eng. 2011, 33, 166–171. [Google Scholar]
- Filacchioni, G.; Casagrande, E.; De Angelis, U.; De Santis, G.; Ferrara, D.; Pilloni, L. Tensile and impact behaviour of BATMAN II steels, Ti-bearing reduced activation martensitic alloys. J. Nucl. Mater. 1999, 271–272, 445–449. [Google Scholar] [CrossRef]
- Chun, Y.B.; Kang, S.H.; Lee, D.W.; Cho, S.; Jeong, Y.H.; Zywczak, A.; Rhee, C.K. Development of Zr-containing advanced reduced-activation alloy (ARAA) as structural material for fusion reactors. Fusion Eng. Des. 2016, 109–111, 629–633. [Google Scholar] [CrossRef]
- Huang, Q.Y.; Li, C.; Li, Y. R&D status of China low activation martensitic steel. Chin. J. Nucl. Sci. Eng. 2007, 27, 41–50. [Google Scholar]
- He, Z.R. Deformation and Fracture of Micro-Zone Adjacent to Interface in Steels Part l-Deformation and Fracture in the Region Adjacent to the Interface between Inclusion and Matrix. J. Fuzhou Univ. 1993, 21, 56–62. [Google Scholar]
- Wei, C.F. Effect of Non-Metallic Inclusions on the Cracks nucleation and propagation in 42CrMo sttel. J. Sichuang Univ. 1994, 13, 30–35. [Google Scholar]
- Rawal, S.P.; Gurland, J. Observations on the effect of cementite particles on the fracture toughness of spheroidized carbon steels. Mater. Trans. 1977, 8, 691–698. [Google Scholar] [CrossRef]
- Wan, Q.M.; Wang, R.S.; Shu, G.G.; Weng, L.K. Analysis method of Charpy V-notch impact data before and after electron beam welding reconstitution. Nucl. Eng. Des. 2011, 241, 459–463. [Google Scholar] [CrossRef]
- Schäefer, L. Tensile and impact behavior of the reduced-activation steels OPTIFER and F82H mod. J. Nucl. Mater. 2000, 283–287, 707–710. [Google Scholar] [CrossRef]
© 2019 by the authors. Licensee MDPI, Basel, Switzerland. This article is an open access article distributed under the terms and conditions of the Creative Commons Attribution (CC BY) license (http://creativecommons.org/licenses/by/4.0/).