Article

Physical and Theoretical Modeling of the Nitrogen Content of Duplex Stainless Steel Weld Metal: Shielding Gas Composition and Heat Input Effects

Department of Materials Science and Engineering, Budapest University of Technology and Economics, H-1111 Budapest, Hungary
*
Author to whom correspondence should be addressed.
Metals 2019, 9(7), 762; https://doi.org/10.3390/met9070762
Submission received: 13 June 2019 / Revised: 3 July 2019 / Accepted: 4 July 2019 / Published: 7 July 2019
(This article belongs to the Special Issue Joining of Advanced High Strength Steels for the Automotive Industry)

Abstract

:
Duplex stainless steels (DSSs) are gaining more and more attention in corrosion-resistant applications and also in the transport and automotive industry. The outstanding mechanical and corrosion properties of DSSs highly depends on the austenite-to-ferrite phase balance (A/F). This phase ratio can shift in a large scale during welding. Thus, the heat input and the shielding gas composition should be optimized. Nitrogen addition to argon shielding is frequently used in DSS welding, because it is a potent austenite former. The dissolved nitrogen content in the heat-affected zone and the weld metal (WM) predetermines the A/F. To determine the effect of heat input and nitrogen content in shielding gas, two different heat inputs and six different gas compositions were used in autogenous tungsten inert gas welding. An improved theoretical model was established in order to simulate the WM dissolved nitrogen content, which calculates it with less error than the initial models. The correlation between nitrogen content and arc voltage was also determined. This improved model delivers the basics for shielding gas selection and the subsequent weld design for optimal A/F for industrial applications.

1. Introduction

Among the growing application of high strength steels [1,2,3,4], duplex stainless steels (DSSs) are gaining increasing attention from the chemical, petrol, and transportation [5,6,7] industries, thanks to their mechanical properties and corrosion resistance [8,9,10,11]. However, the industrial application of DSSs is in only ~1% among all the types of stainless steels [12]. One of the reasons for this is the weldability [9,13], which reduces the numbers of industrial applications. All of the DSSs solidify as delta ferrite (δ) [14]. The duplex austenitic (γ)–ferritic (δ) microstructure evolves during solid-state phase transformation [15,16,17,18]. The driving force of this transformation is the atomic nitrogen diffusion in the δ matrix. DSSs are nitrogen alloyed, not only because of metallurgical reasons (as nitrogen is a strong γ former) but also to increase mechanical properties, such as yield strength and also corrosion resistance [19,20]. Thus, the base materials’ (BMs) nitrogen content plays a significant role during DSS welding. During arc welding of DSSs, the nitrogen loss from the weld metal (WM) leads toward more ferritic microstructures and to the loss of the abovementioned properties [21,22]. In order to balance this nitrogen loss, nitrogen (N2)–argon (Ar) (or helium) mixed shielding gases are used in industrial applications for DSS tungsten inert gas (TIG) welding [23,24,25]. The N2 dissociates at the arc plasma temperature and the atomic nitrogen can dissolve in the molten pool [26]. During the solidification, this dissolved nitrogen (N) can enhance its γ forming effect on the δ → δ + γ phase transformation. However, for this diffusion-driven phase transformation, adequate diffusion time is needed, which is expressed in the cooling time between 1200 °C and 800 °C (Δt12/8) in the case of DSSs [27,28]. On one hand, if the cooling time is insufficiently short, the N can be entrapped in δ, forming different kinds of chromium nitrides (CrN or Cr2N) [16,29,30]. The reason for this is the significant solubility decrease of nitrogen in δ (~0.01 wt %) below ~700 °C [31]. On the other hand, if sufficient Δt12/8 time is provided after welding, the γ content is increasing with the amount of N (and the shielding gases’ N2 content) [32,33,34].
For the quantification of N dissolution during welding, different models exist. Du Toit developed a model for the quantification of nitrogen transfer during autogenous arc welding of austenitic stainless steels [35]. This kinetic model takes both nitrogen absorption and desorption into attention during welding; thus, her model can be used for N content prediction in the molten pool during welding in the case of austenitic stainless steels. In the case of DSSs, an improved model is needed for the solubility prediction, as DSSs have higher nitrogen content as an alloying element (>0.15 wt %), which is needed to be taken into account. Rokanopoulou et al. [36] recently modified this model for the case of DSS plasma arc welding (PAW). Their model is adequate for DSS molten pool N content prediction for lower nitrogen containing shielding gases, but sometimes, exaggerated results are given (such as N = 0.78%), which is over the equilibrium solubility limit of nitrogen in molten DSS grades. The possible reason for this is the complex interaction processes between the plasma-generating and shielding gases and the molten pool during PAW. Hosseini measured a linear regression for the prediction of nitrogen desorption from the WM as a function of arc energy [37].
The aim of our research was to further develop and specify these existing models for the case of autogenous DSS TIG welding of DSS 2205 with different Ar + N2 gas mixtures.

2. Materials and Methods

For our investigation, physical and theoretical models were done, using different Ar + N2 shielding gas mixtures in the case of autogenous TIG welding for DSS. After the physical modeling, our improved theoretical model was compared to the measured values for model validation.

2.1. The DSS Base Material

The base material for the physical welding simulations was the industrially most frequently used X2CrNiMoN22–5–3 (DSS 2205) duplex stainless steel. The nominal chemical composition of the base material can be seen in Table 1. The initial nitrogen content (%N) was measured by HORIBA EMGA-620W nitrogen analyzer (Kyoto, Japan). The dimension of the welded sheets was 150 × 80 × 5 mm3.

2.2. Details of the Physical Weld Simulation

2.2.1. Welding Parameters

In order to investigate the nitrogen solubility in the WM, autogenous TIG welding was performed on the DSS 2205 sheets with 0–50 vol. % N2 content in the pure (99.996 vol. %) Ar shielding gas. For the TIG welding, ESAB CaddyTIG 200 power source was used, with Ø 2.4 mm WC20 electrode on DC- (direct current, electrode on negative) polarity. In our research, arc energy (in kJ·mm−1) is being used instead of heat input. The reason for this is the fact that the nitrogen addition to the shielding gas can significantly modify the thermal conductivity of the arc plasma, and thus, the thermal efficiency value of 1.0 is being used and presumed in every case. Two arc energy values were applied: 0.53 and 0.68 kJ·mm−1. It was very important to keep these arc energy values constant with the different N2 contents in the shielding gases. The welding speed was a constant 3 mm·s−1 in all cases. The shielding gas flow rate was 11 L·min−1 in every case. The arc length was a constant 2 mm, and the electrode tip angle was 30°.

2.2.2. Evaluation Methods

For the geometrical measurements of the weld beads, an Olympus SZX16 stereo-microscope (Tokyo, Japan) was used. The geometrical measurements were done on at least 3 samples. The metallographic images were taken using the Olympus PMG3 optical microscope (Tokyo, Japan). The γ content measurements were done using Image-Pro® 9 image analyzer software (Media Cybernetics Inc., Rockville, MD, USA). The application of image analysis has recently been popular with researchers for DSS characterization [38,39]. A brief description of our self-developed method [40] follows. The cut weld cross-sections were prepared for standard metallography: mounted, ground to 4000 grit paper, and polished to 3 µm diamond suspension. Next, the samples were color etched, using Berahas II etchant (85 mL H2O + 15 mL HCl + 1 g K2S2O5). A 2 × 12 s etching cycle (total of 24 s etching time) was used, which was found to be optimal in our previous work [40]. The samples were rinsed in ethanol in between the two, 12 s, etching cycles. With the optimal etching, the highest contrast can be achieved between the δ (dark areas) and γ phases (light areas). With a histogram-based thresholding process, the dark and light areas can easily be separated to black and white colors. In the thresholded images, the amount of white areas, which is equal to the γ content, can be quantified using the image analyzing software. At least 10 images were evaluated for γ content measurements in every case.
The total dissolved nitrogen content in the WM (Nsteel) was measured via the combustion method, using HORIBA EMGA-620W oxygen/nitrogen analyzer (Kyoto, Japan). At least 4 samples, weighing ~1 g, were machined out from the middle of the WM in every case from the steady-state welded sections. The steady-state of the ~120 mm long weld seams was achieved after ~60 mm. The accuracy of the measurement is 0.001 wt %, which is sufficient in our case.

3. Improved Theoretical Model for Nitrogen Solubility Calculation in the Molten Pool

Our improved model of N kinetics during autogenous TIG welding of DSS is based on Du Toit’s model [35] for austenitic stainless-steel welding and Rokanopoulou’s model [36] for plasma arc welding of DSS.
The representation of the basic assumption of the theoretical model can be seen in Figure 1. The atomic nitrogen enters the weld pool from two sources: from the arc plasma (N(g), Figure 1a) and from the BM (%N, Figure 1c). The desorption of nitrogen from the molten pool takes place also through two different mechanisms: desorption of N to the arc atmosphere (Figure 1b) and desorption of N to the BM (Figure 1d). Under steady-state conditions, the absorption (Figure 1a,c) and desorption (Figure 1b,d) mechanisms are in equilibrium. A few assumptions are made as a boundary condition for the theoretical model: (1) The arc plasma is completely covering the molten pool; (2) the nitrogen concentration in the molten pool, and in the solidified WM, is uniform; and (3) the model does not take into consideration nitrogen porosity formation during welding.

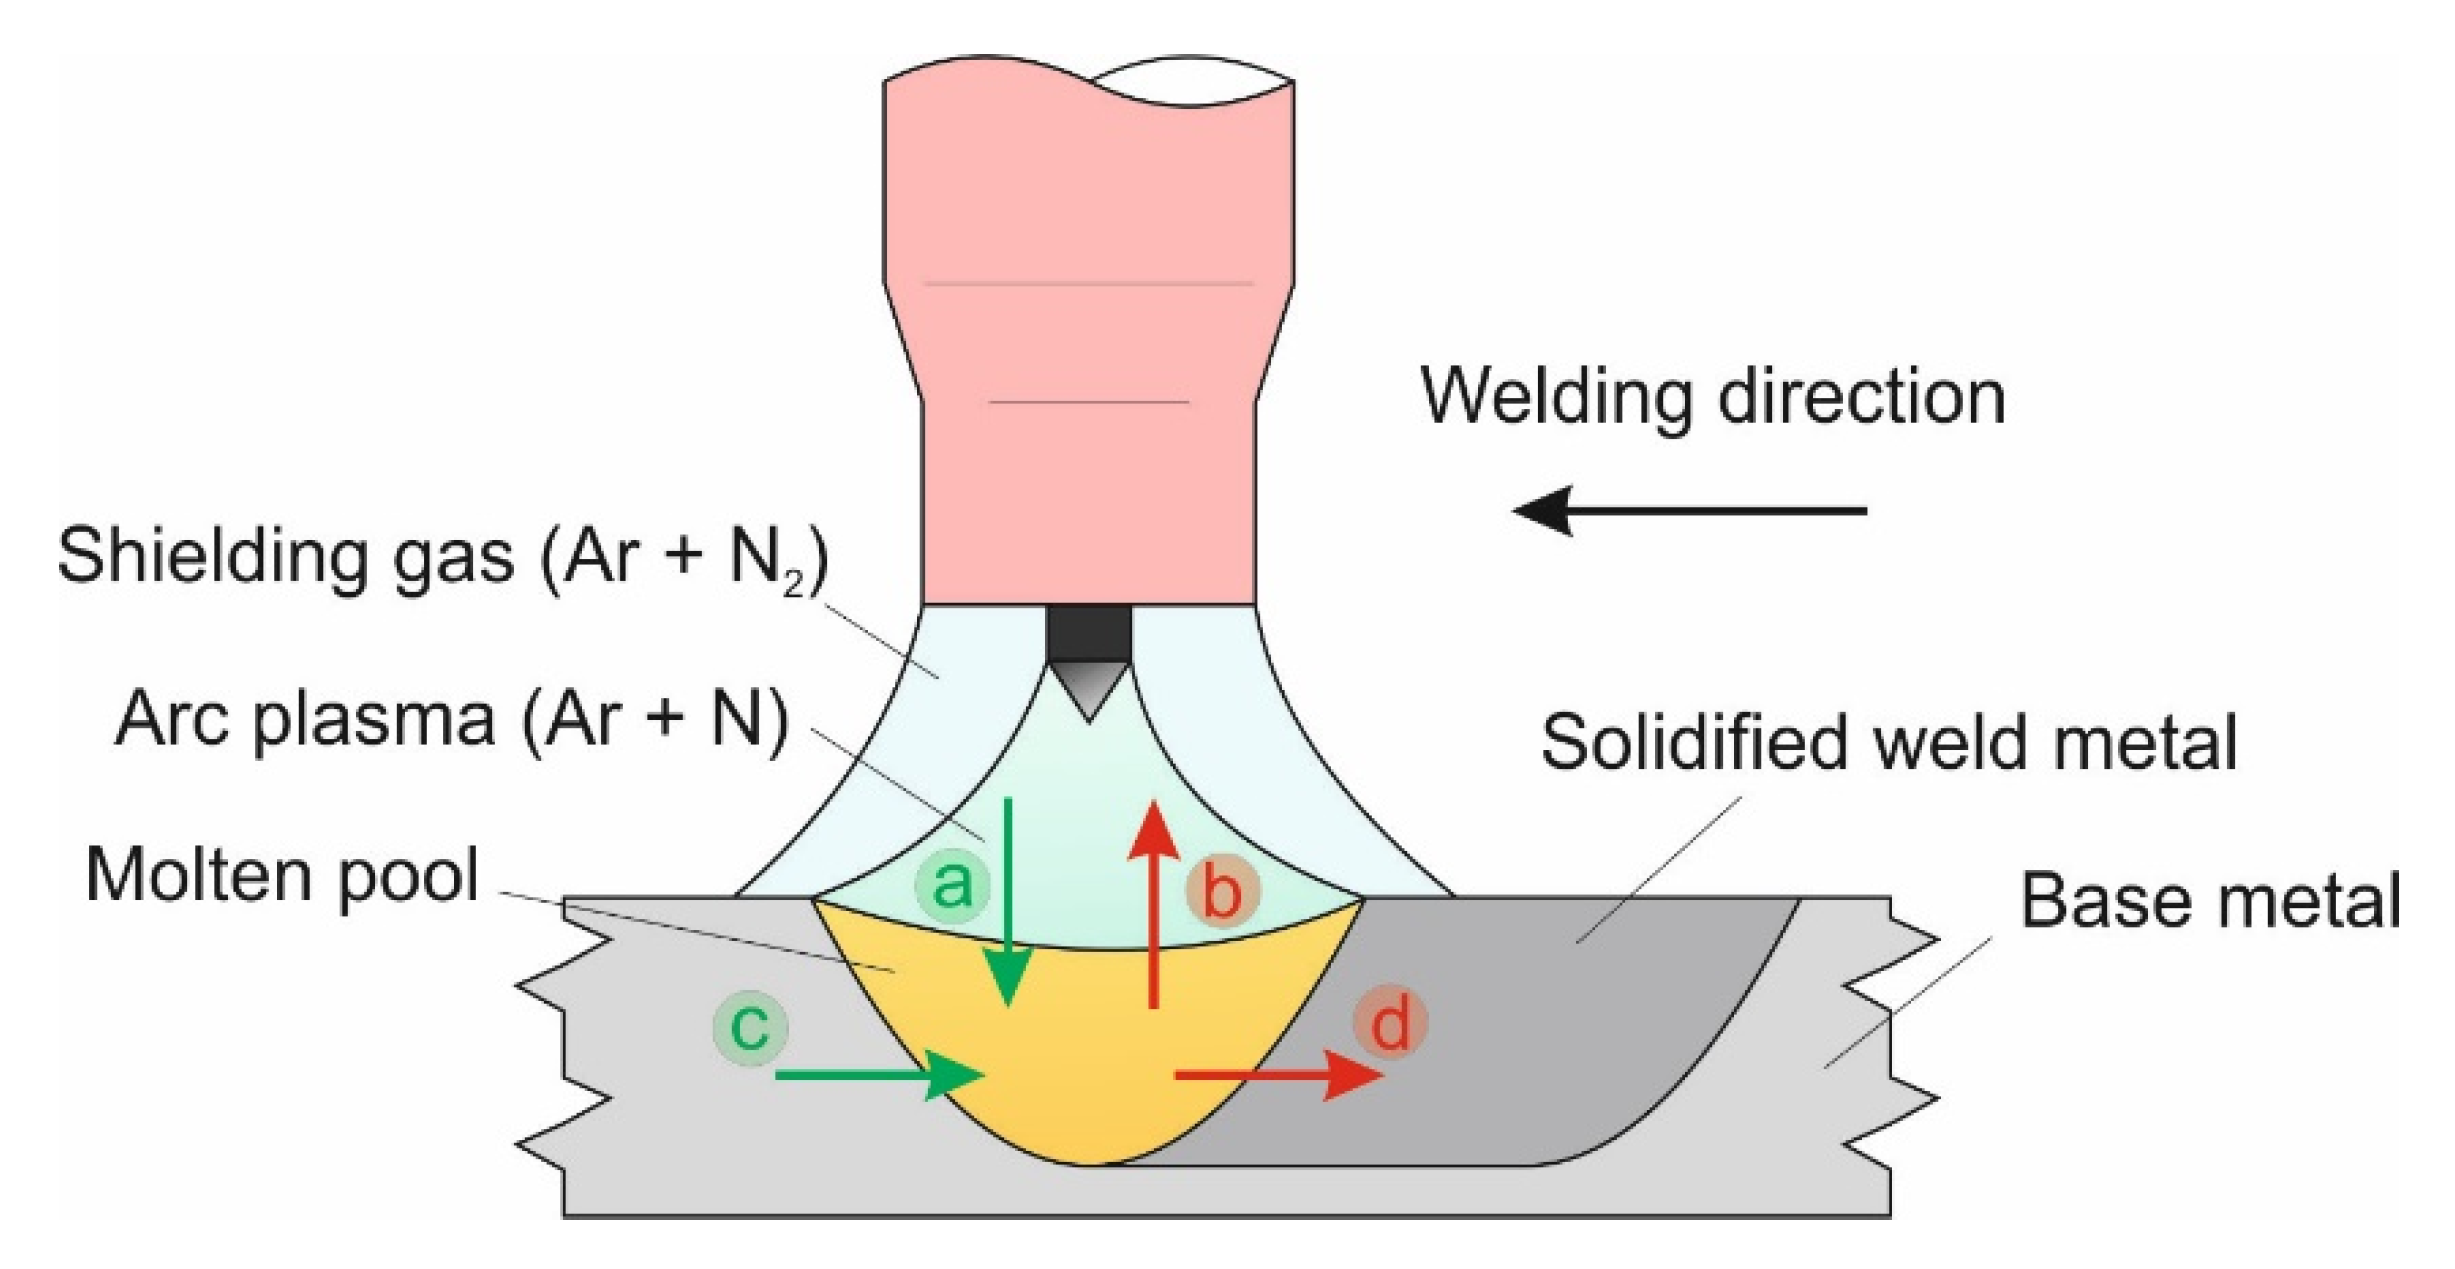
3.1. Nitrogen Absorption from the Arc Plasma

The nitrogen absorption from the arc plasma is represented in Figure 1a. At the arc plasma temperature, the molecular nitrogen in the shielding gas N2 dissociates from nitrogen atoms N(g) [26,41]. The N(g) dissolves in the molten pool (N in (wt %)):
N ( g ) N _ ( wt   % ) .
The N change over time can be expressed according to Du Toit [35]:
d N _ ( wt   % ) d t = 100 A K a ρ V [ N ( g ) N s t e e l K ] ,
where A is the molten pool surface in m2, Ka is the reaction rate constant for Equation (1) in kg·m−2·s−1·atm−1, ρ is the density of the molten pool at the welding temperature in kg·m−3, V is the molten pool volume in m3, N(g) is the monatomic nitrogen content in the arc plasma in atmospheres, Nsteel is the final nitrogen concentration in the solidified WM in wt %, and K is the apparent equilibrium constant for reaction Equation (1).
The molten pool volume during welding (V) in m3 is calculated according to [35,36]:
V = π 6 h ( 3 ( L 2 ) 2 + h 2 ) ,
where h is the penetration depth in meter measured on the cross-section perpendicular to the weld seam and L is the molten pool length during welding in meter, determined by the axis of the ellipsoid in the welding direction as seen in Figure 2.
About the Ka reaction rate constant, very limited data are available in the professional literature. As shown by [35,36], Ka has a weak dependency on the chemical composition, and its average value for DSS is taken as:
K a = 3.5 10 4 ( kg m 2 s 1 atm 1 ) .
The density of the molten pool at the welding temperature, ρ in kg·m−3 [42]:
ρ = 1000 ( 7.2 10 4 ( T T m ) + 7.04 ) ,
where T is the estimated molten pool temperature in Kelvin [36]:
T = 1995 ( K ) ,
and Tm is the liquidus temperature for DSS 2205 in Kelvin [35]:
T m = 1733 ( K ) .
The monatomic nitrogen content in the arc plasma N(g) in atmosphere according to [43,44]:
N ( g ) = P N 2 exp ( Δ G ° 1 R T d ) ,
where PN2 is the partial pressure of the inlet gas in atmosphere [36]:
P N 2 = N 2 100 .
ΔG01 is the standard free energy for the reaction:
1 2 N 2 N ( g ) ,
and ΔG01 in J·mol−1 according to [35,44] is equal to:
Δ G ° 1 = 362560 65.56 T d ,
where Td is the dissociation temperature of diatomic to monatomic nitrogen (Equation (10)) in Kelvin [35,44]:
T d = 1995 ( K ) .
The universal gas constant, R in J·K−1 mol−1 is equal to:
R = 8.314 ( J K 1 mol 1 ) .
The apparent equilibrium constant for reaction Equation (1), K, can be calculated [35]:
K = K K 1 ,
where K′ is the apparent equilibrium constant for the desorption reaction and according to Du Toit [35] equals to:
K = ( N e q ) 2 P N 2 .
The Neq is the equilibrium nitrogen content of the molten metal (in wt %) at the weld pool temperature for equilibrium with the nitrogen in the shielding gas, and calculated according to Wada et al. [45]:
log ( N _ e q ) = 247 T 1 , 22 ( 4780 T 1 , 51 ) log f N , T ( 1760 T 0 , 91 ) ( log f N , T ) 2 ,
where fN,T is the nitrogen activity coefficient at a certain temperature in Kelvin. At this point, the previous models of [35,36] are modified. For the calculation of Neq, Du Toit [35] and Wada et al. [45] calculated with fN,1873, which is the activity coefficient described for 1873 Kelvin not for the molten pool temperature T. Rokanopoulou et al. [36] changed the activity coefficient to the molten pool temperature, based on two different calculations of the equilibrium nitrogen content of the molten metal, Neq. According to the conclusions of Rokanopoulou et al. [36], the fN,T increased to 0.161 from fN,1873 = 0.134. However, the nitrogen activity coefficient in case of DSS should decrease at the molten pool temperature compared to the 1873 Kelvin value [31]. Kobayashi et al. [46] showed that above the melting temperature, the nitrogen activity is decreasing in the case of stainless steels. Anson et al. [47] showed that although nitrogen activity is increasing over the melting temperature in the case of pure iron, the main alloying elements of DSS, such as chromium, nickel, manganese, and molybdenum, are all decreasing this activity in the molten state.
Therefore, in our model, the fN,T is calculated according to [48]:
log f N , T = ( 2538 T 0.355 ) log f N , 1873 ,
which gives smaller value for the estimated molten pool temperature, T. The activity coefficient of nitrogen for 1873 Kelvin temperature [49]:
log f N , 1873 = e N N % N + e N M n % M n + e N S i % S i + e N P % P + e N C r % C r + + e N M o % M o + e N N i % N i + ( γ N C r % C r 2 + γ N M n % M n 2 + γ N M o % M o 2 + γ N N i % N i 2 ) ,
where eNX are the first order and γNX are the second order interaction parameters (Table 2) of nitrogen activity for a certain initial alloying element in the base material %X in wt %, as can be seen in Table 1.
Continuing Equation (14), K1 is the equilibrium constant for nitrogen dissociation Equation (10), and according to Du Toit [35], it is equal to:
K 1 = N ( g ) P N 2 .
Knowing these values, the dissolved atomic nitrogen in the molten pool, over time, Equation (2) can be calculated for the reaction of Equation (1).

3.2. Nitrogen Desorption into the Arc Plasma

One way of dissolved nitrogen (N) desorption from the molten pool is recombining and forming diatomic N2 in the arc plasma (Figure 1b):
2 N _ ( wt   % ) N 2 .
The desorption rate of Equation (20) over time can be expressed as [36]:
d N _ ( wt   % ) d t = 100 A K d ρ V ( N s t e e l 2 N e q . s t e e l 2 ) ,
where A is measured on the welds’ surfaces (e.g., see Figure 2), and V and ρ are calculated previously according to Equations (3) and (5), respectively. Kd is the rate constant for the reaction of nitrogen desorption from the weld pool to the arc atmosphere (Equation (20)) in (kg·m−2·s−1 (wt %)−2), and according to Du Toit [35], it is equal to:
K d = 10 ( 6340 / T + 1.85 ) 1 + 130 f S % S ,
where T is in Equation (6), %S is the initial sulfur content in the base material (Table 1), and fS is the activity coefficient of sulfur in stainless steels, according to [50], calculated by:
log f S = % C r ( 94.2 T + 0.040 ) ,
where %Cr is the initial chromium content in the base material (Table 1). The nitrogen concentration in the weld pool for equilibrium with the nitrogen in the gas Neq.steel can be calculated according to Rokanopoulou [36]:
N e q . s t e e l = P N 2 exp ( Δ G ° 2 R T ) f N , T ,
where PN2 (Equation (9)), T (Equation (6)), R (Equation (13)), fN,T (Equation (17)) are already given, and ΔG02 in J·mol−1 according to [51] is equal to:
Δ G ° 2 = 3598.2 + 23.89 T .
Knowing these values, the nitrogen desorption to the arc plasma over time Equation (21) can be calculated for the reaction of Equation (20).

3.3. Nitrogen Absorption from the Base Metal

The rate of N absorption to the molten pool from the base metal (Figure 1c) is proportional to the melting rate and can be expressed as [35,36]:
d N _ ( wt % ) d t = % N ( v L ) ,
where %N is the initial nitrogen content in the base metal (Table 1), the length of the molten pool L is seen in Figure 2, and v is the welding speed in m·s−1.

3.4. Nitrogen Desorption to the Base Metal

The second way of N desorption to the base metal is during the solidification of molten pool at the rear of the weld pool (Figure 1d). Note that, as can be seen in Figure 1, N desorption takes place toward the solidified WM. For this reason, the actual measured total dissolved nitrogen content in the WM (Nsteel) can be higher than what was predicted by the theoretical model. The nitrogen desorption to the base metal can be expressed according to [35,36]:
d N _ ( wt % ) d t = N s t e e l ( v L ) .
All the expressions in Equation (27) are prescribed earlier.
Solving the theoretical model described here will result in the total amount of dissolved atomic nitrogen in the solidified WM (Nsteel). The basic assumption of the solution is that during steady state, the absorption and desorption processes are in equilibrium with each other (processes (a) + (c) = (b) + (d) in Figure 1) and from this equilibrium, Nsteel can be expressed. This model also takes the nitrogen transport to and from the molten pool towards the base metal into account (processes (c) and (d) in Figure 1), which was proven to be true by Hosseini and Karlsson [52]. It is worth mentioning nitrogen desorption from the heat-affected zone was not observed during solid-state reheating in Gleeble® simulations [53], with relatively fast 1200 to 800 °C cooling rates (50 °C·s−1).

4. Results and Discussion

In the first section, the results of the effects of shielding gasses nitrogen (N2) content on the arc voltage are discussed. Afterwards, the comparison of our improved theoretical model to the measured total dissolved nitrogen in the WM (Nsteel) values of autogenous welds is evaluated. A comparison is also made between the improved theoretical model and previously published models.

4.1. Effects of Shielding Gas Nitrogen Content on the Arc Voltage

To better evaluate the physical welding experiments during TIG welding, it was essential to keep the arc energy values at constant levels with the different nitrogen-containing shielding gases. Thus, the welding current (I in Amps) was always adjusted to the evolved arc voltage (U in Volts). The effects of shielding gas N2 content on the arc voltage can be seen in Figure 3.
From Figure 3, it can be generally said that the arc voltage is increasing with the increasing N2 content in the shielding gas. The relationship between them is linear; however, the slope of the fitted line is changing in the 5 to 10 vol. % N2 range. In the case of lower N2 levels, the slope of the fitted line is higher (the increase of the arc voltage is more significant), ~0.42 (see Table 3). In the case of higher N2 levels, the slope is lower, ~0.11. The breakpoint of the slopes is different in the case of the two arc energies: 10 vol. % N2 in the case of 0.68 kJ·mm−1 and 5 vol. % N2 in the case of 0.53 kJ·mm−1. The possible reason for the arc voltage change with the N2 content is the different thermal conductivity and ionization energy, compared to Ar.
This observation has practical importance, because this is the N2 content range, where shielding gases are used for DSS TIG welding. Moreover, many researchers [23,24,54] observed sometimes contradictory results of γ content in the WM, using this shielding gas range for TIG welding, which could originate from this effect of the arc voltage changes.
To keep the arc energies constant with a constant welding speed of 3 mm·s−1, the welding currents were adjusted to each case, as can be seen in Table 4.

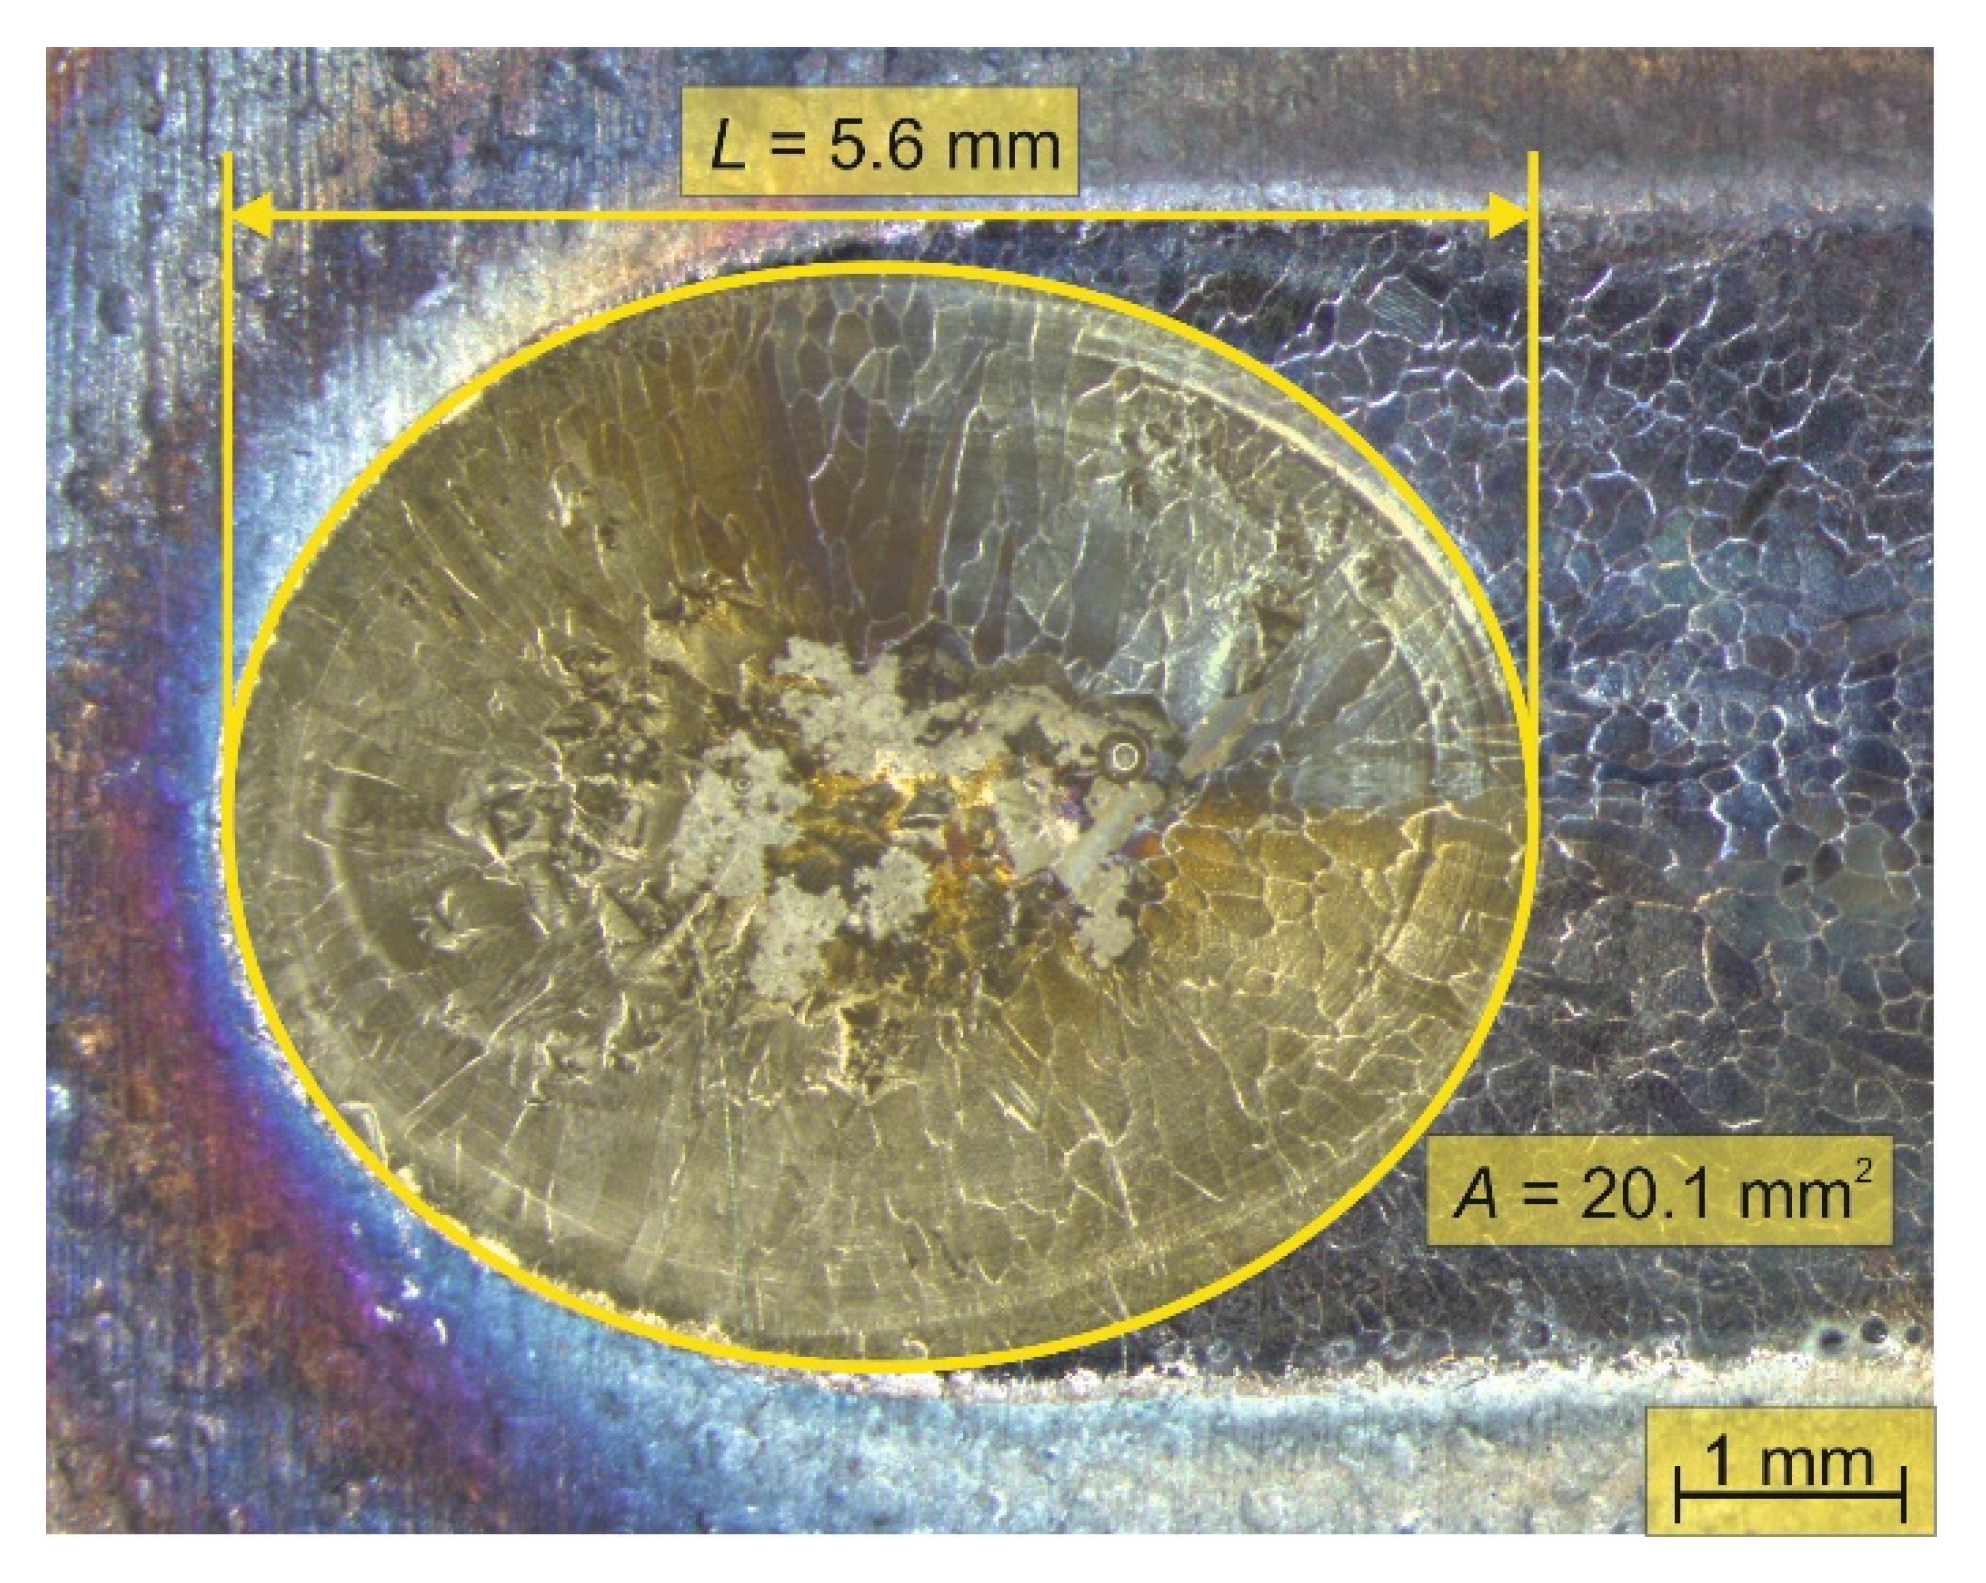
4.2. Weld Geometry Results

The molten pool surface and volume values are calculated with the solidified WM geometries, as described in Section 3.1, according to Figure 2 and Equation (3). The results are listed in Table 5.
From Table 5, it can be clearly seen that although the arc energies were kept constant, the increasing N2 content in the shielding gas means increasing amount of heat during TIG welding, which is represented in the increasing values of WM geometries. This observation was taken into account during the solution of the theoretical model in Equations (2), (21), (26), and (27).

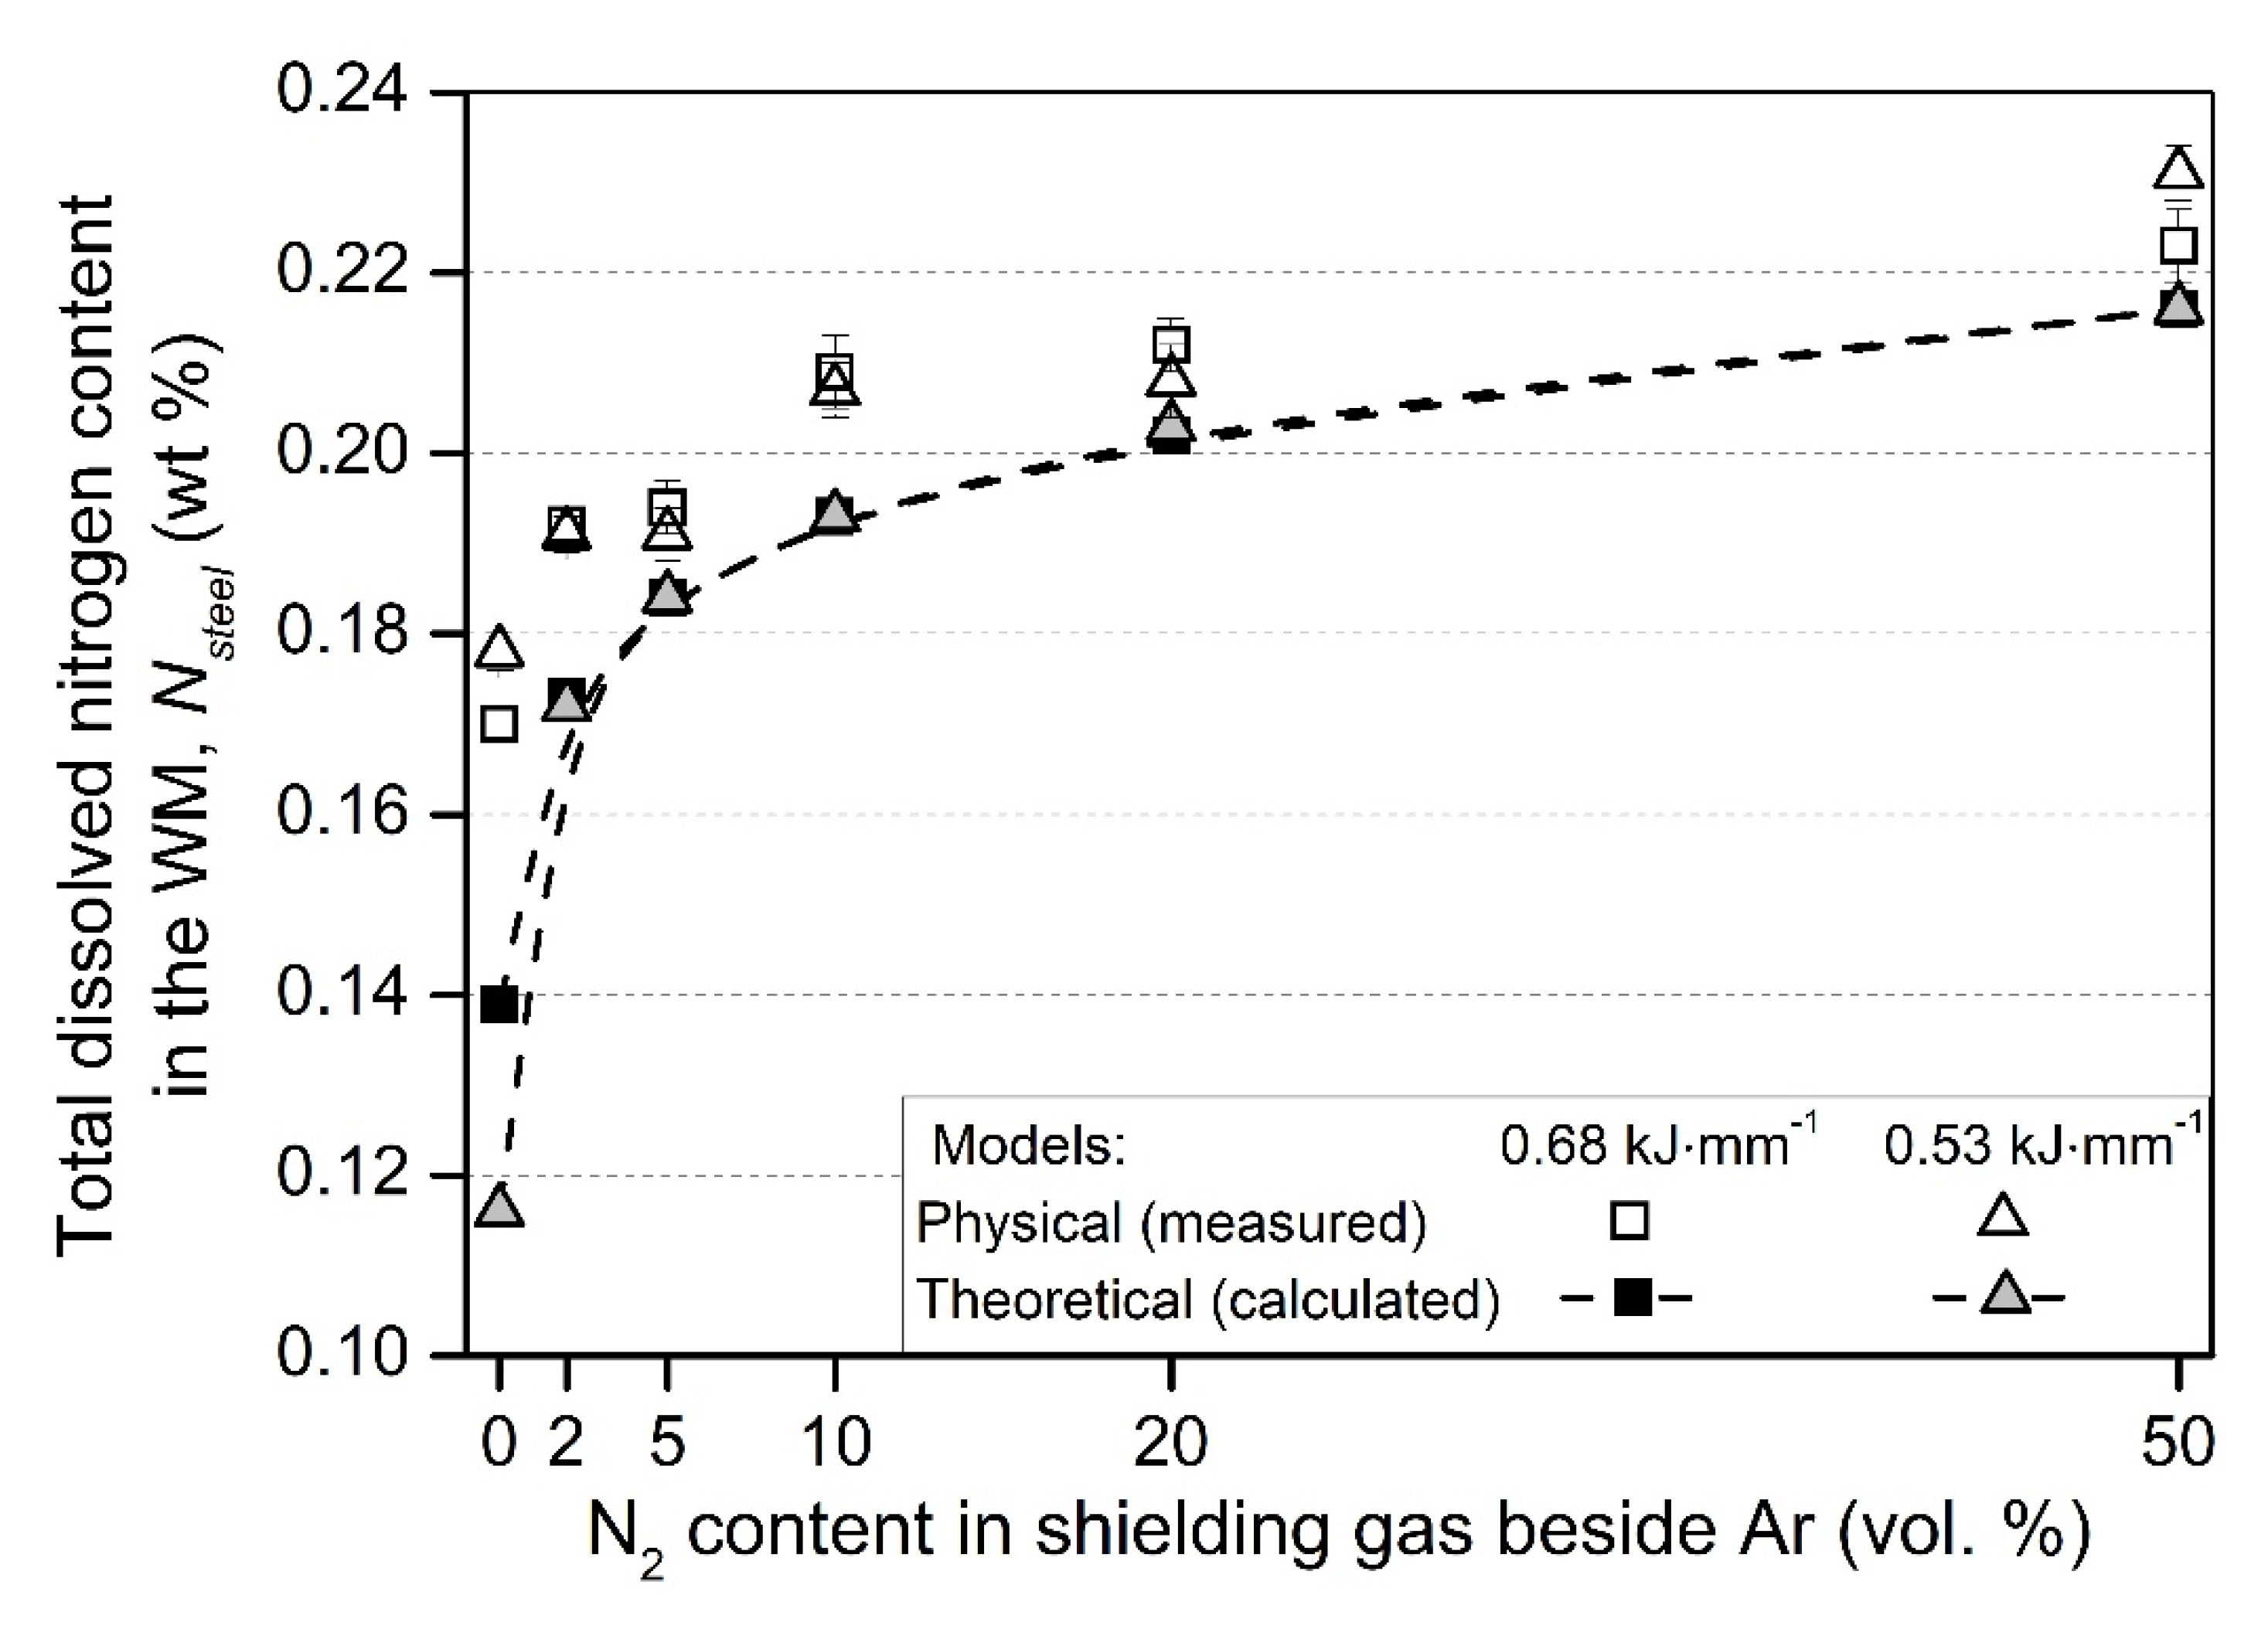
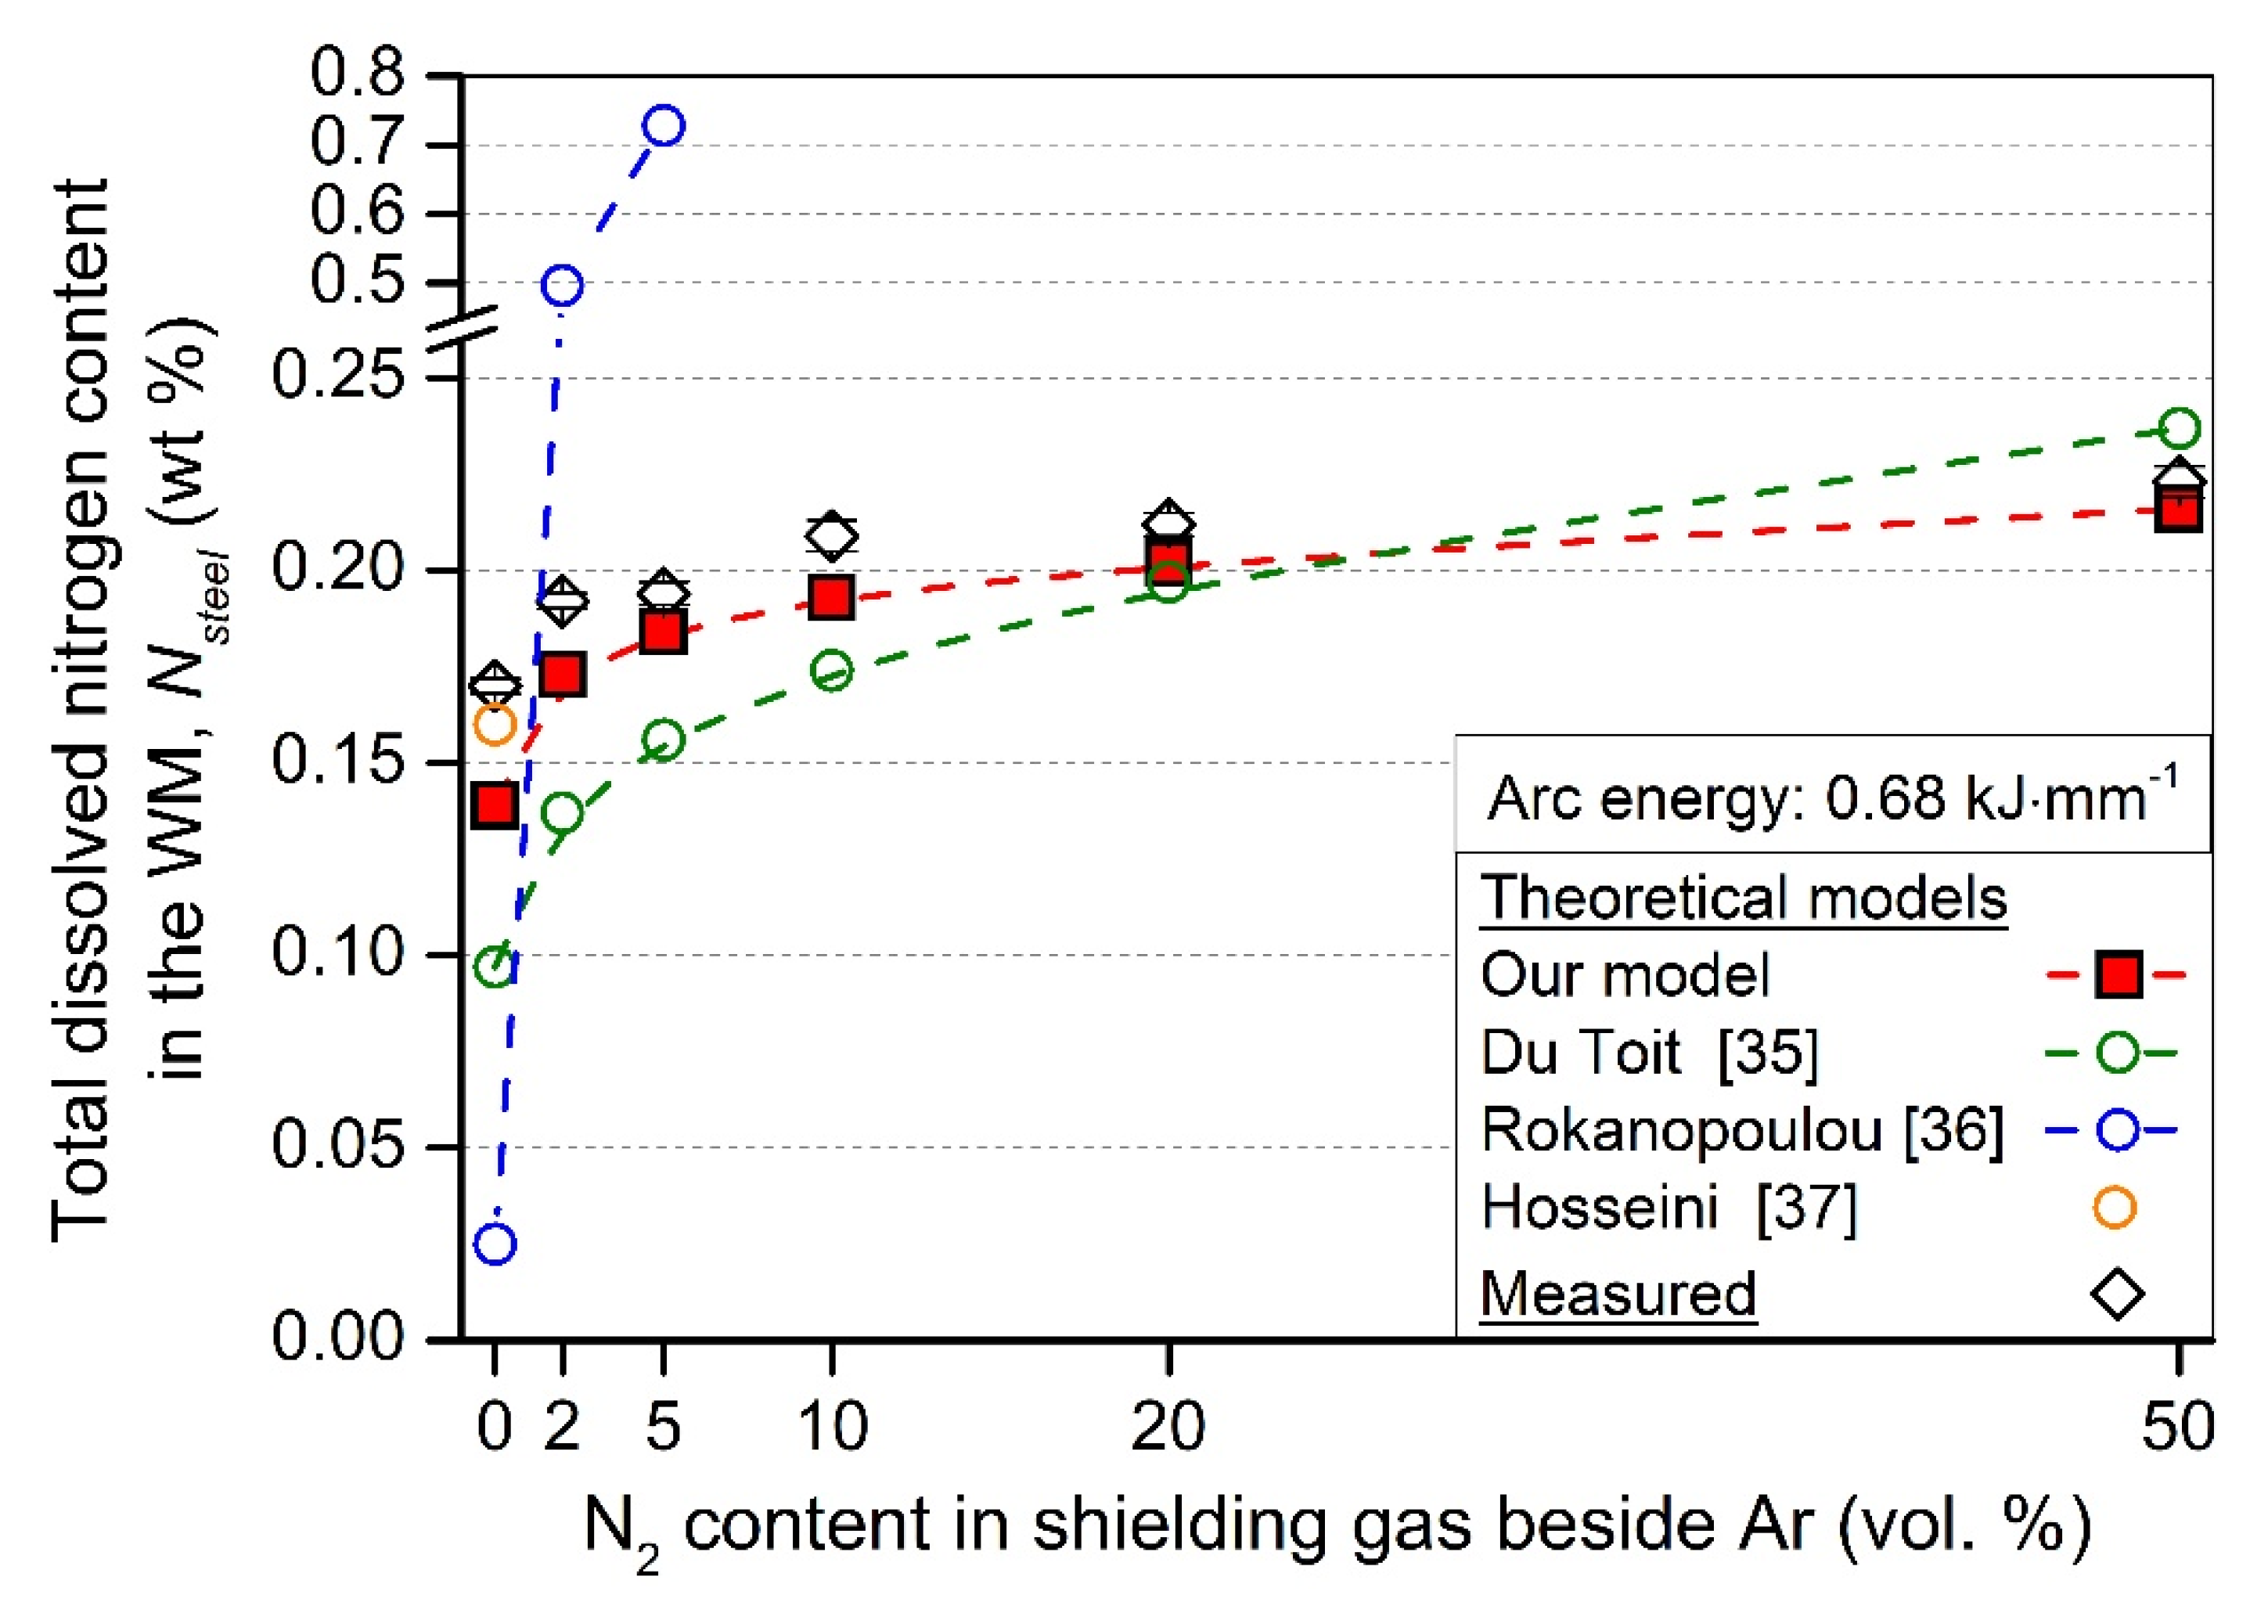
4.3. Comparison of the Physical and Theoretical Model of the Total Dissolved Nitrogen Content in the Solidified Weld Metal

The comparison of the theoretical and physical model (with measured nitrogen contents) of the Nsteel values can be seen in Figure 4.
From Figure 4, the following conclusion can be drawn. The calculated values, according to the developed theoretical model, gives smaller Nsteel values than the measured. This can be explained as that the theoretical model calculates the molten pool N content during welding and does not take into account the N leaving the molten pool toward the previously solidified WM (Figure 1d). The samples for Nsteel content HORIBA measurements were machined out from the solidified weld metal, and thus, higher values could have been measured for the actual Nsteel content. Further, in the applied arc energy range (0.53–0.68 kJ·mm−1), the theoretical model does not result in significant differences between the Nsteel values for a certain N2 shielding gas composition. However, the measured values show larger differences between the two arc energies, which originates from the non-equilibrium behavior of arc welding, but no clear relationship can be found between the arc energy and the Nsteel values on case of nitrogen-containing shielding gases. In case of TIG welding with pure Ar shielding gas, a higher Nsteel content was measured in the case of smaller arc energy. This observation complies with the results of Hosseini et al. [37], who showed that the total dissolved nitrogen content is decreasing with the increasing arc energy in the case of autogenous TIG welding with Ar gas shielding. The reason for this is the increasing molten pool surface and volume with the increasing arc energy (Table 5); thus, more N can leave the molten pool through desorption to the arc atmosphere and to the base metal. This phenomenon is not emphasized enough in our and the previously developed theoretical models. Figure 4 also shows that the highest increase in the Nsteel is significantly pronounced in the 2–10 vol. % N2 shielding gas range (compared to the samples welded in pure Ar), and this is exactly the range where most of the argon + nitrogen shielding gas mixtures are used in industrial applications. This observation is in correlation with the significant increase of arc voltage in this shielding gas N2 content range (Figure 3). At higher N2 levels of shielding gas, the solubility limit of N restrains the significant Nsteel increase.
In order to reach the initial nitrogen content of the BM (%N = 0.181 wt %) in the solidified WM, approx. 2 vol. % N2 content in the shielding gas should be used according to the physical model and approx. 5 vol. % N2 according to the theoretical model. This also complies with the industrial practice, where these nitrogen-containing gas mixtures tend to be used to prevent nitrogen loss from the molten pool. Table 6 shows the comparison of the measured Nsteel values to our improved theoretical model and to Du Toit’s model [35].
In the case of Ar shielding, according to the relationship between the arc energy and the Nsteel value developed by Hosseini et al. [55], the Nsteel for 0.53 kJ·mm−1 arc energy is predicted to be 0.165 wt %, and 0.160 wt % for 0.68 kJ·mm−1 arc energy. These predictions are closer to our measured values (0.178 and 0.170 wt %, respectively) than those calculated by the improved model (0.116 and 0.139 wt %). The possible reason for this is that the nitrogen transport from the high temperature heat-affected zone (HTHAZ) to the molten pool [52] has much higher importance in the case of the non-equilibrium conditions during arc welding than expected in the developed nitrogen kinetic models. This N absorption forms the HTHAZ results in higher Nsteel values in the solidified WM. In the further development of our improved model, this observation should be taken into consideration in the future. In the case of the nitrogen-containing gas mixtures, our improved model gives less than 10% error to the measured total dissolved nitrogen (Nsteel) values in all cases. For DSS autogenous TIG welding with nitrogen-containing shielding gas, our improved model gives better prediction on the Nsteel values (except one case) than the previously developed model by Du Toit [35], which was originally set up for austenitic stainless steels. The model developed by Rokanopoulou et al. [36] was not evaluated in detail in this paper, because their model can sometimes result in exaggerated values. For example, according to their model [36], applying the welding conditions: welding current 80 A, welding speed 3 mm·s−1, and Ar + 5 vol. % N2 shielding gas will result in 1.19 wt % predicted Nsteel value in the case of plasma arc welding of DSS 2205. This is over the solubility limit of nitrogen in γ (which has about one magnitude higher solubility of nitrogen than δ has) [31].
In Figure 5, it can be seen that our improved model approximates the measured values better than the other models. Figure 6 shows metallographic images taken from the WM, welded with Ar, and 2–50 vol. % N2 shielding gases.
The corresponding average γ contents (light areas) are 16.0%, 34.5%, 43.6%, 52.1%, 67.1%, and 71.4%, respectively. The Ar welded sample shows highly ferritic microstructure in the WM. In this case, coherent γ grains can be seen in the δ grain boundaries. In addition to this, intergranular γ islands can be found inside the δ grains. The 2–5 vol. % N2 addition to the shielding gas increased the γ content in the WM, as the Nsteel also increased (from 0.170 to 0.192 and 0.194 wt %, respectively). In these cases, the intergranular γ grains are connected to the grain boundary γ grains. The 10 vol. % N2 addition to the shielding gas results in more austenitic microstructure (52.1% γ content) and also a significant increase in the Nsteel to 0.209 wt %. This is the shielding gas composition, where a breakpoint was found in the corresponding arc voltage (Figure 3 and Table 3). The 20 vol. % N2 addition to the shielding gas resulted only in a small increase in Nsteel (0.212 wt %), compared to the 10 vol. % N2 shielding gas, but a high increase in the γ content (67.1%). The 50 vol. % N2 addition to the shielding gas resulted in eutectic δ + γ solidification from the liquid phase. In this case, interdentritic δ grains can be seen inside the γ matrix. As a summary, it can be said that the Nsteel value depends on the N2 content of the applied shielding gas, and the austenite content in the WM depends on the Nsteel.

5. Conclusions

In this study, the autogenous tungsten inert gas (TIG) welding of DSS 2205 type duplex stainless steel was done using different argon (Ar) and Ar + nitrogen (N2) shielding gas mixtures at two different (0.53 and 0.68 kJ·mm−1) arc energies. We determined the effects of nitrogen addition to the shielding gas to the arc voltage and to the total dissolved nitrogen (Nsteel) content in the solidified weld metal (WM). Further, an improved theoretical was established to predict the Nsteel content in the WM. According to our results, the following conclusions can be drawn:
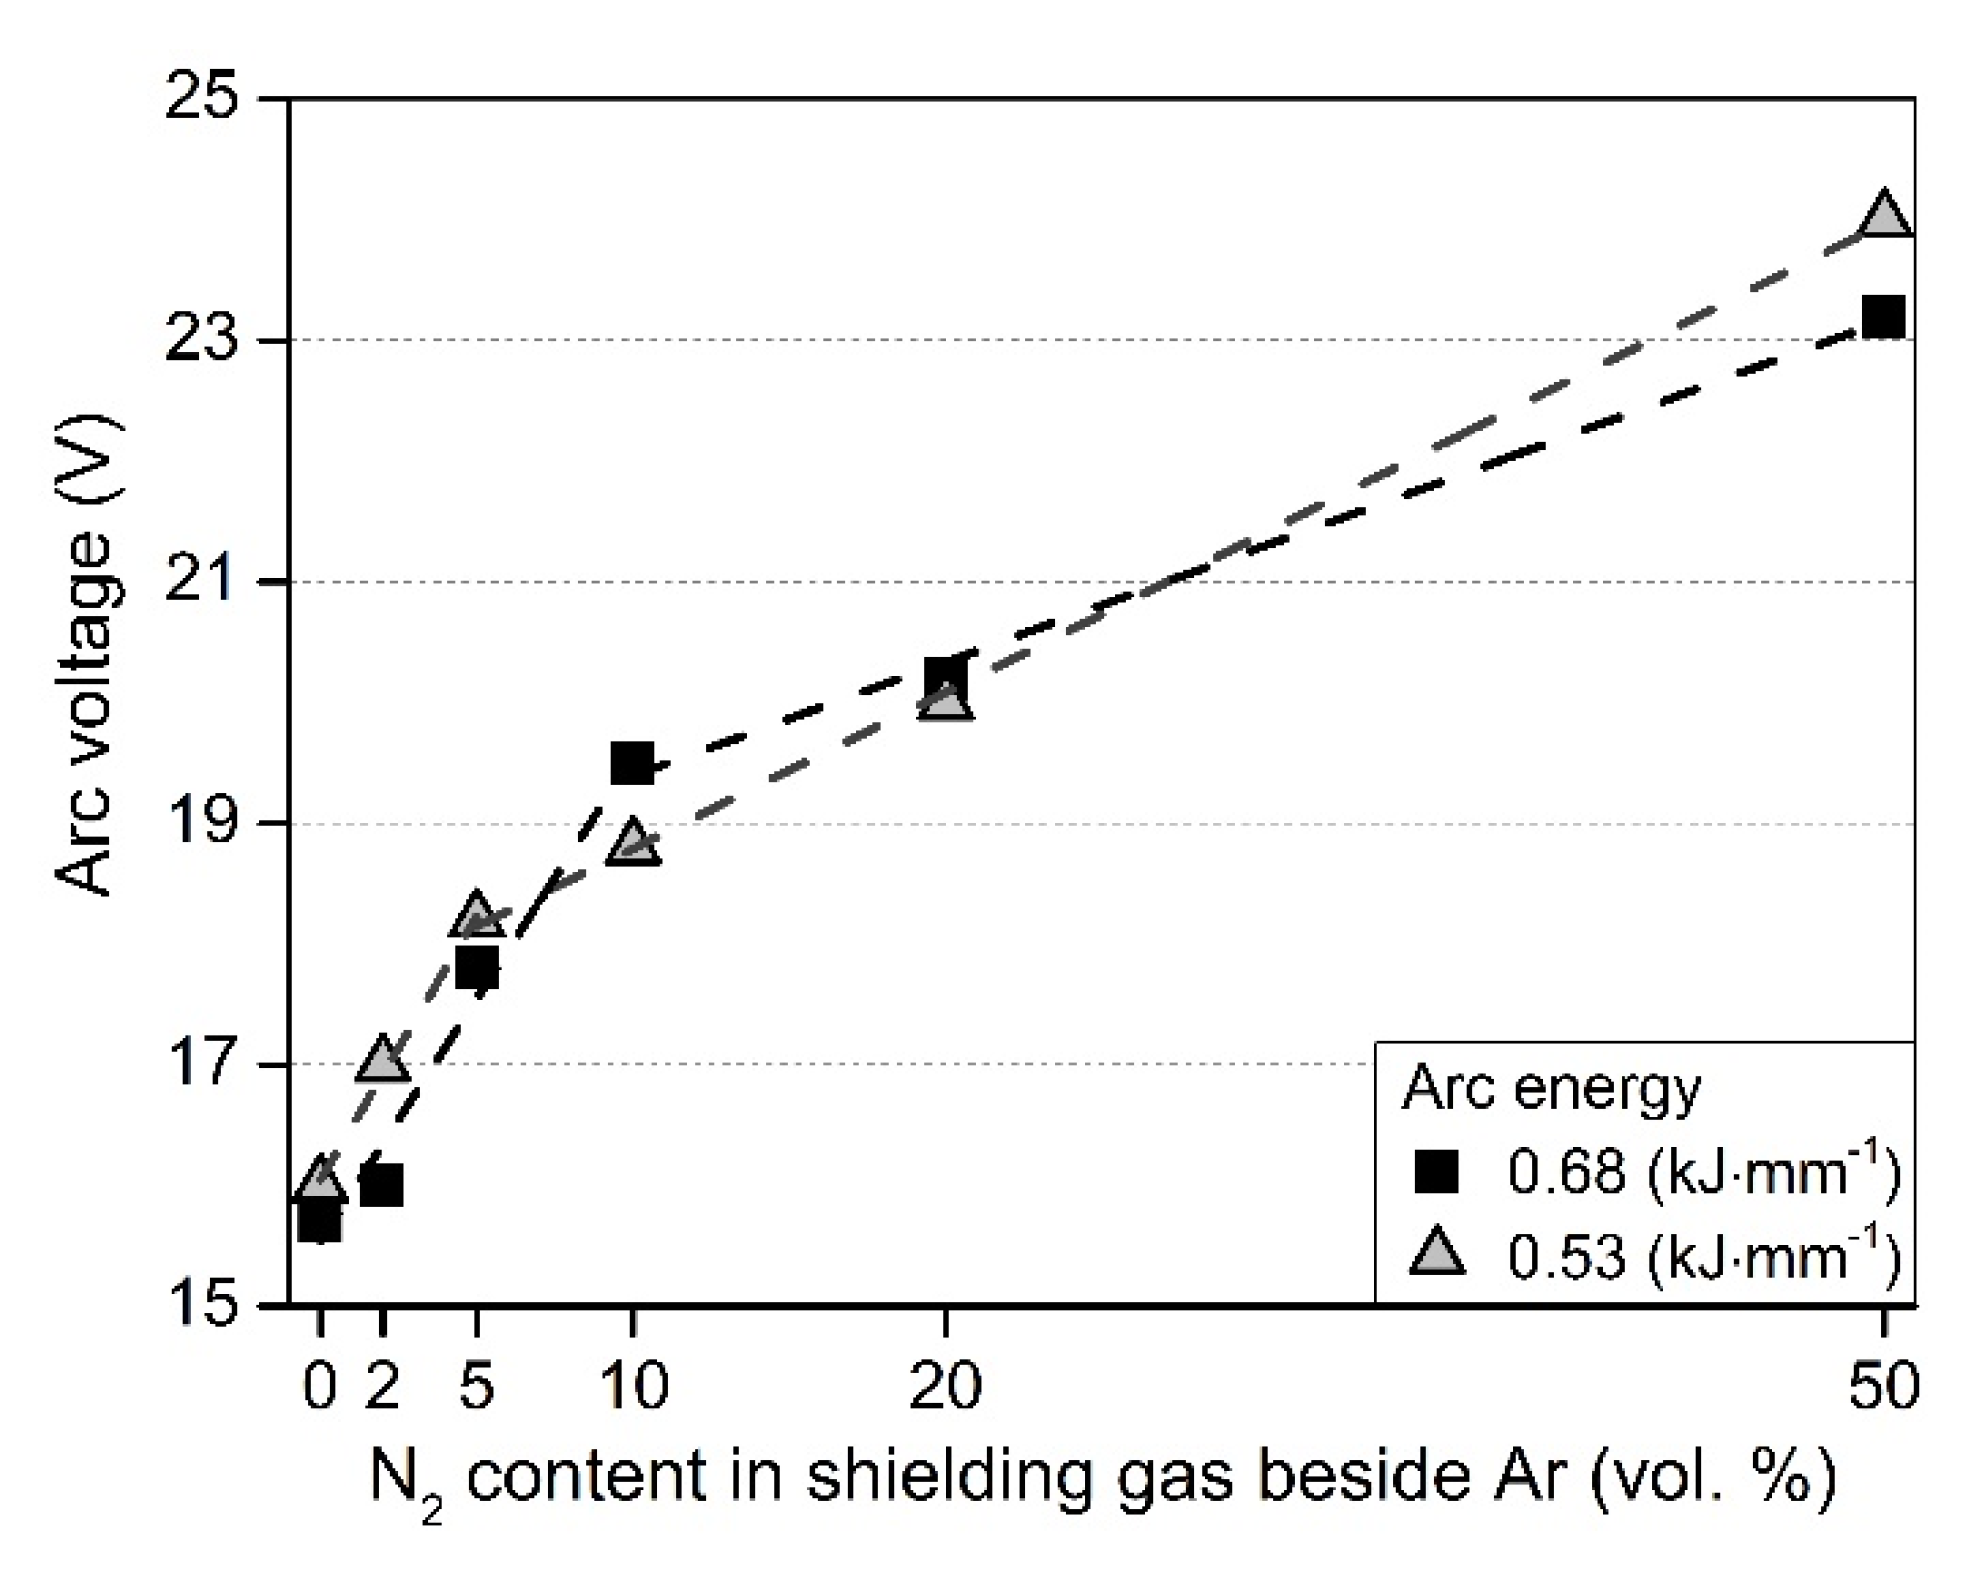
  • During TIG welding, the arc voltage is increasing linearly with the increasing N2 content in the Ar shielding gas. The slope of this linear relationship is different in the 5 to 10 vol. % N2 range. The breakpoint of the slopes is different in the case of the two arc energies: 10 vol. % N2 in case of 0.68 kJ·mm−1 and 5 vol. % N2 in case of 0.53 kJ·mm−1.
  • The higher arc energy (larger molten pool surface and volume) resulted in less Nsteel content in the WM in the case of the Ar welded samples; 0.178 wt % for 0.53 kJ·mm−1 and 0.170 wt % for 0.53 kJ·mm−1.
  • The increase in the Nsteel is significantly pronounced in the 2–10 vol. % N2 shielding gas range (compared to the Ar welded samples), where most of the Ar + N2 shielding gas mixtures are used in industrial applications. This observation is in correlation with the significant increase of arc voltage in this shielding gas N2 content range.
  • Our improved theoretical model, established for the Nsteel prediction, results in less than 10% error compared to the measured Nsteel values in case of autogenous TIG welding of DSS 2205 with Ar + N2 shielding gases.
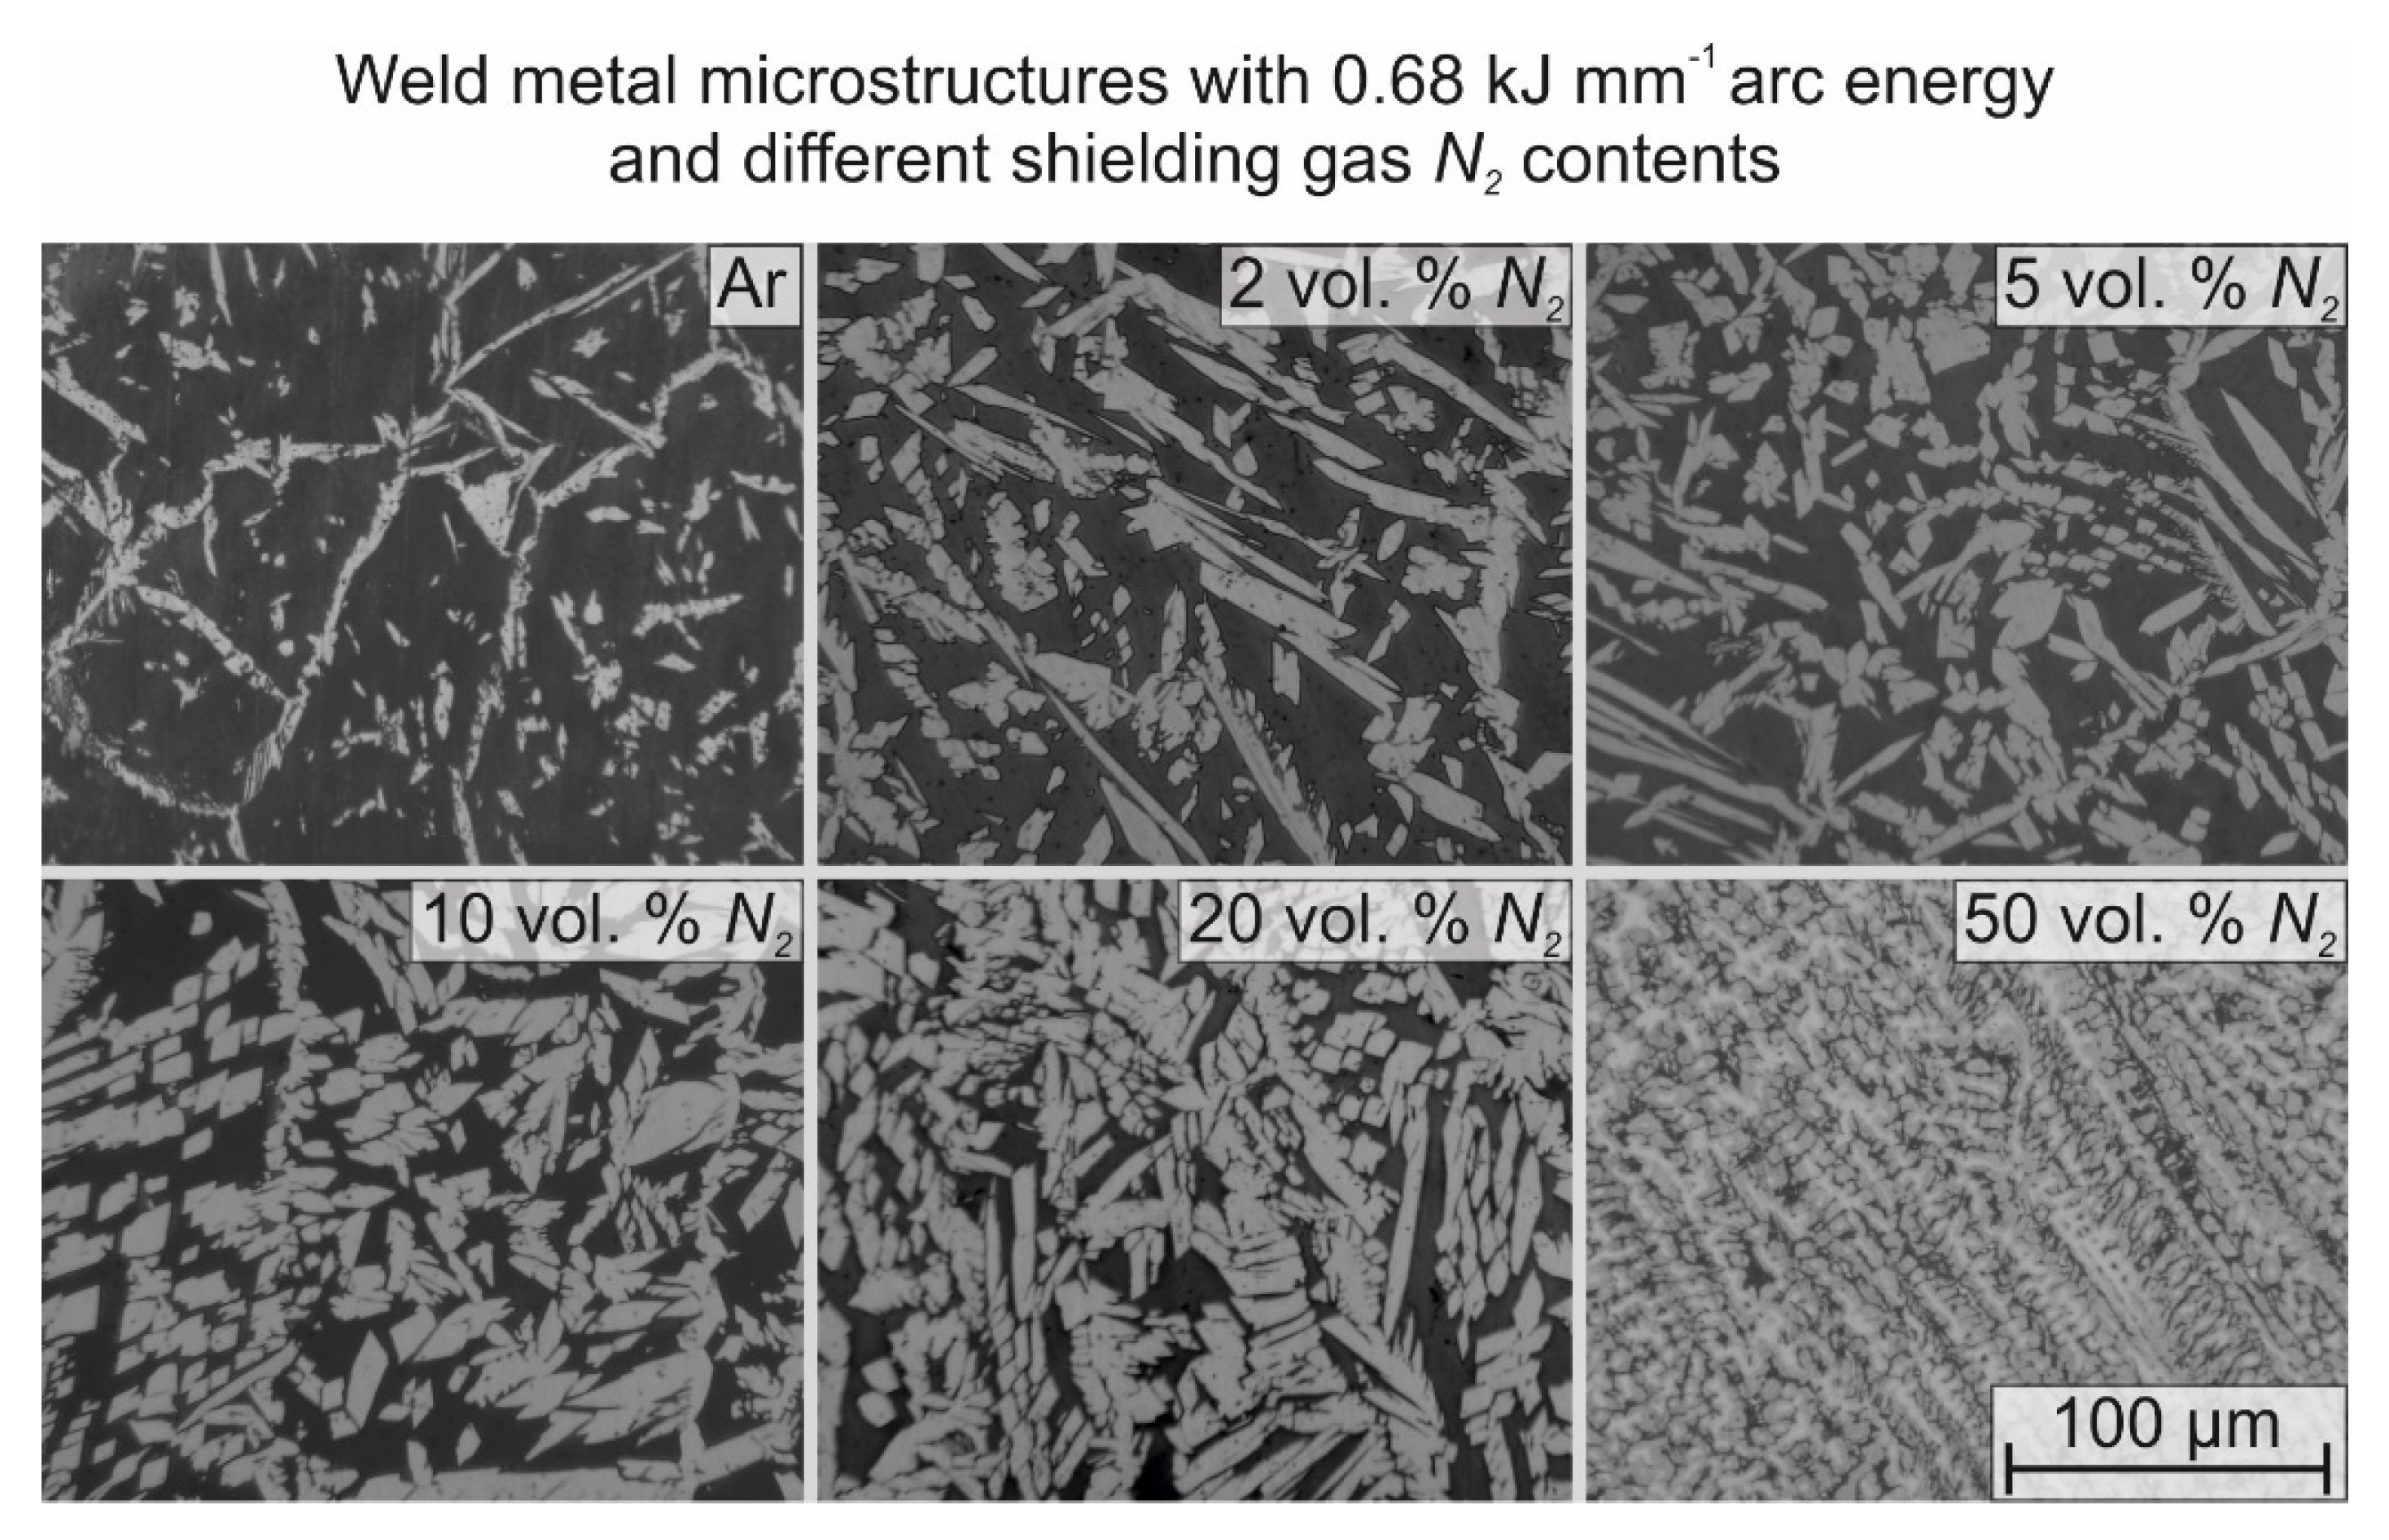
  • The 50 vol. % N2 addition to the Ar shielding gas resulted in eutectic ferrite + austenite solidification from the liquid phase.
With our improved model, the total dissolved nitrogen content in the weld metal can be predicted in the case of duplex stainless-steel autogenous welding after a simple welding trial. This prediction has practical importance, as the austenite content in the weld metal is in correlation with the dissolved nitrogen content. In the near future, this correlation will be investigated in more details, which is helpful for the welding design methodology for industrial applications.

Author Contributions

The contribution of authors can be explained as below according to CRediT Taxonomy of contributor roles. Conceptualization, validation, resources, writing—original draft preparation, writing—review and editing, visualization, B.V. and K.M.; methodology, software, formal analysis, investigation, data curation, B.V.; supervision, project administration, funding acquisition, K.M.

Funding

This research has been supported by the János Bolyai Research Scholarship of the Hungarian Academy of Sciences grant number: BO/00196/16/6 and by the National Research, Development and Innovation Office—NKFIH, OTKA PD 120865 (K. Májlinger). The research reported in this paper was supported by the BME Nanotechnology FIKP grant of EMMI (BME FIKP-NAT).

Conflicts of Interest

The authors declare no conflict of interest.

References

  1. Russo Spena, P.; Rossi, S.; Wurzer, R. Effects of Welding Parameters on Strength and Corrosion Behavior of Dissimilar Galvanized Q&P and TRIP Spot Welds. Metals 2017, 7, 534. [Google Scholar] [Green Version]
  2. Dobosy, Á.; Gáspár, M.; Lukács, J. The Influence of Mismatch Effect on the High Cycle Fatigue Resistance of High Strength Steel Welded Joints. Adv. Mater. Res. 2018, 1146, 73–83. [Google Scholar] [CrossRef]
  3. Béres, G.; Weltsch, Z. Estimation of Strength Properties from Microhardness Results in Dual Phase Steels with Different Martensite Volume Fraction. Period. Polytech. Transp. Eng. 2018, 47, 1–7. [Google Scholar] [CrossRef]
  4. Palotas, B.; Pogonyi, T. Results of resistance spot welding of dual phase steels. In Proceedings of the Provisional agenda of the Commission III Intermediate Meeting 2017 (III-1784-17), Budapest, Hungary, 6–7 February 2017; Borhy, I., Wikhardt, P., dos Santos, J.F., Eds.; Magyar Hegesztési Egyesület: Budapest, Hungary, 2017. III-1794-17. [Google Scholar]
  5. Boillot, P.; Peultier, J. Use of stainless steels in the industry: Recent and future developments. Procedia Eng. 2014, 83, 309–321. [Google Scholar] [CrossRef]
  6. Soulignac, P. Celebrating the 70 + years of duplex stainless steels in Europe. In Proceedings of the 8th Duplex Stainless Steels Conference, Beaune, France, 13–15 October 2010. [Google Scholar]
  7. Chater, J. Playing to strength: Suplex gains market share in construction and transport. Stainl. Steel World 2017, 29, 28–32. [Google Scholar]
  8. Świerczyńska, A.; Fydrych, D.; Rogalski, G. Diffusible hydrogen management in underwater wet self-shielded flux cored arc welding. Int. J. Hydrog. Energy 2017, 42, 24532–24540. [Google Scholar] [CrossRef]
  9. Haldorsen, L.M. Welding duplex-challenges faced and experience gained. Stainl. Steel World 2016, 28, 53–58. [Google Scholar]
  10. Chater, J. The year in stainless steel: Industry sees growth, but over-production still an issue. Stainl. Steel World 2019, 31, 28–31. [Google Scholar]
  11. Rosemann, P.; Müller, C.; Baumann, O.; Modersohn, W.; Halle, T. Influence of the post-weld surface treatment on the corrosion resistance of the duplex stainless steel 1.4062. IOP Conf. Ser. Mater. Sci. Eng. 2017, 181, 012019. [Google Scholar] [CrossRef] [Green Version]
  12. International Stainless Steel Forum (ISSF). Stainless Steel in Figures 2018; ISSF: Brussels, Belgium, 2018; p. 15. [Google Scholar]
  13. Kotecki, D.J. Some pitfalls in welding of duplex stainless steels. Soldag. Insp. 2010, 15, 336–343. [Google Scholar] [CrossRef]
  14. Gunn, R.N. Duplex Stainless Steels: Microstructure, Properties and Applications; Abington Publishing: Cambridge, UK, 1997; pp. 24–27. [Google Scholar]
  15. Westin, E. Microstructure and Properties of Welds in the Lean Duplex Stainless Steel LDX 2101. Ph.D. Thesis, Royal Institute of Technology, Stackholm, Sweden, 2010. [Google Scholar]
  16. Zucato, I.; Moreira, M.C.; Machado, I.F.; Lebrão, S.M.G. Microstructural Characterization and the Effect of Phase Transformations on Toughness of the UNS S31803 Duplex Stainless Steel Aged Treated at 850 °C. Mater. Res. 2002, 5, 385–389. [Google Scholar] [CrossRef]
  17. Alves, A.D.N.S.; Ferreira, D.M.B.; Martins, T.F.; José, G. Numerical Simulation of Welding Superduplex UNS S32760 Stainless Steel with the Flux Cored Arc Welding (FCAW) Process using Finite Element Method. In Proceedings of the XLII consolda–Congresso Nacional De Soldagem, Associacao Brasileira de Soldagem, Belo Horizonte, Brazil, 30 November 2016. [Google Scholar]
  18. Yang, Y.; Guo, Y.; Liu, Y.; Li, J.; Jiang, Y. The Microstructure and Pitting Resistance of 2002 Lean Duplex Stainless Steel after the Simulated Welding Thermal Cycle Process. Materials 2018, 12, 70. [Google Scholar] [CrossRef] [PubMed]
  19. Nilsson, J.-O. The role of nitrogen in duplex stainless steels. Stainl. Steel World 2016, 28, 26–27. [Google Scholar]
  20. Ha, H.-Y.; Lee, C.-H.; Lee, T.-H.; Kim, S. Effects of Nitrogen and Tensile Direction on Stress Corrosion Cracking Susceptibility of Ni-Free FeCrMnC-Based Duplex Stainless Steels. Materials 2017, 10, 294. [Google Scholar] [CrossRef] [PubMed]
  21. Alcantara, A.S.; Fábián, E.R.; Furkó, M.; Fazakas, É.; Dobránszky, J.; Berecz, T. Corrosion resistance of TIG welded joints of stainless steels. Mater. Sci. Forum 2017, 885, 190–195. [Google Scholar] [CrossRef]
  22. Gennari, C.; Lago, M.; Bögre, B.; Meszaros, I.; Calliari, I.; Pezzato, L. Microstructural and Corrosion Properties of Cold Rolled Laser Welded UNS S32750 Duplex Stainless Steel. Metals 2018, 8, 1074. [Google Scholar] [CrossRef]
  23. Başyiğit, A.; Kurt, A. The Effects of Nitrogen Gas on Microstructural and Mechanical Properties of TIG Welded S32205 Duplex Stainless Steel. Metals 2018, 8, 226. [Google Scholar] [CrossRef]
  24. Sales, A.M.; Westin, E.M.; Jarvis, B.L. Effect of nitrogen in shielding gas of keyhole GTAW on properties of duplex and superduplex welds. Weld. World 2017, 61, 1133–1140. [Google Scholar] [CrossRef]
  25. Westin, E.M.; Johansson, M.M.; Pettersson, R.F.A. Effect of nitrogen-containing shielding and backing gas on the pitting corrosion resistance of welded lean duplex stainless steel LDX 2101® (EN 1.4162, UNS S32101). Weld. World 2013, 57, 467–476. [Google Scholar] [CrossRef]
  26. Allum, C. Nitrogen Absorption from Welding Arc; International Institue of Welding: Lisbon, Portugal, 1988. [Google Scholar]
  27. Pramanik, A.; Littlefair, G.; Basak, A.K. Weldability of Duplex Stainless Steel. Mater. Manuf. Process. 2015, 30, 1053–1068. [Google Scholar] [CrossRef]
  28. Pickle, T.; Henry, N.; Morriss, P.; Tennis, L.; Wagner, D.; Baumer, R.E. Root Pass Microstructure in Super Duplex Stainless Steel Multipass Welds. Weld. J. 2019, 98, 123–134. [Google Scholar]
  29. Dobranszky, J.; Szabo, P.J.; Berecz, T.; Hrotko, V.; Portko, M. Energy-dispersive spectroscopy and electron backscatter diffraction analysis of isothermally aged SAF 2507 type superduplex stainless steel. Spectrochim. Acta Part B At. Spectrosc. 2004, 59, 1781–1788. [Google Scholar] [CrossRef]
  30. Knyazeva, M.; Pohl, M. Duplex Steels. Part II: Carbides and Nitrides. Metallogr. Microstruct. Anal. 2013, 2, 343–351. [Google Scholar] [CrossRef] [Green Version]
  31. Lippold, J.C.; Kotecki, D.J. Welding Metallurgy and Weldability of Stainless Steels; John Wiley & Sons, Inc.: Hoboken, NJ, USA, 2005; pp. 240–244. [Google Scholar]
  32. Migiakis, K.; Papadimitriou, G.D. Effect of nitrogen and nickel on the microstructure and mechanical properties of plasma welded UNS S32760 super-duplex stainless steels. J. Mater. Sci. 2009, 44, 6372–6383. [Google Scholar] [CrossRef]
  33. Valiente Bermejo, M.A.A.; Karlsson, L.; Svensson, L.-E.E.; Hurtig, K.; Rasmuson, H.; Frodigh, M.; Bengtsson, P. Effect of shielding gas on welding performance and properties of duplex and superduplex stainless steel welds. Weld. World 2015, 59, 239–249. [Google Scholar] [CrossRef]
  34. Hertzman, S.; Charles, J. On the effect of nitrogen on duplex stainless steels. Rev. Métall. 2011, 108, 413–425. [Google Scholar] [CrossRef]
  35. Du Toit, M. The Behaviour of Nitrogen during the Autogenous Arc Welding of Stainless Steel. Ph.D. Thesis, University of Pretoria, Hatfield, South Africa, 2001. [Google Scholar]
  36. Rokanopoulou, A.; Skarvelis, P.; Papadimitriou, G.D. Welding design methodology for optimization of phase balance in duplex stainless steels during autogenous arc welding under Ar–N2 atmosphere. Weld. World 2019, 63, 3–10. [Google Scholar] [CrossRef]
  37. Hosseini, V.A. Super Duplex Stainless Steels–Microstructure and Properties of Physically Simulated Base and Weld Metal. Ph.D. Thesis, Univesity of West, Trollhattan, Sweden, 2018. [Google Scholar]
  38. Putz, A.; Althuber, M.; Zelić, A.; Westin, E.M.; Willidal, T.; Enzinger, N. Methods for the measurement of ferrite content in multipass duplex stainless steel welds. Weld. World 2019, 63, 1075–1086. [Google Scholar] [CrossRef] [Green Version]
  39. Hosseini, V.A.; Hurtig, K.; Eyzop, D.; Östberg, A.; Janiak, P.; Karlsson, L. Ferrite content measurement in super duplex stainless steel welds. Weld. World 2019, 63, 551–563. [Google Scholar] [CrossRef]
  40. Varbai, B.; Pickle, T.; Májlinger, K. Development and Comparison of Quantitative Phase Analysis for Duplex Stainless Steel Weld. Period. Polytech. Mech. Eng. 2018, 62, 247–253. [Google Scholar] [CrossRef]
  41. Kou, S. Welding Metallurgy, 2nd ed.; John Wiley & Sons Inc.: Hoboken, NJ, USA, 2003; pp. 68–73. [Google Scholar]
  42. Mizukami, H.; Shirai, Y.; Yamanaka, A.; Watanabe, T. Prediction of Density of Stainless Steel. ISIJ Int. 2000, 40, 987–994. [Google Scholar] [CrossRef]
  43. Mundra, K.; Debroy, T. A general model for partitioning of gases between a metal and its plasma environment. Metall. Mater. Trans. B 1995, 26, 149–157. [Google Scholar] [CrossRef]
  44. Palmer, T.A.; Debroy, T. Physical modeling of nitrogen partition between the weld metal and its plasma environnment. Weld. J. 1996, 75, 197–207. [Google Scholar]
  45. Wada, H.; Pehlke, R.D. Solubility of nitrogen in liquid Fe-Cr-Ni alloys containing manganese and molybdenum. Metall. Trans. B 1977, 8, 675–682. [Google Scholar] [CrossRef]
  46. Kobayashi, Y.; Todoroki, H.; Shiga, N.; Ishii, T. Solubility of Nitrogen in Fe-Cr-Ni-Mo Stainless Steel under a 1 atm N2 Gas Atmosphere. ISIJ Int. 2012, 52, 1601–1606. [Google Scholar] [CrossRef]
  47. Anson, D.R.; Pomfret, R.J.; Hendry, A. Prediction of the Solubility of Nitrogen in Molten Duplex Stainless Steel. ISIJ Int. 1996, 36, 750–758. [Google Scholar] [CrossRef]
  48. Dai, K.; Wang, B.; Xue, F.; Liu, S.; Huang, J.; Zhang, J. Formation of Nitrogen Bubbles During Solidification of Duplex Stainless Steels. Metall. Mater. Trans. B 2018, 49, 2011–2021. [Google Scholar] [CrossRef]
  49. Jiang, Z.; Li, H.; Chen, Z.; Huang, Z.; Zou, D.; Liang, L. The Nitrogen Solubility in Molten Stainless Steel. Steel Res. Int. 2005, 76, 740–745. [Google Scholar] [CrossRef]
  50. Japan Society for the Promotion of Science, the 19th Committee on Steelmaking. Steelmaking Data Sourcebook; Gordon and Breach Science Publishers: New York, NY, USA, 1988. [Google Scholar]
  51. Elliot, J.F.; Gleiser, M. Thermochemistry for Steelmaking; Addison-Wesley Pub. Co: Reading, Mass, UK, 1960. [Google Scholar]
  52. Hosseini, V.A.; Karlsson, L. Physical and kinetic simulation of nitrogen loss in high temperature heat affected zone of duplex stainless steels. Materialia 2019, 6, 100325. [Google Scholar] [CrossRef]
  53. Varbai, B.; Adonyi, Y.; Baumer, R.; Pickle, T.; Dobránszky, J.; Májlinger, K. Weldability of Duplex Stainless Steels-Thermal Cycle and Nitrogen Effects. Weld. J. 2019, 98, 78–87. [Google Scholar]
  54. Igual Muñoz, A.; García Antón, J.; Guiñón, J.L.; Pérez Herranz, V. Effect of nitrogen in Argon as a shielding gas on tungsten inert gas welds of duplex stainless steels. Corrosion 2005, 61, 693–705. [Google Scholar] [CrossRef]
  55. Hosseini, V.A.; Wessman, S.; Hurtig, K.; Karlsson, L. Nitrogen loss and effects on microstructure in multipass TIG welding of a super duplex stainless steel. Mater. Des. 2016, 98, 88–97. [Google Scholar] [CrossRef]
Figure 1. Schematic illustration of the nitrogen absorption: (a,c), and desorption: (b,d) during autogenous tungsten inert gas (TIG) welding of DSS.
Metals 09 00762 g001
Figure 2. Determination of the molten pool surface (A) during welding on the end crater surface. Arc energy: 0.53 kJ·mm−1, shielding gas: 100 vol. % Ar.
Metals 09 00762 g002
Figure 3. The effects of shielding gas N2 content (mixed to Ar) on the arc voltage during TIG welding with a constant arc length of 2 mm.
Metals 09 00762 g003
Figure 4. The comparison of the physical (measured) and theoretical (calculated) models of the dissolved total nitrogen in the WM (Nsteel).
Metals 09 00762 g004
Figure 5. The comparison of the different theoretical models and the measured Nsteel values of the weld metals in the case of the 0.68 kJ·mm−1 arc energy.
Metals 09 00762 g005
Figure 6. Metallographic images of weld metal microstructures, TIG welded with constant 0.68 kJ·mm−1 arc energy and different nitrogen containing shielding gases.
Metals 09 00762 g006
Table 1. The nominal chemical composition of the base material duplex stainless steel (DSS) 2205.
DSS GradeThicknessChemical Composition (wt %)
%C%Cr%Ni%Mn%Mo%N 1%Cu%Si%P%S
22055 mm0.0221.64.71.93.10.181 ± 0.0030.30.760.030.001
1 measured by HORIBA EMGA-620W analyzer.
Table 2. First eNX and second γNX order interaction parameters for nitrogen activity of a certain alloying element at 1873 Kelvin [49].
Alloying Element (X)eNXγNX
N0.130-
Mn−0.0243.2 × 10−5
Si0.043-
P0.048-
Cr−0.0483.5 ×∙10−4
Mo−0.0137.9∙× 10−5
Ni0.0113.5∙× 10−5
Table 3. Constants of the linearly fitted lines over the arc voltage values in the different shielding gas N2 ranges (Figure 3).
Arc EnergyShielding Gas N2 Range (beside Ar)Correlation between Arc Voltage and Shielding Gas N2 ContentR2 of the Correlation (-)
(kJ·mm−1)(vol. %)
0.681–10U = 15.5 + 0.40·N20.97
10–50U = 18.5 + 0.09·N20.99
0.531–5U = 16.1 + 0.44·N20.99
5–50U = 17.5 + 0.13·N20.99
Table 4. The adjusted welding current with the arc voltage values in order to keep constant arc energies with constant welding speed of 3 mm·s−1.
Arc EnergyShielding Gas N2 Content (beside Ar)Welding CurrentArc Voltage
(kJ·mm−1)(vol. %)(A)(V)
0.68013015.7
212816.0
511517.8
1010519.5
2010120.2
508823.2
0.53010016.0
29417.0
58818.2
108518.8
208020.0
506724.0
Table 5. The calculated average molten pool geometries measured on the solidified WM.
Arc EnergyShielding Gas N2 Content (beside Ar)Calculated Average Molten Pool Surface, ACalculated Average Molten Pool Length, LAverage Penetration Depth, hVolume, V
(kJ·mm−1)(vol. %)(mm2)(mm)(mm)(mm3)
0.68040.28.11.251.8
242.08.21.253.3
542.38.41.256.3
1043.18.41.358.8
2043.98.81.469.5
5046.69.21.675.4
0.53020.15.60.411.2
221.95.70.712.5
522.56.00.915.6
1024.86.11.115.9
2025.36.21.119.8
5030.96.31.520.8
Table 6. Comparison of the measured Nsteel values to our improved theoretical model and to Du Toit’s model [35].
Arc EnergyShielding Gas N2 Content (beside Ar)Measured Average NsteelCalculated Nitrogen Content of the WM (Nsteel)
Our ModelError of Our Model to the Measured NsteelDu Toit’s [35] ModelError of Du Toit’s Model [35]
(kJ·mm−1)(vol. %)(wt %)(wt %)(%)(wt %)(%)
0.6800.1700.13918.20.09742.9
20.1920.1739.90.13728.6
50.1940.1845.20.15619.6
100.2090.1937.70.17416.7
200.2120.2024.70.1977.1
500.2230.2163.10.2376.3
0.5300.1780.11634.80.07458.4
20.1910.1729.90.13529.3
50.1910.1843.70.15618.3
100.2070.1936.80.17415.9
200.2080.2032.40.1975.3
500.2310.2166.50.2372.6

