Article

Effect of Microstructure and Texture on Mechanical Properties of Resistance Spot Welded High Strength Steel 22MnB5 and 5A06 Aluminium Alloy

Engineering Research Centre of Advanced Manufacturing Technology for Automotive Structural Parts, Ministry of Education, Beijing University of Technology, Beijing 100124, China
*
Author to whom correspondence should be addressed.
Metals 2019, 9(6), 685; https://doi.org/10.3390/met9060685
Submission received: 20 May 2019 / Revised: 11 June 2019 / Accepted: 13 June 2019 / Published: 14 June 2019

Abstract

:
The present study aims to investigate the effect of microstructure and texture on mechanical properties of resistance spot welding of high strength steel 22MnB5 and 5A06 aluminium alloy as a function of welding parameters. The pseudo-nugget zones (NZs) at the steel side have undergone full recrystallisation with a fine-grained ferrite structure containing a small amount of retained austenite and a high hardness of approximately 500 HV, which is a 35% increase in hardness compared to the base material (BM) with fine lath martensitic structure. The NZs at the Al side contain both a recrystallisation texture and shear texture. Higher tensile shear strength with increasing weld time could be linked to the random texture at the Al side. The highest tensile shear strength was achieved at an intermetallic layer thickness of 4 mm.

1. Introduction

In recent years, with the rapid development of automotive industry, there is an increasing demanding of automobile safety and comfort, energy saving and environmental protection. In the automotive industry, changes in automotive design and material use have been implemented to improve fuel economy and vehicle performance. The automobile industry is increasingly interested in the use of aluminium in response to the demand for lightweight structures [1,2]. In some cases, Al alloys are replacing steel in structural parts to give lighter and more energy efficient vehicles [1,3]. Light-weighting of vehicles gives an opportunity for simultaneously cutting petroleum consumption and greenhouse gas emissions. Among the potential light-weight materials, high-strength steel and aluminium have been proven to achieve weight reduction while meeting vehicle safety and performance requirements [4]. The autobody structure made of steel and aluminium takes into account the advantages of steel in strength and price, the aluminium alloy sheet in weight loss and good energy absorption, to achieve a high strength and lightweight autobody under the premise of reducing costs [5]. Autobody assembly requires between 7000 and 12,000 welding spots. Therefore, resistance spot welding is an important process in autobody assembly [1].
A key observation of resistance spot welding of Al and steel include investigating on the intermetallic compound (IMC) layer formed at the welding interface, microstructure and mechanical properties of the welded spots [6,7,8,9,10,11,12,13,14]. A study of resistance spot welded (RSWed) Al and steel by Oikawa et al. [6] reported that the thickness of the IMC layer increased with increasing welding current, in addition, Qiu et al. [7,8,9] found that tensile shear strength decreased with increasing welding current and the tensile shear strength decreased with increasing thickness of the IMC layers [10,11]. However, Sun et al. [11] and Cui et al. [12] both found that with increasing welding current, the tensile shear strength firstly increased then decreased at an excessive welding current. Oikawa et al. [6] found that the tensile failure mode varied with the welding current including shear fracture (12 kA), plug fracture (9.5 kA) and interfacial fracture (18 kA).
Failure mode and mechanical properties of the welded spots highly depend on the thickness of the IMC layer [12,13]. Zhang et al. [13] reported that the characteristics of the IMC layer varied with locations at the interface in the welded joint due to different temperatures imposed along the welded spots. Qiu et al. [7] found that the discontinuously distributed IMC layer was beneficial for improving the strength of the welded spots and that cavities and other defects can be removed by controlling the thickness of the IMC layer [13]. A study of RSWed dissimilar Al and steel by Shin et al. [14] reported that a highly brittle thinner IMC layer with a thickness of 2.39 μm had a higher strength.
However, the tensile shear strength was not affected by the thickness of the IMC layer when the IMC layer was thin [9]. And the tensile shear strength of the welded spots of steel and aluminum alloy was not affected by the IMC layer with a thickness of 4 μm [13,15]. Moreover, Zhang et al. [13] proposed that the tensile shear strength of the welded spots was not affected by the IMC layer using an optimized electrode and a study of a variety of welded spots by Akinay and Hayat [15] also reported that the spot weldability of DP450/AA6061 is the better than the other combination of dissimilar Al and steel when the tensile shear strength was not affected by the IMC layer.
Qiu et al. [9] found that the weld nugget was formed at the aluminium side only due to the fact that the metallurgical reaction occurred between the liquid aluminium and the solid iron during the welding process. A study of RSWed 16Mn steel 6063 Al alloy by Sun et al. [11] reported that the aluminium nugget zones (NZs) consisted of cellular dendrites and equiaxed dendrites with tangled dislocations and fine second phase particles. However, for RSWed aluminium and high strength steel, the high strength steel side with initial martensitic structure was not understood, and the effect of texture of aluminium and steel on mechanical properties has not been reported before, thus, the present paper aims to investigate microstructure, texture evolution and mechanical properties of RSWed aluminium and high strength steel with initial martensitic structure.

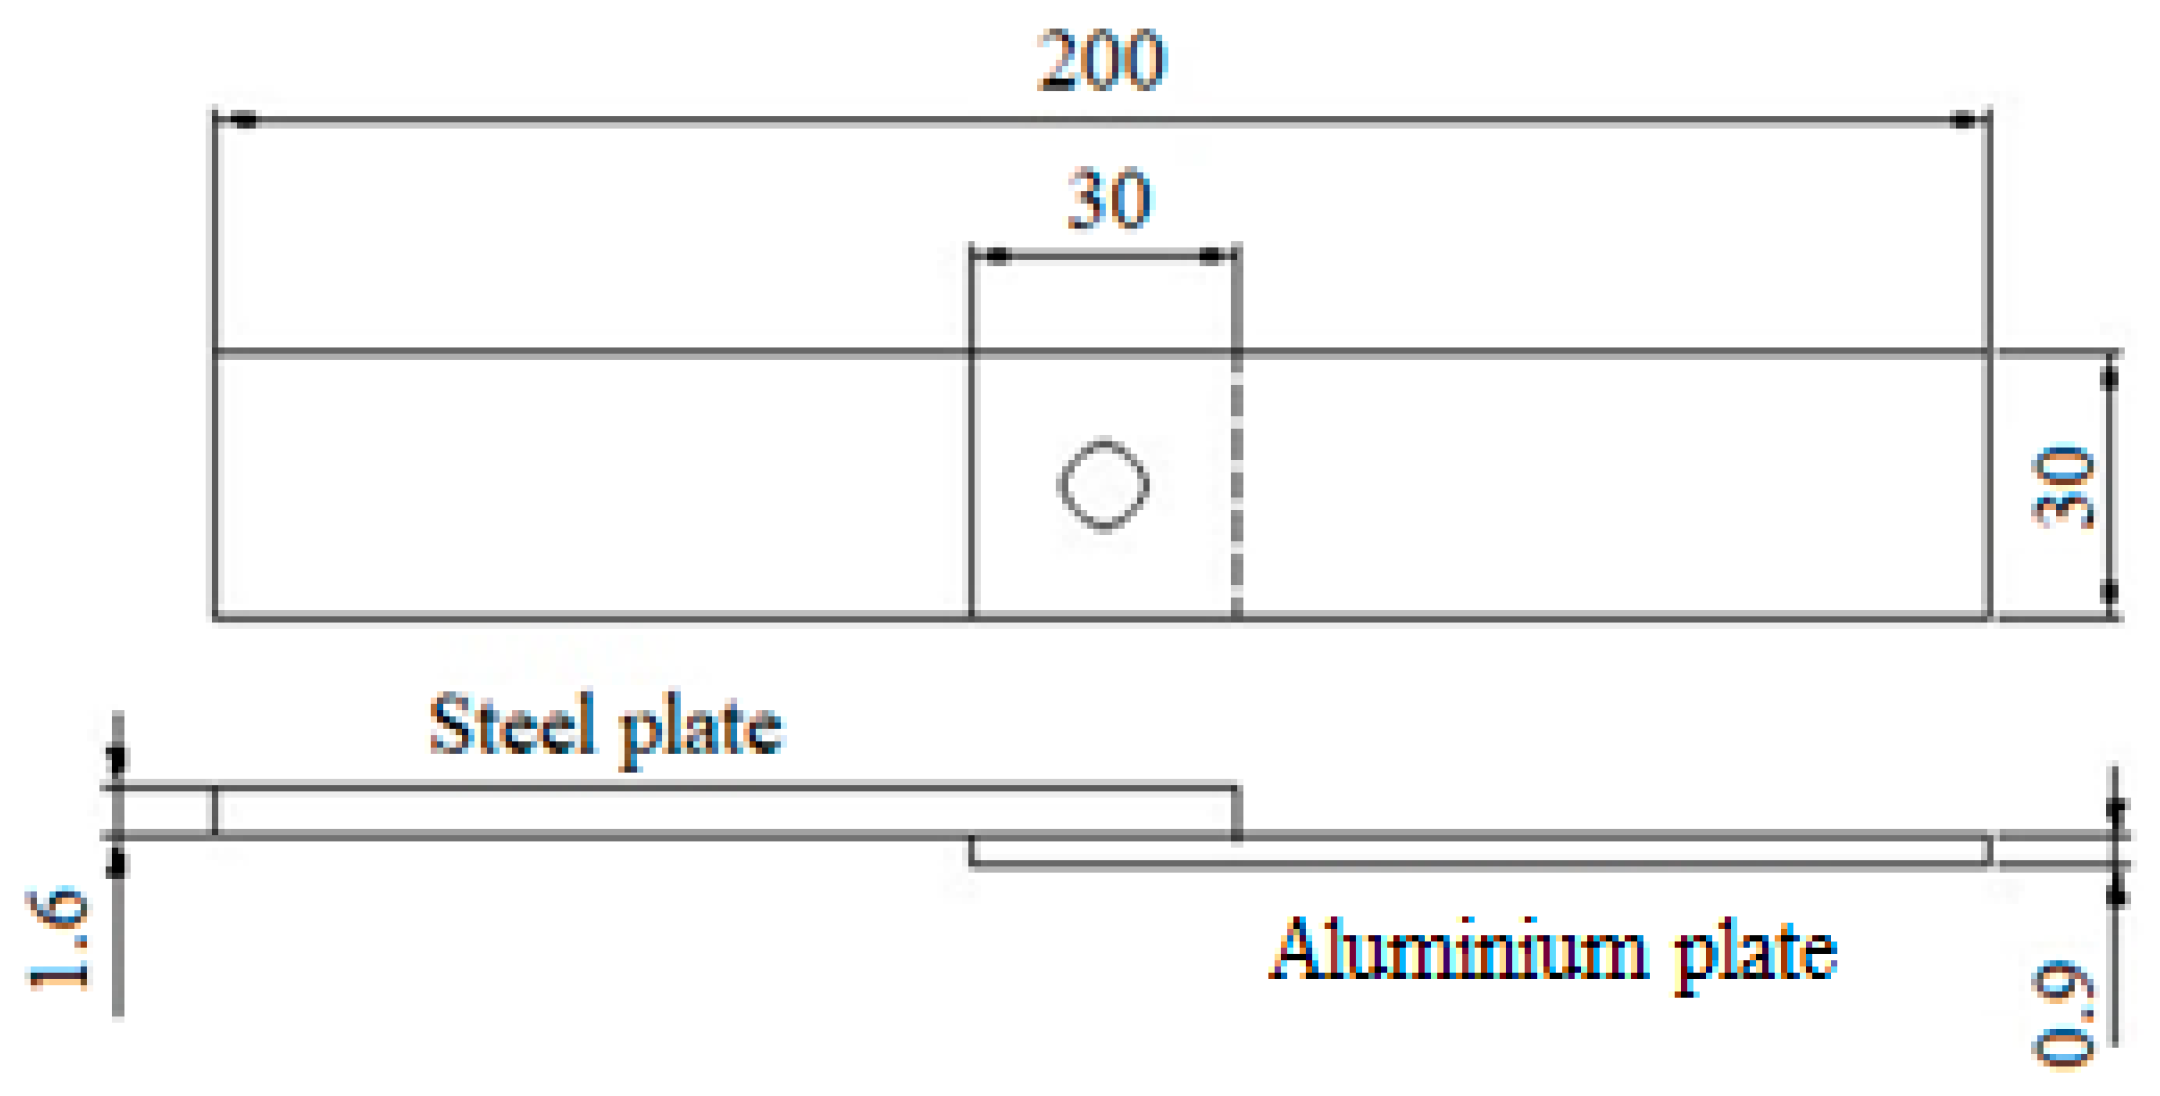
2. Materials and Methods

The chemical composition of the base material (BM; boron steel 22MnB5 and 5A06 Al alloy) is shown in Table 1 from standard data. The RSW equipment was the German NIMAK electric servo spot welding robot system using spherical electrodes. Schematic drawing of the lap joint of hot stamped high strength steel and 5A06 alloy is shown in Figure 1. The dimensions of the spot-welded dissimilar Fe/Al specimen was 30 mm by 120 mm by 0.9 mm with a lap length of 30 mm and the thickness of the steel plate and the aluminium plate were 1.6 mm and 0.9 mm, respectively. It should be noted that weld distortion is prone to occur when the thickness of aluminium alloy is too thin, therefore, the high-strength steel sheet was placed on the top of the aluminium sheet. The welding parameters based on our previous investigations are shown in Table 1.
Roughly forty specimens were prepared, and the specimens for microstructure analysis were prepared using standard procedures for cutting, grinding and polishing. The sample was first ground by progressively finer grades of silicon carbide grinding paper (1200 grit and 1500 grit) and polished using 5, 2.5 and 1 μm diamond pastes. For microstructure analysis, the etchant used for the high strength steel part was a solution consisting of 4 mL nitric acid and 100 mL ethanol. Keller solution (H2O:HNO3:HCl:HF = 190:5:3:2) was employed to etch the 5A06 Al part. The sample was immersed in the Keller etchant for 30 s. Microstructure analysis was undertaken using Olympus-Lext confocal laser scanning microscopy (Olympus Corporation, Tokyo, Japan). Electron backscatter diffraction (EBSD) technology was employed to investigate the microstructure and texture of the dissimilar Fe/Al joints. For EBSD analysis, samples were then electropolished by 30% nitric acid in methanol for 60 s at approximately −20 °C with a voltage of 12 V for 5A06 Al alloy, and the electropolishing solution for 22MnB5 steel was 80 mL ethanol + 12 mL distilled water + 8 mL perchloric acid. EBSD was carried out using an field emission scanning electron microscope with attached TSL Genesis 7000 EBSD (EDAX/TSL Corporation, NY, USA). One specimen of each pair of parameters was prepared for optical microscopy and EBSD, respectively.
The microhardness test was carried out on both the steel side and the aluminium side near the weld interface using the Vicker’s method with a load of 200 g for 15 s. Ten measurements were made for each sampling point on a grid of 0.25 mm and their average was taken as the microhardness of the sampling point. Tensile shear tests were performed at room temperature using a universal testing machine INSTRON-5569 (INSTRON Inc., Boston, MA, USA), the tensile axes were parallel to the transverse direction. The tensile velocity was 5 mm/min. Three tensile samples were tested for each pair of welding parameters, and the tensile shear strength was the averaged value of the three sets of data.

3. Results

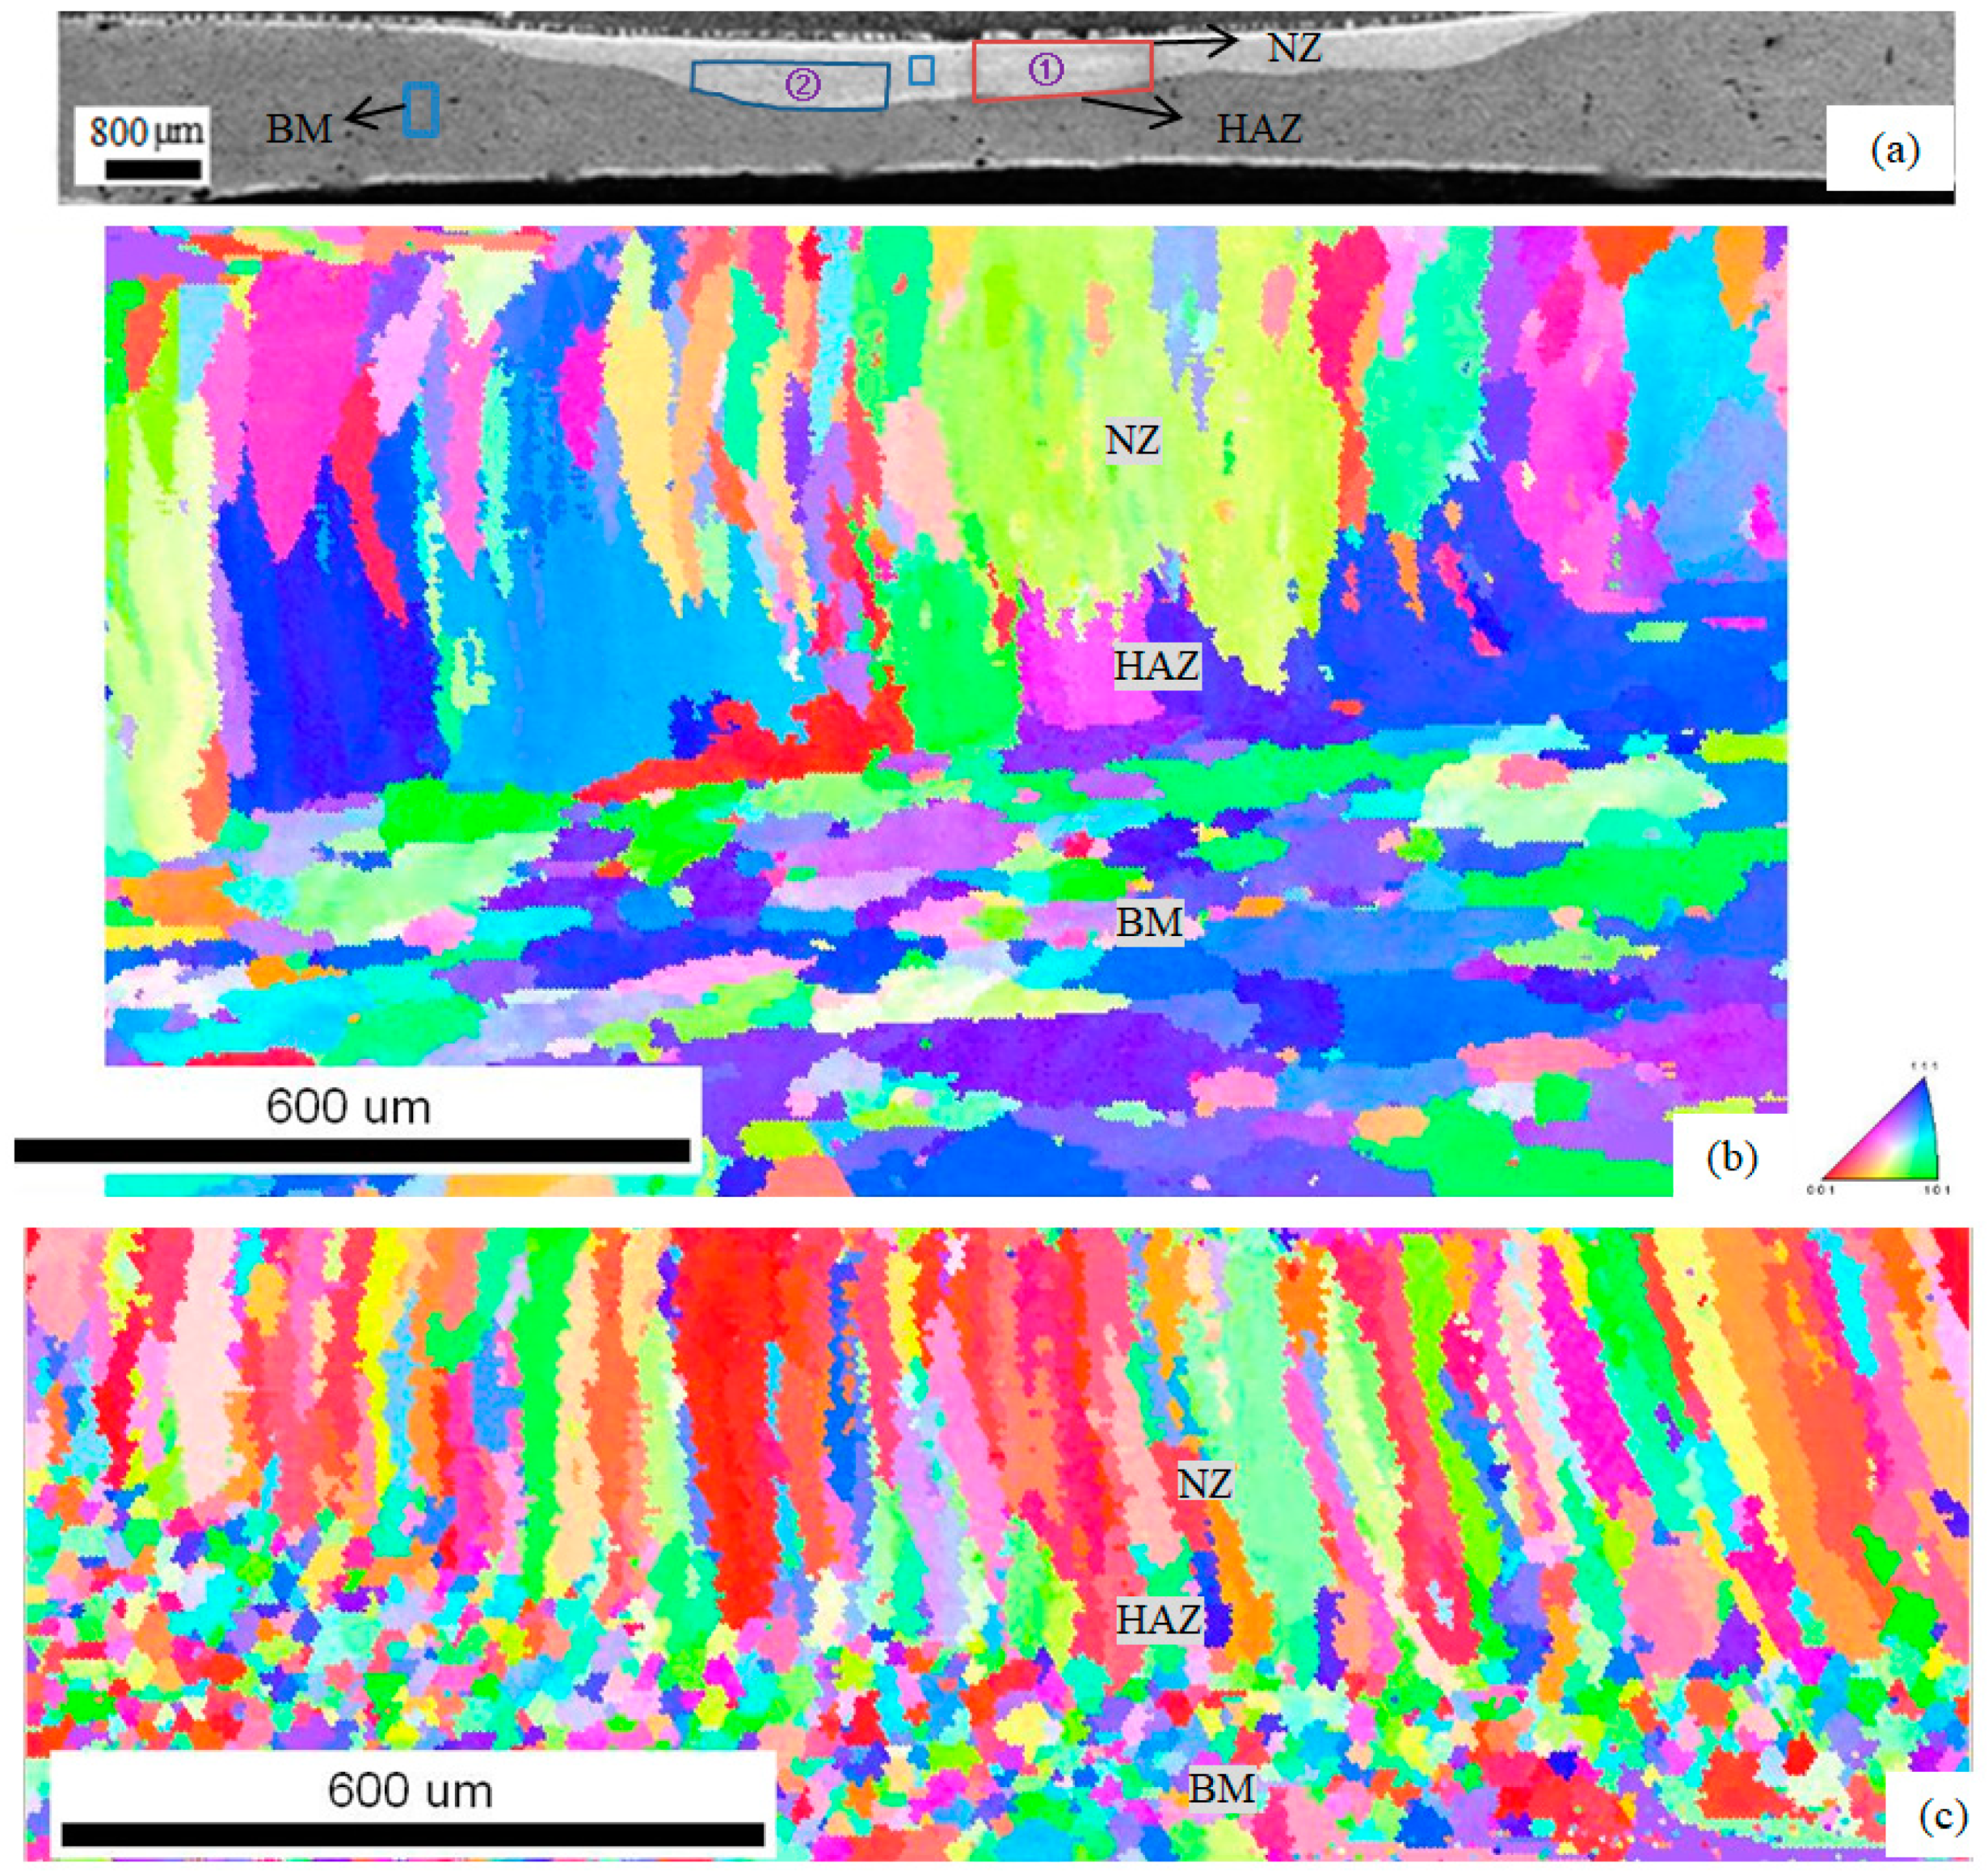
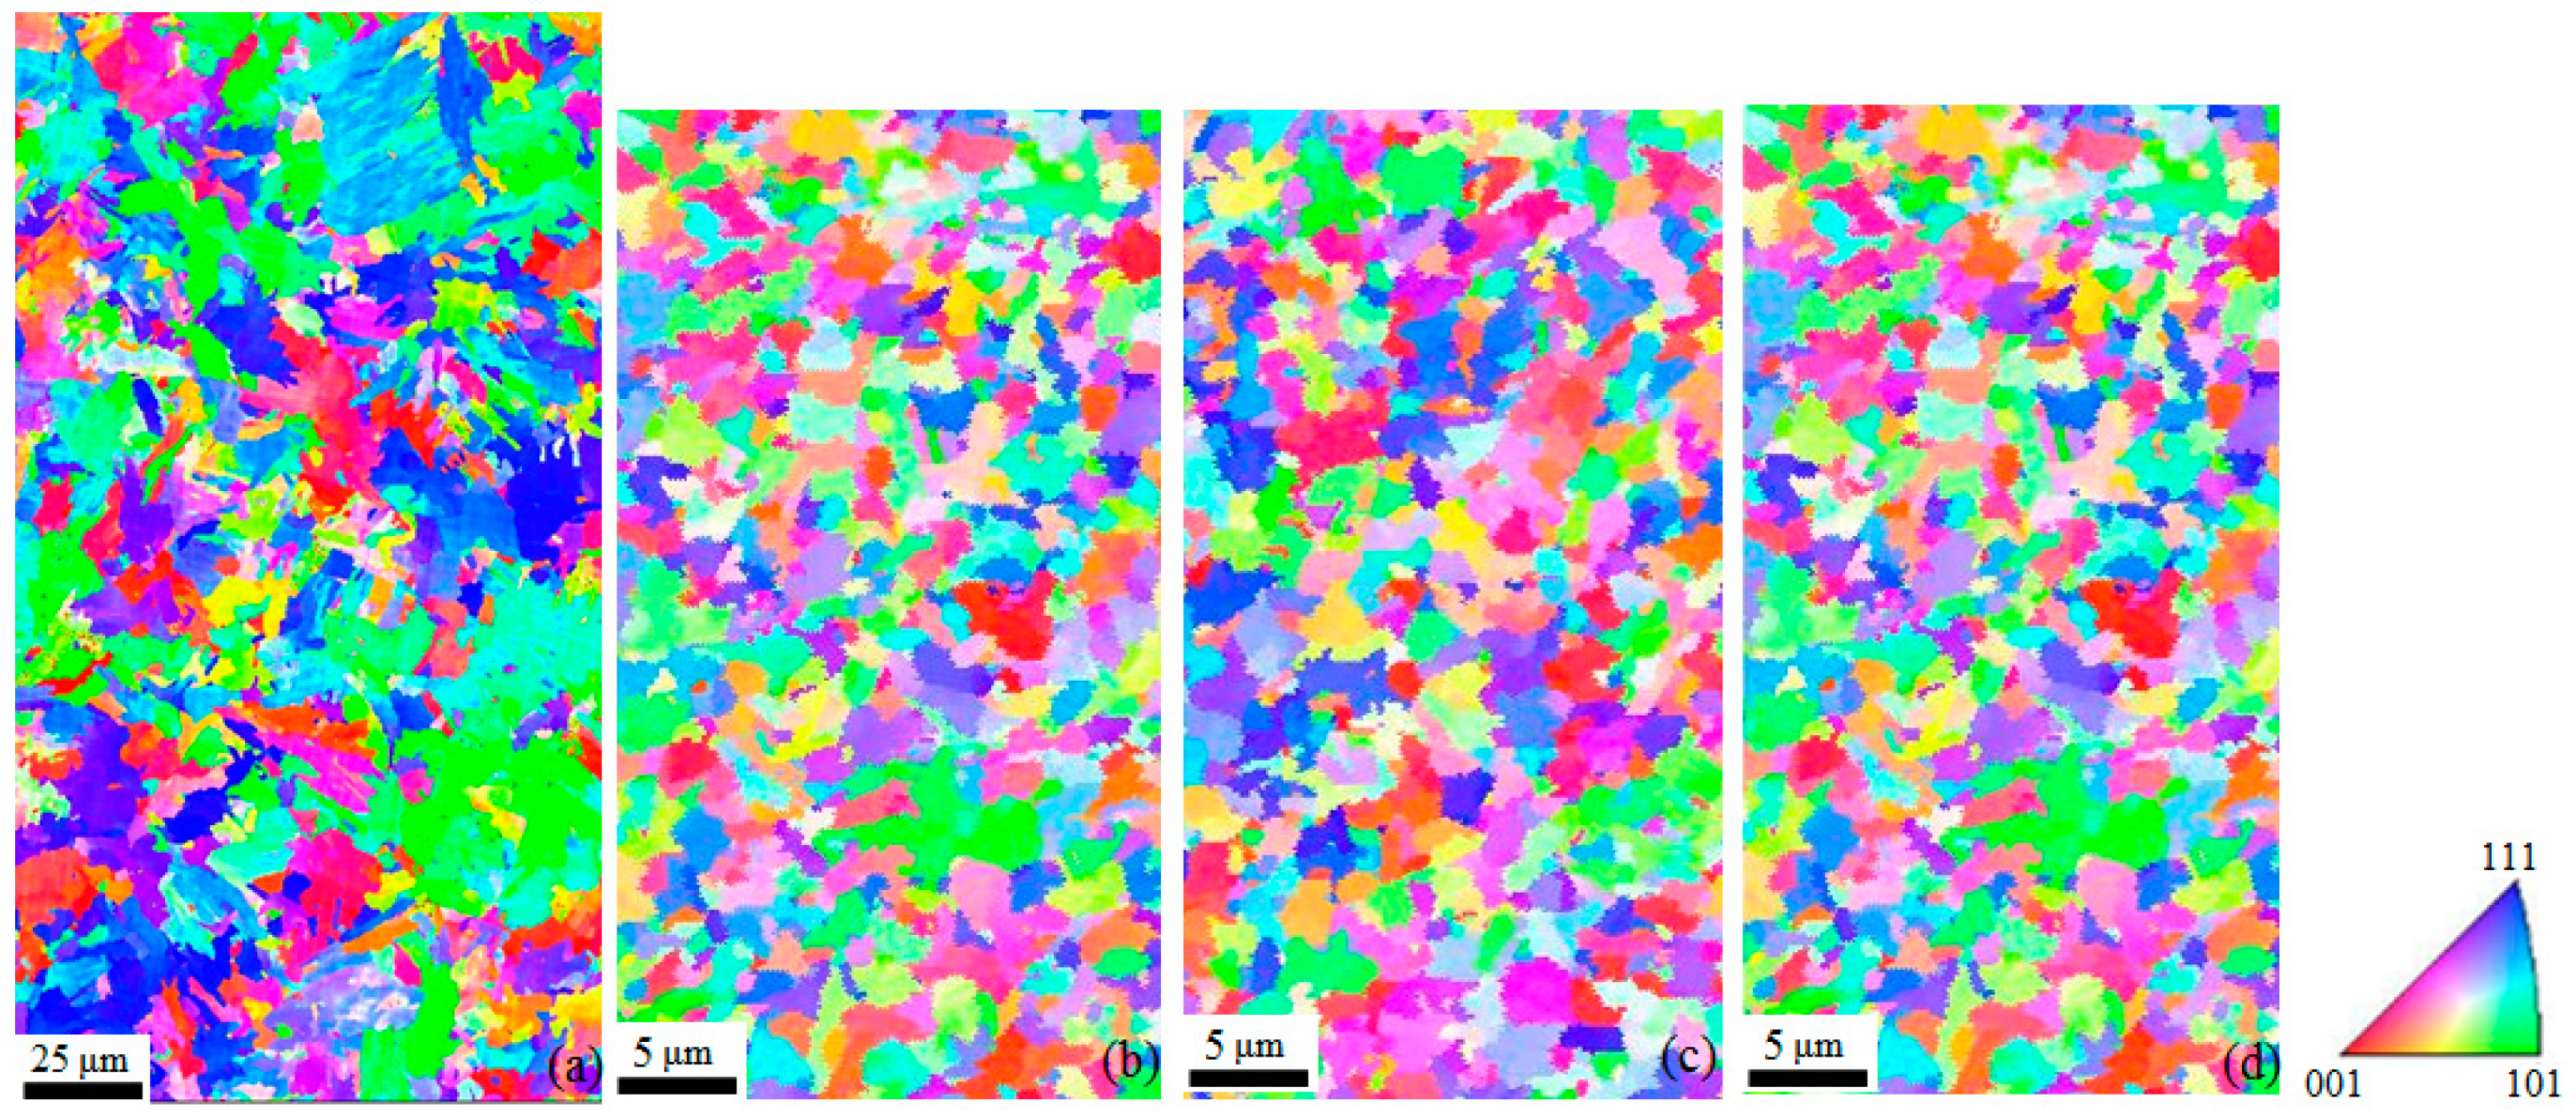
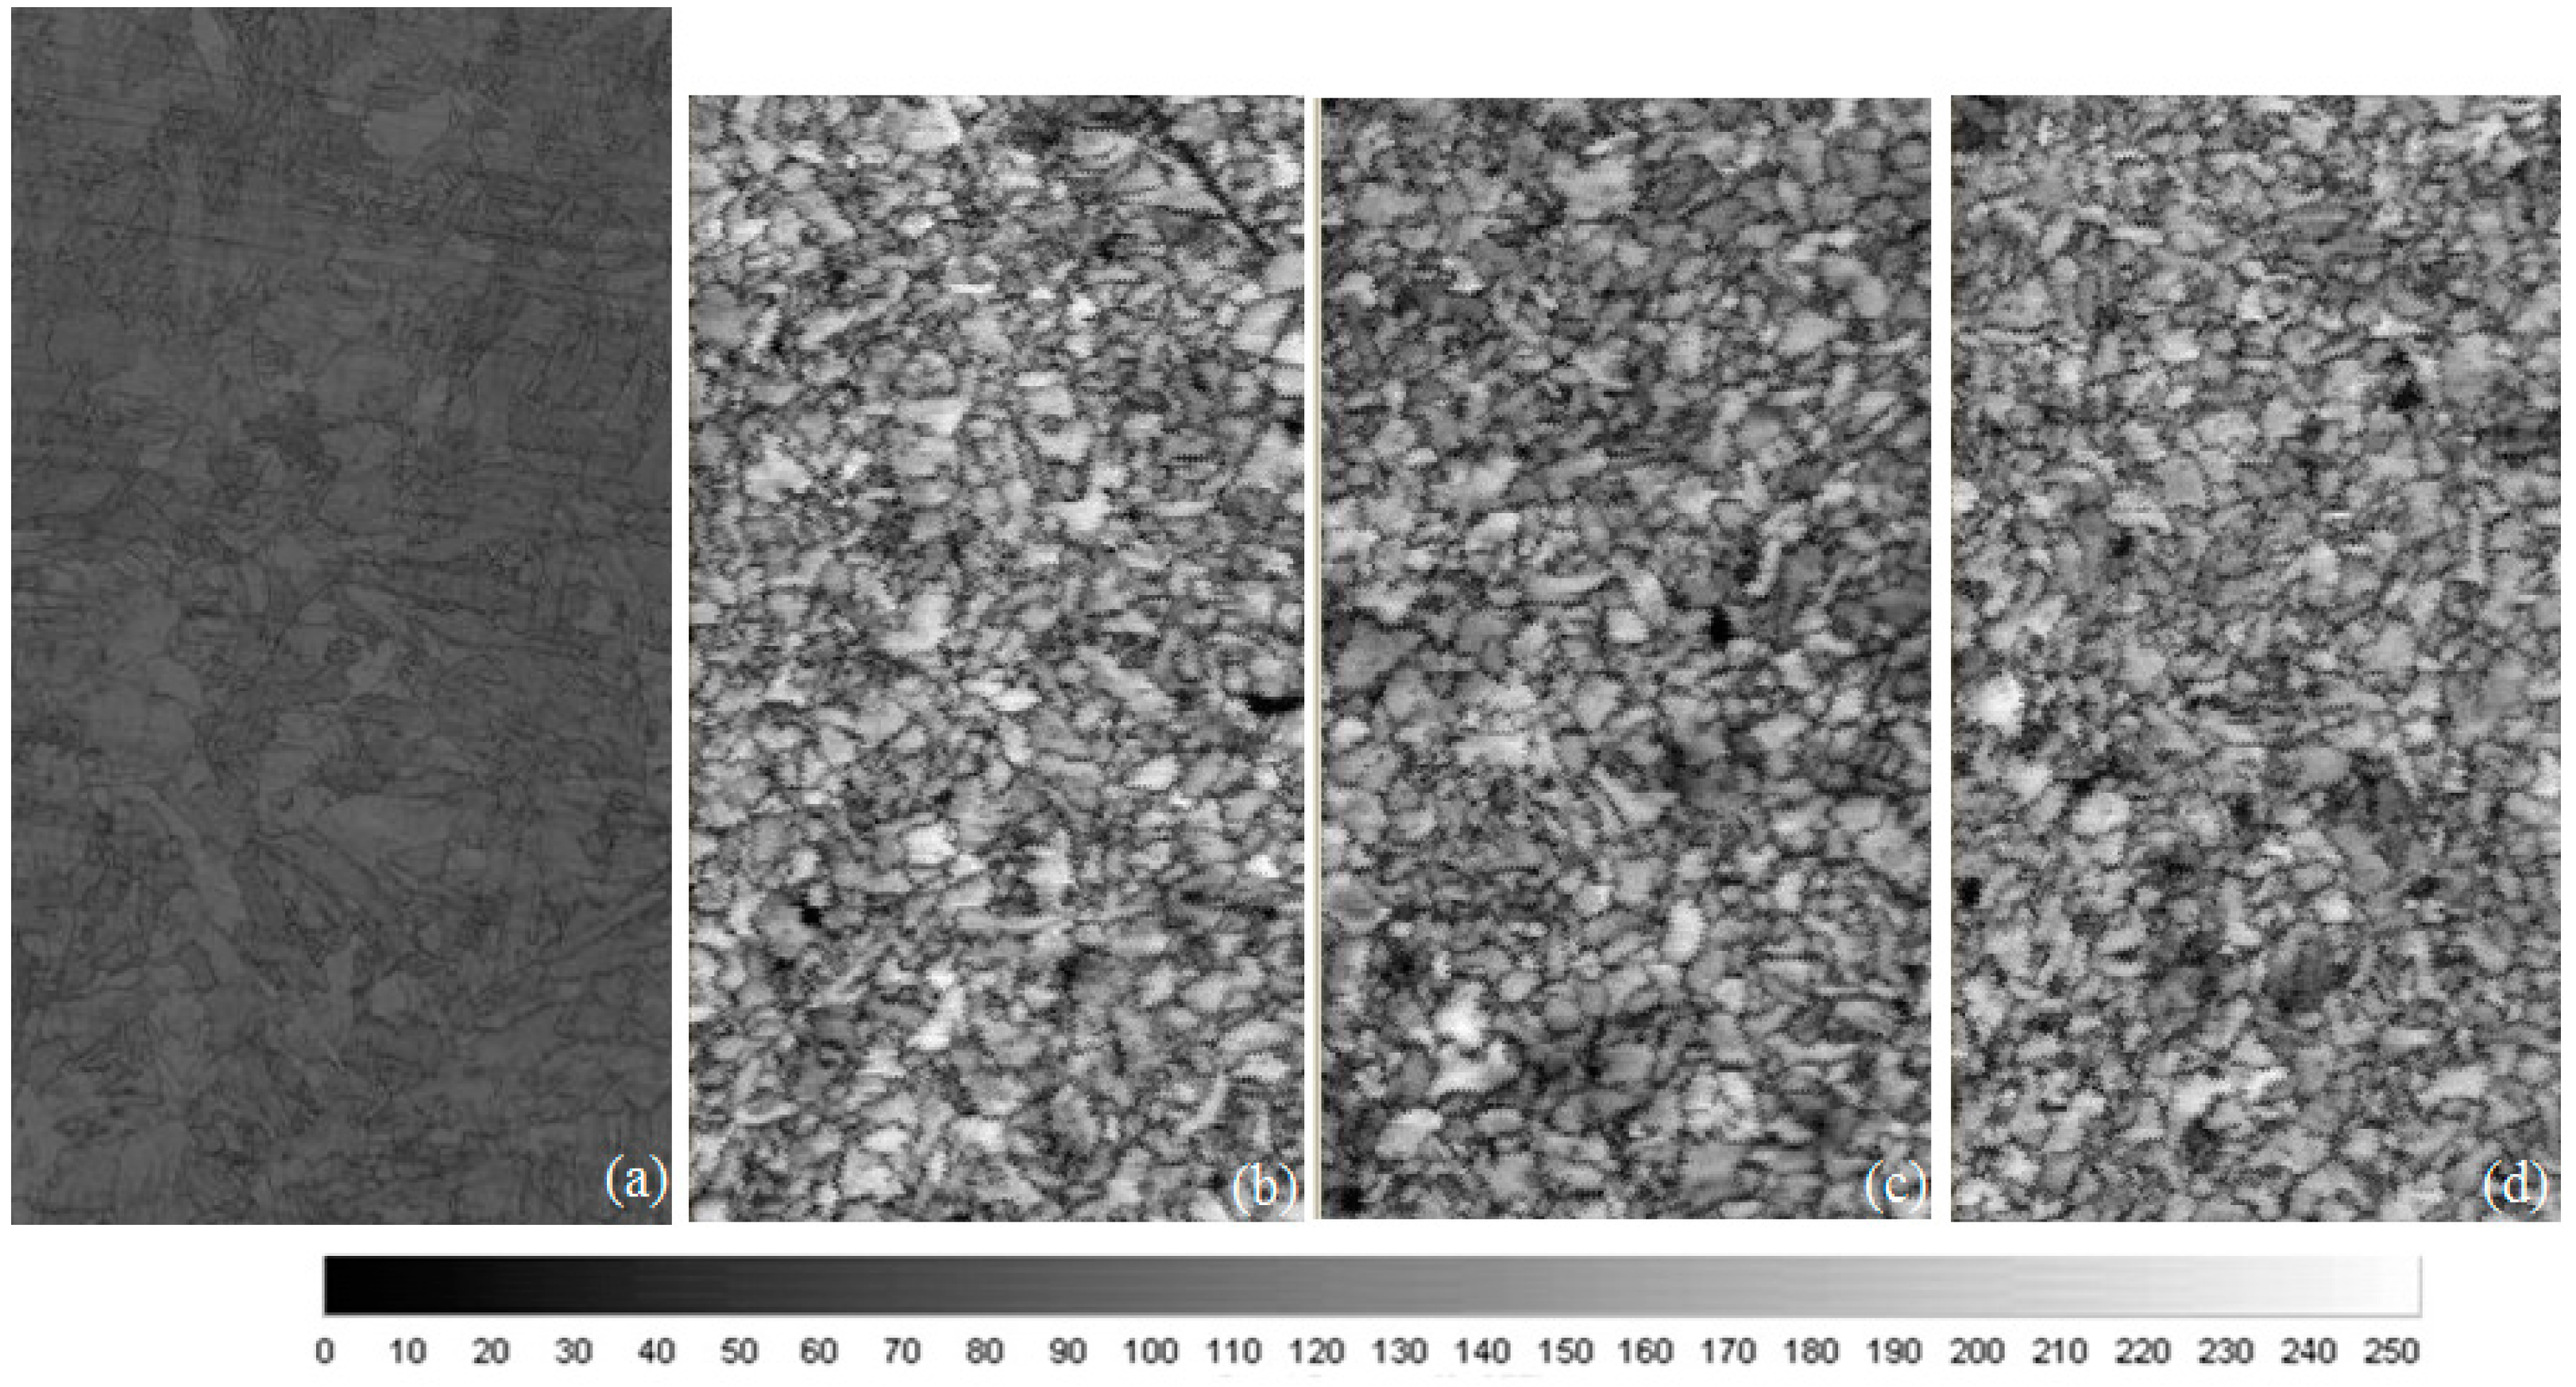
3.1. Microstructure in the Dissimilar Fe/Al Joint

Figure 2 shows the photographs of the welded spots using different welding parameters. The two pictures marked as (a), (b), (c), (d) are from the Al side and the steel side, respectively.
A cross section of the specimen with respect to the normal direction and the micrographs of the different regions of the welded joints are shown in Figure 3. The NZ of the spot-welded dissimilar Fe/Al joint had a shape of a bowl, as shown in Figure 3 displaying the morphology of the spot-welded dissimilar joints of Al and high strength steel. The high strength steel and the 5A06 aluminium alloy were difficult to melt together due to the great difference between the physical properties of steel and that of Al, such as great difference in density and melting point. Moreover, the high strength steel with an initial martensitic structure has a low weldability due to its higher hardening ability after quenching [16,17]. The RSWed joints of dissimilar Al and high strength steel (central part of Figure 3) could be classified into the base material (BM) (Figure 3a), the heat affected zone (HAZ) (Figure 3b) and the nugget zone (NZ) (Figure 3c) [17], and the three orthogonal directions in the welds were the welding direction (WD), the normal direction (ND) and the transverse direction (TD), as shown in the bottom right of Figure 3. The NZ was formed at Al side, however, the steel nugget was not formed and the steel side had characteristics rather of welding–brazing due to the difference in the melting points between steel and the Al alloy. However, Figure 3c shows that the region near the interface at the steel side had refined grains indicating that this region could be defined as pseudo-NZ. The steel BM (Figure 3a) showed a typical microstructure of hot stamped steel with ultimate tensile strength larger than 1500 MPa consisting of coarse-lathed martensite within prior austenite grains, at the steel side, the HAZ retained the lath martensite and a new type of grain structure other than the lath martensite were developed in the HAZ, and grains were significantly refined in the NZ with an equiaxed microstructure. It was seen that size of the prior austenite increased from the BM to the HAZ, this result was in accordance with a study of RSWed steel by Kianersi et al. [18] who also found that size of the prior austenite increased from the BM to the HAZ. In the lower part of Figure 3 at the Al side, the BM (Figure 3d) had an average grain size of 15μm and grains of the NZ (Figure 3e) were refined to an average size of 3 μm, and the fine elongated grains perpendicular to the central plane in the NZ had a clear growth direction pointing from the fusion boundary near the HAZ to the central plane and its growth direction was parallel to the WD.
Large inverse pole figure colouring (IPF) maps of 8.5 kA and 300 ms with a coarse BM and 9.5 kA and 300 ms with a fine BM at a step size of 5 µm are shown in Figure 4. The regions ① and ② are from two samples, but for simplification, the regions ① and ② shown in the upper image of Figure 4 are in one sample. Figure 5 shows the IPF maps of the BM, the HAZ and the NZ of the Al side parallel to the Z axis (ND) at a step size of 0.8 µm at welding parameters of (200–300 ms)-(8.5–9.5 kA) with a coarse BM and 300 ms-9.5 kA with a fine BM.
It is seen from Figure 4 and Figure 5 that two types of the BM with different morphology were chosen, the coarse BM in rolling state has a coarse grain structure and the fine BM produced by thermo-mechanical treatment has a fine grain structure. However, it should be noted that the EBSD scan (Figure 4) using a larger step size of 5 µm was not able to draw all the grains, but it showed that grains had been significantly refined in the NZ using a fine-grained BM and a greater welding current. It was seen that grains of the HAZ and the NZ at the Al side were elongated along the WD, which showed agreement with the optical micrograph of the NZ (Figure 3e). Table 2 displays the volume fraction of grain boundary angles for the BM, the HAZ and the NZ at the Al side consisting of low angle grain boundaries (LAGBs) ranged from 2° to 15° and high angle grain boundaries (HAGBs) larger than 15°.
Figure 6 shows the IPF maps of the HAZ and the pseudo-NZ with different welding parameters at the steel side. The HAZ showed a mixed microstructure of ferrite and martensite; the pseudo-NZs consist of equiaxed ferrite and a small amount of retained austenite [19]. Figure 7 and Figure 8 are the grain size distribution and the misorientation angle distribution of the HAZ and the pseudo-NZ with different welding parameters at the steel side, respectively. It was then calculated that the BM has an average grain size of 18.85 μm and the average grain size in the pseudo-NZ of the welded spots at parameters of 300 ms-8.5 kA, 200 ms-9.5 kA, and 300 ms-9.5 kA were 4.28 μm, 4.14 μm and 4.46 μm, respectively. It was seen that the HAZ had a much larger grain size than the NZs at all of the three welding parameters and the microstructure of the pseudo-NZs with different welding parameters were similar in terms of grain orientation and grain size.
Figure 9 and Figure 10 are the image quality maps of the BM, the HAZ and the NZ (or pseudo-NZ for steel) produced by different welding parameters at the Al side and the steel side, respectively. At the Al side, the fine BM (Figure 9b) had a darker colour than the coarse BM (Figure 9a), which would suggest that the fine BM underwent more deformation than the coarse BM. Similarly, more deformation was imposed on the HAZ and the NZ (Figure 9f) of the welded spots with a fine BM compared to the HAZ and the NZ (Figure 9e) of the welded spots with a coarse BM at welding parameter of 300 ms-9.5 kA, whereas, the HAZ and the NZ (Figure 9c–e) of all the welded spots with a coarse BM had the same amount of deformation as they have similar distribution of grey colour. It should be noted that the dark lines aligning with the WD in the HAZ and the NZ at 200 ms-9.5 kA (Figure 9d) were the LAGBs, whereas, the dark lines consisted of HAGBs in the other regions at welding parameters of 300 ms-(8.5–9.5 kA) with a coarse BM and 300 ms-9.5 kA with a fine BM.
At the steel side, the HAZ consisted of martensite and ferrite, and the pseudo-NZs were composed of fine ferrite and retained austenite located at the ferrite grain boundaries. The HAZ (Figure 10a) had a much darker colour than the pseudo-NZs at different welding parameters (Figure 10b–d) indicating high dislocation density in the HAZ compared to the pseudo-NZs, the martensitic structure in the HAZ had high dislocation density, which showed agreement with Chao et al. [19] who observed high density of dislocation lines appearing as dislocation tangles and dislocation walls in the martensitic microstructure of hot stamped 22MnB5 high strength steel. In addition, the martensitic structure had a darker colour in the band contrast map with low pattern quality due to the higher crystal lattice imperfection, while ferrite appeared bright [20]. It should be noted that all the pseudo-NZs had a similar dark colour indicating that the deformation state retained the same with increasing welding current and with increasing welding time.

3.2. Texture of the Dissimilar Fe/Al Joint

Texture components are often described by crystallographic indices (a plane and direction) [21]. Table 3 and Table 4 show the texture components developed in the BM, the HAZ and the NZ (or the pseudo-NZ for steel) at the Al side and at the steel side, respectively [22]. The texture components were calculated from the three Euler angles φ1, Φ and φ2 in orientation distribution function (ODF). Table 3 shows that the main texture components developed in the Al side are composed of a deformation texture and recrystallisation texture. Cube {001}<100>, Goss {110}<001>, Q {013}<123>, RCRD1 {013}<001> and RCND1 {001}<310> are recrystallisation texture components; shear1 (001)<110>, shear2 {111}<110>, brass {110}<112> and S {123}<634> are deformation texture components. Cube orientation is known as a typical recrystallised texture in Al alloys [23]. Table 2 shows that cube texture was mainly observed in the NZ at 300 ms-9.5 kA with a fine BM, and the coarse BM and the NZ of 200 ms, 300 ms-9.5 kA were dominated by shear texture. The torsion tests of Face-Centered Cubic (fcc) materials Al and Cu usually produce the shear1 and shear2 texture components [24], moreover, the simple shear components Shear1 and Shear3 {112}<110> were developed in the stir zone of friction stir welded Al alloys [25,26]. At the Al side, the recrystallisation texture in the NZ at 300 ms-9.5 kA with a coarse BM is much stronger than that in the other NZs.
It was observed that the texture components at the steel side (Table 4) were weak as their intensity value was low, indicating that texture was randomly distributed at the steel side. The texture components A1, A2, {001}<110>, F {110}<001> and E (110)<111> [27] were developed in the weld zones at the steel side. A1 and A2 belong to the steel rolling texture and the E (110)<111> component belong to the steel shear texture [28]. The F {110}<001> component in the ferrite of the pseudo-NZ is inherited from the cube {100}<001> component of the parent austenite recrystallisation texture [29]. The transformation texture {001}<110> in the ferrite of the pseudo-NZ also originates from the cube {100} <001> component [30,31,32]. Thus, both the F {110}<001> component and the {001}<110> component in the ferrite of the pseudo-NZ are recrystallisation texture components. It is seen that the steel pseudo-NZ at 200 ms-9.5 kA had a slightly stronger texture than the other pseudo-NZs and the HAZ.

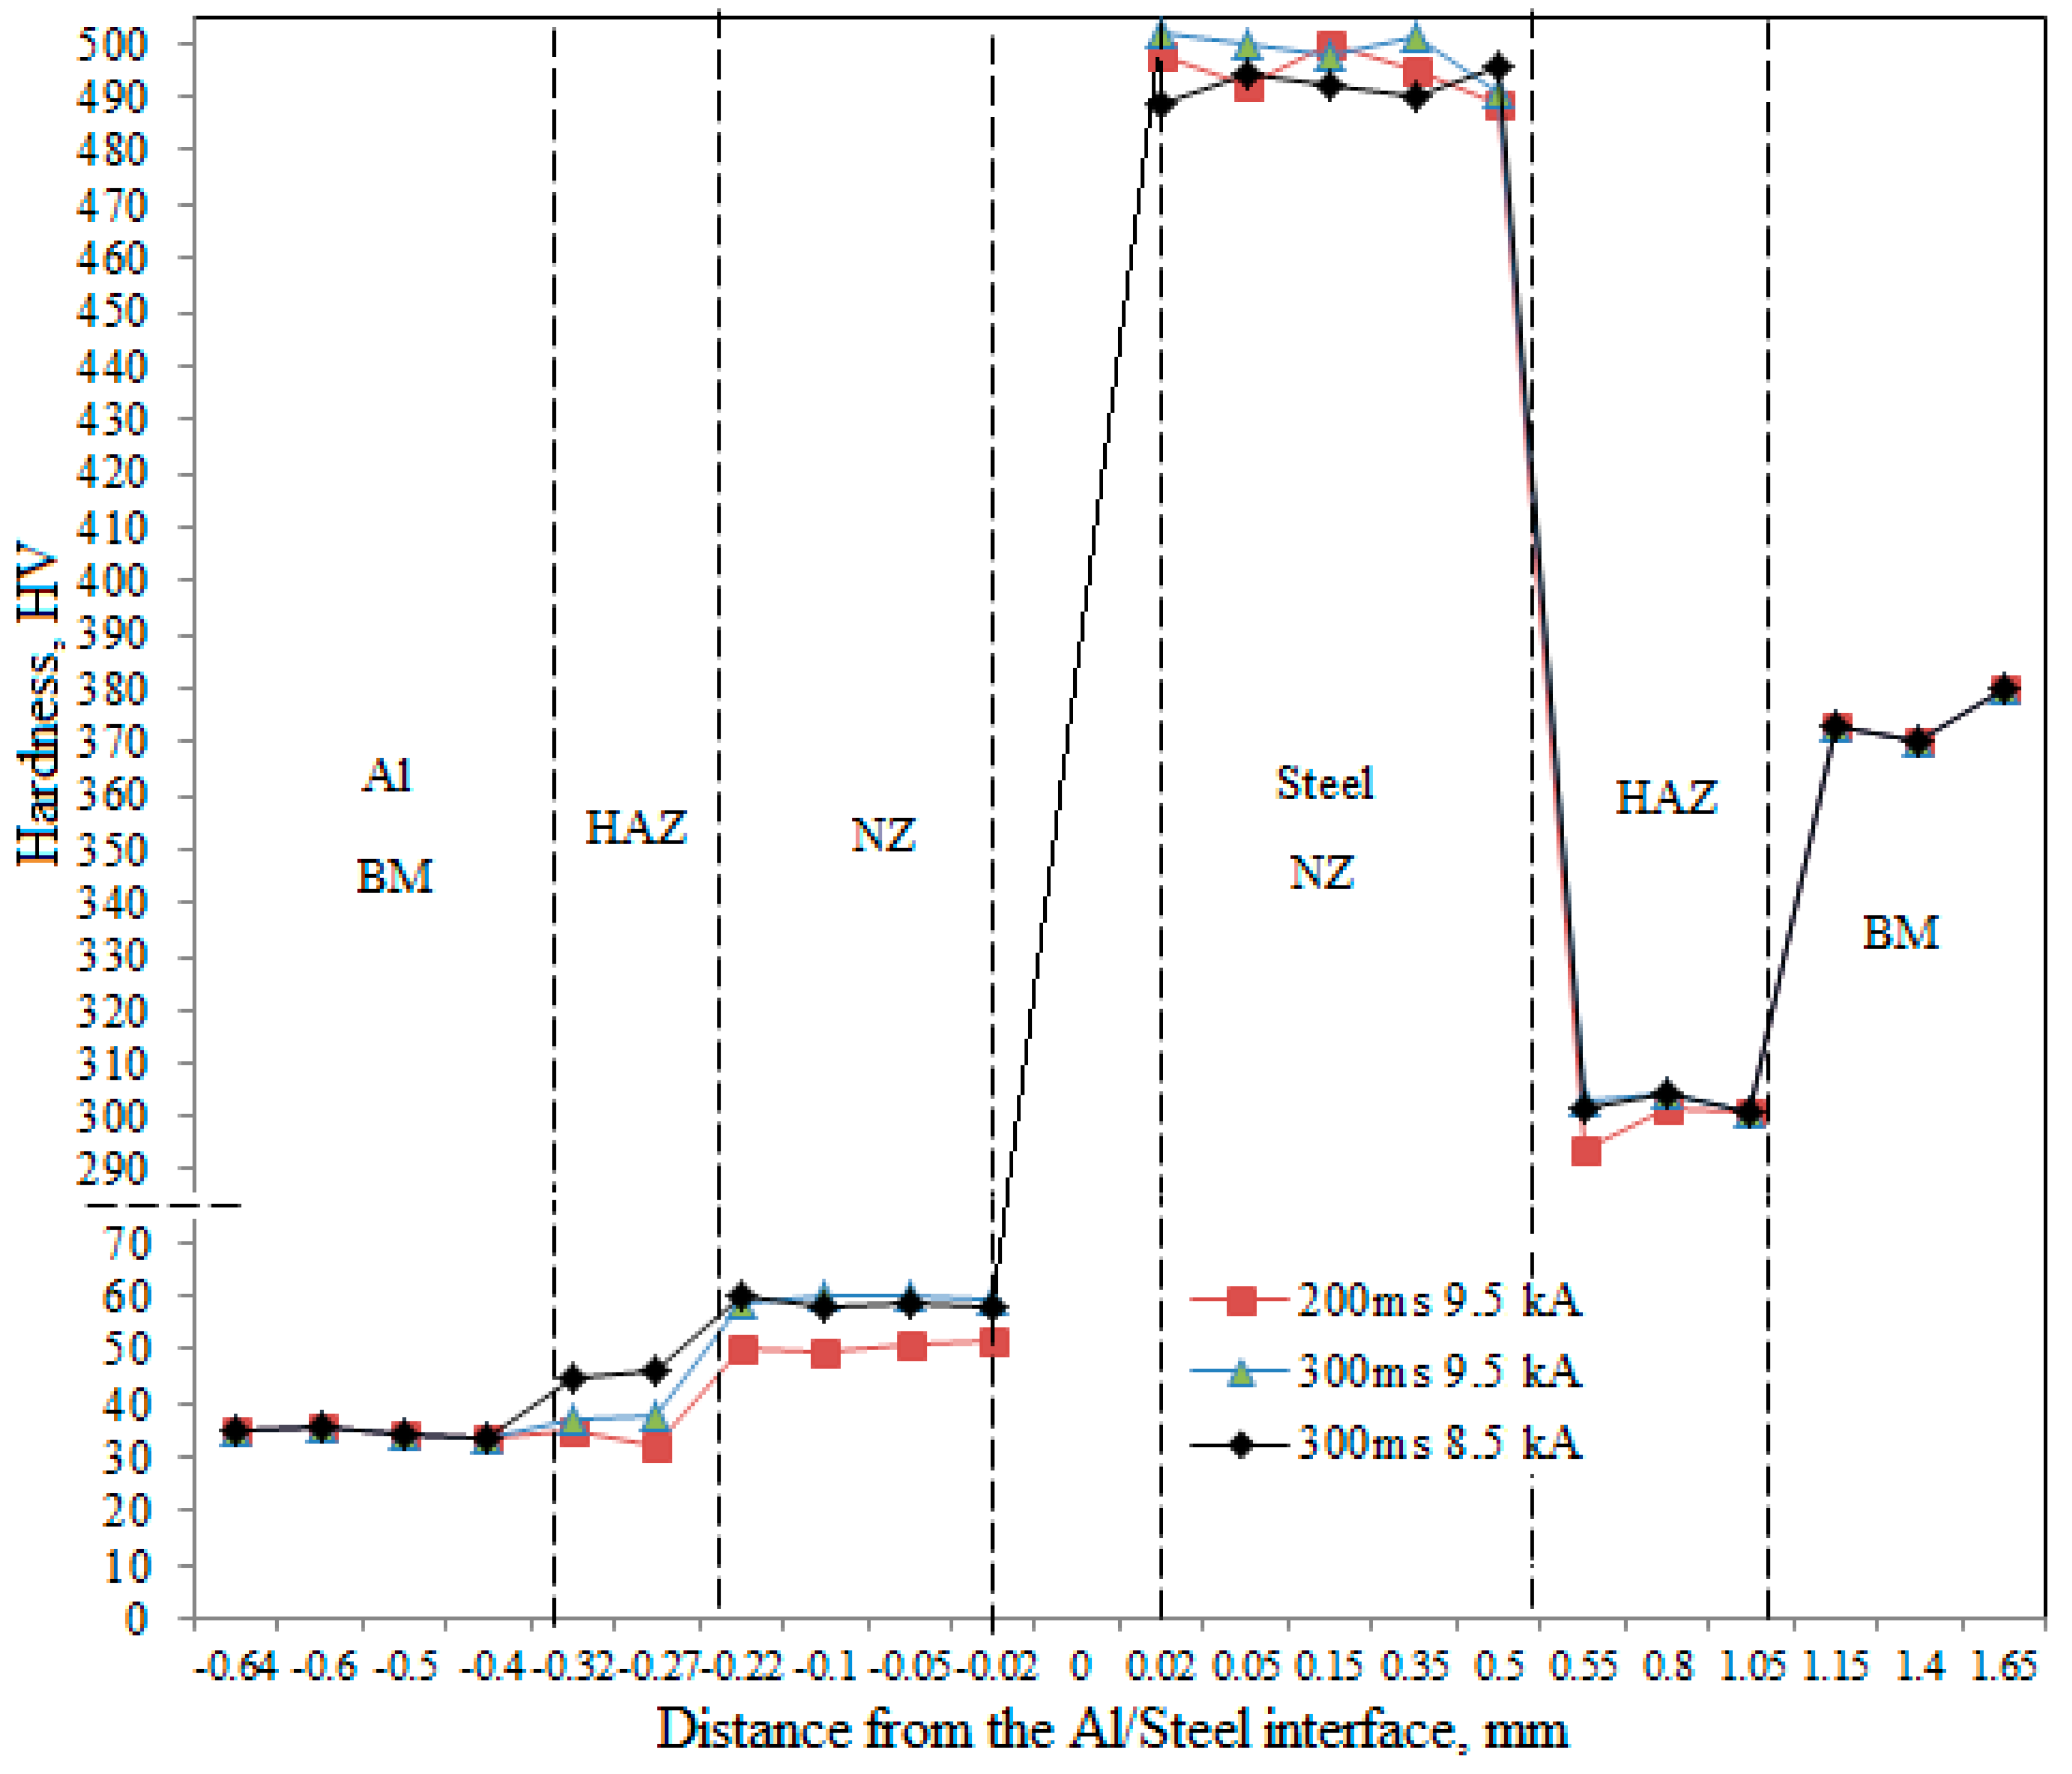
3.3. Microhardness Tests

Hardness was measured from the NZ centre with 0.25 mm spacing between each data point to the adjacent regions for the Al side and the steel side of the weld joint with coarse grained BM (Figure 11). It is seen from Figure 11 that hardness of the BM with martensitic structure ranged from 350 HV to 400 HV; this shows agreement with Anijdan et al. [33] who found that the hardness of the martensitic structure was about 350 HV. Hardness of the steel pseudo-NZ reached up to more than 500 HV, hardness values decreased greatly near the steel pseudo-NZ, the HAZ with a low hardness value of 300 HV was the softer region near the steel pseudo-NZ, similar to that of RSWed high strength steel. The hardness value of the Al NZ was 60 HV and it was significantly higher than that of the BM which had a hardness value of 35 HV; this could be attributed to the fact that grains of the Al NZ were refined, however, the Al HAZ had a slightly higher hardness than the BM.

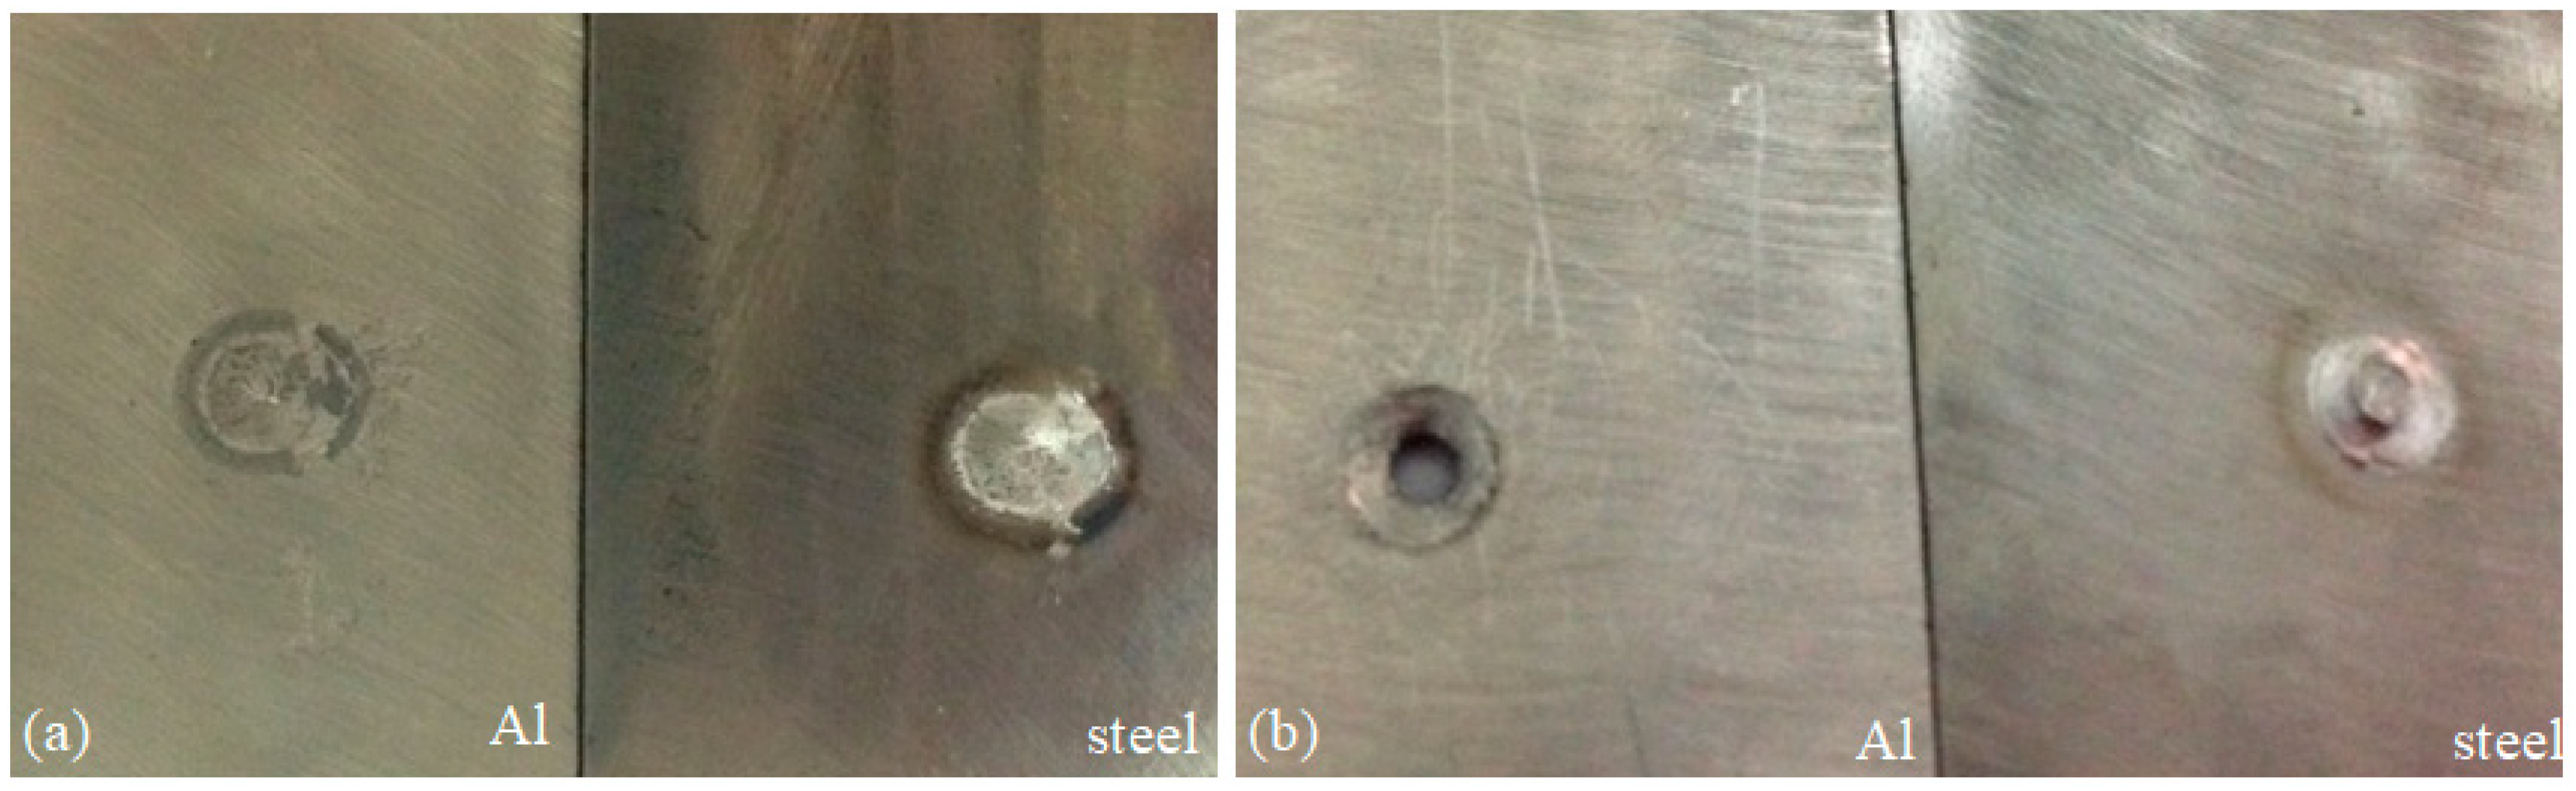
3.4. Tensile Shear Properties of the Fe/Al Welded Spots

In the case of process optimization at welding times in the range of 300–350 ms and a welding current of 9.5 kA with Al nugget diameter of 4 mm, the welded spots failed in the form of nugget pull out from the NZ at the Al side and the other joints failed as interfacial fractures (Figure 12). The nugget pull out failure mode after tensile testing was superior to the interfacial failure mode [13].
Tensile shear strength plotted against IMC thickness via welding current and via welding time is shown in Figure 13.

4. Discussion

4.1. The Effect of Microstructure on Mechanical Properties

4.1.1. At the Al Side

The elongated grains in the NZ (Figure 3e and Figure 5) grew approximately along the direction perpendicular to the Fe/Al interface at the Al side. During welding, most of the heat was generated from the high-strength steel side and transferred to the aluminium side continuously, which resulted in a strong temperature gradient field between the steel pseudo-NZ centre and the Al side leading to the growth of the Al NZ grains along the temperature gradient direction, which was parallel to direction of the electrode pressure.
When the welding current was 8.5 kA, the NZ grains were significantly smaller than that at the welding current of 9.5 kA. However, Zhang et al. [34] found that as welding current and welding time increased, both the NZ close to the IMC layer and the IMC layer itself exhibited coarser grain structures which were susceptible to cracking. It can be seen from Table 2, the fraction of HAGBs (2°–15°) in the HAZ and the NZ increased significantly at a welding time of 300 ms at the Al side. It is seen from Figure 9 that the number of sub-grains of the NZ increased with increasing welding time. Thus, the rapid increase of HAGBs fraction in the HAZ and the NZ with increasing welding time from 200 ms to 300 ms would suggest that continuous dynamic recrystallisation (CDRX) may have occurred in the NZ [35]. Whereas, the grain boundary angle distribution of the NZ was basically the same for welding current of 8.5 kA and 9.5 kA, and the number fraction of LAGBs accounts for 22% and 23%, respectively (Table 2). This would suggest that the influence of the welding current on grain boundary angle distribution in the NZ was negligible and the welding time had a greater effect on the formation of the sub-grain boundaries than the welding current at the Al side.
The NZ had higher hardness than the BM at the Al side due to finer grains for all the welded spots with coarse grained BM, however, the NZ grains were coarser than fine grained BM grains as shown in Figure 4b. It is seen from Figure 11 that hardness increased from 200 ms-9.5 kA to 300 ms-8.5 kA and 300 ms-9.5 kA in the NZs at the Al side, as grain size decreased, this would suggest that hardness in the NZs became higher with increasing welding time and with increasing welding current, this is mainly due to the aforementioned grain refinement in the NZs with increasing welding time from 200 ms to 300 ms and with increasing welding current from 8.5 kA to 9.5 kA (Figure 5). However, hardness in the HAZ was higher at 300 ms-8.5 kA than that at 300 ms-9.5 kA, this could be attributed to much finer grains in the HAZ at 300 ms-8.5 kA (Figure 5c).
It was seen from IPF (Figure 5), band contrast map (Figure 6) and the curves of tensile shear strength as a function of the IMC thickness (Figure 13) that, in the NZs, when there was a large increase of grain size with increasing weld time, the tensile shear strength increased significantly from 0.9 to 1.5 kN with increasing welding time from 200 to 300 ms. However, there was a slight increase of 0.2 kN in tensile shear strength with increasing welding current from 8.5 to 9.5 kA with the grain size being changed slightly, this meant that the smaller the grains, the higher the tensile strength. Thus, the effect of grain size on microhardness and tensile shear strength at the Al side for all the welding parameters in the present work was in accordance with Hall–Petch relationship; this meant that the smaller the grains (except for the ultrafine grains or submicron grains), the higher the hardness, and the higher tensile strength.

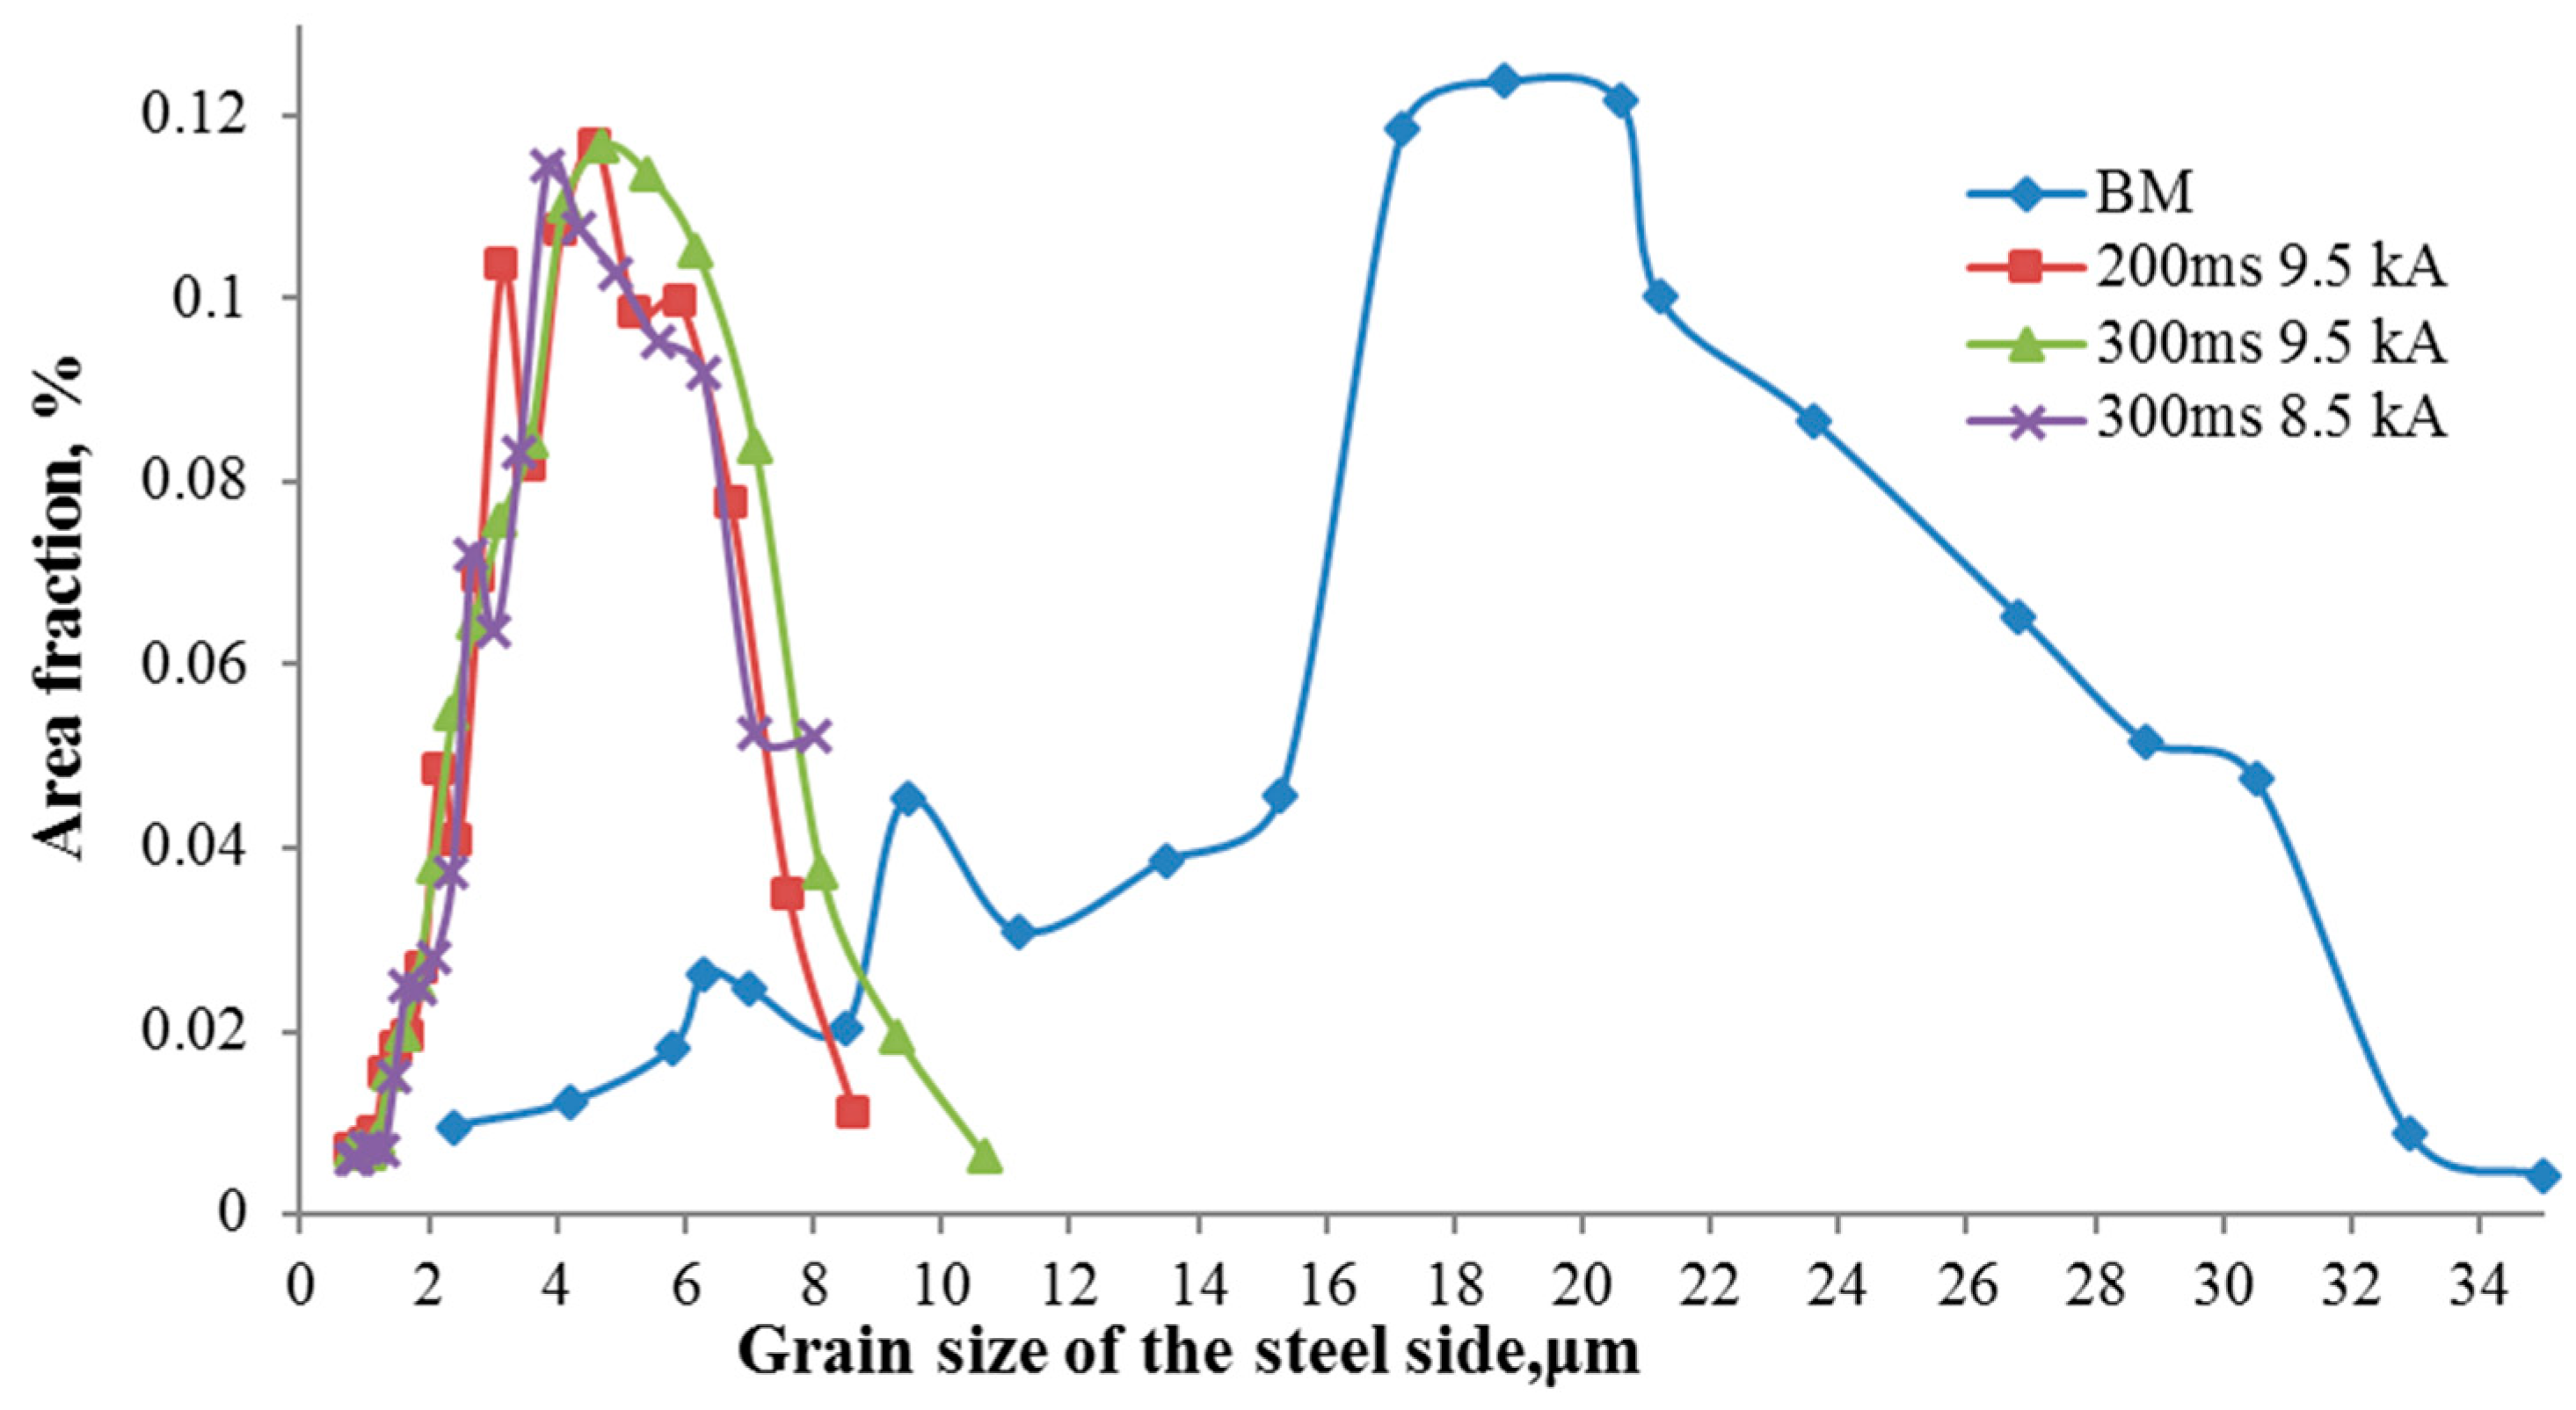
4.1.2. At the Steel Side

Similar to the Al side, the increase of HAGBs from the HAZs to the steel pseudo-NZs (Figure 8) and the development of the recrystallisation texture components in the NZs at the steel side (Table 3) would indicate that CDRX had occurred in the pseudo-NZs [36]. It is seen from Figure 8 that the NZs had fine equiaxed ferrite with a grain size of less than 5 μm because DRX would produce ferrite grain size of 2–5 μm [37].
The NZ that consisted of equiaxed ferrite and retained austenite had higher hardness (approximately 500 HV) than the BM (350–400 HV) at the steel side due to finer ferrite grains. This was in accordance with Calcagnotto et al.’s work that the increase of strength and improved ductility was due to grain refinement of the strengthened ferrite [38]. However, Kim et al. [34] found that the increased hardness of 240 HV from the BM to the NZ was due to the fact that a martensitic structure was formed in the NZ which had been fast cooled from above the A3 transformation point. In contrast, Kianersiet et al. [18] and Kocabekir et al. [39] both found that microhardness of the NZ was lower than that of the HAZ and the BM because of a coarser acicular delta ferrite microstructure.
The effect of grain size on hardness was significant when the HAZ and the pseudo-NZs were compared; this showed agreement with Chokshi et al. [40] and Lehto et al. [41] who both reported that the finer grains with more HAGBs had a higher hardness. Moreover, HAGBs are more important for strengthening and they can improve the toughness of steels [42]. However, the grain size had changed slightly in the pseudo-NZs for all the three welding parameters, and it could not contribute to the variation of hardness and tensile shear strength of the welded spots at the steel side with varying welding parameters. Whereas, the slight change in hardness and the great change in tensile shear strength of the NZs at the Al side due to the partial effect of grain size with varying welding parameters would suggest that the microstructure of welded spots at the Al side may have dominated the tensile shear strength of the weld spots with varying welding parameters.

4.2. The Effect of Microstructure and Texture on Mechanical Properties

With increasing welding current from 8 kA to 9.5 kA and with increasing welding time from 200 ms to 350 ms, the tensile shear strength and thickness of the IMCs first increased then decreased. This shows agreement with Cui et al. [12] and Zhang et al. [34] who both found that the tensile shear strength increased with increasing welding current and welding time. Figure 13 shows that the tensile shear strength increased gradually with increasing IMC thickness from 0 mm to 4.2 mm, and then decreased when the thickness of the IMC layer is larger than 4.2 mm. The button pull out failure occurred in the welded spot at welding parameters of 9.5 kA-300 ms with an IMC thickness of 4 μm. However, Chen et al. [43] summarized that weld strength was determined by the combination effects of the thickness of the IMC layer, nugget diameter, grain refinement and location of the defect.
In the IPF maps of the BM and the NZs at the Al side (Figure 5), the different colours correspond to orientations differing by more than 2°. The sharp change of the colours, namely, the distinct difference in orientation was observed in the NZs at welding parameters of 200 ms-9.5 kA, however, as the welding time increased from 200 ms and 300 ms at a welding current of 9.5 kA, the grain orientations became random or the anisotropy of the NZ grains enhanced. This significantly reduced the number of LAGBs and increased the fraction of HAGBs, thus, grain refinement occurred in the NZs of 300 ms-9.5 kA. This would again confirm that the Al NZ underwent CDRX with increasing welding time from 200 ms to 300 ms, and recrystallisation texture in the NZ of 300 ms-9.5 kA was much stronger than that in the NZ of 200 ms-9.5 kA where different recrystallisation texture components were observed, whereas, there are many colours in the NZs of 8.5–9.5 kA (Figure 5c,e) indicating that the orientations are randomly distributed in the NZs of 8.5–9.5 kA at a welding time of 300 ms. However, the recrystallisation texture type of the NZ at 300 ms-8.5 kA was different from that of the NZ at 300 ms-9.5 kA.
The tensile shear strength of the welded spots as a function of welding current and weld time is shown in Figure 13. It was seen that tensile shear strength of the welded spots first increased, then reduced with increasing weld time. Whilst, with increasing welding time from 200 ms to 350 ms at a welding current of 9.5 kA, the tensile shear strength increased significantly, the maximum tensile shear strength reached about 1.65 kN at a welding time of 350 ms, and tensile shear strength then decreased slightly when the welding time continued to increase, because more welding time and more heat input resulted in the occurrence of slight splash and porosity in the welded spots. The tensile shear strength increased greatly from 0.85 kN to 1.55 kN with increasing welding time from 200 ms to 300 ms when texture became much more random. However, the tensile shear strength increased slightly from 1.35 kN to 1.55 kN with increasing welding current from 8.5 kA to 9.5 kA at a welding time of 300 ms, when the distribution of texture components was random in the Al NZs at welding current of 8.5 kA and 9.5 kA, respectively.
Compared to the HAZ at the steel side, Figure 10 shows that the steel pseudo-NZs at all the welding parameters had more orientations with more HAGBs resulting in higher hardness [44,45]. This is in accordance with the results obtained by Tutar et al. [46] who found that the NZ had higher hardness than the HAZ. Moreover, the HAZ had the lowest hardness compared to the BM and the pseudo-NZ, as proposed by Qiao et al. [47]. The steel pseudo-NZs with varying welding parameters had a similar random recrystallisation texture (Figure 6). The random texture of steel pseudo-NZs could not be linked to the tensile shear strength of the welded spots which changed greatly with varying welding parameters. This showed agreement with Guo [48] who found that texture did not influence tensile properties due to the randomization of orientations resulting from ferritic transformation from high temperature austenite. This would suggest that texture of the Al side had great influence on the tensile shear strength of the welded spots. It was then concluded that the texture of the welded spots at the Al side had much more effect on the tensile shear strength than that at the steel side with varying welding parameters.

5. Conclusions

  • Tensile shear strength of the welded spots mainly depends on the microstructure and texture of the Al side with varying welding parameters. The welded spots at welding parameters of (300–350) ms-9.5 kA have higher tensile shear strength and exhibit the button pull out fracture mode.
  • Grains in the Al NZs grew approximately along the direction perpendicular to the Fe/Al interface. The Al NZs with a random texture at welding parameters of 300 ms-9.5 kA have higher tensile shear strength than that with a strong texture at welding parameters of 200 ms-9.5 kA. CDRX has occurred in the NZs (or the pseudo-NZs for steel) with recrystallisation texture at both the Al side and the steel side.
  • The NZs (or the pseudo-NZs for steel) have higher hardness than the BM at both the Al side and the steel side due to finer grains. More orientations and more HAGBs contribute to higher hardness in the steel pseudo-NZs. The deformation texture at the Al side has little effect on hardness.

Author Contributions

Conceptualization, S.C. and X.J.; methodology, X.J. and J.G.; software, X.J.; validation, X.J., S.C. and Z.L.; formal analysis, X.J.; investigation, X.J.; resources, J.G.; data curation, X.J., J.G.; writing—original draft preparation, X.J.; writing—review and editing, X.J.; visualization, X.J.; supervision, S.C.; project administration, Z.L.; funding acquisition, Z.L.

Funding

This research was funded by the National Natural Science Foundation of China (NSFC), grant number 51775007.

Acknowledgments

This work was supported by the National Natural Science Foundation of China (NSFC) under grant No. 51775007.

Conflicts of Interest

We declare that we do not have any commercial or associative interest that represents a conflict of interest in connection with the work submitted.

References

  1. Khan, J.A.; Xu, L.; Chao, Y.J. Prediction of nugget development during resistance spot welding using coupled thermal–electrical–mechanical model. Sci. Technol. Weld. J. 1999, 4, 201–207. [Google Scholar] [CrossRef]
  2. Winnicki, M.; Małachowska, A.; Korzeniowski, M.; Jasiorski, M.; Baszczuk, A. Aluminium to steel resistance spot welding with cold sprayed interlayer. Surf. Eng. 2018, 34, 235–242. [Google Scholar] [CrossRef]
  3. Kelkar, A.; Roth, R.; Clark, J. Automobile bodies: Can aluminium be an economical alternative to steel? JOM 2001, 53, 28–32. [Google Scholar]
  4. Kim, H.; Keoleian, G.A.; Skerlos, S.J. Greenhouse Gas Emissions Payback for Lightweighted Vehicles Using Aluminium and High-Strength Steel. J. Ind. Ecol. 2011, 15, 64–80. [Google Scholar] [CrossRef]
  5. Zhou, Y. Study on Several Key Problems of Lightweight Design for Steel-Aluminium Hybrid Structure Car Body and Its Application. PhD Thesis, South China University of Technology, Guangzhou, China, 2011. [Google Scholar]
  6. Oikawa, H.; Ohmiya, S.; Yoshimura, T.; Saitoh, T. Resistance spot welding of steel and aluminium sheet using insert metal sheet. Sci. Technol. Weld. Join. 1999, 4, 80–88. [Google Scholar] [CrossRef]
  7. Qiu, R.; Satonaka, S.; Iwamoto, C. Effect of interfacial reaction layer continuity on the tensile shear strength of RSWed spots between aluminium alloy and steels. Mater. Des. 2009, 30, 3686–3689. [Google Scholar] [CrossRef]
  8. Qiu, R.; Shi, H.; Zhang, K.; Tu, Y.; Iwamoto, C.; Satonaka, S. Interfacial characterization of joint between mild steel and aluminium alloy welded by resistance spot welding. Mater. Charact. 2010, 61, 684–688. [Google Scholar] [CrossRef]
  9. Qiu, R.; Shi, H.; Zhang, K.; Tu, Y.; Iwamoto, C.; Satonaka, S. Interfacial characteristics of welded joint between aluminium alloy and stainless steel by resistance spot welding. Trans. China Weld. Inst. 2011, 32, 37–40. [Google Scholar]
  10. Qiu, R.; Iwamoto, C.; Satonaka, S. In situ scanning electron microscopy observation of fracture crack propagation in the welding interface between aluminium alloy and steel. Mater. Sci. Technol. 2013, 25, 1189–1192. [Google Scholar] [CrossRef]
  11. Sun, D.; Zhang, Y.; Liu, Y.; Ma, Q.; Guo, N.; Song, X.; Feng, J. Microstructures and mechanical properties of RSWed spots of 16Mn steel and 6063-T6 aluminium alloy with different electrodes. Mater. Des. 2016, 109, 596–608. [Google Scholar] [CrossRef]
  12. Cui, L.; Qiu, R.; Hou, L.; Shen, Z.; Li, Q. Resistance spot welding between steel and aluminum alloy. In Proceedings of the 5th International Conference on Advanced Design and Manufacturing Engineering, Shenzhen, China, 19–20 September 2015; pp. 777–781. [Google Scholar]
  13. Zhang, W.; Sun, D.; Han, L.; Li, Y. Optimised design of electrode morphology for novel dissimilar resistance spot welding of aluminium alloy and galvanised high strength steel. Mater. Des. 2015, 85, 461–470. [Google Scholar] [CrossRef]
  14. Shin, S.; Park, D.J.; Yu, J.; Rhee, S. Resistance Spot Welding of Aluminum Alloy and Carbon Steel with Spooling Process Tapes. Metals 2019, 9, 410. [Google Scholar] [CrossRef]
  15. Akinay, Y.; Hayat, F. Investigation of resistance spot welds between DP450 steel and aluminium alloys. Mater. Test. 2016, 58, 408–412. [Google Scholar] [CrossRef]
  16. Xiao, J. Development and Research on Welding Wear-Resistant Sieve Plate of Carbon-Free Alloyed Steel during Air Quenching. Ph.D. Thesis, Zhengzhou University, Zhengzhou, China, 2014. [Google Scholar]
  17. Wang, Q. A Single-Tooth Roller Surfacing Welding Repair Process. Chinese Patent CN105750691A, 25 July 2016. [Google Scholar]
  18. Kianersi, D.; Mostafaei, A.; Amadeh, A.A. Resistance spot welding joints of AISI 316L austenitic stainless steel sheets: Phase transformations, mechanical properties and microstructure characterizations. Mater. Des. 2014, 61, 251–263. [Google Scholar] [CrossRef]
  19. Chao, J.; Shan, Z.; Zhuang, B.; Rong, W.J.; Zhang, M. Microstructure and properties of hot stamping 22MnB5 steel. Trans. Mater. Heat Treat. 2012, 33, 78–81. (In Chinese) [Google Scholar]
  20. Calcagnotto, M.; Ponge, D.; Raabe, D. Microstructure Control during Fabrication of Ultrafine Grained Dual-phase Steel: Characterization and Effect of Intercritical Annealing Parameters. ISIJ Int. 2012, 52, 874–883. [Google Scholar] [CrossRef] [Green Version]
  21. Suwas, S.; Ray, R.K. Crystallographic Texture of Materials, Engineering Materials and Processes; Springer: London, UK, 2014; pp. 95–141. [Google Scholar]
  22. Rollett, A.D.; Kalu, P.N. Typical Textures-Thermomechanical processing (TMP) of Metals, Part 1. Carnegie Mellon University. 2007. Available online: http//www.coursehero.com/file/2894082/TypicalTextures20Feb08/ (accessed on 16 July 2016).
  23. Somerday, M.; Humphreys, F.J. Recrystallisation behaviour of supersaturated Al-Mn alloys-Part 2—Al-0.3 wt-%Mn, Mater. Sci. Technol. 2003, 9, 30–35. [Google Scholar]
  24. Montheillet, F.; Gilormini, F.P.; Jonas, J.J. Relation between Axial stresses and texture development during torsion testing a simplified theory. Acta Metall. 1985, 33, 705–717. [Google Scholar] [CrossRef]
  25. Ahmed, M.M.Z. The Development of Thick Section Welds and Ultra-Fine Grain Aluminum Using Friction Stir Welding and Processing. Ph.D. Thesis, The University of Sheffield, Sheffield, UK, 2009. [Google Scholar]
  26. McNelley, T.R.; Swaminathan, S.; Su, J.Q. Recrystallization mechanisms during friction stir welding/processing of aluminum alloys. Scr. Mater. 2008, 58, 349–354. [Google Scholar] [CrossRef] [Green Version]
  27. Montheillet, F.; Cohen, M.; Jonas, J.J. Axial stresses and texture development during the torsion testing of Al, Cu and α-Fe. Acta Metall. 1984, 32, 2077–2089. [Google Scholar] [CrossRef]
  28. Hölscher, M.; Raabe, D.; Lücke, K. Relationship between rolling textures and shear textures in fcc and bcc metals. Acta Metal. 1994, 42, 879–888. [Google Scholar] [CrossRef]
  29. Kurdjumov, G.; Sachs, G. About the mechanism of steel hardening. Z. Phys. 1930, 64, 325–343. [Google Scholar]
  30. Ray, R.K.; Jonas, J.J. Transformation textures in steels. Int. Mater. Rev. 1990, 35, 1–36. [Google Scholar] [CrossRef]
  31. Ray, R.K.; Jonas, J.J.; Butrón-Guillén, M.P.; Butrón-Guillén, J.S. Transformation textures in steels. ISIJ Int. 1994, 34, 927–942. [Google Scholar] [CrossRef]
  32. Park, Y.B.; Lee, D.N.; Gottstein, G. The evolution of recrystallization textures in body centred cubic metals. Acta Mater. 1998, 46, 3371–3379. [Google Scholar] [CrossRef]
  33. Anijdan, S.H.M.; Sabzi, M.; Ghobeiti-Hasab, M.; Roshan-Ghiyas, A. Optimization of spot welding process parameters in dissimilar joint of dual phase steel DP600 and AISI 304 stainless steel to achieve the highest level of shear-tensile strength. Mater. Sci. Eng. A 2018, 726, 120–125. [Google Scholar] [CrossRef]
  34. Zhang, W.H.; Qiu, X.M.; Sun, D.Q.; Han, L.J. Effects of resistance spot welding parameters on microstructures and mechanical properties of dissimilar material joints of galvanised high strength steel and aluminium alloy. Sci. Technol. Weld. Join. 2011, 16, 153–161. [Google Scholar] [CrossRef]
  35. Humphreys, F.J.; Hatherly, M. Recrystallization Phenomenon and Related Annealing, 2nd ed.; Elsevier: Amsterdam, The Netherlands; Boston, MA, USA, 2004. [Google Scholar]
  36. Tsuji, N.; Ito, Y.; Saito, Y.; Minamino, Y. Strength and ductility of ultrafine grained aluminum and iron produced by ARB and annealing. Scr. Mater. 2002, 47, 893–899. [Google Scholar] [CrossRef]
  37. Husain, M.M.; Sarkar, R.; Pal, T.K.; Ghosh, M.; Prabhu, N. Quantification of microtexture at weld nugget of Friction stir-welded carbon steel. J. Mater. Eng. Perform. 2017, 26, 2047–2056. [Google Scholar] [CrossRef]
  38. Song, D.; Ponge, R.; Kaspar, R.; Raabe, D. Grain boundary characterization and grain size measurement in an ultrafine-grained steel. Zeitschrift für Metallk unde 2004, 95, 513. [Google Scholar] [CrossRef]
  39. Kocabekir, B.; Kacar, R.; Gündüz, S.; Hayat, F. An effect of heat input, weld atmosphere and weld cooling conditions on the resistance spot weldability of 316L austenitic stainless steel. J. Mater. Process. Technol. 2008, 195, 327–335. [Google Scholar] [CrossRef]
  40. Chokshi, A.H.; Rosen, A.; Karch, J.; Gleiter, H. On the validity of the Hall-Petch relationship in nanocrystalline materials. Scr. Metall. 1989, 23, 1679–1683. [Google Scholar] [CrossRef]
  41. Lehto, P.; Remes, H.; Saukkonen, T.; Hänninen, H.; Romanoff, J. Influence of grain size distribution on the Hall–Petch relationship of welded structural steel. Mater. Sci. Eng. A 2014, 592, 28–39. [Google Scholar] [CrossRef]
  42. Matusiewicz, P.; Ratuszek, W.; Zielińska-Lipiec, A. Recrystallization of Ferrite in Spheroidite of Fe-0.67%C Steel. Arch. Metall. Mater. 2011, 56, 63–69. [Google Scholar] [CrossRef]
  43. Chen, N.; Wang, H.P.; Carlson, B.E.; Sigler, D.R.; Wang, M. Fracture mechanisms of Al/steel resistance spot welds in coach peel and cross tension testing. J. Mater. Process. Technol. 2018, 252, 348–361. [Google Scholar] [CrossRef]
  44. Gong, P.; Sun, L.; Wynne, B.P.; Palmiere, E.J.; Rainforth, W.M. The effect of thermomechanical controlled processing on recrystallisation and subsequent deformation-induced ferrite transformation textures in microalloyed steels. J. Mater. Sci. 2018, 53, 6922–6938. [Google Scholar] [CrossRef] [Green Version]
  45. Choi, W.S.; De Cooman, B.C. Characterization of the Bendability of Press-Hardened 22MnB5 Steel. Steel Res. Int. 2014, 85, 824–835. [Google Scholar] [CrossRef]
  46. Tutar, M.; Aydin, H.; Bayram, A. Effect of Weld Current on the Microstructure and Mechanical Properties of a Resistance Spot-Welded TWIP Steel Sheet. Metals 2017, 7, 519. [Google Scholar] [CrossRef]
  47. Qiao, Z.; Li, H.; Li, L.; Ran, X.; Feng, L. Microstructure and Properties of Spot Welded Joints of Hot-Stamped Ultra-High Strength Steel Used for Automotive Body Structures. Metals 2019, 9, 285. [Google Scholar] [CrossRef]
  48. Guo, N. A Study on Microstructural Characterization and Mechanical Properties of Cold Drawing Pearlitic Steel Wires for Bridge Cable. Ph.D. Thesis, Chongqing University, Chongqing, China, 2012. [Google Scholar]
Figure 1. Schematic drawing of the lap joint showing dimensions of the tensile shear specimens in mm.
Metals 09 00685 g001
Figure 2. Photographs of the welded spots at different welding parameters of (a) 8.5 kA-300 ms, (b) 9.5 kA-200 ms, (c) 9.5 kA-300 ms with a coarse base material and (d) 9.5 kA-300 ms with a fine base material.
Metals 09 00685 g002
Figure 3. Morphology of (a) the base material (BM), (b) the heat affected zone (HAZ), (c) the nugget zone (NZ) at the steel side, and (d) the BM, (e) the HAZ at the Al side produced by a welding current of 8 kA and a welding time of 200 ms.
Metals 09 00685 g003
Figure 4. Large inverse pole figure colouring (IPF) maps using 5 μm step size of the NZ at (a) region ①: 8.5 kA and 300 ms with a coarse BM and (b) region ②: 9.5 kA and 300 ms with a fine BM.
Metals 09 00685 g004
Figure 5. The IPF maps of (a) the coarse BM, (b) the fine BM, (c) the HAZ and the NZ at 300 ms-8.5 kA, (d) the HAZ and the NZ at 200 ms-9.5 kA, (e) the HAZ and the NZ at 300 ms-9.5 kA with a coarse BM and (f) the HAZ and the NZ at 300 ms-9.5 kA with a fine BM and a step size of 0.8 μm at the Al side.
Metals 09 00685 g005
Figure 6. IPF maps of (a) the HAZ, the pseudo-NZs at (b) 200 ms-9.5 kA, (c) 300 ms-9.5 kA and (d) 300 ms-8.5 kA at the steel side.
Metals 09 00685 g006
Figure 7. Grain size distribution of the BM and the pseudo-NZ with different welding parameters at the steel side.
Metals 09 00685 g007
Figure 8. Misorientation angle distribution of the HAZ and the pseudo-NZs with different welding parameters at the steel side.
Metals 09 00685 g008
Figure 9. Band contrast (image quality) maps of (a) the coarse BM, (b) the fine BM, (c) the HAZ and the NZ at 300 ms-8.5 kA, (d) the HAZ and the NZ at 200 ms-9.5 kA, (e) the HAZ and the NZ at 300 ms-9.5 kA with a coarse BM and (f) the HAZ and the NZ at 300 ms-9.5 kA with a fine BM.
Metals 09 00685 g009
Figure 10. Band contrast maps of (a) the HAZ at 200 ms-9.5 kA, the pseudo-NZs at (b) 200 ms-9.5 kA, (c) the 300 ms-9.5 kA and (d) 300 ms-8.5 kA at the steel side.
Metals 09 00685 g010
Figure 11. Distribution of microhardness in the welded spots at the Al side and the steel side with coarse grained BM, respectively.
Metals 09 00685 g011
Figure 12. Two failure modes of the welded spots: (a) interfacial fracture at 200 ms-9.5 kA and 300 ms-8.5 kA and (b) nugget pull out at 300 ms-9.5 kA.
Metals 09 00685 g012
Figure 13. Tensile shear strength as a function of the intermetallic compound (IMC) thickness via welding current (at a constant welding time of 300 ms) in dark blue lines and via welding time (at a constant welding current of 9.5 kA) in dark red lines.
Metals 09 00685 g013
Table 1. Chemical composition of boron steel 22MnB5 and 5A06 Al alloy, in wt.% and the welding parameters.
22MnB5 SteelFeCSiMnCrTiBSP
-0.220.311.410.220.0230.0040.0060.007
5A06 AlAlMgSiMnCuTiZn--
-5.8–6.840.5–0.80.10.02–0.10.2--
Welding ParametersWelding current, kAWelding time, msDwell time, msElectrode force, kN -
8, 9.5, 10.5200, 300, 4502002.5-
Table 2. Volume fraction of grain boundaries for all the regions at the Al side.
Region NameCoarse BMFine BM300 ms-8.5 kA with a Coarse BM200 ms-9.5 kA with a Coarse BM300 ms-9.5 kA
Coarse BMFine BM
HAZ NZHAZNZHAZNZ HAZNZ
2°–15°0.340.080.20.240.820.60.240.230.180.13
>15°0.660.920.80.760.180.40.760.770.810.87
Table 3. Texture components of the BM and the NZ at the Al side.
TypeComponentCoarse BMFine BMNZ 300 ms-8.5 kANZ 200 ms-9.5 kANZ 300 ms-9.5 kA
with a Coarse BMwith a Fine BM
DeformationShear1 {001}<110>--5.3-30.623
Shear2 {111}<110>30.3--29.59.8-
Brass {110}<112>-5-50.5--
S {123}<634>67.2-28.23-
RecrystallisationCube {001}<100>-7.2---22
Goss {110}<001>8-28---
Q {013}<123>5.5--11--
RCRD1{013}<001>--16-5.5-
RCND1 {001}<310>---230-
Table 4. Texture components of the HAZ and the pseudo-NZ at the steel side.
ComponentBMHAZ200 ms-9.5 kA 300 ms-9.5 kA300 ms-8.5 kA
A1 ( 1 ¯ 1 1 ¯ ) [ 2 ¯ 1 ¯ 1 ] 4.52.3---
A2 ( 1 1 ¯ 1 ) [ 121 ] 3.81.4---
Rx {001} <110>--33.13.7
Rx F {110}<001>--3.422.4
E (110)<111> -1.11.91.71.3

