Abstract
Most investigations dealing with fatigue crack propagation on the nanoscale, limit their studies on a loading scenario of constant stress or strain amplitudes. Since such a load scenario is rather rare, this paper aims to examine the influence of the load sequence on the crack growth using bcc iron. For this purpose, a specimen containing a central crack was loaded repeatedly by varying the load amplitude. All computations were carried out using molecular dynamics methods (MD), and the material behaviour was represented by utilising an embedded atom method (EAM) potential. Significant deviation in the crack growth behaviour was observed when loading the specimens with variable amplitudes rather than with constant amplitudes. Cracks did not only extend during the loading phase but also in the initial phase of the unloading process where cracks expanded from voids that had been formed in the last phase of loading. These voids coalesced with the main crack as the specimen was subjected to further loading.
1. Introduction
In the eyes of a design engineer, the fatigue problem of a presumed homogeneous defect free structure can be divided into two major phases [1]. Firstly, and for practical design purpose this is the most important phase, the fatigue lifetime until a (technical) fatigue crack initiates. A technical fatigue crack is defined as a crack with the size of several mm, which can be determined by non-destructive inspection methods [2]. In this regime, the fatigue life of a structure or component may be addressed by engineering concepts such as the stress-life (S-N) or the strain-life (-N) approach to approximate damage based on cyclic loading during service. In the second phase of fatigue life, where a crack has been detected, the remaining fatigue lifetime can be estimated using the tools of fracture mechanics. To assess fatigue crack growth, linear elastic fracture mechanics (LEFM) is mostly applied and suggested for practical application [3,4]. On the engineering (macro-) scale, the theoretical framework of LEFM provides the designer with the tools to address practical issues when certain criteria are valid. Crack growth laws, such as the widely-used Paris law shown in Equation (1), allow the approximation of crack propagation.
The Paris law describes the advancement of the crack length for an increment of cycles depending on the stress intensity factor range , representing the loading situation in the near field of the crack [5], as well as the material constants C and m. These two material constants have to be determined by fitting experimental results, which lead to scattering in obtained parameters [6]. Besides the Paris law, there are other more sophisticated crack propagation laws [5,7,8], but probably due to its simplicity, the Paris law is widely applied and even adapted to describe fatigue crack growth on the nanoscale [9]. The lower bound of the application area of LEFM is the threshold stress intensity factor range . When the computed stress intensity factor range is lower than this threshold, no crack growth is assumed on the macroscale. Nevertheless, smaller fatigue cracks, for which several classifications can be found in the literature [8], are still able to grow at an even faster pace compared to cracks on the macroscale [10]. In order to assess the crack growth in this region, a wealth of research has been performed and there are many models that have been suggested to assess fatigue crack growth. For a discussion on short crack growth, the reader is referred to the literature in [7,8,11,12,13,14,15]. The proposed models for estimating short crack growth are limited in their applicability, partly due to the underlying database. In addition, many of these short crack growth models are available in the literature [8,10,11,12]. Consequently, no model seems to be as established as the Paris law examining the macro-crack regime [10]. The (theoretical) advantage of short crack growth models is clear. The accumulation of damage caused by the loading of different amplitudes can be estimated by means of considering the corresponding growth law. When the problem of fatigue is addressed on the macroscale without crack growth, the accumulation of damage is an unsolved problem. The addition of the damage components is usually carried out in practical application with the aid of linear damage accumulation according to Miner’s rule [16] or according to one of its modifications [17]:
By doing so, the incorporation of the effects caused by the sequence of loading as well as by overload cycles are difficult to consider accurately. The damage events happening are simply set in relation to the resistance of this respective event derived from the appropriate Wöhler-curve. In this case the failure criterion is the value of the allowable Miner sum . Depending on the loading situation, several critical values for are suggested in the literature [3,17]. Besides Miner’s rule, several approaches to accumulate damage have been proposed in the past. A survey is given in reference [18].
Damage due to fatigue loading manifests itself through crack growth on a small-scale observation level. Therefore, theories in which damage is considered in the framework of continuum mechanics and adapted to observations on the macroscale cannot adequately reflect the true damage behaviour which starts on much a smaller scale. It shall be mentioned for completeness that short crack models have been proposed to assess a component’s fatigue strength on an engineering scale. An example is comprehensively discussed in [15]. When the initial crack is lower than a specific size, then even such models struggle to describe the propagation of cracks of smaller lengths. Nevertheless, the idea of describing the fatigue problem considering crack growth seems worthwhile exploring.
In contrast to the many empirically-based engineering approaches to fatigue crack growth and fatigue damage, modern methods of material science enable the simulation of crack growth in materials. This can be achieved with a lesser amount of phenomenological presumptions present in many continuum models. Computer aided material science may help the study of material phenomena applying first principle methods (e.g., [19]) as well as molecular dynamics (MD) methods [20,21,22] or multi-scale approaches on a much smaller scale. Especially MD has proven to be a useful tool to investigate fatigue crack growth in various materials, e.g., iron [23,24,25,26,27,28], fatigue in nano-twinned metals [29], copper [9,30], magnesium single crystals [31], aluminium [32], and others. In addition, molecular dynamic methods enable the simulation of crack growth as well as the direction in which a crack propagates without having to specify additional criteria [33] as is the case in LEFM.
Most investigations are limited to the consideration of a constant load with either a stress amplitude or a strain amplitude. For this reason, this article examines the influence of sequence effects on fatigue crack growth. The article is structured as follows. In Section 2, the simulation method is shortly described and subsequently, the simulation set-up is presented in Section 3. Afterwards, the results for the different loading scenarios are presented and discussed in Section 5. Lastly, a conclusion is presented.
2. Simulation Method
In MD computations, the material modelling is performed by the inter-atomic potential, which can be thought of as the equivalent to the constitutive relations in continuum mechanics [22]. According to the literature, simple pair potentials are not well suited to simulate metals [34,35,36] and therefore, many-body potentials are often applied to study metallic materials. In particular, the embedded atom method (EAM) has often been used in recent studies with reports that computed properties agree well with results obtained by experiments [34].
By adding an embedding energy function depending on the local electron density , which is computed from the local environment of the respective particle [34], the many-body character of the resulting potential is ensured. The contributing pairwise additive part as well as the electron density depends on the inter-atomic distance [35]. These potentials are often fitted to reproduce certain experimental properties [36] and, therefore, different potentials may lead to diverging results. A comparison of the fracture behaviour and fracture toughness in -iron using 8 different EAM potentials under mode I loading in various crystal orientations was conducted in [37]. It was concluded that none of these potentials completely match the fracture behaviour of observed experiments in all configurations. Nevertheless, some potentials are better for the purpose of the investigation of fracture [37]. Following these results, the Mendelev-II [38] potential was utilised for the examinations in this work.
3. Simulation Setup
To study the effects of load order, we presumed an initial crack and studied fatigue crack propagation starting in the centre of the specimen as shown in Figure 1.
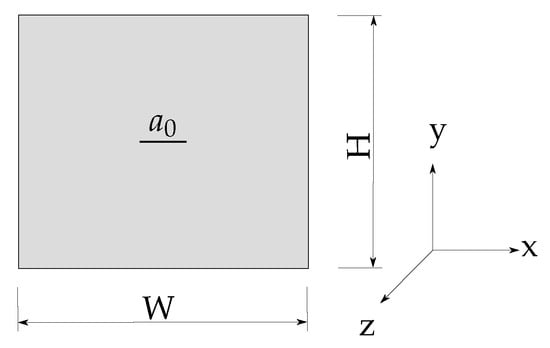
Figure 1.
Specimen with centre crack.
The model was set up in a three dimensional space defined by a Cartesian coordinate system. As in Figure 1, the dimensions were defined depending on the lattice constant a = 2.8665 Å for -Fe [39]. The width W in x-direction and the height H (y-direction) were set to 210 times the lattice constant and the initial crack length was related to the width through the relation W/10. The thickness T of the model was 12 times a. The model orientation was [001](010), whereas the number in the square brackets describes the orientation of the initial crack front and the numbers in parentheses notate the original crack face. On this stage, periodic boundary conditions were applied on both sides of the model in the x and z direction as well as on the non-periodic boundary conditions in the direction of the applied load.
The model was built and computed using the LAMMPS code [40]. To simulate fatigue crack propagation, the specimen was subjected to applied strain, as shown in Figure 2, in different loading scenarios. To prohibit the healing of the crack in the compression regime as far as possible a slightly higher strain amplitude of = 0.04 was applied in the first load step. From there, the strain was applied in a cyclic fashion using a strain rate of 1.5 × 10 s. Besides the loading with a constant amplitude (a.), high-low (b.), and low-high (c.) load order was investigated. In addition, a single overload event (SOL) (d.) as well as a single underload (SUL) (e.) was also simulated. To save computational time, 8 load steps consisting of loading and unloading were computed. Before the cyclic loading was applied, the model was equilibrated using constant NVE (i.e., constant number of particles N, volume V, and total energy E of the system) time integration, whereas the temperature was controlled by utilising a Berendsen thermostat [41] with a temperature of 300 K and a relaxation parameter of 0.1 ps. After relaxation, the crack was implemented by deactivating the interaction of the particles in the relevant area. By doing so, a crack was created as a discontinuity which has the same depth as the model. The timestep used in all computations was 0.001 ps and the integration of the equation of motion was performed utilising the velocity-Verlet algorithm [42].
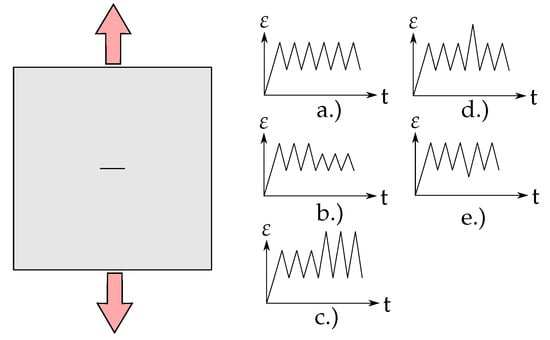
Figure 2.
Direction of loading and investigated loading sequences.
4. Results
4.1. Determination of Crack Length
After the simulations, the crack growth was manually measured with the help of Ovito [43], where only the crack extension in x-direction was considered. The model was projected onto a plane and the distance between the crack tips was investigated. If voids occurred, their contribution was added to the resulting value. The determination of the crack tip was not straightforward in all cases. Figure 3 shows crack tip blunting, which is a sign of ductile behaviour. In such cases, it is easy to determine the crack tip. It becomes more difficult in cases such as the one shown on the right.
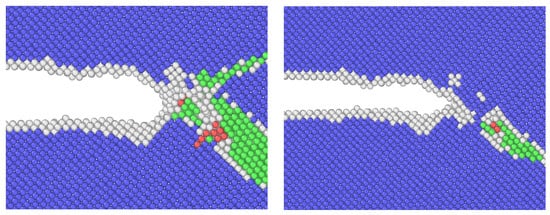
Figure 3.
Various crack tip geometries. The colouring is presented according to common neighbour analysis. The blue colour indicates bcc, whereas the green notates fcc, and the red indicates the hcp iron structure. Particles belonging to an unidentified structure are visualised in grey.
4.2. Constant Strain Amplitude
After relaxation, the model was loaded with an initial strain amplitude of = 0.04. From this state, the subsequent cyclic loading was applied. For these loading sequences, a strain amplitude of = 0.02 was used to open the crack in mode I. Equal to the loading phase, the unloading was performed by utilising a strain amplitude of = 0.02. Figure 4 shows the crack lengths at the peaks of the respective loading and unloading cycles.
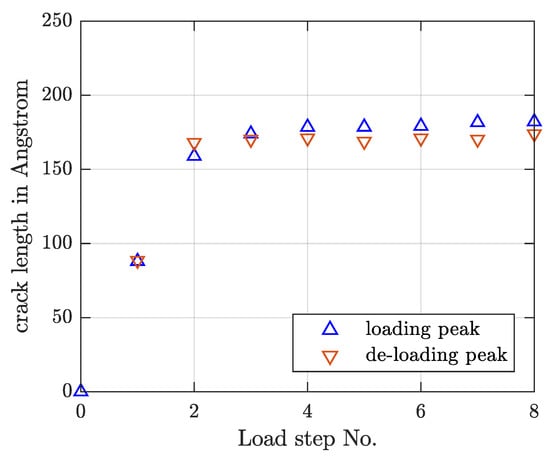
Figure 4.
Evolution of the crack length. The blue signs indicate the peaks of the loading cycles, whereas the red triangles indicate the peaks of the unloading steps.
It can be deduced from Figure 4 that the crack length increased while unloading from the peak of the second load step. Therefore, the crack is longer at the point where the unloading peek was reached in contrast to the peak of the second load step, e.g., crack propagation occurring as the crack closed. After the first and second load step, the rate of crack growth decreased and a more uniform crack growth was observed. The time evolution of the crack is shown in Figure 5.
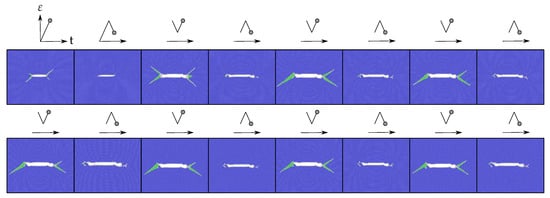
Figure 5.
Evolution of the crack during cyclic loading. The images show the peak of the loading and unloading cycle for each of the eight cycles. The second row is a prolongation of the first. The colouring is presented according to common neighbour analysis. The blue colour indicates bcc, whereas the green notates fcc, and the red indicates the hcp iron structure. Particles belonging to an unidentified structure are visualised in grey.
At the beginning of the loading cycle, the crack was closed as it had been introduced after relaxation. When the strain amplitude was applied, the crack opened and started to propagate, while phase transformation from bcc to fcc and hcp occurred as deduced from Figure 5. In addition, slip band formation can also be observed.
4.3. High-Low and Low-High Loading
Engineering structures and components are not always stressed by constant amplitude loading. More often, the loading fluctuates and the loading cycles have to be counted using an algorithm, for example the rain-flow counting method. After this procedure, the load cycles are classified and summarised in classes containing cycles in a certain range and their damage contributions can be calculated using Miner’s rule. In the case of fracture mechanics, the damage contribution of varying load cycles can be studied through the growth of a crack. To investigate the effect of a loading sequence, a few loading sequences are common [44]. Four of these sequences, e.g., high-low, low-high as well as single over and under-load events, were adapted in the present work to study the effect of simple load orders for nanostructurally small cracks.
4.3.1. High-Low
To investigate the effect of high-low loading, the specimen was loaded with a strain amplitude of = 0.02 in tension and compression after the initial loading, which was = 0.04. The strain rate was kept constant at 1.5 × 10 s in all loading sequences. After the unloading of the fourth load step, the load amplitudes were reduced to = 0.01. The evolution of the crack extension is shown in Figure 6.
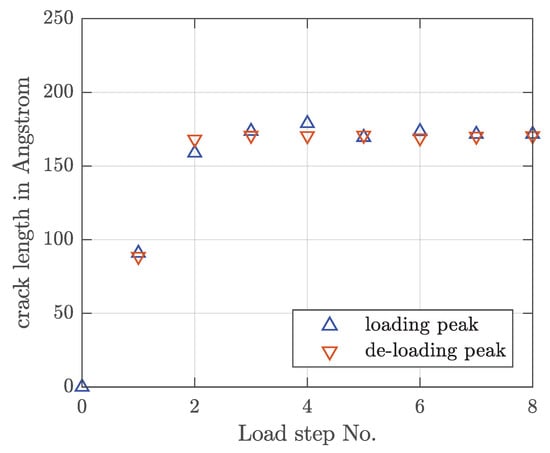
Figure 6.
Crack length vs. load step. High-low block loading.
When the loading was decreased after the fourth loading cycle, the crack arrested. The crack length at the compression peak was constant in load steps five to eight, whereas the crack length at the loading peaks varied slightly in load steps five and six but stayed unchanged in steps seven and eight. Note that small deviations might have been caused due to the manual measurement of the crack extension, which is difficult in certain cases. Similar to the threshold stress intensity factor in fracture mechanics, nanostructurally small cracks arrest when a certain threshold value is not reached [21,37]. Another reason for the stop of crack growth after the reduction of the load could be retardation effects, which can also occur during crack growth on the macroscale [44]. This is currently under investigation.
4.3.2. Low-High
When the applied strain was increased, a jump in crack extension took place as expected. Unfortunately, after reaching the peak of the fifth loading cycle, the model suffered from artificial effects due to the periodic boundary conditions as shown in the Figure 7 and Figure 8. This leads to the conclusion that the simulation model is too small and the size has to be increased to avoid self interaction. Consequently, the crack growth was not further reported because these results are no longer reliable.
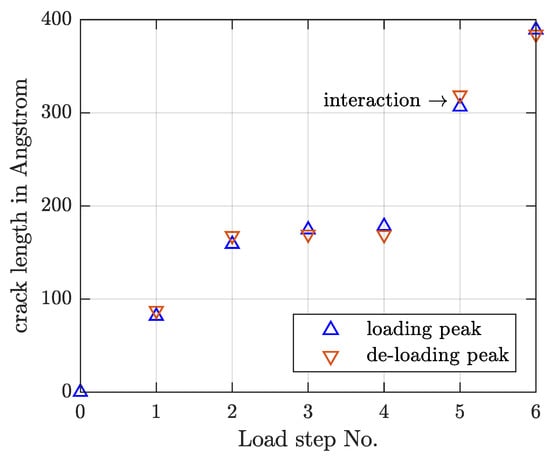
Figure 7.
Crack length vs. load step. Low-high block loading.
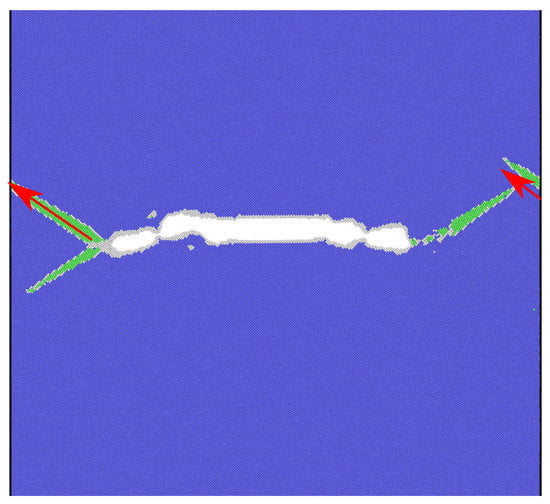
Figure 8.
Self-interaction due to the periodic boundary conditions. The particles leaving the left side of the model re-enter the system through the boundary on the opposite side.
4.4. Single Under- and Over-Load
4.4.1. Single Under-Load
In order to simulate a single under-load event, the applied strain amplitude was varied from = 0.02 to = −0.03 after reaching the loading peak of the fifth load step. After one loading step, the strain amplitude was again changed to the initial value. The results are shown in Figure 9.
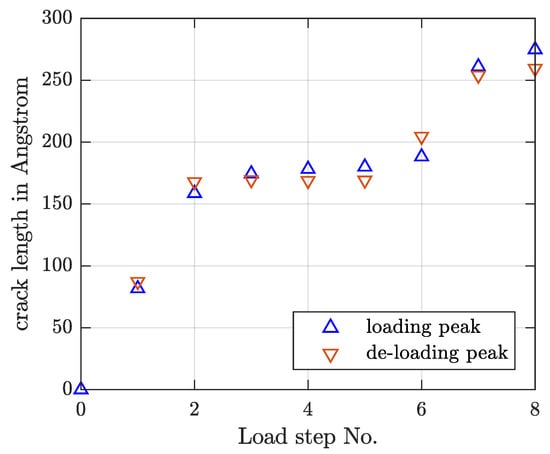
Figure 9.
Single under-load event.
After the compression was applied, the specimen was again loaded in order to open the crack. During the opening, a void formation was visible in the area near the crack tip before reaching the peak of the sixth load step. This is shown in Figure 10. During the unloading phase, this void increased in length. In the subsequent loading, another void was formed in front of the existing one and both voids as well as the main crack coalesced during further crack opening.
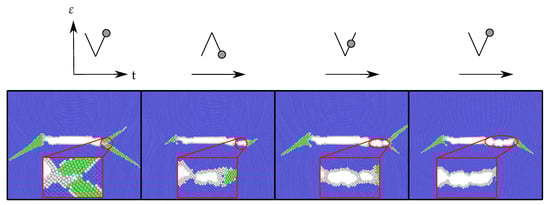
Figure 10.
Formation and coalescence of voids.
4.4.2. Single Over-Load
In order to simulate a single over-load event, a strain amplitude of approximately = 0.02 was applied for the first four cycles of loading and unloading. Subsequently, the loading was varied to = 0.03 and = −0.03 in the fifth loading and unloading cycle respectively. After the unloading phase of the fifth cycle, the strain amplitude was raised again to the initial amplitude and the specimen was cyclically loaded with the remaining load steps. The results are shown in Figure 11.
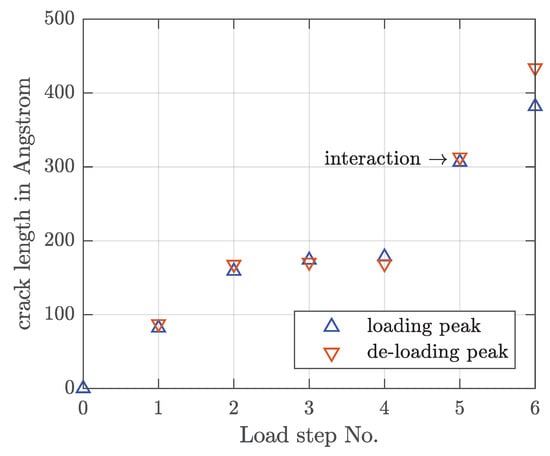
Figure 11.
Single over-load event.
As in the case of low-high block loading, a jump in crack extension could be observed when the amplitude was increased. In the subsequent loading and unloading processes, the model suffered from self-interaction. Hence, crack extension is not further reported.
5. Discussion
Crack growth due to fatigue loading up to eight load cycles was simulated using molecular dynamics in a specimen containing a centre crack. The positions of the crack tips were tracked and the crack extension at the corresponding load steps was reported for both loading and unloading peaks of the respective phases. It was observed that the crack length does not only increase in the opening stage (loading) of the crack, but also, in some cases, in the first stages of the unloading phase. This was due to void formation in the vicinity of the crack tip as shown in Figure 10 during the loading. These voids increased in size in the first stages of the subsequent unloading phase before partially closing during the later stages of unloading. When the next loading cycle was applied, these voids coalesced with the main crack. The evolution of the crack in the single over-load and low-high loading sequence could not be investigated satisfactorily since it emerged that the computation model was too small and the cracks suffered from self interaction due to the periodic boundary conditions.
Other limitations of the work lie in the quasi 2D set up of the problem. Such models are reported to suffer from several issues. Dislocations are not able to interact as well as move in the direction of the model’s thickness (z-direction) [32]. In addition, lattice trapping effects as well as gliding systems cannot be studied in detail [20]. Results obtained via MD simulations are strongly dependent on the utilised potential for which the appropriate choice relies on the aim of the corresponding simulation. In a recent comparison of eight EAM potentials [37], the authors concluded that the behaviour during fracture in bcc iron could not be reproduced entirely by any of these potentials.
The verification of the results obtained in the present works seem difficult. On the one hand, this is due to the circumstance that previous investigations of fatigue crack growth on the atomistic scale have concentrated on constant amplitude loading. A comparison with experimental data is not possible, as no corresponding data seems available. Besides conducting corresponding experiments, the results can only be verified by further computations. However, as long as the potential used is reliable, it may be assumed that the growth of fatigue cracks can be simulated accurately [22].
6. Conclusions
The aim of the contribution at hand was the investigation of the effect of the loading sequence in bcc iron during repeated loading and unloading procedures. When fatigue is assessed using crack growth models, the contribution of each loading cycle in terms of damage can be expressed through crack propagation. Deviation from the crack growth observed in the case of constant amplitude loading was detected where the specimen was loaded in variable amplitude. Even though loading was applied perpendicular to the initial crack, deviation of the crack path from a pure mode I to a slightly mixed mode (mode I + mode II) was detected. The determination of the crack tip was not straightforward in some cases, which may have added a slight inaccuracy to the resulting curves. When crack blunting occurred, the detection of the crack tip was more easy to achieve. The effect of the load sequence should be further investigated. In this context, simulations using larger models seem to be particularly useful. It is known from observations on the macroscale [44] that the order of loading can lead to such effects of acceleration and retardation. More detailed investigations of these effects on the atomistic scale are thus a relevant topic for further investigations. In addition, the temporal evolution could be more resolved in order to capture effects more accurately that may take place between the peaks of loading and unloading. The influence of different potentials would also be an interesting topic for further research.
Author Contributions
Investigation, M.L.; Supervision, T.H.; Writing—original draft, M.L. and T.H.
Funding
Open access funding provided by the University of Innsbruck.
Conflicts of Interest
The authors declare no conflict of interest.
Abbreviations
The following abbreviations are used in this manuscript:
| MD | Molecular dynamics |
| S-N | Stress life approach to fatigue |
| -N | Strain life approach to fatigue |
| LEFM | Linear elastic fracture mechanics |
| da | Increment increase of crack length |
| dN | Increment increase of cycles |
| C, m | Material parameters for the Paris equation |
| Range of stress intensity factor | |
| Maximum stress intensity factor | |
| Minimum stress intensity factor | |
| Threshold value for fatigue crack propagation | |
| Damage sum according to Miner’s rule | |
| Number of cycles occurring at the stress range i | |
| Number of cycles to failure at the stress range i | |
| EAM | Embedded atom method |
| EAM potential | |
| Scalar distance between atoms | |
| Pairwise additive contributions to the potential | |
| Electron density | |
| Initial crack length | |
| H | Height of the specimen |
| W | Width of the specimen |
| a | Lattice constant |
| Strain | |
| bcc | Body centered cubic crystal structure |
| fcc | Face centered cubic crystal structure |
| hcp | Hexagonal closed packed crystal structure |
| t | Time |
| SOL | Single overload |
| SUL | Single underload |
| Mode I | Crack opening perpendicular to the crack plane |
| Mode II | In plane sliding of the crack |
References
- Sander, M. Sicherheit und Betriebsfestigkeit von Maschinen und Anlagen: Konzepte und Methoden zur Lebensdauer-Vorhersage, 1st ed.; Springer: Berlin, Germany, 2008. [Google Scholar]
- Hobbacher, A. The use of fracture mechanics in the fatigue analysis of welded joints. In Fracture and Fatigue of Welded Joints and Structures; Elsevier: Amsterdam, The Netherlands, 2011; pp. 91–112. [Google Scholar]
- Hobbacher, A. (Ed.) Recommendations for Fatigue Design of Welded Joints and Components, 2nd ed.; IIW Collection, Springer: Berlin, Germany, 2016. [Google Scholar]
- Berger, C.; Blauel, J.G.; Hodulak, L.; Pyttel, B.; Varfolomeev, I. Bruchmechanischer Festigkeitsnachweis für Maschinenbauteile, 4th ed.; FKM-Richtlinie, VDMA-Verl.: Frankfurt am Main, Germany, 2018. [Google Scholar]
- Kuna, M. Finite Elements in Fracture Mechanics: Theory–Numerics–Applications; Solid Mechanics and Its Applications; Springer: Dordrecht, The Netherlands; New York, NY, USA, 2013. [Google Scholar]
- Stephens, R.I.; Fatemi, A.; Stephens, R.R.; Fuchs, H.O. Metal Fatigue in Engineering, 2nd ed.; Wiley: New York, NY, USA, 2001. [Google Scholar]
- Chowdhury, P.; Sehitoglu, H. Mechanisms of fatigue crack growth—A critical digest of theoretical developments. Fatigue Fract. Eng. Mater. Struct. 2016, 1–23. [Google Scholar] [CrossRef]
- Suresh, S. Fatigue of Materials, 2nd ed.; reprint ed.; Cambridge Univ. Press: Cambridge, UK, 2004. [Google Scholar]
- Potirniche, G.P.; Horstemeyer, M.F. On the growth of nanoscale fatigue cracks. Philos. Mag. Lett. 2006, 86, 185–193. [Google Scholar] [CrossRef]
- Davidson, D.L. Characterizing small fatigue cracks in metallic alloys. Metall. Mater. Trans. A 2004, 35, 7–14. [Google Scholar] [CrossRef]
- Hussain, K. Short fatigue crack behaviour and analytical models: A review. Eng. Fract. Mech. 1997, 58, 327–354. [Google Scholar] [CrossRef]
- Miller, K.J. (Ed.) Short Fatigue Cracks: [Papers Read at the ESIS Conference on Short Fatigue Cracks Held at Sheffield in December 1990]; Volume 13: ESIS Publication; Mechanical Engineering Publ: London, UK, 1992. [Google Scholar]
- Hobson, P.D. The formulation of a crack growth equation for short cracks. Fatigue Fract. Eng. Mater. Struct. 1982, 5, 323–327. [Google Scholar] [CrossRef]
- Endo, M.; Mcevily, A. Prediction of the Behavior of Small Fatigue Cracks. Mater. Sci. Eng. A 2007, 468, 51–58. [Google Scholar] [CrossRef]
- Zerbst, U.; Madia, M.; Schork, B.; Hensel, J.; Kucharczyk, P.; Ngoula, D.; Tchuindjang, D.; Bernhard, J.; Beckmann, C. Fatigue and Fracture of Weldments; Springer International Publishing: Cham, Switzerland, 2019. [Google Scholar]
- Miner, M.A. Cumulative damage in fatigue. Trans. ASME J. Appl. Mech. 1945, 12, A159–A164. [Google Scholar]
- Radaj, D.; Sonsino, C.M.; Fricke, W. Fatigue Assessment of Welded Joints by Local Approaches, 2nd ed.; Woodhead Publishing in Materials, Woodhead: Cambridge, UK, 2006. [Google Scholar]
- Fatemi, A.; Yang, L. Cumulative fatigue damage and life prediction theories: A survey of the state of the art for homogeneous materials. Int. J. Fatigue 1998, 20, 94. [Google Scholar] [CrossRef]
- Leung, K.W.K.; Pan, Z.L.; Warner, D.H. Kohn–Sham density functional theory prediction of fracture in silicon carbide under mixed mode loading. Model. Simul. Mater. Sci. Eng. 2016, 24, 035004. [Google Scholar] [CrossRef]
- Bitzek, E.; Kermode, J.R.; Gumbsch, P. Atomistic aspects of fracture. Int. J. Fract. 2015, 191, 13–30. [Google Scholar] [CrossRef]
- Farkas, D.; Selinger, R.L.B. Atomistics of Fracture. In Handbook of Materials Modeling; Yip, S., Ed.; Springer: Dordrecht, The Netherlands, 2005; pp. 839–853. [Google Scholar]
- Horstemeyer, M.F.; Farkas, D.; Kim, S.; Tang, T.; Potirniche, G. Nanostructurally small cracks (NSC): A review on atomistic modeling of fatigue. Int. J. Fatigue 2010, 32, 1473–1502. [Google Scholar] [CrossRef]
- Nishimura, K.; Miyazaki, N. Molecular dynamics simulation of crack growth under cyclic loading. Comput. Mater. Sci. 2004, 31, 269–278. [Google Scholar] [CrossRef]
- Ma, L.; Xiao, S.; Deng, H.; Hu, W. Molecular dynamics simulation of fatigue crack propagation in bcc iron under cyclic loading. Int. J. Fatigue 2014, 68, 253–259. [Google Scholar] [CrossRef]
- Ma, L.; Xiao, S.; Deng, H.; Hu, W. Atomic simulation of fatigue crack propagation in Ni3Al. Appl. Phys. A 2015, 118, 1399–1406. [Google Scholar] [CrossRef]
- Uhnáková, A.; Machová, A.; Hora, P. 3D atomistic simulation of fatigue behaviour of a ductile crack in bcc iron. Int. J. Fatigue 2011, 33, 1182–1188. [Google Scholar] [CrossRef]
- Uhnáková, A.; Pokluda, J.; Machová, A.; Hora, P. 3D atomistic simulation of fatigue behaviour of a ductile crack in bcc iron loaded in mode II. Comput. Mater. Sci. 2012, 61, 12–19. [Google Scholar] [CrossRef]
- Potirniche, G.P.; Horstemeyer, M.F.; Gullett, P.M.; Jelinek, B. Atomistic modelling of fatigue crack growth and dislocation structuring in FCC crystals. Proc. R. Soc. Lond. A Math. Phys. Eng. Sci. 2006, 462, 3707–3731. [Google Scholar] [CrossRef]
- Zhou, X.; Li, X.; Chen, C. Atomistic mechanisms of fatigue in nanotwinned metals. Acta Mater. 2015, 99, 77–86. [Google Scholar] [CrossRef]
- Potirniche, G.; Horstmeyer, M.; Jelinek, B.; Wagner, G. Fatigue damage in nickel and copper single crystals at nanoscale. Int. J. Fatigue 2005, 27, 1179–1185. [Google Scholar] [CrossRef]
- Tang, T.; Kim, S.; Horstemeyer, M.F. Fatigue crack growth in magnesium single crystals under cyclic loading: Molecular dynamics simulation. Comput. Mater. Sci. 2010, 48, 426–439. [Google Scholar] [CrossRef]
- White, P. Molecular dynamic modelling of fatigue crack growth in aluminium using LEFM boundary conditions. Int. J. Fatigue 2012, 44, 141–150. [Google Scholar] [CrossRef]
- Madenci, E.; Oterkus, E. Peridynamic Theory and Its Applications; Springer: New York, NY, USA, 2014. [Google Scholar]
- Lee, J.G. Computational Materials Science: An Introduction, 2nd ed.; CRC Press: Boca Raton, FL, USA; London, UK; New York, NY, USA, 2017. [Google Scholar]
- Tadmor, E.B.; Miller, R.E. Modeling Materials: Continuum, Atomistic and Multiscale Techniques; Cambridge University Press: Cambridge, UK, 2011. [Google Scholar]
- LeSar, R. Introduction to Computational Materials Science: Fundamentals to Applications; Materials Research Society, Cambridge Univ. Press: Cambridge, UK, 2013. [Google Scholar]
- Möller, J.J.; Bitzek, E. Comparative study of embedded atom potentials for atomistic simulations of fracture in α -iron. Model. Simul. Mater. Sci. Eng. 2014, 22, 045002. [Google Scholar] [CrossRef]
- Mendelev, M.I.; Han, S.; Srolovitz, D.J.; Ackland, G.J.; Sun, D.Y.; Asta, M. Development of new interatomic potentials appropriate for crystalline and liquid iron. Philos. Mag. 2003, 83, 3977–3994. [Google Scholar] [CrossRef]
- Bürgel, R.; Richard, H.A.; Riemer, A. Werkstoffmechanik: Bauteile Sicher Beurteilen und Werkstoffe Richtig Einsetzen, 2nd ed.; Springer Vieweg: Wiesbaden, Germany, 2014. [Google Scholar]
- Plimpton, S. Fast Parallel Algorithms for Short-Range Molecular Dynamics. J. Comput. Phys. 1995, 117, 1–19. [Google Scholar] [CrossRef]
- Berendsen, H.J.C.; Postma, J.P.M.; van Gunsteren, W.F.; DiNola, A.; Haak, J.R. Molecular dynamics with coupling to an external bath. J. Chem. Phys. 1984, 81, 3684–3690. [Google Scholar] [CrossRef]
- Verlet, L. Computer “Experiments” on Classical Fluids. II. Equilibrium Correlation Functions. Phys. Rev. 1968, 165, 201–214. [Google Scholar] [CrossRef]
- Stukowski, A. Visualization and analysis of atomistic simulation data with OVITO–the Open Visualization Tool. Model. Simul. Mater. Sci. Eng. 2010, 18, 015012. [Google Scholar] [CrossRef]
- Skorupa, M. Load interaction effects during fatigue crack growth under variable amplitude loading-a literature review. Part I: Empirical trends. Fatigue Fract. Eng. Mater. Struct. 1998, 21, 987–1006. [Google Scholar] [CrossRef]


© 2019 by the authors. Licensee MDPI, Basel, Switzerland. This article is an open access article distributed under the terms and conditions of the Creative Commons Attribution (CC BY) license (http://creativecommons.org/licenses/by/4.0/).