Article

Dislocation Density-Based Modeling of Dynamic Recrystallized Microstructure and Process in Friction Stir Spot Welding of AA6082

1
School of Materials Science and Engineering, Henan Polytechnic University, Jiaozuo 454003, China
2
School of Materials Science and Engineering, Harbin Institute of Technology, Harbin 150001, China
3
Institute for Materials Science and Welding, Graz University of Technology, Graz 8010, Austria
*
Author to whom correspondence should be addressed.
Metals 2019, 9(6), 672; https://doi.org/10.3390/met9060672
Submission received: 3 May 2019 / Revised: 27 May 2019 / Accepted: 7 June 2019 / Published: 10 June 2019
(This article belongs to the Special Issue The Behaviours of Alloys under Thermo-Mechanical Treatment)

Abstract

:
This work mainly focuses on a series of microstructural analysis and predictions regarding dynamic recrystallization behavior, change in grain size, and dislocation density. Additionally, this study includes the shape prediction of the stir zone formed during friction stir spot welding. Microstructure analysis of the joint reveals that the mechanism of dynamic recrystallization in the stir zone is geometric dynamic recrystallization. A set of constitutive equations based on dislocation density is established and implemented in DEFORM-3D software to predict dynamic recrystallization during friction stir spot welding of AA6082. From the experimental and model predictions, it is observed that the original microstructure in the stir zone is completely replaced by a recrystallized fine grained microstructure. There is satisfactory agreement between the experimental grain size and the simulated results. In addition, the predicted shape of the stir zone fits quite well with the experimental shape as well.

1. Introduction

Lightweight structures have attracted increasing attention in the automobile and aerospace industries to enhance performance efficiency as well as to reduce environmental impact [1,2,3]. More weight saving material such as aluminum alloy is utilized instead of steel in vehicle design. Resistance spot welding is the most frequently used process in vehicle body assembly. However, resistance spot welding of aluminum sheet is fraught with many disadvantages, which include porosity and cracks [4]. Moreover, a severe electrode wear problem caused by high current during process has also been encountered during the resistance spot welding of aluminum [5].
Friction stir spot welding (FSSW) is a new solid-state joining technology, which is based on the friction stir welding invented by TWI (The Welding Institute), UK in 1991 and can be used to partially replace the conventional resistance spot welding as well as riveting. FSSW has great advantages in the area of light alloy joining, especially for aluminum. It has won the favor of customers and recognition from the areas of aerospace, automobile, shipbuilding industries, and so on [6,7,8]. FSSW is primarily a three-stage process including plunge, dwell, and welding stage as illustrated in Figure 1. In the plunge stage, as shown in Figure 1a,b, a hard non-consumable rotating tool penetrates the plate to be welded. The material around pin undergoes significant transformation due to high temperature and stresses involved during this stage. In the dwell stage as shown in Figure 1c, the tool penetrates metals and tool shoulder contacts with upper plate, which generates more heat and plastic flow. Meanwhile, the weld zones are developed in plates around the tool. The two overlapping sheets are joined at a single location during FSSW and the rotating tool is withdrawn leaving a keyhole depression, as shown in Figure 1d. The final FSSW joint consists of four typical zones: stir zone (SZ), thermo-mechanically affected zone (TMAZ), heat affected zone (HAZ) and base material (BM). Thus, understanding of these stages is very crucial as the thermal and material flow fields generated in the process would dictate the final microstructure and weld quality. Besides FSSW of the same material, FSSW between different material, such as aluminum and copper [9,10,11], aluminum and magnesium alloy [12], even copper and polymer [13], have been fairly researched.
A number of previous studies have investigated recrystallization phenomena and mechanism during friction stir welding of aluminum alloy [14,15,16]. Results of these studies suggested that the recrystallization mechanism is very complex because aluminum alloys have high stacking fault energy. During common hot deformation of aluminum, dynamic recovery is the main restoration mechanism taking place in aluminum due to the high stacking fault energy. If large strain is reached, such as in friction stir welding or friction stir spot welding, dynamic recovery can be followed by geometric dynamic recrystallization (GDRX) [17] or by the formation of new grains by lattice rotation by continuous dynamic recrystallization (CDRX) [18,19]. These dynamic processes are influenced significantly by temperature, strain, strain rate, as well as the interaction between particles and dislocations. Many studies for modelling hot deformation, and microstructure evolution have been carried out so far. Recently, studies also have been concentrated on the prediction of the microstructure evolution during friction stir welding and friction stir spot welding [20,21,22]. However, the dislocation’s density and shape of the stir zone after FSSW has not been predicted yet.
There are several published papers on FSSW and processing, but so far in the open literature, there are very few papers on microstructure evolution modeling based on dislocation density. In this work, FEM software DEFORM-3D, Lagrangian implicit code designed for metal forming processes, was adopted to simulate the process of FSSW. To demonstrate the validity of the numerical model, it is first applied to compare the temperature data between experimental and simulated specimens. Meanwhile, the constitutive equation and GDRX model based on dislocation density under FSSW conditions were developed and implemented into DEFORM-3D to simulate the joint’s microstructure evolution including its dislocation density and grain size. The basic idea for GDRX is that the grain size is determined by the subgrain size, which depends on dislocation density. Through formation of subgrain boundaries, the number of dislocations reduce. When serrated subgrains meet each other, a new equiaxed grain forms. The detailed information can be found in Section 2.2. The recrystallized microstructure in SZ was investigated in detail using light microscopy and EBSD technique. The comparative study was carried out with a focus on the number fraction of misorientation angle in SZ with different processing parameters. The numerical simulation provided the temperature, strain and strain rate distribution in the specimen. In addition, the changing of dislocation density, grain size as well as the shape of SZ can be derived from the numerical simulation.

2. Experimental Work and Constitutive Model

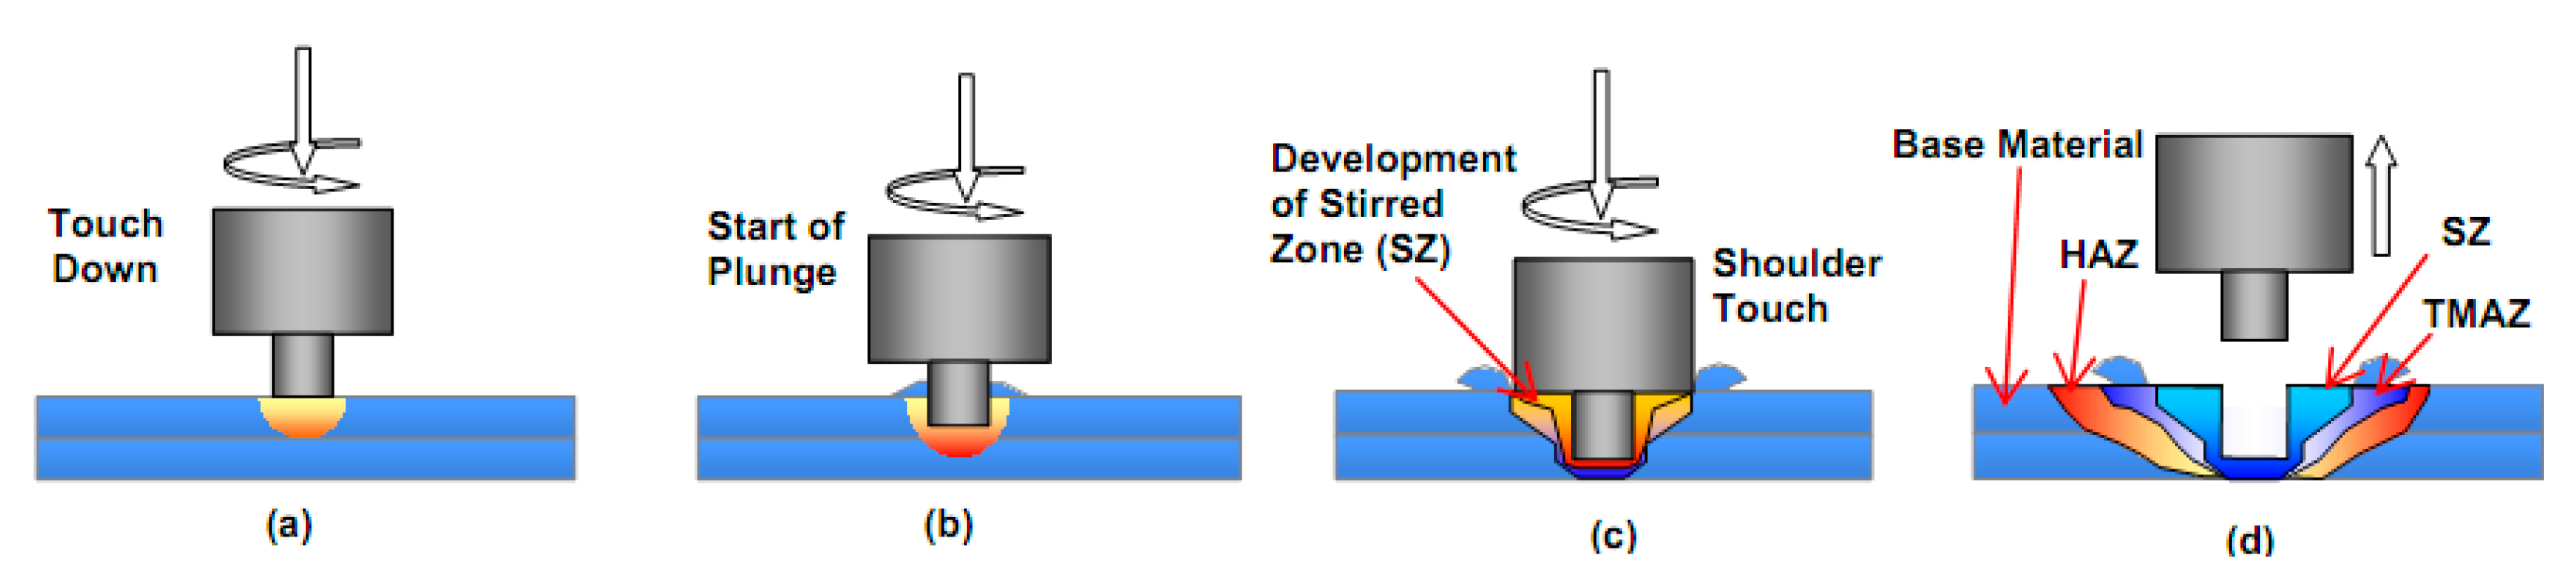
2.1. Material and Friction Stir Spot Welding

The investigated material in this research is AA6082, which is a high strength Al-Mg-Si alloy extensively used for structural purposes in civil and transport industries. The chemical composition of AA6082 is given in Table 1. The microstructure of the as received AA6082 is composed of coarse and equiaxed grains with an average size of about 81.7 µm, as presented in Figure 2. In order to avoid contact instability in numerical simulation due to intermittent contact at interface between sheets, one single sheet of 4 mm thickness was used as the work piece instead of two sheets. The length and width dimensions of the sheet are 60 mm × 60 mm.
The FSSW experiment was performed on a MTS I-Stir BR4 machine (MTS Systems Corporation, Eden Prairie, MN, USA). The FSSW tool is a cylindrical shaped wear resistant H13 steel with a shoulder diameter of 11 mm, pin diameter of 5.5 mm, and pin height of 2 mm. In order to examine the validity of the numerical model, temperature history during FSSW experiment has been recorded at 3 points of which the distances to the shoulder edge are 1 mm, 3 mm, and 5 mm, respectively. In order to freeze the dynamical recrystallization microstructure in the specimen, water spray cooling was carried out immediately after FSSW.

2.2. Constitutive Analysis and GDRX Model

In general, dynamic recovery in aluminum alloy is more likely to take place than dynamic recrystallization due to its high stacking fault energy during common deformation conditions characterized with lower strain and strain rate [23,24,25,26]. However, under a large strain and a high strain rate, just as in the FSSW stir zone, geometric dynamic recrystallization takes place as a result of dynamic recovery and grain pinching off when serrated grain boundaries meet each other [17,27]. Figure 3 reveals the schematic of GDRX process. The grains will elongate significantly after a large plastic deformation and turn into flat shaped grains. Meanwhile, the grain boundaries will become serrated due to dynamic recovery as shown in Figure 3a. As a consequence, the interaction of subgrain boundaries with the existing grain boundaries will take place. The serrated size Zl is equivalent to the subgrain size. New equiaxed grain will appear when the serrated boundary contacts each other as shown in Figure 3b. Therefore, the new grain size is equal to the subgrain size. This phenomenon has been observed in many research works related to aluminum alloy processing characterized with high strain and strain rate under elevated temperature [28,29,30,31].
The constitutive equations and GDRX model were developed and implemented into DEFORM-3D software (V6.0, Scientific Forming Technologies Corporation, Columbus, OH, USA) based on the data of tensile and compressive tests of AA6082 aluminum alloy since the software cannot yet provide the necessary database. Figure 4 shows the flow stress–strain under different temperature, strain, and strain rate utilized in FEM software (V6.0, Scientific Forming Technologies Corporation, Columbus, OH, USA).
Based on the GDRX principle, the size of new formed equiaxed grain is determined by subgrain size, which has a very close relationship with different dislocation variations. During hot deformation, three kinds of dislocations can be distinguished, namely, mobile dislocations (ρm), immobile dislocations in the cell interior (ρi), and immobile dislocations in the cell walls (ρw). The detailed variations for three kinds of dislocations in constitutive equations can be found in Reference [32]. Here, only the main concept of grain size evolution is presented.
The GDRX model was chosen to describe the microstructure evolution of AA6082 alloy during the FSSW process due to its typical recrystallization phenomenon. The basic idea of the GDRX model is that the size of new formed grain is determined by subgrain size, which mainly depends on three kinds of dislocation variation. In this research, the subgrain size evolution model developed by Nes [33] combined with GDRX was utilized. This model is based on the assumption of a cellular microstructure considering the cell size and the dislocation density in the cell interiors and walls as given in Figure 5.
As shown in Figure 5, the cell size will decrease with the localization of immobile dislocation in cell wall. On the other hand, the cell size will increase with the dislocation climb or annihilation. The subgrain size during the FSSW process can be calculated by following the equation in FEM:
δ SS = [ K δ ( k T G b 3 ) ( ε ˙ v D ) exp ( U SD k T ) ] 1 4 ,
where δss is the subgrain size, k the Boltzmann constant, T the temperature, G the shear modulus, b the Burgers vector, ε ˙ the strain rate, vD the Debye frequency, and USD the activation energy for self-diffusion, and
K δ = [ 8 b 4 ξ δ q c 2 C B δ ( 1 + f w ( q b 2 1 ) ) ] 1 ,
where ξδ is the stress intensity factor, Bδ the pre-exponential constants associated with subgrain growth, C the proportionality coefficient, fw the volume fraction of dislocation wall, and
q c = δ SS ρ i ,
and
q b = ρ w ρ i .
During the simulation, a critical strain εcritical depending on the size of subgrain and initial grain as well as the grain shape, was defined as following:
ε cr = ln ( K 1 D 0 s f δ SS ) ,
where D0 is the initial grain size, K1 the constant, and sf the shape factor (sf = max size/min size). The GDRX phenomenon occurred when the effective strain in material exceeded the critical strain defined above, as presented in Figure 6.
When the grain is subjected to a compression or tensile force, the grain width and length adjust according to the loading conditions. Consequently, there is no dynamical recrystallization developing in the grain until the length of the grain reaches a predetermined critical strain which results in instantaneous recrystallization kinetics for the entire grain [34]. Finally, the size of the new formed GDRX grain is equal to the subgrain size as defined in Equation (1). To simplify the model and study the dynamical recrystallization behavior, the growth of recrystallized grain after FSSW is not considered in this research. Accordingly, the experimental specimen was cooled by water spray immediately after FSSW.

3. Results and Discussion

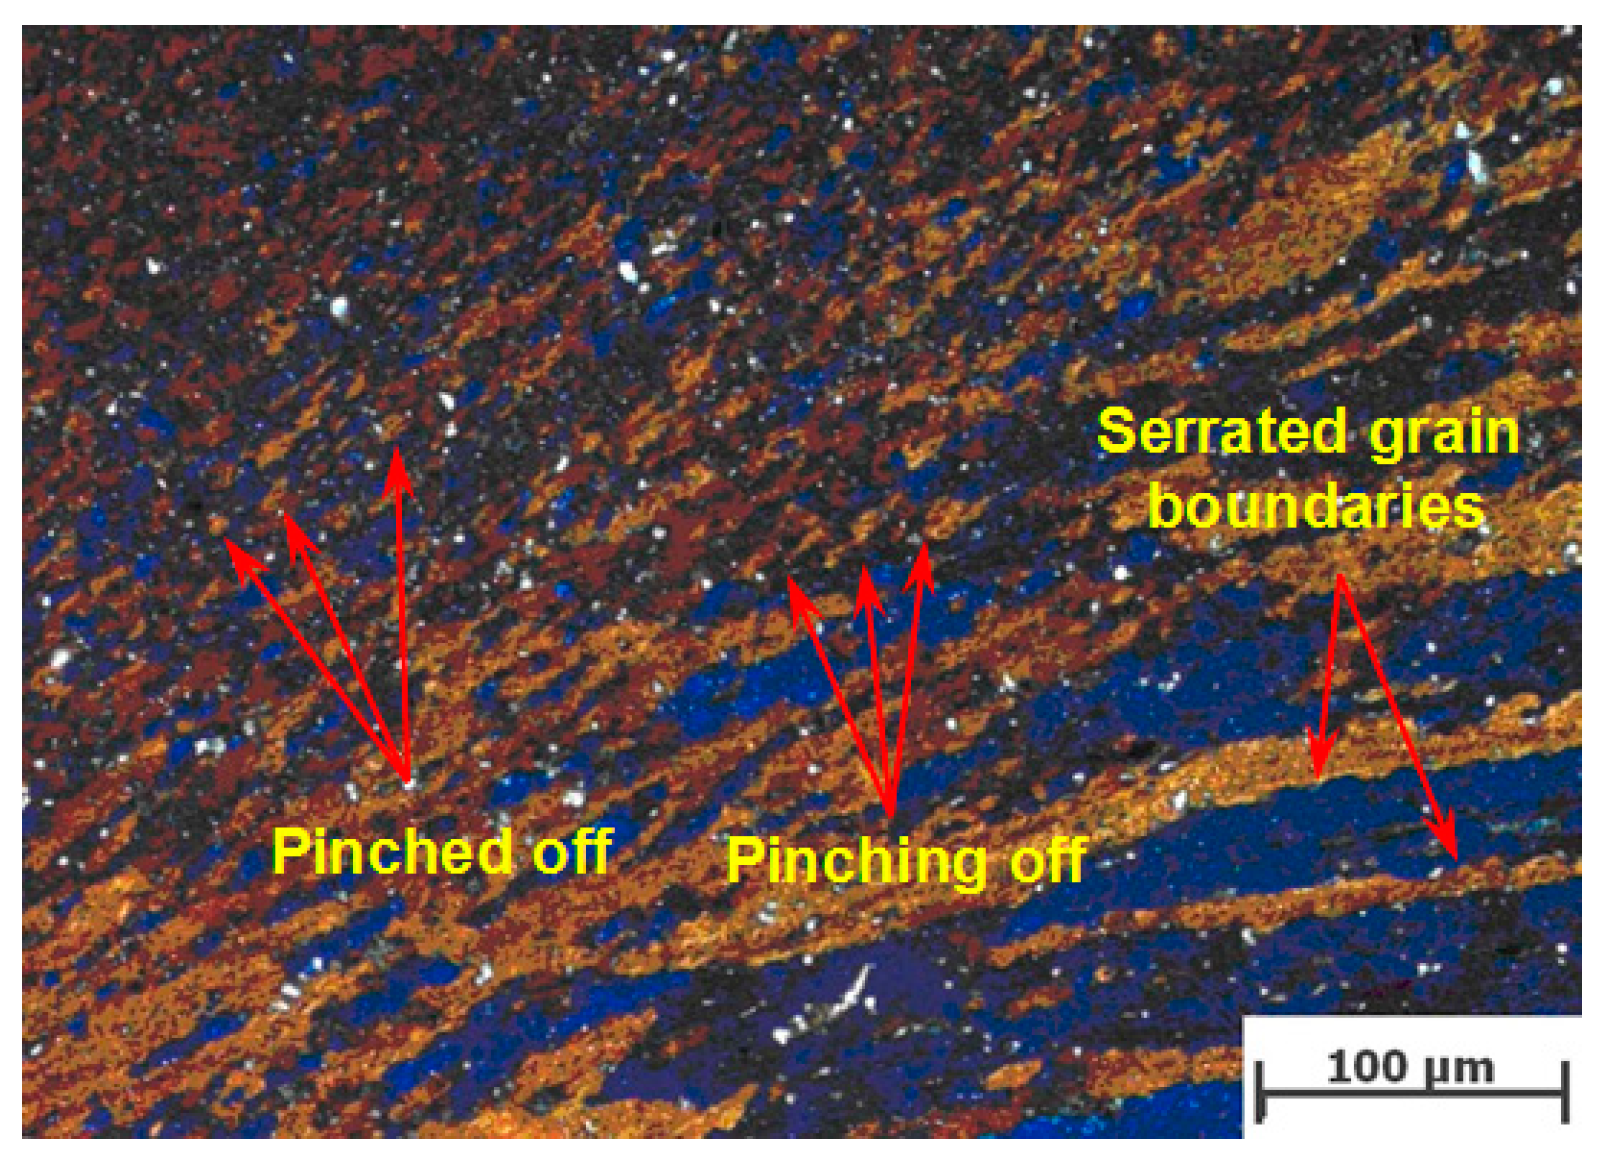
3.1. Microstructure Evolution of Experimental Specimen

After the FSSW process, the joint was divided into four typical zones: stir zone, thermo-mechanically affected zone, heat affected zone, and base material, as presented in Figure 7. The microstructure in the stir zone was characterized by very fine equiaxed grains instead of large equiaxed grains. GDRX was completely finished in SZ and could only be observed in TMAZ as shown in Figure 8. SZ located at upper left side and TMAZ at lower right side in Figure 8. As can be seen, the grains in TMAZ were elongated due to the plastic deformation. Some serrated grain boundaries were being formed far from SZ as indicated. Meanwhile, some grains were pinched off or pinching off, according to the distance to SZ. It indicates that the GDRX model is appropriate for the FSSW process of AA6082 alloy. The grain size in HAZ is a little larger than that in BM due to the grain growth induced by heat input from SZ.
Figure 9 shows the EBSD analysis of the stir zone experienced FSSW with the following process parameters: rotating speed 1600 rpm, plunge rate 72 mm/min, plunge depth 2.2 mm, and dwell time 3 s. Figure 9a indicates that SZ completely consists of fine equiaxed grain instead of coarse grain. The resultant grain size distribution is shown in Figure 9c. It can be calculated that 79.2% of the area is occupied by fine grain with the size between 3–6 µm. The weighted average grain size in SZ is 4.75 µm. Figure 9b gives the EBSD boundary map with black lines representing misorientations above 15°, green boundaries between 10° and 5°, and red boundaries with misorientations less than 5°. The relationship between misorientation angle and number fraction is given in Figure 9d. As can be calculated, the percentage of misorientation angle below 5° in SZ is 52.1%, between 5° and 10° is 3.43% and above 15° is 44.47%.
To study the microstructure evolution in SZ while experiencing lower rotational speed, EBSD analysis has been carried out in an experimental specimen with the following parameters: rotating speed 400 rpm, plunge rate 18 mm/min, plunge depth 2.2 mm, and dwell time 3 s. Figure 10 shows that much finer equiaxed recrystallized grains are formed in SZ while experiencing lower rotational speed. Figure 10c presents the distribution of grain size in which the small sized ones, between 0.4 μm and 0.9 μm, are the most, accounting for 66% of the total measuring area. The weighted average grain size of SZ is 0.74 μm. Compared with the specimen experiencing high rotating speed, the grain size, which is temperature depending, becomes smaller by nearly one order of magnitude. The main reason is that at a lower rotating speed, less friction heat is generated during the process, leading to temperature decrease in SZ [11,21,35]. Figure 10d shows the relationship between misorientation angle and number fraction, in which the percentage of misorientation angle below 5° is 50.8%. The percentage of misorientation angle between 5° and 10° is 2.26% and above 15° is 46.94%.
The number fraction of misorientation angle in base material has also been measured and the comparison result is given in Table 2. Compared with the data in base material, it can be seen that the number fraction of misorientation angle above 15° increases significantly in the stir zone produced by both of high and low rotating speeds. Meanwhile, the number fraction of misorientation angle below 5° decreases from 88% to nearly 50%; the value between 5° and 10° remains nearly constant. It indicates that GDRX consumes a mass of small misorientation angle to produce much finer equiaxed grain.

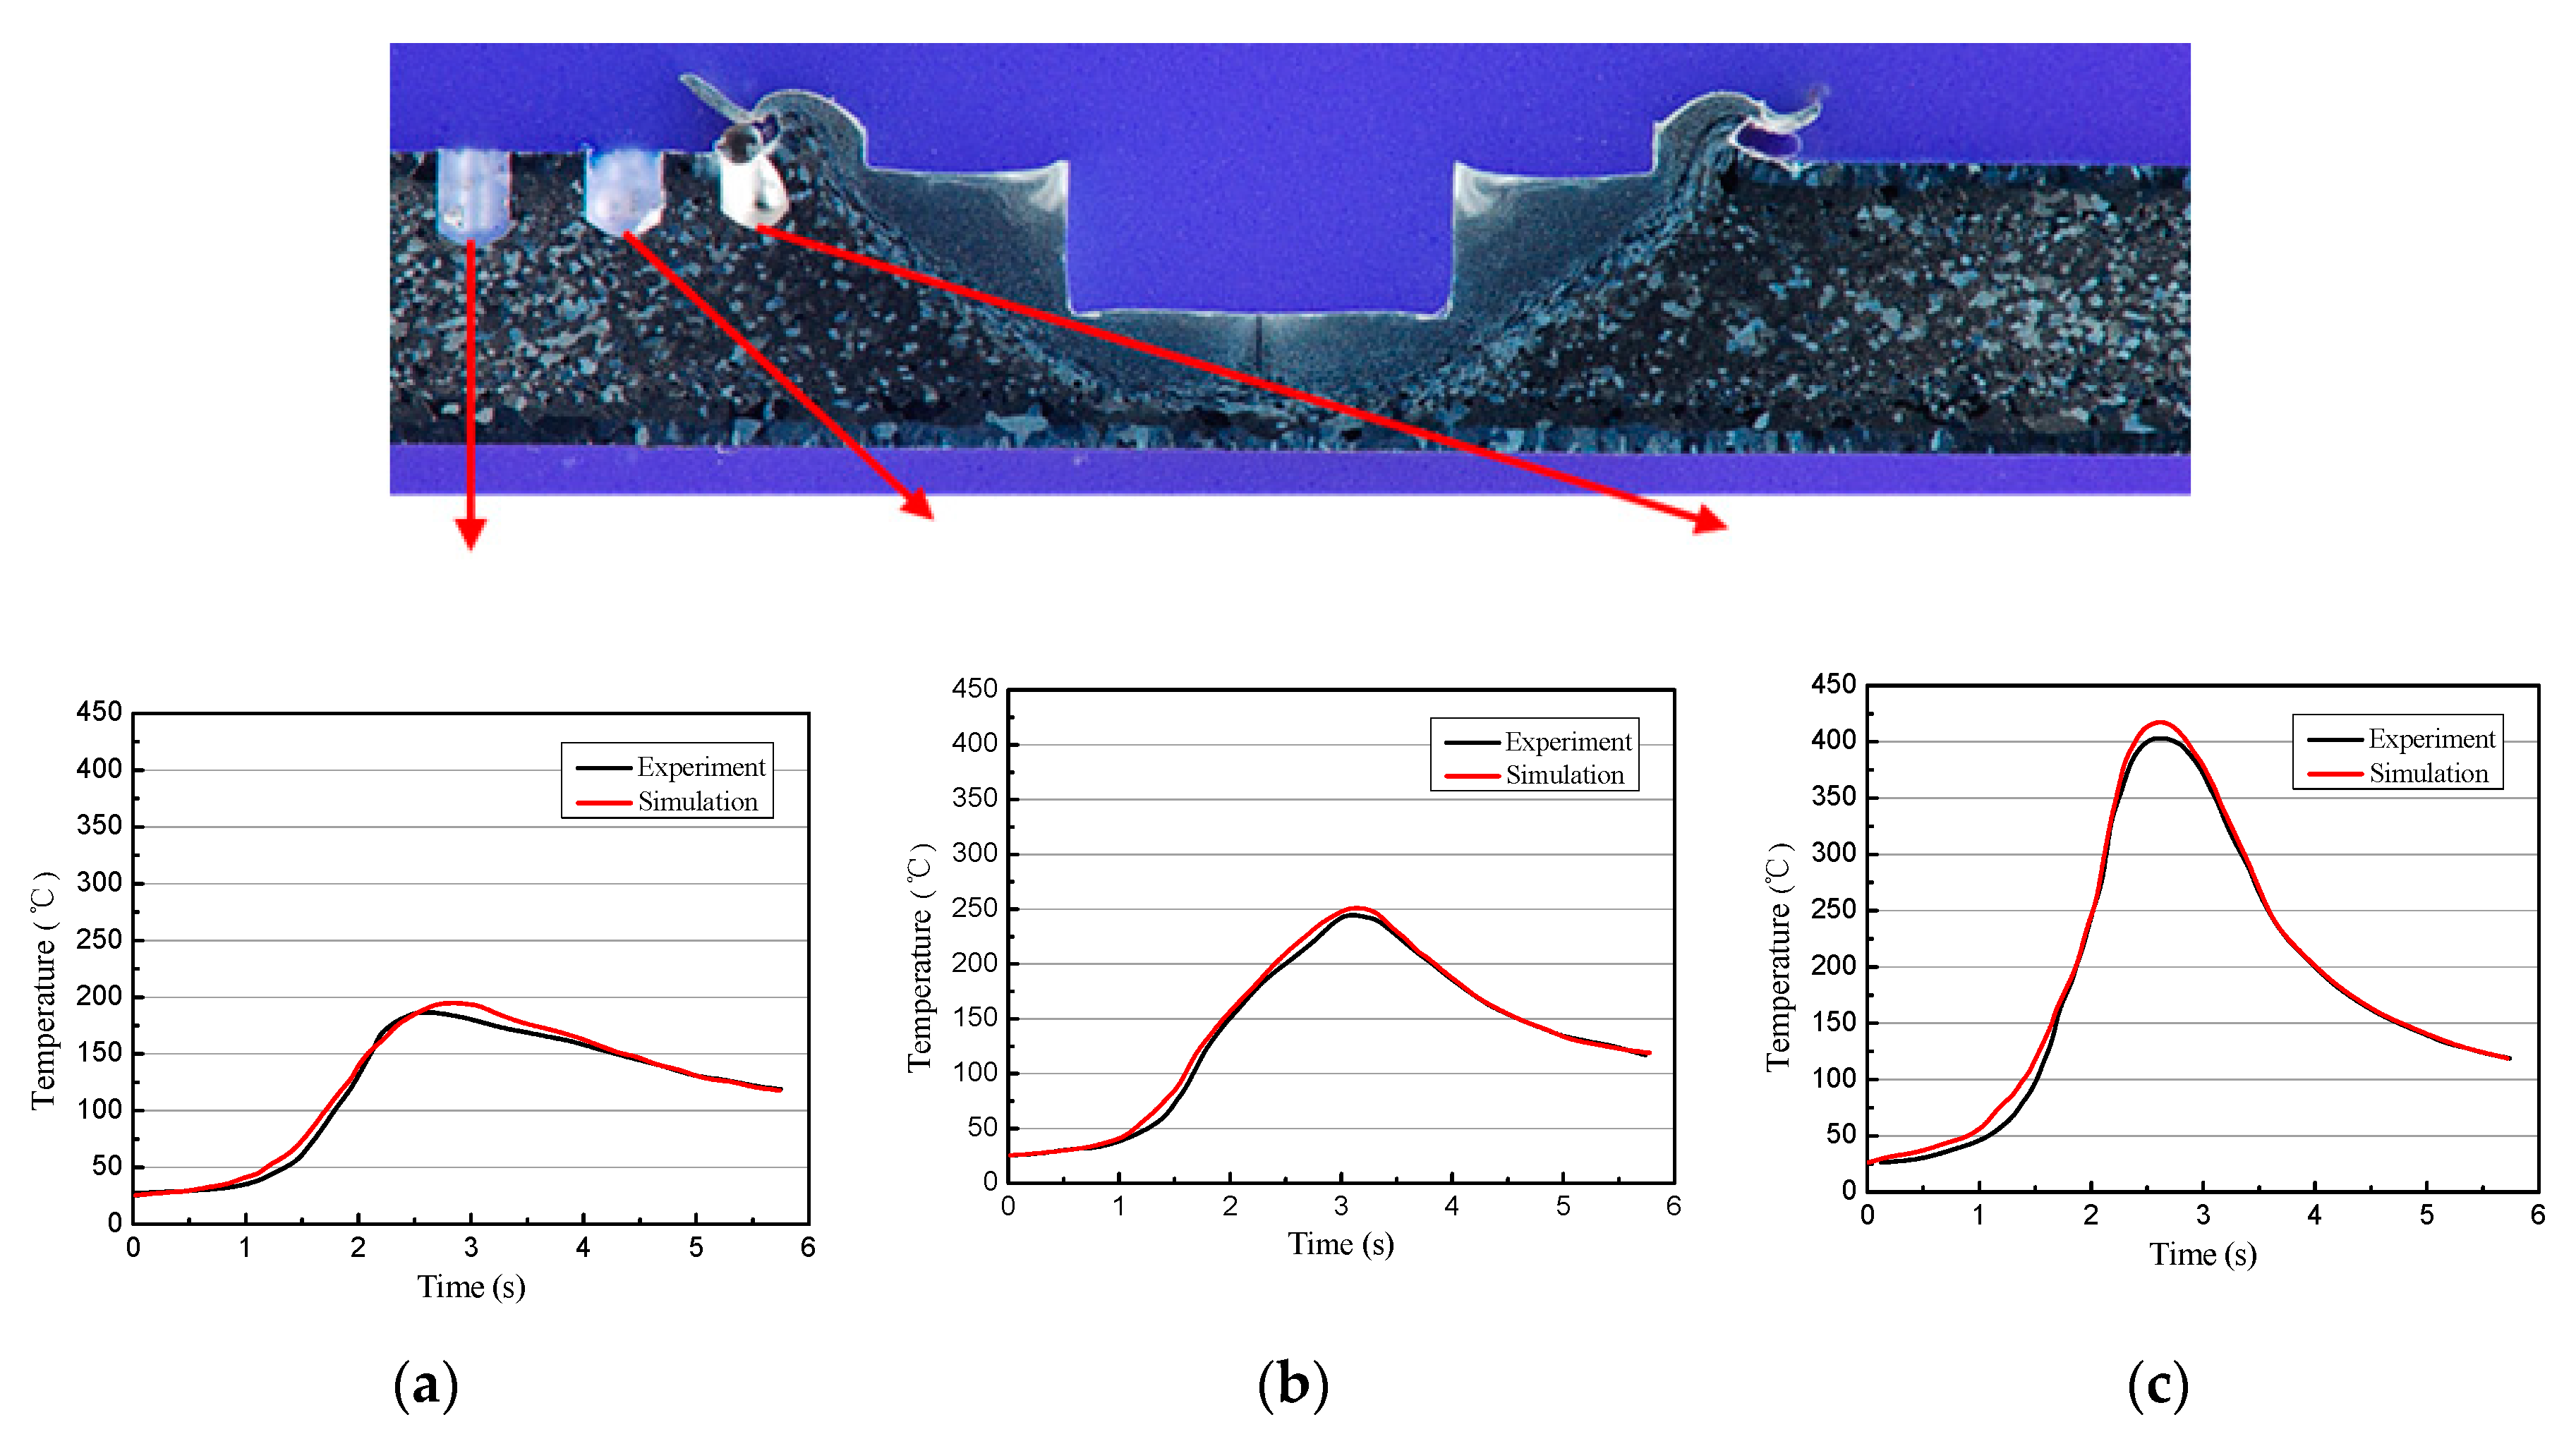
3.2. Process of Friction Stir Spot Welding

In order to validate the veracity of the numerical model, the data from numerical simulation and experiment needed to be compared. Before the experiment, three holes having a diameter equal to 1 mm and depth 1 mm were drilled, respectively, at a specific distance from the outer edge of the shoulder (1 mm, 3 mm, and 5 mm). Afterwards, three K-type thermocouples were sequentially inserted into the formed holes and fixed by insulating high temperature glue. During FSSW, thermocouples converted heat signal into electrical signal output. Then temperature cycle of the point near the hole was obtained. Figure 11 shows the temperature data comparison between experiment and simulation at 3 defined points. The temperature curves show that experimental and simulated data are quite close. Therefore, the numerical model established in this research is proved to be quite accurate.
Temperature, strain and strain rate are fundamental data for the calculation of dislocation density and grain size as described before. Therefore, those values have significant influences on the microstructure evolution of the FSSW joint. With process parameters: rotating speed 1600 rpm, plunge rate 72 mm/min, plunge depth 2.2 mm, and dwell time 3 s, the temperature, effective strain rate, and effective strain distribution in the workpiece at the end of the process are shown in Figure 12. It can be seen that the peak temperature during FSSW is 526 °C, which appears at the interface between shoulder and tool pin. The peak temperature value is about 0.86 times the melting point of the base material. Figure 12b,c shows that the effective strain rate and effective strain are much larger than those of common plastic deformation. The largest strain and strain rate in the stir zone can reach 332 mm/mm and 400 (mm/mm)/s, respectively. Figure 12b indicates that the large strain rate is mainly located in the material around the pin hole. Although the linear velocity below the shoulder is larger than that around the pin, the material close to the tool pin has a larger effective strain compared to that below the shoulder. Under the condition of large strain and high strain rate in SZ and TMAZ, the GDRX process takes place as shown in Figure 3b.

3.3. Evolution of Dislocation Density and Grain Size

The three kinds of dislocation densities were calculated as a function of strain, strain rate and temperature in the material. Before simulation, the initial three kinds of dislocation densities in AA6082 were defined to be 1.00 × 10¹² m/m3. Figure 13 presents the distribution of three kinds of dislocation density at the end of the FSSW process. The mobile dislocation density did not increase very much in the workpiece as a result of its mobility under elevated temperature, which basically remained unchanged and the maximum mobile dislocation density was 1.50 × 10¹² m/m3. On the other hand, dislocation density in cell walls increased significantly and the average value around the key hole reached 3.40 × 10¹³ m/m3 as shown in Figure 13c. The value of immobile dislocation density was between those of mobile dislocation density and dislocation density in cell walls. For three kinds of dislocations, the higher density area were mainly located at the interface between tool pin and base material, while the other area basically remained unchanged just like the distribution of strain rate in material. It denotes that three kinds of dislocation density are quite strain-rate dependent. Compared with cold plastic deformation, FSSW has a larger strain and strain rate. However, the simulation result shows that the dislocation densities in the material are quite low. The main reason is that GDRX occurred during the FSSW process, which decreases the grain size through the annihilation of dislocations within the cells.
The experimental results illustrate that grain size in SZ is refined significantly. Based on dislocation density and the GDRX model stated before, grain size distribution at different stages of FSSW is shown in Figure 14. The following process parameters: rotating speed 1600 rpm, plunge rate 72 mm/min, plunge depth 2.2 mm, and dwell time 3 s were utilized in this simulation. As can be seen in Figure 14a, GDRX already occurred during the plunging stage. The main GDRX area around the tool pin was characterized by elevated temperature, large strain, and high strain rate. The grain size in the GDRX area was quite fine and uniform. On the other hand, the material under the tool pin remained unchanged because effective strain in this area was less than the critical strain as defined in Equation (5). At the moment of shoulder contact with workpiece, the GDRX area increased. Meanwhile, the material under the tool pin also underwent GDRX as shown in Figure 14b. At the end of the FSSW process, the GDRX area and grain size were almost the same as in Figure 14b. The average GDRX grain size in the simulation was around 5.8 µm. Moreover, the weighted grain size measured by EBSD in SZ was 4.75 µm. It means that the simulation had a good accuracy.

3.4. Shape Prediction of Stir Zone

For the FSSW joint, the shape and size of SZ has significant influence on joint mechanical properties. In this research, point tracking technology in DEFORM-3D was utilized to predict the shape and size of SZ. The schematic of point tracking is illustrated in Figure 15. Before numerical simulation, 117 points were defined in the workpiece with the horizontal distance 0.5 mm and vertical distance 0.5 mm. Due to the symmetry of the FSSW joint, only half of the cross section needed to be defined. During numerical simulation, the points may leave their initial positions because of the plastic flow caused by tool rotation. As a consequence, the points located in SZ disappeared from the defined cross section.
By connecting points at the border, the shape and size of SZ could be predicted as shown in Figure 16a. Figure 16b presents two curves extracted from the experiment and simulation with high rotational speed, which illustrates that numerical simulation and experimental result matched very well. Moreover, displacement of the points in Figure 16a indicated that material deformation in different areas is quite different. The material under the center of the tool pin mainly experienced compression deformation instead of shear deformation. The material under the tool pin away from the axis of symmetry mainly experienced both of compression and shear deformation. While the material under the tool shoulder mainly experienced shear deformation.

4. Conclusions

In this paper, the microstructure evolution of AA6082 alloy in FSSW joint is analyzed by using light microscopy and EBSD. The GDRX model is implemented into DEFORM-3D to predict the dislocation density and grain size in the joint area. Meanwhile, the stir zone shape is predicted by using a point tracking technique. The following conclusions can be drawn:
(1)
After the FSSW process, the grain size in the stir zone is refined significantly compared with the base material. Geometric dynamical recrystallization is the main grain refinement mechanism in the stir zone.
(2)
After the FSSW process, the number fraction of the misorientation angle below 5° decreases from 88% to nearly 50% compared with the base material; the value between 5° and 10° remains nearly constant. Through formation of subgrain boundaries, the number of dislocations decrease. GDRX consumes a mass of small misorientation angle to produce much finer equiaxed grain. The rotational speed has a significant effect on grain size in the stir zone, which decreases with the increase of rotational speed.
(3)
The largest strain and strain rate in the stir zone can reach 332 mm/mm and 400 (mm/mm)/s, respectively. The large strain and strain rate is mainly located in the material around the pin hole. For three kinds of dislocations, the higher density area is mainly located at the interface between tool pin and base material, while the other area basically remains unchanged.
(4)
During the plunging stage, GDRX will take place and the main GDRX area is around the tool pin. The predicted grain size in the stir zone is around 5.8 µm, which agrees well with the experimental results (4.75 µm). Point tracking technology in DEFORM-3D can be utilized to predict the shape and size of the stir zone.

Author Contributions

Investigation, Z.G., J.F., and Z.W.; resources, J.N.; supervision, C.S.; writing—original draft preparation, Z.G.; writing—review and editing, J.N. and C.S.

Funding

The research was financially supported by the National Natural Science Foundation of China (No. 51245008), the Science and Technology Project of Henan Province, China (No. 182102210312), the Key Scientific Research Project of Henan Higher Education Institutions, China (No. 15A430007).

Conflicts of Interest

The authors declare no conflicts of interest.

References

  1. Mohammadi, J.; Behnamian, Y.; Mostafaei, A.; Izadi, H.; Saeid, T.; Kokabi, A.H.; Gerlich, A.P. Friction stir welding joint of dissimilar materials between AZ31B magnesium and 6061 aluminum alloys: Microstructure studies and mechanical characterizations. Mater. Charact. 2015, 101, 189–207. [Google Scholar] [CrossRef]
  2. Micari, F.; Buffa, G.; Pellegrino, S.; Fratini, L. Friction Stir Welding as an Effective Alternative Technique for Light Structural Alloys Mixed Joints. In Proceedings of the 11th International Conference on Technology of Plasticity, ICTP 2014, Nagoya, Japan, 19–24 October 2014; pp. 74–83. [Google Scholar]
  3. Zhou, X.; Chen, Y.; Li, S.; Huang, Y.; Hao, K.; Peng, P. Friction stir spot welding-brazing of Al and hot-dip aluminized Ti alloy with Zn interlayer. Metals 2018, 8, 922. [Google Scholar] [CrossRef]
  4. Gean, A.; Westgate, S.A.; Kucza, J.C.; Ehrstrom, J.C. Static and fatigue behavior of spot-welded 5182-0 aluminum alloy sheet. Weld. J. (Miami, Fla) 1999, 78, 80s–86s. [Google Scholar]
  5. Khan, M.I.; Kuntz, M.L.; Su, P.; Gerlich, A.; North, T.; Zhou, Y. Resistance and friction stir spot welding of DP600: A comparative study. Sci. Technol. Weld. Join. 2007, 12, 175–182. [Google Scholar] [CrossRef]
  6. Shahani, A.; Farrahi, A. Effect of stirring time on the mechanical behavior of friction stir spot weld of Al 6061-T6 lap-shear configuration. Proc. Inst. Mech. Eng. Part C J. Mech. Eng. Sci. 2019, 233, 3583–3591. [Google Scholar] [CrossRef]
  7. Schmal, C.; Meschut, G.; Buhl, N. Joining of high strength aluminum alloys by refill friction stir spot welding (III-1854-18). Weld. World 2019, 63, 541–550. [Google Scholar] [CrossRef]
  8. Andalib, H.; Farahani, M.; Enami, M. Study on the new friction stir spot weld joint reinforcement technique on 5754 aluminum alloy. Proc. Inst. Mech. Eng. Part C J. Mech. Eng. Sci. 2018, 232, 2976–2986. [Google Scholar] [CrossRef]
  9. Mubiayi, M.P.; Akinlabi, E.T.; Makhatha, M.E. Current state of friction stir spot welding between aluminium and copper. Mater. Today: Proc. 2018, 5, 18633–18640. [Google Scholar] [CrossRef]
  10. Li, G.; Zhou, L.; Zhou, W.; Song, X.; Huang, Y. Influence of dwell time on microstructure evolution and mechanical properties of dissimilar friction stir spot welded aluminum–copper metals. J. Mater. Res. Technol. 2019, 8, 2613–2624. [Google Scholar] [CrossRef]
  11. Siddharth, S.; Senthilkumar, T. Development of friction stir spot welding windows for dissimilar Al5086/C10100 spot joints. Mater. Today Proc. 2018, 5, 6550–6559. [Google Scholar] [CrossRef]
  12. Dong, Z.; Song, Q.; Ai, X.; Lv, Z. Effect of joining time on intermetallic compound thickness and mechanical properties of refill friction stir spot welded dissimilar Al/Mg alloys. J. Manuf. Processes 2019, 42, 106–112. [Google Scholar] [CrossRef]
  13. Pandey, A.K.; Nayak, K.C.; Mahapatra, S.S. Characterization of friction stir spot welding between copper and poly-methyl-methacrylate (PMMA) sheet. Mater. Today Commun. 2019, 19, 131–139. [Google Scholar] [CrossRef]
  14. Simar, A.; Brechet, Y.; De Meester, B.; Denquin, A.; Gallais, C.; Pardoen, T. Integrated modeling of friction stir welding of 6xxx series Al alloys: Process, microstructure and properties. Prog. Mater Sci. 2012, 57, 95–183. [Google Scholar] [CrossRef] [Green Version]
  15. McNelley, T.R.; Swaminathan, S.; Su, J.Q. Recrystallization mechanisms during friction stir welding/processing of aluminum alloys. Scr. Mater. 2008, 58, 349–354. [Google Scholar] [CrossRef] [Green Version]
  16. Mishra, R.S.; Ma, Z.Y. Friction stir welding and processing. Mater. Sci. Eng. R Reprots 2005, 50, 1–78. [Google Scholar] [CrossRef]
  17. Blum, W.; Zhu, Q.; Merkel, R.; McQueen, H.J. Geometric dynamic recrystallization in hot torsion of Al-5Mg-0.6Mn (AA5083). Mater. Sci. Eng. A 1996, 205, 23–30. [Google Scholar] [CrossRef]
  18. Jata, K.V.; Semiatin, S.L. Continuous dynamic recrystallization during friction stir welding of high strength aluminum alloys. Scr. Mater. 2000, 43, 743–749. [Google Scholar] [CrossRef]
  19. Fratini, L.; Buffa, G. Continuous dynamic recrystallization phenomena modelling in friction stir welding of aluminium alloys: A neural-network-based approach. Proc. Inst. Mech. Eng. Part B J Eng. Manuf. 2007, 221, 857–864. [Google Scholar] [CrossRef]
  20. Chernikov, E.; Naumov, A.; Golubev, I.; Michailov, V. Numerical Simulation and Microstructure Analysis of Friction Stir Welded Al 6082. In Proceedings of the 24th International Conference on Metallurgy and Materials, METAL, Brno, Czech Republic, 3–5 June 2015; pp. 1423–1428. [Google Scholar]
  21. Zhang, B.; Chen, X.; Pan, K.X.; Li, M.; Wang, J.N. Thermo-mechanical simulation using microstructure-based modeling of friction stir spot welded AA 6061-T6. J. Manuf. Processes 2019, 37, 71–81. [Google Scholar] [CrossRef]
  22. Grujicic, M.; Ramaswami, S.; Snipes, J.S.; Avuthu, V.; Galgalikar, R.; Zhang, Z. Prediction of the grain-microstructure evolution within a friction stir welding (FSW) joint via the use of the monte carlo simulation method. J. Mater. Eng. Perform. 2015, 24, 3471–3486. [Google Scholar] [CrossRef]
  23. Huang, C.-Q.; Deng, J.; Wang, S.-X.; Liu, L.-l. A physical-based constitutive model to describe the strain-hardening and dynamic recovery behaviors of 5754 aluminum alloy. Mater. Sci. Eng. A 2017, 699, 106–113. [Google Scholar] [CrossRef]
  24. Guan, W.; Linyuan, K.; Zhiwen, L.; Shikang, L.; Luoxing, L. Flow softening behavior and microstructure evolution of aluminum alloy 6061 due to dynamic recovery. Mater. Res. Express 2019, 6, 056555. [Google Scholar] [CrossRef]
  25. McQueen, H.J. Development of Dynamic Recovery Theory for Aluminum. In Proceedings of the Proceedings from Materials Solutions Conference 2001, Indianapolis, IN, USA, 5–8 November 2001; pp. 351–360. [Google Scholar]
  26. Mostafaei, M.A.; Kazeminezhad, M. A novel approach to find the kinetics of dynamic recovery based on hot flow curves. Mater. Sci. Eng. A 2012, 544, 88–91. [Google Scholar] [CrossRef]
  27. Poletti, C.; Rodriguez-Hortala, M.; Hauser, M.; Sommitsch, C. Microstructure development in hot deformed AA6082. Mater. Sci. Eng. A 2011, 528, 2423–2430. [Google Scholar] [CrossRef]
  28. Watt, T.J.; Yasuda, S.; Ichitani, K.; Takata, K.; Carpenter, A.; Jodlowski, J.; Taleff, E.M. The effect of magnesium content on microstructure evolution during hot deformation of aluminum alloys. In Proceedings of the 142nd Annual Meeting and Exhibition, TMS 2013, San Antonio, TX, USA, 3–7 March 2013; pp. 499–503. [Google Scholar]
  29. Ridley, N.; Cullen, E.; Humphreys, F.J. Development of superplastic microstructures during the thermomechanical processing of Al-Cu-Zr alloys. In Proceedings of the 1998 TMS Annual Meeting, San Antonio, TX, USA, 15–19 February 1998; pp. 65–74. [Google Scholar]
  30. Negendank, M.; Taparli, U.A.; Gall, S.; Muller, S.; Reimers, W. Microstructural evolution of indirectly extruded seamless 6xxx aluminum tubes with axial variable wall thickness. J. Mater. Process. Technol. 2016, 230, 187–197. [Google Scholar] [CrossRef]
  31. McQueen, H.J.; Spigarelli, S.; Kassner, M.E.; Evangelista, E. Hot Deformation and Processing of Aluminum Alloys; CRC Press: Boca Raton, FL, USA, 2016; pp. 1–564. [Google Scholar]
  32. Roters, F.; Raabe, D.; Gottstein, G. Work hardening in heterogeneous alloys—A microstructural approach based on three internal state variables. Acta Mater. 2000, 48, 4181–4189. [Google Scholar] [CrossRef]
  33. Pettersen, T.; Holmedal, B.; Nes, E. Microstructure development during hot deformation of aluminum to large strains. Metall. Mater. Trans. A 2003, 34, 2737–2744. [Google Scholar] [CrossRef]
  34. Pari Jr, L.D.; Misiolek, W.Z. Theoretical predictions and experimental verification of surface grain structure evolution for AA6061 during hot rolling. Acta Mater. 2008, 56, 6174–6185. [Google Scholar] [CrossRef]
  35. Sekhar, S.R.; Chittaranjandas, V.; Govardhan, D.; Karthikeyan, R. Effect of tool rotational speed on friction stir spot welded AA5052-H38 aluminum alloy. Mater. Today Proc. 2018, 5, 5536–5543. [Google Scholar] [CrossRef]
Figure 1. Schematic illustration of the Friction stir spot welding (FSSW) process. (a) touch down of rotating tool; (b) start of pin penetration to commence plunge; (c) plunge ends by shoulder touch and development of weld zones; (d) retraction of the tool with weld zones formed.
Metals 09 00672 g001
Figure 2. Metallographic structure of as received AA6082.
Metals 09 00672 g002
Figure 3. Schematic of geometric dynamic recrystallization (GDRX): (a) serrated boundary shape; (b) formation of new equiaxed grains due to mutual bulge.
Metals 09 00672 g003
Figure 4. Flow stress–strain curves for AA6082 alloy under different temperature: (a) 300 °C; (b) 400 °C; (c) 500 °C; (d) 550 °C.
Metals 09 00672 g004
Figure 5. Schematic representation of the subgrain size evolution: (a) decreasing cell size due to localization of dislocations; (b) subgrain size growth due to dislocation climb.
Metals 09 00672 g005
Figure 6. Schematic of critical strain, which controls the GDRX phenomenon in simulation.
Metals 09 00672 g006
Figure 7. Typical microstructure of AA 6082 FSSW joint using process parameters: rotating speed 1600 rpm, plunge rate 72 mm/min, plunge depth 2.2 mm, and dwell time 3 s.
Metals 09 00672 g007
Figure 8. GDRX process observed in TMAZ of FSSW joint.
Metals 09 00672 g008
Figure 9. EBSD analysis of stir zone using process parameters: rotating speed 1600 rpm, plunge rate 72 mm/min, plunge depth 2.2 mm, and dwell time 3 s: (a) grain shape; (b) EBSD boundary map; (c) area fraction of grain size; (d) number fraction of misorientation angle.
Metals 09 00672 g009
Figure 10. EBSD analysis of stir zone using process parameters: rotating speed 400 rpm, plunge rate 18 mm/min, plunge depth 2.2 mm, and dwell time 3 s: (a) grain shape; (b) EBSD boundary map; (c) area fraction of grain size; (d) number fraction of misorientation angle.
Metals 09 00672 g010
Figure 11. Temperature comparison between experiment and simulation using a tool rotating speed of 1600 rpm at the location of: (a) 5 mm away from outer edge of the shoulder; (b) 3 mm away from outer edge of the shoulder; (c) 1 mm away from outer edge of the shoulder.
Metals 09 00672 g011
Figure 12. Distribution of field data in workpiece at the end of the FSSW process using a tool rotating speed of 1600 rpm: (a) temperature distribution; (b) effective strain rate distribution; (c) effective strain distribution.
Metals 09 00672 g012
Figure 13. Distribution of (a) mobile dislocations density; (b) immobile dislocations density in cell interior; (c) dislocation density in cell walls. (FSSW parameters: rotating speed 1600 rpm, plunge rate 72 mm/min, plunge depth 2.2 mm, and dwell time 3 s).
Metals 09 00672 g013
Figure 14. Grain size distribution at different stages of FSSW: (a) plunging stage; (b) at the moment of shoulder contact with workpiece; (c) at the end of the welding process. (FSSW parameters: rotating speed 1600 rpm, plunge rate 72 mm/min, plunge depth 2.2 mm, and dwell time 3 s).
Metals 09 00672 g014aMetals 09 00672 g014b
Figure 15. Schematic of point tracking: (a) initial location of tracking points; (b) distribution of the point.
Metals 09 00672 g015
Figure 16. Shape of the stir zone: (a) simulation result; (b) comparison between the simulation and experiment result. (FSSW parameters: rotating speed 1600 rpm, plunge rate 72 mm/min, plunge depth 2.2 mm, and dwell time 3 s).
Metals 09 00672 g016
Table 1. Chemical composition of AA6082 alloy (in wt. %).
ElementMgSiMnFeCuCrZnTiAl
wt. %1.6–1.20.7–1.30.4–1.00.50.10.250.20.1Bal.
Table 2. Comparison of number fraction of misorientation angle in stir zone and base material.
Number FractionMisorientation Angle below 5°Misorientation Angle between 5° and 10°Misorientation Angle above 15°
In stir zone produced by high rotating speed52.10%3.43%44.47%
In stir zone produced by low rotating speed50.80%2.26%46.94%
In base material88.00%2.66%9.34%

