Article

Numerical Analysis of the Effects of Pulsed Laser Spot Heating Parameters on Brazing of Diamond Tools

1
Institute of Manufacturing Engineering, Huaqiao University, Xiamen 361021, China
2
Fujian Engineering Research Center of Intelligent Manufacturing for Brittle Materials, Xiamen 361021, China
3
EPSRC Future Metrology Hub, Centre for Precision Technologies, University of Huddersfield, Huddersfield HD1 3DH, UK
4
School of Mechanical and Automotive Engineering, Xiamen University of Technology, Xiamen 361011, China
*
Author to whom correspondence should be addressed.
Metals 2019, 9(5), 612; https://doi.org/10.3390/met9050612
Submission received: 3 May 2019 / Revised: 22 May 2019 / Accepted: 23 May 2019 / Published: 27 May 2019

Abstract

:
A 3D finite element (FE) model is built to numerically analyze heating parameters on temperature during brazing diamond grains by the pulsed laser spot heating. A pulsed Nd:YAG laser is used for experimental validation. The results show that during laser heating, the temperature varies periodically because of the pulsed heat flux. Four key thermal indices, the maximum temperature Tmax, the minimum temperature Tmin, the average temperature Tav and the temperature fluctuation amplitude ΔT are addressed. The primary factor affecting Tmax, ΔT and Tav is the pulse power and on Tmin is the pulse frequency. The secondary effect factor on Tmax, Tav and ΔT is the pulse width and on Tmin is the pulse power. For engineering practice, the order of designing heating parameters is recommended as: pulse power, second frequency and last width.

1. Introduction

Recently, the brazing diamond technique has been considered to be a promising method of manufacturing diamond tools [1,2]. Owing to the strong chemical and metallurgical bonding within the diamond/filler alloy interface, brazed diamond tools have high bonding strength, grain protrusion and chip storage space [3]; this makes them ideal for the efficient and low-force grinding of difficult-to-cut materials, such as carbides [4], optical glass [5], ceramics [6], aluminium alloy [7], stone [8], and others.
Furnace and induction heating are common methods for brazing diamond; however, laser heating has attracted attention because it is a promising way for brazing diamond tools with grains in flexible distributed patterns. It has been proved that diamonds can be brazed onto a steel substrate via laser heating [9]. Wear performance assessments also confirmed that diamond grains brazed by laser heating are qualified for grinding [10,11]. However, literatures [12,13] show that the graphitization and cracking on the surface of the brazed diamond grains by laser heating can result in poor wear resistance and even fracture failure of brazed diamond tools, and were associated with the high brazing temperatures induced by laser heating [14,15]. Only a few investigations have been devoted to the relation between laser heating parameters and brazing quality because the temperature induced by laser pulse heating is not easily measured [16,17].
Numerical simulations provide another way to understand the brazing process. A finite element model of brazing diamonds by continuous laser scanning was built and the effects of the heating parameters on the temperature of the brazing zone were simulated [18]. However, pulsed laser heating is also commonly used in brazing. In contrast to continuous laser heating, pulsed laser heating is more complex and difficult to control because the heating zone is created by a serial heat pulses. Unfortunately, no simulation of the temperature field during diamond brazing by pulsed laser heating is presently available.
In this work, the laser heating parameters and their effect on temperature during diamond brazing by a pulsed Nd:YAG laser were investigated. A 3D transient temperature finite element (FE) model was built and the heat source was treated as pulsed heating flux. Experiments were carried out for verification of the proposed simulation model. The brazing temperatures were simulated by serial combinations of laser heating parameters. Four key thermal indices for diamond brazing were evaluated including the maximum temperature, the minimum temperature, the average temperature, and the temperature fluctuation amplitude. The designing sequence of heating parameters to engineering applications was recommended.

2. Experimental Setup

The laser heating device was a pulsed Nd: YAG laser (AXL-600 W, Dongguan Aoxin Laser Co., Ltd., Dongguan, China), shown in Figure 1, with wavelength of 1064 nm, average output laser power of 600 W, maximum pulse heat energy of 130 J, irradiation spot diameter of 0.2–2 mm, pulse width of 0.3–20 ms and pulse frequency of 1–100 Hz.
Diamond grains (HuangHe Diamond Limited Company, Henan, China) in 30/35 mesh were used. A commercial Ni–Cr powder (Ni 81–Cr 7–Si 5–B 3–Fe 4 by wt %) in 100/150 mesh was used as the filler alloy, with melting temperature of 1000–1030 °C. The substrates were cylindrical with diameter of 20 mm and height of 8 mm. The filler alloy was evenly coated on the top surface of the substrate with a layer thickness of 200 µm, as shown in Figure 1c. Then, diamond grain was orderly placed on the top of the coat. Subsequently, the specimen was placed in a chamber with the protection of nitrogen gas atmosphere. Finally, laser spot heating was carried out to braze the diamond grain. The diameter of the laser beam irradiated on the specimen was set as 1.5 mm.
A high-speed infrared thermal imager (ImageIR® 5325, InfraTec infrared LLC, Los Angeles, CA, USA), whose temperature measuring range is −40–1200 °C and sensitivity is 0.025 K at 30 °C, was used to monitor the temperature in the irradiated spot on the specimen, as shown in Figure 1c. The framerate is 480 Hz.
A digital optical microscope (VHX-1000, Keyence Corporation, Osaka, Japan) was used to observe the bonding condition of brazed diamonds.

3. Simulation Model

3.1. Diamond Brazing by Pulsed Laser Spot Heating

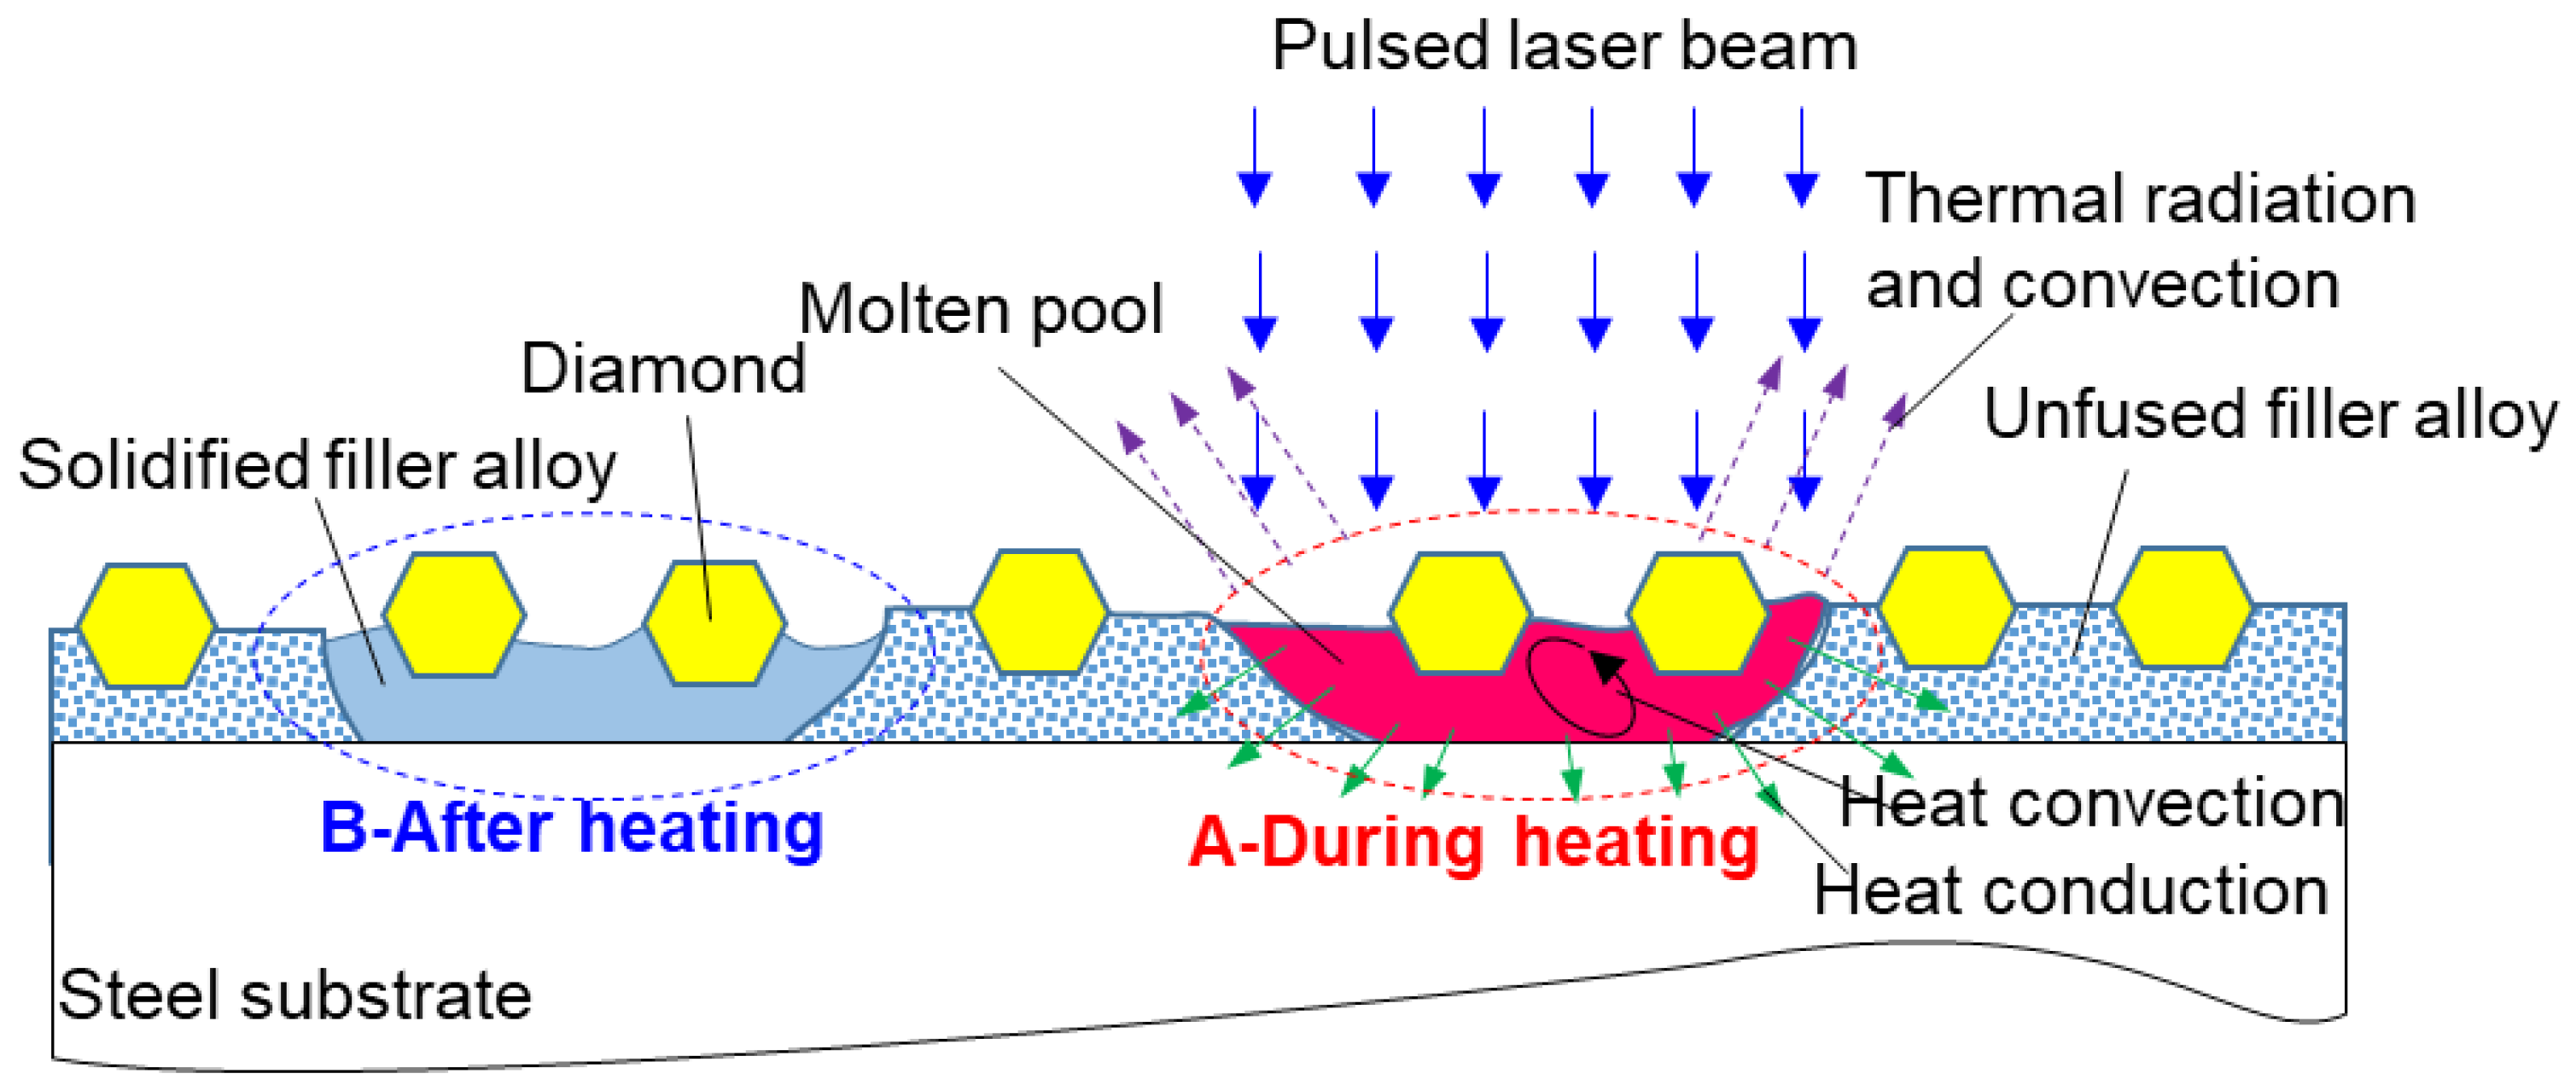
The schematic of diamond brazing onto 1045 steel substrate by pulsed laser spot heating is illustrated in Figure 2, in which Circle A denotes the laser heating and Circle B the cooling stage. Owing to the high light transparency of diamond, the laser beam can be considered to directly irradiate the filler alloy layer [18]. Thus, the laser energy is absorbed and transformed into heat, fast increasing the filler alloy temperature, which is commonly called the brazing temperature. Because of the high temperature, the filler alloy melts and forms a molten pool, in which an active carbide interface forms at the diamond/filler alloy interface, bonding the diamond onto the substrate. Once the laser heating stops or moves away, the brazing zone cools and the diamonds are firmly bonded on the substrate (Circle B).
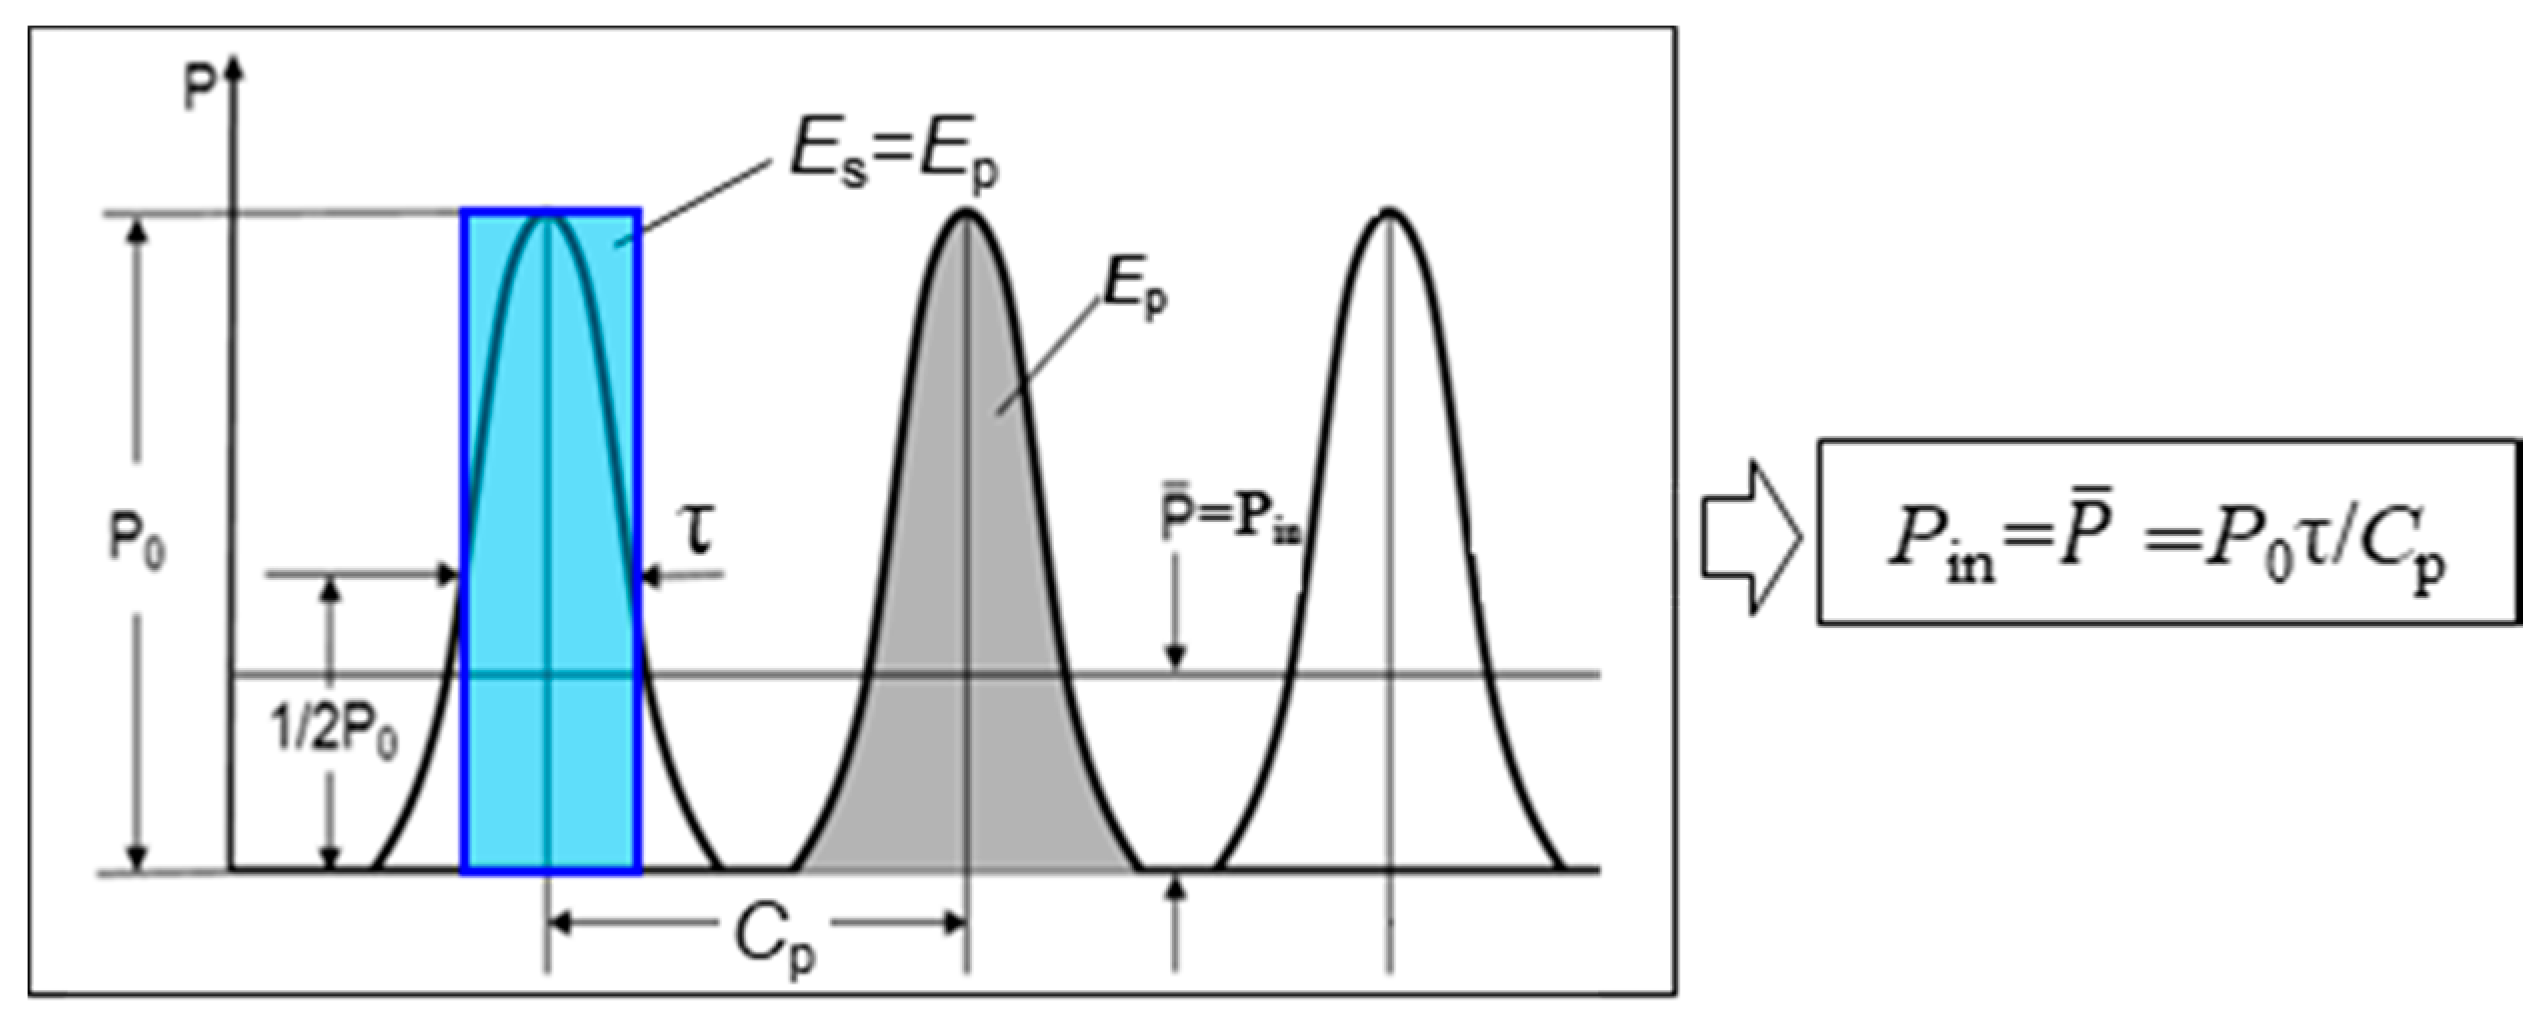
Compared with continuous laser heating, pulsed laser heating is more complex. Figure 3 shows the output power waveform of the laser beam during pulsed laser heating. Obviously, the laser output waveform has frequency f and the pulse duration Cp = 1/f. The key parameters of a pulse heat are the pulse power P0 and the pulse width τ, and both control the energy of the pulse heat Ep by Ep = τP0. The active heating time ratio eh is the ratio of heating time to the pulse duration, which is eh = τ/Cp or eh = τf. As seen from the above complexity of pulsed laser heating, the laser generator input power Pin is commonly used to represent the average power P ¯ by P in = P ¯ = P 0 τ C p = P 0 τ f .

3.2. Finite Element (FE) Model

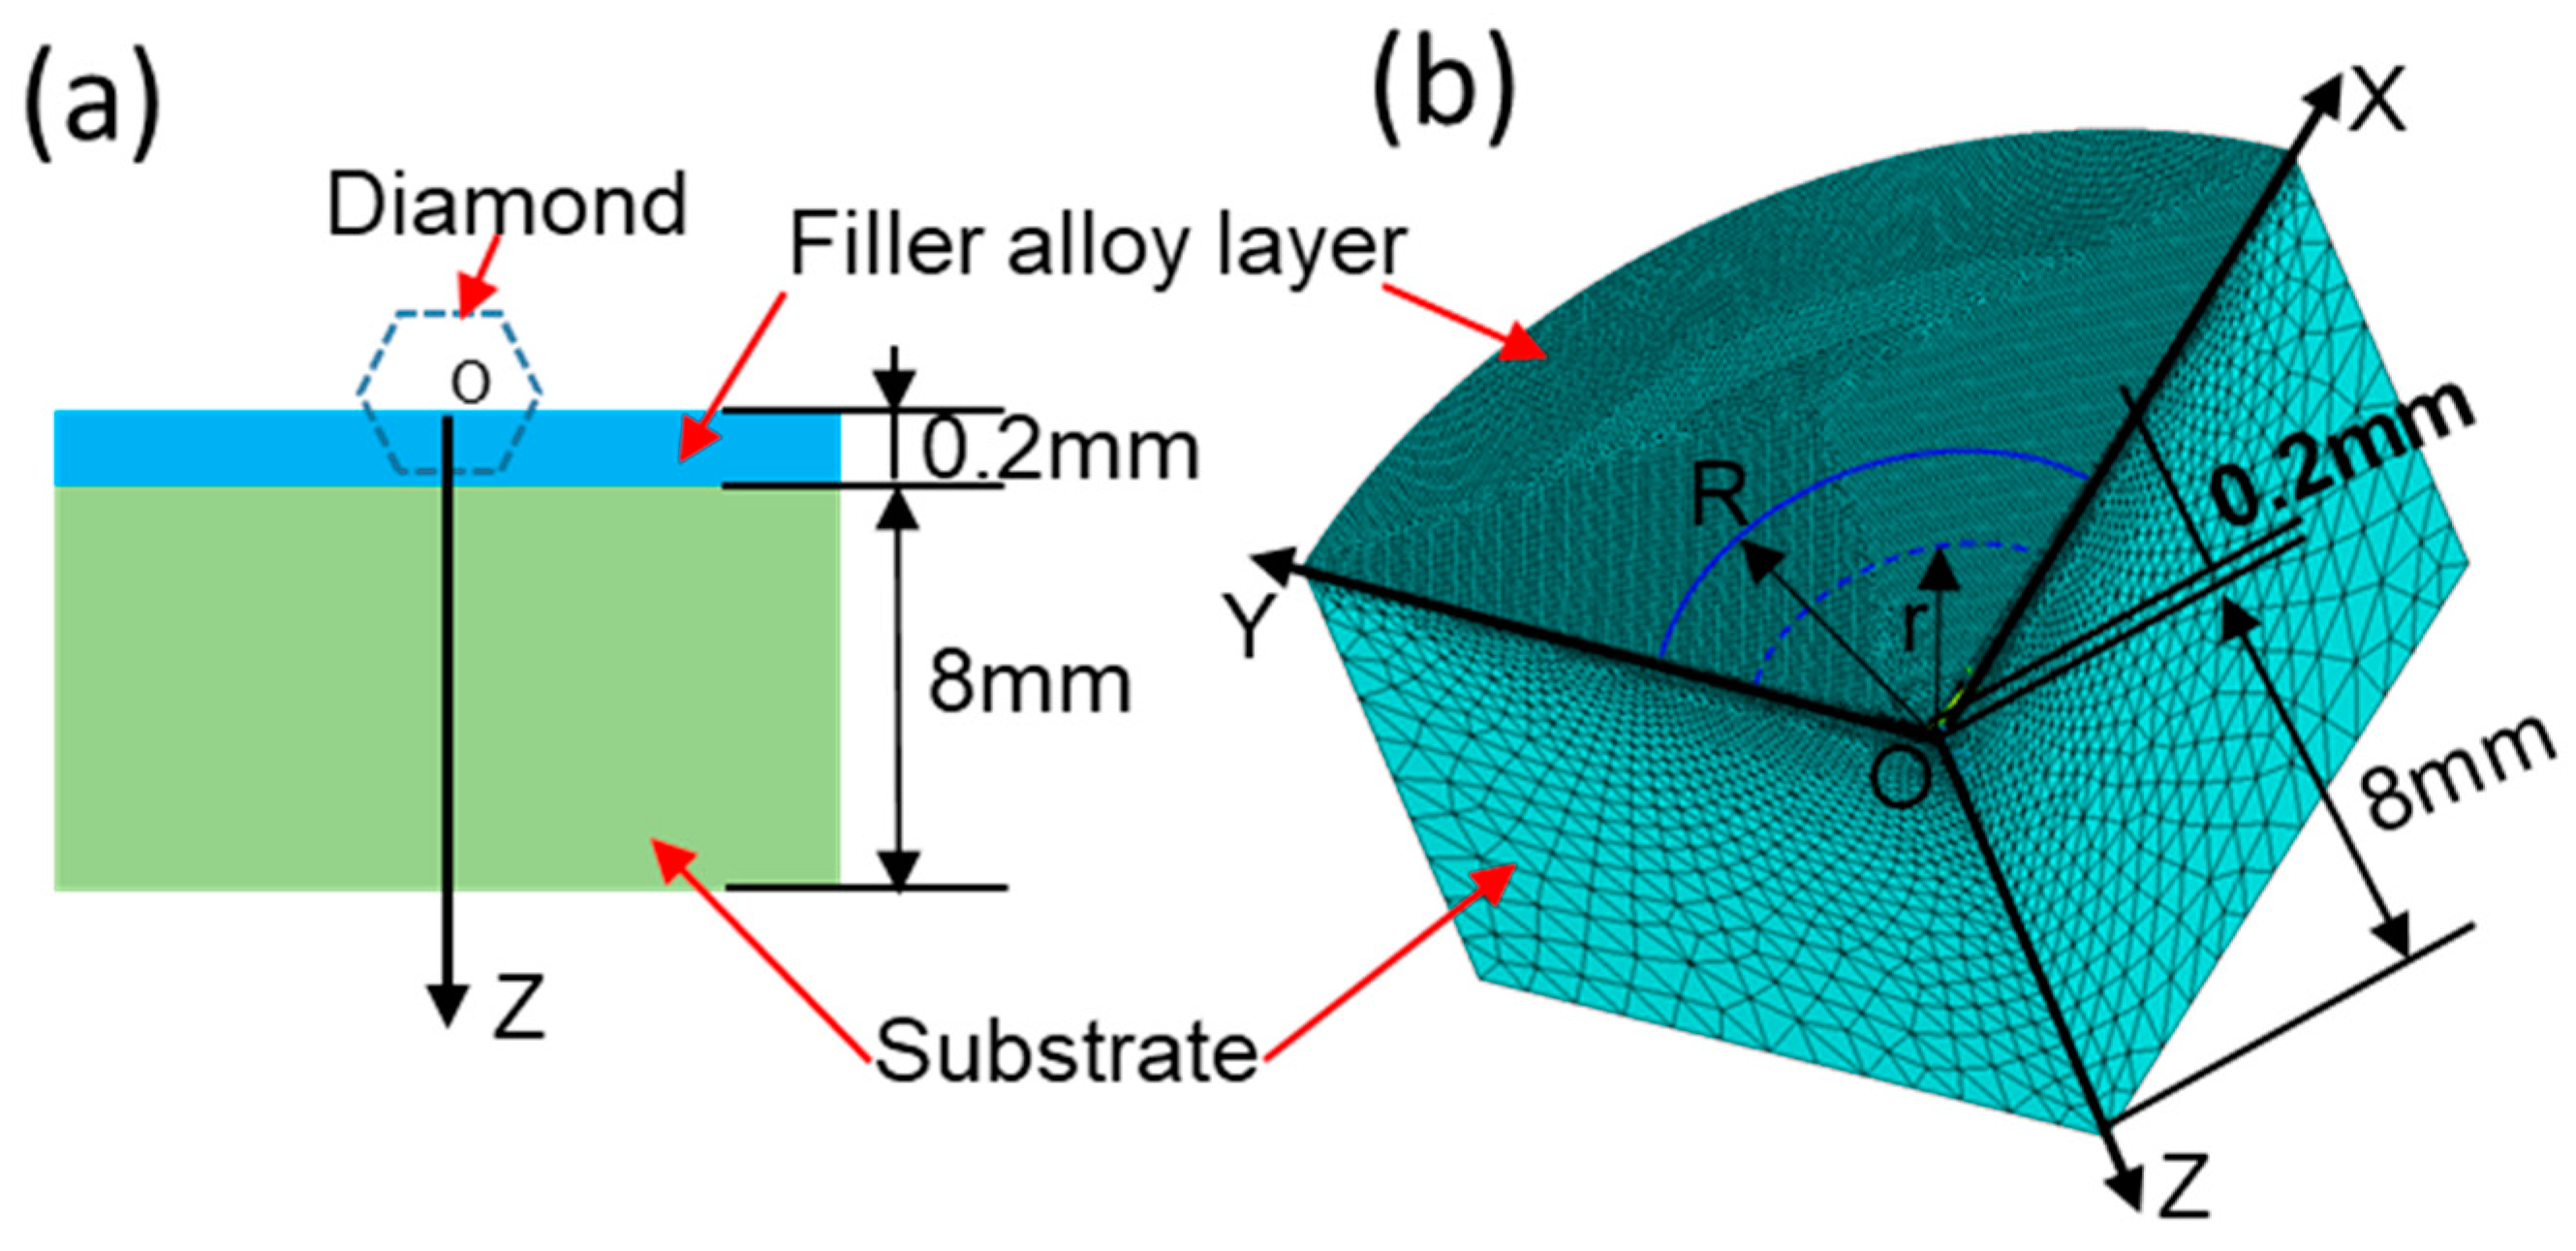
The brazing zone basically consists of diamond grain, filler alloy and steel substrate. Owing to the excellent light transparency and heat conductivity of diamond, the effect of diamond grain on the brazing zone can be neglected [18]. Hence, the laser brazing diamond model is simplified to a filler alloy layer and a substrate, as shown in Figure 4a. To simplify the computations, one-fourth of the 3D finite-element model is built by the ANSYS software and is shown in Figure 4b. In the model, the substrate is a 1045 steel cylinder with diameter of 20 mm and thickness of 8 mm. The filler alloy is Ni–Cr alloy with thickness of 0.2 mm. The SOLID 70 element was used in the meshing. The mesh size of the filler layer was set at 0.1 µm; however, for the substrate, graded meshing was used to improve the computation speed.
As shown in Figure 4, a cylindrical coordinates system was used. The z-axis is the symmetry axis and its positive direction is from the filler alloy to the substrate. The zero point is set at the top surface of the filler alloy. The central point of the irradiation spot is O. The radius of laser beam irradiation spot is R. In this work, R is set to 0.75 mm. The radius r is the distance to the O. The materials used are considered homogeneous and isotropic. The size of the diamond grains is much smaller than that of the filler layer; thus, the effect of diamond grains on the temperature field is neglected.
The thermal interaction during laser brazing can be simulated based on heat conduction theory and is described by the three-dimensional heat transfer equation [19,20,21]:
ρ ( T ) C ( T ) T t ( k ( T ) T ) = S ,
where T, t, ρ, C and k denote the temperature, heating time, mass density, specific heat and thermal conductivity respectively. S is the heat generation rate.
The initial time is set at zero and the initial condition is:
T | t = 0 = T ( r , z , t ) = T 0 .
The boundary conditions are given below. During brazing, the workpiece exchanges heat with the medium around it via convection and radiation owing to the large difference in the temperature between the boundaries and the surrounding air. Owing to the different calculation methods for thermal radiation and thermal convection, the radiant heat exchange and convection from the contact between the object and the air having different temperatures are both considered using the total heat transfer coefficient η. Thus, the total loss of heat transfer on the surface qs is [19]:
q s = η ( T T s ) | z = 0 ,
where Ts is the ambient temperature.
In the calculations, the convective heat transfers and heat radiation at the surface of the brazed filler metal are expressed via η, the nitrogen gas is continuously fed and Ts is set equal to T0.
Pulse laser heating was simplified as series based on the heat squared. However, owing to the optics focusing system, the laser energy on the heated spot is not uniformly distributed and could be oblong, circular, elliptical, or more often, Gaussian [22]. Based on the characteristics of the equipment used in this study, the laser energy distribution is described by Gaussian. Thus, the absorbed heat flux distribution on the laser irradiation spot (ql) at the top surface of filler alloy (z = 0) is [23]:
q l ( r ) = 3 π R 2 α P 0 · exp ( 3 r 2 R 2 )
where r is the radial distance from the heating spot center point O, R is the laser heating spot radius and α is the absorption coefficient of the laser energy, which is obtained by calibration in this study.
During pulsed laser heating, the top surface of the filler alloy is periodically heated. Therefore, the laser heat source resembles series of heat pulses. In other words, pulsed laser heating can be modelled by the cyclic loading of a single heat pulse. Therefore, a Do loop for the pulsed laser heating was programmed by using the ANSYS parametric design language (APDL) language and integrated with the FE model.

3.3. Calibration and Validation

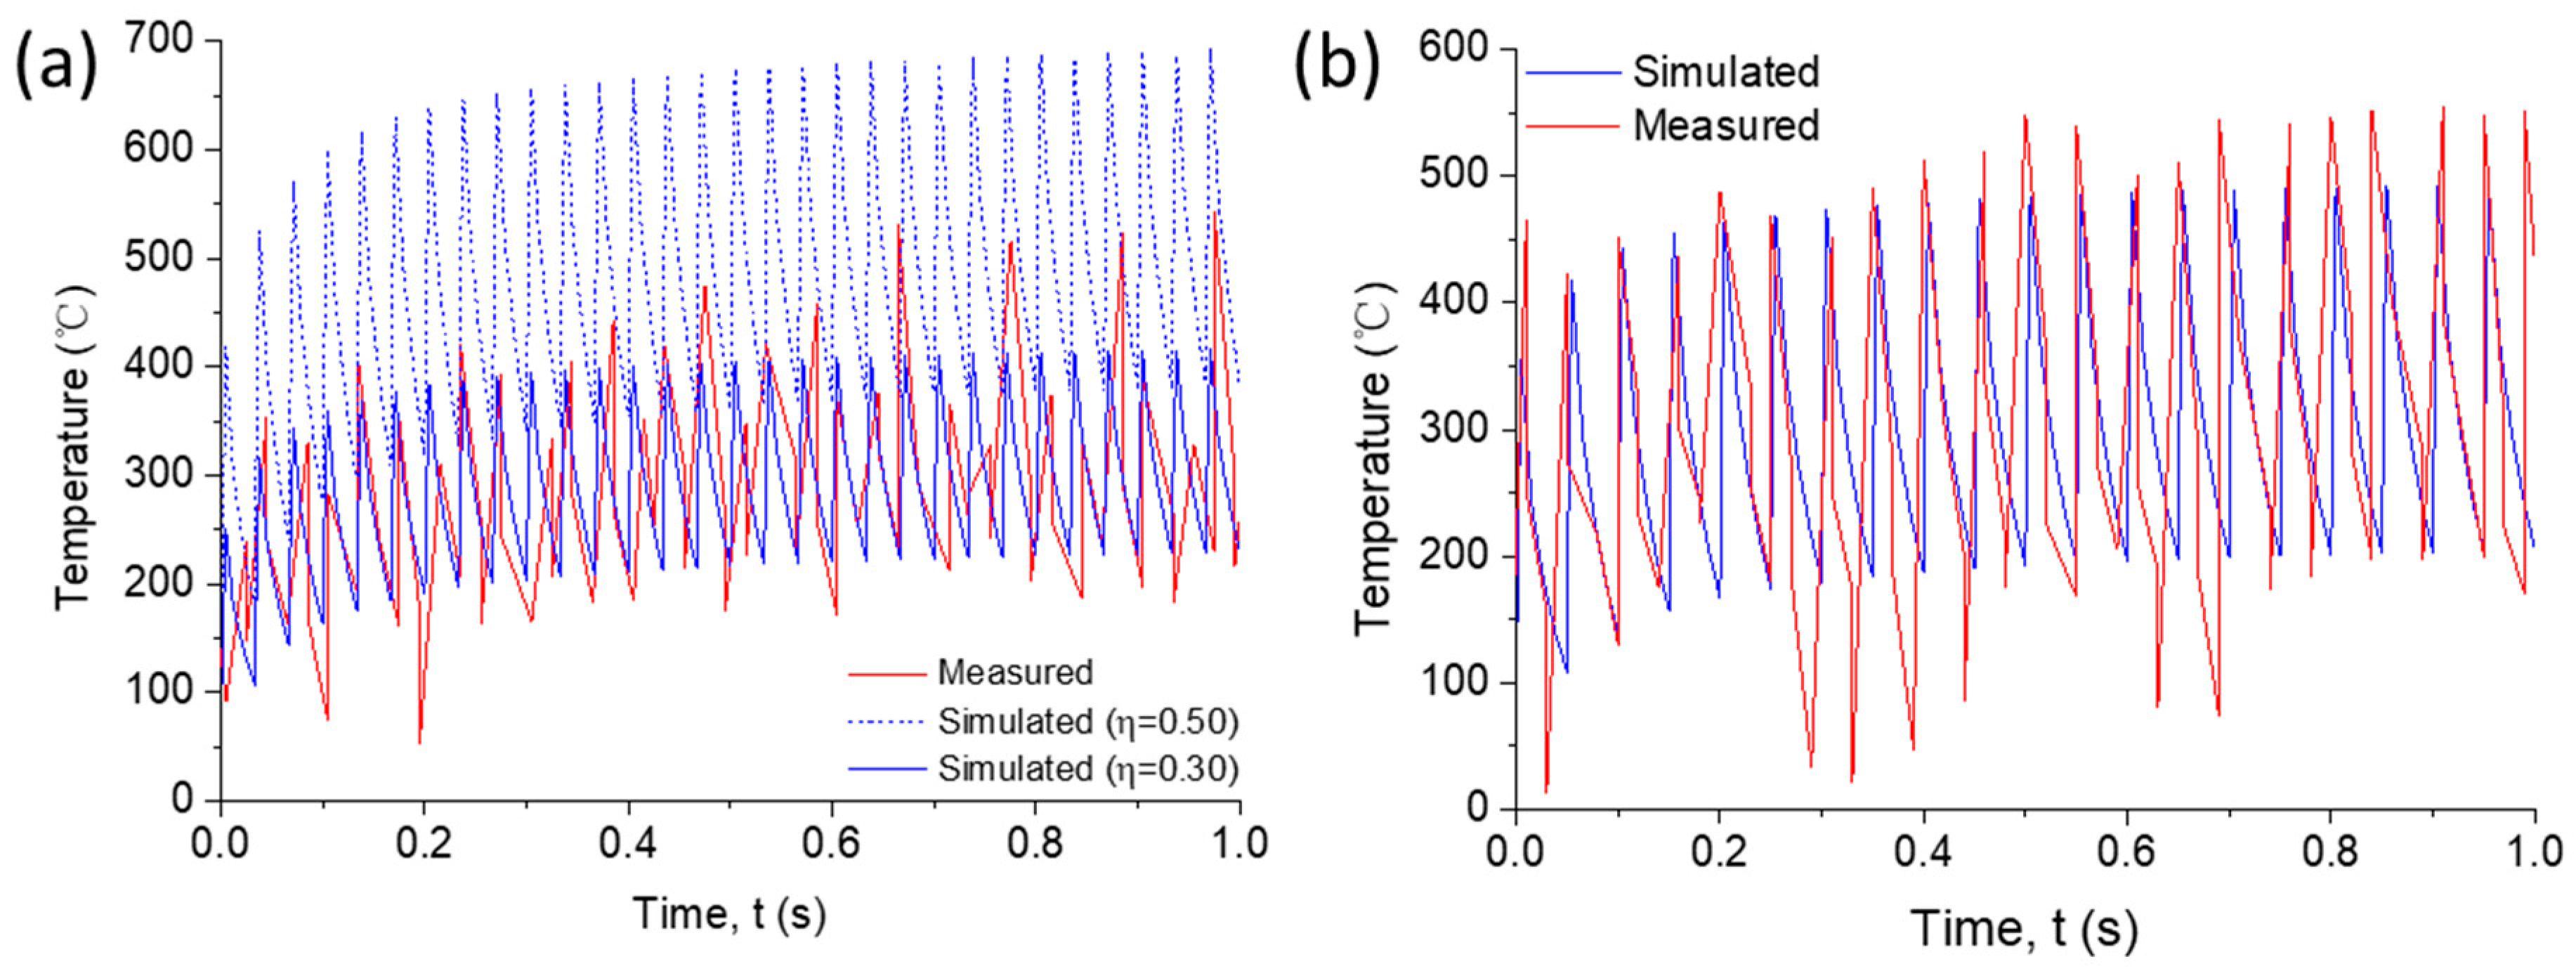
For calibrating the absorption coefficient α shown in Equation (4), the laser heating parameter combination of P0 = 570 W, f = 30 Hz and τ = 3 ms was used. Thermal conductivity and specific heat of AISI 1045 steel and filler alloy are set according to the data in [18,22].
First, the laser brazing experiment was conducted and its brazing temperature was measured. Then, the simulation was carried out with α initially set as 0.5. Finally, by adjusting α to make the simulation match with the experimental result, the absorptivity was calibrated as 0.30, which is within the range shown in [24]. The three temperature curves are compared in Figure 5a.
Further, the laser heating parameter combination of P0 = 380 W, f = 20 Hz and τ = 3 ms was conducted for validation, whose results are also compared in Figure 5b. The rise and fall of the measured temperature and simulated temperature are in close agreement. Although there are some variations between the simulation and the measured temperatures, which are likely because of the boundary conditions in the simulation and the limitations of the infrared thermal imaging temperature measurement, the compared results in Figure 5 can support that the established FE simulation model can be used to characterize the temperature changes during brazing.

4. Results and Discussion

4.1. The Characteristics of Brazing Temperature Heated by the Pulsed Laser

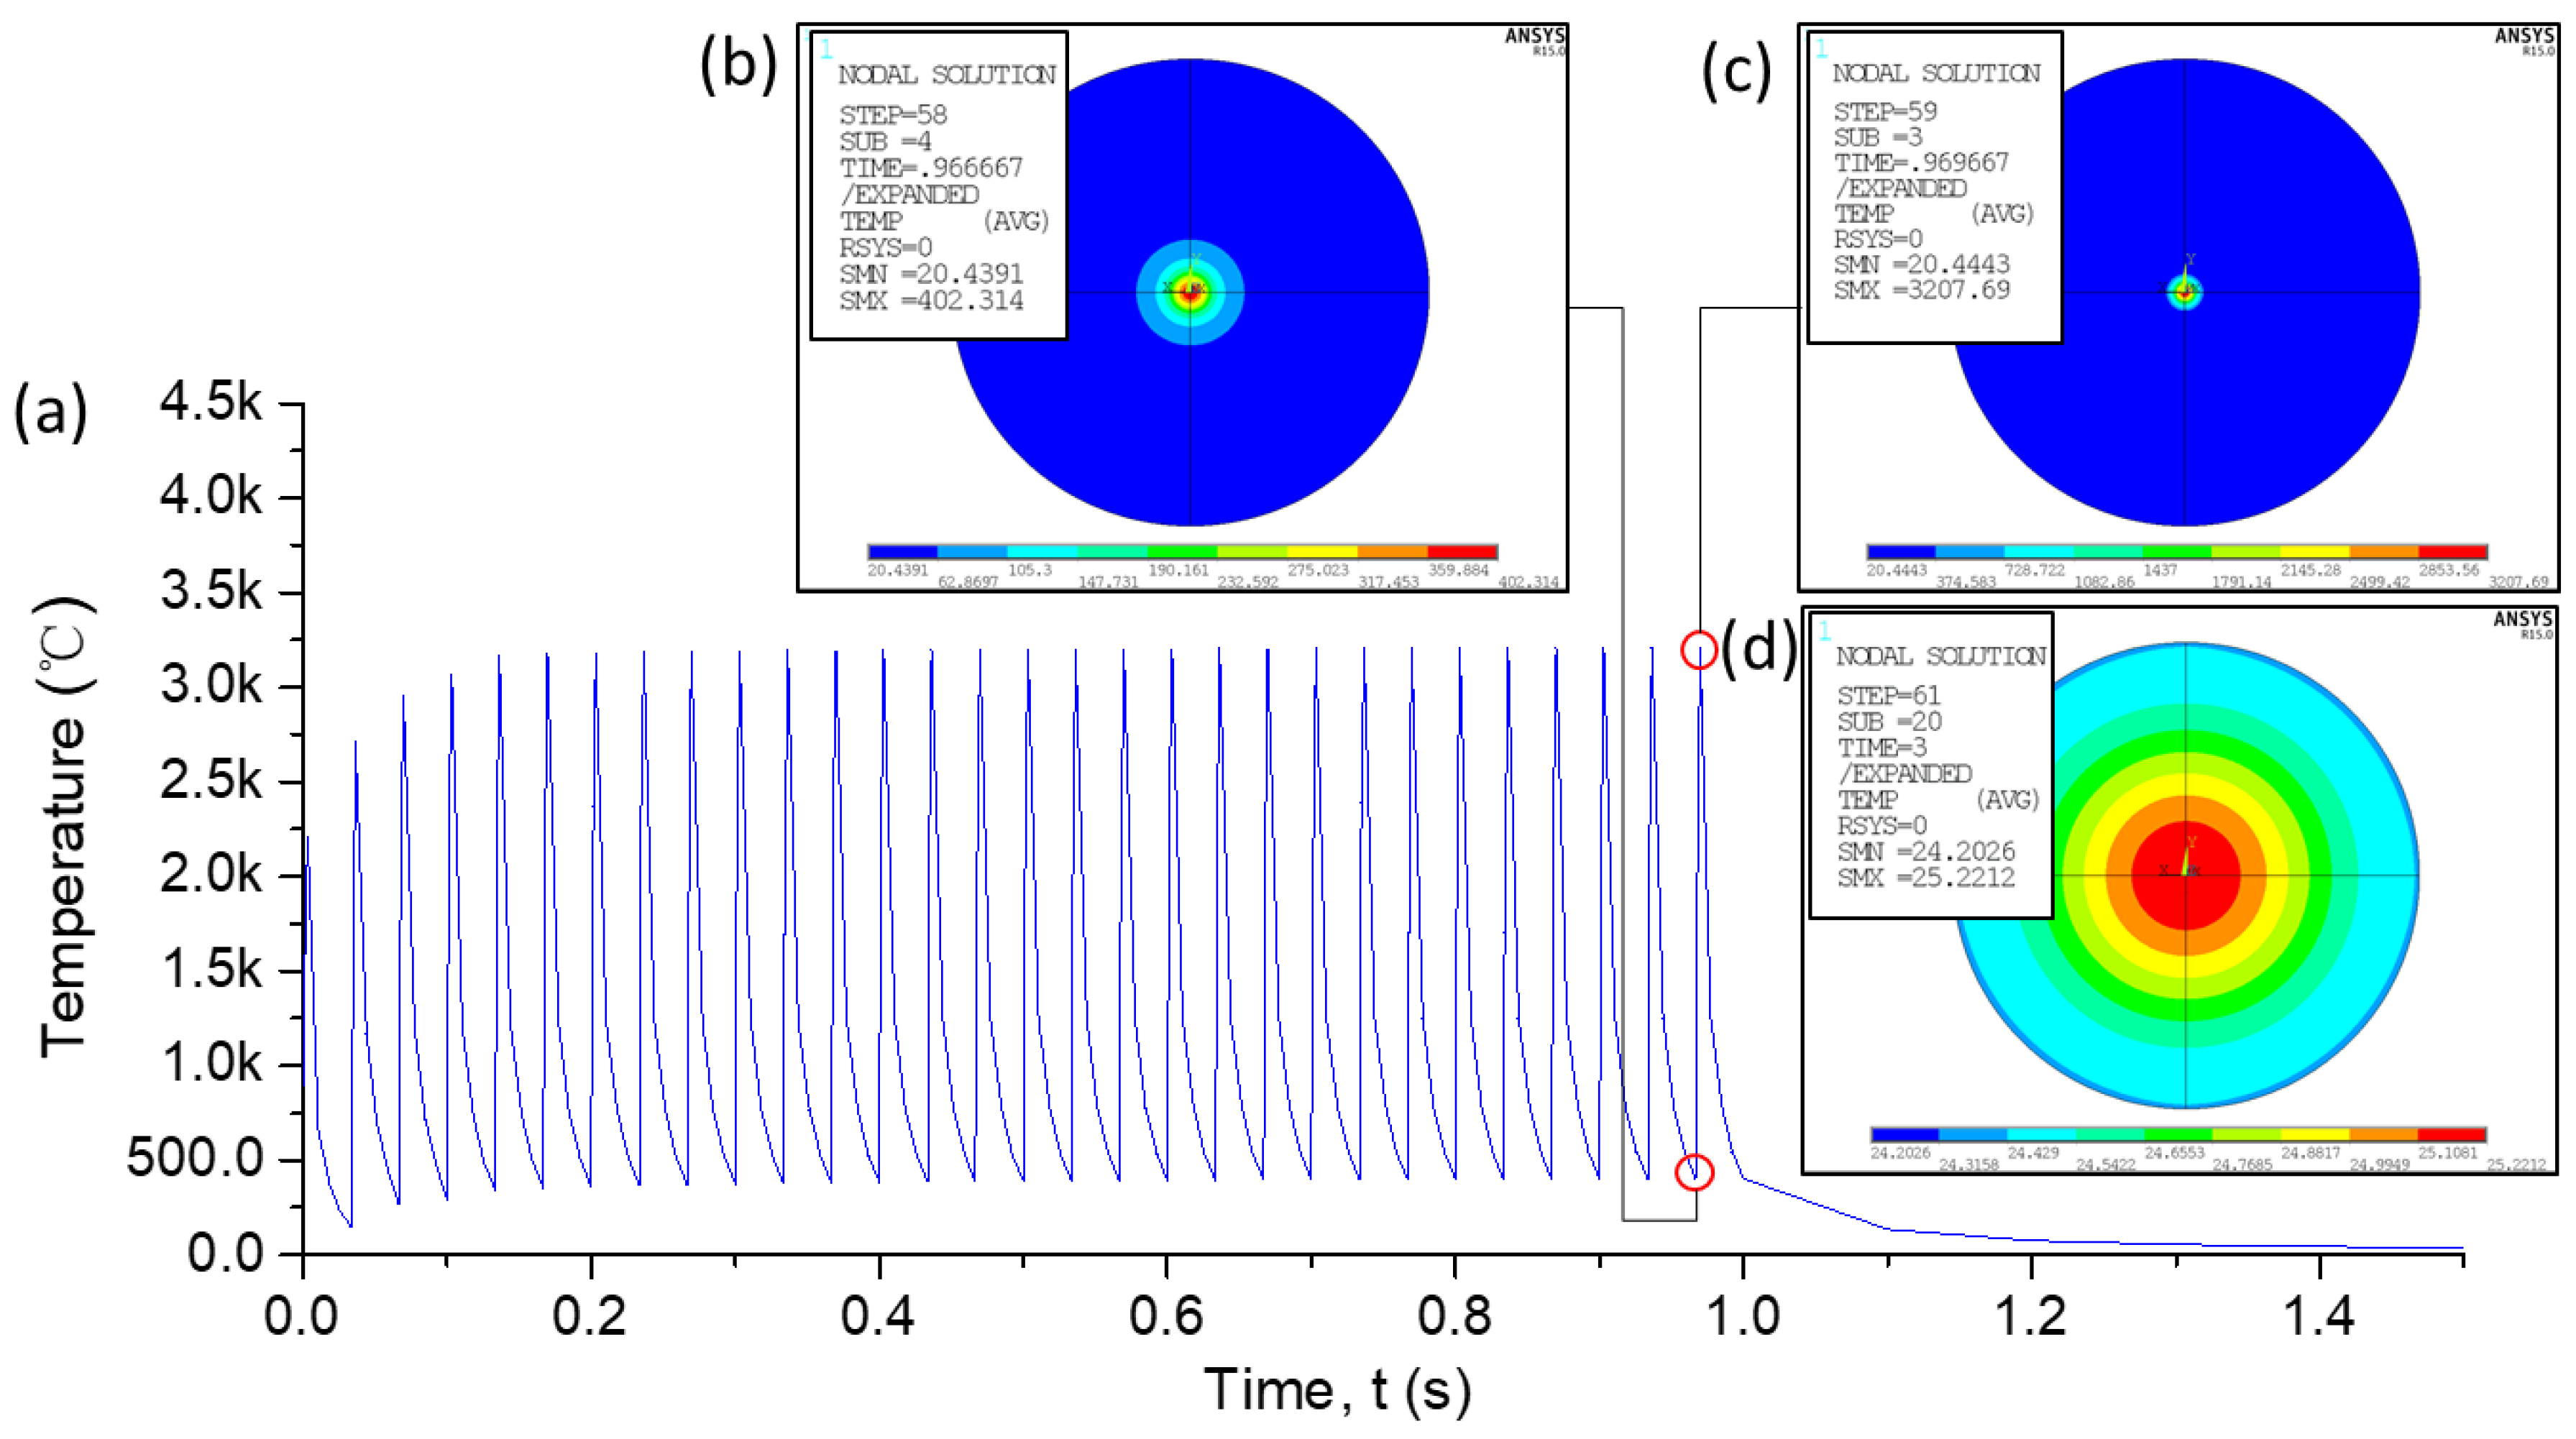
Figure 6 is the temperature results simulated under the heating parameter combination of P0 = 1710 W (Pin = 153 W), f = 30 Hz, τ = 3 ms and t = 3 s. Figure 6a shows the temperature of the laser heating central point on the surface of the filler alloy. When heat flux is periodically applied to the filler alloy, the temperature rapidly increases following the periodic fluctuation mode that coincides with the rhythm of the pulsed heat source, which is similar to the simulated temperature curve shown in [25,26]. Figure 6b–d show three temperature distribution simulations on the top surface of the filler alloy. The maxima temperature at t = 0.966667 s is 402.85 °C and t = 0.969667 s is 3207.69 °C, revealing the brazing temperature greatly fluctuating even in the stable stage. When the laser heating stops, the temperature rapidly decrease. At t = 3 s, the maxima temperature on the filler alloy is 25.22 °C, which is close to the initial temperature.

4.2. Influence of Laser Heating Parameters on Temperature

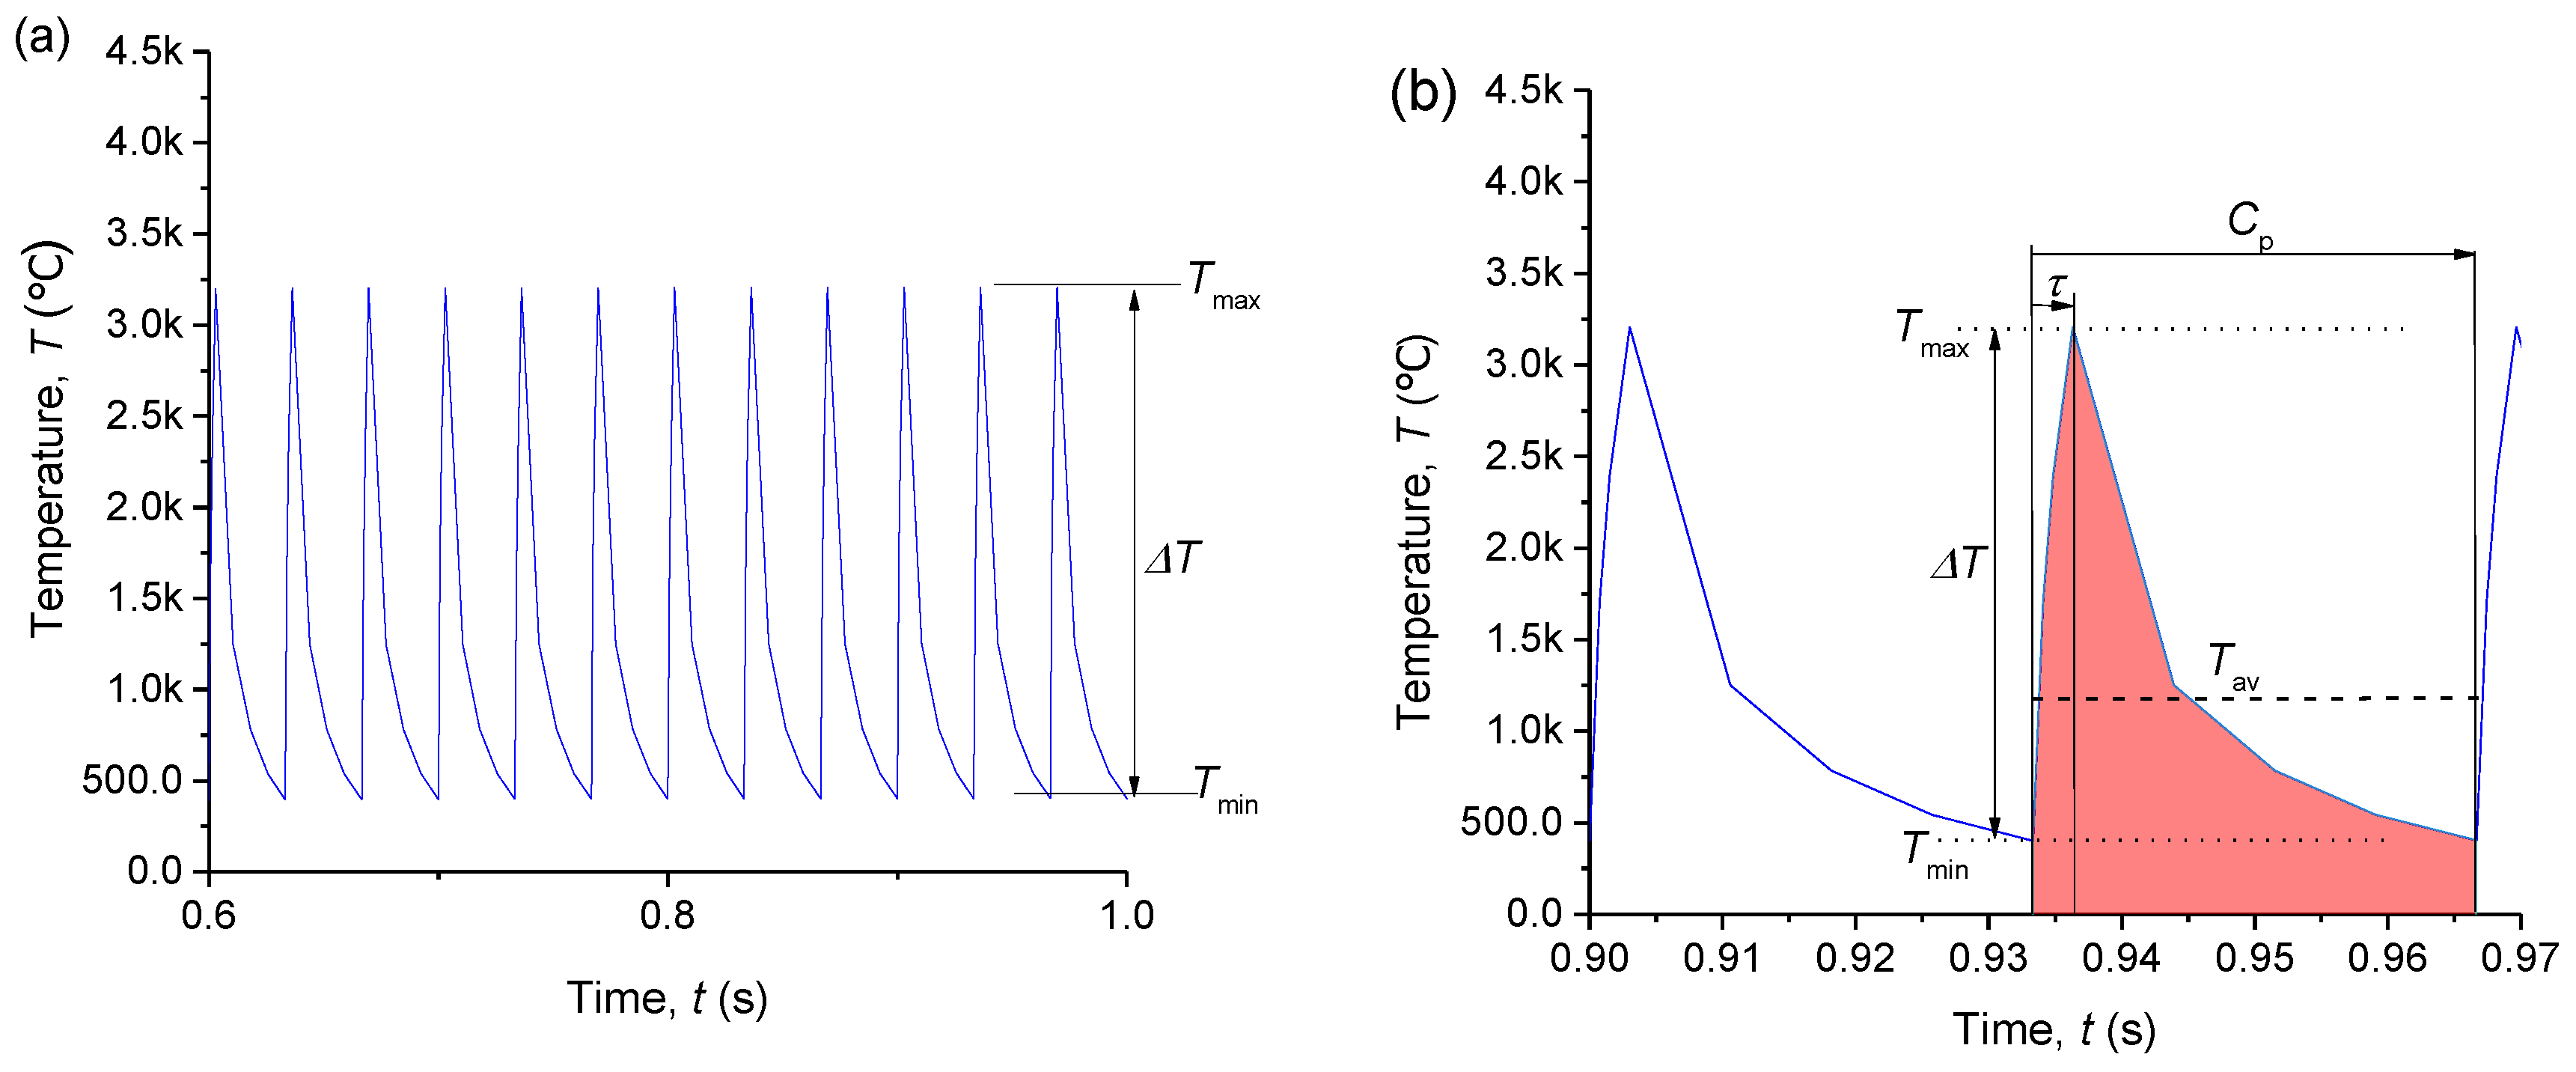
Figure 7a shows the details of a temperature curve segment taken from the stable heating state in Figure 6. Figure 7b shows the temperature versus the duration of the heat pulse. From 0 to τ, the temperature rapidly reaches maximum (Tmax) and, when the heat decreases from τ to Cp, the temperature quickly decreases to the minimum (Tmin) owing to heat conduction and thermal convection. Based on the temperature curve segment from the stable heating state, the magnitude of the temperature fluctuation is ΔT = TmaxTmin and the average temperature Tav is T av = C p 0 T · d T / C p . In engineering applications, Tmax, Tmin, ΔT and Tav are used to control the quality of brazing. High Tmax can lead to graphitization and cracking of diamonds during laser heating, high ΔT is responsible for high residual stresses in the brazed joints and thus cracking in the diamond and filler alloy layer, low Tmin will not melt the filler alloy and Tav should be within the active brazing temperature zone because it generally reflects the fusion degree of filler alloy and the bonding reactions at the interface [27,28,29].
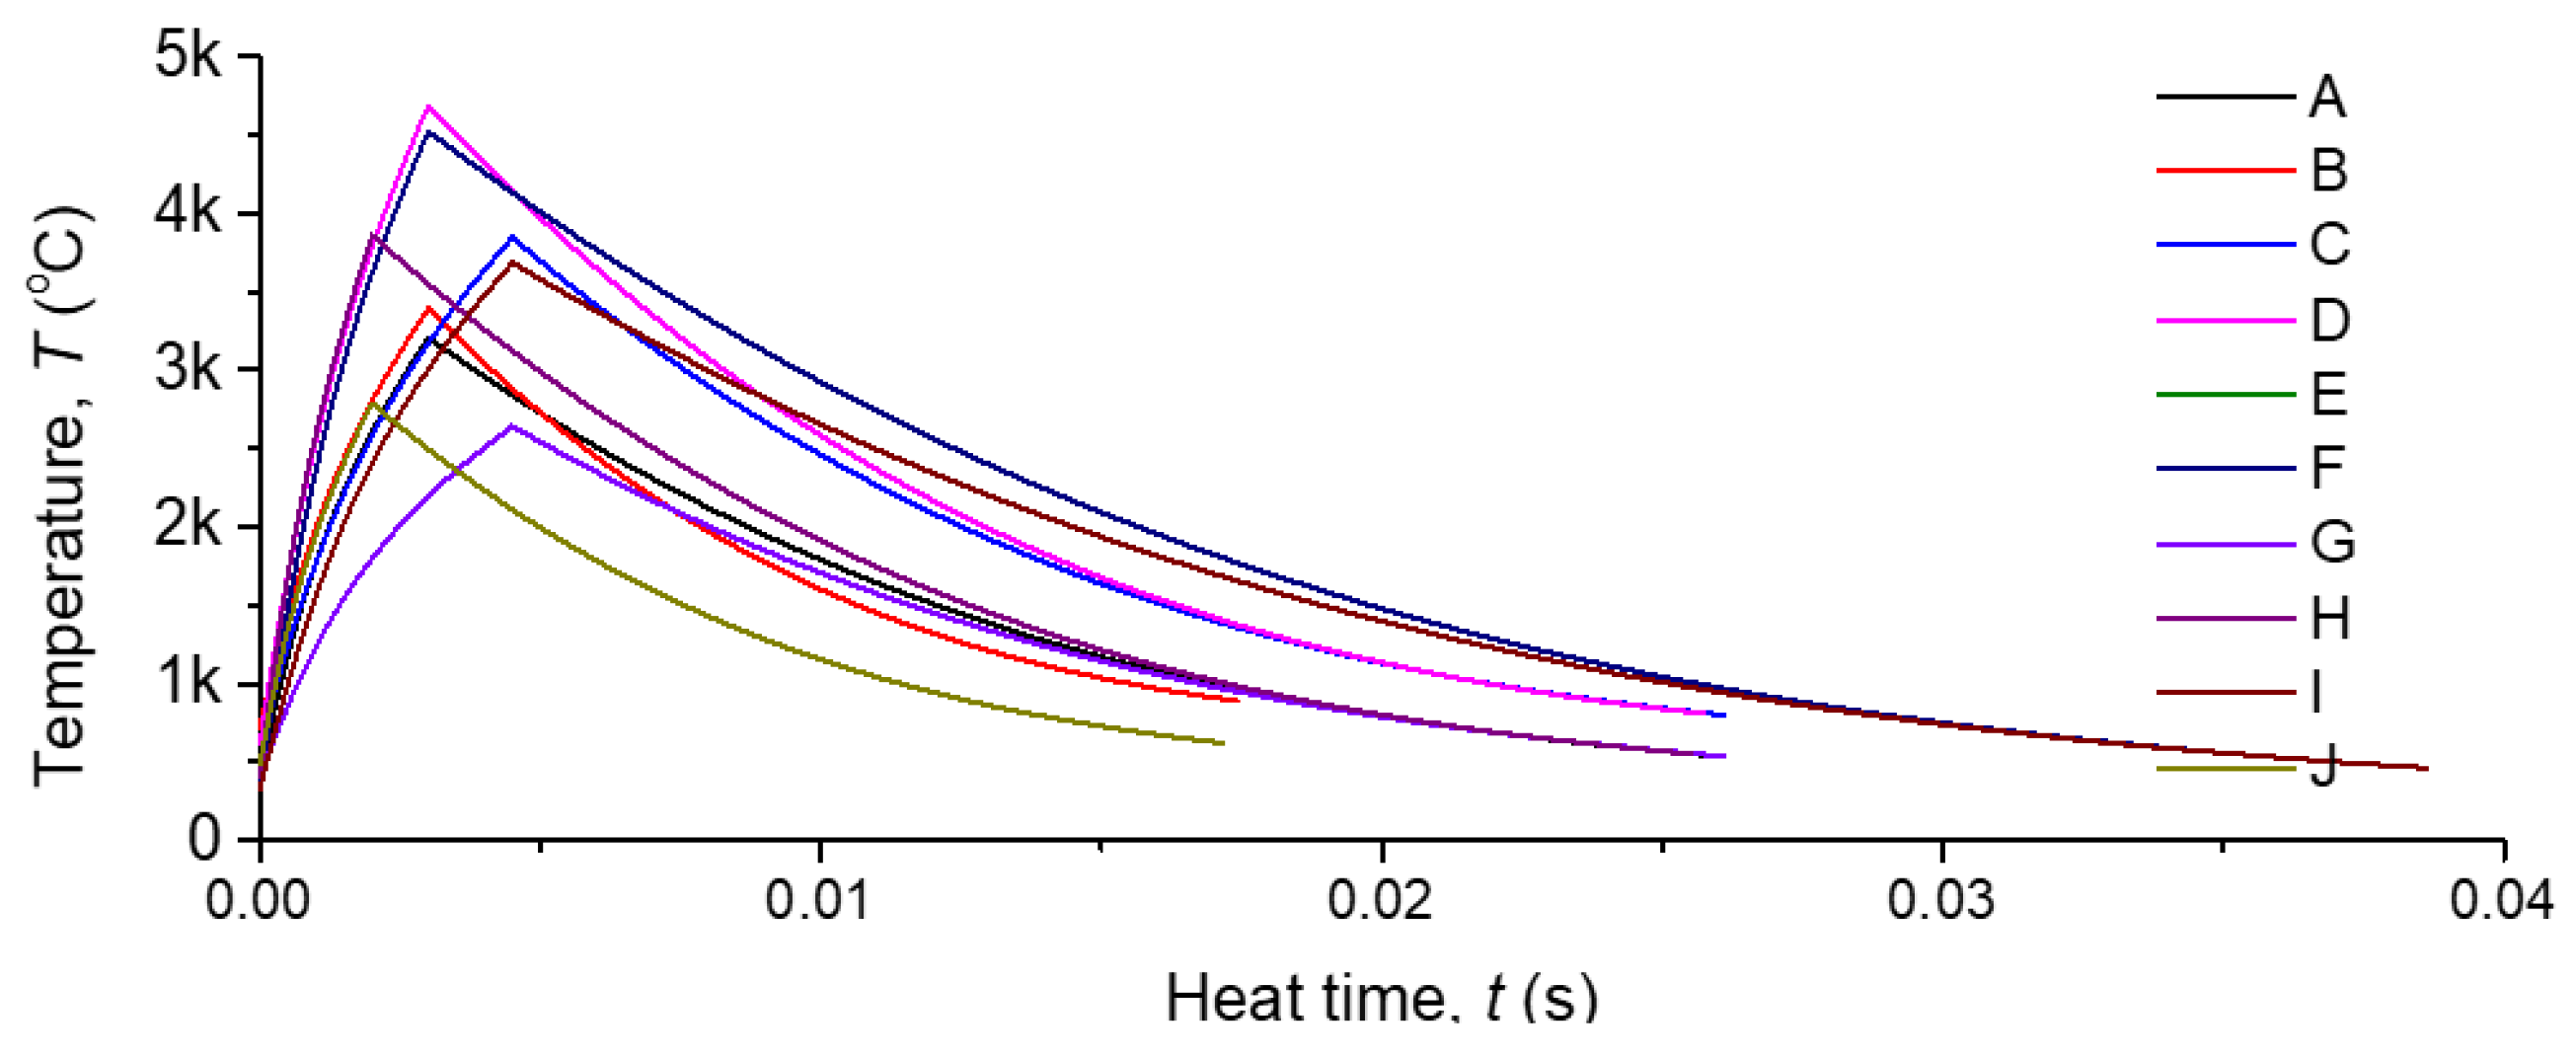
To assess the effect of laser heating parameters on the above four key indices, ten combinations of heating parameters were simulated and summarized in Table 1. In addition, all the simulated temperature results induced by a pulse duration are plotted and compared in Figure 8. The real micrographs of diamonds brazed by the Case D, G and E heating parameter combinations are shown in Figure 9. Because the Tav is higher than 1030 °C, the filler alloy fully melted, and the diamonds were bonded during brazing. However, the diamond brazed in the D case cracked owing to the too high Tmax. In the G case, the diamonds were not well bonded owing to the inadequate melting of the filler alloy because of the too low Tmin. In the E case, the diamonds are well surrounded and bonded by the filler alloy forming a hill-like shape, similar to the results in [10].
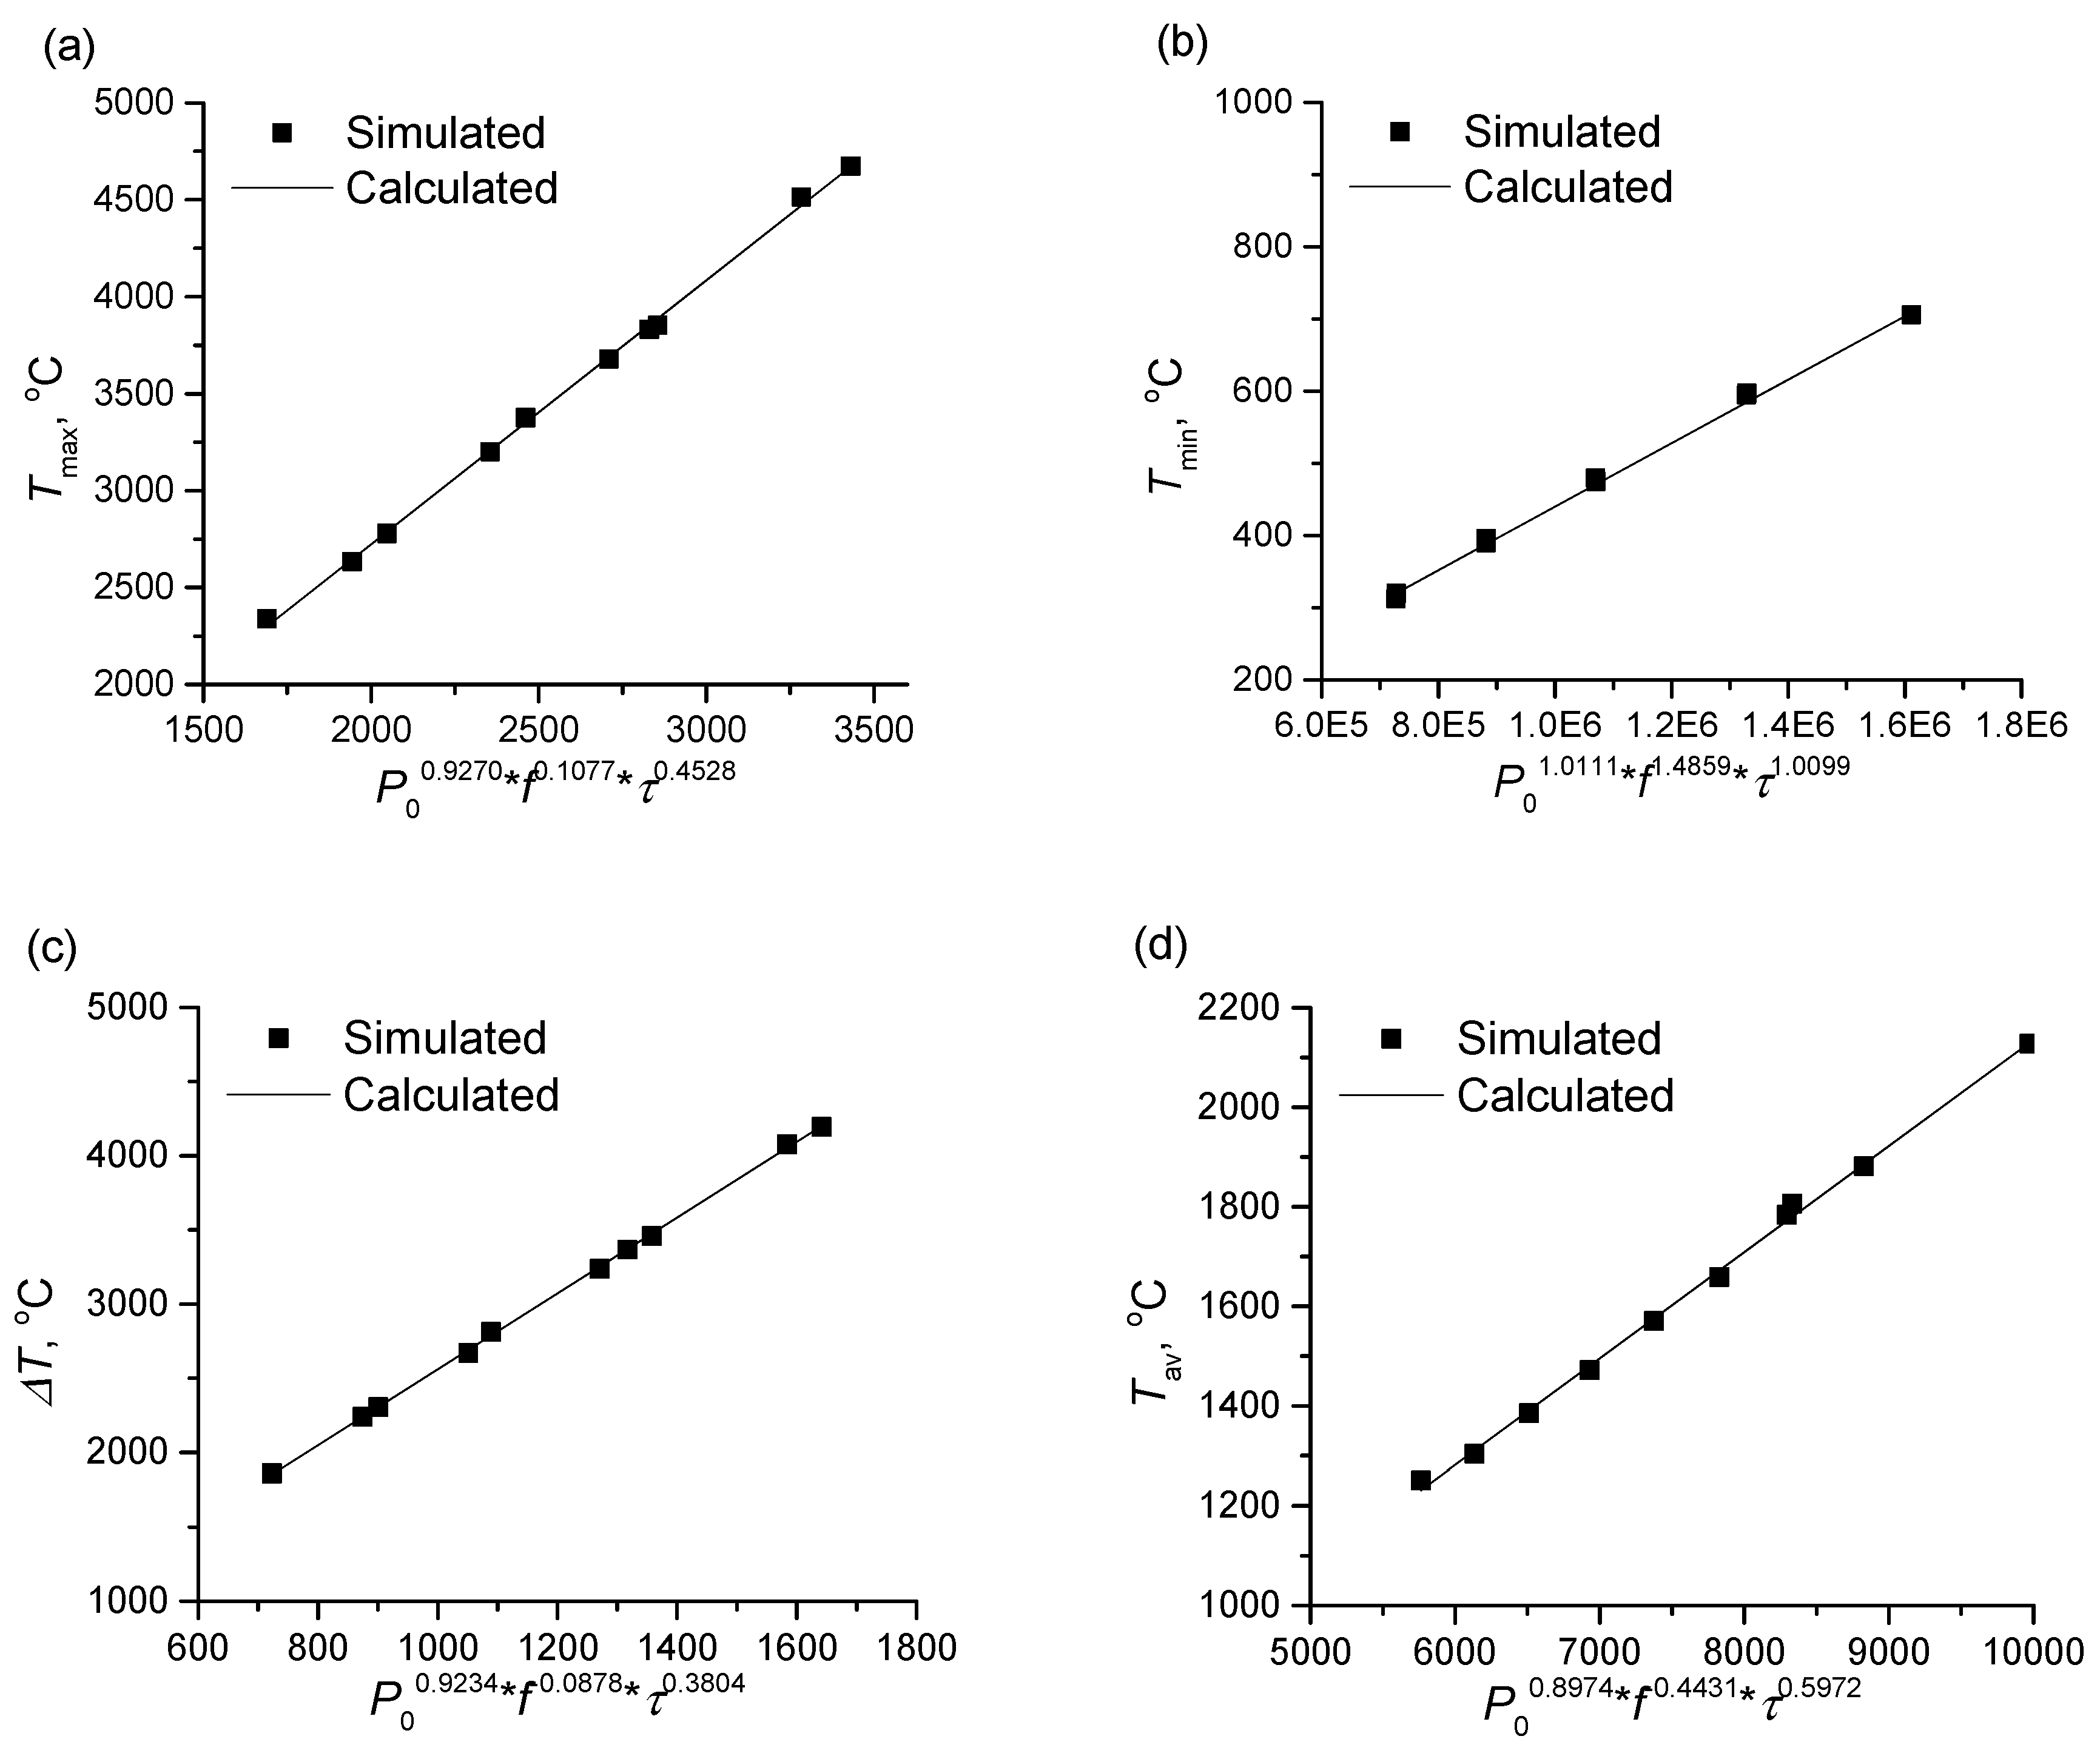
Based on the data listed in Table 1, the effect of the laser heating parameters on the four indices are quantified by exponential empirical formula and the results are obtained as the following equations, in which R2 is the coefficient of determination:
T max = 1.3615 P 0 0.9270 f 0.1077 τ 0.4528 ,   ( R 2 = 0.9988 )
T min = 0.00044 P 0 1.0111 f 1.4859 τ 1.0099 ,   ( R 2 = 0.9997 )
Δ T = 2.5598 P 0 0.9234 f 0.0878 τ 0.3804 ,   ( R 2 = 0.9996 )
T av = 0.2136 P 0 0.8974 f 0.4431 τ 0.5972 ,   ( R 2 = 0.9977 )
The simulated results listed in Table 1 and the calculated results by the Equations (5)–(8) are compared in Figure 10.
As shown in Figure 2, the pulse heat energy (Ep) is a function of the pulse power and the pulse width, i.e., E p = P 0 · τ . Thus, the increase in pulse power and pulse width will directly increase the absorbed energy during pulse heating, directly resulting in increasing Tmin, Tmax, Tav and ΔT. This is also supported by the positive exponential coefficients of the two factors in Equations (5)–(8). From Figure 2, it is also clear that the active heating time ratio eh increases when the pulse frequency increases. Therefore, with increasing pulse frequency, Tmin, Tmax and Tav increase, whereas ΔT decreases owing to the shortening of the cooling stage in the pulse duration. Based on Equations (5)–(8), it can be concluded that the dominant factor for Tmax, Tav and ΔT is the pulse power, but for Tmin is the pulse frequency. Meanwhile, the secondary effect factor for Tmax, Tav and ΔT is the pulse width and for Tmin is the pulse power. Therefore, in laser brazing, to reduce graphitization and cracking caused by high temperatures, the pulse power and pulse width should be reduced, whereas the pulse frequency should be increased. To reduce cracking of the brazing layer caused by rapid heating and cooling, low temperature fluctuations are suggested and this can be achieved by increasing the frequency. During brazing, the pulse temperature should be maintained within a certain range and the temperature fluctuation should be kept at minimum. In practice, the recommended order of designing and adjusting the heating parameters is pulse power, frequency and then width, and the aim is to control the brazing temperature to meet the requirement of the active brazing temperature zone presented in [29]. In addition, the pulse heat power can be converted to the laser generator’s input power P in by the relation shown in Figure 3.

5. Conclusions

The simulations of pulsed laser brazing of diamond grains onto a 1045 steel substrate with Ni-Cr filler alloy are achieved by finite element (FE) modelling. The simulated results are verified by experiments. During pulsed laser heating, the temperature varies periodically because of the heat pulses. The primary factor affecting Tmax, ΔT and Tav is the pulse power and for Tmin is the pulse frequency. The secondary effect factor for Tmax, Tav and ΔT is the pulse width and for Tmin is the pulse power. In practice, the recommended order for designing and adjusting the heating parameters is pulse power, pulse frequency and then pulse width.

Author Contributions

Experimental validation, data collection and analysis, and original draft, Y.W.; conceptualization, methodology, review and editing, and project administration, G.H.; simulation, data collection and analysis, Y.S.; data collection and analysis, M.Z.; data interpretation, review and editing, and recourses, Z.T.; data interpretation, review and editing, and project administration, C.C.

Funding

This research work was funded by the National Natural Science Foundation of China (Grant No. 51575198, U1805251) and the Project for Postgraduates’ Innovative Fund in Scientific Research of Huaqiao University (Grant No. 17014080016).

Conflicts of Interest

The authors declare no conflict of interest.

References

  1. Chattopadhyay, A.K.; Chollet, L.; Hintermann, H.E. Experimental investigation on induction brazing of diamond with Ni-Cr hardfacing alloy under argon atmosphere. J. Mater. Sci. 1991, 26, 5093–5100. [Google Scholar] [CrossRef]
  2. Long, F.; He, P.; Sekulic, D. Research and Development of Powder Brazing Filler Metals for Diamond Tools: A Review. Metals 2018, 8, 315. [Google Scholar] [CrossRef]
  3. Sung, J.C.; Sung, M. The brazing of diamond. Int. J. Refract. Met. Hard Mater. 2009, 27, 382–393. [Google Scholar] [CrossRef]
  4. Zhan, Y.J.; Xu, X.P. An experimental investigation of temperatures and energy partition in grinding of cemented carbide with a brazed diamond wheel. Int. J. Adv. Manuf. Technol. 2012, 61, 117–125. [Google Scholar] [CrossRef]
  5. Zhang, B.; Xu, H.J.; Fu, Y.C.; Su, H.H. Experiment Research on Grinding of Optical Glass with Indigenously Developed Monolayer Brazed Diamond Grinding Wheel. Adv. Mater. Res. 2010, 136, 279–283. [Google Scholar] [CrossRef]
  6. Chen, J.; Shen, J.; Huang, H.; Xu, X. Grinding characteristics in high speed grinding of engineering ceramics with brazed diamond wheels. J. Mater. Process. Technol. 2010, 210, 899–906. [Google Scholar] [CrossRef]
  7. Huang, G.; Yu, K.; Zhang, M.; Guo, H.; Xu, X. Grinding characteristics of aluminium alloy 4032 with a brazed diamond wheel. Int. J. Adv. Manuf. Technol. 2018, 95, 4573–4581. [Google Scholar] [CrossRef]
  8. Huang, G.; Xu, X. Sawing performance comparison of brazed and sintered diamond wires. Chin. J. Mech. Eng. 2013, 26, 393–399. [Google Scholar] [CrossRef]
  9. Huang, S.; Tsai, H.; Lin, S. Laser Brazing of Diamond Grits Using a Cu–15Ti–10Sn Brazing Alloy. Mater. Trans. 2002, 43, 2604–2608. [Google Scholar] [CrossRef]
  10. Yang, Z.; Zhang, M.; Zhang, Z.; Liu, A.; Yang, R.; Liu, S. A study on diamond grinding wheels with regular grain distribution using additive manufacturing (AM) technology. Mater. Des. 2016, 104, 292–297. [Google Scholar] [CrossRef]
  11. Yang, Z.; Zhang, Z.; Yang, R.Y.; Liu, A. Study on the grain damage characteristics of brazed diamond grinding wheel using a laser in face grinding. Int. J. Adv. Manuf. Technol. 2016, 87, 853–858. [Google Scholar] [CrossRef]
  12. Rommel, D.; Scherm, F.; Kuttner, C.; Glatzel, U. Laser cladding of diamond tools: Interfacial reactions of diamond and molten metal. Surf. Coat. Technol. 2016, 291, 62–69. [Google Scholar] [CrossRef]
  13. Yang, L.; Li, B.; Yao, J.; Li, Z. Effects of diamond size on the deposition characteristic and tribological behavior of diamond/Ni60 composite coating prepared by supersonic laser deposition. Diamond Relat. Mater. 2015, 58, 139–148. [Google Scholar] [CrossRef]
  14. Chen, Y.; Fu, Y.; Su, H.; Xu, J.; Xu, H. The effects of solder alloys on the morphologies and mechanical properties of brazed diamond grits. Int. J. Refract. Met. Hard Mater. 2014, 42, 23–29. [Google Scholar] [CrossRef]
  15. Yang, Z.; Liu, A.; Yang, R.; Zhang, Z.; Liu, S. Interface Microstructure and Formation Mechanism of Diamond Abrasives Laser Brazed with Ni-Cr Solder. Rare Met. Mater. Eng. 2016, 45, 1152–1156. [Google Scholar]
  16. Huang, S.; Tsai, H.; Lin, S. Effects of brazing route and brazing alloy on the interfacial structure between diamond and bonding matrix. Mater. Chem. Phys. 2004, 84, 251–258. [Google Scholar] [CrossRef]
  17. Yang, W.; Xiao, L.; Chen, H.; Zhang, X.; Tang, X. Experimental study on laser power influence for diamond grits brazing. In Proceedings of the Tenth International Conference on Information Optics and Photonics (CIOP 2018), Beijing, China, 8–11 July 2018. [Google Scholar]
  18. Yang, Z. Fundamental Research on Laser Brazing of Diamond Grains. Ph.D. Thesis, Nanjing University of Aeronautics and Astronautics, Nanjing, China, November 2007. [Google Scholar]
  19. Han, G.; Zhao, J.; Li, J. Dynamic simulation of the temperature field of stainless steel laser welding. Mater. Des. 2007, 28, 240–245. [Google Scholar]
  20. García, O.; García-Ballesteros, J.J.; Munoz-Martin, D.; Núñez-Sánchez, S.; Morales, M.; Carabe, J.; Torres, I.; Gandía, J.J.; Molpeceres, C. Estimation of Local Crystallization of a-Si:H Thin Films by Nanosecond Pulsed Laser Irradiation Through Local Temperature Simulation. Phys. Procedia 2012, 39, 286–294. [Google Scholar] [CrossRef] [Green Version]
  21. Lv, X.; Pan, Y.; Jia, Z.; Shen, Z.; Lu, J.; Ni, X. Time-resolved temperature measurement and numerical simulation of superposed pulsed Nd:YAG laser irradiated silicon. In Proceedings of the International Symposium on Laser Interaction with Matter, Chengdu, China, 6–9 November 2016. [Google Scholar]
  22. Bag, S.; Trivedi, A.; De, A. Use of a multivariate optimization algorithm to develop a self-consistent numerical heat transfer model for laser spot welding. Int. J. Adv. Manuf. Technol. 2008, 38, 575–585. [Google Scholar] [CrossRef]
  23. Hao, M.; Sun, Y. A FEM model for simulating temperature field in coaxial laser cladding of TI6AL4V alloy using an inverse modeling approach. Int. J. Heat Mass Transf. 2013, 64, 352–360. [Google Scholar] [CrossRef]
  24. Woo, W.-S.; Lee, C.-M. A study of the machining characteristics of AISI 1045 steel and Inconel 718 with a cylindrical shape in laser-assisted milling. Appl. Therm. Eng. 2015, 91, 33–42. [Google Scholar] [CrossRef]
  25. Sabaeian, M.; Shahzadeh, M. Simulation of temperature and thermally induced stress of human tooth under CO2 pulsed laser beams using finite element method. Lasers Med. Sci. 2015, 30, 645–651. [Google Scholar] [CrossRef]
  26. Laazizi, A.; Courant, B.; Jacquemin, F.; Andrzejewski, H. Applied multi-pulsed laser in surface treatment and numerical–experimental analysis. Opt. Laser Technol. 2011, 43, 1257–1263. [Google Scholar] [CrossRef]
  27. Huang, G.; Huang, J.; Zhang, M.; Mu, D.; Zhou, G.; Xu, X. Fundamental aspects of ultrasonic assisted induction brazing of diamond onto 1045 steel. J. Mater. Process. Technol. 2018, 260. [Google Scholar] [CrossRef]
  28. Mukhopadhyay, P.; Raghava Simhan, D.; Ghosh, A. Challenges in brazing large synthetic diamond grit by Ni-based filler alloy. J. Mater. Process. Technol. 2017, 250, 390–400. [Google Scholar] [CrossRef]
  29. Huang, G.; Zhang, M.; Guo, H.; Xu, X. The effects of temperature curves on the diamond/ Ni-Cr interfacial properties in high-frequency induction brazing. Int. J. Abras. Technol. 2017, 8, 133–146. [Google Scholar] [CrossRef]
Figure 1. Experimental setup: (a) laser heating device, (b) temperature monitor, and (c) laser heating zone in the chamber.
Metals 09 00612 g001
Figure 2. Diamond brazing by spot heating with pulsed laser.
Metals 09 00612 g002
Figure 3. Waveform of the output power of a pulsed laser beam.
Metals 09 00612 g003
Figure 4. Finite element model of laser brazing. (a) The cross-sectional illustration of the diamond/filler alloy/substrate assembly; (b) the meshed model.
Metals 09 00612 g004
Figure 5. Comparison of experimental and simulation temperature curves: (a) calibration and (b) validation.
Metals 09 00612 g005
Figure 6. Simulated temperature curve and distributions during pulsed laser spot heating: (a) temperature curve, (b) t = 0.966667 s, (c) t = 0.969667 s, and (d) t = 3 s.
Metals 09 00612 g006
Figure 7. Stable heating stage in Figure 6: (a) temperature vs. heating time and (b) temperature evolution within a heat pulse duration.
Metals 09 00612 g007
Figure 8. Temperature curve induced within a heat pulse duration.
Metals 09 00612 g008
Figure 9. Diamond grains brazed by: (a) Case D, (b) Case G, and (c) Case E.
Metals 09 00612 g009
Figure 10. Comparisons between the simulated and the calculated results: (a) Tmax, (b) Tmin, (c) ΔT and (d) Tav.
Metals 09 00612 g010
Table 1. Laser heating parameters and simulation results.
Simulation CaseLaser ParametersTemperature (°C)
P0 (W)Pin (W)f (Hz)τ (ms)TmaxTminΔTTav
A1710153303320039028101472
B1710230453337770626711784
C1710230304.5383259532371881
D2565230303467459740772128
E1140153.9453234048018601251
F2565153.9203451532041951806
G1140153.9304.5263539622391304
H2565153.9302385339534581659
I1710153.9204.5367831233661570
J1710153.9452277947523041385