Article

Metallic Glasses: A New Approach to the Understanding of the Defect Structure and Physical Properties

by
Vitaly Khonik
1,*,† and
Nikolai Kobelev
2,†
1
Department of General Physics, State Pedagogical University, Lenin St. 86, 394043 Voronezh, Russia
2
Institute for Solid State Physics, Russian Academy of Sciences, Chernogolovka, 142432 Moscow, Russia
*
Author to whom correspondence should be addressed.
These authors contributed equally to this work.
Metals 2019, 9(5), 605; https://doi.org/10.3390/met9050605
Submission received: 25 April 2019 / Revised: 17 May 2019 / Accepted: 20 May 2019 / Published: 24 May 2019
(This article belongs to the Special Issue Recent Advancements in Metallic Glasses)

Abstract

:
The work is devoted to a brief overview of the Interstitialcy Theory (IT) as applied to different relaxation phenomena occurring in metallic glasses upon structural relaxation and crystallization. The basic hypotheses of the IT and their experimental verification are shortly considered. The main focus is given on the interpretation of recent experiments on the heat effects, volume changes and their link with the shear modulus relaxation. The issues related to the development of the IT and its relationship with other models on defects in metallic glasses are discussed.

1. Introduction

Metallic glasses (MGs) constitute an amazing example of a man-made non-crystalline state, which is not observed in nature. These materials are very promising in the sense of technological applications that results in the growing interest to the investigation of their physical properties. At first glance, since MGs do not have directional chemical bonding, one can expect that the understanding of their structure and properties should be a simpler task than for other types of glasses. However, any commonly accepted theory describing their formation and main structural features has been absent thus far, and any general theory of non-crystalline substances is still lacking as well. This largely constrains the development of new type MGs with the physical properties predicted in advance. Since MGs are prepared by melt quenching while the melt is obtained by fusion of the crystalline state, one should naturally expect a relationship between these states, including a connection between the properties of the glass and those of the maternal crystal (whose melt is used for the glass production). These interdependencies should be taken into account by a theoretical model of glass. On the other hand, since it is commonly accepted that glass is a frozen liquid, this model should also imply certain relation to the melting mechanism and formation of the liquid state. By that, it should include as a major ingredient the notions on structural defects, which are intrinsically related to the whole glass prehistory, i.e., maternal crystal→melt→glass. To date, quite a few theoretical models describing the structural features, defects and different properties of MGs have been suggested [1,2,3,4,5,6,7,8,9,10,11,12]. In our opinion, however, the above general requirements are satisfied by another approach—the Interstitialcy theory (IT) of condensed matter states suggested by Granato [13,14]. It was demonstrated in recent years that the IT provides a powerful tool for the understanding and predicting different relaxation phenomena in MGs and unambiguously shows a genetic relationship of the glass with the maternal crystal. Therefore, this brief overview is firstly devoted to an analysis of the major hypotheses of the IT and main experiments related to its verification. Since certain issues related to the IT have already been discussed [15,16], this work is largely devoted to the new experiments and their interpretations while earlier information is mentioned briefly. Finally, a relation of the IT to other models of the metallic glass structure and its defects is discussed.

2. The Interstitialcy Theory

The Interstitialcy theory is essentially based on the experimental investigations of the effect of low-temperature (4 K), low-dose soft neutron irradiation on the elastic moduli of single crystal copper carried out by Granato’s group in the 1970s [17,18]. The irradiation leads to the formation of isolated Frenkel pairs (vacancy+interstitial) remaining mostly immobile in the liquid helium temperature range. A careful analysis of the experimental data led to the conclusion that the formation of interstitial defects results in a strong decrease of the shear modulus (diaelastic effect) C 44 according to Δ C 44 / C 44 = B i c i , where c i is the interstitial concentration and B i 30 is the shear sensitivity. For the vacancies, the shear sensitivity is by an order of magnitude smaller, B v 2 . The effect of point defects on the bulk modulus is also small, comparable to the diaelastic effect produced by the vacancies. At the same time, similar results were obtained upon electron irradiation of single crystal aluminum [19]. It was argued that a strong diaelastic effect can be observed only if the interstitials do not make up an octahedral configuration, as considered before the 1970s (red circle in Figure 1a), but form a dumbbell (split) structure, which is characterized by the two atoms trying to occupy the same lattice cite (red circles in Figure 1b). To underline the difference between these defects, the latter defect is also called an interstitialcy [20]. It is of major importance that the octahedral interistitial is a spherically symmetrical defect (similarly to the vacancy) while the dumbbell interstitial is clearly anisotropic and, thus, constitutes an elastic dipole strongly interacting with the external shear stress [19,21]. It is this feature of the defect, which leads to a strong diaelastic effect. It is now generally accepted that dumbbell intertitials exist in all main lattices and constitute the defect state with the lowest formation enthalpy [22,23,24,25,26].
An important consequence of the interstitial dumbbell structure consists in the appearance of the low-frequencies in the vibrational spectrum, which are by a few times smaller than the Debye frequency [28]. This in turn leads to the high formation entropy of the defect (for copper, S f ( 5 10 ) k B according to the Granato’s estimate [14]) and, respectively, to a decrease of the Gibbs formation free energy at high temperatures. The extrapolation of the elastic moduli of irradiated crystals towards high defect concentration in the experiments [17,18] showed that C 44 0 at c i 0.02 ÷ 0.03 providing a guess that such big defect concentration should lead to the crystal→liquid transition, because the liquid is characterized by a vanishing (or very small) shear modulus [29,30]. This allowed Granato to suggest that melting of metals should be related to the rapid thermoactivated generation of dumbbell interstitials. Another important point realized by Granato was the understanding that the defect formation enthalpy is proportional to the unrelaxed shear modulus G, in line with earlier investigations [31,32]. The above hypotheses led Granato to the formulation of the interstitialcy theory, which includes melting as an integral part [13,14] (see also a discussion given below). In fact, the mathematical formalism of the IT is based on the two equations,
H i F c i = α G Ω ,
G = μ e x p ( B i c i ) ,
where H i F is the interstitial formation enthalpy, α is a dimensionless parameter close to unity, μ is the shear modulus of the defectless crystal, Ω is the volume per atom and B i = α β with β being the dimensionless shear susceptibility. This quantity was estimated by Granato as β = 3 C 4444 / C 44 40 , where C 44 is the shear modulus of the crystal and C 4444 is its fourth-rank (anharmonic) shear modulus. On the other hand, the shear susceptibility is related to the internal energy U of the crystal as β = 1 16 μ 4 U ε 4 , where ε is the shear strain. The above equations show that the shear susceptibility constitutes a fundamental parameter of the material since it is proportional to the ratio of the fourth-rank shear modulus to the “usual” shear modulus.
The general approach of the IT to the crystal→melt→glass transformation and the relationship between these states consists in the following. Crystal melting is related to a rapid increase of the concentration of dumbbell interstitials, which remain identifiable structural units in the liquid state (as confirmed by later computer modeling [33]). Rapid melt quenching freezes the melt defect structure in the solid glass and different relaxation processes occurring in it upon heat treatment can be interpreted in terms of the changes of the defect concentration by using Equations (1) and (2). For the glassy state, the quantities G and μ in these equations correspond to the shear moduli of glass and maternal crystal, respectively. Despite the simplicity of these equations, it has been found that the IT, although originally derived for simple metals, provides explanations for many experiments on multicomponent MGs, as reviewed earlier [15,16] and discussed below.

3. Verification of the Main Starting Hypotheses of the Interstitialcy Theory

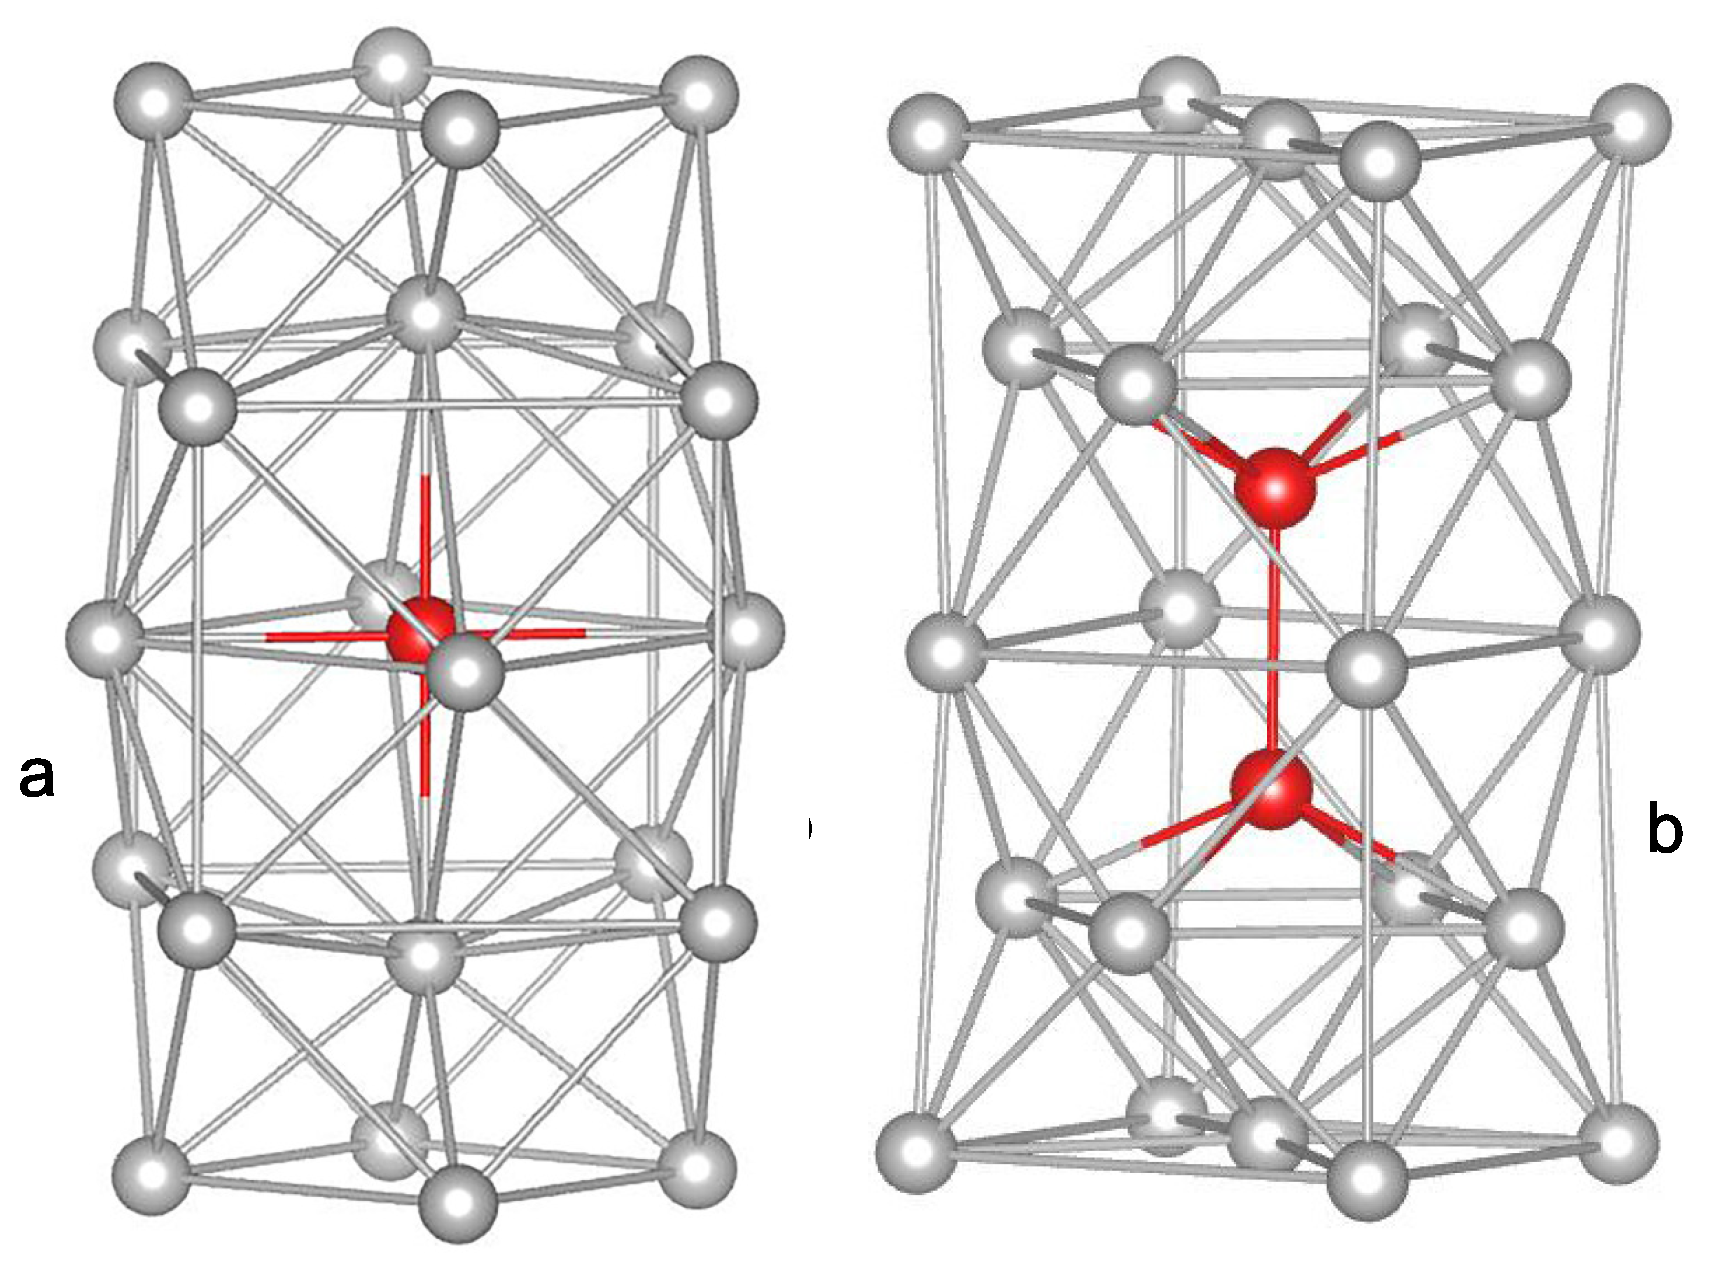
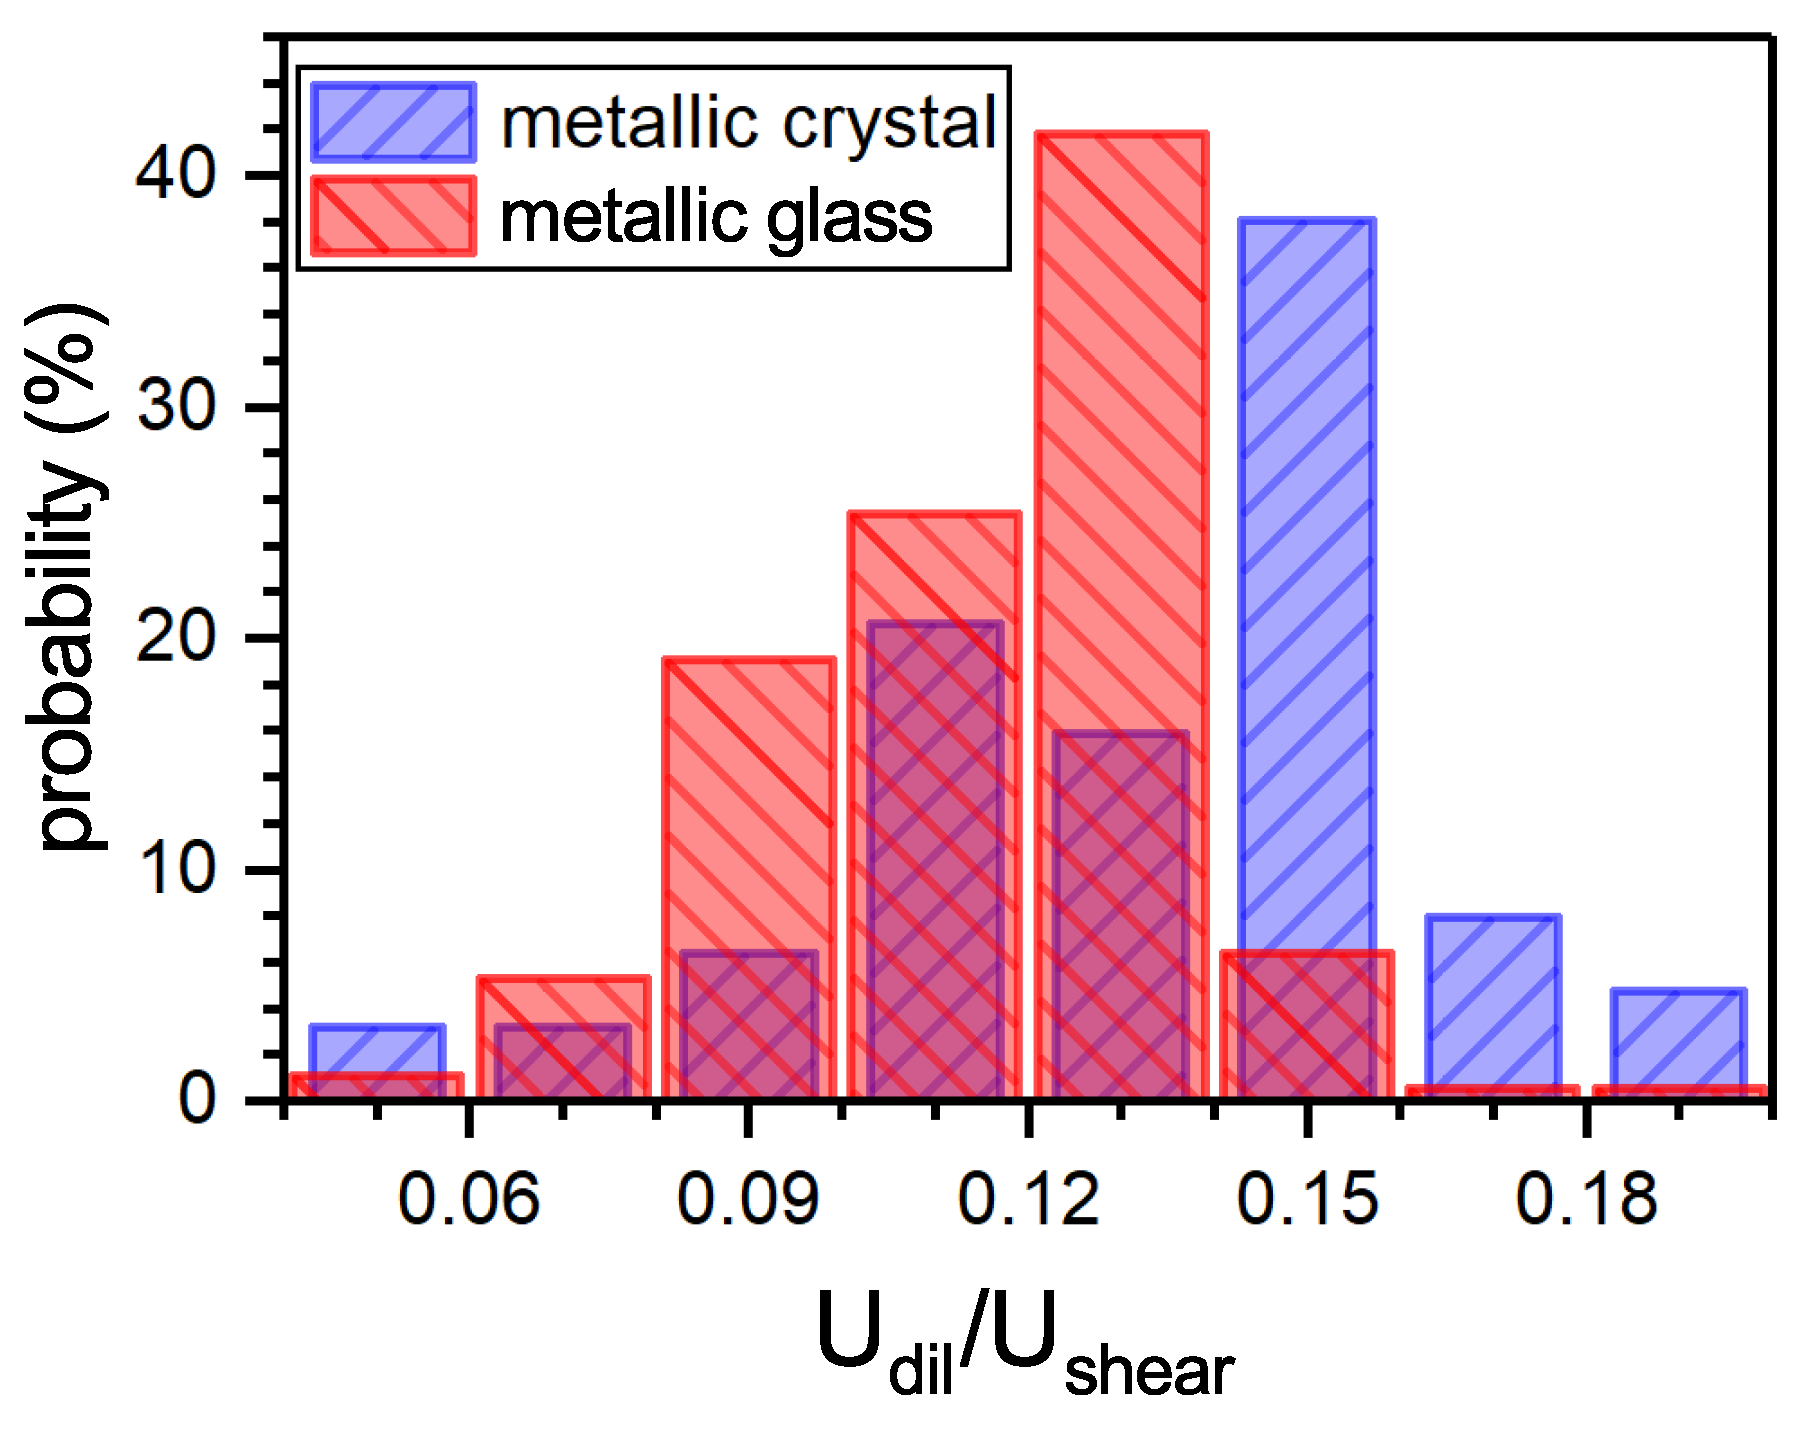
3.1. Shear and Dilatation Contributions into the Defect Elastic Energy

The IT is actually built on the hypothesis that the shear component of the elastic energy created by interstitial defects is predominant while the dilatation contribution can be neglected. This agrees with later calculations by Dyre [34] who showed that it is the shear strain component, which produces the main contribution into the elastic energy far from a point defect in a solid. He derived a simple relation for the ratio of the dilatation U d i l and shear U s h e a r components of this energy and concluded that the former is much smaller, i.e.,
U d i l U s h e a r = 2 B / G 9 B G 2 + 8 B G + 4 0.1 ,
where B is the bulk modulus. This equation, however, was derived within the linear elasticity approach for a spherically symmetric defect and does not account for the energy of the defect nucleus. For further verification of the above Granato’s hypothesis, a molecular-static modeling of interstitial defects in four FCC metals was performed [27]. To compare the contributions U d i l and U s h e a r into the total elastic energy, the local relative change of the Voronoi polyhedra volume V i for each atom with respect to the Voronoi polyhedra volume of an atom in the ideal lattice V 0 was accepted as a measure of the volume change upon defect formation, i.e., U d i l = B 2 V 0 ( Δ V / V ) 2 d V B 2 i ( V 0 V i ) 2 V 0 2 . The shear component of the elastic energy was taken as a difference U s h e a r = H f U d i l with H f being the interstitial formation enthalpy. The calculations showed that the ratio U d i l / U s h e a r for the interstitial dumbbell is nearly twice as that given by Equation (3) due to the accounting of the elastic energy of the defect nucleus. This correction allows using this equation for 63 elemental metals. The result shown in Figure 2 implies that this ratio does not exceed 0.15 for more than 90% of metals. Assuming that MGs contain similar interstitial-type defects in line with the IT, the same calculation procedure was applied to 189 metallic glass composition and nearly the same result was obtained (see Figure 2). Thus, in both cases, the contribution of the dilatation energy is indeed much smaller than that given by the shear energy, just as supposed by Granato [13,14].

3.2. Increase of the Interstitial Concentration before Melting

As mentioned above, the IT argues that melting of metals is related to a rapid increase of the concentration of dumbbell interstitials. This is a crucial statement of the theory. Since dumbbell interstitials produce tenfold bigger shear softening as compared with vacancies, this effect can be detected experimentally provided that there are no contributions coming from other defects (e.g., dislocations) in the crystal. Such experiments were recently performed on single crystal aluminum and coarse-crystalline indium [35,36]. The main results of these measurements are shown in Figure 3. Despite the usual opinion that the equilibrium interstitial concentration c i is negligible at any temperature [37], it is seen that c i rapidly increases for both metals upon approaching the melting temperature T m . In aluminum, this concentration remains smaller than the vacancy concentration c v while for indium c i becomes even bigger than c v near T m . Besides that, the data on Al clearly demonstrate an increasing tendency of c i -growth at high temperatures T 926 K ( 0.99 T m ) while the formation Gibbs free energy start to rapidly decrease in this region [35]. These features agree with the predictions of the IT. It is worth noting that increasing concentration of dumbbell interstitials can explain the non-linear growth of the heat capacity of simple metals near T m , whose nature remains hitherto unclear [38]. It should also be mentioned that temperature dependence of the interstitial concentration obtained for aluminum [35] allowed an estimate of their formation entropy S i F , which was found to be ≈7 k B [39], in full agreement with Granato’s value [14].

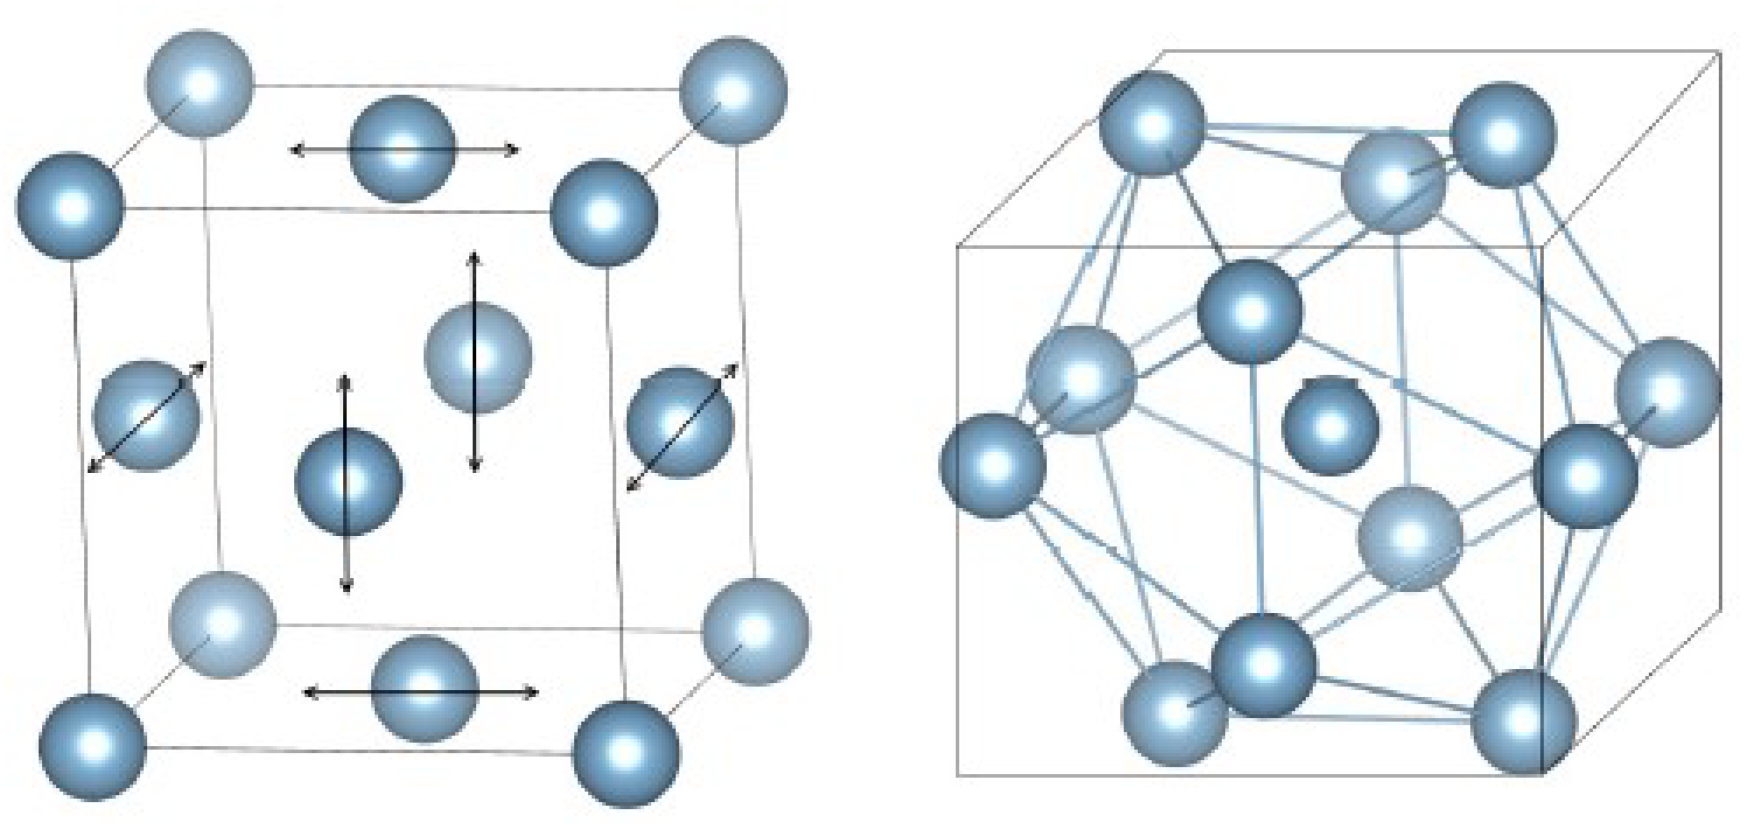
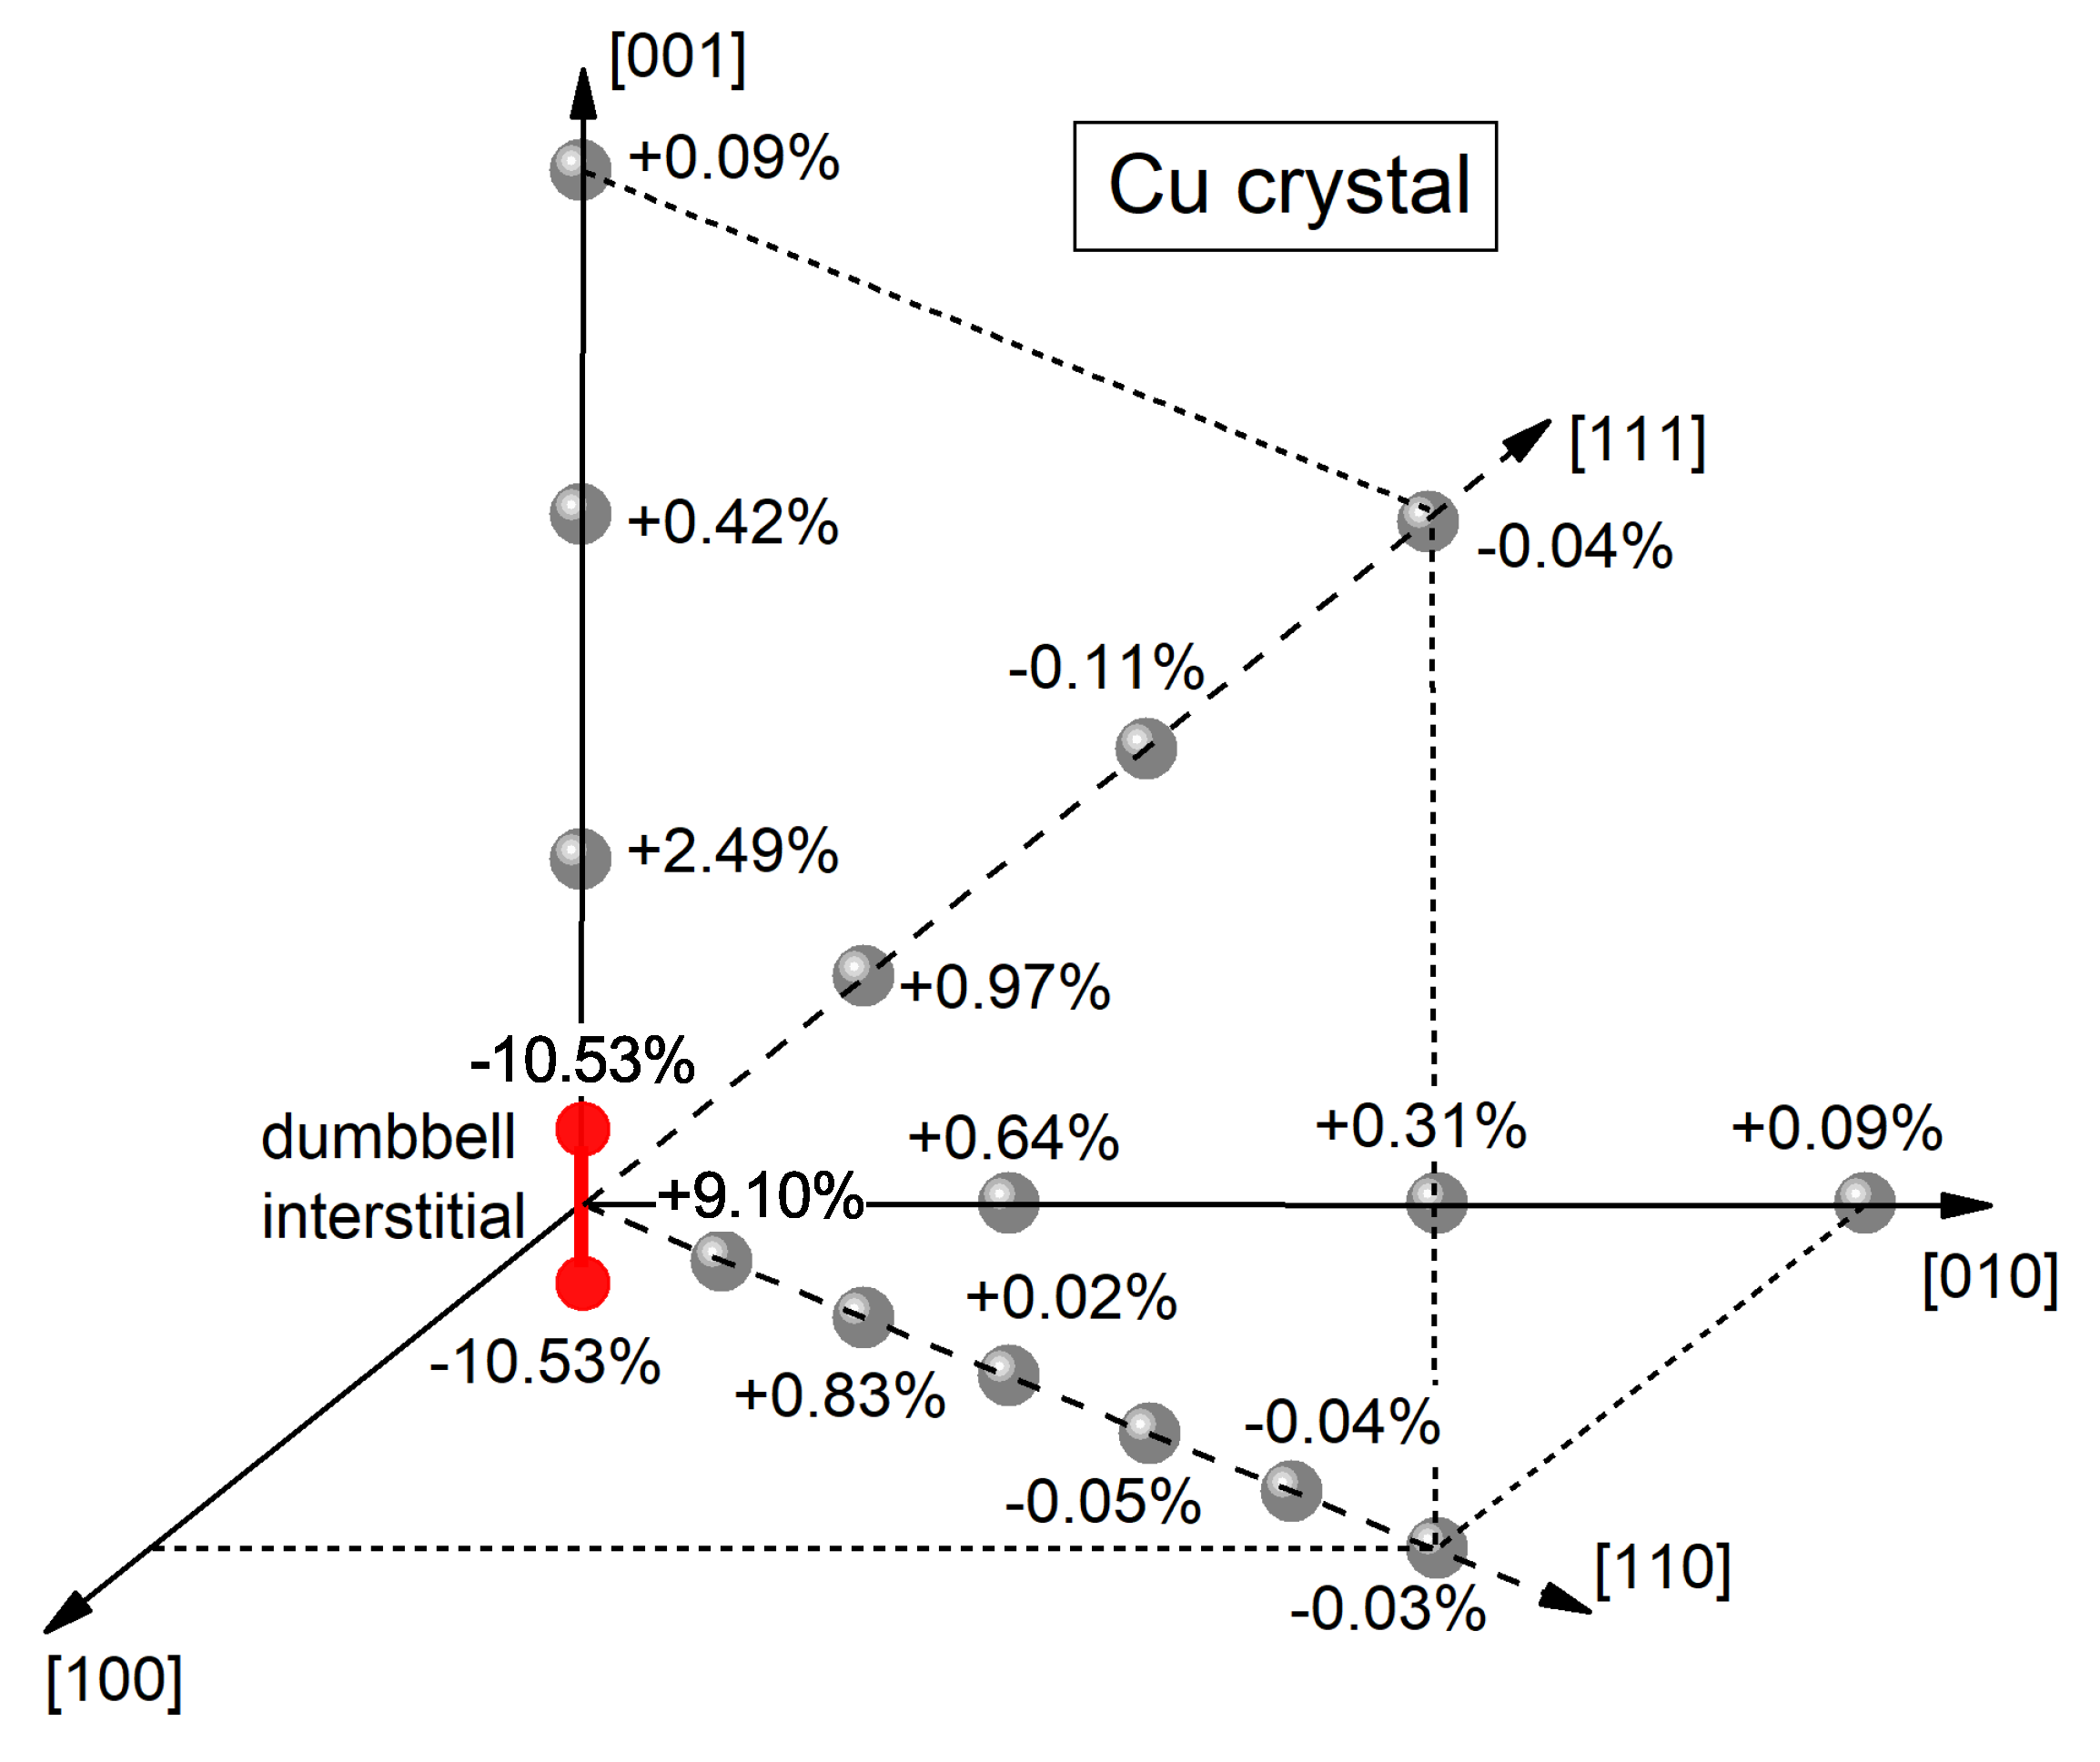
3.3. Identification of Interstitial-Type Defects in the Glassy State

The topological pattern of dumbbell interstitials in crystals is very clear—two atoms, trying to occupy the same lattice cite (Figure 1b). However, any similar topological picture in the glassy state is absent. In this case, one can try to identify these defects by searching structural regions, which display the properties similar to those of dumbbell interstitials. Thus far, such attempts have been performed using computer models of glassy copper and aluminum [40,41]. It was found that certain nano-sized regions reveal large non-affine displacements and can be characterized by a strong sensitivity to the applied shear stress and distinctive local shear strain fields, which are described by the local shear susceptibility as well as by the diaelastic compliance and diaelastic polarizability tensors. Another feature consists in the characteristic low- and high-frequency modes (far below and above the Debye frequency, respectively) in the vibration spectra of atoms belonging to these regions. All these peculiarities are quite similar to those of dumbbell interstitials in crystals. Thus, interstitial-type defects indeed exist in non-crystalline simple metals. Two-component metallic structures should be analyzed in a similar way. Besides that, numerous simulations of MGs show the presence of the atoms characterized by < 0 , 2 , 8 , 0 > Voronoi indexes (or close to them) [7], which constitute a characteristic feature of dumbbell interstitials in crystals (Figure 1b). One the other hand, an interstitial defect is characterized by the two atoms with these indexes. We are unaware of any attempts for searching two adjacent atoms with < 0 , 2 , 8 , 0 > or close indexes in computer models of MGs.

3.4. Shear Susceptibility

The large magnitude of the shear susceptibility β (see Equation (2)), which determines the influence of defects on the shear modulus (diaelastic effect), constitutes a salient ingredient of the IT. This quantity is controlled by the non-linearity of the solid, specifically by the magnitude of the non-linear shear modulus C 4444 or, in an isotropic approximation, by the quantity γ 4 = 1 16 4 U e l ε 4 , where U e l is the elastic energy and ε is the shear strain. To determine the value of the shear susceptibility β , the effect of elastic loading on the ultrasound velocity was studied on two (Zr- and Pd-based) MGs [42,43]. The shear susceptibility derived in these experiments is smaller than that originally estimated by Granato ( β 40 ) but has nonetheless the same order of magnitude. Moreover, this quantity is close to the estimates derived by other methods [44] (see Section 3.5 and Table 1).

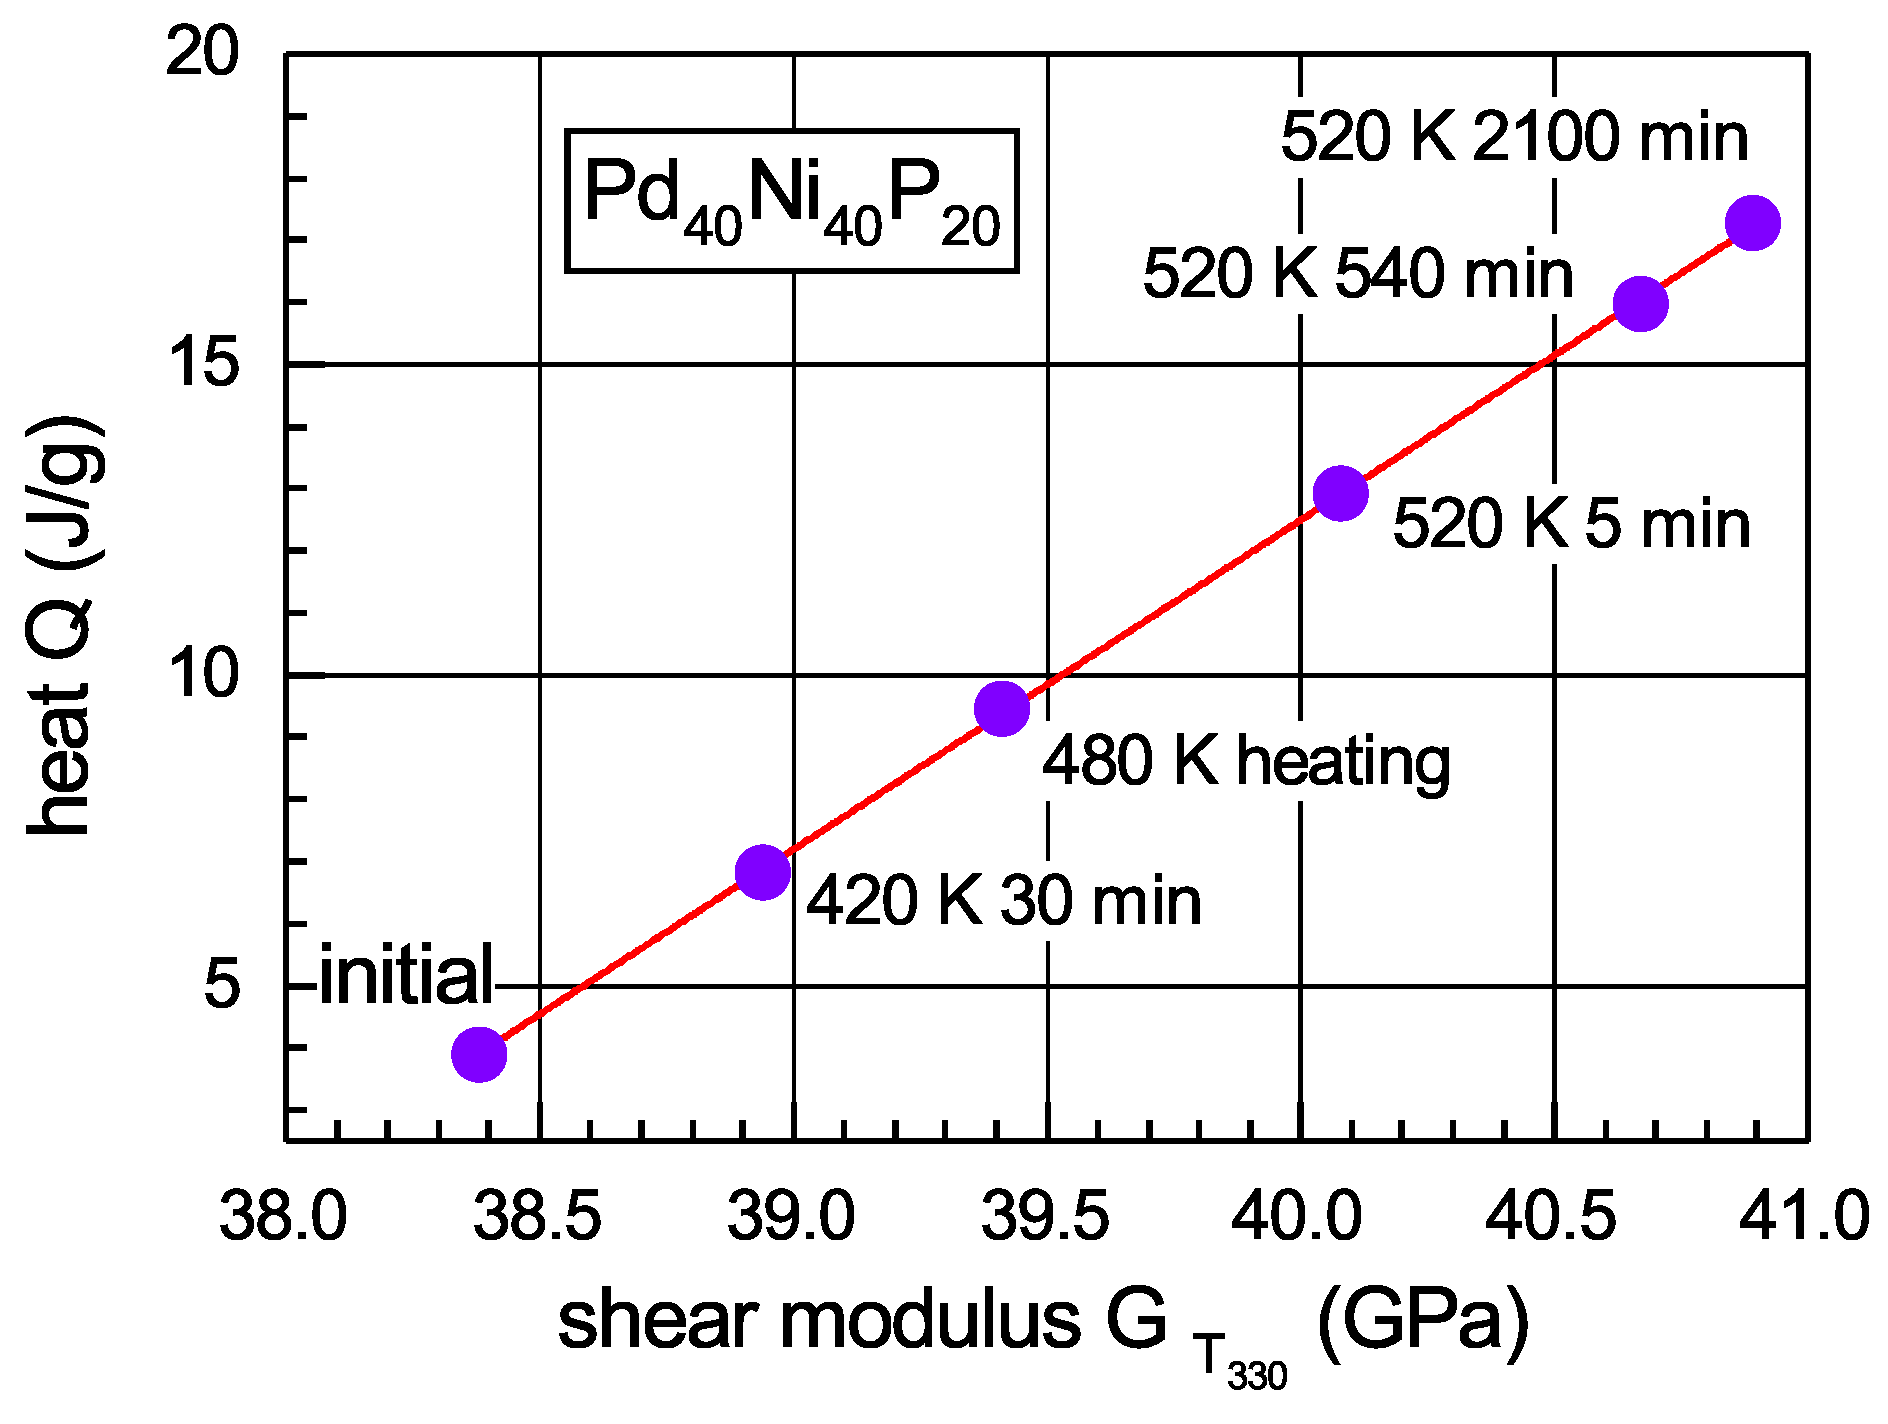
3.5. Relation between the Shear Modulus and Heat Effects

A simple analysis of Equations (1) and (2) shows that the IT implies an intrinsic relation between shear modulus changes and heat effects in MGs. Indeed, integration of Equation (1) taking account of Equation (2) leads to an expression for the enthalpy increment Δ H upon insertion of interstitial-type defects, which can be expressed through the shear moduli of glass and maternal crystal, Δ H ( μ G ) / β ρ , where β is the shear susceptibility and ρ is the density. Then, one can arrive at an expression relating the heat flow with the change of the shear modulus,
W = T ˙ ρ β G μ μ T G T ,
where T ˙ is the rate of temperature change. This relationship was repeatedly tested and found to give an excellent description of the heat flow on the basis on shear modulus relaxation data not only upon structural relaxation below the glass transition temperature T g and in the supercooled liquid state but upon crystallization as well [45,46]. The latter fact is really surprising and actually suggests that the whole excess internal energy Δ U (with respect to the crystalline maternal state) is mostly related to the interstitial-type defect system frozen-in upon glass production. An analysis gives a simple expression for this quantity [47],
Δ U Δ H μ β ρ 1 G μ .
It is seen that the excess internal energy is simply controlled by the shear moduli of glass and maternal crystal. Upon crystallization, the defect system disappears and this energy is released as heat, i.e., Δ U Q c r y s t , where Q c r y s t is the heat of crystallization. A specially designed experiment confirmed this idea [48]. From a physical viewpoint, this result means that the whole heat content of glass (i.e., the excess enthalpy with respect to the crystalline maternal state) is mostly determined by the interstitial-type defect system frozen-in upon glass production.
On the other hand, considering the initial and relaxed states of MGs and calculating the corresponding differences for the heat flow and shear modulus, Δ W = W r e l W and Δ G = G r e l G , Equation (4) after simplification can be rewritten as [49]
Δ W = T ˙ ρ β Δ G T .
This relationship shows that the quantities Δ W and Δ G / T should be proportional to each other. Figure 4 shows these quantities derived from calorimetric and shear modulus data for bulk glassy Z r 65 A l 10 N i 10 C u 15 . It is clearly seen that they are indeed proportional. This allows determination of proportionality constant and calculation of the shear susceptibility β . Table 1 shows β -values thus derived for a few MGs. It is seen that these values belong to a relatively narrow range 15 β 22 that, in general, agrees with the IT. Other methods used for the determination of β give close results [49]. Since the shear susceptibility determines the shear softening effect (via Equation (2)), the heat effects (according to Equations (4) and (5)) and also related to the anharmonicity of the interatomic potential, it appears to be a major integral parameter of the glassy structure.

4. Refinement of the Parameters of the Interstitialcy Theory

As reviewed earlier [15,16] and discussed in the present work, the IT provides a good description of different aspects of MGs relaxation behavior. At the same time, some model parameters of the IT were introduced in a phenomenological way. It is therefore desirable to clarify their physical meaning and relationship with material parameters. In the initial model, an interstitial defect was considered by Granato as an elastic string. At the same time, a split interstitial can be treated as an elastic dipole [47,50]. The corresponding “dipole” approach is based on the expansion of the energy into a series in powers of the elastic strain created by the dipoles [50]. It was found that that the Granato and “dipole” approaches give practically identical expressions for the elastic energy and shear modulus [47]. A comparison of these approaches leads to an expression for the parameter α introduced in the original version of the IT (see Equations (1) and (2)) as α = ( ε i j ε j i 1 3 ε i i 2 ) d V / Ω , where ε i j is the elastic strain field created by the interstitial. Thus, the parameter α characterizes the “strength” of the defect. The shear susceptibility within the “dipole” approach was calculated as β = γ 4 Ω t / μ , where μ is the shear modulus of the maternal crystal and Ω t = 1.38 is a parameter characterizing the elastic anisotropy of the interstitial [50]. This estimate is about two times smaller than that given by Granato. It should be noted that the “dipole” approach was found very useful upon further IT development, especially in the part that accounts for the effect of the concentration of interstitials on their interaction (see Section 6).

5. Recent Experiments

5.1. Reconstruction of Temperature Dependence of the Shear Modulus Using Calorimetric Data

Equation (4) for the heat flow W ( T ) can be used in the “opposite” way, i.e., for the calculation of the shear modulus relaxation using input calorimetric data . This leads to a relation [51]
G ( T ) = G r t μ r t μ ( T ) ρ β T ˙ T r t T W ( T ) d T .
where the subscript “ r t ” refers to the room temperature. Figure 5 gives experimental temperature dependences of the shear modulus of a Zr-based glass in the initial state, after relaxation obtained by heating into the supercooled liquid region and after full crystallization. The figure also shows temperature dependences of the shear modulus in the initial and relaxed states calculated with Equation (7) using experimental calorimetric heat flow W ( T ) , temperature dependence of the shear modulus in the crystalline state μ ( T ) , experimental parameters and material constants entering this equation. It is seen that the calculation reproduces experimental G ( T ) -data quite well, including shear modulus growth due to structural relaxation below T g and shear softening in the supercooled liquid region.

5.2. Heat Absorption Occurring upon Heating of Relaxed Glass

Within the IT framework, the heat absorbed upon heating from room temperature T r t to a temperature T s q l in the supercooled liquid region can be calculated as [52]
Q 1 β ρ G T r t G T s q l μ T r t + μ T s q l ,
where G T r t , G T s q l , μ T r t and μ T s q l are the shear moduli of glass and maternal crystal at temperatures T r t and T s q l , respectively, other quantities are the same as above. Since the shear moduli G T s q l and μ T s q l in the supercooled liquid state do not depend on the thermal prehistory, the only quantity in Equation (8), which varies upon structural relaxation, is the room-temperature shear modulus. The moduli G T s q l , μ T r t and μ T s q l are only temperature dependent. The temperature T s q l can be accepted as a constant and the quantities G T s q l , μ T r t and μ T s q l are then constants as well. Thus, the heat Q is dependent on a single variable G T r t . The latter can be changed by preliminary heat treatment. Figure 6 shows the experimental data on the heat absorbed upon warming up of P d 40 N i 40 P 20 glass into the supercooled liquid as a function of the shear modulus measured at 330 K. The data points correspond to different preannealing treatments as indicated. It is seen that Q ( G T 330 ) -data nicely fall onto a straight line, as implied by Equation (6). The slope of this line within a few percent error agrees with its theoretical value given by this equation as Q / G 330 = 1 β ρ [52]. Similarly, one can describe [53] the widely known so-called “sub- T g enthalpy relaxation” effect, which consists in the growth of the heat absorption near the glass transition temperature T g in MGs subjected to prolonged preannealing well below T g [54,55].
The data discussed above in Section 3.5, Section 5.1 and Section 5.2 convincingly demonstrate a close relationship between shear modulus relaxation and heat effects in MGs, in full agreement with the IT predictions.

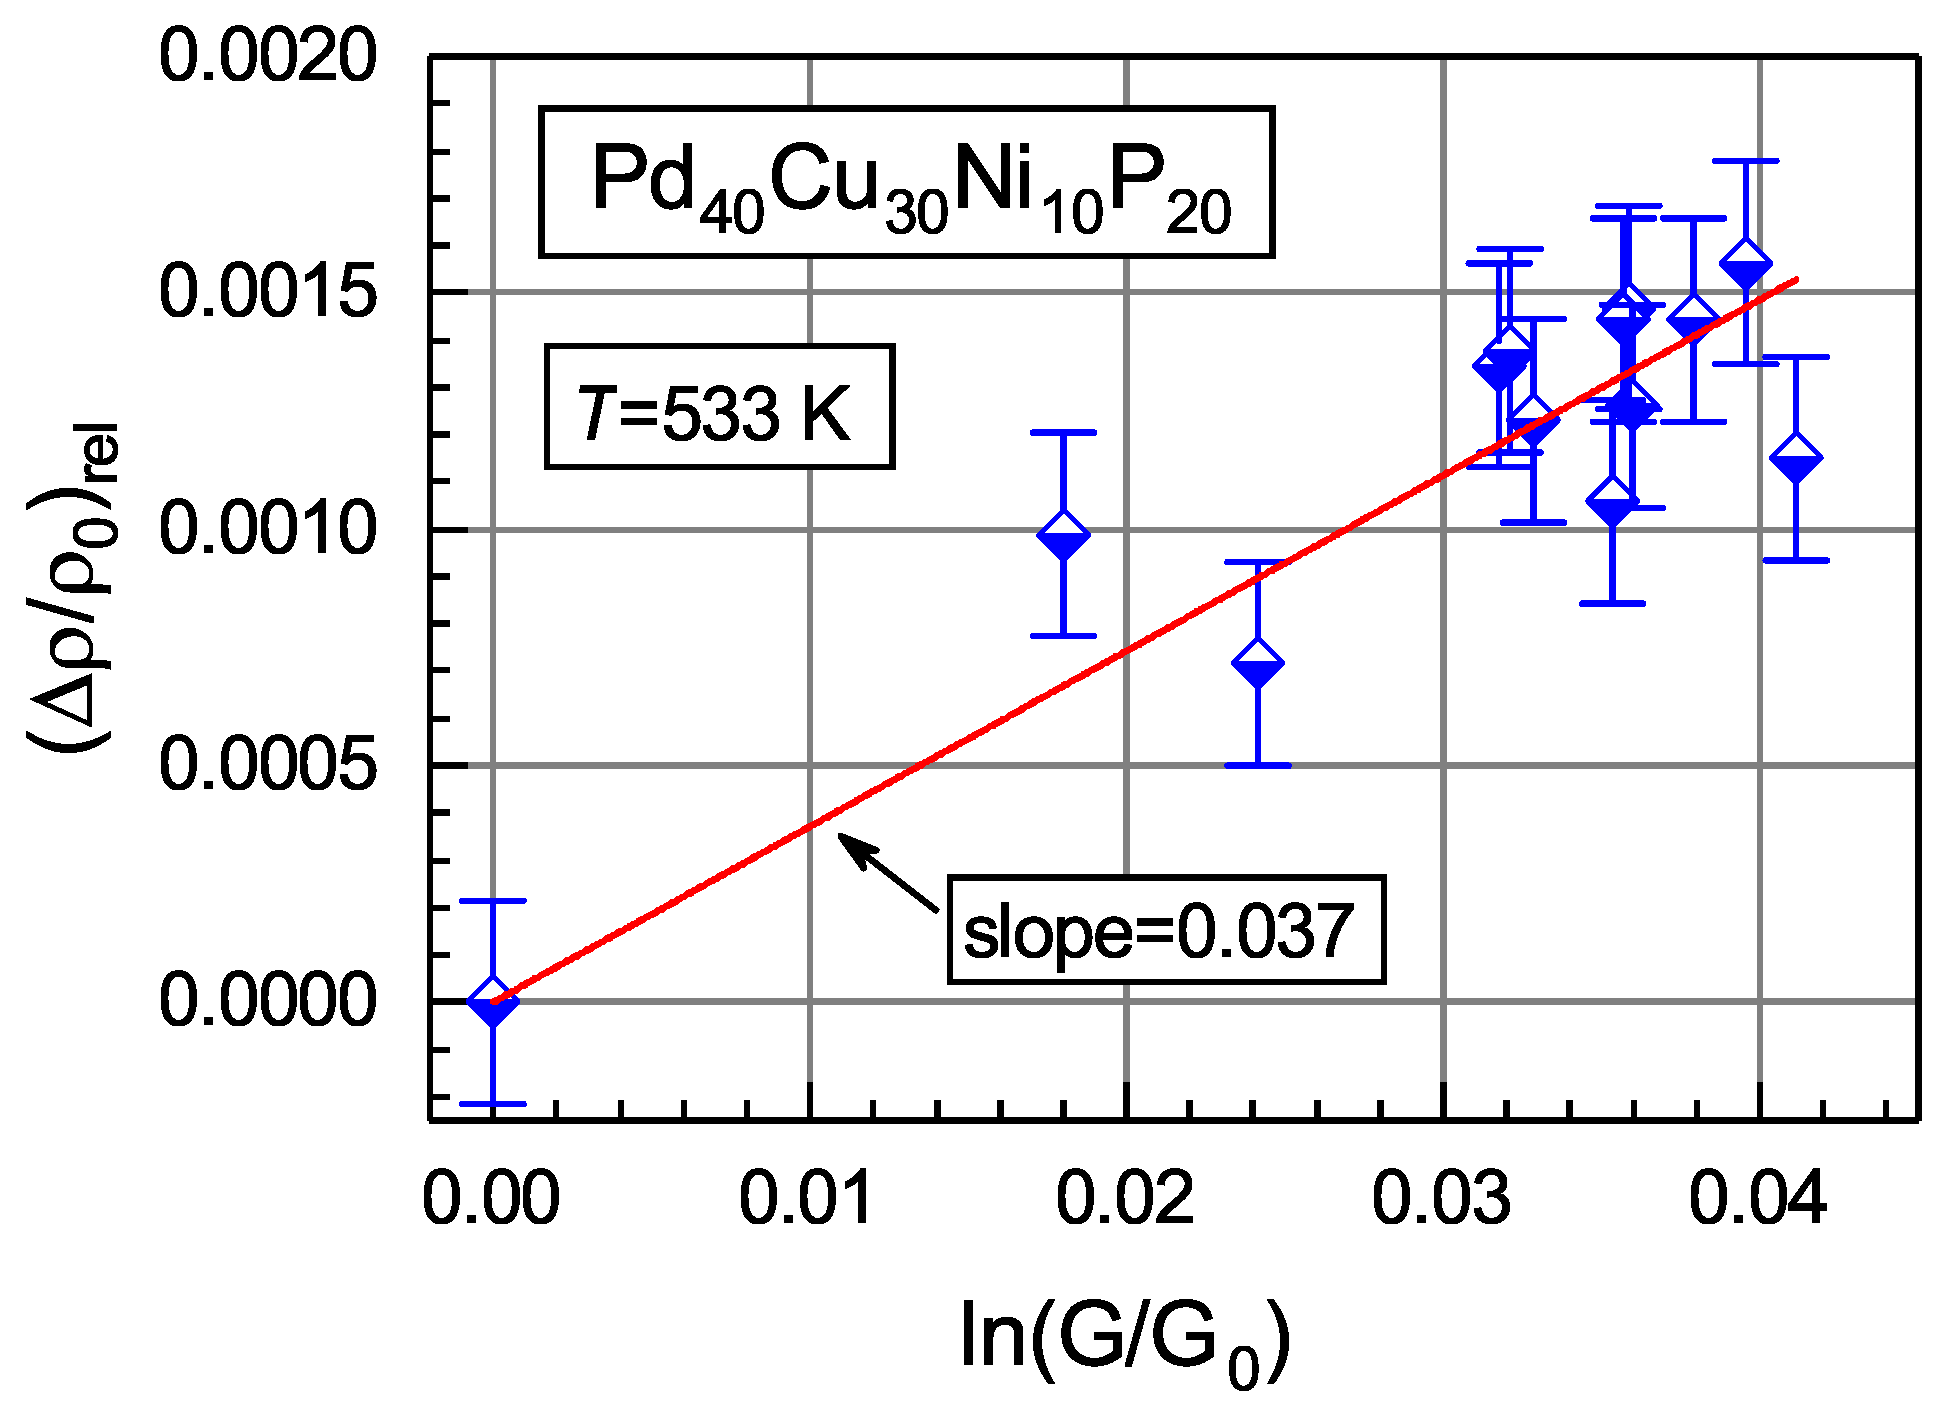
5.3. Density Changes upon Structural Relaxation and Crystallization

The interpretation of volume changes using the IT is based on the expected change of the volume Δ V upon creation of a dumbbell interstitial defect, which can be represented as Δ V / Ω = 1 + r i , where r i is the so-called relaxation volume reflecting the relaxation of the structure after defect creation, and Ω is the volume per atom [24,56]. Then, if a defect concentration c is created, the volume increases by Δ V and the relative volume change becomes Δ V / V = ( r i 1 ) c . Using the shear modulus given by Equation (2), one arrives at the relative change of the density upon isothermal structural relaxation at a particular temperature as
Δ ρ ( t ) ρ 0 r e l = ( r i 1 ) α β l n G ( t ) G 0 ,
where Δ ρ ( t ) = ρ ( t ) ρ 0 , the densities ρ ( t ) and ρ 0 correspond to the shear moduli G ( t ) and G 0 = G ( t = 0 ) , respectively, α and β are the same as in Equation (2). An example of relative density changes as a function of shear modulus change of glassy P d 30 C u 30 N i 10 P 20 measured at room temperature after isothermal annealing is given in Figure 7 [57]. It is seen that this dependence can be fitted by a straight line, in accordance with Equation (9). This equation implies the slope of this line equal to ( r i 1 ) α β . With α = 1 (as usually assumed), the shear susceptibility for this glass β = 19 (Table 1) and the relaxation volume r i = 1.6 (as for FCC metals [24]), one arrives at the slope equal to 0.031 , in a good agreement with the experimental slope of 0.037 (Figure 7).
Equation (9) can be then modified as [57]
d l n G d l n V = α β r i 1 .
With β and r i given above, one arrives at d l n G / d l n V = 32 , rather close to the experimental value d l n G / d l n V = 25 reported in Ref. [58] for the same glass.
For the density change upon crystallization, the IT gives [57]
Δ ρ ρ c r y s t = ( r i 1 ) α β l n μ G ,
where Δ ρ = ρ c r y s t ρ with ρ and ρ c r y s t being the densities of glass and maternal crystal, respectively. It is seen that, if the relaxation volume r i > 1 , the density change Δ ρ / ρ > 0 upon crystallization. It was shown that Equation (11) then provides a reasonable explanation of crystallization-induced density changes of Zr-based MGs [57]. However, for loosely packed crystalline structures, one can expect that the relaxation volume r i is less than unity. In this case, Equation (11) predicts a decrease of the density upon crystallization. Indeed, the literature gives a few examples of crystallization-induced density decrease of about 1% [59,60] or even more [61,62].
For warming up from room to the temperature of the full crystallization, the above reasoning leads to the relationship
Δ ρ ( T ) ρ r t = r i 1 α β l n μ r t G r t G ( T ) μ ( T ) ,
where Δ ρ ( T ) is the density change upon heating. It was shown that this equation provides a good description of Δ ρ / ρ -changes occurring upon heating up to the temperature of the full crystallization [63]. It can be concluded that changes of the density are controlled by the shear moduli of glass and maternal crystal, which in turn reflect the evolution of the interstitial-type defect system.

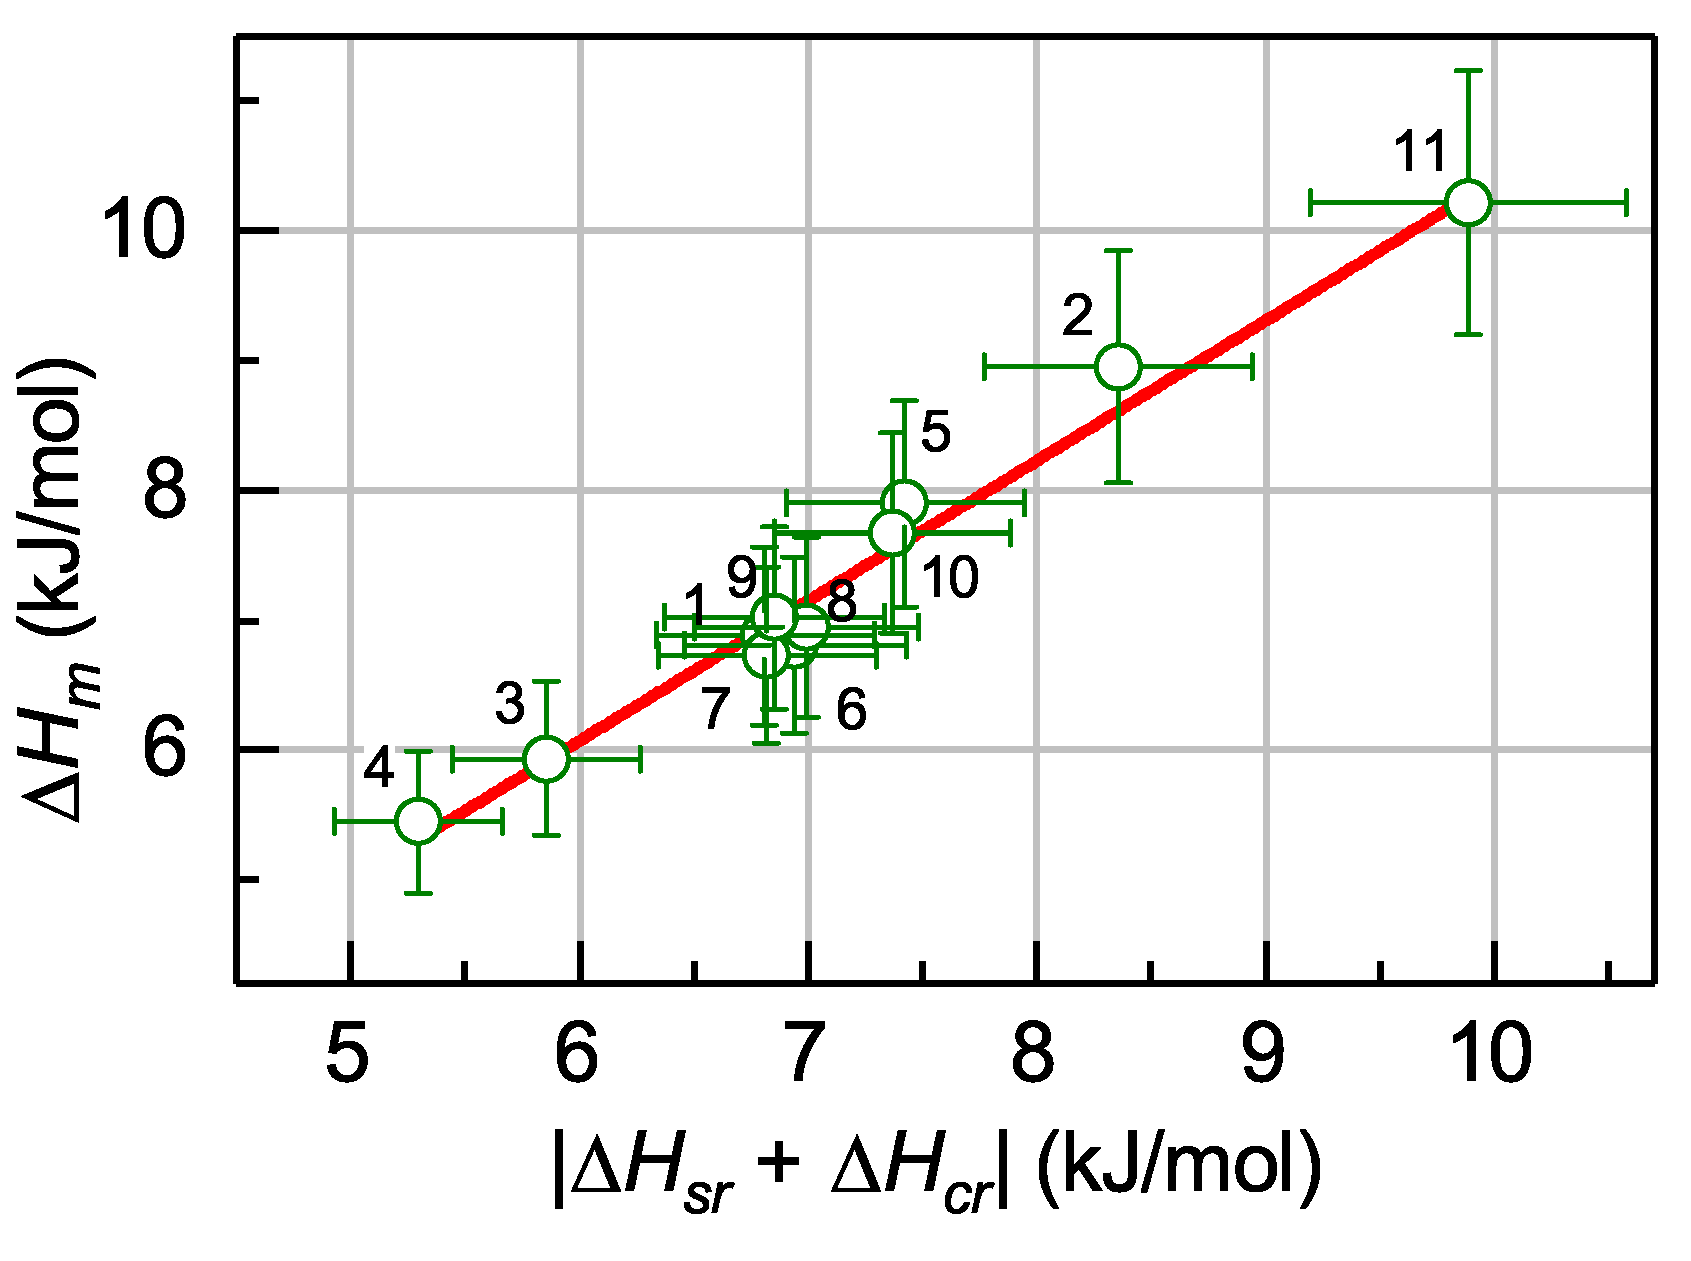
5.4. Relation between the Enthalpies of Relaxation, Crystallization and Melting

According to the general IT approach discussed above (Section 2), the interstitial-type defects in glass are inherited from the melt. Provided that the melt quenching rate is big enough, one can expect that the defect concentrations in the glass and melt are nearly equal, c g l a s s c m e l t . The quantity c g l a s s determines the whole excess heat content (enthalpy) of the glass. Subsequent structural relaxation below T g leads to a decrease of this concentration by Δ c r e l that results in a growth of the shear modulus from G up to G r e l = G e x p ( α β Δ c r e l ) and corresponding release of the enthalpy Δ H r e l . Upon crystallization, the remaining defect concentration c m e l t Δ c r e l c c r y s t drops down to zero (the defects disappear), the shear modulus increases up to its value μ in the crystalline state with simultaneous release of the enthalpy Δ H c r y s t . The whole heat release of the initial glass after crystallization is then given by Equation (5), where Δ U Δ H c r y s t , as discussed above (Section 3.5). Since the defect concentration quenched-in from the melt is c m e l t Δ c r e l + c c r y s t , the heat absorbed upon melting should be approximately equal to the total heat release upon structural relaxation and crystallization , i.e., in terms of the corresponding enthalpy changes,
Δ H m e l t Δ H c r y s t + Δ H r e l .
The result of a specially designed experiment [64] aimed at the verification of this relationship is reproduced in Figure 8, which shows that the data taken on eleven Zr-, Pd- and La-based MGs can be approximated by a straight line with the unity slope. Thus, the relationship in Equation (13) is indeed valid within the experimental error (about 10%) confirming the idea on a connection between the defects occurring upon melting of the maternal crystal and those disappearing upon structural relaxation and crystallization of the glass.

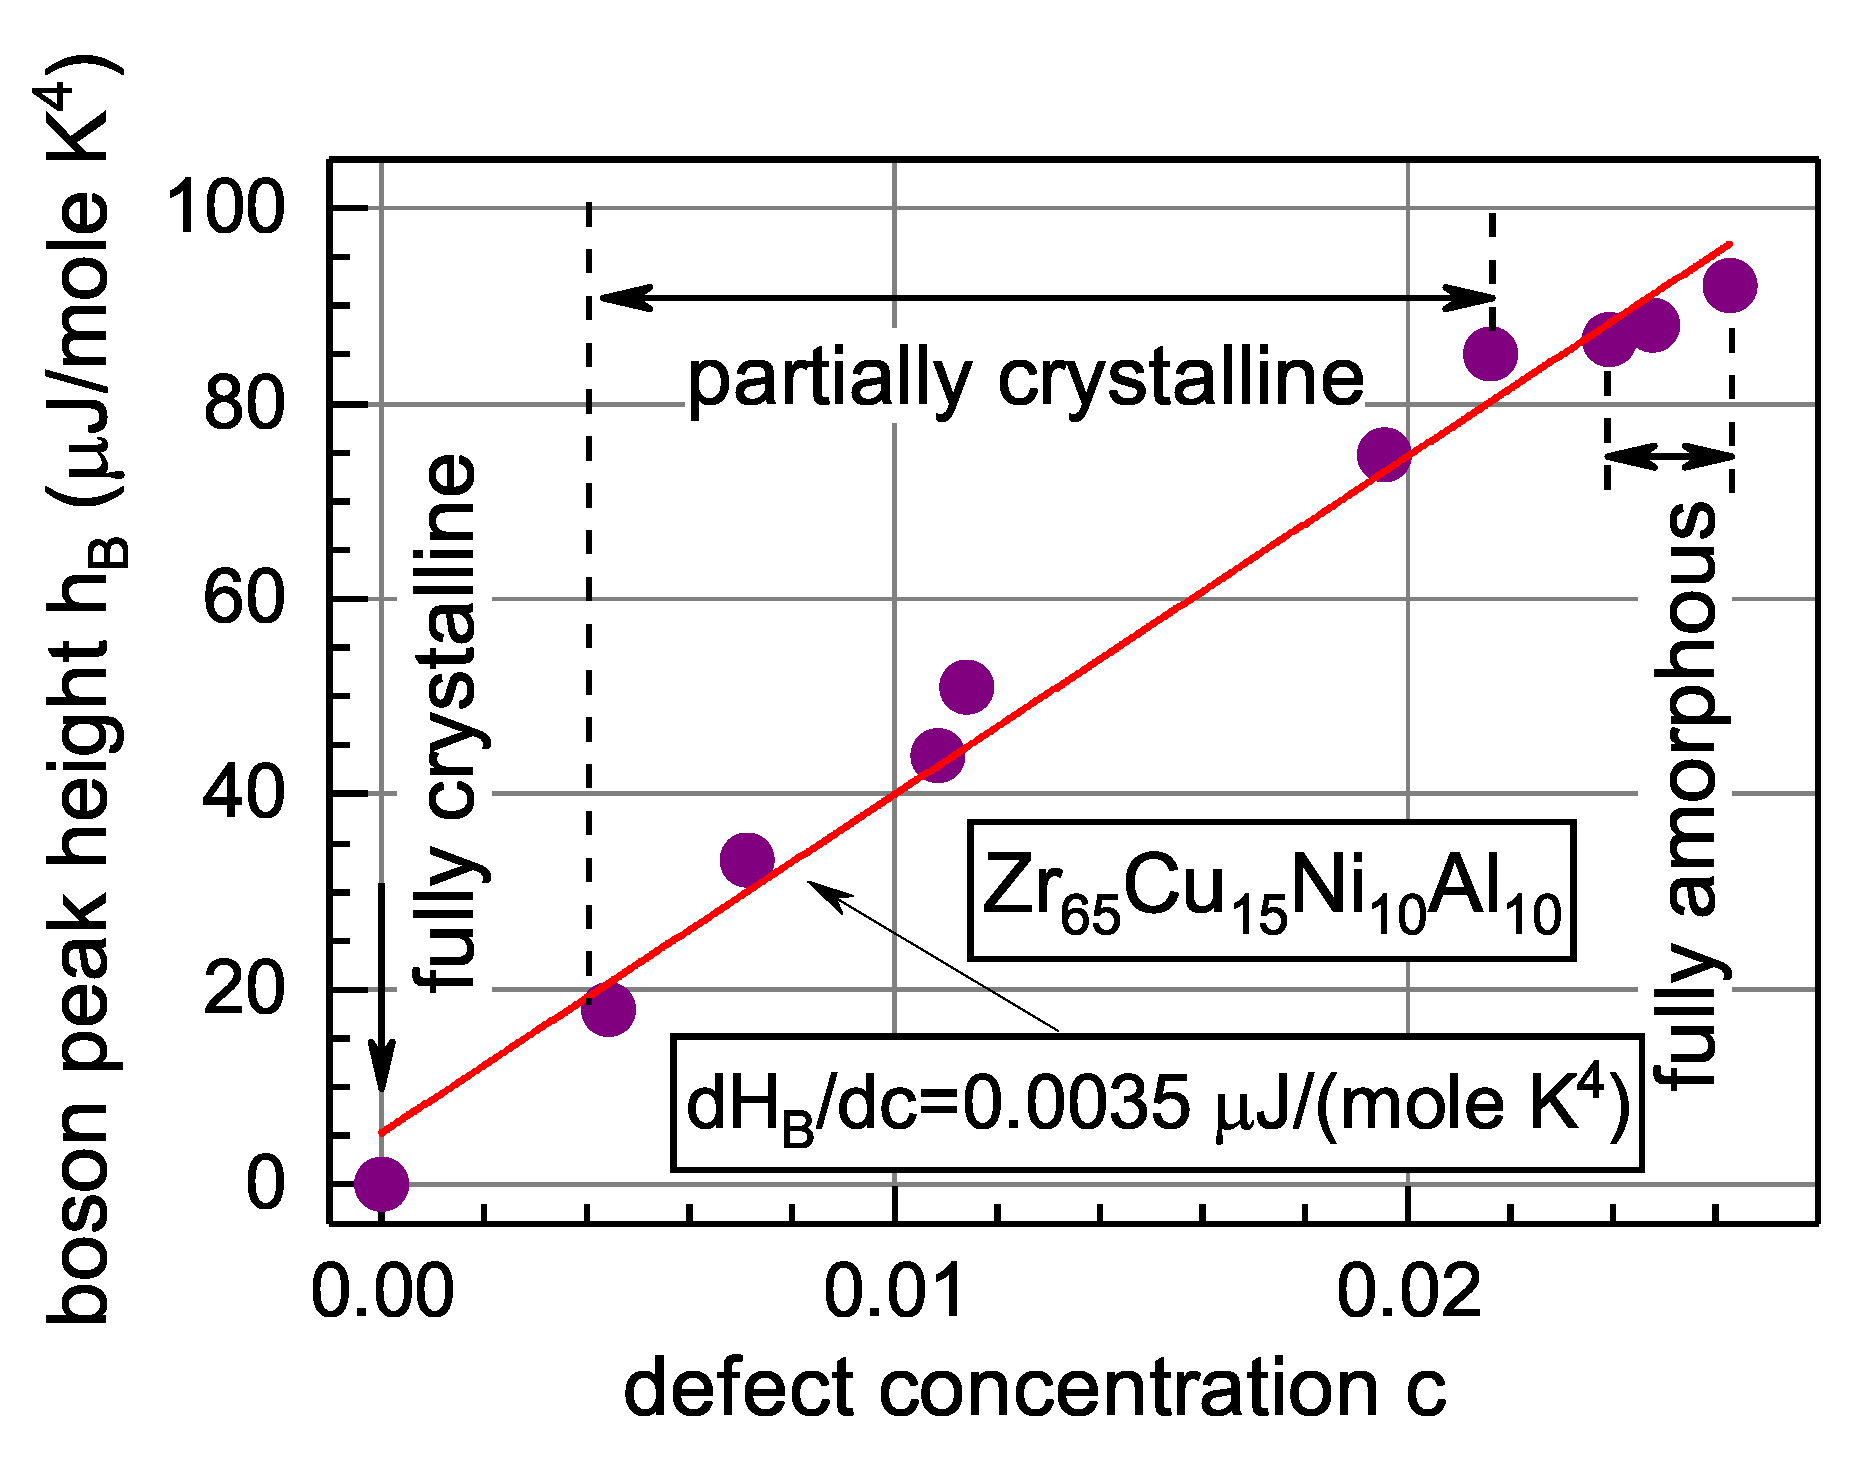
5.5. Relation of the Boson Heat Capacity Peak to the Defect Structure

A peculiar universal feature of atomic dynamics in non-crystalline materials consists in the presence of excess (over the Debye contribution) low-frequency vibrational modes [65,66]. These low-frequency modes are detected as a peak in the low temperature (5–15 K) heat capacity C plotted as C / T 3 vs. T. These features are usually referred to as the boson peak, which is known for metallic glasses as well [67]. The nature of the boson peak constitutes a matter of intensive ongoing debates [68,69,70,71]. Granato argued that the boson peak originates from low-frequency resonance vibration modes of interstitial-type defects frozen-in upon glass production [72]. He showed that the boson peak height should be proportional to the defect concentration. A refined equation for the boson peak height has the form [73]
h B = C d T B 3 = 234 R Θ D 3 0.09 f ω D ω r 3 + 3 2 β c Γ c ,
where T B is the boson peak temperature, C d is the heat capacity related to the interstitial-type defect system, Θ D and ω D are the Debye temperature and Debye frequency of the maternal crystal, respectively, ω r is the characteristic frequency of interstitial resonance vibrations, f is the number of resonance modes per interstitial-type defect, R is the universal gas constant and other quantities are specified above. The defect concentration c can be monitored by measurements of the shear moduli of glass and maternal crystal as implied by Equation (2). Thus, the boson peak within the framework of the IT is considered to be a “fingerprint” of the defect glass structure.
An experiment aimed to check the prediction given by Equation (14) was carried out on glassy Z r 65 C u 15 N i 10 A l 10 [73]. The main result of this experiment is shown in Figure 9, which gives the measured height of the boson peak as a function of the defect concentration c calculated with Equation (2) using room-temperature measurements of the shear modulus after different annealing treatments. The annealing protocol was designed to perform measurements on both fully amorphous and partially crystalline samples. It is seen that independent of the state of the samples (amorphous/partially crystalline), the boson peak height linearly increases with the defect concentration, in line with Granato’s prediction [72]. The derivative d h B / d c calculated from Figure 9 provides reasonable estimates for the resonant vibration frequencies of the defects assumed to be responsible for the boson peak [73].
On the other hand, since the interstitial-type defect structure determines the excess enthalpy Δ H of glass, as discussed above in Section 5.3, one can expect that the boson peak height h B should also be related to Δ H . The calculation gives the relation between the boson peak height and excess enthalpy of glass Δ H as [74]
h B = Γ α β l n μ μ ρ β Δ H ,
where the quantity Γ is defined by Equation (14), ρ is the density, and μ , α and β are same as in Equation (2). The relationship in Equation (15) directly connects the boson peak height with the excess enthalpy of the glass. The latter may be considered as an independent variable, which can be changed by the annealing leading to either structural relaxation within the glassy state or partial crystallization. Using differential scanning calorimetry, the excess enthalpy can be determined as Δ H = T ˙ 1 T i T f W ( T ) d T , where W is the heat flow measured by the calorimeter, T ˙ is the heating rate, T i can be accepted equal to room temperature and T f is the temperature leading to the full crystallization. Figure 10 shows the dependence of the boson peak height h B calculated using Equation (15) together with the experimental h B -data as function of the variable l n μ / ( μ ρ β Δ H ) [74]. It is seen, first, that the calculated and experimental h B -points are quite close. The experimental dependence h B ( Δ H ) nicely falls onto a straight line and the slope of this dependence equals to ( 5.14 ± 0.29 ) × 10 4 J/(mol × K 4 ) . This agrees with this slope given by Equation (15) as Γ α β = 4.9 × 10 4 J/(mol × K 4 ) . Thus, the IT-based approach reproduces the boson peak height and provides a good description of its height on the excess enthalpy of the glass.
An interesting study of the boson peak was recently reported by Brink et al. [75]. They performed a molecular dynamic simulation of an equiatomic CuNiCoFe alloy in the crystalline and amorphous states alternatively with chemical disorder (high-entropy state), structural disorder and reduced density. They found that the density reduction and fluctuations of the elastic constants cannot be responsible for the boson peak. However, they revealed that the boson peak in the crystal increases with the concentration of dumbbell interstitials while other defects (e.g., dislocations) do not contribute to it. Interstitial atoms even at a small concentration lead to a boson peak, which is close to that in the glass of the same composition. At that, the vibrational modes of interstitial defects in the crystal resemble those of glass. Finally, the authors of [75] concluded that the softened regions provided by interstitials resemble the “soft spots” discussed in the literature on MGs [70,76] and the boson peak is due to quasi-localized defect-related modes.

5.6. Relation between the Properties of Glass and Maternal Crystal

In general, one can expect that the physical properties of MGs should be somehow related with the properties of their maternal crystalline states, which were used for the production of these glasses by melt quenching. Indeed, for instance, the properties of PdNiCuP glasses and their relaxation upon annealing should necessarily be related to the properties of intermetallic and/or metal-phosphide crystalline phases. To our knowledge, however, this issue was not raised in the literature.
Meanwhile, the IT is intrinsically based on the crystal→glass relationship. It starts from the main IT equation for the shear modulus of the glass G, which is scaled by the shear modulus of the maternal crystal μ (defectless state) as G = μ e x p ( α β c ) . That is why the shear moduli of glass and maternal crystal determine major thermodynamic parameters of the glass, including its excess internal energy (≈enthalpy) as given by Equation (5). As a result, the shear moduli G and μ explicitly enter all relations for the heat effects (Equations (4), (6), (8) and (13)), volume relaxations (Equations (9)–(12)) and low temperature excess heat capacity (boson peak) (Equations (14) and (15)). By that, in most cases, one must know not only G and μ at particular temperatures but also their exact temperature dependences, otherwise any quantitative agreement with the experiment cannot be achieved. Temperature dependences of the shear moduli of glass and maternal crystal reflect the interstitial-type defect structure of glass and the physical origin of crystal→glass relationship within the framework of the IT is intrinsically related to this defect structure, which controls the fundamental properties of the glass [77]. In a certain sense (not structural), one can accept Granato’s statement that “… glasses and dense liquids are crystals containing a few percent of interstitials” [78].

6. Development of the Interstitialcy Theory

Despite the amazing matching of the IT predictions with a number of relaxation phenomena in MGs, there exist a few phenomena, which cannot be easily interpreted within the framework of the original Granato’s theory. First, an increase of the apparent defect concentration above T g due to the thermal activation, which follows from the original IT version (e.g., see Figure 10 in Ref. [16]), faces certain difficulties related to the high formation enthalpies necessary for this process. The same issue applies to the understanding of so-called rejuvenation of relaxation properties of MGs by quenching (or even relatively slow cooling) from the supercooled liquid region (i.e., from above T g ) [79,80]. However, this difficulty can be avoided by assuming that an interstitial-type defect in the glass has a few energy states and the transitions between them are accessible by thermal activation. In the original IT version, this possibility was not assumed. One can suggest that the occurrence of a spectrum of energy states is related to the high defect density in the glass and melt, which is estimated to be a few percent [13,16]. Such high density of the defects will result in their strong interaction and this must be taken into account. In Granato’s original approach, the defect interaction was considered only qualitatively.
It is long known from the physics of crystals that this interaction can lead to the formation of interstitial clusters consisting of N individual interstitials, from N = 2 up to N = 7 and even more [23,28,81]. Clustering is energy profitable since the formation enthalpy per interstitial decreases with the number of interstitials [23,81]. The interstitial cluster consisting of N = 7 split interstitials in the FCC lattice represents a perfect icosahedron with < 0 , 0 , 12 , 0 > Voronoi indexes [81], as illustrated by Figure 11 for the FCC cell. Thus, if melting of metallic crystals is related to an increase of the concentration of split interstitials up to a few percent, as considered by the IT, then one can expect the formation of clusters consisting of N = 2 to N = 7 interstitial-type defects. It is to be emphasized in this relation the commonly accepted notion that icosahedral clusters constitute a major structural feature of metallic melts and their concentration increases upon supercooling defining thus the dynamic slowdown of the internal movements and eventual glass formation [7,82].
One can expect, therefore, that the solid glass will contain, first, individual interstitial-type defects (adjacent atoms with < 0 , 2 , 8 , 0 > Voronoi indexes and/or close to them) and their small clusters ( N = 2 , 3 ), which correspond to the defect part of the structure. Larger clusters define the icosahedral-type structural backbone. Thus, the metallic glass constitutes a heterogeneous structure. The properties of the clusters should be evidently dependent on the number N. Specifically, the shear sensitivity B i should decrease with N defining a reduction of the diaelastic effect produced by the clusters. By that, the vibrational entropy of interstitial-type defects in the clusters should decrease due to their interaction leading to the mutual damping of the low-frequency vibration modes, as was qualitatively noted in the original Granato’s model [14]. The quasi-equilibrium balance between all these clusters will be dependent on temperature and thermal prehistory defining the evolution of glass properties [83,84]. Some qualitative estimates of clustering kinetics are given elsewhere [85,86]. Further detailed work in this direction is challenging.

7. Comparison with Other Models

Quite a few models are suggested in the literature for a description of defects in metallic glasses. A common shortage in most of them is the lack of understanding of their nature. However, it turns out that many of these models are quite consistent with the IT, as sketched below.
Egami suggested that the main properties of MGs are determined by the defects, which create shear, hydrostatic compression and/or tension (so-called τ -, p- and n-defects) [8]. Meanwhile, the dumbbell interstitials are featured by the same combination of stresses. Figure 12 shows the changes of the Voronoi polyhedra volume (indicated by the numbers) for a dumbbell interstitial in a Cu crystal with respect to the ideal lattice. It is seen that the interstitial produces both positive and negative changes of the Voronoi polyhedra volume. In other words, the defect creates both hydrostatically compressed and hydrostatically tensioned regions. One can expect that the same should be applicable for an interstitial-type defect in the glass. Taking into account that shear stress field is one of its main characteristics, one can conclude that the defect demonstrates the properties similar to those of Egami’s τ -, p- and n-defects.
It is often mentioned that supercooled liquids contain “strings” (“string-like” solitons), which become frozen in the solid glass [12,87,88,89,90,91]. It is also sometimes said that these defects resemble the signatures of dumbbell interstitials in crystals [33,88]. Meanwhile, the “string” idea is compatible with the IT since a split interstitial in the original Granato’s model was considered as a string segment [13,14]. Similar arguments can be applied for the defects viewed as “shear transformation zones” [3,92], “soft spots” [70,76], “soft zones” [92], “flow units” [10,93], “liquid-like regions” [11], “geometricallly unfavored motifs” [76,94] and “regions with large non-affine displacements” [3,9,76]. Since the region of an interstitial-type defect is characterized by the big shear susceptibility, the shear deformation of the surrounding material upon action of the applied stress is bigger that of the matrix and contains a large non-affine component [41]. Naturally, the above terms (“soft zones”, “liquid-like regions”, etc.) can be applied to this region. It should be noted that these defects also contribute to the low-frequency part of the vibration spectrum of a glassy structure [76,93] similar to what is assumed by the IT.
Another approach to the understanding of defects in MGs is the “free volume” model, which was suggested long ago [1,95,96] and subjected to numerous modifications since then (e.g., Ref. [97]). In this approach, the defects are considered as regions of the reduced density (vacancy-like “free volume”), which affect relaxation and deformation phenomena in MGs. The premise for its popularity consists, on the one hand, in a decreased density of MGs (frozen-in “free volume”) with respect to their maternal crystals and, on the other hand, in the existence of numerous correlations of MGs’ properties with the amount of the “free volume” [98]. Although this model was repeatedly criticized in different directions [5,99], it nonetheless constitutes perhaps the most popular approach. Meanwhile, it is quite compatible with the IT. Indeed, one should recall that the volume change Δ V v upon vacancy formation is Δ V v / Ω = r v + 1 , where r v is the corresponding relaxation volume and Ω is the volume per atom [56]. Taking into account the volume change Δ V i occurring upon interstitial formation (see Section 5.2 above) and accepting, e.g., for Al, r i = 1.9 and r v = 0.38 [24], one can easily arrive to the ratio of the relative volume changes produced by interstitials and vacancies, ( Δ V / V ) i / ( Δ V / V ) v = ( r i 1 ) / ( r v + 1 ) = 1.45 . This means that the volume changes for interstitials and vacancies have the same sign and are quite comparable in the magnitude [100]. Thus, a decrease of the defect concentration within both the free volume model and the IT should lead to the densification of the glass by about the same amount. Moreover, since the free volume in both models is proportional to the number of the defects, one can naturally expect a correlation of material properties with the amount of the free volume. However, there are major differences between these approaches. In the former one, it is the free volume that constitutes the principal source for the property changes. The IT considers the features of the interstitial-type defect (large shear susceptibility, high formation entropy, and specific strain fields) to be of major importance while defect-related volume changes are of secondary relevance. It is also very important that vacancy-like free volume appears to have the spherical symmetry, which is why it should not interact with the external shear stress. Conversely, an interstitial defect is strongly asymmetric (Figure 1b) and constitutes an elastic dipole displaying strong sensitivity to the external shear load. Moreover, if a metallic glass is formed by melting of a loosely packed crystalline structure (related to the generation of interstitial-type defects), the creation of the free volume is not necessary at all. In this case, the density of glass can be even bigger than that of the maternal crystal (see Section 5.2 above) that cannot be understood within the free volume approach.

8. Concluding Remarks

The Interstitialcy Theory (IT) of condensed matter states thermodynamically predicts that melting of simple metallic crystals is related to a rapid increase of the concentration of the interstitial defects in their most stable dumbbell form just near the melting temperature. Recently, rather convincing (although indirect) experimental arguments confirming this hypothesis were obtained. Computer simulations showed that these defects remain identifiable structural objects in the liquid state. Rapid melt quenching freezes them in the solid glass. In the liquid and glassy states, these defects do not have any clear topological pattern as in crystals (two atoms trying to occupy the same lattice site) but nonetheless display all the properties characteristic of dumbbell interstitials in crystals, as confirmed by computer modeling of mono-atomic metallic systems. These properties include strong susceptibility to the applied shear stress, specific strain fields and low-frequency modes in the terahertz vibration spectrum. It is found that rather numerous relaxation phenomena can be understood by assuming that these interstitial-type defects indeed exist in real multicomponent metallic glasses (MGs).
The mathematical formalism of the IT is quite simple and based on the two relations linking the unrelaxed shear modulus, which constitutes the basic thermodynamical parameter of the IT (being the second derivative of the Gibbs free energy with respect to the shear strain), with the formation enthalpy of interstitial-type defects and their concentration. A thermoactivated change of the defect concentration (due to structural relaxation below T g , in the supercooled liquid state or upon crystallization) leads to an alteration of the formation enthalpy and results in numerous heat effects, which are intrinsically related to the relaxation of the shear modulus, as verified by specially designed experiments. On the other hand, changes of the defect concentration lead to certain volume changes, which can also be monitored by the shear modulus relaxation. Accepting reasonable values of the material parameter for the interstitial-type volume relaxation (i.e., the relaxation volume), one can explain the kinetics and final volume changes occurring upon structural relaxation and crystallization.
The IT leads to the conclusion that the excess internal energy and enthalpy of the glassy structure with respect to the maternal crystal is mostly related to the elastic energy of the interstitial-type defect structure frozen-in from the melt upon glass production. The full dissipation of this elastic energy constitutes the heat of crystallization. On the other hand, since the total amount of the defects is determined by the melting, there arises a relationship between the latent heat absorbed upon melting and heat release occurring upon structural relaxation and crystallization, as verified experimentally.
Within the framework of the IT, the low temperature boson heat capacity peak originates from low-frequency resonance vibration modes of interstitial-type defects and, thus, its height should be proportional to the defect concentration. Specially performed experiments showed that this is indeed the case provided that the concentration is derived from measurements of the shear modulus, as assumed by the IT. The defect concentration determines the excess enthalpy of the glass and it is the origin, which defines the observed dependence of the boson peak height on the experimentally measured excess enthalpy.
In general, the obtained results convincingly demonstrate an intrinsic relationship of the shear modulus relaxation with the heat and volume effects occurring upon structural relaxation and crystallization of MGs. At that, the properties of the glass are tightly related with those of the maternal crystal, in line with the basic assumptions of the IT. It has also been shown that other models describing defects and properties of MGs are largely compatible with the IT. The ways for the development of the IT and its relation to other models on defects in MGs are discussed.

Author Contributions

The authors equally contributed to this work.

Funding

This research was supported by the Ministry of Science and Education of the Russian Federation under the grant 3.1310.2017/4.6.

Acknowledgments

The authors are grateful to their colleagues, Yu.P. Mitrofanov, R.A. Konchakov, A.S. Makarov, G.V. Afonin and E.V. Goncharova, for long-term fruitful cooperation.

Conflicts of Interest

The authors declare no conflict of interest.

References

  1. Spaepen, F. A microscopic mechanism for steady state inhomogeneous flow in metallic glasses. Acta Metall. 1977, 25, 407–415. [Google Scholar] [CrossRef]
  2. Argon, A.S. Plastic deformation in metallic glasses. Acta Metall. 1979, 27, 47–58. [Google Scholar] [CrossRef]
  3. Falk, M.L.; Langer, J.S. Dynamics of viscoplastic deformation in amorphous solids. Phys. Rev. E 1998, 57, 7192–7205. [Google Scholar] [CrossRef] [Green Version]
  4. Miracle, D.B. The efficient cluster packing model—An atomic structural model for metallic glasses. Acta Mater. 2006, 54, 4317–4336. [Google Scholar] [CrossRef]
  5. Miracle, D.B.; Egami, T.; Flores, K.M.; Kelton, K.F. Structural aspects of metallic glasses. MRS Bull. 2007, 32, 629–634. [Google Scholar] [CrossRef]
  6. Miracle, D.B.; Greer, A.L.; Kelton, K.F. Icosahedral and dense random cluster packing in metallic glass structures. J. Non-Cryst. Sol. 2008, 354, 4049–4055. [Google Scholar] [CrossRef]
  7. Cheng, Y.Q.; Ma, E. Atomic-level structure and structure–property relationship in metallic glasses. Prog. Mater. Sci. 2011, 56, 379–473. [Google Scholar] [CrossRef]
  8. Egami, T. Atomic level stresses. Prog. Mater. Sci. 2011, 56, 637–653. [Google Scholar] [CrossRef]
  9. Peng, H.L.; Li, M.Z.; Wang, W.H. Structural signature of plastic deformation in metallic glasses. Phys. Rev. Lett. 2011, 106, 135503. [Google Scholar] [CrossRef] [PubMed]
  10. Wang, D.P.; Zhu, Z.G.; Xue, R.J.; Ding, D.W.; Bai, H.Y.; Wang, W.H. Structural perspectives on the elastic and mechanical properties of metallic glasses. J. Appl. Phys. 2013, 114, 173505. [Google Scholar] [CrossRef]
  11. Wang, Z.; Sun, B.A.; Bai, H.Y.; Wang, W.H. Evolution of hidden localized flow during glass-to-liquid transition in metallic glass. Nat. Commun. 2014, 5, 5823. [Google Scholar] [CrossRef]
  12. Zhang, H.; Zhong, C.; Douglas, J.F.; Wang, X.; Cao, Q.; Zhang, D.; Jiang, J.-Z. Role of string-like collective atomic motion on diffusion and structural relaxation in glass forming Cu-Zr alloys. J. Chem. Phys. 2015, 142, 164506. [Google Scholar] [CrossRef]
  13. Granato, A.V. Interstitialcy model for condensed matter states of face-centered-cubic metals. Phys. Rev. Lett. 1992, 68, 974–977. [Google Scholar] [CrossRef]
  14. Granato, A.V. Interstitialcy theory of simple condensed matter. Eur. J. Phys. 2014, 87, 18. [Google Scholar] [CrossRef]
  15. Khonik, V.A. Understanding of the structural relaxation of metallic glasses within the framework of the interstitialcy theory. Metals 2015, 5, 504–529. [Google Scholar] [CrossRef]
  16. Khonik, V.A. Interstitialcy theory of condensed matter states and its application to non-crystalline metallic materials. Chin. Phys. B 2017, 26, 016401. [Google Scholar] [CrossRef]
  17. Holder, J.; Rehn, L.E.; Granato, A.V. Effect of self-interstitials on the elastic constants of copper. Phys. Rev. B 1974, 10, 363–375. [Google Scholar] [CrossRef]
  18. Holder, J.; Granato, A.V.; Rehn, L.E. Experimental evidence for split interstitials in copper. Phys. Rev. Lett. 1974, 32, 1054–1057. [Google Scholar] [CrossRef]
  19. Robrock, K.-H.; Schilling, W. Diaelastic modulus change of aluminum after low temperature electron irradiation. J. Phys. F Metal Phys. 1976, 6, 303–314. [Google Scholar] [CrossRef]
  20. Seitz, F. On the theory of diffusion in metals. Acta Cryst. 1950, 3, 355–363. [Google Scholar] [CrossRef]
  21. Nowick, A.S.; Berry, B.S. Anelastic Relaxation in Crystalline Solids; Academic Press: New York, NY, USA; London, UK, 1972. [Google Scholar]
  22. Schilling, W. Self-interstitial atoms in metals. J. Nucl. Mater. 1978, 69–70, 465–489. [Google Scholar] [CrossRef]
  23. Robrock, K.H. Mechanical Relaxation of Interstitials in Irradiated Metals; Springer: Berlin, Germany, 1990. [Google Scholar]
  24. Wolfer, W.G. Fundamental properties of defects in metals. In Comprehensive Nuclear Materials; Konings, R.J.M., Ed.; Elsevier: New York, NY, USA, 2012. [Google Scholar]
  25. Ma, P.-W.; Dudarev, S.L. Universality of point defect structure in body-centered cubic metals. Phys. Rev. Mater. 2019, 3, 013605. [Google Scholar] [CrossRef]
  26. Ma, P.-W.; Dudarev, S.L. Symmetry-broken self-interstitial defects in chromium, molybdenum, and tungsten. Phys. Rev. Mater. 2019, 3, 043606. [Google Scholar] [CrossRef]
  27. Konchakov, R.A.; Makarov, A.S.; Afonin, G.A.; Kretova, M.A.; Kovelev, N.P.; Khonik, V.A. Relation between the shear and dilatation energy of interstitial defects in metallic crystals. J. Exp. Theor. Phys. Lett. 2019, 109, 473–478. [Google Scholar]
  28. Dederichs, P.H.; Lehman, C.; Schober, H.R.; Scholz, A.; Zeller, R. Lattice theory of point defects. J. Nucl. Mater. 1978, 69–70, 176–199. [Google Scholar] [CrossRef]
  29. Born, M. Thermodynamics of crystals and melting. J. Chem. Phys. 1939, 7, 591–603. [Google Scholar] [CrossRef]
  30. Forsblom, M.; Grimvall, G. How superheated crystals melt. Nat. Mater 2005, 4, 388–390. [Google Scholar] [CrossRef] [PubMed]
  31. Nemilov, S.V. Kinetics of elementary processes in the condensed state. II. Shear relaxation and the equation of state for solids. Russ. J. Phys. Chem. 1968, 42, 726–729. [Google Scholar]
  32. Dyre, J.C.; Olsen, N.B.; Christensen, T. Local elastic expansion model for viscous-flow activation energies of glass-forming molecular liquids. Phys. Rev. B 1996, 53, 2171–2174. [Google Scholar] [CrossRef] [Green Version]
  33. Nordlund, K.; Ashkenazy, Y.; Averback, R.S.; Granato, A.V. Strings and interstitials in liquids, glasses and crystals. Europhys. Lett. 2005, 71, 625–631. [Google Scholar] [CrossRef]
  34. Dyre, J.C. Dominance of shear elastic energy far from a point defect in a solid. Phys. Rev. B 2007, 75, 092102. [Google Scholar] [CrossRef] [Green Version]
  35. Safonova, E.V.; Mitrofanov, Y.P.; Konchakov, R.A.; Vinogradov, A.Y.; Kobelev, N.P.; Khonik, V.A. Experimental evidence for thermal generation of interstitials in a metallic crystal near the melting temperature. J. Phys. Condens. Matter 2016, 28, 215401. [Google Scholar] [CrossRef]
  36. Goncharova, E.V.; Makarov, A.S.; Konchakov, R.A.; Kobelev, N.P.; Khonik, V.A. Premelting generation of interstitial defects in polycrystalline indium. J. Exp. Theor. Phys. Lett 2017, 106, 35–39. [Google Scholar] [CrossRef]
  37. Gottstein, G. Physical Foundations of Materials Science; Springer: Berlin, Germany, 2004. [Google Scholar]
  38. Safonova, E.V.; Konchakov, R.A.; Mitrofanov, Y.P.; Kobelev, N.P.; Vinogradov, A.Yu.; Khonik, V.A. Contribution of interstitial defects and anharmonicity to the premelting increase in the heat capacity of single-crystal aluminum. J. Exp. Theor. Lett. 2016, 103, 765–768. [Google Scholar] [CrossRef]
  39. Kobelev, N.P.; Khonik, V.A. On the enthalpy and entropy of point defect formation in crystals. J. Exp. Theor. Phys. 2018, 126, 340–346. [Google Scholar] [CrossRef]
  40. Konchakov, R.A.; Kobelev, N.P.; Khonik, V.A.; Makarov, A.S. Elastic dipoles in the model of single-crystal and amorphous copper. Phys. Sol. State 2016, 58, 215–222. [Google Scholar] [CrossRef]
  41. Goncharova, E.V.; Konchakov, R.A.; Makarov, A.S.; Kobelev, N.P.; Khonik, V.A. Identification of interstitial-like defects in a computer model of glassy aluminum. J. Phys. Condens. Matter 2017, 29, 305701. [Google Scholar] [CrossRef]
  42. Kobelev, N.P.; Kolyvanov, E.L.; Khonik, V.A. Higher order elastic moduli of the bulk metallic glass Zr52.5Ti5Cu17.9Ni14.6Al10. Phys. Sol. State 2007, 49, 1209–1215. [Google Scholar] [CrossRef]
  43. Kobelev, N.P.; Kolyvanov, E.L.; Khonik, V.A. Higher-order elastic moduli of the metallic glass Pd40Cu30Ni10P20. Phys. Sol. State 2015, 57, 1483–1487. [Google Scholar] [CrossRef]
  44. Konchakov, R.A.; Makarov, A.S.; Afonin, G.V.; Mitrofanov, Y.P.; Kobelev, N.P.; Khonik, V.A. Estimate of the fourth-rank shear modulus in metallic glasses. J. Alloys Compd. 2017, 714, 168–171. [Google Scholar] [CrossRef]
  45. Mitrofanov, Y.P.; Wang, D.P.; Makarov, A.S.; Wang, W.H.; Khonik, V.A. Towards understanding of heat effects in metallic glasses on the basis of macroscopic shear elasticity. Sci. Rep. 2016, 6, 23026. [Google Scholar] [CrossRef]
  46. Makarov, A.S.; Afonin, G.V.; Mitrofanov, Y.P.; Kobelev, N.P.; Khonik, V.A. Heat effects occurring in the supercooled liquid state and upon crystallization of metallic glasses as a result of thermally activated evolution of their defect systems. Phys. Stat. Sol. (A) 2019, submitted. [Google Scholar]
  47. Kobelev, N.P.; Khonik, V.A. Theoretical analysis of the interconnection between the shear elasticity and heat effects in metallic glasses. J. Non-Cryst. Sol. 2015, 427, 184–190. [Google Scholar] [CrossRef]
  48. Afonin, G.V.; Mitrofanov, Y.P.; Makarov, A.S.; Kobelev, N.P.; Wang, W.H.; Khonik, V.A. Universal relationship between crystallization-induced changes of the shear modulus and heat release in metallic glasses. Acta Mater. 2016, 115, 204–209. [Google Scholar] [CrossRef]
  49. Makarov, A.S.; Mitrofanov, Y.P.; Afonin, G.V.; Kobelev, N.P.; Khonik, V.A. Shear susceptibility—A universal integral parameter relating the shear softening, heat effects, anharmonicity of interatomic interaction and “defect” structure of metallic glasses. Intermetallics 2017, 87, 1–5. [Google Scholar] [CrossRef]
  50. Kobelev, N.P.; Khonik, V.A.; Makarov, A.S.; Afonin, G.V.; Mitrofanov, Yu.P. On the nature of heat effects and shear modulus softening in metallic glasses: A generalized approach. J. Appl. Phys. 2014, 115, 033513. [Google Scholar] [CrossRef]
  51. Makarov, A.S.; Mitrofanov, Y.P.; Afonin, G.V.; Kobelev, N.P.; Khonik, V.A. Predicting temperature dependence of the shear modulus of metallic glasses using calorimetric data. Scr. Mater. 2019, 168, 10–13. [Google Scholar] [CrossRef]
  52. Makarov, A.S.; Afonin, G.V.; Mitrofanov, Y.P.; Konchakov, R.A.; Kobelev, N.P.; Qiao, J.C.; Khonik, V.A. Relationship between the heat effects and shear modulus changes occurring upon heating of a metallic glass into the supercooled liquid state. J. Non-Cryst. Sol. 2018, 500, 129–132. [Google Scholar] [CrossRef]
  53. Mitrofanov, Y.P.; Afonin, G.V.; Makarov, A.S.; Kobelev, N.P.; Khonik, V.A. A new understanding of the sub-Tg enthalpy relaxation in metallic glasses. Intermetallics 2018, 101, 116–122. [Google Scholar] [CrossRef]
  54. Chen, H.S. On mechanisms of structural relaxation in a Pd48Ni32P20 glass. J. Non-Cryst. Sol. 1981, 46, 289–305. [Google Scholar] [CrossRef]
  55. Busch, R.; Johnson, W.L. The kinetic glass transition of the Zr46.75Ti8.25Cu7.5Ni10Be27.5 bulk metallic glass former-supercooled liquids on a long time scale. Appl. Phys. Lett. 1998, 72, 2695–2697. [Google Scholar] [CrossRef]
  56. Gordon, C.A.; Granato, A.V.; Simmons, R.O. Evidence for the self-interstitial model of liquid and amorphous states from lattice parameter measurements in krypton. J. Non-Cryst. Sol. 1996, 205–207, 216–220. [Google Scholar] [CrossRef]
  57. Goncharova, E.V.; Konchakov, R.A.; Makarov, A.S.; Kobelev, N.P.; Khonik, V.A. On the nature of density changes upon structural relaxation and crystallization of metallic glasses. J. Non-Cryst. Sol. 2017, 471, 396–399. [Google Scholar] [CrossRef]
  58. Harms, U.; Jin, O.; Schwarz, R.B. Effects of plastic deformation on the elastic modulus and density of bulk amorphous Pd40Cu30Ni10P20. Non-Cryst. Sol. 2003, 317, 200–205. [Google Scholar] [CrossRef]
  59. Shen, T.D.; Harms, U.; Schwarz, R.B. Correlation between the volume change during crystallization and the thermal stability of supercooled liquids. Appl. Phys. Lett. 2003, 83, 4512–4514. [Google Scholar] [CrossRef]
  60. Safarik, D.J.; Schwarz, R.B. Elastic constants of amorphous and single-crystal Pd40Cu40P20. Acta Mater. 2007, 55, 5736–5746. [Google Scholar] [CrossRef]
  61. Panova, G.K.; Chernoplekov, N.A.; Shikov, A.A.; Savel’ev, B.I.; Khlopkin, M.N. Effects of amorphization on the vibrational specific heat of metallic glasses. Sov. Phys. JETP 1985, 61, 595–598. [Google Scholar]
  62. Zhao, Y.; Zhang, B.; Sato, K. Unusual volume change associated with crystallization in Ce-Ga-Cu bulk metallic glass. Intermetallics 2017, 88, 1–5. [Google Scholar] [CrossRef]
  63. Makarov, A.S.; Mitrofanova, Y.P.; Konchakov, R.A.; Kobelev, N.P.; Csach, K.; Qiao, J.C.; Khonik, V.A. Density and shear modulus changes occurring upon structural relaxation and crystallization of Zr-based bulk metallic glasses: In situ measurements and their interpretation. J. Non-Cryst. Sol. 2019. submitted. [Google Scholar]
  64. Afonin, G.V.; Mitrofanov, Y.P.; Kobelev, N.P.; da Silva Pinto, M.W.; Wilde, G.; Khonik, V.A. Relationship between the enthalpies of structural relaxation, crystallization and melting in metallic glass-forming systems. Scr. Mater. 2019, 166, 6–9. [Google Scholar] [CrossRef]
  65. Philips, W.A. Amorphous Solids: Low Temperature Properties; Springer: Berlin, Germany, 1981. [Google Scholar]
  66. Gil, L.; Ramos, M.A.; Bringer, A.; Buchenau, U. Low-temperature specific heat and thermal conductivity of glasses. Phys. Rev. Lett. 1993, 70, 182–185. [Google Scholar] [CrossRef]
  67. Li, Y.; Bai, H.Y.; Wang, W.H.; Samwer, K. Low-temperature specific-heat anomalies associated with the boson peak in CuZr-based bulk metallic glasses. Phys. Rev. B 2006, 74, 052201. [Google Scholar] [CrossRef]
  68. Zorn, R. The boson peak demystified? Physics 2011, 4, 44. [Google Scholar] [CrossRef]
  69. Shintani, H.; Tanaka, H. Universal link between the boson peak and transverse phonons in glass. Nat. Mater. 2008, 7, 870–877. [Google Scholar] [CrossRef]
  70. Sheng, H.; Ma, E.; Kramer, M. Relating dynamic properties to atomic structure in metallic glasses. JOM 2012, 64, 856–881. [Google Scholar] [CrossRef]
  71. Jakse, N.; Nassour, A.; Pasturel1, A. Structural and dynamic origin of the boson peak in a Cu-Zr metallic glass. Phys. Rev. B 2012, 85, 174201. [Google Scholar] [CrossRef]
  72. Granato, A.V. Interstitial resonance modes as a source of the boson peak in glasses and liquids. Physica B 1996, 219–220, 270–272. [Google Scholar] [CrossRef]
  73. Khonik, V.A.; Kobelev, N.P.; Mitrofanov, Y.P.; Zakharov, K.V.; Vasiliev, A.N. Boson heat capacity peak in metallic glasses: Evidence of the same defect-induced heat absorption mechanism in structurally relaxed and partially crystallized states. Phys. Stat. Sol. RRL 2018, 12, 1700412. [Google Scholar] [CrossRef]
  74. Mitrofanov, Y.P.; Makarov, A.S.; Afonin, G.V.; Zakharov, K.V.; Vasiliev, A.N.; Kobelev, N.P.; Wilde, G.; Khonik, V.A. Relationship between the boson heat capacity peak and the excess enthalpy of a metallic glass. Phys. Stat. Sol. RRL 2019, 1900046. [Google Scholar] [CrossRef]
  75. Brink, T.; Koch, L.; Albe, K. Structural origins of the boson peak in metals: From high-entropy alloys to metallic glasses. Phys. Rev. B 2016, 94, 224203. [Google Scholar] [CrossRef] [Green Version]
  76. Ding, J.; Patinet, S.; Falk, M.L.; Cheng, Y.; Ma, E. Soft spots and their structural signature in a metallic glass. Proc. Natl. Acad. Sci. USA 2014, 111, 14052. [Google Scholar] [CrossRef]
  77. Mitrofanov, Y.P.; Kobelev, N.P.; Khonik, V.A. On the relationship of the properties of metallic glasses and their maternal crystals. Phys. Sol. State 2019, 61, 962–968. [Google Scholar]
  78. Granato, A.V. Self-interstitials as basic structural units if liquids and glasses. J. Phys. Chem. Sol. 1994, 55, 931–939. [Google Scholar] [CrossRef]
  79. Wakeda, M.; Saida, J.; Li, J.; Ogata, S. Controlled rejuvenation of amorphous metals with thermal processing. Sci. Rep. 2015, 5, 10545. [Google Scholar] [CrossRef]
  80. Guo, W.; Yamada, R.; Saida, J.; Lü, S.; Wu, S. Thermal rejuvenation of a heterogeneous metallic glass. J. Non-Cryst. Sol. 2018, 498, 8–13. [Google Scholar] [CrossRef]
  81. Ingle, W.; Perrin, R.C.; Schober, H.R. Interstitial cluster in FCC metals. J. Phys. F Met. Phys. 1981, 11, 1161–1173. [Google Scholar] [CrossRef]
  82. Greer, A.L. Metallic glasses. In Physical Metallurgy; Laughlin, D.E., Hono, K., Eds.; Elsevier: Oxford, UK, 2014; Volume I, pp. 305–385. [Google Scholar]
  83. Cheng, Y.Q.; Cao, A.J.; Ma, E. Correlation between the elastic modulus and the intrinsic plastic behavior of metallic glasses: The roles of atomic configuration and alloy composition. Acta Mater. 2009, 57, 3253–3267. [Google Scholar] [CrossRef]
  84. Ding, J.; Cheng, Y.Q.; Ma, E. Full icosahedra dominate local order in Cu64Zr34 metallic glass and supercooled liquid. Acta Mater. 2014, 69, 343–354. [Google Scholar] [CrossRef]
  85. Mitrofanov, Y.P.; Kobelev, N.P.; Khonik, V.A. Different metastable equilibrium states in metallic glasses occurring far below and near the glass transition. J. Non-Cryst. Sol. 2018, 497, 48–55. [Google Scholar] [CrossRef]
  86. Makarov, A.S.; Afonin, G.V.; Mitrofanov, Y.P.; Konchakov, R.A.; Kobelev, N.P.; Qiao, J.C.; Khonik, V.A. Evolution of the activation energy spectrum and defect concentration upon structural relaxation of a metallic glass determined using calorimetry and shear modulus data. J. Alloys Comp. 2018, 745, 378–384. [Google Scholar] [CrossRef]
  87. Donati, C.; Glotzer, S.C.; Poole, P.H.; Kob, W.; Plimpton, S.J. Spatial correlations of mobility and immobility in a glass-forming Lennard-Jones liquid. Phys. Rev. E 1999, 60, 3107–3119. [Google Scholar] [CrossRef] [Green Version]
  88. Oligschleger, C.; Schober, H.R. Collective jumps in a soft-sphere glass. Phys. Rev. B 1999, 59, 811–821. [Google Scholar] [CrossRef] [Green Version]
  89. Schober, H.R. Collectivity of motion in undercooled liquids and amorphous solids. J. Non-Cryst. Sol. 2002, 307–310, 40–49. [Google Scholar] [CrossRef]
  90. Betancourt, B.A.P.; Douglas, J.F.; Starr, F.W. String model for the dynamics of glass-forming liquids. J. Chem. Phys. 2014, 140, 204509. [Google Scholar] [CrossRef] [Green Version]
  91. Wang, Y.-J.; Du, J.-P.; Shinzato, S.; Dai, L.-H.; Ogata, S. A free energy landscape perspective on the nature of collective diffusion in amorphous solids. Acta Mater. 2018, 157, 165–173. [Google Scholar] [CrossRef] [Green Version]
  92. Li, W.; Gao, Y.; Bei, H. On the correlation between microscopic structural heterogeneity and embrittlement behavior in metallic glasses. Sci. Rep. 2015, 5, 14786. [Google Scholar] [CrossRef]
  93. Liu, S.T.; Li, F.X.; Li, M.Z.; Wang, W.H. Structural and dynamical characteristics of flow units in metallic glasses. Sci. Rep. 2017, 7, 11558. [Google Scholar] [CrossRef] [Green Version]
  94. Ma, E. Tuning order in disorder. Nat. Mater. 2015, 14, 547–552. [Google Scholar] [CrossRef]
  95. van den Beukel, A.; Radelaar, S. On the kinetics of structural relaxation in metallic glasses. Acta Metall. 1983, 31, 419–427. [Google Scholar] [CrossRef]
  96. van den Beukel, A.; Sietsma, J. The glass transition as a free volume related kinetic phenomenon. Acta Met. Mater. 1990, 38, 383–389. [Google Scholar] [CrossRef]
  97. Spaepen, F. Homogeneous flow of metallic glasses: A free volume perspective. Scr. Mater. 2006, 54, 363–367. [Google Scholar] [CrossRef]
  98. Wang, W.H. The elastic properties, elastic models and elastic perspectives of metallic glasses. Prog. Mater. Sci. 2012, 57, 487–656. [Google Scholar] [CrossRef]
  99. Cheng, Y.Q.; Ma, E. Indicators of internal structural states for metallic glasses: Local order, free volume, and configurational potential energy. Appl. Phys. Lett. 2008, 93, 051910. [Google Scholar] [CrossRef]
  100. Khonik, V.A.; Kobelev, N.P. Alternative understanding for the enthalpy vs. volume change upon structural relaxation of metallic glasses. J. Appl. Phys. 2014, 115, 093510. [Google Scholar] [CrossRef]
Figure 1. Octahedral (a) and dumbbell (split) (b) interstitial defects in a computer model of a face-centered cubic lattice [27]. All of the dumbbell atoms (marked by red circles) are characterized by < 0 , 2 , 8 , 0 > Voronoi indexes. With permission from JETP Letters, 2019.
Metals 09 00605 g001
Figure 2. Histogram illustrating the distribution of the ratio of dilatation U b u l k and shear U s h e a r components of the elastic energy for dumbbell interstitials in 63 polycrystalline elemental metals. The same data for interstitial-type defects in 189 metallic glasses are also shown [27]. With permission from JETP Letters, 2019.
Metals 09 00605 g002
Figure 3. Estimates of interstitial and vacancy concentrations in crystalline aluminum (a) and indium (b) derived from the diaelastic effect measurements. The melting temperatures are indicated [35,36]. With permission from Pleiades Publishing, LTD, 2019.
Metals 09 00605 g003
Figure 4. Temperature dependences of the quantities Δ W and Δ G / T entering Equation (6) derived from calorimetric and shear modulus measurements [49]. The data correspond to structural relaxation below the glass transition. With permission from Elsevier, 2019.
Metals 09 00605 g004
Figure 5. Experimental and calculated using Equation (7) temperature dependences of the shear modulus G of glassy Zr65Cu15Al10Ni10 in the initial and relaxed states. Temperature dependence of the shear modulus μ after full crystallization is also shown. Calorimetric T g is indicated by the arrow [51]. With permission from Elsevier, 2019.
Metals 09 00605 g005
Figure 6. Dependence of the integral heat Q absorbed upon heating from 330 K to 610 K (supercooled liquid region) as a function of the shear modulus G 330 measured at 330 K just after heating onset. The points correspond to different preannealing treatment applied for shear modulus measurements and DSC tests as indicated. The solid line gives the lest square fit [52]. With permission from Elsevier, 2019.
Metals 09 00605 g006
Figure 7. Dependence of the relative density change on the quantity l n ( G / G 0 ) , where G 0 is the initial room-temperature shear modulus and G is the room-temperature shear modulus after annealing of bulk glassy P d 40 C u 30 N i 10 P 20 at T = 533 K [57]. With permission from Elsevier, 2019.
Metals 09 00605 g007
Figure 8. The melting enthalpy vs. the absolute value of sum of the enthalpies of structural relaxation and crystallization. The numbers correspond to different Zr-, Pd- and La-based MGs [64]. With permission from Elsevier, 2019.
Metals 09 00605 g008
Figure 9. The height of the boson peak as a function of the defect concentration c calculated using Equation (2). The line gives the least square fit [73]. With permission from John Wiley and Sons, 2019.
Metals 09 00605 g009
Figure 10. Experimental and calculated height of the boson peak h B as a function of the excess enthalpy Δ H plotted according to Equation (15). The numbers near the data points indicate the corresponding preannealing temperatures in Kelvins [74]. With permission from John Wiley and Sons, 2019.
Metals 09 00605 g010
Figure 11. Formation of a perfect icosahedron by the creation of dumbbell interstitials on the opposite faces of the FCC cell: (Left) elementary FCC cell where the arrows show how two atoms are inserted instead of one atom; and (Right) perfect icosahedron with < 0 , 0 , 12 , 0 > Voronoi indexes formed by six dumbbell interstitials on the faces of the cell and one interstitial in the octahedral position (i.e., in center of the cell, see Figure 1a) [81].
Metals 09 00605 g011
Figure 12. Dumbbell [001]-oriented interstitial (two red circles) and the relative changes of the volume of the Voronoi polyhedra Δ V / V (indicated by the numbers) as compared with the ideal lattice for the atoms (shaded circles) in a copper crystal. Δ V / V -changes are shown along the dumbbell axis, perpendicular to it and in the [111] direction. It is seen that the defect creates both positive and negative changes of the Voronoi polyhedra volume (i.e., changes of the local density) [27]. With permission from JETP Letters, 2019.
Metals 09 00605 g012
Table 1. Determination of the shear susceptiblity β on the basis of calorimetric and shear modulus data taken on MGs in the initial and relaxed state using Equation (6) [49]. With permission from Elsevier, 2019.
NoMetallic Glass β
1La55Al25Co2021
2Zr46Cu46Al819
3Zr46Cu45Al7Ti221
4Zr56Co28Al1617
5Zr65Al10Ni10Cu1522
6Pd40Ni40P2015
7Pd41.25Cu41.25P17.521
8Pd40Cu30Ni10P2019

