Influence of Niobium or Molybdenum Addition on Microstructure and Tensile Properties of Nickel-Chromium Alloys

Abstract
1. Introduction
2. Materials and Methods
3. Results
4. Discussion
5. Conclusions
Author Contributions
Funding
Acknowledgments
Conflicts of Interest
References
- Bauer, J.R.D.O.; Loguercio, A.D.; Reis, A.; Rodrigues Filho, L.E. Microhardness of Ni-Cr alloys under different casting conditions. Braz. Oral Rev. 2006, 20, 40–46. [Google Scholar] [CrossRef]
- Bezzon, O.L.; Mattos, M.G.; Rollo, J.M.; Panzeri, H. Desenvolvimento de uma liga experimental de Ni-Cr para restaurações metalocerâmicas: Ensaios de dureza e resistência mecânica. Rev. Odontol. Univ. São Paulo 1995, 9, 145–149. [Google Scholar]
- Chen, W.C.; Teng, F.Y.; Hung, C.C. Characterization of Ni–Cr alloys using different casting techniques and molds. Mater. Sci. Eng. C 2014, 35, 231–238. [Google Scholar] [CrossRef] [PubMed]
- Ho, K.H.; Kim, J.H.; Chang, K.; Kwon, J. The role of Cr on oxide formation in Ni-Cr alloys: A theoretical study. Comput. Mater. Sci. 2018, 142, 185–191. [Google Scholar]
- Huang, H.H. Surface characterization of passive film on Ni-Cr based dental casting alloys. Biomaterials 2003, 24, 1575–1582. [Google Scholar] [CrossRef]
- Bezzon, O.L.; de Mattos, M.D.G.; Ribeiro, R.F.; de Almeida Rollo, J.M. Effect of beryllium on the castability and resistance of ceramometal bonds in nickel-chromium alloys. J. Prosthet. Dent. 1998, 80, 5–570. [Google Scholar] [CrossRef]
- Turchi, P.; Kaufman, L.; Liu, Z.K. Modeling of Ni-Cr-Mo based alloys: Part I—Phase Stability. Calphad 2006, 30, 70–87. [Google Scholar] [CrossRef]
- Franke, P.; Neuschütz, D. Scientific Group Thermodata Europe (SGTE) Mo-Ni. In Binary Systems. Part 4: Binary Systems from Mn-Mo to Y-Zr; Franke, P., Neuschütz, D., Eds.; Landolt-Börnstein—Group IV Physical Chemistry (Numerical Data and Functional Relationships in Science and Technology); Springer: Berlin/Heidelberg, Germany, 2006; Volume 19B4. [Google Scholar]
- Wataha, J.C. Biocompatibility of dental casting alloys. Crit. Rev. Oral Biol. Med. 2002, 87, 351–363. [Google Scholar]
- Bania, P.J. Beta titanium alloys and their role in the titanium industry. J. Met. 1994, 46, 16–19. [Google Scholar] [CrossRef]
- Rosenstiel, S.F.; Land, M.F.; Fujimoto, J. Prótese Fixa Contemporânea, 3rd ed.; Editora Santos: São Paulo, Brazil, 2002; p. 868. [Google Scholar]
- Silva, H.M.; Schneider, S.G.; Neto, C.M. Estudo das propriedades mecânicas das ligas Ti-8Nb-13Zr e Ti-18Nb-13Zr para aplicação como biomaterial. Revista Brasileira de Aplicações de Vácuo 2003, 22, 5–7. [Google Scholar]
- Chen, H.; Du, Y.; Xu, H.; Liu, Y.; Schuster, J.C. Experimental investigation of the Nb-Ni phase diagram. J. Mater. Sci. 2005, 40, 6019–6062. [Google Scholar] [CrossRef]
- Du, Y.; Liu, S.; Chang, Y.A.; Yang, Y. A thermodynamic modeling of the Cr–Nb–Ni system. Calphad 2005, 29, 140–148. [Google Scholar] [CrossRef]
- JCPDS: International Centre for Diffraction Date. Powder Diffraction File (Inorganic Phases), 1st ed.; JCPDS, International Centre for Diffraction Date: Swarthmore, PA, USA, 1988; Volume 2. [Google Scholar]
- Kraus, W.; Nolze, G. Powdercell—A program for the representation and manipulation of crystal structures and calculation of the resulting X-ray powder patterns. J. Appl. Crystallogr. 1996, 29, 301–303. [Google Scholar] [CrossRef]
- Rasband, W.S. ImageJ; U. S. National Institutes of Health: Bethesda, MD, USA. Available online: https://imagej.nih.gov/ij/ (accessed on 29 April 2019).
- ASTM E92-97: Standard Test Method for Vickers Hardness of Metallic Materials; ASTM International: West Conshohocken, PA, USA, 1982; pp. 1–9.
- ASTM E8M-00a: Standard Test Methods for Tension Testing of Metallic Materials [Metric]; ASTM International: West Conshohocken, PA, USA, 2001; pp. 1–22.
- Craig, R.G.; Powers, J.M. Restorative Dentals Materials, 11th ed.; Mosby: St. Louis, MO, USA, 2002. [Google Scholar]
- Horasawa, N.; Marek, M. The effect of remolding on corrosion of a silver-palladium alloy. Dent. Mater. 2004, 20, 352–357. [Google Scholar] [CrossRef]
- Stachurski, Z.H. Section 3.4.3—X-ray scattering from a-NiNb alloy. In Fundamentals of Amorphous Solids: Structure and Properties; Higher Education Press, Wiley-VCH Verlag GmbH & Co. KGaA: Weinheim, Germany, 2015; p. 136. [Google Scholar]
- American Society for Metals. Alloy Phase Diagrams; ASM Handbook, Metals Park, Ohio: Russell Township, OH, USA, 2016; Volume 3, pp. 2314–2321. [Google Scholar]
- Holcomb, G.R.; Alman, D.E. The effect of manganese additions on the reactive evaporation of chromium in Ni–Cr alloys. Scr. Mater. 2006, 54, 1821–1825. [Google Scholar] [CrossRef]
- Bauer, J.R.; Reis, A.; Loguercio, A.D.; Filho, L.E. Resistência à tração e alongamento de ligas de Ni-Cr fundidas sob diferentes condições. RPG Rev. Pós. Grad. 2006, 13, 83–88. [Google Scholar]
- Pimenta, A.R.; Diniz, M.G.; Paciornik, S.; Sampaio, C.A.F.; Miranda, M.S.; Paolucci-Pimenta, J.M. Mechanical and Microstructural properties of a nickel-chromium alloy after casting process. RSBO 2012, 9, 17–24. [Google Scholar]
- Olivieri, K.A.N.; Neisser, M.P.; Souza, P.C.; Bottino, M.A. Mechanical properties and micro structural analyses of a Ni-Cr alloy cast under different temperatures. Braz. J. Oral Sci. 2004, 3, 414–419. [Google Scholar]
- Anusavice, K.J. Phillips: Materiais Dentários, 10th ed.; Guanabara Koogan: Rio de Janeiro, Brazil, 1998. [Google Scholar]
- Lass, E.A.; Stoudt, M.R.; Williams, M.E.; Katz, M.B.; Levine, L.E.; Phan, T.Q.; Gnaeupel-Herold, T.H.; Ng, D.S. Formation of the Ni3Nb δ-Phase in Stress-Relieved Inconel 625 Produced via Laser Powder-Bed Fusion Additive Manufacturing. Metall. Trans. A 2017, 48, 5547–5558. [Google Scholar] [CrossRef]


| Element | Ni-20Cr-10Mo | Ni-24Cr-8Nb | Ni-22Cr-10Nb | Ni-20Cr-12Nb | Commercial Alloy |
|---|---|---|---|---|---|
| C | 0.014 | 0. 032 | 0.036 | 0.027 | ND |
| S | 0.011 | 0. 012 | 0.015 | 0.012 | ND |
| N | 0.016 | 0.019 | 0.021 | 0.021 | ND |
| Al | 0.002 | 0.000 | 0.001 | 0.001 | ND |
| Si | 0.170 | 0.220 | 0.210 | 0.170 | ND |
| P | 0.004 | 0.003 | 0.003 | 0.003 | ND |
| Ti | 0.011 | 0.113 | 0.136 | 0.162 | ND |
| V | 0.003 | 0.006 | 0.006 | 0.007 | ND |
| Cr | 21.92 | 24.29 | 22.04 | 20.08 | 19,1 |
| Mn | 0.010 | 0.030 | 0.010 | 0.010 | 0.65 |
| Ni | 69.00 | 66.30 | 66.20 | 65.30 | 70.0 |
| Cu | 0.003 | 0.018 | 0.018 | 0.023 | ND |
| Nb | 0.010 | 8.090 | 9.840 | 11.52 | ND |
| Mo | 9.110 | 0.045 | 0.011 | 0.006 | 4.2 |
| Alloy | C (wt. %) | S (wt. %) | N (wt. %) | O (wt. %) |
|---|---|---|---|---|
| Ni-22Cr-10Mo | 0.020 | 0.020 | 0.016 | 0.099 |
| Ni-20Cr-12Nb | 0.010 | 0.007 | 0.022 | 0.039 |
| Ni-22Cr-10Nb | 0.010 | 0.010 | 0.025 | 0.059 |
| Ni-24Cr-8Nb | 0.020 | 0.099 | 0.019 | 0.054 |
| Commercial | 0.260 | 0.002 | 0.032 | 0.027 |
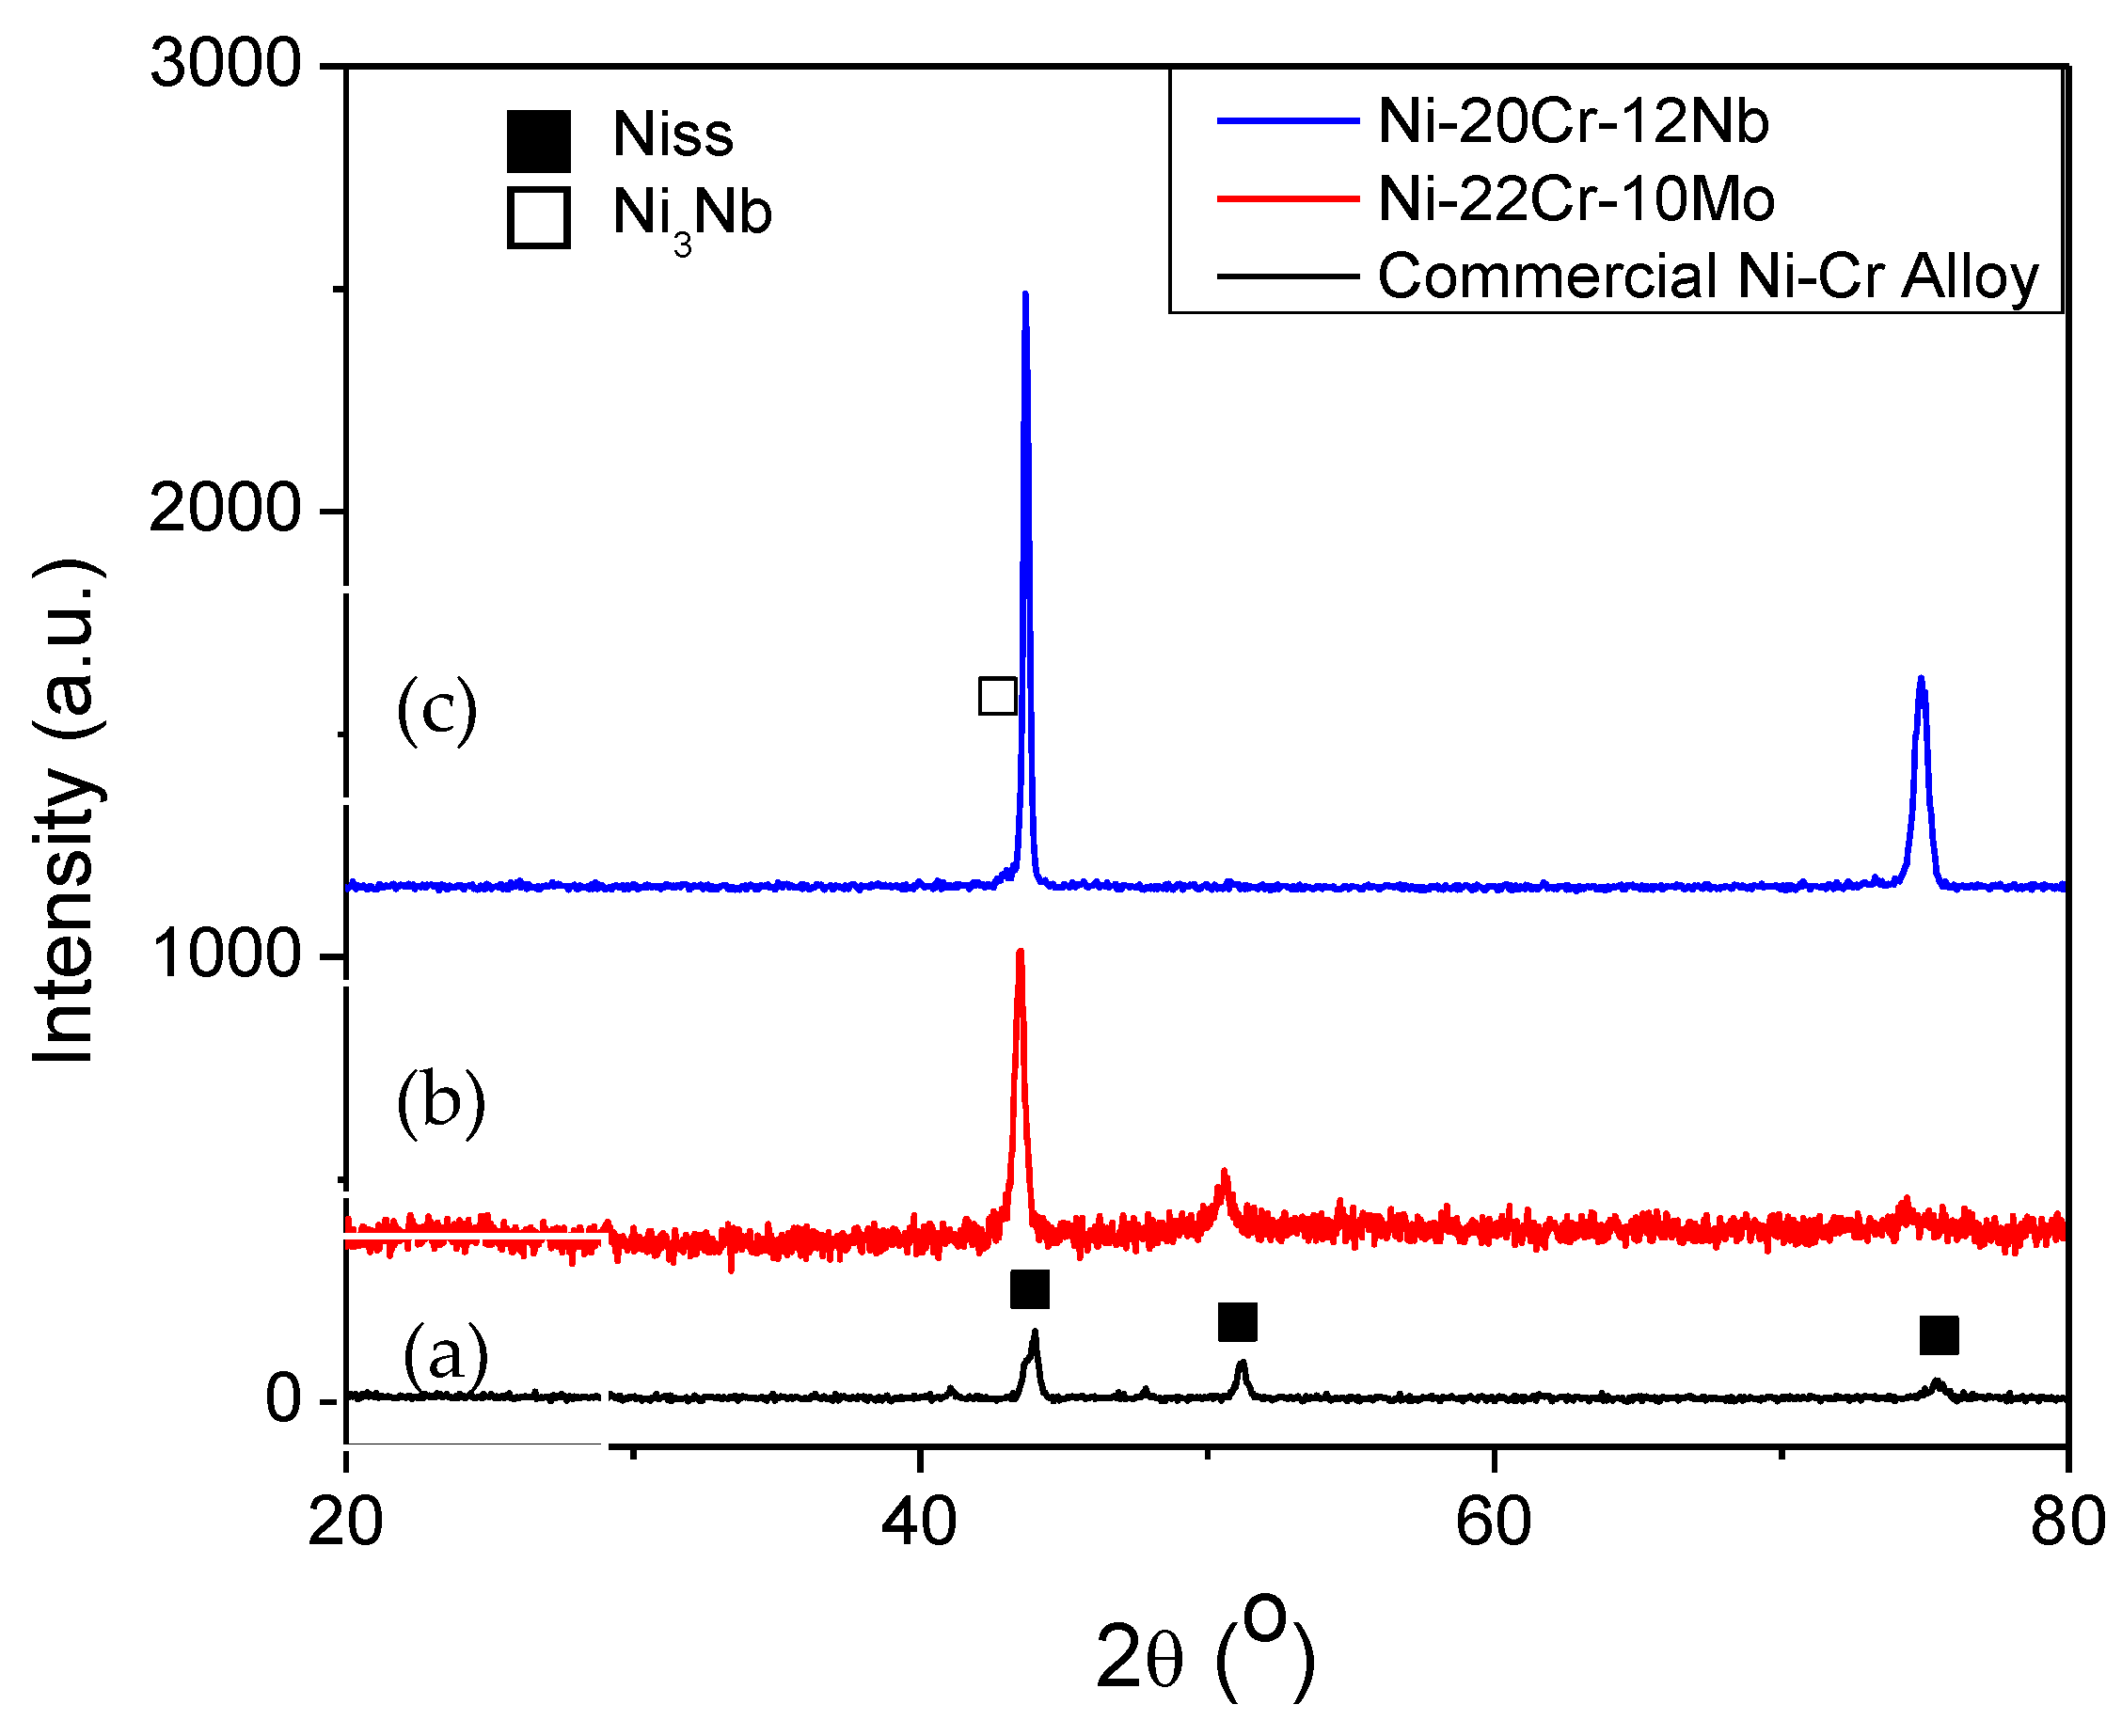
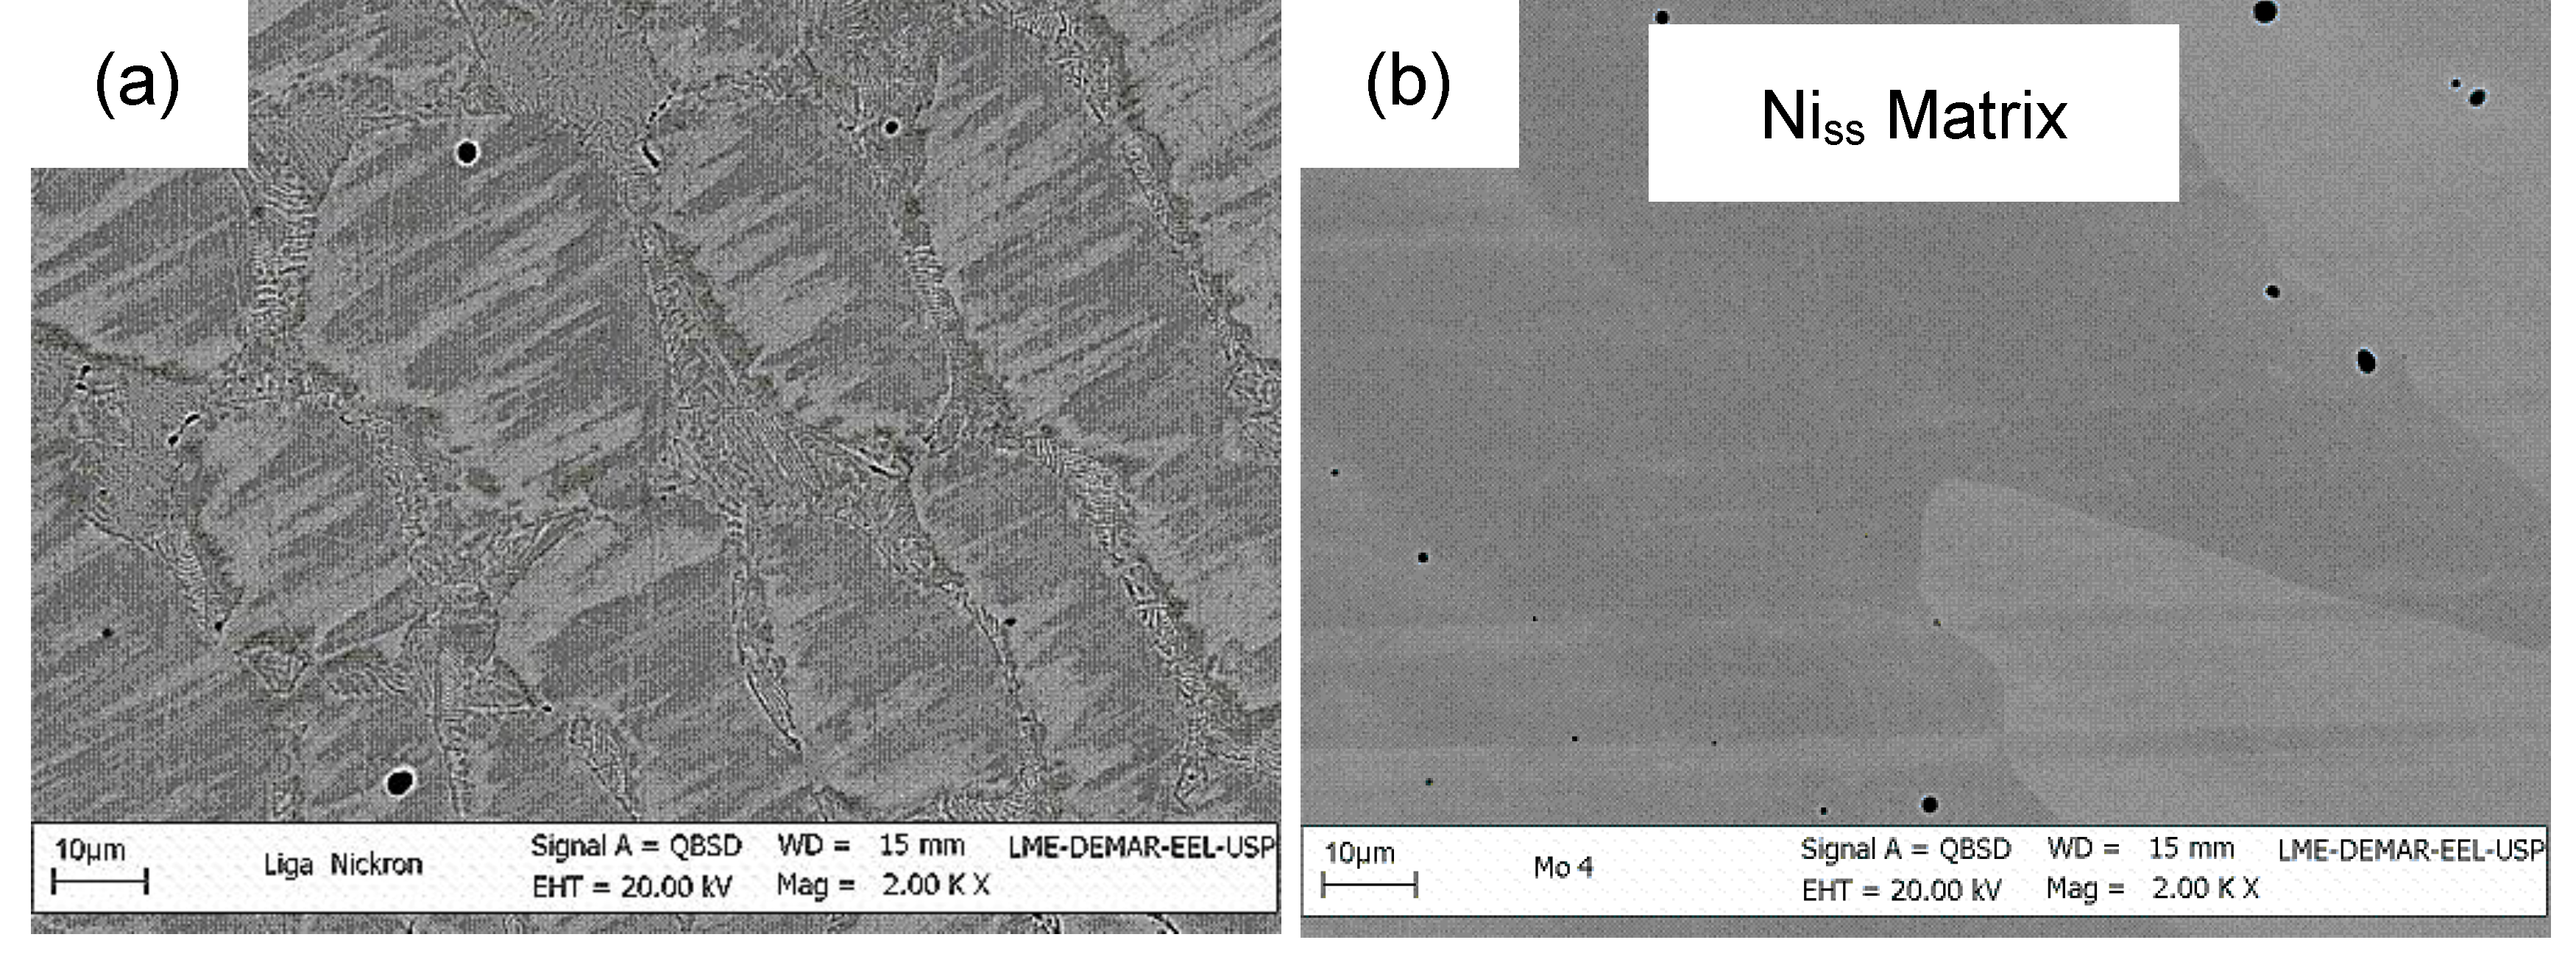
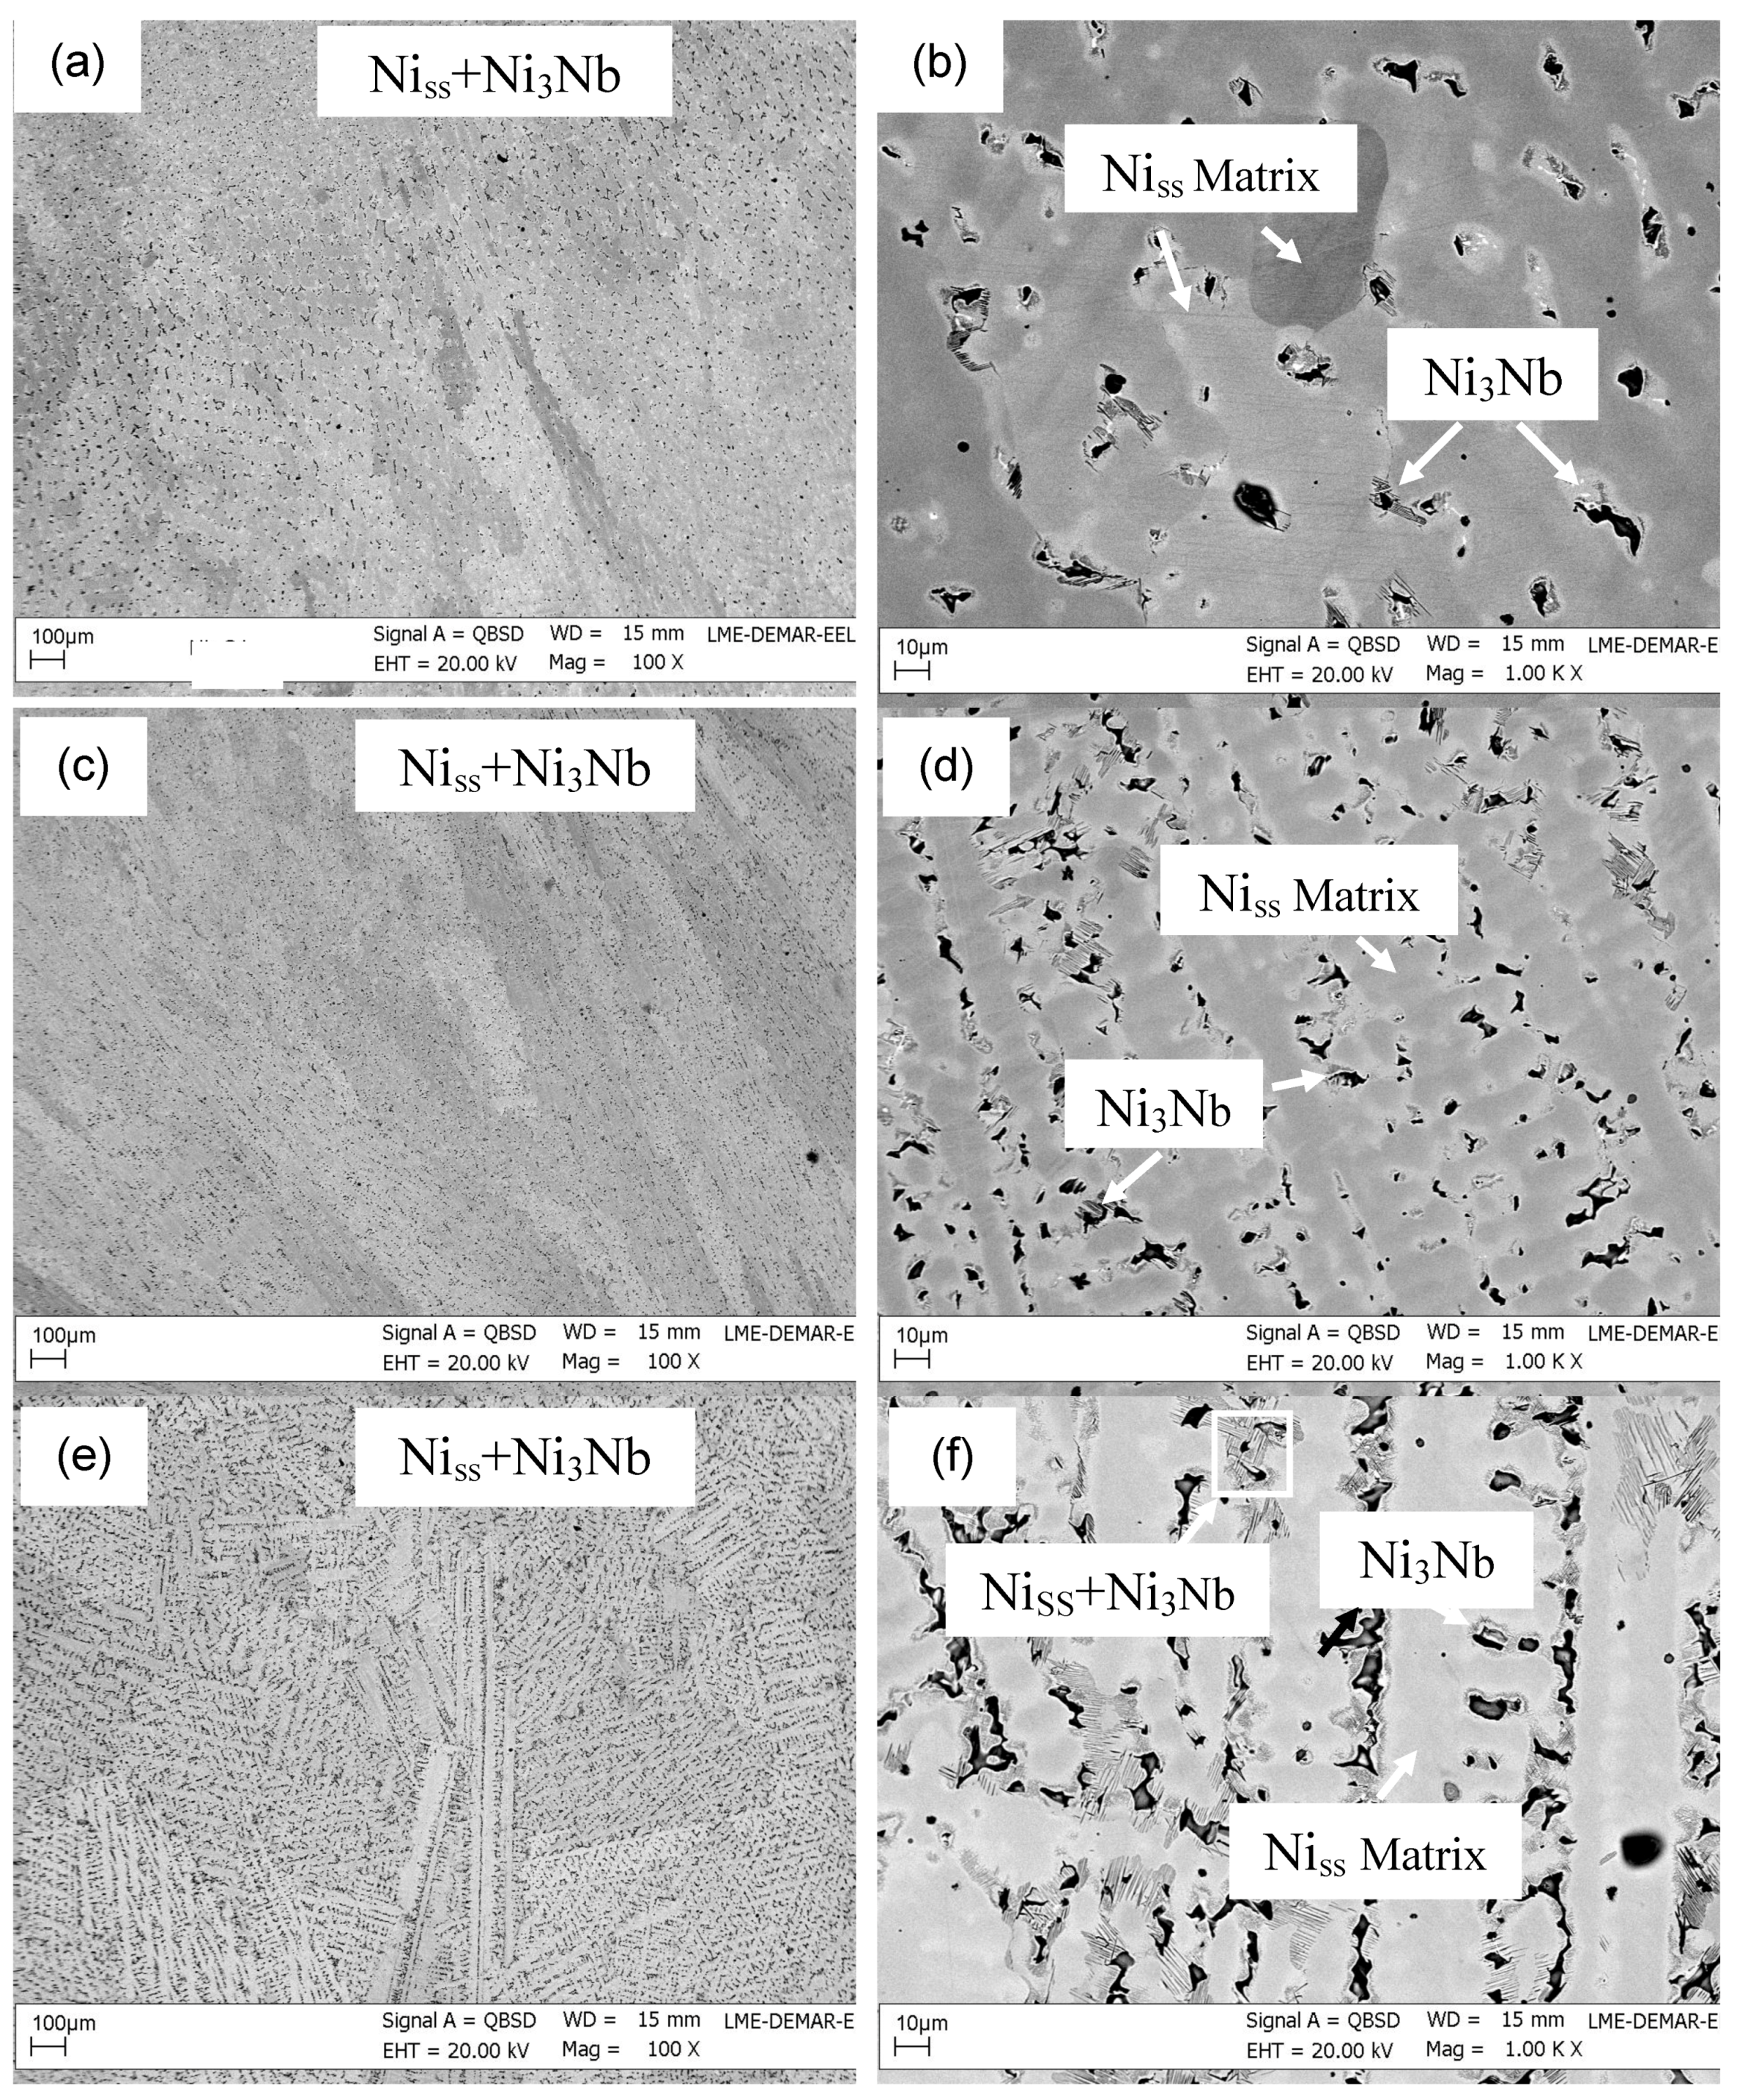
| Alloy | Phase | Ni | Cr | Mo | Nb | Others |
|---|---|---|---|---|---|---|
| Ni-22Cr-10Mo | Niss | 68.5–70.5 | 24.0–25.5 | 5.1–6.0 | - | - |
| Ni-24Cr-8Nb | Niss | 68.9–69.4 | 25.4–27.8 | - | 2.8–5.5 | - |
| Ni-20Cr-12Nb | Niss | 70.2–71.1 | 22.5–25.0 | - | 3.9–7.1 | - |
| Ni3Nb | 72.3 | 9.6–10.5 | - | 17.2–18.1 | - | |
| Commercial Ni-Cr Alloy | Niss | 59.5–70.7 | 22.0–26.7 | 2.0–4.5 | - | Si (3.6–8.6); Mn (0.6–0.7) |
| Alloy | Vickers Hardness (HV) |
|---|---|
| Ni-22Cr-10Mo | 150.0 ± 5.3 |
| Ni-24Cr-8Nb | 243.0 ± 19.8 |
| Ni-22Cr-10Nb | 309.0 ± 6.7 |
| Ni-20Cr-12Nb | 374.0 ± 21.1 |
| Commercial Ni-Cr Alloy | 231.0 ± 14.6 |
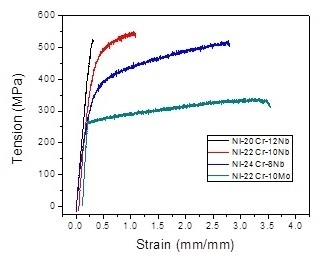
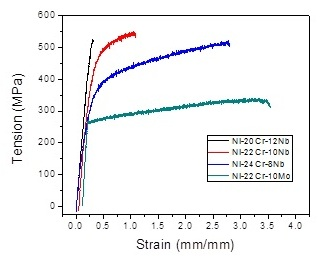
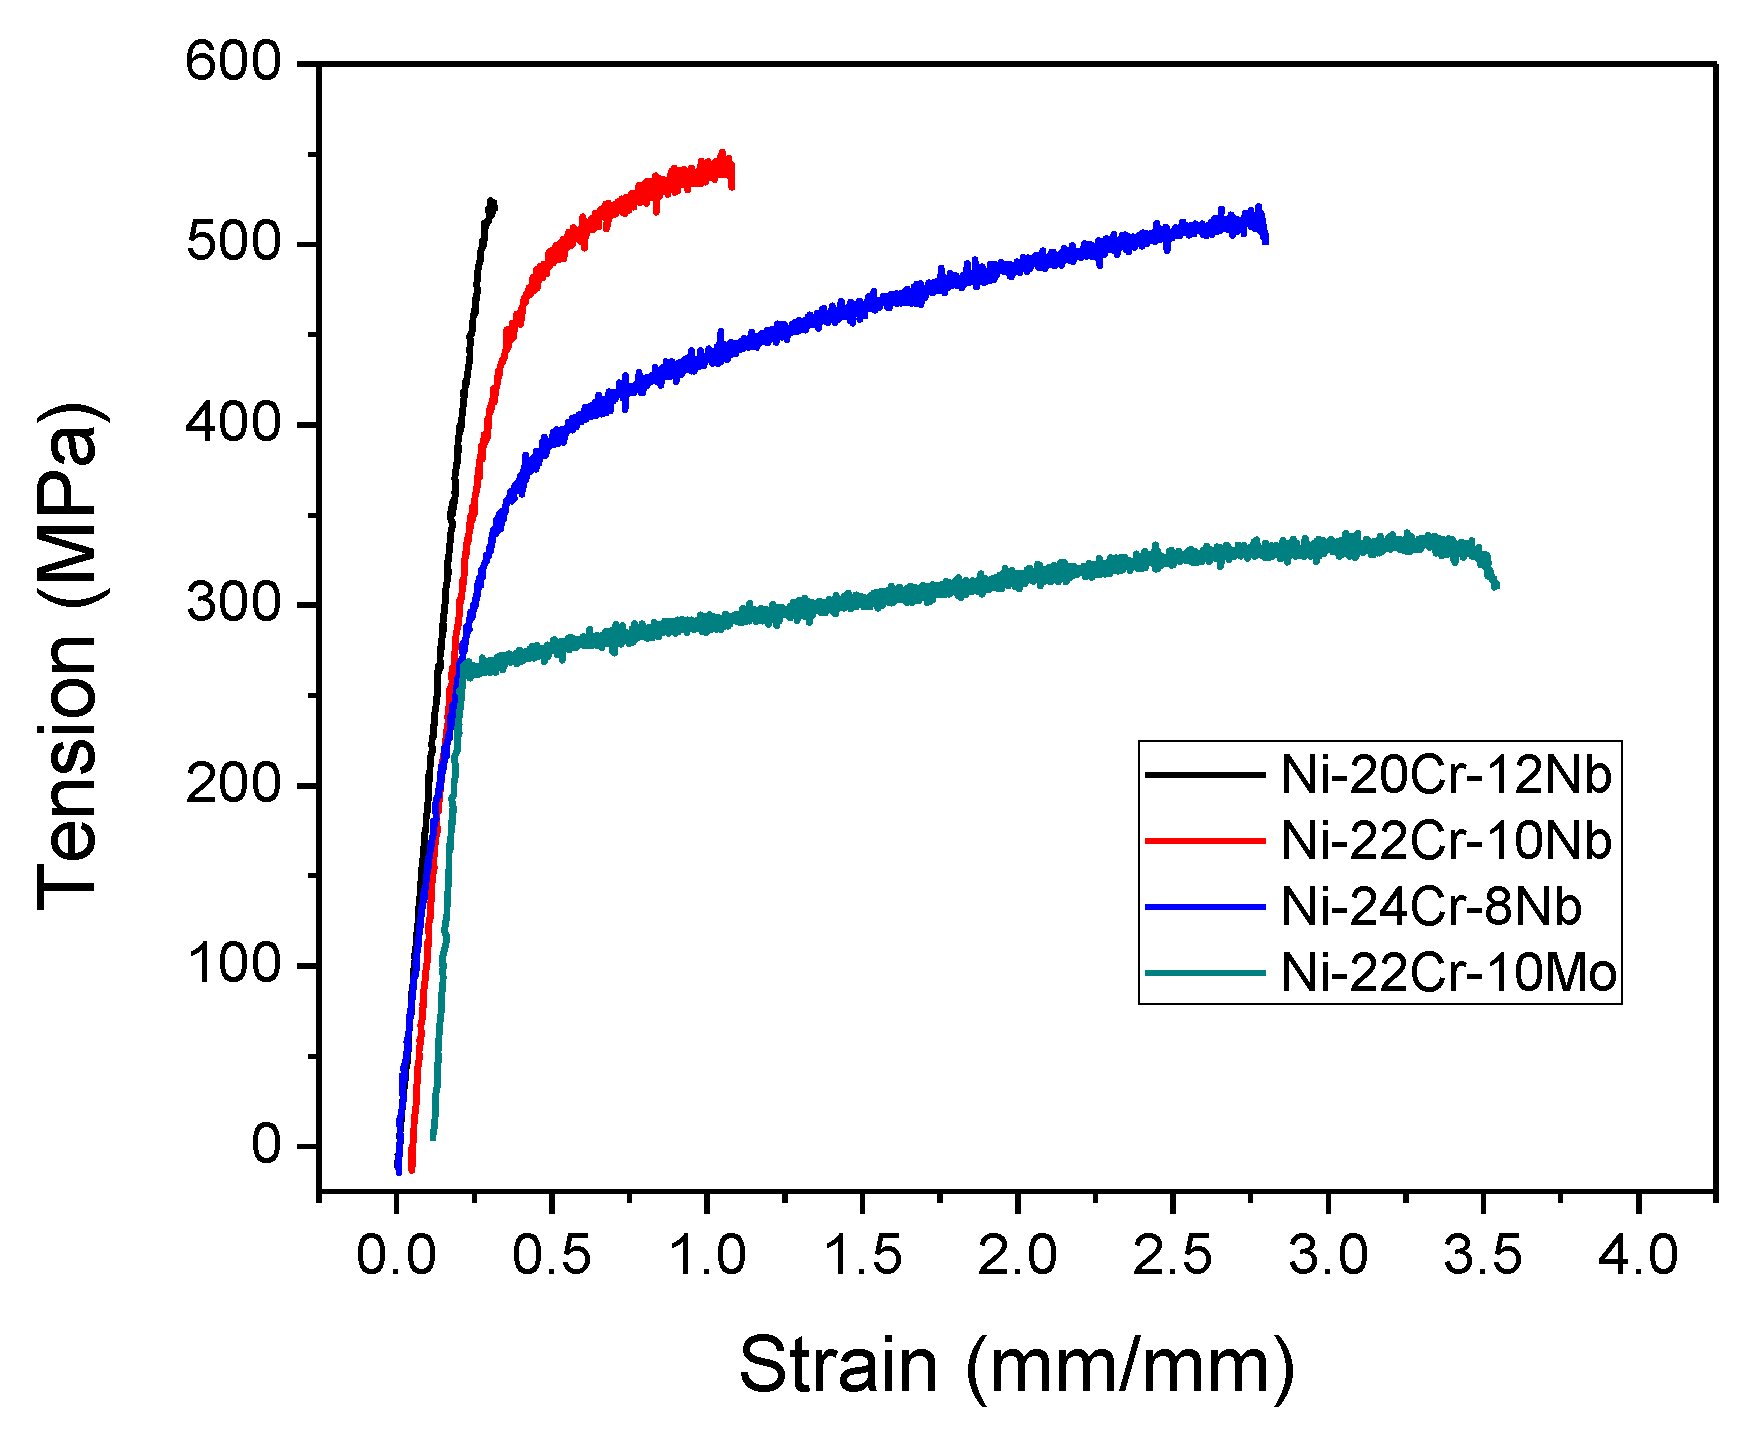
| Alloy | Yield Strength (MPa) | Ultimate Tensile Strength (MPa) | Total Strain (%) | Elastic Module (GPa) |
|---|---|---|---|---|
| Ni-22Cr-10Mo | 212.4 ± 46.2 | 380.6 ± 36.5 | 4.2 ± 0.2 | 28.9 ± 16.4 |
| Ni-24Cr-8Nb | 334.2 ± 22.3 | 505.3 ± 22.2 | 6.5 ± 0.5 | 41.4 ± 0.6 |
| Ni-22Cr-10Nb | 448.4 ± 48.4 | 551.3 ± 51.7 | 4.5 ± 0.7 | 61.0 ± 5.8 |
| Ni-20Cr-12Nb | 510.5 ± 81.5 | 576.5 ± 133.4 | 1.8 ± 0.5 | 69.5 ± 18.3 |
© 2019 by the authors. Licensee MDPI, Basel, Switzerland. This article is an open access article distributed under the terms and conditions of the Creative Commons Attribution (CC BY) license (http://creativecommons.org/licenses/by/4.0/).
Share and Cite
Souza, M.A.d.; Fiorin, B.d.O.; Hashimoto, T.M.; Rosifini, A.P.; Nunes, C.A.; Baptista, C.A.R.P.; Ramos, A.S. Influence of Niobium or Molybdenum Addition on Microstructure and Tensile Properties of Nickel-Chromium Alloys. Metals 2019, 9, 589. https://doi.org/10.3390/met9050589
Souza MAd, Fiorin BdO, Hashimoto TM, Rosifini AP, Nunes CA, Baptista CARP, Ramos AS. Influence of Niobium or Molybdenum Addition on Microstructure and Tensile Properties of Nickel-Chromium Alloys. Metals. 2019; 9(5):589. https://doi.org/10.3390/met9050589
Chicago/Turabian StyleSouza, Marisa Aparecida de, Bárbara de Oliveira Fiorin, Tomaz Manabu Hashimoto, Ana Paula Rosifini, Carlos Angelo Nunes, Carlos Antônio Reis Pereira Baptista, and Alfeu Saraiva Ramos. 2019. "Influence of Niobium or Molybdenum Addition on Microstructure and Tensile Properties of Nickel-Chromium Alloys" Metals 9, no. 5: 589. https://doi.org/10.3390/met9050589
APA StyleSouza, M. A. d., Fiorin, B. d. O., Hashimoto, T. M., Rosifini, A. P., Nunes, C. A., Baptista, C. A. R. P., & Ramos, A. S. (2019). Influence of Niobium or Molybdenum Addition on Microstructure and Tensile Properties of Nickel-Chromium Alloys. Metals, 9(5), 589. https://doi.org/10.3390/met9050589