Abstract
Sound absorption performance of a porous metal can be improved by compression and optimal permutation, which is favorable to promote its application in noise reduction. The 10-layer gradient compressed porous metal was proposed to obtain optimal sound absorption performance. A theoretical model of the sound absorption coefficient of the multilayer gradient compressed porous metal was constructed according to the Johnson-Champoux-Allard model. Optimal parameters for the best sound absorption performance of the 10-layer gradient compressed porous metal were achieved by a cuckoo search algorithm with the varied constraint conditions. Preliminary verification of the optimal sound absorber was conducted by the finite element simulation, and further experimental validation was obtained through the standing wave tube measurement. Consistencies among the theoretical data, the simulation data, and the experimental data proved accuracies of the theoretical sound absorption model, the cuckoo search optimization algorithm, and the finite element simulation method. For the investigated frequency ranges of 100–1000 Hz, 100–2000 Hz, 100–4000 Hz, and 100–6000 Hz, actual average sound absorption coefficients of optimal 10-layer gradient compressed porous metal were 0.3325, 0.5412, 0.7461, and 0.7617, respectively, which exhibited the larger sound absorption coefficients relative to those of the original porous metals and uniform 10-layer compressed porous metal with the same thickness of 20 mm.
1. Introduction
Noise pollution is one of the major environmental problems all over the world [1]. Especially in the urban area, the increasing noise pollution is harmful to persons, animals, precise instruments, and structural buildings, and the harmful level is determined by its frequency, intensity, and time [2]. Therefore, noise reduction is one of the research focuses in the field of environmental protection [3], and development of a sound absorber with fine sound absorption performance is considered an effective method to achieving noise reduction [4,5]. Normally, sound absorption performance of the sound absorber with certain thickness is evaluated by the average sound absorption coefficient in the given frequency range, which indicates that the desired sound absorber must achieve a higher average sound absorption coefficient and utilize smaller total thickness simultaneously. Moreover, taking the practical applications into account, besides the outstanding sound absorption performance, the desired sound absorber should have the additional advantages of low fabrication cost, excellent fire resistance, fine environmental friendliness, convenient installability, and easy maintainability [6,7]. Therefore, these factors should be taken into consideration in developing the sound absorber for practical application.
The proposed sound absorber in this study is expected to be used for noise reduction in workshops. Although many sound absorbers made of wood or cork have been developed and can exhibit fine sound absorption performance, they will be favorable to use in the workshops when their fire resistance, mechanical strength, and maintainability are improved in future, because the materials used in the workshops should obey the stricter requirements. Among the present common sound absorbing materials, porous metal is considered as one potential candidate to fabricate the sound absorber for mass production and large-scale application in workshops, and many sound absorbers that consist of porous metal have been developed [8,9,10,11,12,13,14]. Ru et al. [8] prepared the porous copper by the resin curing and foaming method, which exhibited a greater sound absorption capacity than the lotus-type copper. A porous polycarbonate material sample was developed by Liu et al. [9] through the additive manufacturing method, and the results indicated that increasing the angle of the slanted pores decreased the sound absorption coefficient when the porosity was kept as constant. Ning and Zhao [10] studied sound absorption characteristics of the multilayer porous materials backed with the air gap, which could achieve better sound absorption behavior for an increase of the acoustic resistance. Sound absorption performance of the porous metals was enhanced by Otaru [11] through using X-ray tomography images to reliably characterize pore structure-related parameters of the high density porous metallic structures, and the flow simulations were used to deduce parameters that determine the acoustical properties, which could assist in minimizing the operating cost and the time involved in sound absorption measurement. Chen et al. [12] presented a method for calculating and optimizing the sound absorption coefficient of the multi-layered porous fibrous metals in the low frequency range, and the numerical examples demonstrated that the optimization model was very applicable and efficient. The various nickel foam-based multilayer sound absorbing structures were developed by Cheng et al. [13], which could achieve the optimal sound absorption coefficient of 0.4 in the 1000–1600 Hz for the composite structure of five-layer foams with a backed 5 mm-thick cavum. Ao et al. [14] conducted the sound absorption characteristics and the structure optimization of porous stainless steel fibrous felt materials, and it indicated that the sample with excellent sound absorption performance could be prepared by adjusting the match between the mean pore size and the fibrous diameter for different frequencies. This research [8,9,10,11,12,13,14] proved that sound absorption behavior of the porous metal was determined by its structural parameters, and it could be improved by using some optimization methods, which indicated that the suitable optimization was a crucial procedure to develop a novel sound absorber made of the porous metal.
It was proved by Bai et al. [15] that the sound absorption efficiency of the porous metal could be improved through compression, and the average sound absorption coefficient of the compressed and the microperforated porous metal panel absorber in the 100–6000 Hz reached 0.5969 with a backed cavity of 20 mm [16]. Meanwhile, Yang et al. [17] proposed a high-efficiency and thin-thickness acoustic absorber by compression and assembly of the porous metals, which could obtain an excellent average sound absorption coefficient of 0.6033 in the 100–6000 Hz with a total thickness of 11 mm. Therefore, a 10-layer gradient compressed porous metal was optimized to obtain an excellent sound absorption performance in this research. Firstly, the structural parameters of each compressed layer of porous metal were derived according to their definitions, and the theoretical model of the sound absorption coefficient of the 10-layer gradient compressed porous metal was constructed by the transfer matrix method [18,19] based on the Johnson-Champoux-Allard model [20,21]. Secondly, parameters of the proposed sound absorbers were optimized for best average sound absorption coefficients in varied frequency ranges by the cuckoo search algorithm [22,23], which was proved effective in optimizing parameters of the sound absorbing structures [24]. Thirdly, finite element simulation models of the obtained optimal sound absorbers were founded in the virtual acoustic laboratory [25], which was considered an effective assistant method to preliminarily verify the sound absorption performance of the composite structures [19,24]. Afterwards, the desired 10-layer gradient compressed porous metals were fabricated according to the optimal parameters by compression and assembly. Finally, the sound absorption coefficients of the sound absorbers were tested by the standing wave tube measurement [26,27], which was treated as effective validation for the theoretical sound absorption model, the cuckoo search optimization algorithm, and the finite element simulation method.
2. Theoretical Modeling
The 10-layer gradient compressed porous metal consisted of 10 single compressed porous metals, thus it was necessary to derive the structural parameters for each layer. The major structural parameters were thickness, porosity, and static flow resistivity. Based on their definitions, when the compression ratio of the single compressed porous metal was (defined as the ratio of the reduced thickness by the compression to the initial thickness), the corresponding thickness , the porosity , and the static flow resistivity could be calculated by Equations (1), (2), and (3), respectively [17]. Here, , , and were thickness, porosity, and static flow resistivity of initial porous metal before compression.
Based on the Johnson-Champoux-Allard model [20,21], complex effective density and complex effective bulk modulus of the single compressed porous metal could be obtained according to the derived structural parameters, as shown in Equations (4) and (5), respectively. Here, was the sound angular frequency, which could be calculated by Equation (6); was the density of the air with normal temperature, 1.21 Kg/m3; was the specific heat ratio of the air, 1.40; was the standard static pressure of the air, 1.013·105 Pa; was the Nusselt number, 4.36; was the Prandtl number, 0.71 [15,16,17,18,19,20,21]. Meanwhile, was the symbol of the imaginary number.
Moreover, for the single layer compressed porous metal, the wave number in it and its corresponding characteristic impedance could be calculated through Equations (7) and (8), respectively. Furthermore, transfer matrix of the single layer compressed porous metal could be calculated by Equation (9) [17,18,19].
The utilized porous metal samples were all purchased from YiYang Foam metal New material Co., Ltd., Yiyang, China, and their initial thicknesses, porosities, and static flow resistivities were the same, which indicated that the structural parameters of the compressed porous metals were determined by the compression ratio . Therefore, supposing the transfer matrix of the ith layer single compression porous metal with the compression ratio of was , the total transfer matrix of the 10-layer gradient compressed porous metal could be calculated by Equation (10) based on the transfer matrix method [18,19], and the corresponding sound absorption coefficient could further be obtained by Equation (11). In Equation (11), and corresponded to the real part and the imaginary part of one complex number, respectively. In this way, the theoretical sound absorption model of the 10-layer gradient compressed porous metal was constructed, which provided the theoretical basis for further parameter optimization.
3. Parameter Optimization
As mentioned above, all the utilized porous metal samples were purchased from YiYang Foam metal New material Co., Ltd., Yiyang, China, and their initial thicknesses, porosities, and static flow resistivities were 5 mm (measured by Vernier caliper), 0.95 (measured according to its definition), and 10,200 Pa·s·m−2 (measured based on the water tank method), respectively, which were marked by the manufacturer and further validated through the experimental measurements in this study. Therefore, for the proposed 10-layer gradient compressed porous metal in this research, its sound absorption performance was completely determined by the 10 compression ratios, and parameter optimization was realized by using the cuckoo search algorithm [22,23], which was proved effective and practical to optimize parameters of the sound absorbing structures [24]. The proposed sound absorber was desired for use in workshops, and the available space to install it was limited to 20 mm, which indicated that the summation of the 10 compression ratios needed to be smaller than six (summation of thicknesses of the 10 initial porous metals was 50 mm), as shown in Equation (12). Meanwhile, from Equation (2), it could be observed that each compression ratio needed to be smaller than the initial porosity . Furthermore, it was validated through the compression experiments that it was difficult to further compress the utilized porous metal sample when the compression ratio exceeded 0.9, because the structure of the compressed sample was more and more dense. Therefore, the additional constraint condition of the limit for each compression ratio was given and is shown in Equation (13).
For the various equipment and machines installed in the different workshops, frequency ranges of their noise differed. Taking practical applications into consideration, the investigated frequency ranges were 100–1000 Hz, 100–2000 Hz, 100–4000 Hz, and 100–6000 Hz. In the optimization process, maximization of the average sound absorption coefficient in the corresponding frequency range was treated as the optimization target, as shown in Equation (14). Here, and were the upper limit and the lower limit of the investigated frequency range.
As is well known, the cuckoo search algorithm may obtain a local optimal solution instead of a global optimal solution. There are two factors that affect the optimization results, which include initial values of the parameters and the optimization time. Therefore, in order to improve the reliability of the optimization results, each optimization process continued as long as possible, and it was stopped until the obtained optimal parameters had no changes for more than 1 h. Meanwhile, in order to further improve accuracy of the optimization results, different initial values of the parameters were selected for each optimization process. Consistency of the optimal parameters for each investigated sound absorber was obtained, which validated the reliability and the accuracy of the cuckoo search algorithm. According to the cuckoo search algorithm [22,23,24], compression ratios of each layer in the optimal 10-layer gradient compressed porous metals with the different investigated frequency ranges were obtained and are summarized in Table 1. The total thickness of each optimal sound absorber was 20 mm. The corresponding average sound absorption coefficients were 0.3805, 0.5678, 0.7503, and 0.8231 when the investigated frequency ranges were 100–1000 Hz, 100–2000 Hz, 100–4000 Hz, and 100–6000 Hz, respectively. By contrast, the average sound absorption coefficients of the original porous metal with the same thickness of 20 mm were 0.1639, 0.3070, 0.4981, and 0.6050 when the frequency ranges were 100–1000 Hz, 100–2000 Hz, 100–4000 Hz, and 100–6000 Hz, respectively. Meanwhile, when the 10 compression ratios in the 10-layer gradient compressed porous metals were equal to 0.6, it was named by the uniform compressed porous metal as a special case, which was also treated as the contrast. The average sound absorption coefficients of the uniform compressed porous metal were 0.2593, 0.5015, 0.7168, and 0.7980 when the investigated frequency ranges were 100–1000 Hz, 100–2000 Hz, 100–4000 Hz, and 100–6000 Hz, respectively. It could be observed that the sound absorption performance in each investigated frequency range was significantly improved by the 10-layer gradient compressed porous metals relative to the original porous metal with the same thickness of 20 mm, and the optimal 10-layer gradient compressed porous metals exhibited better sound absorption performance than the uniform compressed porous metal.

Table 1.
Summary of compression ratios of each layer in the optimal 10-layer gradient compressed porous metals with the different investigated frequency ranges.
Sound absorption coefficients of the optimal 10-layer gradient compressed porous metals were obtained through taking the optimal parameters in Table 1 into the constructed theoretical sound absorption models in Equations (1) to (11), and their distributions are shown in Figure 1. Meanwhile, the sound absorption coefficients of the original porous metal and those of the uniform compressed porous metal with the same thickness of 20 mm were also calculated according to the Johnson-Champoux-Allard model [20,21] and are shown in Figure 1 for contrast. It could further prove the improvement of the sound absorption performance by these obtained optimal 10-layer gradient compressed porous metals. Meanwhile, it could be found that the sound absorption coefficients were reduced in the 100–1000 Hz when the investigated frequency range was enlarged, because the corresponding sound absorption peak shifted to the high-frequency direction.
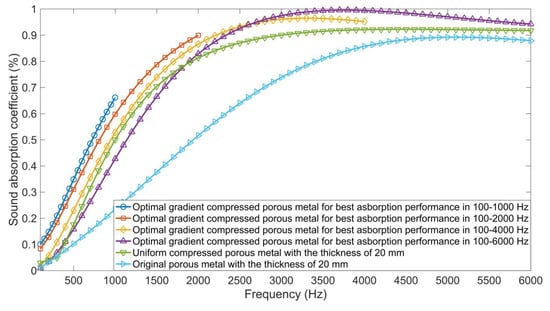
Figure 1.
Comparisons of sound absorption coefficients of the optimal 10-layer gradient compressed porous metals and those of the original porous metal and uniform compressed porous metal.
4. Finite Element Simulation
Finite element simulation models were considered as an effective assistant method to preliminarily verify the sound absorption performance of the composite structures [19,24], and the obtained optimal sound absorbers were simulated in a virtual acoustic laboratory [25]. The constructed finite element simulation model for the 10-layer gradient compressed porous metal is shown in Figure 2. Meanwhile, the finite element simulation model for the original porous metal and uniform compressed porous metal with a thickness of 20 mm is shown in Figure 3, which was treated as the contrast. The used model for the porous metal in this study was the Delany-Bazley-Miki model [28,29], and the structural parameters we needed to set were thickness, porosity, and static flow resistivity, which could be obtained by Equations (1), (2), and (3) according to the optimal compression ratios in Table 1 and the parameters of the initial porous metal. Plane wave was imported in the acoustic source inlet, which was the incident sound source in the finite element simulation model. Sound pressures of the incident wave and those of the reflected wave at the two microphones were measured, and the sound absorption coefficient could be calculated through Equation (15). Here, , , and were transfer functions of the total sound field, the incident wave, and the reflected wave, respectively; was the wave number; was the distance between microphone 1 and the surface of the detected sample. The length of the standing wave tube was 300 mm, and the distance between the two microphones was 40 mm [19]. The mesh grid was set to 5 mm in these constructed finite element simulation models, as shown in Figure 2 and Figure 3. Meanwhile, in order to validate the influence of the mesh grid to the simulation results, the corresponding finite element simulation models with mesh grids of 0.5 mm, 1 mm, and 3 mm were also constructed. The influence of the mesh grid was evaluated by average deviations of the sound absorption coefficients at the corresponding frequency points among these simulation data obtained by the various finite element simulation models. It could be found that the calculated average deviations were smaller than 1%, which indicated that the influence of the mesh grid was insignificant in this study. Therefore, in order to improve the computing speed and promote the simulation efficiency, the mesh grid of 5 mm was selected in the finite element simulation models in this study, as shown in Figure 2 and Figure 3.
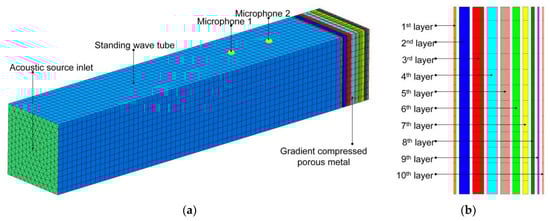
Figure 2.
The constructed finite element simulation model for 10-layer gradient compressed porous metal. (a) Frame diagram of the system of the standing wave tube measurement; (b) schematic drawing compositions of the 10-layer gradient compressed porous metal.
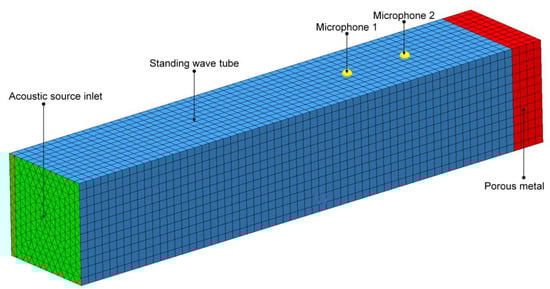
Figure 3.
The constructed finite element simulation model for the original porous metal and the uniform compressed porous metal.
Comparisons of the sound absorption coefficients of the investigated sound absorber in theory as well as those in simulations are shown in Figure 4. It could be observed that, for the four optimal 10-layer gradient compressed porous metals, the original porous metal with the thickness of 20 mm, and the uniform compressed porous metal with the thickness of 20 mm, simulation results were consistent with theoretical results, which could preliminarily verify the effective improvement of the sound absorption performance by the optimal 10-layer gradient compressed porous metals. The existing differences between theoretical data and simulation data were primarily generated by the different acoustic models used for the porous metal. The theoretical sound absorption models were constructed based on the Johnson-Champoux-Allard model in this study [20,21], and the acoustic model for porous metal in the finite element simulation model was the Delany-Bazley-Miki model [28,29]. It is well known that single-piece fabrication of the porous metal with different structural parameters is high-cost and time-consuming, and the measurement of sound absorption coefficients of the sound absorber also takes a great deal of time. Therefore, finite element simulation could be treated as an effective supplement for further experimental validation [19,24].
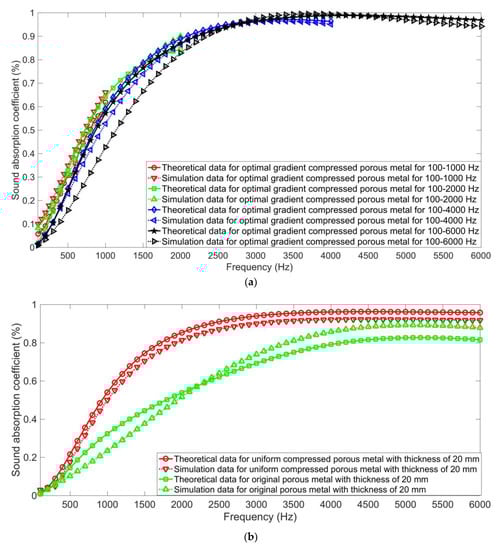
Figure 4.
Comparisons of the sound absorption coefficients in theory and those in simulation. (a) The optimal 10-layer gradient compressed porous metals for the varied frequency ranges; (b) the original porous metal and uniform compressed porous metal with same thicknesses of 20 mm.
5. Standing Wave Tube Measurement
The initial porous metal was porous copper, which was purchased from YiYang Foam metal New material Co., Ltd., Yiyang, China. According to the obtained compression ratios of each layer in the optimal 10-layer gradient compressed porous metals in Table 1, the initial porous metals were compressed by the CTM2050 universal testing machine (Wuxi City Bleecker Trading Co., Ltd., Wuxi, China), as shown in Figure 5 [15,16,17]. Afterwards, the 10 single compressed porous metals were assembled by the glue water according to the orders in Table 1. The neighboring layers were glued by the glue water at three boundary points, and the bonding area was limited to smaller than 1 mm2, which aimed to reduce the influence of the glue water on the sound absorption performance of the 10-layer gradient compressed porous metals. In this method, the four optimal 10-layer gradient compressed porous metals were fabricated.
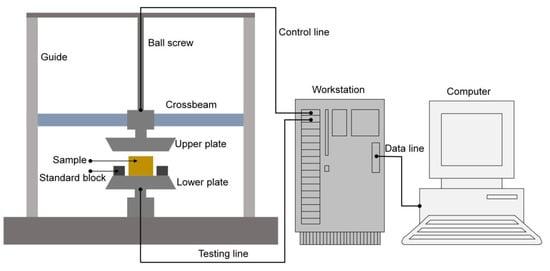
Figure 5.
Schematic diagram of the used CTM2050 universal testing machine for fabrication of the optimal 10-layer gradient compressed porous metals.
The fabricated optimal 10-layer gradient compressed porous metals are shown in Figure 6, and their sound absorption coefficients were measured by the AWA6128A detector (Hangzhou Aihua Instruments Co., Ltd., Hangzhou, China), as shown in Figure 7 [15,16,17,27]. According to the operating manual of the AWA6128A detector, measurement of the sound absorption coefficient in the 100–2000 Hz range required the sample with a diameter of 96 mm, and that in the 2000–6000 Hz required the sample with a diameter of 30 mm. Therefore, it was found that, for the investigated frequency ranges of 100–1000 Hz and 100–2000 Hz, there was one sample with a diameter of 96 mm in Figure 6a,b, respectively. Meanwhile, for the investigated frequency ranges of 100–4000 Hz and 100–6000 Hz, there were additional samples with the diameter of 30 mm in Figure 6c,d, respectively. In order to reduce the random error in the measuring process, the four 10-layer gradient compressed porous metals, the original porous metal with the thickness of 20 mm, and the uniform compressed porous metal with the thickness of 20 mm were measured 10 times, and the final actual sound absorption coefficients were the average of the 10 experimental measurements for each sound absorber. It was found that the standard deviation for each sound absorption coefficient data was smaller than 0.6%, which indicated that the experimental uncertainty in this research was negligible, and the experimental data obtained by the standing wave tube measurement were accurate and believable.
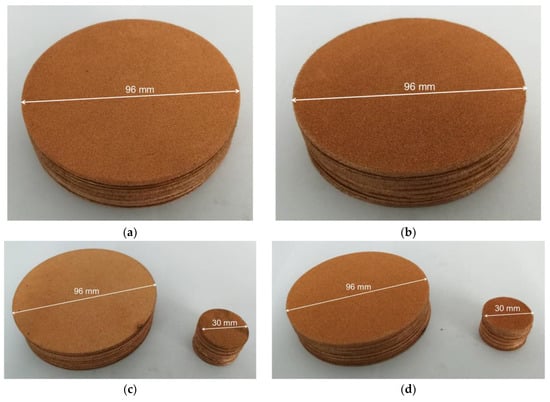
Figure 6.
The prepared 10-layer gradient compressed porous metals for the varied frequency ranges. (a) 100–1000 Hz; (b) 100–2000 Hz; (c) 100–4000 Hz; (d) 100–6000 Hz.
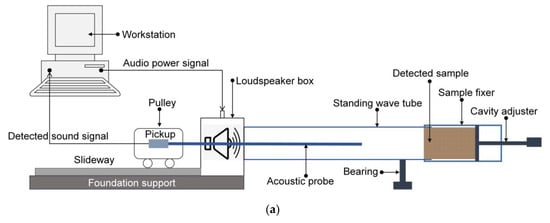
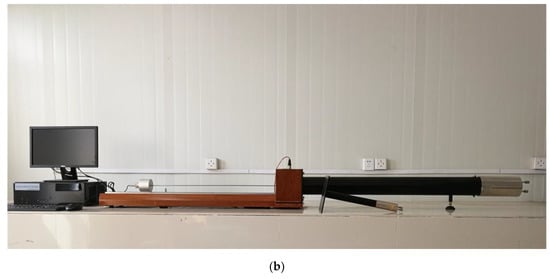
Figure 7.
The AWA6128A detector for the standing wave tube measurement. (a) Schematic diagram; (b) actual picture.
Comparisons of theoretical data, simulation data, and experimental data of the sound absorption coefficient of the four optimal 10-layer gradient compressed porous metals, those of the uniform compressed porous metal with a thickness of 20 mm, and those of the original porous metal with a thickness of 20 mm are shown in Figure 8. When the investigated frequency ranges were 100–1000 Hz, 100–2000 Hz, 100–4000 Hz, and 100–6000 Hz, the average deviations between theoretical data and experimental data for the optimal 10-layer gradient compressed porous metals were 0.0520, 0.0438, 0.0304, and 0.0624, respectively, and the corresponding deviations between the simulation data and the experimental data were 0.0315, 0.0294, 0.0296, and 0.0356, respectively. For the uniform compressed porous metal with a thickness of 20 mm, the average deviation between theoretical data and experimental data was 0.0596, and that between simulation data and experimental data was 0.0393. For the original porous metal with a thickness of 20 mm, the average deviation between theoretical data and experimental data was 0.0825, and that between simulation data and experimental data was 0.1069. Consistencies among the theoretical data, the simulation data, and the experimental data proved accuracies of the theoretical sound absorption model, the cuckoo search optimization algorithm, and the finite element simulation method, which provided a novel method to develop gradient compressed porous metals.
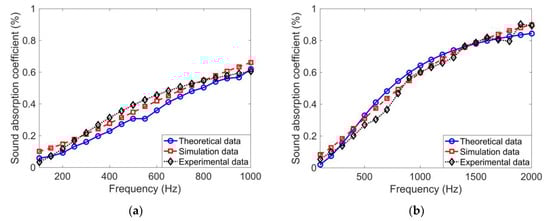
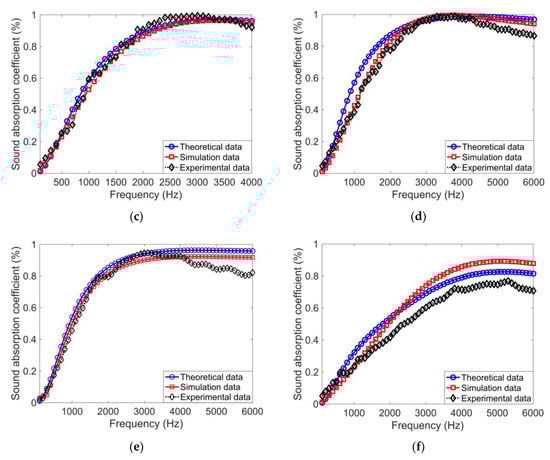
Figure 8.
Comparisons of the theoretical data, the simulation data, and the experimental data of the sound absorption coefficient of the investigated sound absorbers. (a) Optimal 10-layer gradient compressed porous metals for 100–1000 Hz; (b) optimal 10-layer gradient compressed porous metals for 100–2000 Hz; (c) optimal 10-layer gradient compressed porous metals for 100–4000 Hz; (d) optimal 10-layer gradient compressed porous metals for 100–6000 Hz; (e) uniform compressed porous metal with the thickness of 20 mm; (f) original porous metal with the thickness of 20 mm.
Comparisons of the average sound absorption coefficients of the four optimal 10-layer gradient compressed porous metals, those of the uniform compressed porous metal with a thickness of 20 mm, and those of the original porous metal with a thickness of 20 mm are shown in Table 2. The actual average sound absorption coefficients of the optimal 10-layer gradient compressed porous metals were 0.3325, 0.5412, 0.7461, and 0.7617 when the investigated frequency ranges were 100–1000 Hz, 100–2000 Hz, 100–4000 Hz, and 100–6000 Hz, respectively, which exhibited higher sound absorption coefficients than those of the uniform compressed porous metal and those of the original porous metal with the same thickness of 20 mm. The improvement was evaluated by the growth ratio of the average sound absorption coefficient, as shown in Equation (16). Here, , , and were the actual average sound absorption coefficients of the optimal 10-layer gradient compressed porous metal, that of the uniform compressed porous metal with a thickness of 20 mm, and that of the original porous metal with a thickness of 20 mm, respectively. Relative to the original porous metal, it could be calculated by Equation (16) that the growth ratios were 117.5%, 118.5%, 76.3%, and 44.3% when the investigated frequency ranges were 100–1000 Hz, 100–2000 Hz, 100–4000 Hz, and 100–6000 Hz, respectively. Meanwhile, for the uniform compressed porous metal, the growth ratios were 58.5%, 19.4%, 9.2%, and 3.1% when the investigated frequency ranges were 100–1000 Hz, 100–2000 Hz, 100–4000 Hz, and 100–6000 Hz, respectively. It could be found that the improvement of the sound absorption coefficient in the low-frequency range was more remarkable than that in the high-frequency range, and the optimal 10-layer gradient compressed porous metal could make up for the shortage of the original porous metal and broaden its sound absorption broadband. Meanwhile, relative to the uniform compressed porous metal, the sound absorption performance of the 10-layer gradient compressed porous metal could be further improved by parameter optimization.
Table 2.
Comparisons of average sound absorption coefficients of the optimal 10-layer gradient compressed porous metal and those of original porous metal and the uniform compressed porous metal.
6. Structural Analysis
Distributions of the compression ratio of the optimal 10-layer gradient compressed porous metals are shown in Figure 9. It could be observed that, for each optimal sound absorber, there was a layer with a high compression ratio in the beginning two layers. Afterwards, the compression ratio decreased quickly in the next several layers, and then it increased gradually until the last layer. These were common structural characteristics for the four optimal 10-layer gradient compressed porous metals, which influenced their sound absorption performance.
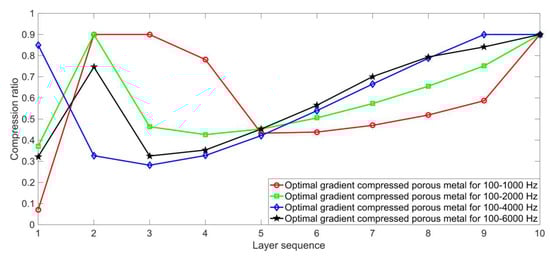
Figure 9.
Distributions of compression ratio of optimal 10-layer gradient compressed porous metals.
As mentioned above, the sound absorption performance of porous metal was primarily determined by its structural parameters, and these structural parameters were controlled by the compression ratios in the optimal 10-layer gradient compressed porous metals. Therefore, structural parameters of the optimal 10-layer gradient compressed porous metals, which included thickness, porosity, and static flow resistivity, were calculated by Equations (1), (2), and (3), respectively [17], as shown in Table 3. Distributions of the structural parameters of the optimal 10-layer gradient compressed porous metals along the thickness direction are shown in Figure 10. It was found that there was a layer with low porosity and high static flow resistivity in the first several layers. After the gradient decrease of the porosity and the gradient increase of the static flow resistivity in the middle several layers, there were more layers with low porosity and high static flow resistivity in the last several layers. It was presumed that the varied pore structures in the optimal 10-layer gradient compressed porous metals were effective in absorbing the sound in different frequency ranges [17], and the two layers with low porosity and high static flow resistivity enhanced the sound absorption effect. In the future, interactions between the material and the sound wave will be further quantitatively investigated and theoretically modeled, which is favorable to reveal the sound absorption mechanism of the gradient compressed porous metal and to explain its sound absorption characteristics with different frequencies and parameters.
Table 3.
Structural parameters of the optimal 10-layer gradient compressed porous metals.
Figure 10.
Distribution of structural parameters of the optimal 10-layer gradient compressed porous metals along the thickness direction. (a) Porosity; (b) static flow resistivity.
7. Conclusions
Optimization and validation of the sound absorption performance of 10-layer gradient compressed porous metals were conducted in this study. Through theoretical modeling, parameter optimization, finite element simulation, sample preparation, standing wave tube measurement, and structural analysis, the following conclusions were obtained.
(1) According to the constructed theoretical sound absorption model, parameter optimizations of the 10-layer gradient compressed porous metals were realized by the cuckoo search algorithm, and the optimal actual average sound absorption coefficients were 0.3325, 0.5412, 0.7461, and 0.7617 when the investigated frequency ranges were 100–1000 Hz, 100–2000 Hz, 100–4000 Hz, and 100–6000 Hz, respectively, which proved that 10-layer gradient compressed porous metals could obtain excellent sound absorption performance relative to the original porous metal and the uniform compressed porous metal with the same thickness of 20 mm.
(2) Sound absorption performance of the optimal 10-layer gradient compressed porous metals, the uniform compressed porous metal, and the original porous metal were preliminarily verified by the finite element simulation method and further validated through the standing wave tube measurement. Consistencies among the theoretical data, the simulation data, and the experimental data proved accuracies and reliability of the theoretical sound absorption model, the cuckoo search optimization algorithm, and the finite element simulation method.
(3) Structural analysis of the optimal 10-layer gradient compressed porous metal was realized through calculation and discussion of the structural parameters, which included the thickness, the porosity, and the static flow resistivity. The varied pore structure in the optimal 10-layer gradient compressed porous metals was effective in absorbing the sound wave with different frequency ranges, and the two layers with low porosity and high static flow resistivity enhanced the sound absorption effect.
The developed optimal 10-layer gradient compressed porous metals exhibited outstanding sound absorption performance in the varied frequency ranges, which is favorable for promoting their practical applications in the reduction of industrial noise and the protection of an acoustic environment.
Author Contributions
Conceptualization, X.S.; Software, Z.L.; Validation, F.Y. and X.Z.; Formal analysis, F.Y. and P.B.; Investigation, Q.Y.; Data curation, F.Y. and P.B.; Writing—original draft preparation, F.Y. and X.S.; Writing—review and editing, X.S. and P.B.; Supervision, X.S.; Funding acquisition, X.S.
Funding
This research was funded by National Natural Science Foundation of China, grant number 51505498; Natural Science Foundation of Jiangsu Province, grant number BK20150714; National Key R & D Program of China, grant number 2016YFC0802900; Hong Kong Scholars Program, grant number XJ2017025.
Acknowledgments
The authors wish to express their sincere thanks to Hangzhou Aihong instruments Co., Ltd., China for the support of the AWA6128A detector.
Conflicts of Interest
The authors declare no conflict of interest.
References
- Buxton, R.T.; McKenna, M.F.; Mennitt, D.; Fristrup, K.; Crooks, K.; Angeloni, L.; Wittemyer, G. Noise pollution is pervasive in U.S. protected areas. Science 2017, 356, 531–533. [Google Scholar] [CrossRef] [PubMed]
- Nieuwenhuijsen, M.J. Influence of urban and transport planning and the city environment on cardiovascular disease. Nat. Rev. Cardiol. 2018, 15, 432–438. [Google Scholar] [CrossRef] [PubMed]
- Vogiatzis, K.; Vanhonacker, P. Noise reduction in urban LRT networks by combining track based solutions. Sci. Total Environ. 2016, 568, 1344–1354. [Google Scholar] [CrossRef] [PubMed]
- Yang, M.; Sheng, P. Sound Absorption Structures: From Porous Media to Acoustic Metamaterials. Annu. Rev. Mater. Res. 2017, 47, 83–114. [Google Scholar] [CrossRef]
- Liu, P.S.; Qing, H.B.; Hou, H.L. Primary investigation on sound absorption performance of highly porous titanium foams. Mater. Des. 2015, 85, 275–281. [Google Scholar] [CrossRef]
- Wang, J.Z.; Ao, Q.B.; Ma, J.; Kang, X.T.; Wu, C.; Tang, H.P.; Song, W.D. Sound absorption performance of porous metal fiber materials with different structures. Appl. Acoust. 2019, 145, 431–438. [Google Scholar] [CrossRef]
- Jin, W.; Liu, J.A.; Wang, Z.L.; Wang, Y.H.; Cao, Z.; Liu, Y.H.; Zhu, X.Y. Sound absorption characteristics of aluminum foams treated by plasma electrolytic oxidation. Materials 2015, 8, 7511–7518. [Google Scholar] [CrossRef]
- Ru, J.M.; Bo, K.; Liu, Y.G.; Wang, X.L.; Fan, T.X.; Zhang, D. Microstructure and sound absorption of porous copper prepared by resin curing and foaming method. Mater. Lett. 2015, 139, 318–321. [Google Scholar] [CrossRef]
- Liu, Z.Q.; Zhan, J.X.; Fard, M.; Davy, J.L. Acoustic properties of a porous polycarbonate material produced by additive manufacturing. Mater. Lett. 2016, 181, 296–299. [Google Scholar] [CrossRef]
- Ning, J.F.; Zhao, G.P. Sound absorption characteristics of multilayer porous metal materials backed with an air gap. J. Vib. Control 2016, 22, 2861–2872. [Google Scholar]
- Otaru, A.J. Enhancing the sound absorption performance of porous metals using tomography images. Appl. Acoust. 2019, 143, 183–189. [Google Scholar] [CrossRef]
- Chen, W.J.; Liu, S.T.; Tong, L.Y.; Li, S. Design of multi-layered porous fibrous metals for optimal sound absorption in the low frequency range. Theor. Appl. Mech. Lett. 2016, 6, 42–48. [Google Scholar] [CrossRef]
- Cheng, W.; Duan, C.Y.; Liu, P.S.; Lu, M. Sound absorption performance of various nickel foam-base multi-layer structures in range of low frequency. Trans. Nonferr. Metal. Soc. 2017, 27, 1989–1995. [Google Scholar] [CrossRef]
- Ao, Q.B.; Wang, J.Z.; Tang, H.P.; Zhi, H.; Ma, J.; Bao, T.F. Sound absorption characteristics and structure optimization of porous metal fibrous materials. Rare Metal Mat. Eng. 2015, 44, 2646–2650. [Google Scholar]
- Bai, P.F.; Shen, X.M.; Zhang, X.N.; Yang, X.C.; Yin, Q.; Liu, A.X. Influences of compression ratio on sound absorption performance of porous nickel-iron alloy. Metals 2018, 8, 539. [Google Scholar] [CrossRef]
- Bai, P.F.; Yang, X.C.; Shen, X.M.; Zhang, X.N.; Li, Z.Z.; Yin, Q.; Jiang, G.L.; Yang, F. Sound absorption performance of the acoustic absorber fabricated by compression and microperforation of the porous metal. Mater. Des. 2019, 167, 107637. [Google Scholar] [CrossRef]
- Yang, X.C.; Shen, X.M.; Bai, P.F.; He, X.H.; Zhang, X.N.; Li, Z.Z.; Chen, L.; Yin, Q. Preparation and characterization of gradient compressed porous metal for high-efficiency and thin-thickness acoustic absorber. Materials 2019, 12, 1413. [Google Scholar] [CrossRef]
- Verdière, K.; Panneton, R.; Elkoun, S.; Dupont, T.; Leclaire, P. Transfer matrix method applied to the parallel assembly of sound absorbing materials. J. Acoust. Soc. Am. 2013, 134, 4648–4658. [Google Scholar] [CrossRef]
- Shen, X.M.; Bai, P.F.; Yang, X.C.; Zhang, X.N.; To, S. Low-frequency sound absorption by optimal combination structure of porous metal and microperforated panel. Appl. Sci. 2019, 9, 1507. [Google Scholar] [CrossRef]
- Kino, N. Further investigations of empirical improvements to the Johnson–Champoux–Allard model. Appl. Acoust. 2015, 96, 153–170. [Google Scholar] [CrossRef]
- Yang, X.C.; Peng, K.; Shen, X.M.; Zhang, X.N.; Bai, P.F.; Xu, P.J. Geometrical and dimensional optimization of sound absorbing porous copper with cavity. Mater. Des. 2017, 131, 297–306. [Google Scholar] [CrossRef]
- Yang, X.S.; Deb, S. Engineering Optimisation by Cuckoo Search. Int. J. Math. Model. Numer. Optim. 2010, 1, 330–343. [Google Scholar] [CrossRef]
- Yang, X.S.; Deb, S. Cuckoo search: recent advances and applications. Neural Comput. Appl. 2014, 24, 169–174. [Google Scholar] [CrossRef]
- Yang, X.C.; Bai, P.F.; Shen, X.M.; To, S.; Chen, L.; Zhang, X.N.; Yin, Q. Optimal design and experimental validation of sound absorbing multilayer microperforated panel with constraint conditions. Appl. Acoust. 2019, 146, 334–344. [Google Scholar] [CrossRef]
- Liu, J.; Chen, T.T.; Zhang, Y.H.; Wen, G.L.; Qing, Q.X.; Wang, H.X.; Sedaghati, R.; Xie, Y.M. On sound insulation of pyramidal lattice sandwich structure. Compos. Struct. 2019, 208, 385–394. [Google Scholar] [CrossRef]
- Bujoreanu, C.; Nedeff, F.; Benchea, M.; Agop, M. Experimental and theoretical considerations on sound absorption performance of waste materials including the effect of backing plates. Appl. Acoust. 2017, 119, 88–93. [Google Scholar] [CrossRef]
- Yang, X.C.; Bai, P.F.; Shen, X.M.; Zhang, X.N.; Zhu, J.W.; Yin, Q.; Peng, K. Theoretical modeling and experimental validation of sound absorbing coefficient of porous iron. J. Porous Media 2019, 22, 225–241. [Google Scholar] [CrossRef]
- Delany, M.E.; Bazley, E.N. Acoustical properties of fibrous absorbent materials. Appl. Acoust. 1970, 3, 105–116. [Google Scholar] [CrossRef]
- Miki, Y. Acoustical properties of porous materials-Modifications of Delany-Bazley models. J. Acoust. Soc. Jpn. (E) 1990, 11, 19–24. [Google Scholar] [CrossRef]


© 2019 by the authors. Licensee MDPI, Basel, Switzerland. This article is an open access article distributed under the terms and conditions of the Creative Commons Attribution (CC BY) license (http://creativecommons.org/licenses/by/4.0/).