Influences of Cu Content on the Microstructure and Strengthening Mechanisms of Al-Mg-Si-xCu Alloys


Abstract

1. Introduction
2. Experimental Methods
2.1. Materials
2.2. Performance Test
2.3. Microstructure Analysis
3. Results
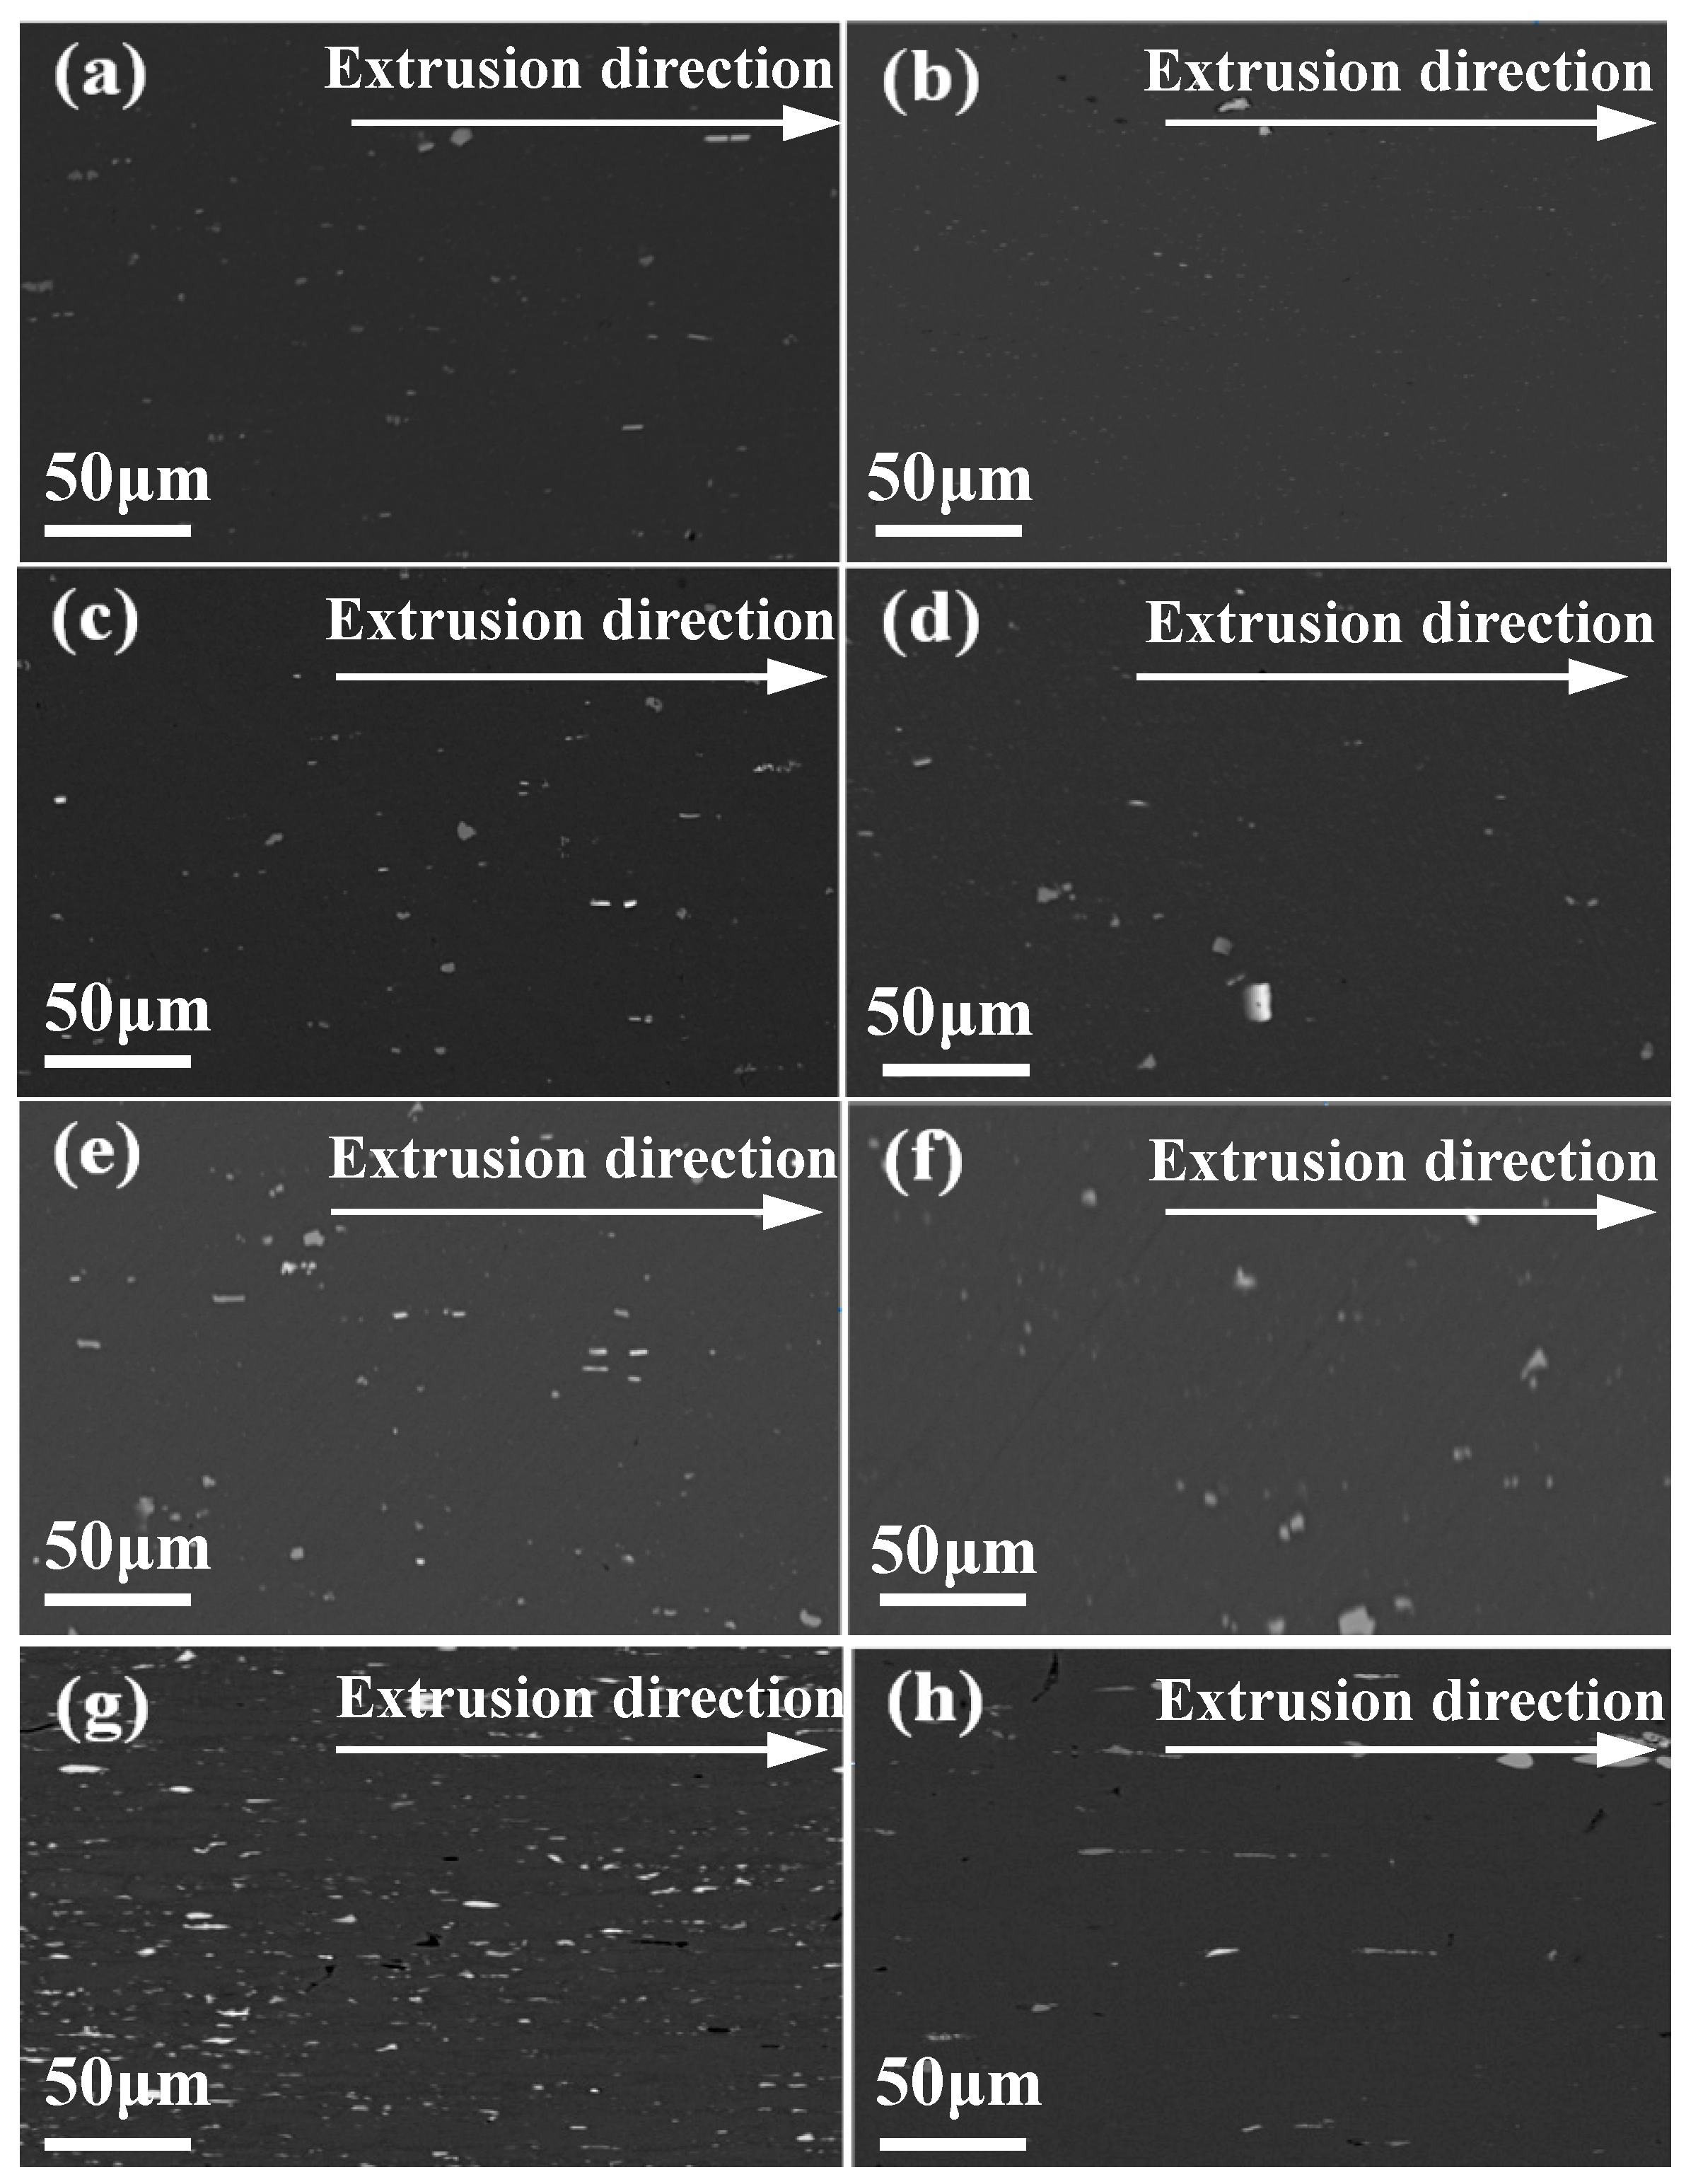
3.1. Effect of Cu Content on the Metallographic Structures of the Alloys
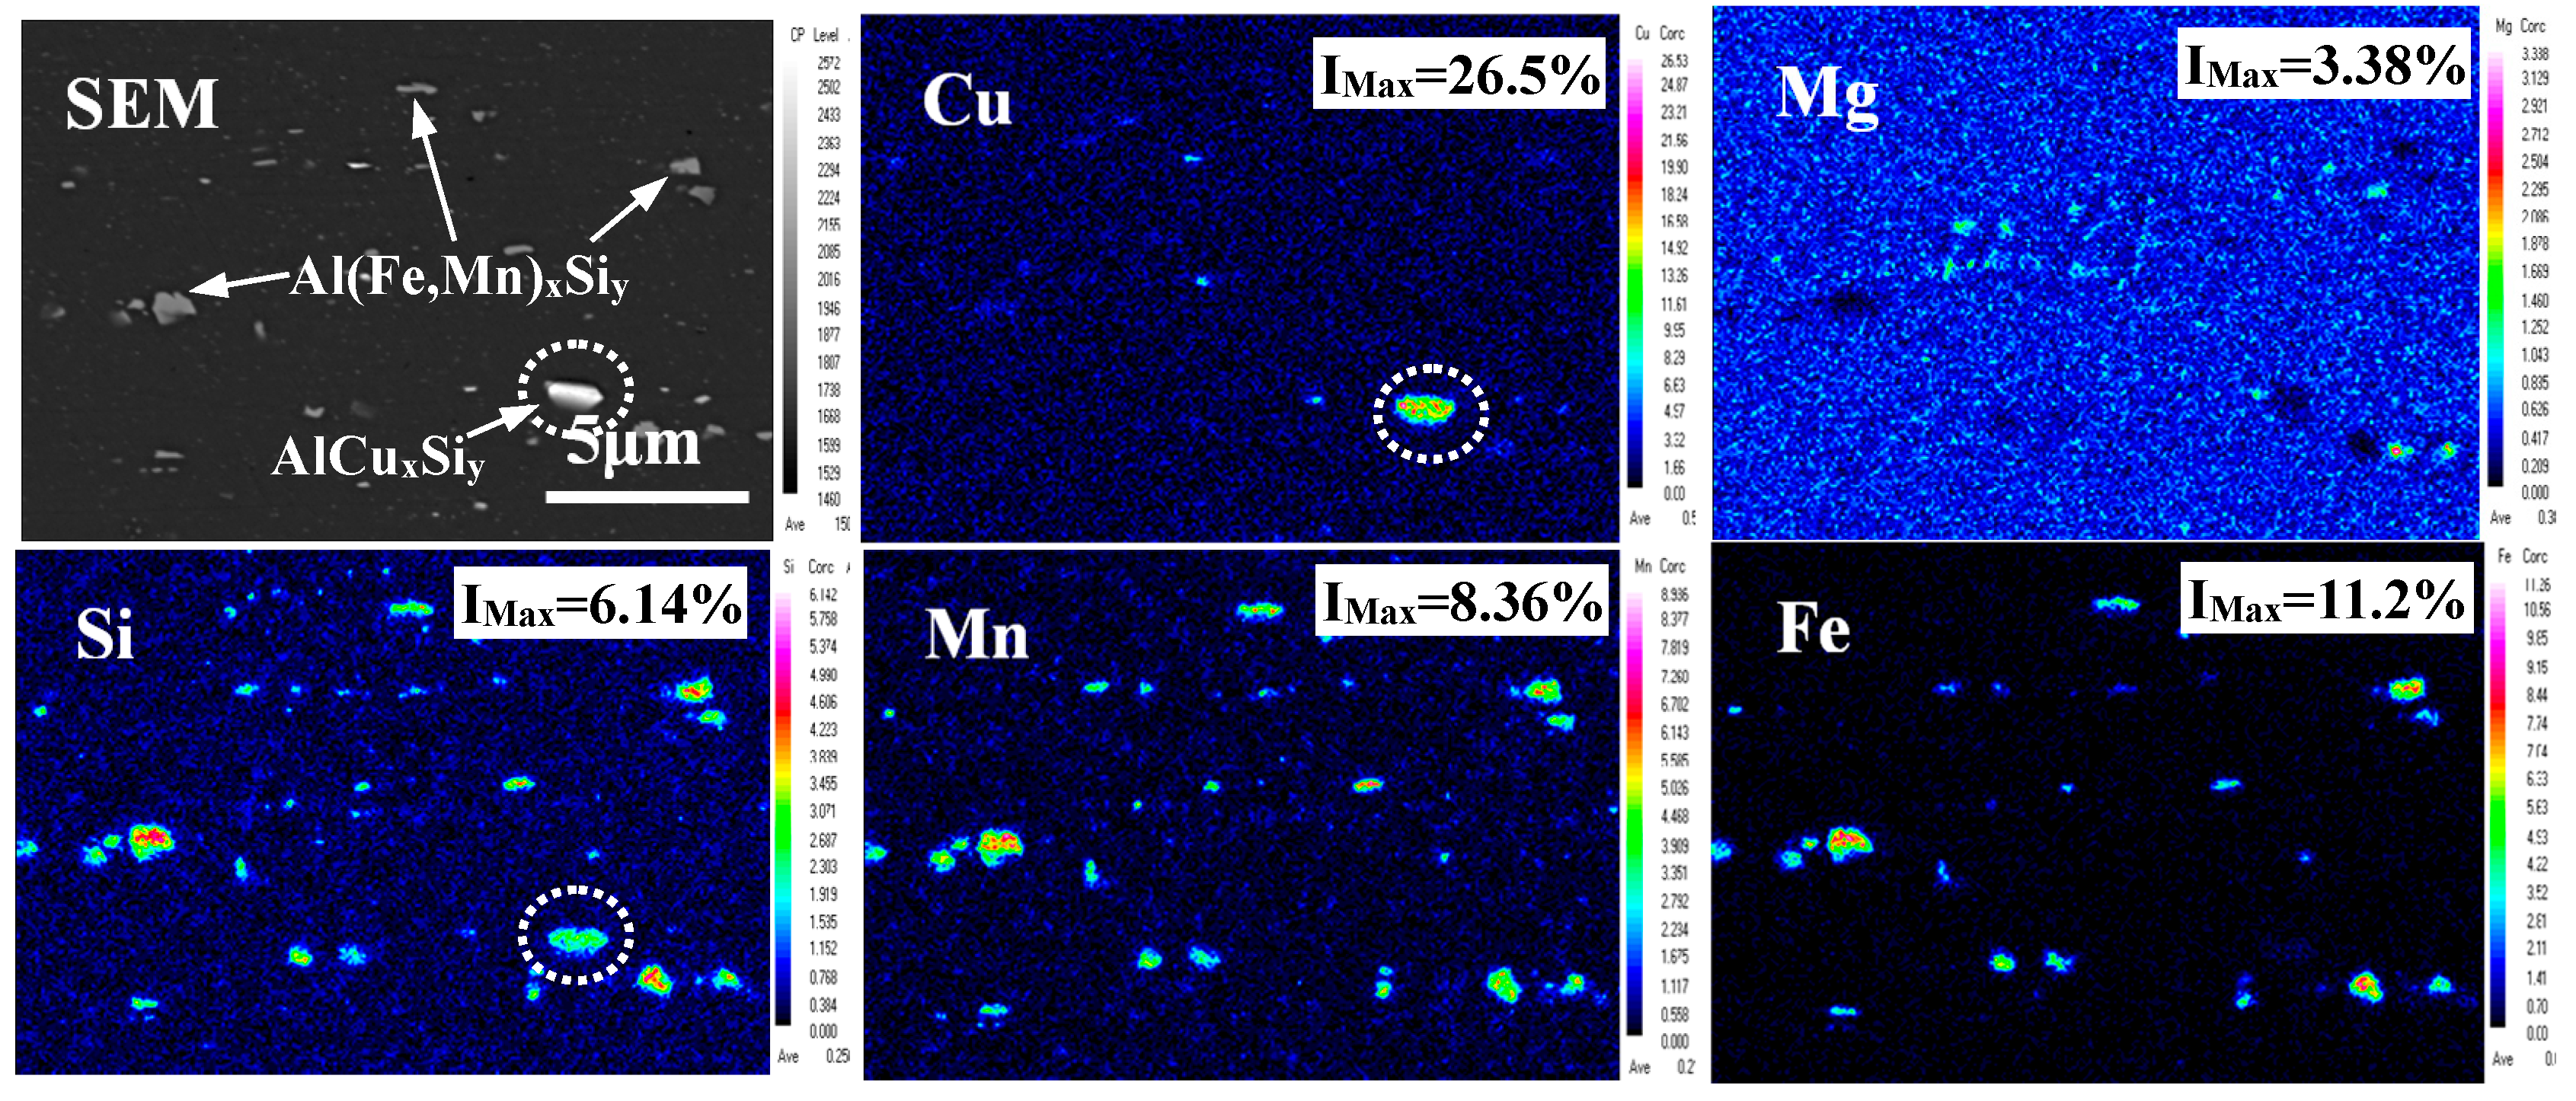
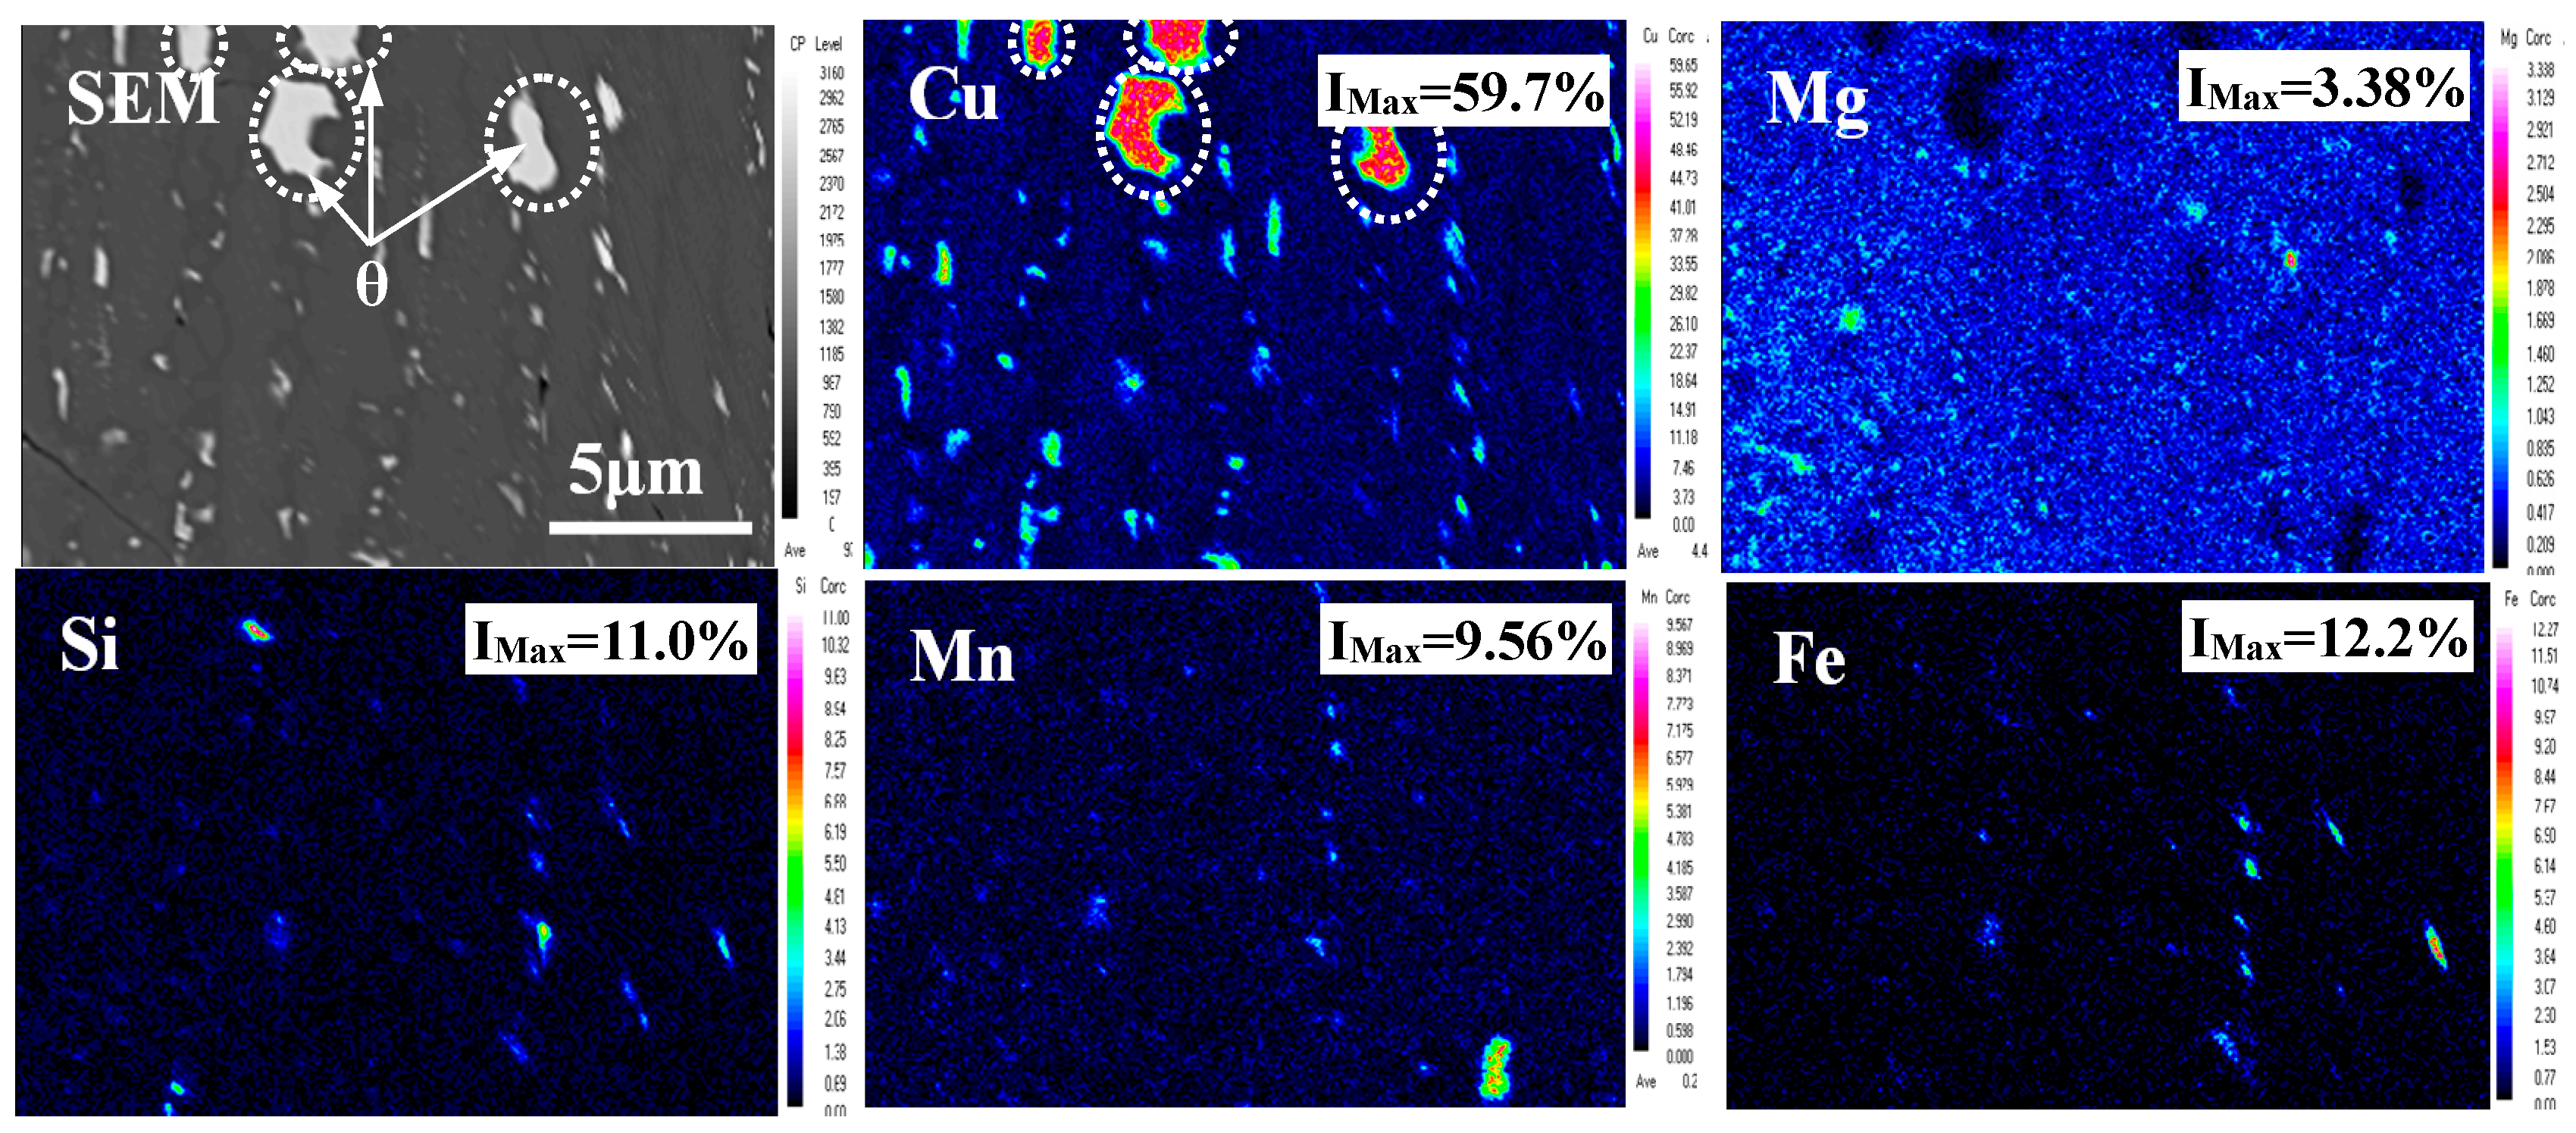
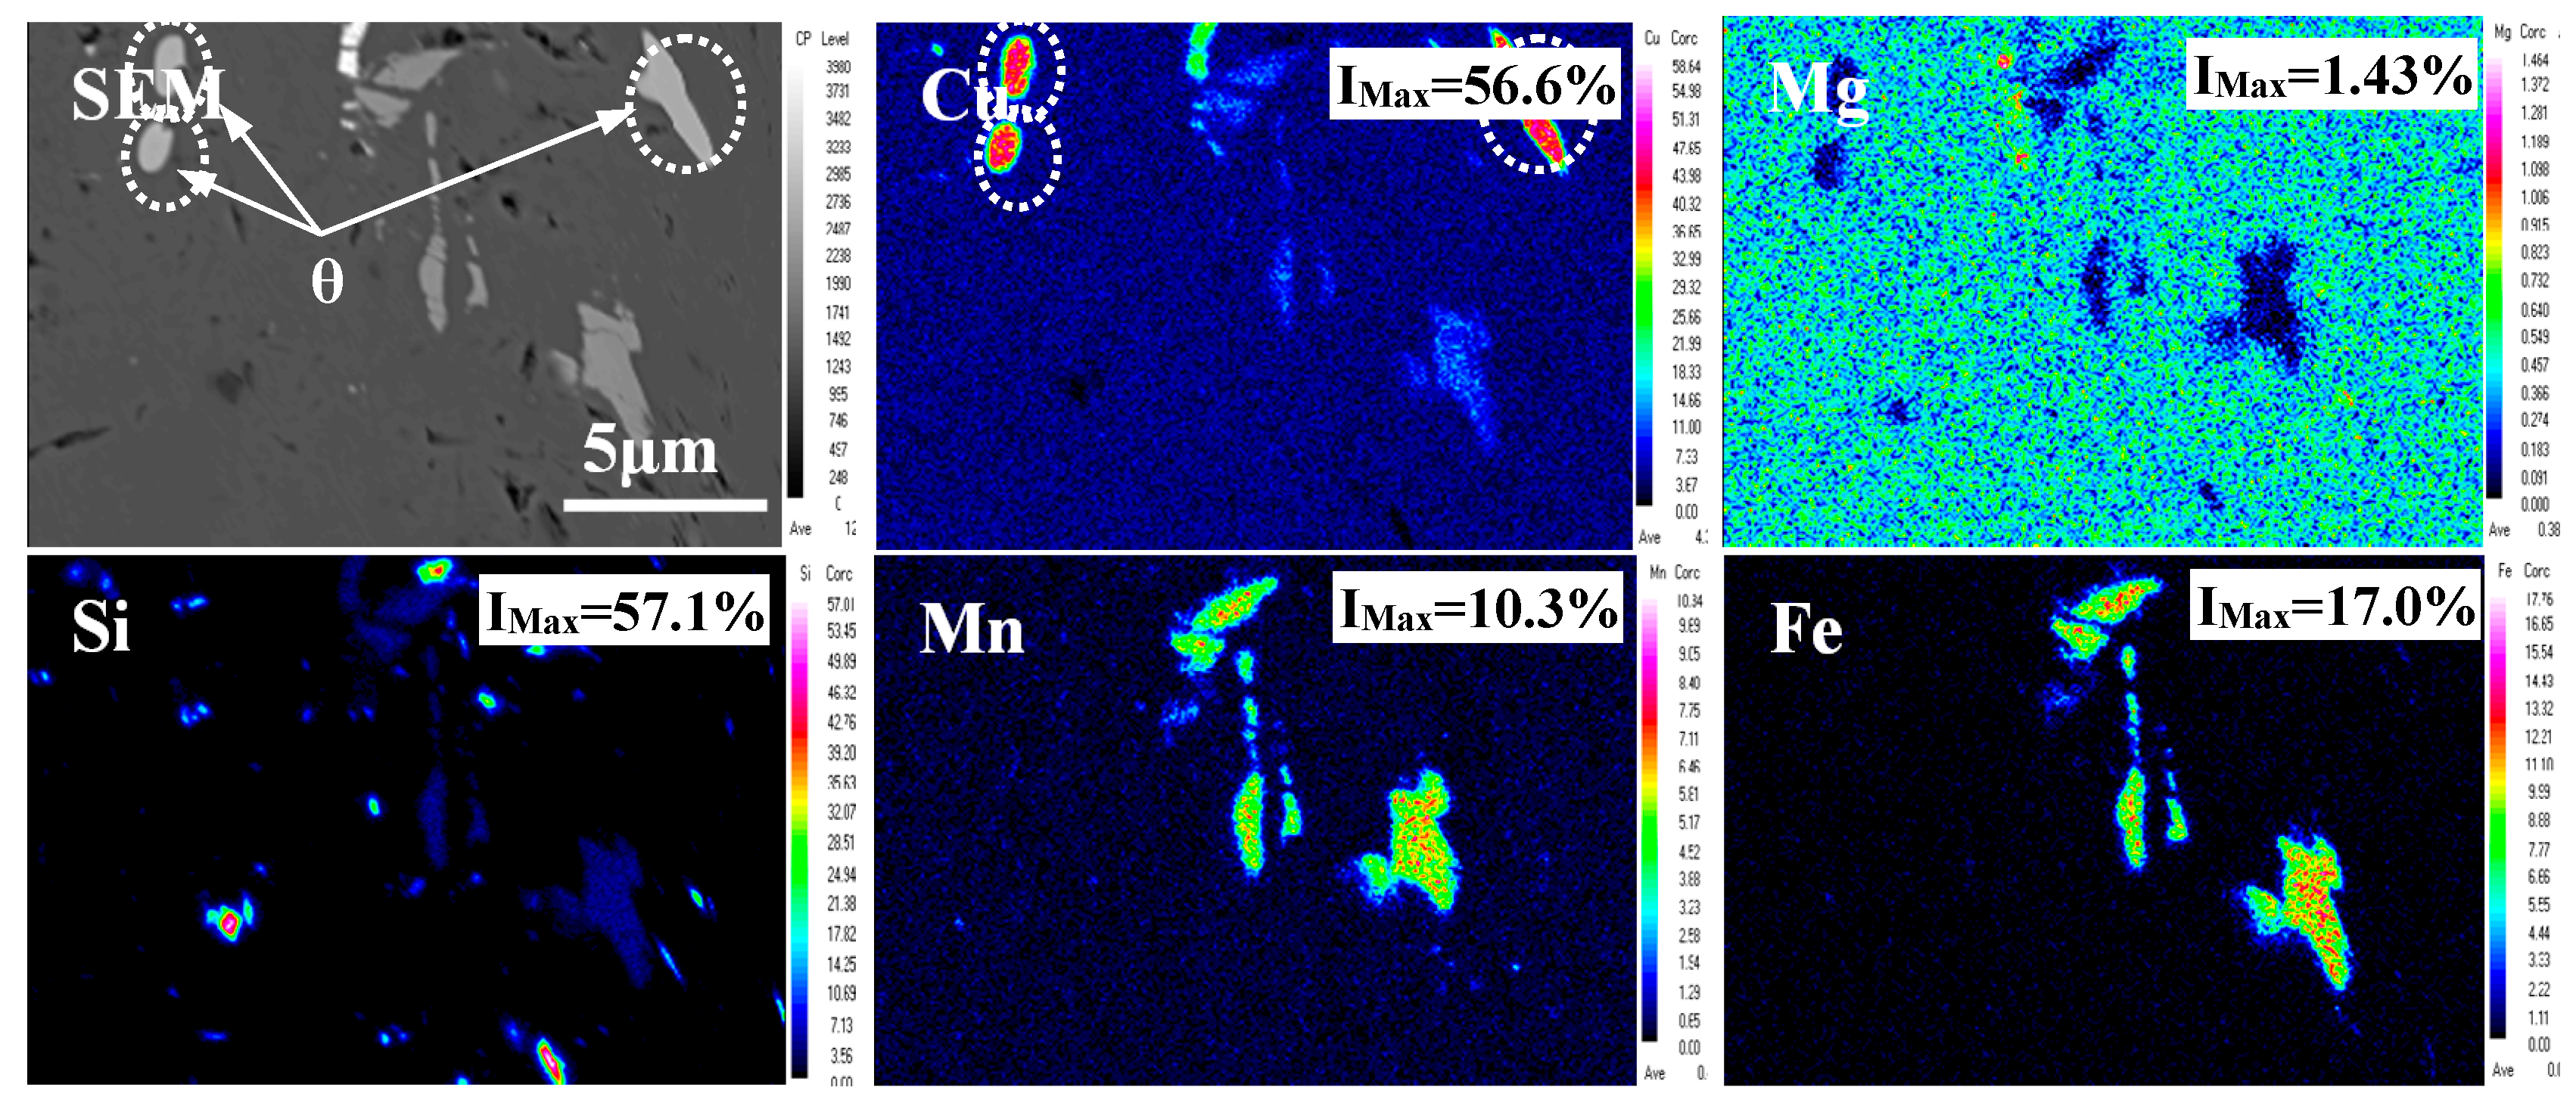
3.2. Influence of Cu Content on the Coarse Second-phase of the Alloys
3.3. Influence of the Cu Content on the Mechanical Properties of the Alloys
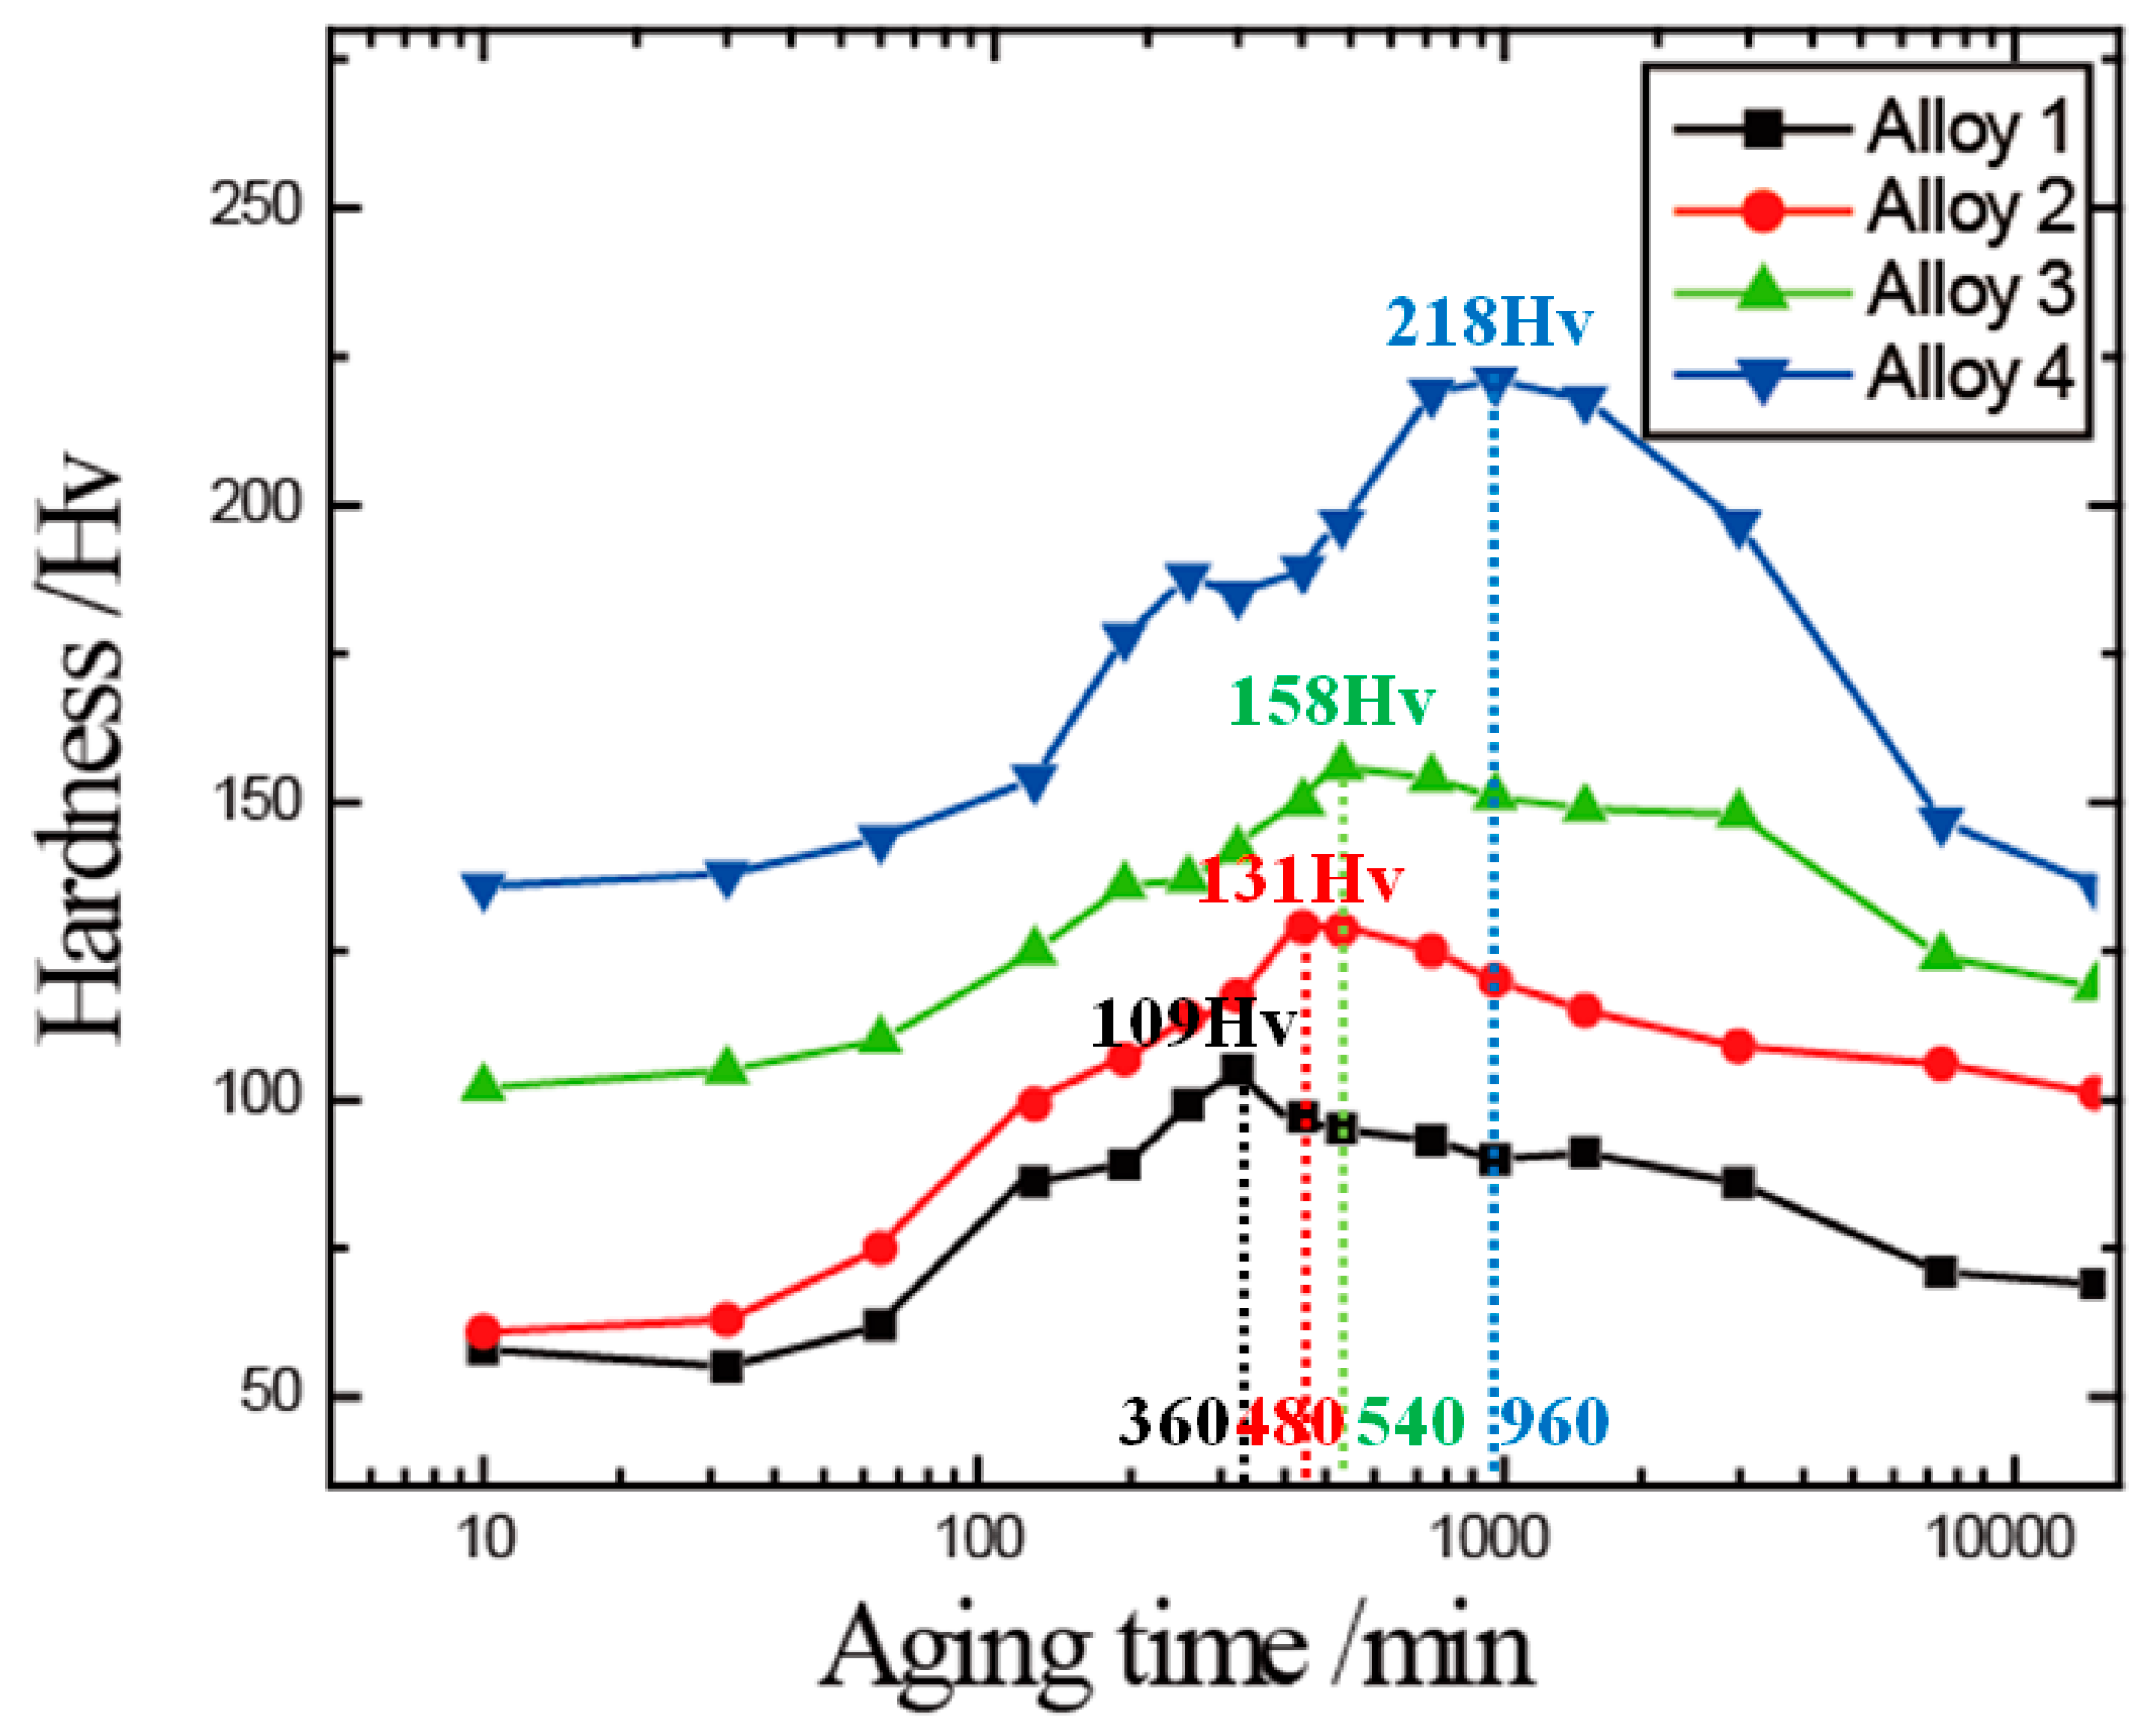
3.3.1. Age-Hardening Curves
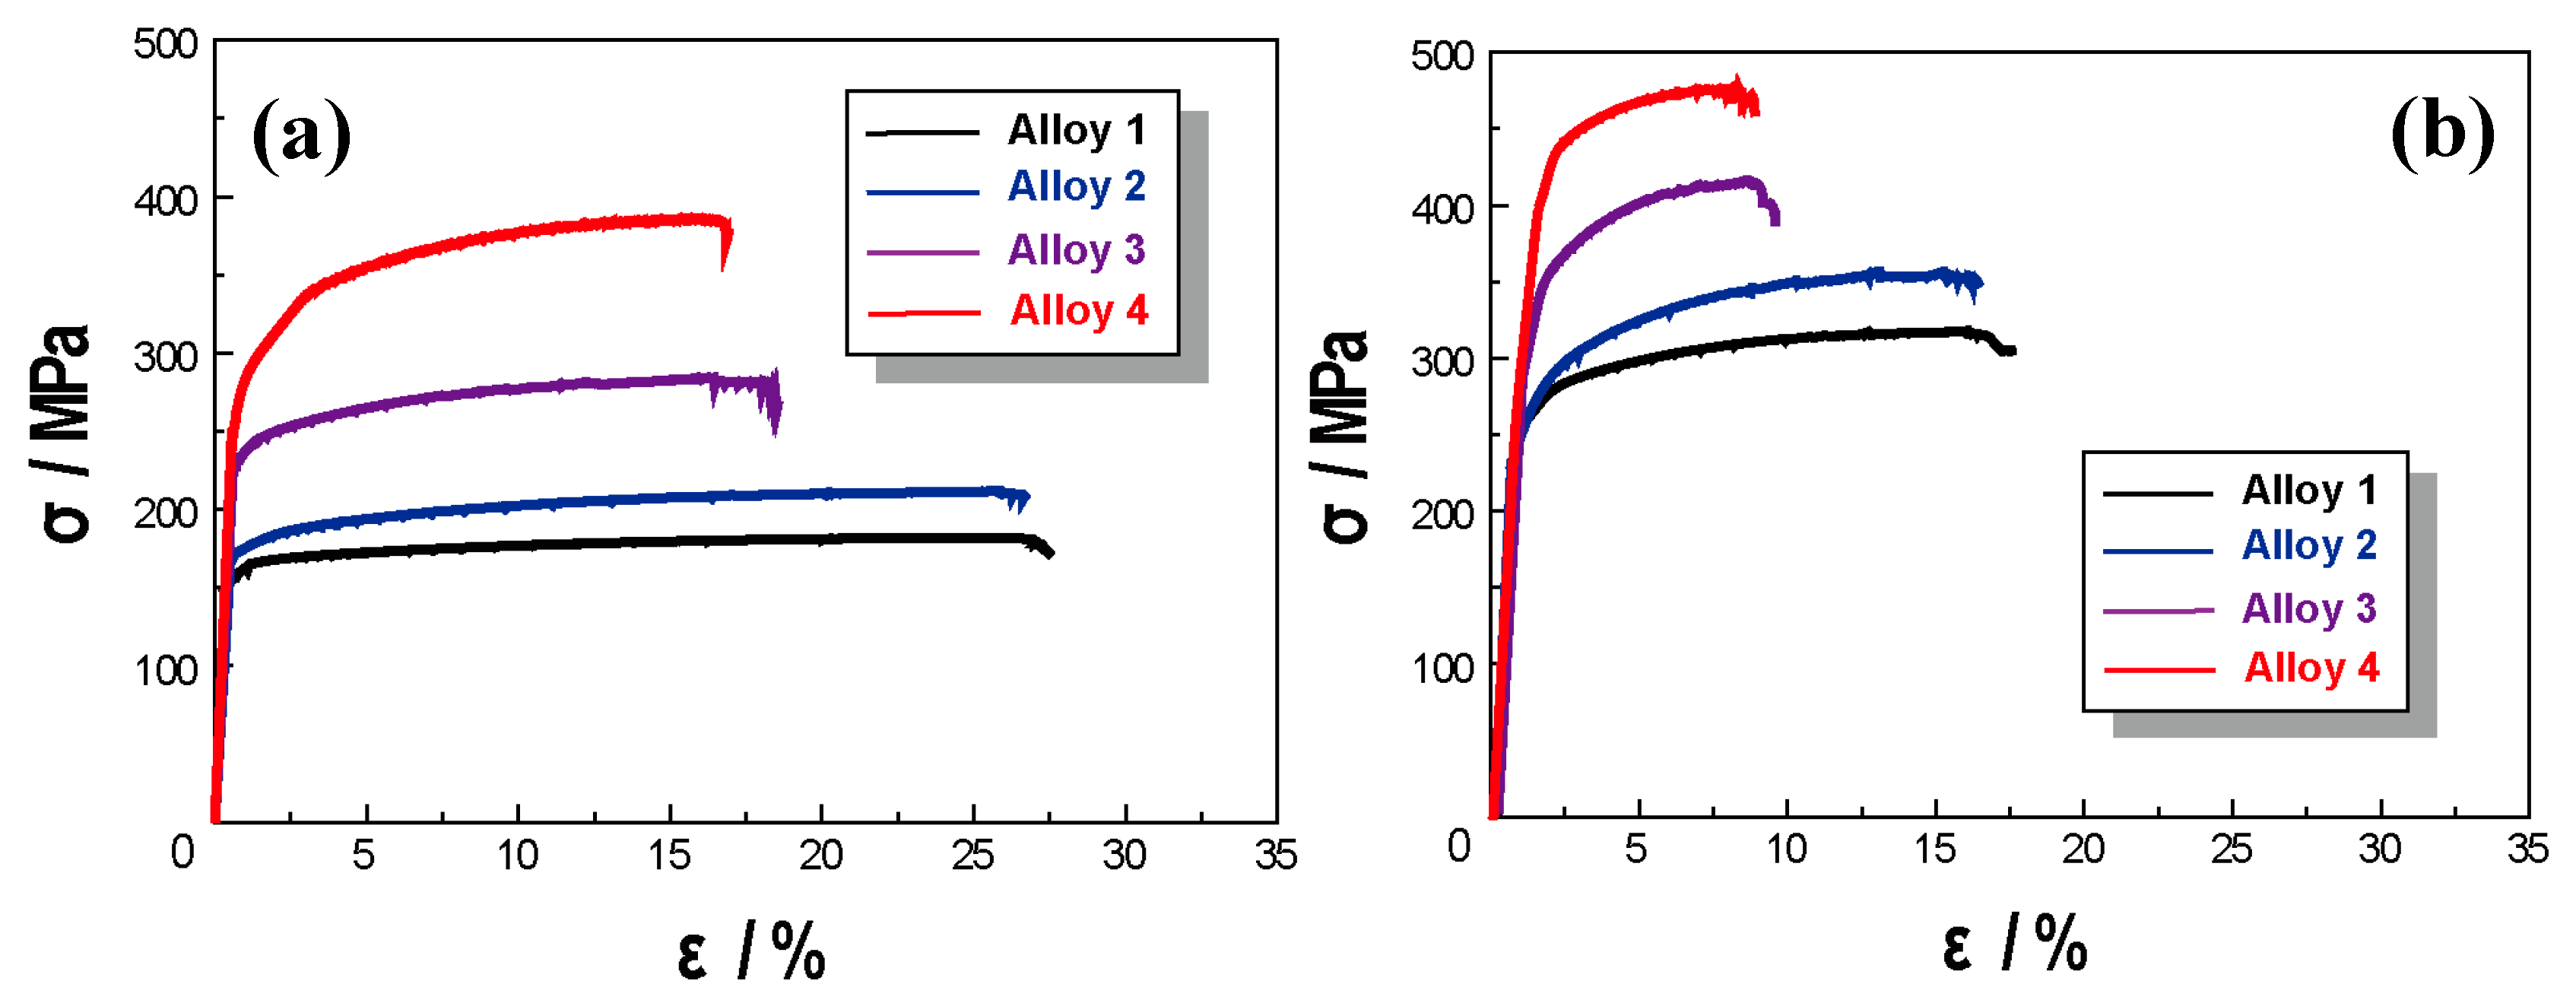
3.3.2. Mechanical Properties
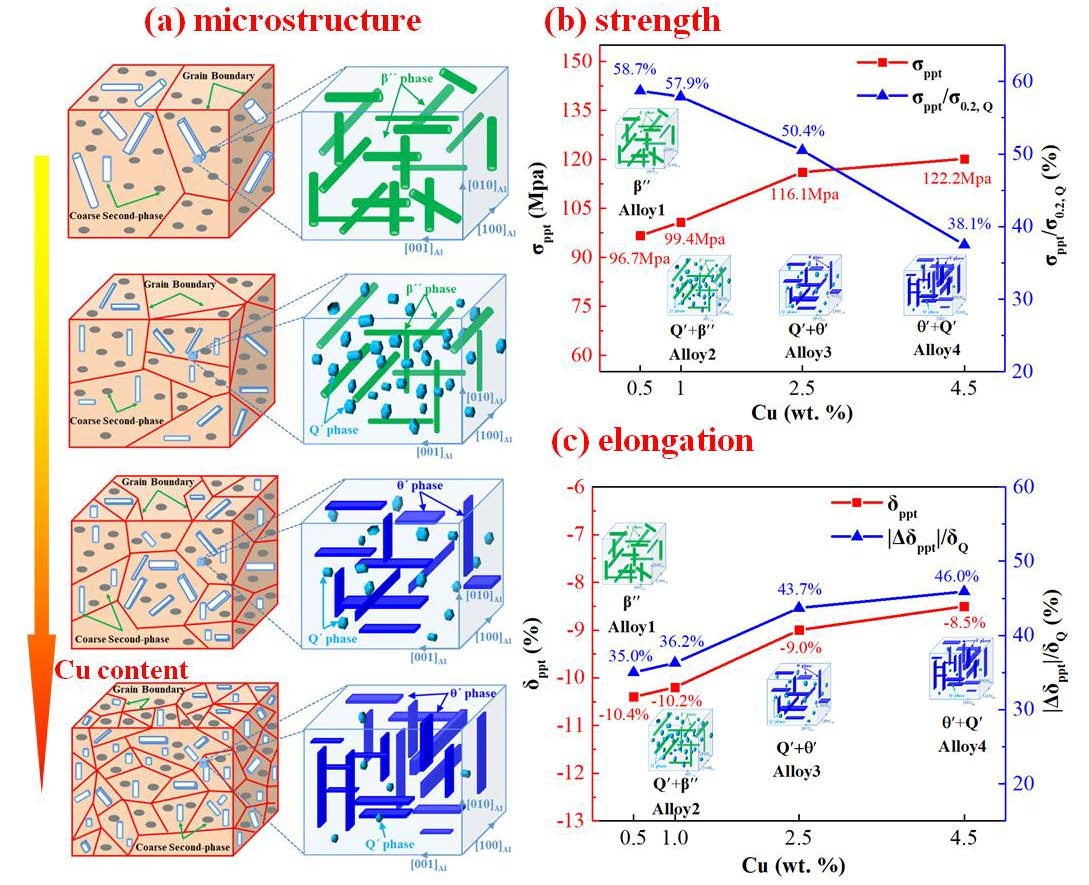
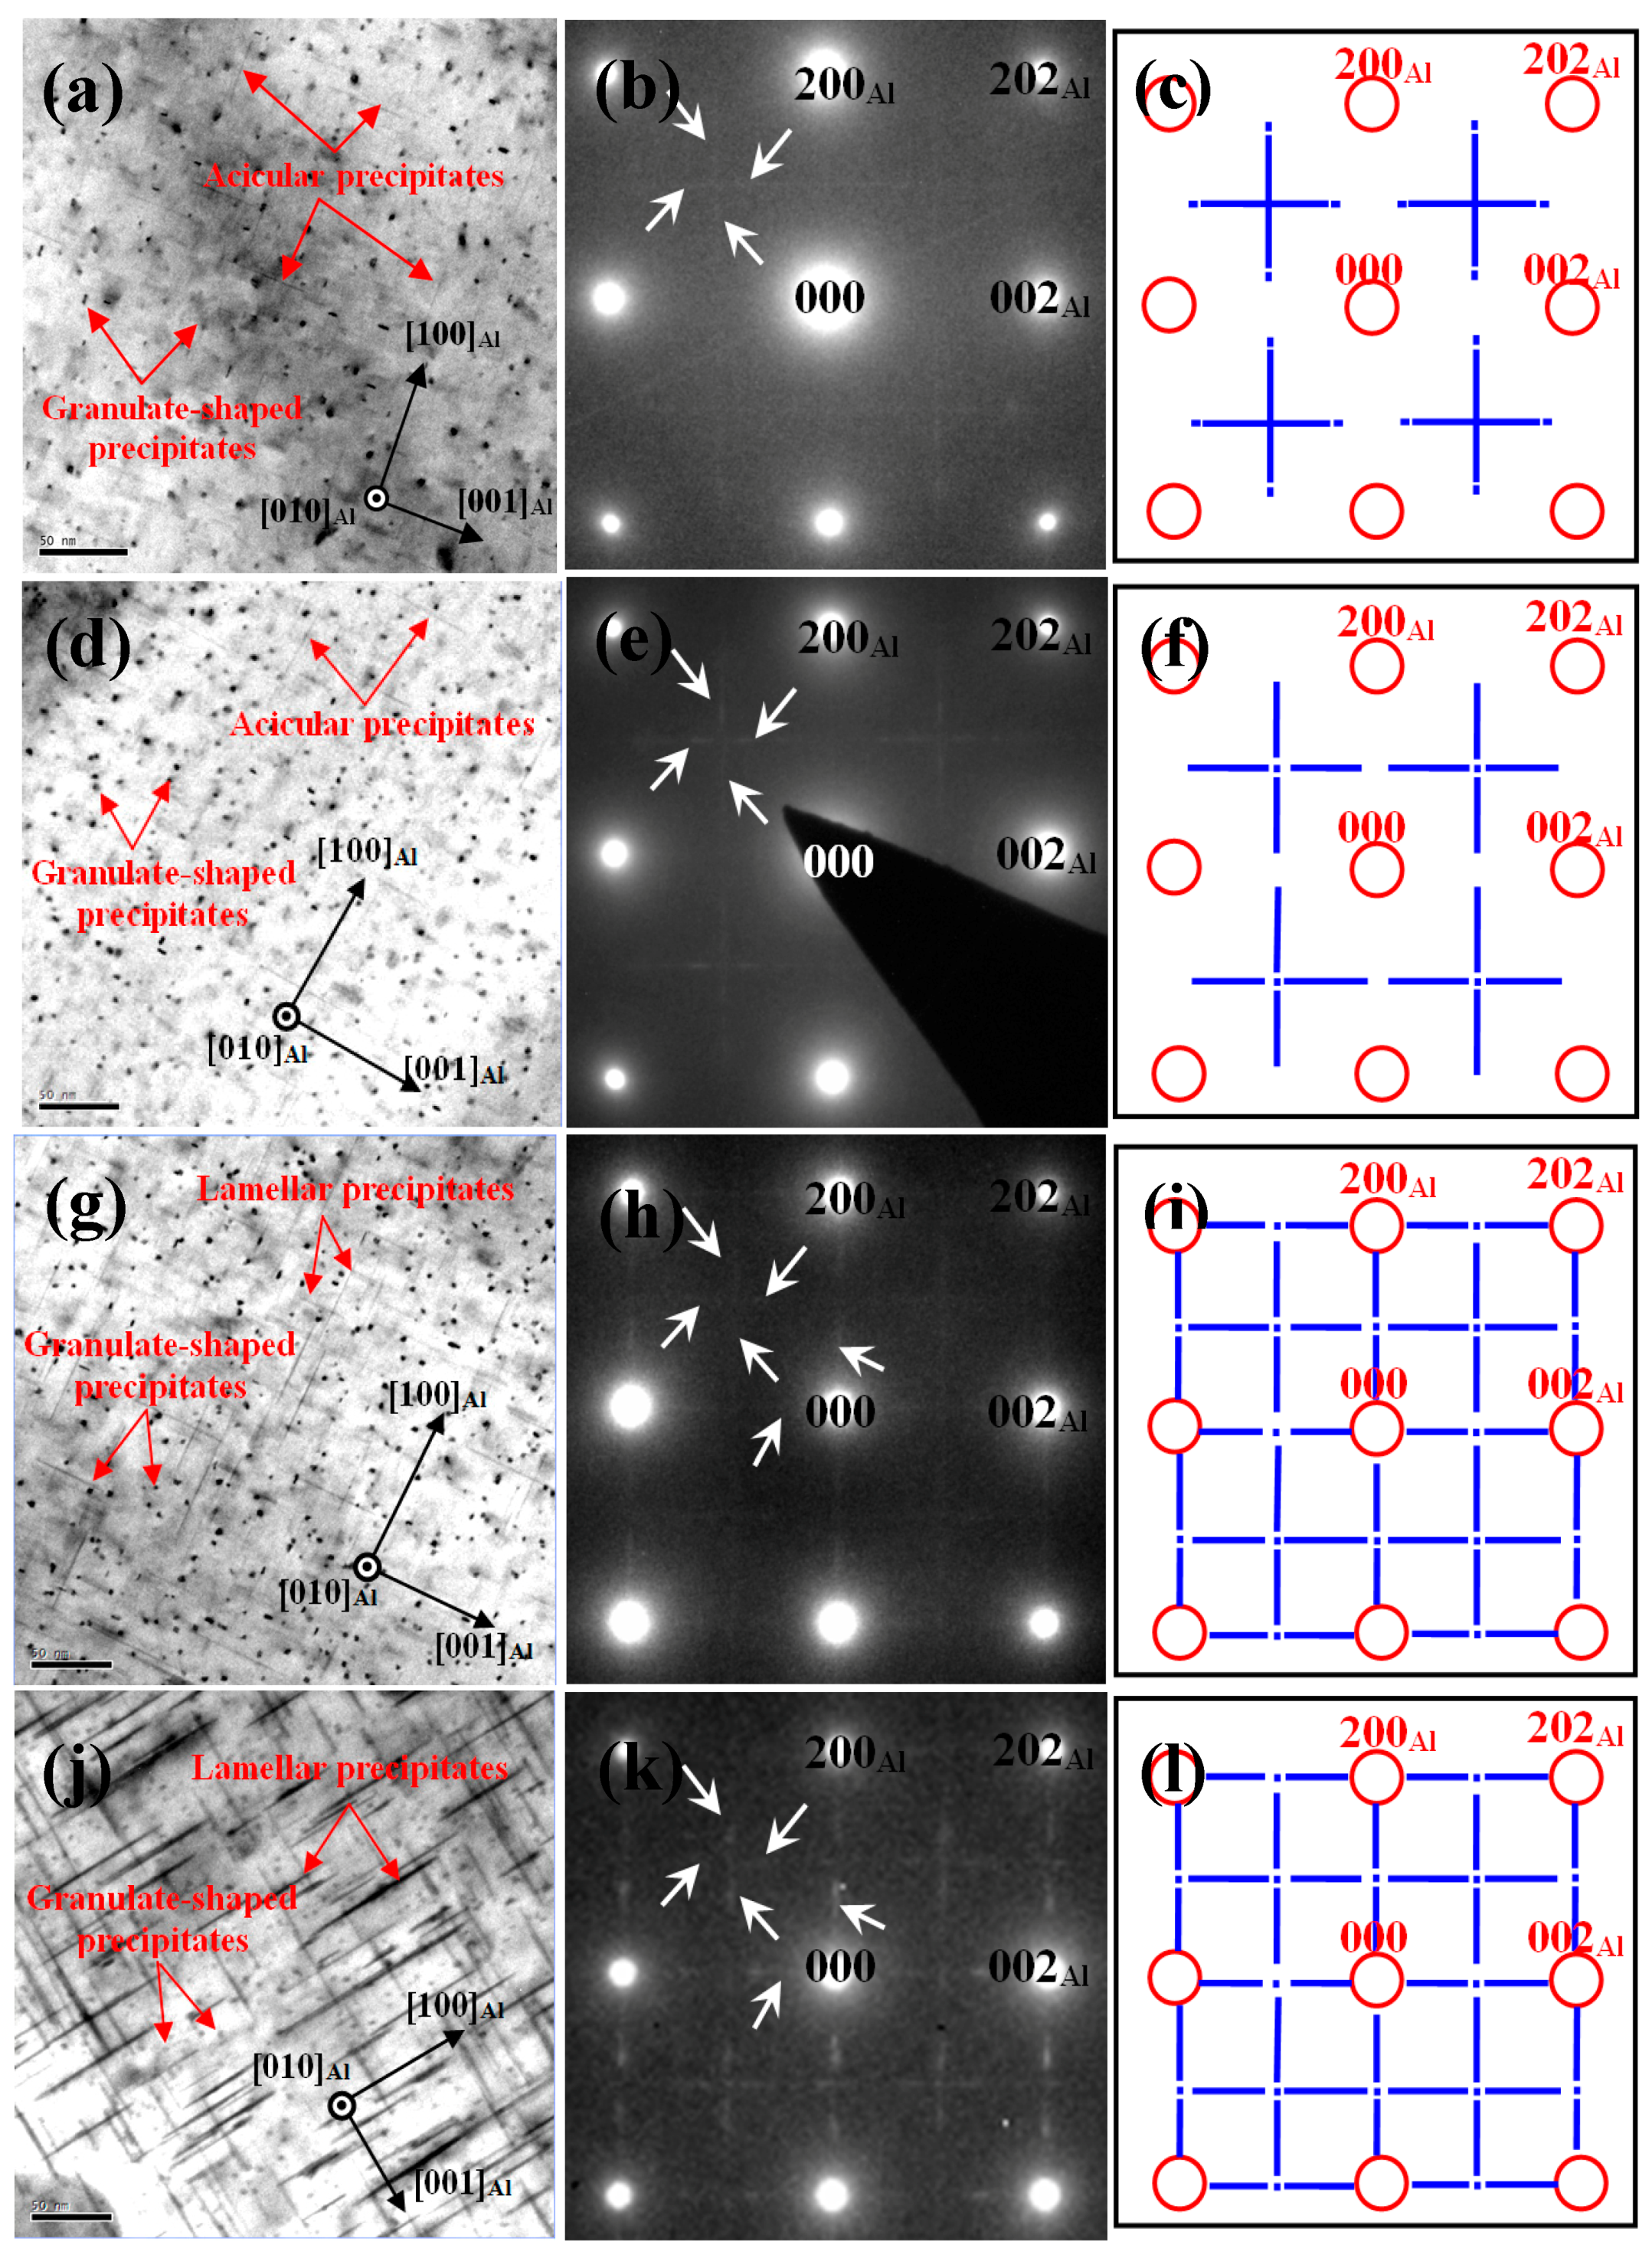
3.4. Influence of the Cu Content on the Precipitates of the Alloys
4. Discussion
4.1. Influence of Cu Content on Alloy Microstructure
4.1.1. Coarse Second-Phase Particles
4.1.2. Grain Size
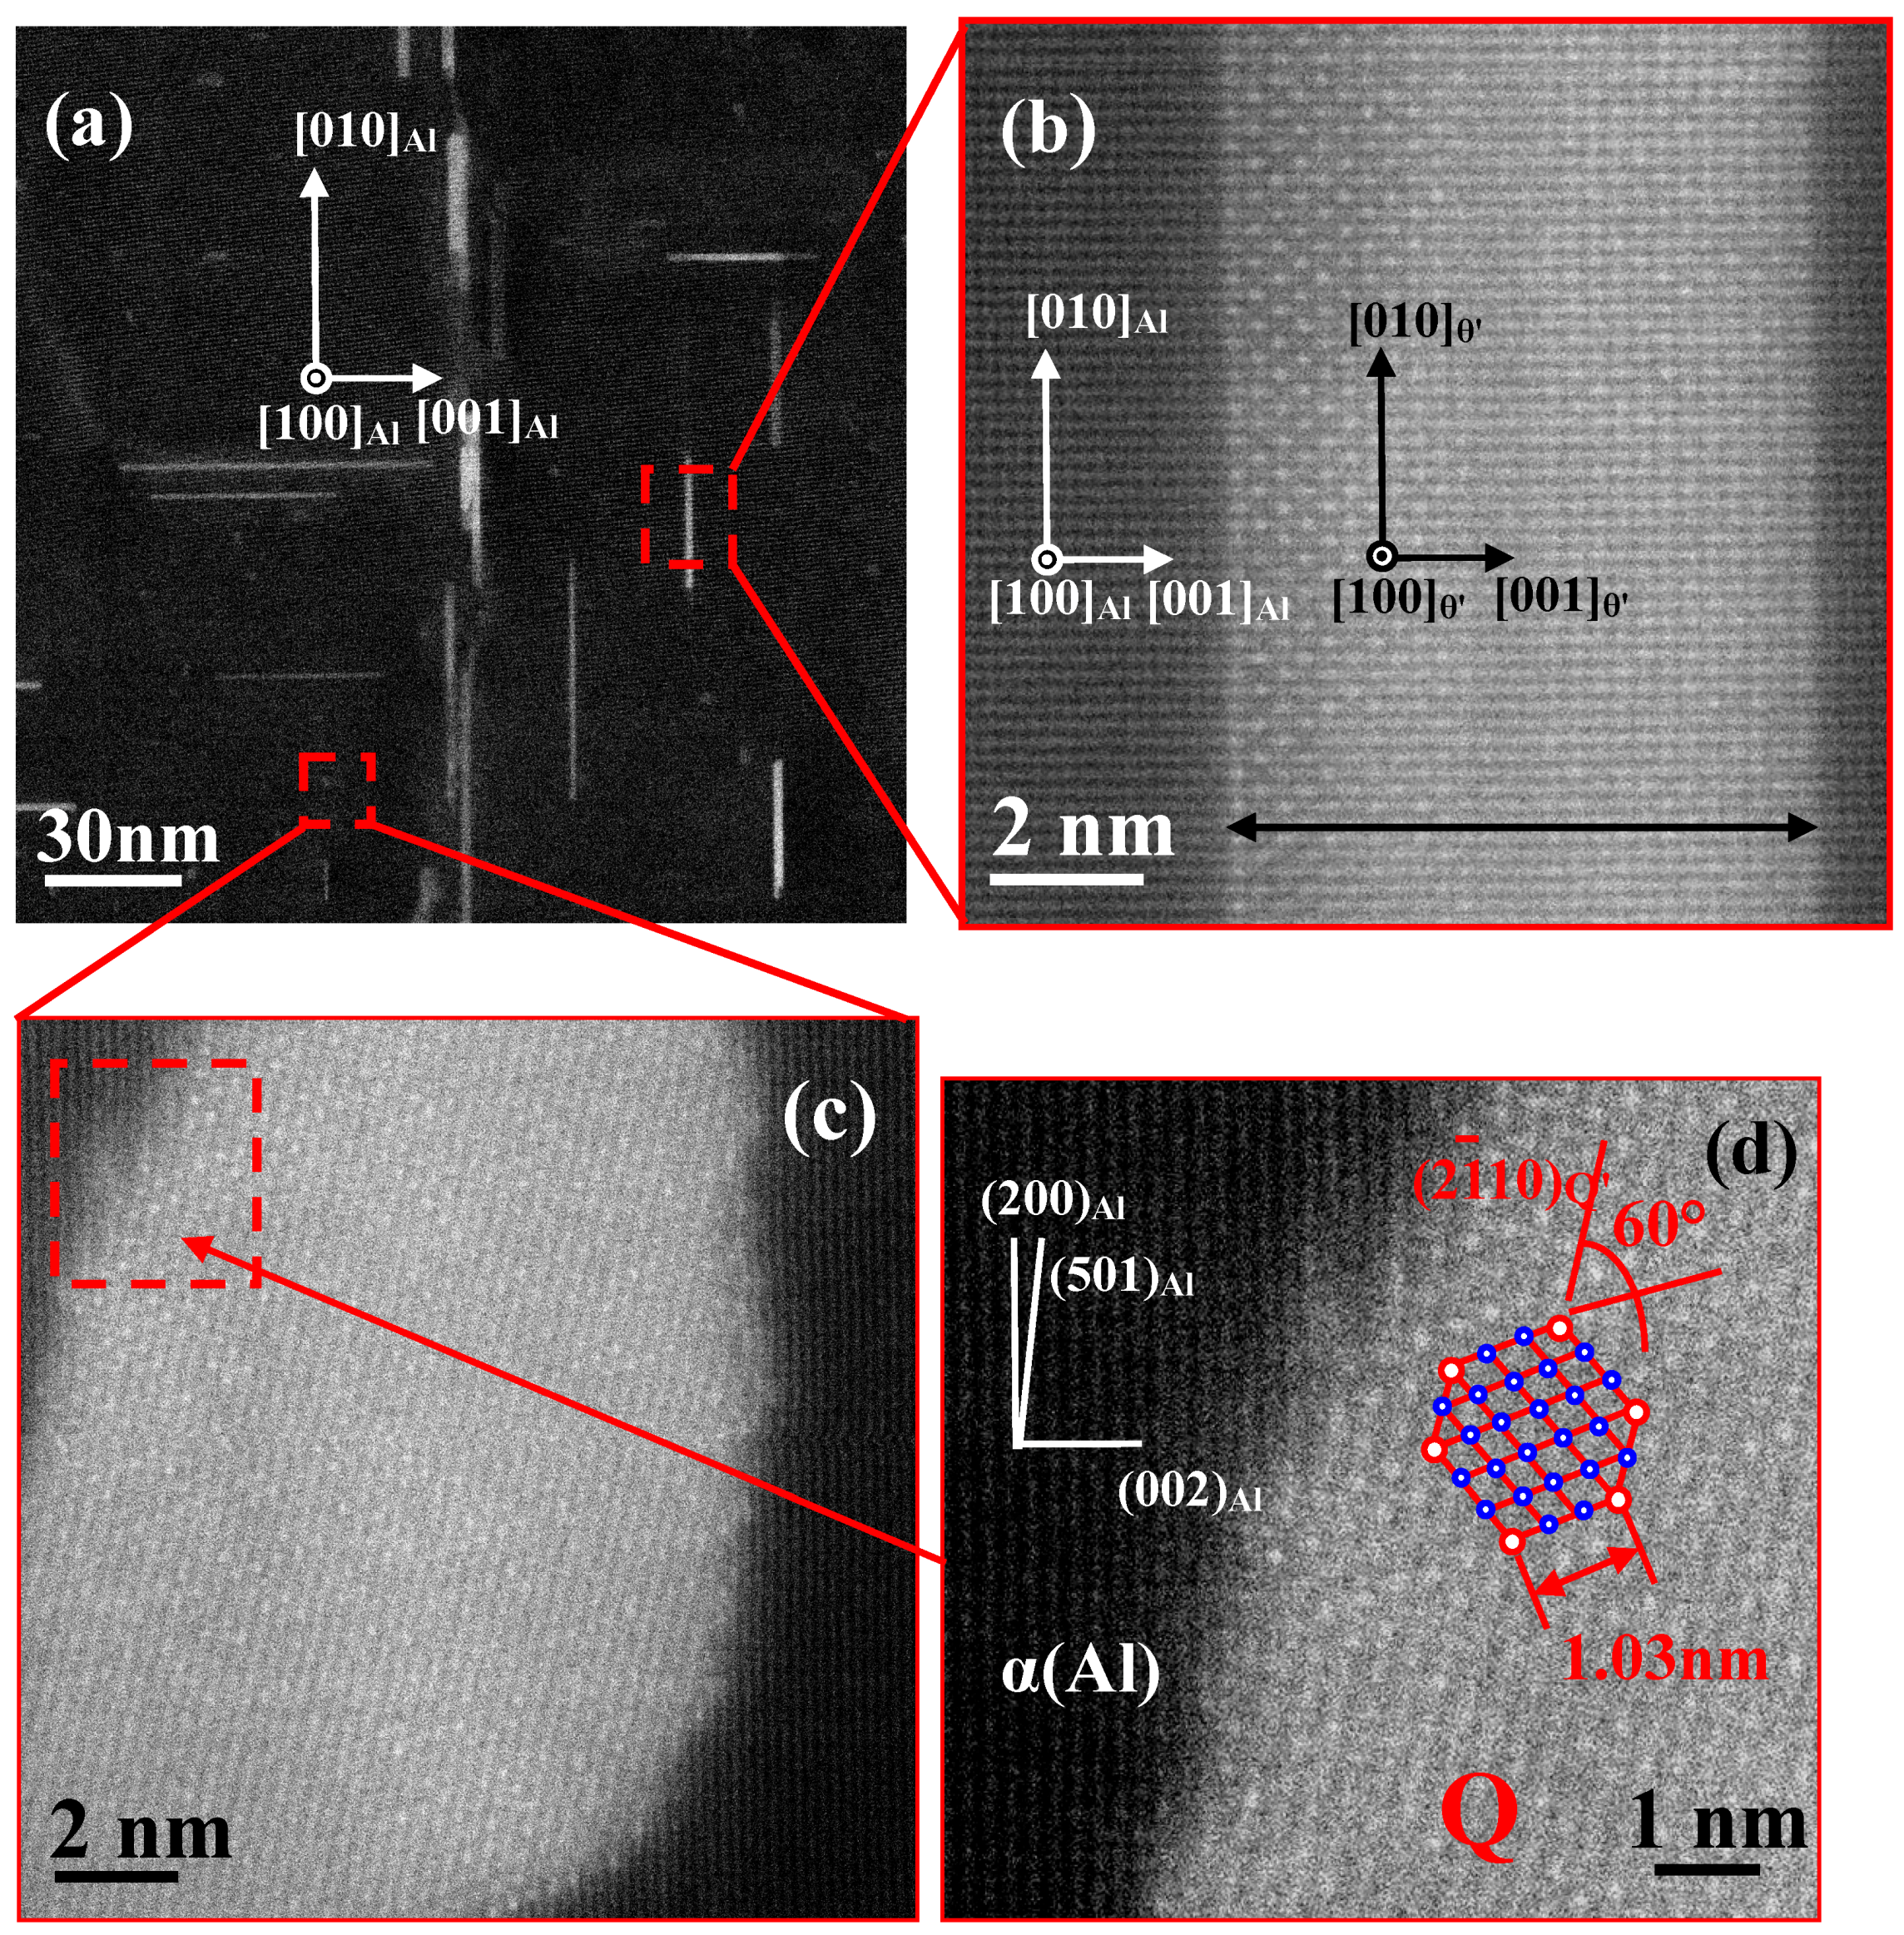
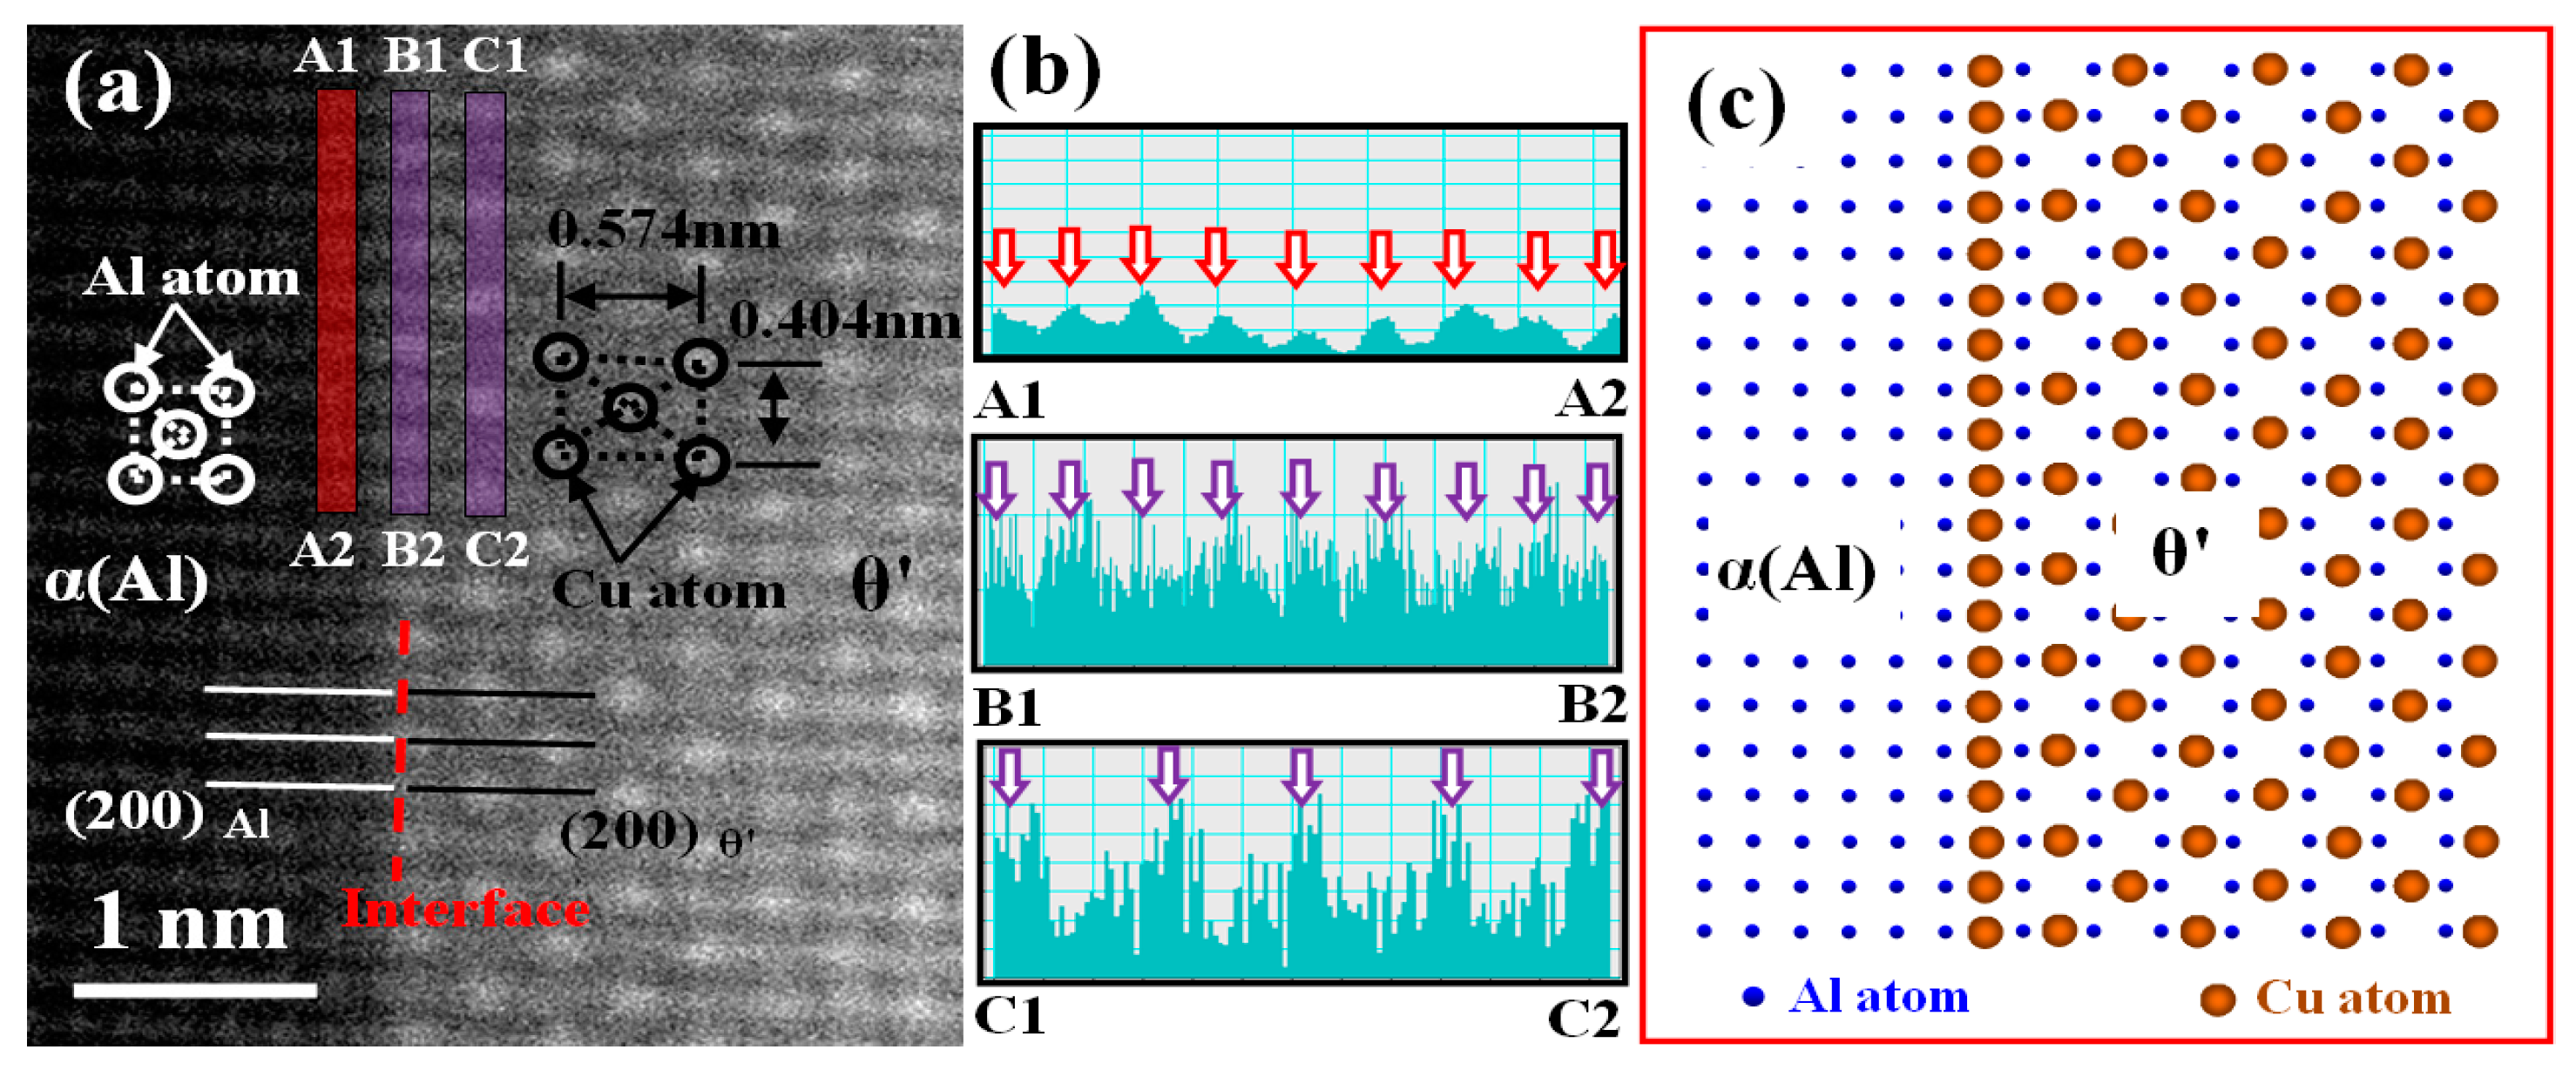
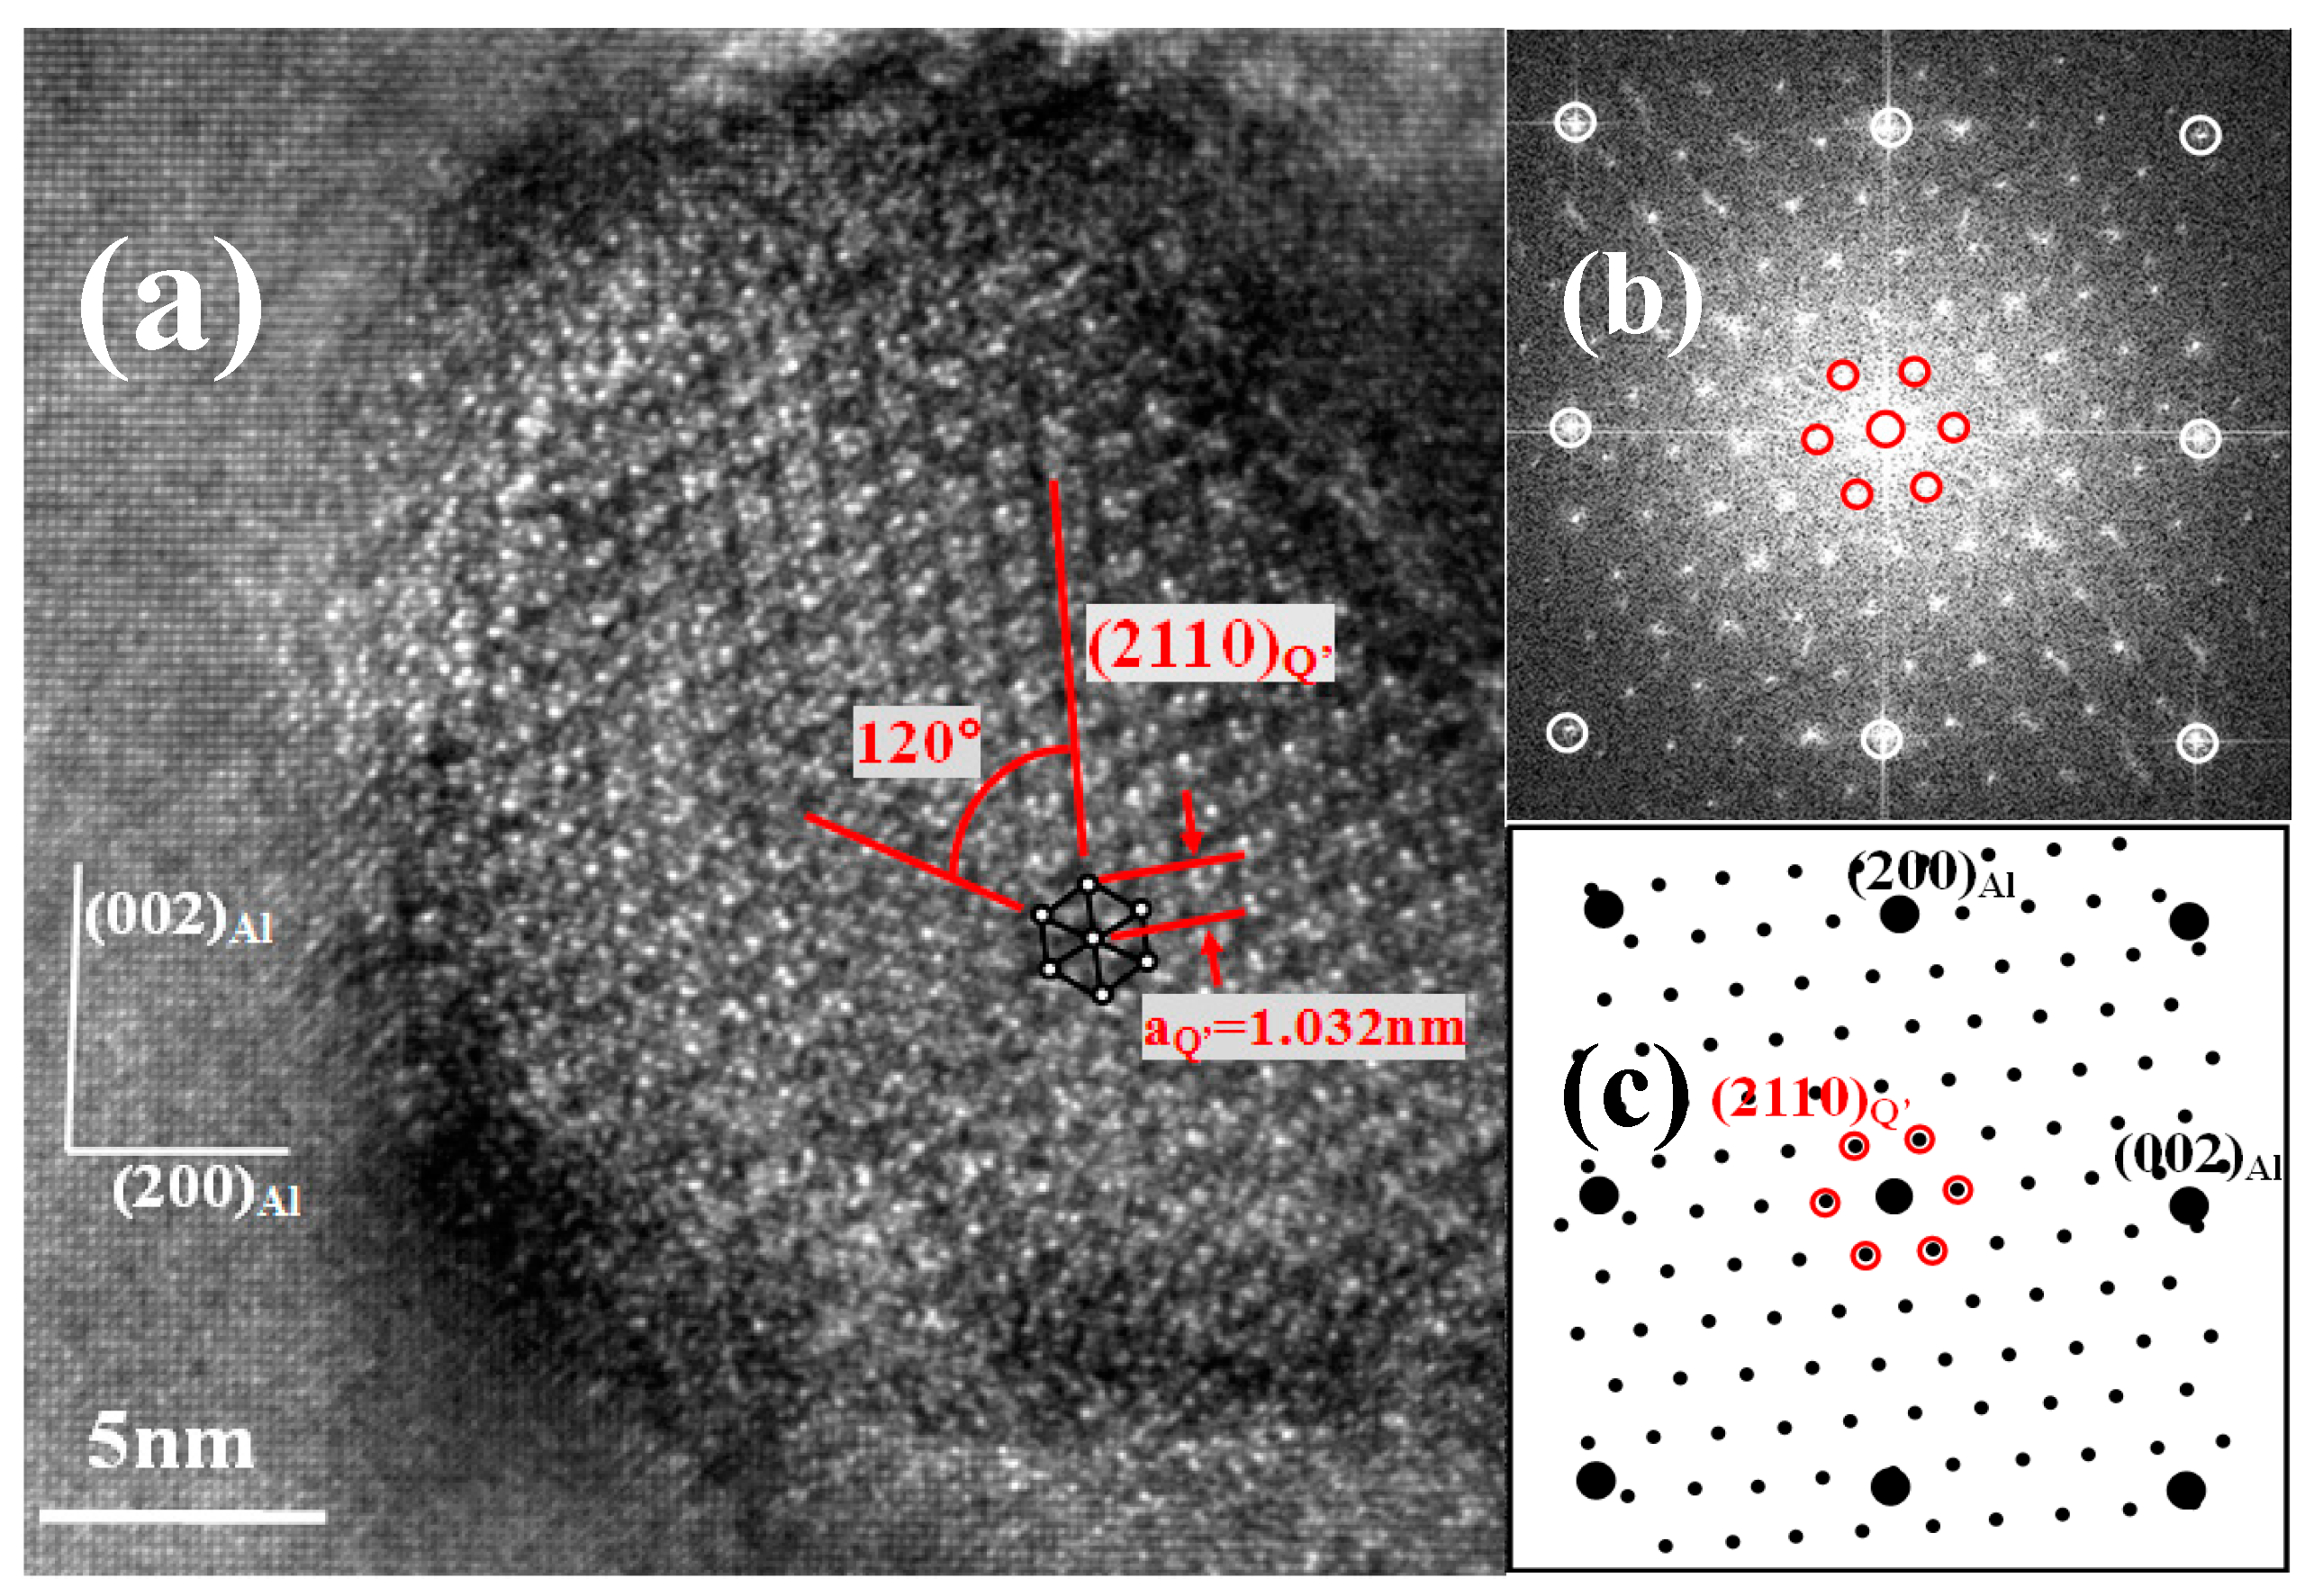
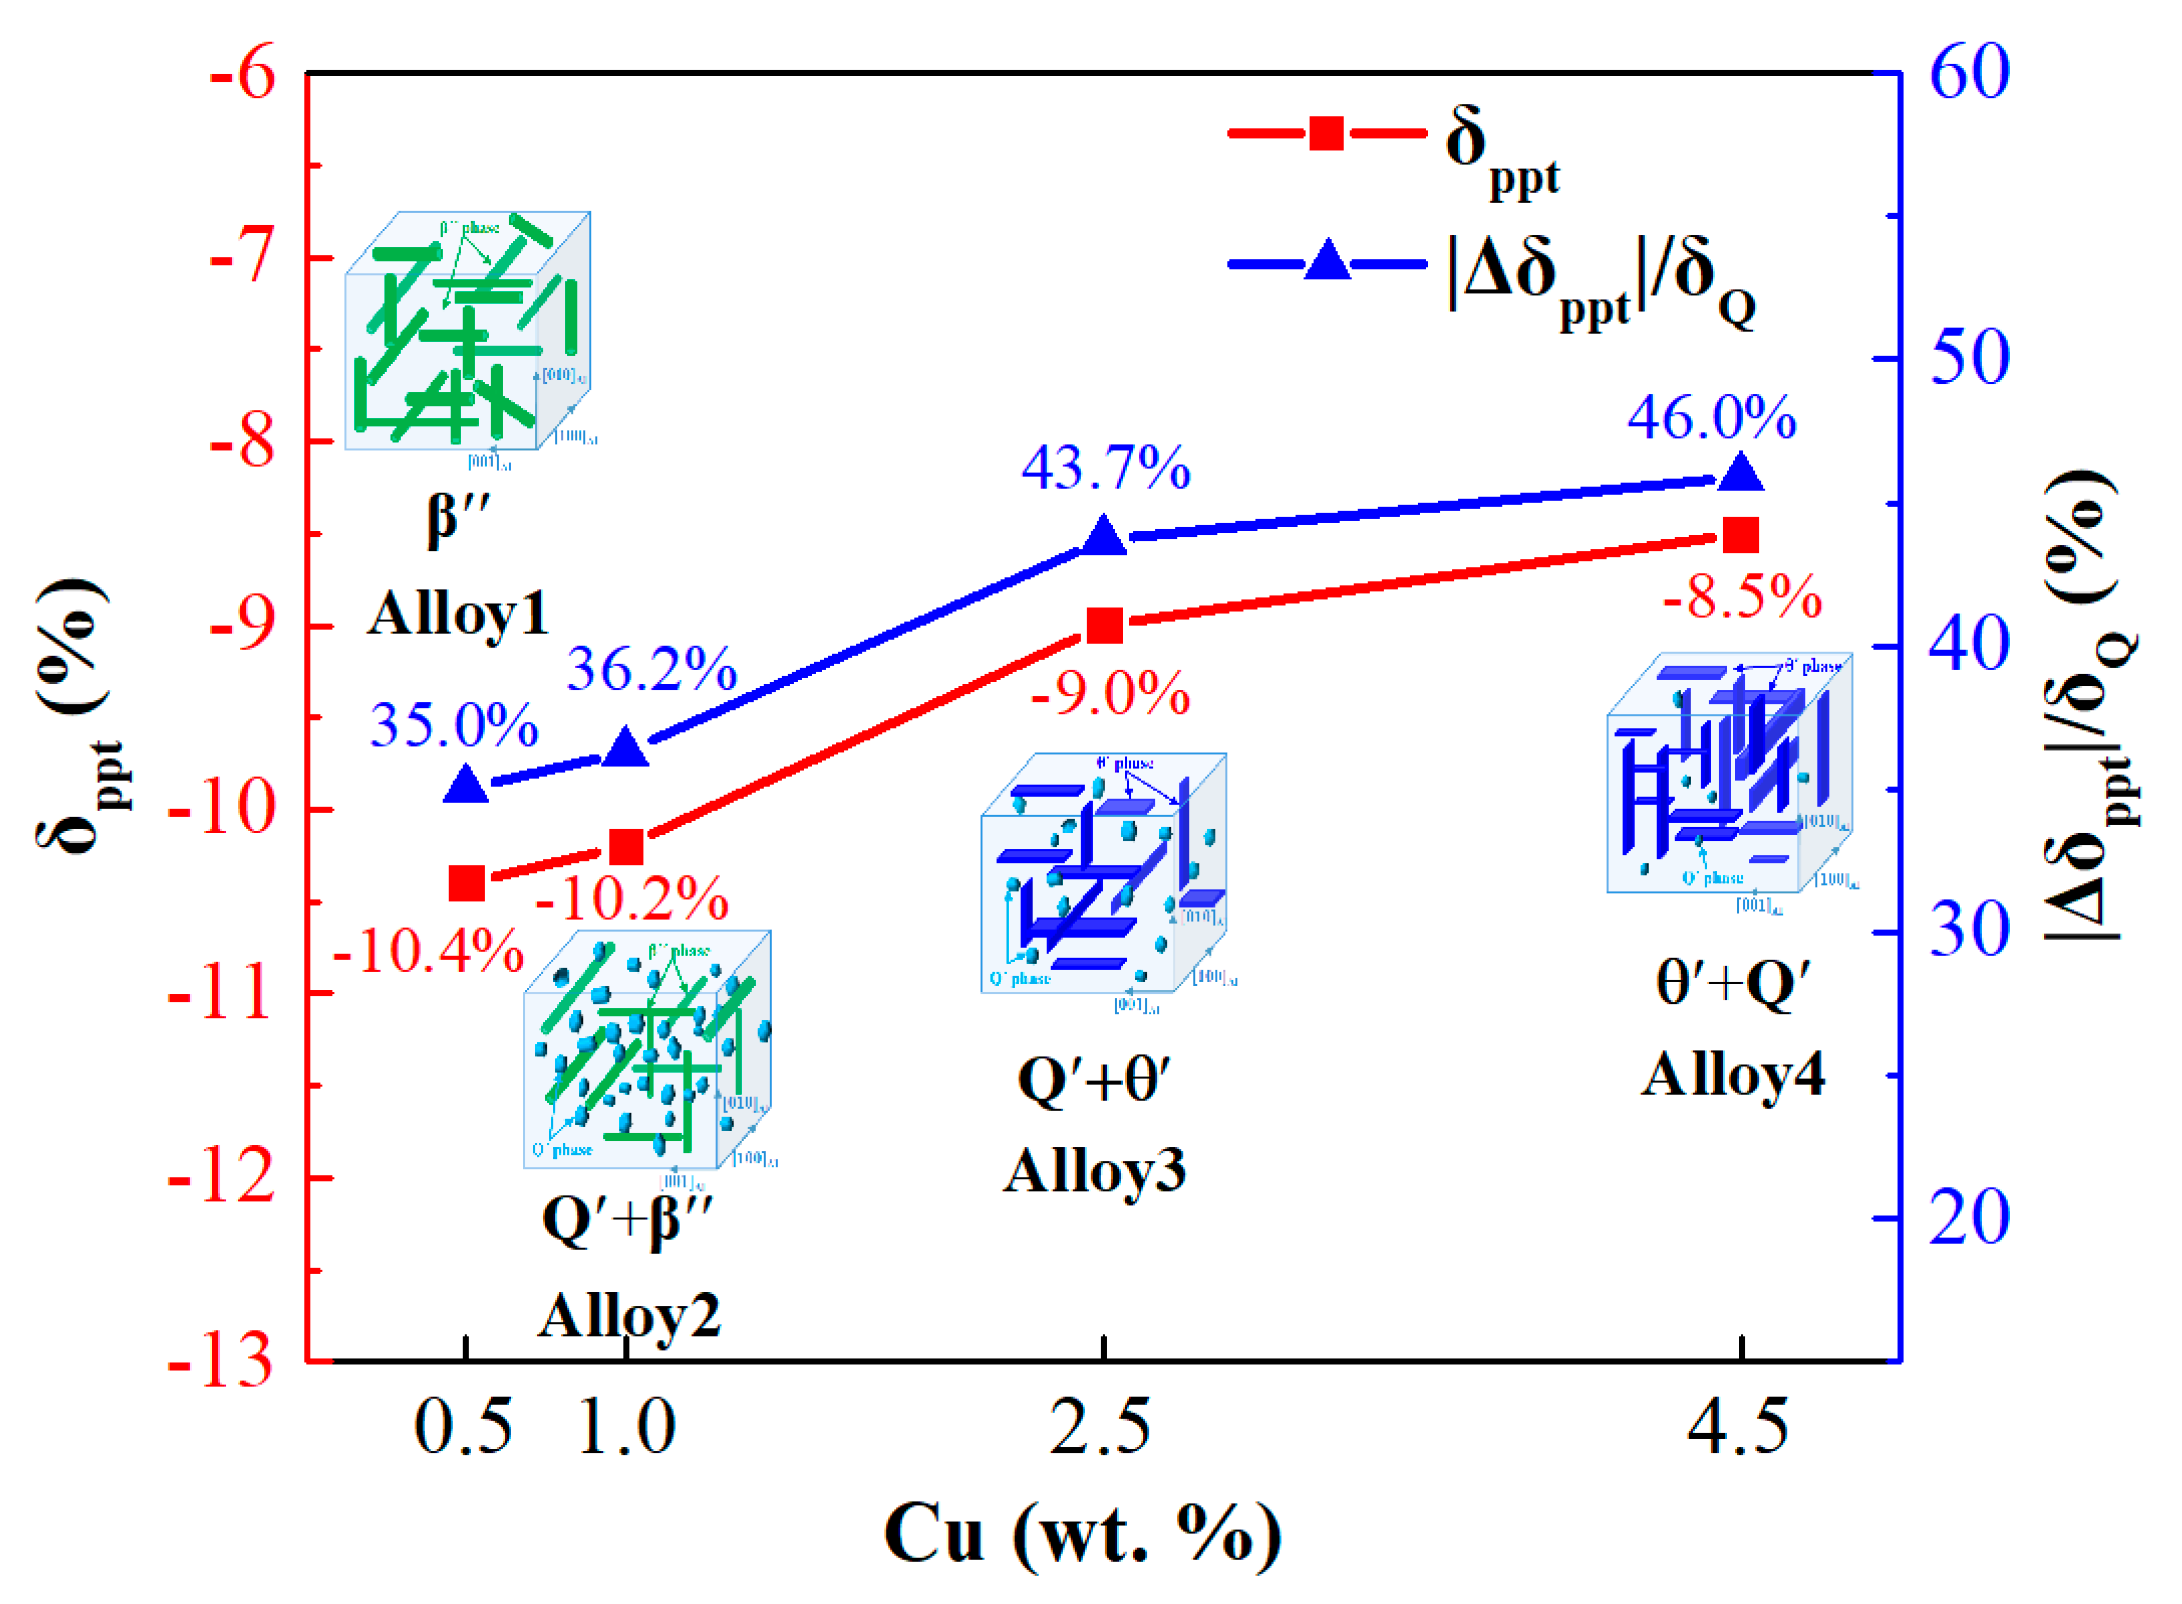
4.1.3. Precipitates
4.2. Influence of Cu Content on Alloy Strengthening Mechanisms
4.2.1. Strength
4.2.2. Elongation
5. Conclusions
Author Contributions
Funding
Acknowledgments
Conflicts of Interest
References
- Chen, Y.Q.; Pan, S.P.; Tang, S.W.; Liu, W.H.; Tang, C.P.; Xu, F.Y. Formation mechanisms and evolution of precipitate-free zones at grain boundaries in an Al-Cu-Mg-Mn alloy during homogenization. J. Mater. Sci. 2016, 51, 7780–7792. [Google Scholar] [CrossRef]
- Liu, C.; Liu, Y.L.; Ma, L.Y.; Yi, J.H. Effects of solution treatment on microstructure and high-cycle fatigue properties of 7075 aluminum alloy. Metals 2017, 7, 193. [Google Scholar] [CrossRef]
- Chen, Y.Q.; Pan, S.P.; Zhu, B.X.; Liu, X.; Liu, W.H.; Tang, S.W. The evolution of orientation relationships during the transformation of a twin-free T-particle to tenfold T-twins in an Al alloy during homogenisation. Mater. Charact. 2018, 141, 59–73. [Google Scholar] [CrossRef]
- Yin, D.; Xiao, Q.; Chen, Y.; Liu, H.; Yi, D.; Wang, B.; Pan, S. Effect of natural ageing and pre-straining on the hardening behaviour and microstructural response during artificial ageing of an Al-Mg-Si-Cu alloy. Mater. Des. 2016, 95, 329–339. [Google Scholar] [CrossRef]
- Jin, M.; Li, J.; Shao, G.J. Study of Cu addition on precipitation behaviors and mechanical properties in AA6082 Al-Mg-Si alloy. Mater. Sci. Forum 2007, 546–549, 825–828. [Google Scholar] [CrossRef]
- Aversa, A.; Marchese, G.; Manfredi, D.; Lorusso, M.; Calignano, F.; Biamino, S.; Lombardi, M.; Paolo Fino, P.; Pavese, M. Laser powder bed fusion of a high strength Al-Si-Zn-Mg-Cu alloy. Metals 2018, 8, 300. [Google Scholar] [CrossRef]
- Ferguson, J.B.; Lopez, H.; Cho, K.; Kim, C.S. Temperature effects on the tensile properties of precipitation-hardened Al-Mg-Cu-Si alloys. Metals 2016, 6, 43. [Google Scholar] [CrossRef]
- Shabestari, S.G.; Moemeni, H. Effect of copper and solidification conditions on the microstructure and mechanical properties of Al-Si-Mg alloys. J. Mater. Process. Technol. 2004, 153–154, 193–198. [Google Scholar] [CrossRef]
- Zheng, Y.; Xiao, W.; Ge, S.; Zhao, W.; Hanada, S.; Ma, C. Effects of Cu content and Cu/Mg ratio on the microstructure and mechanical properties of Al-Si-Cu-Mg alloys. J. Alloys Compd. 2015, 649, 291–296. [Google Scholar] [CrossRef]
- Farkoosh, A.R.; Pekguleryuz, M. Enhanced mechanical properties of an Al–Si–Cu–Mg alloy at 300 °C: Effects of Mg and the Q-precipitate phase. Mater. Sci. Eng. A 2015, 621, 277–286. [Google Scholar] [CrossRef]
- Zeren, M. Effect of copper and silicon content on mechanical properties in Al–Cu–Si–Mg alloys. J. Mater. Process Technol. 2005, 169, 292–298. [Google Scholar] [CrossRef]
- Grosselle, F.; Timelli, G.; Bonollo, F. Doe applied to microstructural and mechanical properties of Al–Si–Cu–Mg casting alloys for automotive applications. Mater. Sci. Eng. A 2010, 527, 3536–3545. [Google Scholar] [CrossRef]
- Zhong, H.; Rometsh, P.; Estrin, Y. Effect of alloy composition and heat treatment on mechanical performance of 6xxx aluminum alloys. T. Nonferr. Metal. Soc. 2014, 24, 2174–2178. [Google Scholar] [CrossRef]
- Lu, T.; Wu, J.; Pan, Y.; Tao, S.; Chen, Y. Optimizing the tensile properties of Al–11Si–0.3Mg alloys: Role of Cu addition. J. Alloys Compd. 2015, 631, 276–282. [Google Scholar] [CrossRef]
- Watanabe, K.; Maruno, S.; Matsuda, K.; Lee, S.; Horita, Z.; Terada, D.; Saikawa, S.; Hirosawa, S. Aging behavior and microstructure of aged excess Mg type Al-Mg-Si alloys after HPT processing. J. Jpn. Inst. Light Met. 2013, 63, 406–412. [Google Scholar] [CrossRef][Green Version]
- Sauvage, X.; Lee, S.; Matsuda, K.; Horita, Z. Origin of the influence of Cu or Ag micro-additions on the age hardening behavior of ultrafine-grained Al-Mg-Si alloys. J. Alloys Compd. 2017, 710, 199–204. [Google Scholar] [CrossRef]
- Salleh, M.S.; Omar, M.Z. Influence of Cu content on microstructure and mechanical properties of thixoformed Al-Si-Cu-Mg alloys. Trans. Nonferr. Metal. Soc. 2015, 25, 3523–3538. [Google Scholar] [CrossRef]
- Wang, G.; Sun, Q.; Feng, L.; Hui, L.; Jing, C. Influence of Cu content on ageing behavior of AlSiMgCu cast alloys. Mater. Des. 2007, 28, 1001–1005. [Google Scholar] [CrossRef]
- Hutchinson, C.R.; Ringer, S.P. Precipitation processes in Al-Cu-Mg alloys microalloyed with Si. Metall. Mater. Trans. A 2000, 31, 2721–2733. [Google Scholar] [CrossRef]
- Esmaeili, S.; Lloyd, D.J.; Poole, W.J. A yield strength model for the Al-Mg-Si-Cu alloy AA6111. Acta Mater. 2003, 51, 2243–2257. [Google Scholar] [CrossRef]
- Miao, W.F.; Laughlin, D.E. Effects of Cu content and preaging on precipitation characteristics in aluminum alloy 6022. Metall. Mater. Trans. A 2000, 31, 361–371. [Google Scholar] [CrossRef]
- Jiang, X.; Galano, M.; Audebert, F. Extrusion textures in Al, 6061 alloy and 6061/SiCp nanocomposites. Mater. Charact. 2014, 88, 111–118. [Google Scholar] [CrossRef]
- Gras, C.; Meredith, M.; Hunt, J.D. Microdefects formation during the twin-roll casting of Al-Mg-Mn aluminium alloys. J. Mater. Process. Technol. 2005, 167, 62–72. [Google Scholar] [CrossRef]
- Zhuang, L.; Bottema, J.; Kaasenbrood, P.; Miller, W.S.; Smet, P.D. The effect of small particles on annealed grain size and texture of Al-Mg-Si alloys. Mater. Sci. Forum 1996, 217–222, 487–492. [Google Scholar] [CrossRef]
- Farkoosh, A.R.; Javidani, M.; Hoseini, M.; Larouche, D.; Pekguleryuz, M. Phase formation in as-solidified and heat-treated Al-Si-Cu-Mg-Ni alloys: Thermodynamic assessment and experimental investigation for alloy design. J. Alloys Compd. 2013, 551, 596–606. [Google Scholar] [CrossRef]
- Song, Y.F.; Ding, X.F.; Xiao, L.R.; Zhao, X.J.; Cai, Z.Y.; Gguo, L.; Li, Y.W.; Zheng, Z.Z. Effects of two-stage aging on the dimensional stability of Al-Cu-Mg alloy. J. Alloys Compd. 2017, 701, 508–514. [Google Scholar] [CrossRef]
- Guo, M.X.; Zhu, J.; Zhang, Y.; Li, G.J.; Lin, T.; Zhang, J.S.; Zhuang, L.Z. The formation of bimodal grain size distribution in Al-Mg-Si-Cu alloy and its effect on the formability. Mater. Charact. 2017, 132, 248–259. [Google Scholar] [CrossRef]
- Wang, S.C.; Starink, M.J. Precipitates and intermetallic phases in precipitation hardening Al-Cu-Mg-(Li) based alloys. Int. Mater. Rev. 2005, 50, 193–215. [Google Scholar] [CrossRef]
- Bourgeois, L.; Dwyer, C.; Weyland, M.; Nie, J.F.; Muddle, B.C. Structure and energetics of the coherent interface between the θ′ precipitate phase and aluminium in Al-Cu. Acta Mater. 2011, 59, 7043–7050. [Google Scholar] [CrossRef]
- Wolverton, C.; Ozoliņš, V. Entropically favored ordering: The metallurgy of Al2Cu revisited Revisited. Phys. Rev. Lett. 2001, 86, 5518–5521. [Google Scholar] [CrossRef] [PubMed]
- Wolverton, C. Crystal structure and stability of complex precipitate phases in Al-Cu-Mg-(Si) and Al-Zn-Mg alloys. Acta Mater. 2001, 49, 3129–3142. [Google Scholar] [CrossRef]
- Bourgeois, L.; Dwyer, C.; Weyland, M.; Nie, J.F.; Muddle, B.C. The magic thicknesses of θ′ precipitates in Sn-microalloyed Al-Cu. Acta Mater. 2012, 60, 633–644. [Google Scholar] [CrossRef]
- Matsuda, K.; Ikeno, S.; Sato, T.; Uetani, Y. New quaternary grain boundary precipitate in Al-Mg-Si alloy containing silver. Scr. Mater. 2006, 55, 127–129. [Google Scholar] [CrossRef]
- Troeger, L.P.; Starke, E.A. Particle-stimulated nucleation of recrystallization for grain-size control and superplasticity in an Al-Mg-Si-Cu alloy. Mater. Sci. Eng. A 2000, 293, 19–29. [Google Scholar] [CrossRef]
- Mikhaylovskaya, A.V.; Ryazantseva, M.A.; Portnoy, V.K. Effect of eutectic particles on the grain size control and the superplasticity of aluminium alloys. Mater. Sci. Eng. A 2011, 528, 7306–7309. [Google Scholar] [CrossRef]
- Moghanaki, S.K.; Kazeminezhad, M.; Logé, R. Recrystallization behavior of multi-directionally forged over-aged and solution treated Al-Cu-Mg alloy during non-isothermal annealing. Mater. Des. 2017, 132, 250–256. [Google Scholar] [CrossRef]
- Chakrabarti, D.J.; Laughlin, D.E. Phase relations and precipitation in Al-Mg-Si alloys with Cu additions. Prog. Mater. Sci. 2004, 49, 389–410. [Google Scholar] [CrossRef]
- Tsao, C.S.; Chen, C.Y.; Jeng, U.S.; Kuo, T.Y. Precipitation kinetics and transformation of metastable phases in Al-Mg-Si alloys. Acta Mater. 2006, 54, 4621–4631. [Google Scholar] [CrossRef]
- Chen, J.H.; Costan, E.; Huis, M.A.V.; Xu, Q.; Zandbergen, H.W. Atomic pillar-based nanoprecipitates strengthen Al-Mg-Si alloys. Science 2006, 312, 416–419. [Google Scholar] [CrossRef] [PubMed]
- Edwards, G.A.; Stiller, K.; Dunlop, G.L.; Couper, M.J. The precipitation sequence in Al-Mg-Si alloys. Acta Mater. 1998, 46, 3893–3904. [Google Scholar] [CrossRef]
- Dumolt, S.D.; Laughlin, D.E.; Williams, J.C. Formation of a modified β″ phase in aluminium alloy 6061. Scr. Metal. 1984, 18, 1347–1350. [Google Scholar] [CrossRef]
- Torsæter, M.; Lefebvre, W.; Marioara, C.D.; Andersen, S.J.; Walmsley, J.C.; Holmestad, R. Study of intergrown L and Q′ precipitates in Al-Mg-Si-Cu alloys. Scr. Mater. 2011, 64, 817–820. [Google Scholar] [CrossRef]
- Perovic, A.; Perovic, D.D.; Weatherly, G.C.; Lloyd, D.J. Precipitation in aluminum alloys AA6111 and AA6016. Scr. Mater. 1999, 41, 703–708. [Google Scholar] [CrossRef]
- Saito, T.; Marioara, C.D.; Andersen, S.J.; Lefbvre, W.; Holmestad, R. Aberration-corrected HAADF-STEM investigations of precipitate structures in Al–Mg–Si alloys with low Cu additions. Philos. Mag. Ser. 2014, 94, 520–531. [Google Scholar] [CrossRef]
- Raviprasad, K.; Hutchinson, C.R.; Sakurai, T.; Ringer, S.P. Precipitation processes in an Al-2.5Cu-1.5Mg (wt.%) alloy microalloyed with Ag and Si. Acta Mater. 2003, 51, 5037–5050. [Google Scholar] [CrossRef]
- Ringer, S.P.; Hono, K.; Polmear, I.J.; Sakurai, T. Nucleation of precipitates in aged Al-Cu-Mg-(Ag) alloys with high Cu:Mg ratios. Acta Mater. 1996, 44, 1883–1898. [Google Scholar] [CrossRef]
- Liu, L.; Chen, J.H.; Wang, S.B.; Liu, C.H.; Yang, S.S.; Wu, C.L. The effect of Si on precipitation in Al-Cu-Mg alloy with a high Cu/Mg ratio. Mater. Sci. Eng. A 2014, 606, 187–195. [Google Scholar] [CrossRef]
- Huskins, E.L.; Cao, B.; Ramesh, K.T. Strengthening mechanisms in an Al-Mg alloy. Mater. Sci. Eng. A 2010, 527, 1292–1298. [Google Scholar] [CrossRef]
- Hansen, N. Hall-petch relation and boundary strengthening. Scripta Mater. 2004, 51, 801–806. [Google Scholar] [CrossRef]
- Kendig, K.L.; Miracle, D.B. Strengthening mechanisms of an Al-Mg-Sc-Zr alloy. Acta Mater. 2002, 50, 4165–4175. [Google Scholar] [CrossRef]
- Zhu, Z.; Han, J.; Gao, C.; Liu, M.; Song, J.; Wang, Z.; Li, H. Microstructures and mechanical properties of Al-Li 2198-T8 alloys processed by two different severe plastic deformation methods: A comparative study. Mater. Sci. Eng. A 2017, 681, 65–73. [Google Scholar] [CrossRef]
- Srivatsan, T.; Kolar, D.; Magnusen, P. The cyclic fatigue and final fracture behavior of aluminum alloy 2524. Mater. Des. 2002, 23, 129–139. [Google Scholar] [CrossRef]
- Zheng, Z.Q.; Cai, B.; Zhai, T.; Li, S.C. The behavior of fatigue crack initiation and propagation in AA2524-T34 alloy. Mater. Sci. Eng. A 2011, 528, 2017–2022. [Google Scholar] [CrossRef]
- Nie, J.F.; Muddle, B.C. Strengthening of an Al–Cu–Sn alloy by deformation-resistant precipitate plates. Acta Mater. 2008, 26, 3490–3501. [Google Scholar] [CrossRef]


| No. | Mg | Si | Cu | Mn | Cr | Zn | Ti | Fe | Al |
|---|---|---|---|---|---|---|---|---|---|
| 1 | 0.42 | 0.50 | 0.50 | 0.20 | 0.10 | 0.20 | 0.02 | <0.10 | Bal. |
| 2 | 0.42 | 0.50 | 1.00 | 0.20 | 0.10 | 0.20 | 0.02 | <0.10 | Bal. |
| 3 | 0.42 | 0.50 | 2.50 | 0.20 | 0.10 | 0.20 | 0.02 | <0.10 | Bal. |
| 4 | 0.42 | 0.50 | 4.50 | 0.20 | 0.10 | 0.20 | 0.02 | <0.10 | Bal. |
| Sample State | As-Extruded State | As-Quenched | ||||||
|---|---|---|---|---|---|---|---|---|
| Sample No. | Alloy 1 | Alloy 2 | Alloy 3 | Alloy 4 | Alloy 1 | Alloy 2 | Alloy 3 | Alloy 4 |
| AGZ (µm) | 765 | 538 | 475 | 190 | 482 | 351 | 211 | 108 |
| GAR | 6.47 | 8.27 | 9.67 | 11.23 | 2.35 | 2.97 | 3.56 | 4.12 |
© 2019 by the authors. Licensee MDPI, Basel, Switzerland. This article is an open access article distributed under the terms and conditions of the Creative Commons Attribution (CC BY) license (http://creativecommons.org/licenses/by/4.0/).
Share and Cite
Chen, Y.; Hu, Q.; Pan, S.; Zhang, H.; Liu, H.; Zhu, B.; Liu, X.; Liu, W. Influences of Cu Content on the Microstructure and Strengthening Mechanisms of Al-Mg-Si-xCu Alloys. Metals 2019, 9, 524. https://doi.org/10.3390/met9050524
Chen Y, Hu Q, Pan S, Zhang H, Liu H, Zhu B, Liu X, Liu W. Influences of Cu Content on the Microstructure and Strengthening Mechanisms of Al-Mg-Si-xCu Alloys. Metals. 2019; 9(5):524. https://doi.org/10.3390/met9050524
Chicago/Turabian StyleChen, Yuqiang, Qiang Hu, Suping Pan, Hao Zhang, Huiqun Liu, Biwu Zhu, Xiao Liu, and Wenhui Liu. 2019. "Influences of Cu Content on the Microstructure and Strengthening Mechanisms of Al-Mg-Si-xCu Alloys" Metals 9, no. 5: 524. https://doi.org/10.3390/met9050524
APA StyleChen, Y., Hu, Q., Pan, S., Zhang, H., Liu, H., Zhu, B., Liu, X., & Liu, W. (2019). Influences of Cu Content on the Microstructure and Strengthening Mechanisms of Al-Mg-Si-xCu Alloys. Metals, 9(5), 524. https://doi.org/10.3390/met9050524