Article

High-Temperature Reduction and Melting Mechanism of Sinter with Different MgO Content

School of Metallurgy, Northeastern University, Shenyang 110819, China
*
Author to whom correspondence should be addressed.
Metals 2019, 9(5), 510; https://doi.org/10.3390/met9050510
Submission received: 28 March 2019 / Revised: 23 April 2019 / Accepted: 29 April 2019 / Published: 30 April 2019

Abstract

:
Adding MgO to sinter is considered to be a popular counter measure to cope with the use of high Al2O3 ores. The purpose of this paper is to investigate the effect of the MgO content on the reduction melting behavior in order to clarify the main mechanism of melting and dripping under simulated blast furnace (BF) conditions. It was found that reduction behavior was inhibited with an increased MgO content; the reduction mechanism was further investigated by means of XRD, SEM, and kinetic analysis. The influence of MgO on the melting mechanism of high basicity sinter was also studied. The softening start temperature and softening temperature increased, and the softening zone increased as a whole with the increased MgO contents from 1.3 to 2.0 wt%. The melting temperature was similar, because the MgO remained in an unslagged state and existed in wustite as FeO-MgO solid solution. The dripping temperature was increased; the main reason for this was that high melting-point slags appeared, and that it was more difficult for carburization to occur with increased MgO content. The most appropriate MgO content in the sinter was 1.3 wt% according to principal component analysis (PCA).

1. Introduction

In recent years, Al2O3 in slag has been improved with an increased imported ore, which is an enormous challenge for blast furnace [1]. To cope with the use of high Al2O3 ores, adding MgO to sinter is considered to be a popular counter measure. The purpose of adding MgO is mainly to guarantee appropriate basicity, increase viscosity, and improve the ability of slag to desulfurization, whereas there is also a negative influence for ironmaking, such as iron ore strength, reduction, and melting-dripping properties. Softening-melting, an important characteristics, can influence the ironmaking process, and the burden of better softening-melting increases the permeability index and ensures smooth operation of blast furnace; therefore, production efficiency is improved and economic benefits are generated.
Some studies have been published on the reduction softening of sinters and pellets [2,3]. Liu et al. investigated the effect of high temperature interaction between sinter and lump ore on the formation behavior of primary-slags, and found that it improved the primary-slags formation behavior of integrated burdens [4]. Advanced reduction under load (ARUL) was used to study the reduction-softening behavior of acid and olivine pellets and basic sinter, which indicated that the reduction softening properties of olivine pellets was better and those of acid pellets were bad [5]. Cheng et al. investigated the effect of Cr2O3 on the reduction and smelting mechanism of high-chromium vanadium-titanium magnetite pellets [6]. The productivity, tumbler strength and coke rate increased with the increased MgO content in sinter; however, the softening and melting properties stayed at the same levels [7]. Li et al. evaluated the effect of MgO and Al2O3 on softening-melting properties of high basicity sinter, and found that the influence of MgO on softening temperature was insignificant compared with Al2O3 [8]. The main reason is that MgO exists in wustite as FeO-MgO solid solution and Al2O3 is distributed in slag. Higuchi et al. investigated the effect of chemical compositions and microstructure of sinter on TS and TD [9]. They found that the optimal sinter had 1.0–1.5 basicity, low Al2O3 and high MgO. Loo et al. studied the effect of material coalescence on sintering, and found that temperature had a strong influence on the level of coalescence, and it also had an influence on the sinter properties [10,11]. Kemppainen et al. carried out experiments on softening behavior with acid and olivine fluxed iron ore pellets [12]. Acid pellets softened rapidly at 1150 °C and reached about 40% contraction at 1200 °C, and the olivine fluxed pellets reached contraction of 30–35% at 1350 °C. Guo et al. studied the effect of ferrous burden reducibility on softening-melting properties [13]. In the case of higher reduction degree, the microstructure of the ferrous burden changed significantly, wustite decreased and metallic iron phase increased. Tang et al. investigated the effect of MgO in sinter and primary-slag on smelting mechanism [14]. They found that depolymerization of the primary slag structure increased, and the primary-slag formation temperature interval decreased with increasing MgO.
Some new methods were investigated to improve and understand the softening-melting properties of iron-bearing burden. Coke-ore mixed charging improved the softening-dripping properties of packed bed, but the fluidity of slag and dropping behavior was bad when coke-ore mixing ratio was increased to 50% [15]. In order to better understand the softening-melting characteristic of iron-bearing burden, Wu et al. investigated a new method for evaluating softening-melting behavior, and found that unit charge column maximum pressure drop, pressure drop range, and unit charge column pressure drop can better reflect the permeability and liquid fluidity of burden [16]. The composition of burden has an important effect on the softening and melting properties. It was found that softening-melting behavior of pellet burden structure was improved when high basicity sinter was added to the acid pellet forming mixed burden, in which the ratio was 33.65% pellet mixed with sinter [17]. The softening behavior of sinter can be improved by controlling its chemical compositions [18].
Based on the above literature, previous research has been conducted on the softening-melting behavior of sinter, including the effects of chemical composition and microstructure on melting-dripping properties. However, challenges still remain in the effects of MgO on the melting and dripping behavior so far. (1) One of the influence factors on the melting behavior is reduction of iron ore in the reducing gas. Most previous studies only focused on the melting properties, but ignored the reduction behavior. Therefore, the relation between reduction and melting behavior is necessary to better understand the high temperature properties, and also is one of the originalities of the present work. (2) Many researchers have investigated the effect of MgO on melting properties of sinter, but some key mechanisms are not yet clear. The MgO can affect the melting properties of both the metallic iron and primary slag. Therefore, the distribution of MgO between metallic phase and slag phase is one of the key points to better understand the influence mechanism of MgO, and also is the originality of the present work. (3) The high temperature properties of sinter can be expressed by many characteristic parameters, such as T10, T40, TS, TD, T40-T10, TD-TS etc. In the present work, principal component analysis (PCA) was used to analyze these characteristics, and one compressive assessment index is proposed to express the high temperature properties, and this is originality of the present work too.
Aimed to address these challenges, research was undertaken on the effect of MgO on the melting-dripping mechanism of high basicity sinter requires elaboration, including (1) the kinetic analysis of the reduction of sinter with different MgO content, (2) the microstructure structure and phase composition of dripping materials (the softening-melting mechanism), (3) the effect of MgO on the ratio of dripping iron to dripping slag, and (4) the compressive assessment method for evaluation on the high temperature properties of sinter. The results provide a theoretical foundation and experimental reference for the effects of MgO on reduction-melting of high basicity sinter in BF.

2. Materials and Methods

2.1. Characterization
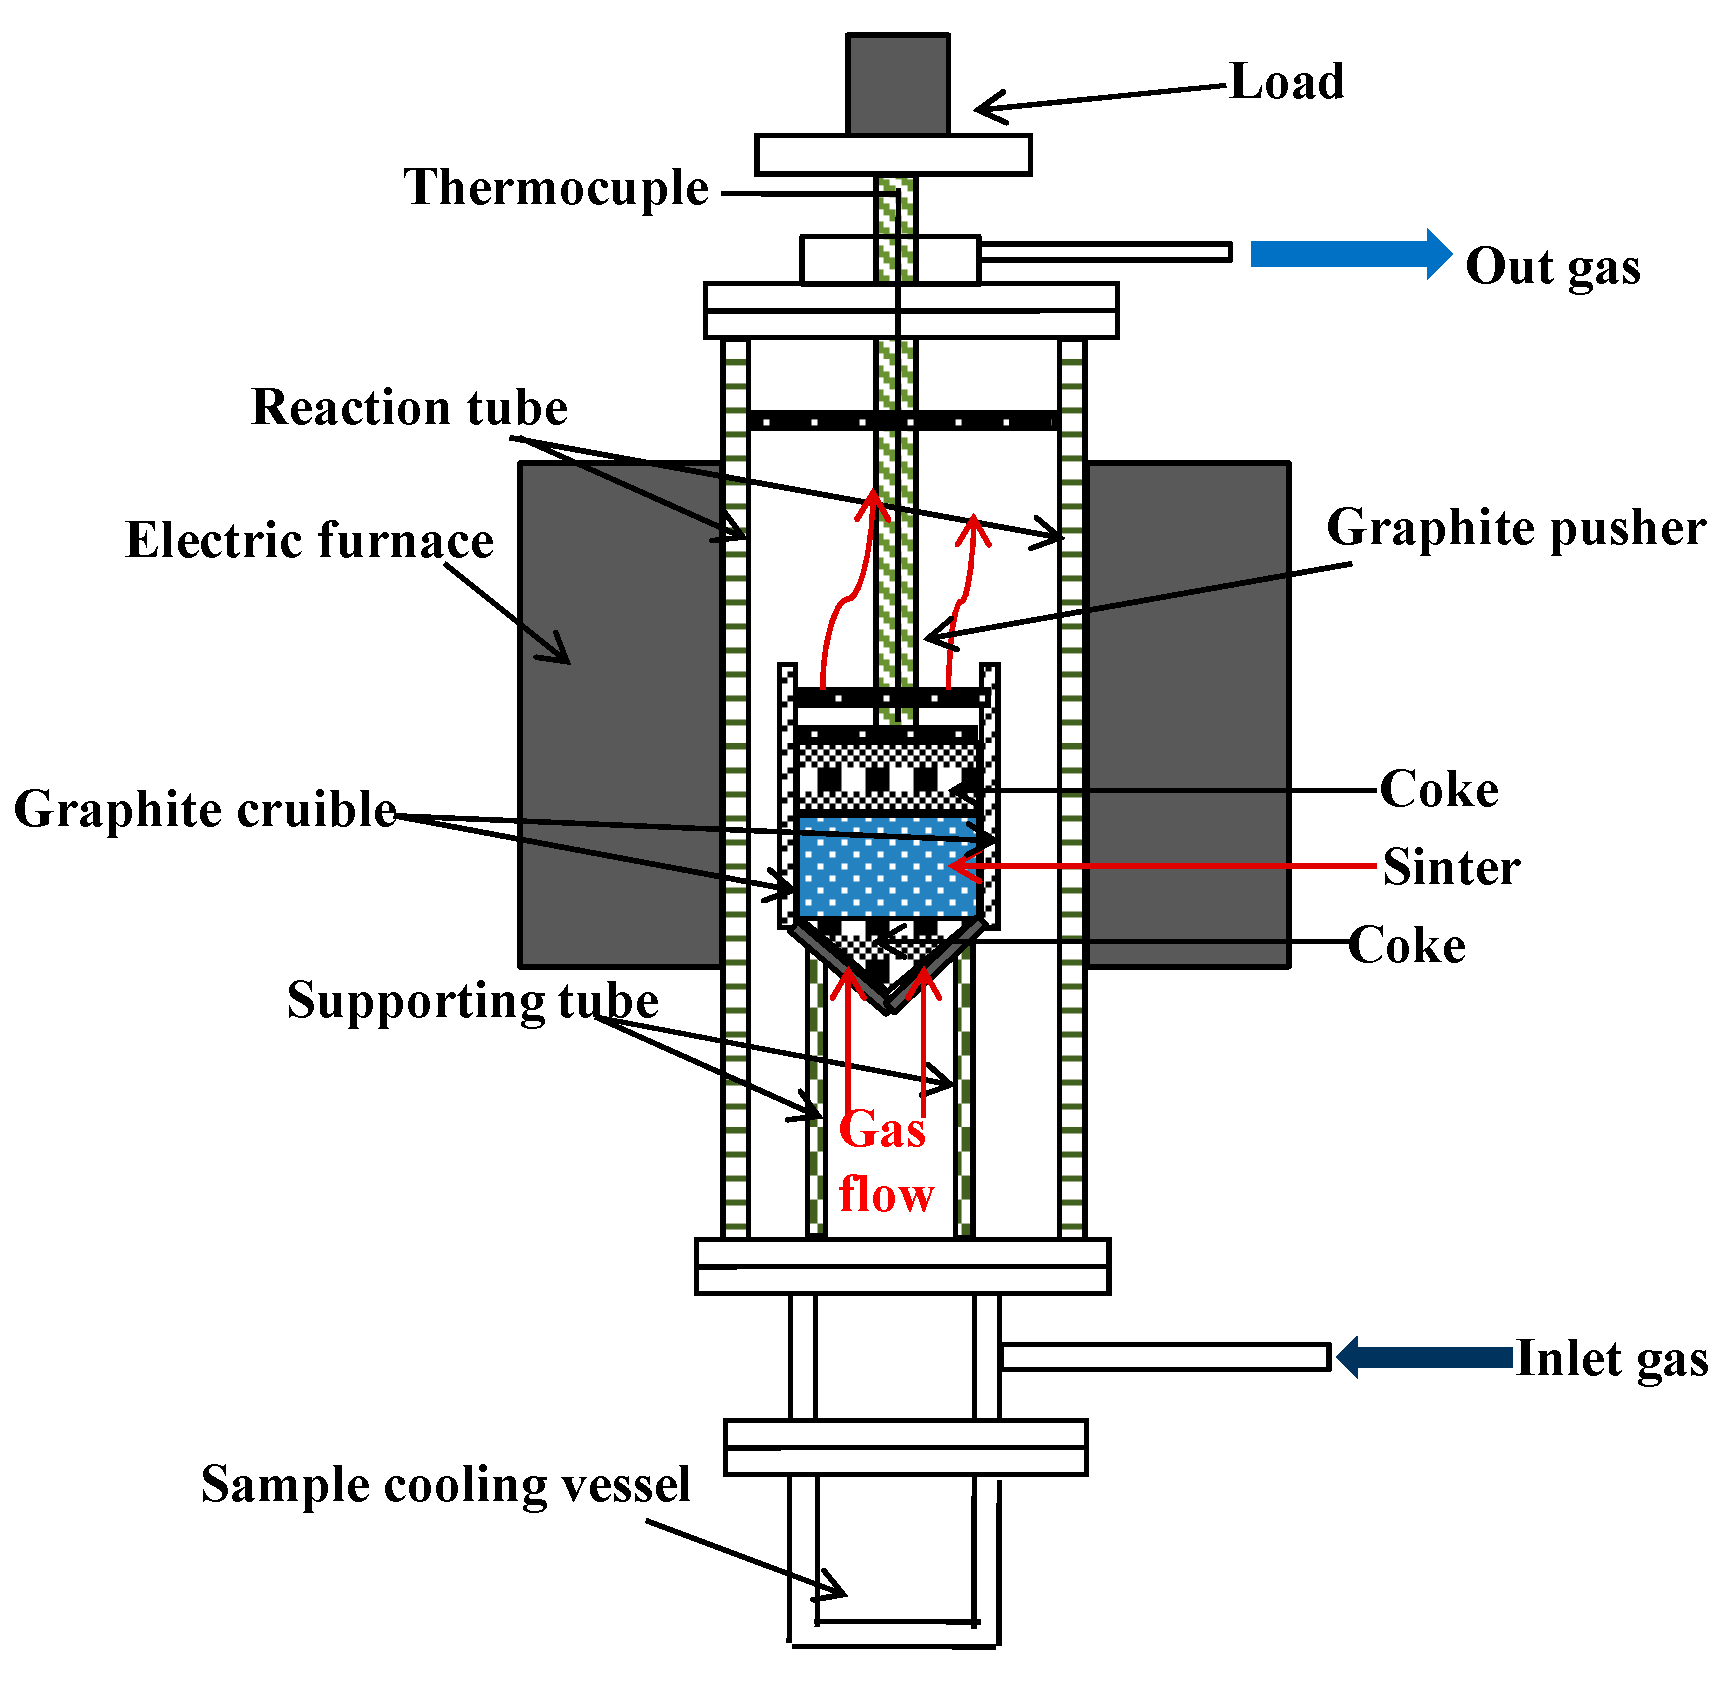
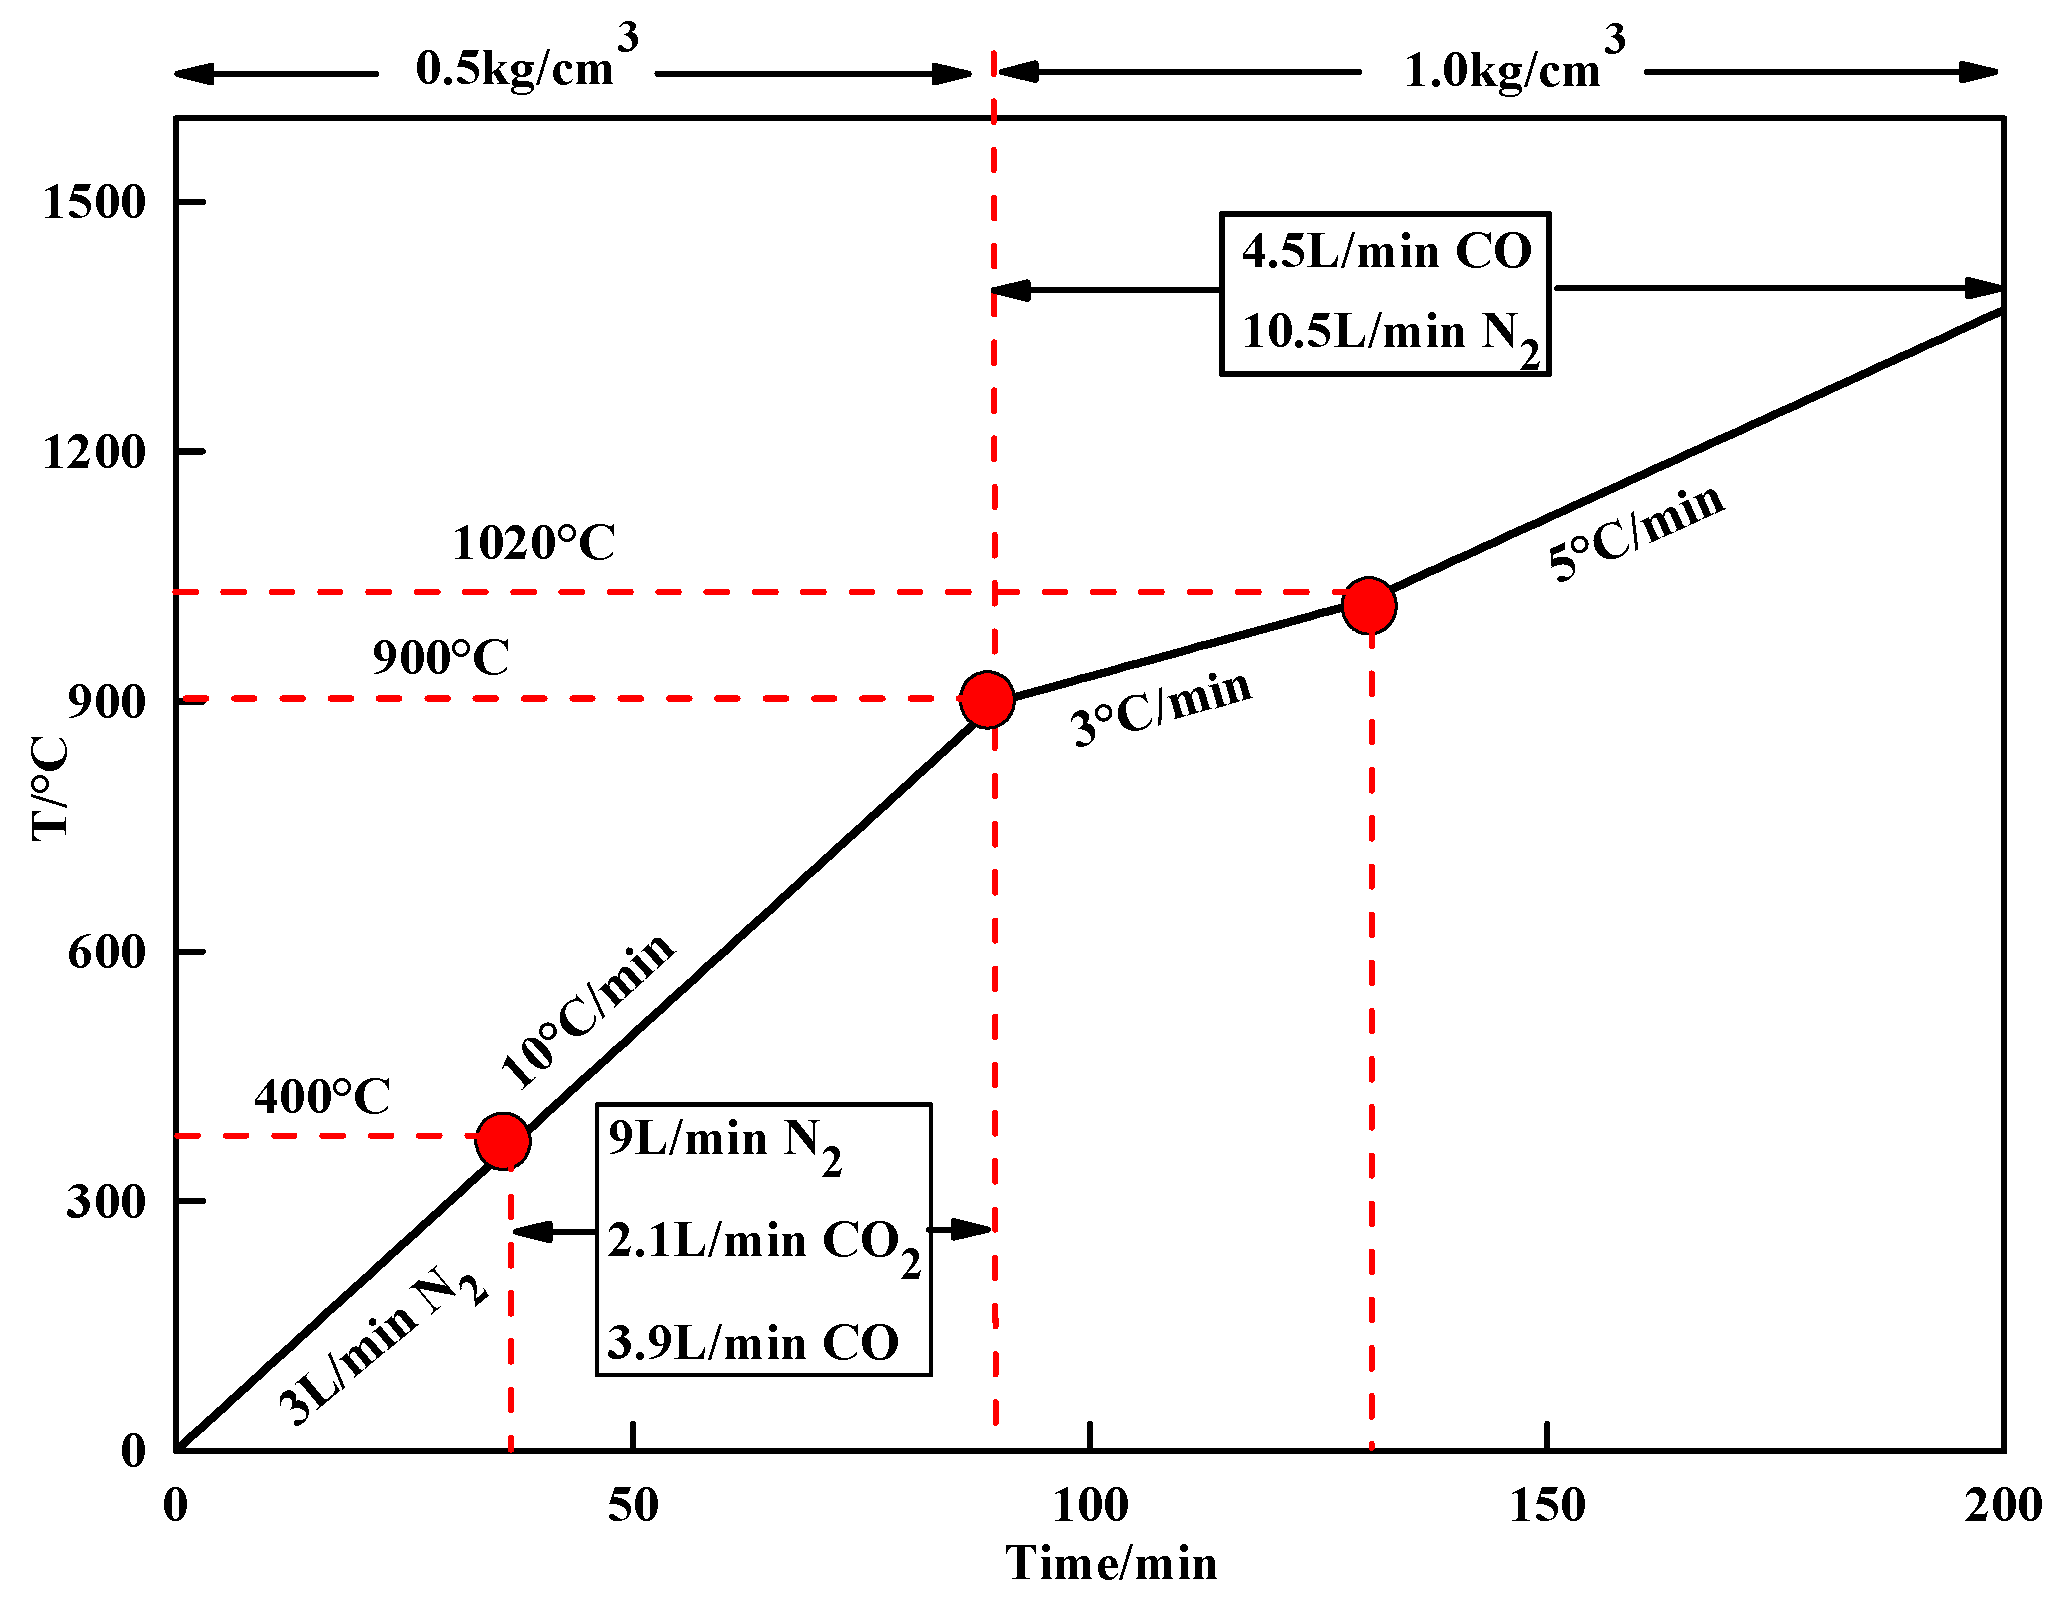
In this study, the sinter came from Hansteel of China, and its main chemical composition is shown in Table 1. As can be seen in Table 1, the MgO content in the sinter sample changed from 1.3 to 2.0 wt%, whereas the basicity (R = CaO/SiO2) of all sinter samples was steady at around 1.70, which is a commonly used value. It can be seen that the sinter had a low content of total iron grade. In order to avoid experimental errors, the size of raw materials was uniform: sinter and coke of 10–12 mm diameter were selected by the sieving method.
The phase compositions of sinter with different MgO contents were characterized by X-ray diffraction. Figure 1 shown that the main phase components were Fe3O4, CaO·Fe2O3, MgO·Fe2O3, (CaO)0.54·(FeO)1.46·SiO2, 2FeO·SiO2, and Fe2O3 for all samples. For the sinter with 1.3 wt% MgO, the main phases were Fe3O4, (CaO)0.54·(FeO)1.46·SiO2, 2FeO·SiO2 and Fe2O3. As the MgO content increased from 1.3 to 2.0 wt%, the peak corresponding to Fe3O4 and MgO·Fe2O3 strengthened gradually, whereas that of Fe2O3 weakened and the others mineral compositions had little variation.

2.2. Procedures

The reduction experiment for different MgO sinters was carried out in an apparatus that came from Northeastern University (Boston, MA, USA) and the reduction reactor was 75 mm in diameter. The reduction temperatures were 800 °C, 900 °C and 1000 °C, which were controlled at ±10 °C. In order to clarify the nature of sinter samples under industrial conditions, all tests were operated in a constant reduction atmosphere. The reduction gas was a mixture of CO and N2 (30% CO, 70% N2), which simulated the actual top gas composition prevailing in the blast furnace. The flow of shielding gas was 0.3 m3/h, which prevented the sample from being oxidized again.
The softening-melting experiment for different MgO sinters was carried out in the melting-dripping furnace (Kexiang, Anshan, China); the experimental apparatus is shown in Figure 2. The furnace was heated electrically by a U-shape-Super Kanthal with a heating zone of about 600 mm in height where the maximum working temperature could reach 1600 °C. For the experiment, 30 g of coke was put in the bottom of the crucible and 500 g of sinter was put on the lower coke, together with 90 g of coke on the sinter. After charging, the pressure bar and the charged crucible were put in the melting-dripping tube, and it was verified that the thermocouple was correctly wired. In order to assure the certainty of pressure drop, the melting-dripping tube bottom needed to be sealed well to prevent gas leakage.
Table 2 shows that different researchers used various conditions and sample sizes in their melting-dripping experiments. However, the main gas composition of blast furnace was CO, CO2, N2 and the temperature of blast furnace changed gradually. The experimental conditions in these papers are shown in Figure 3. After the temperature reached 1570 °C, nitrogen gas was added quickly until room temperature was reached, in order to avoid reduction from oxidization. The softening-melting behavior and mechanism were investigated by analysis of chemical compositions and microstructures.
The reduction degree was calculated as the fraction of oxygen removed from the high basicity sinter. However, the oxides containing Mg, Si, and Ca could hardly be reduced under the experimental temperature and atmosphere conditions in the study. Therefore, the reduction degree (α) was generally treated as the mass percentage of oxygen removed from the iron oxides and was evaluated as:
α = m 1 m t m 0
where, m1 is the initial mass of high basicity sinters, g, mt is the mass of high basicity sinters after reduced time t, g, m0 is the total mass of theory removed oxygen, g.
In the Equation (1), the total mass of theoretical removed oxygen in the high basicity sinters is evaluated assuming that all the oxygen-bearing iron exists in the form of Fe2O3, however, some Fe3O4 and FeO is also appeared in the high basicity sinters. The reduction degree should be calculated according to mass loss in the experiment and difference between the ideal oxygen content and measured oxygen content. In the paper, the certain weight of oxygen was calculated based on Fe2O3, Fe3O4 and FeO exists in the high basicity sinters, and the reduction degree was evaluated according to the Equation (2)
α = m 0 W 1 × 8 71.85 m 0 W 2 × 48 111.7 × 100 + m 1 m t m 0 × W 2 100 × 48 111.7 × 100
Equation (2) is simplified into the form of Equation (3)
α = ( 0.111 W 1 0.430 W 2 + m 1 m t m 0 × 0.430 W 2 × 100 ) × 100
where m0 is the mass of samples (g); m1 is the mass of samples before reduction (g); mt is the mass that samples are reduced after t min (g); W1 is the percent of wustite (FeO) before reduction (%); W2 is the percent of TFe before reduction (%).

2.3. Analysis Methods

The X-ray diffraction (XRD, X’Pert Pro; PANalyical, Almelo, The Netherlands) for qualitative analysis with monochromatic Cu-Ka X-ray radiation (wavelength = 1.5406 Å) at a setting of 40 kV and 40 mA was used to analyze the minerals phases of different samples. The scanning range was from 10 °C to 85 °C at a scanning speed of 6 °C/min with a step size of 0.05 °C. The microstructure was observed using scanning electron microscopy with energy dispersive X-ray spectrometer (SEM/EDS; Ultra Plus, Zeiss, Dresden, German) with a Schottky-type field-emission electron source and with resolution rations of 0.8 nm/15 kV and 1.6 nm/1 kV at 20 V to 30 V.

3. Results

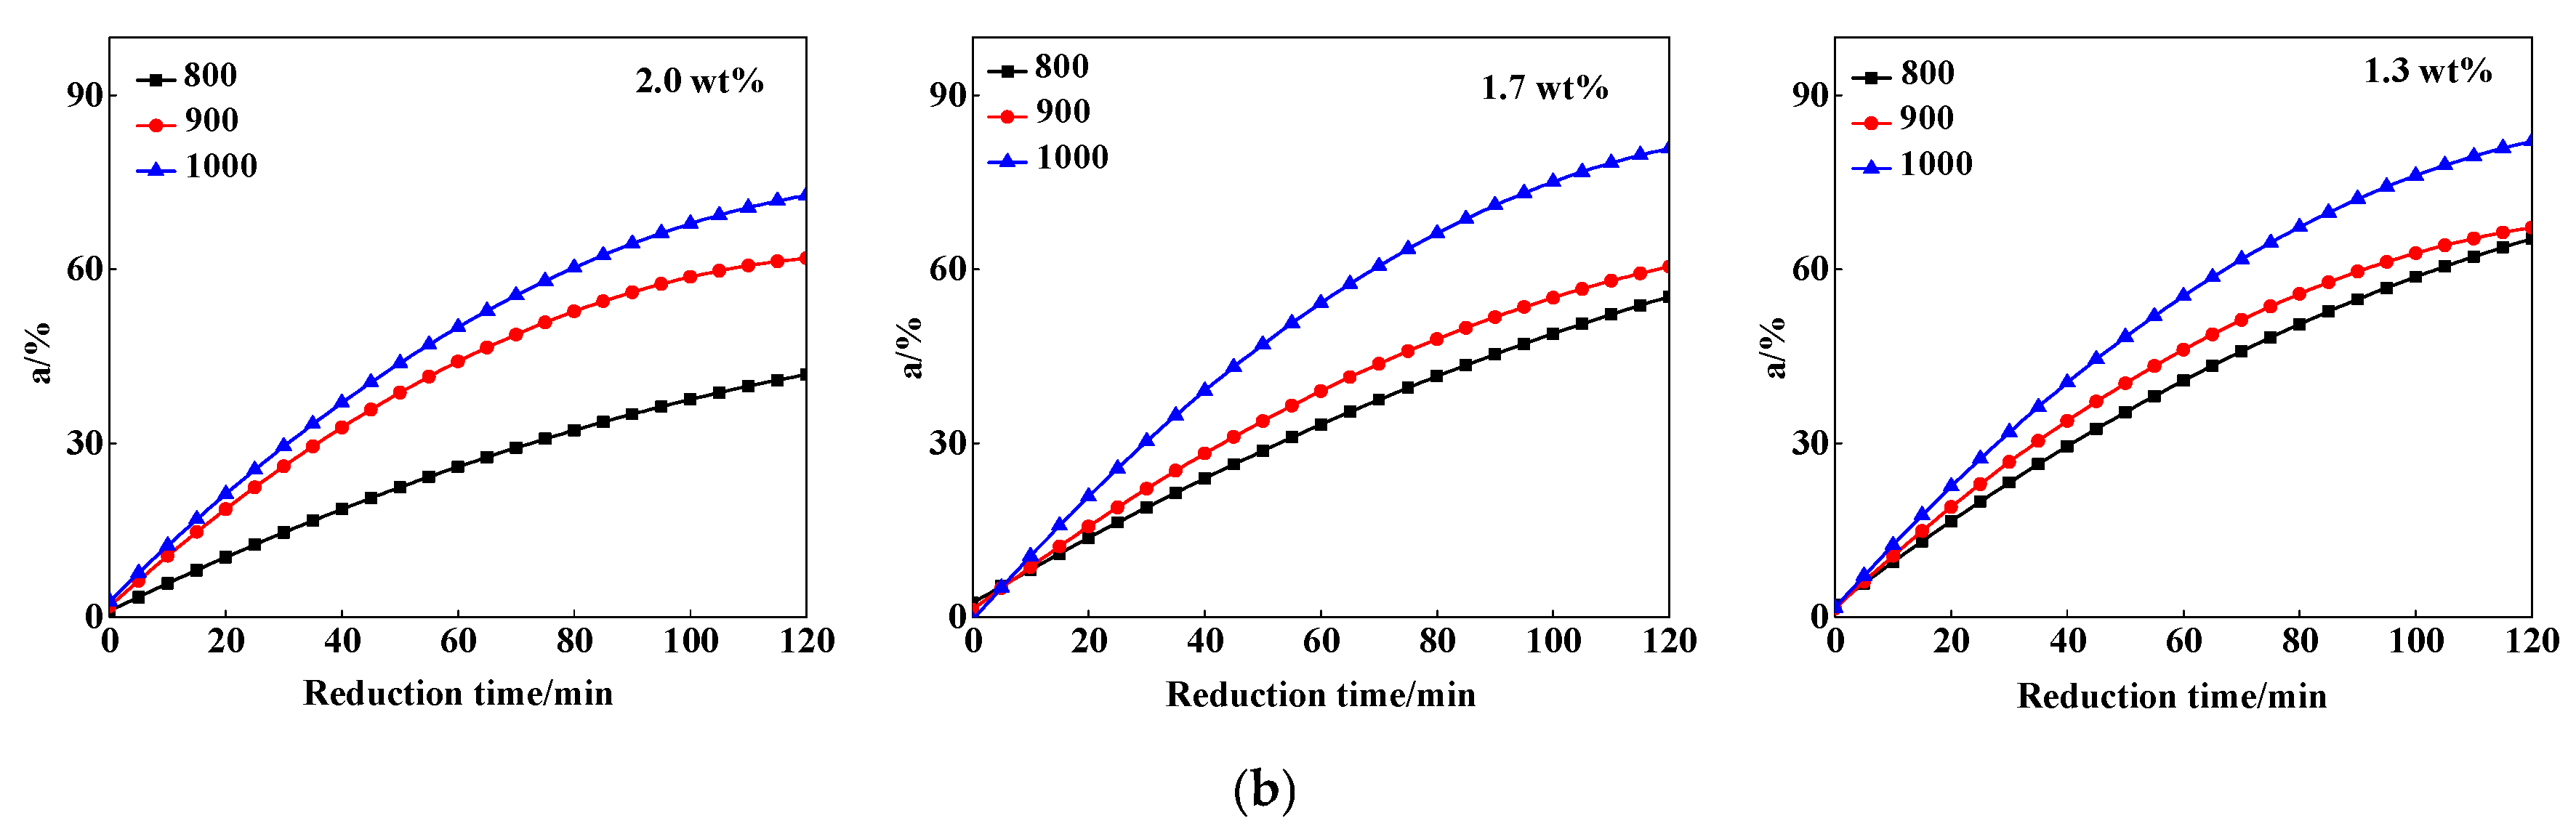
3.1. The Reduction Behavior of Different MgO Sinter

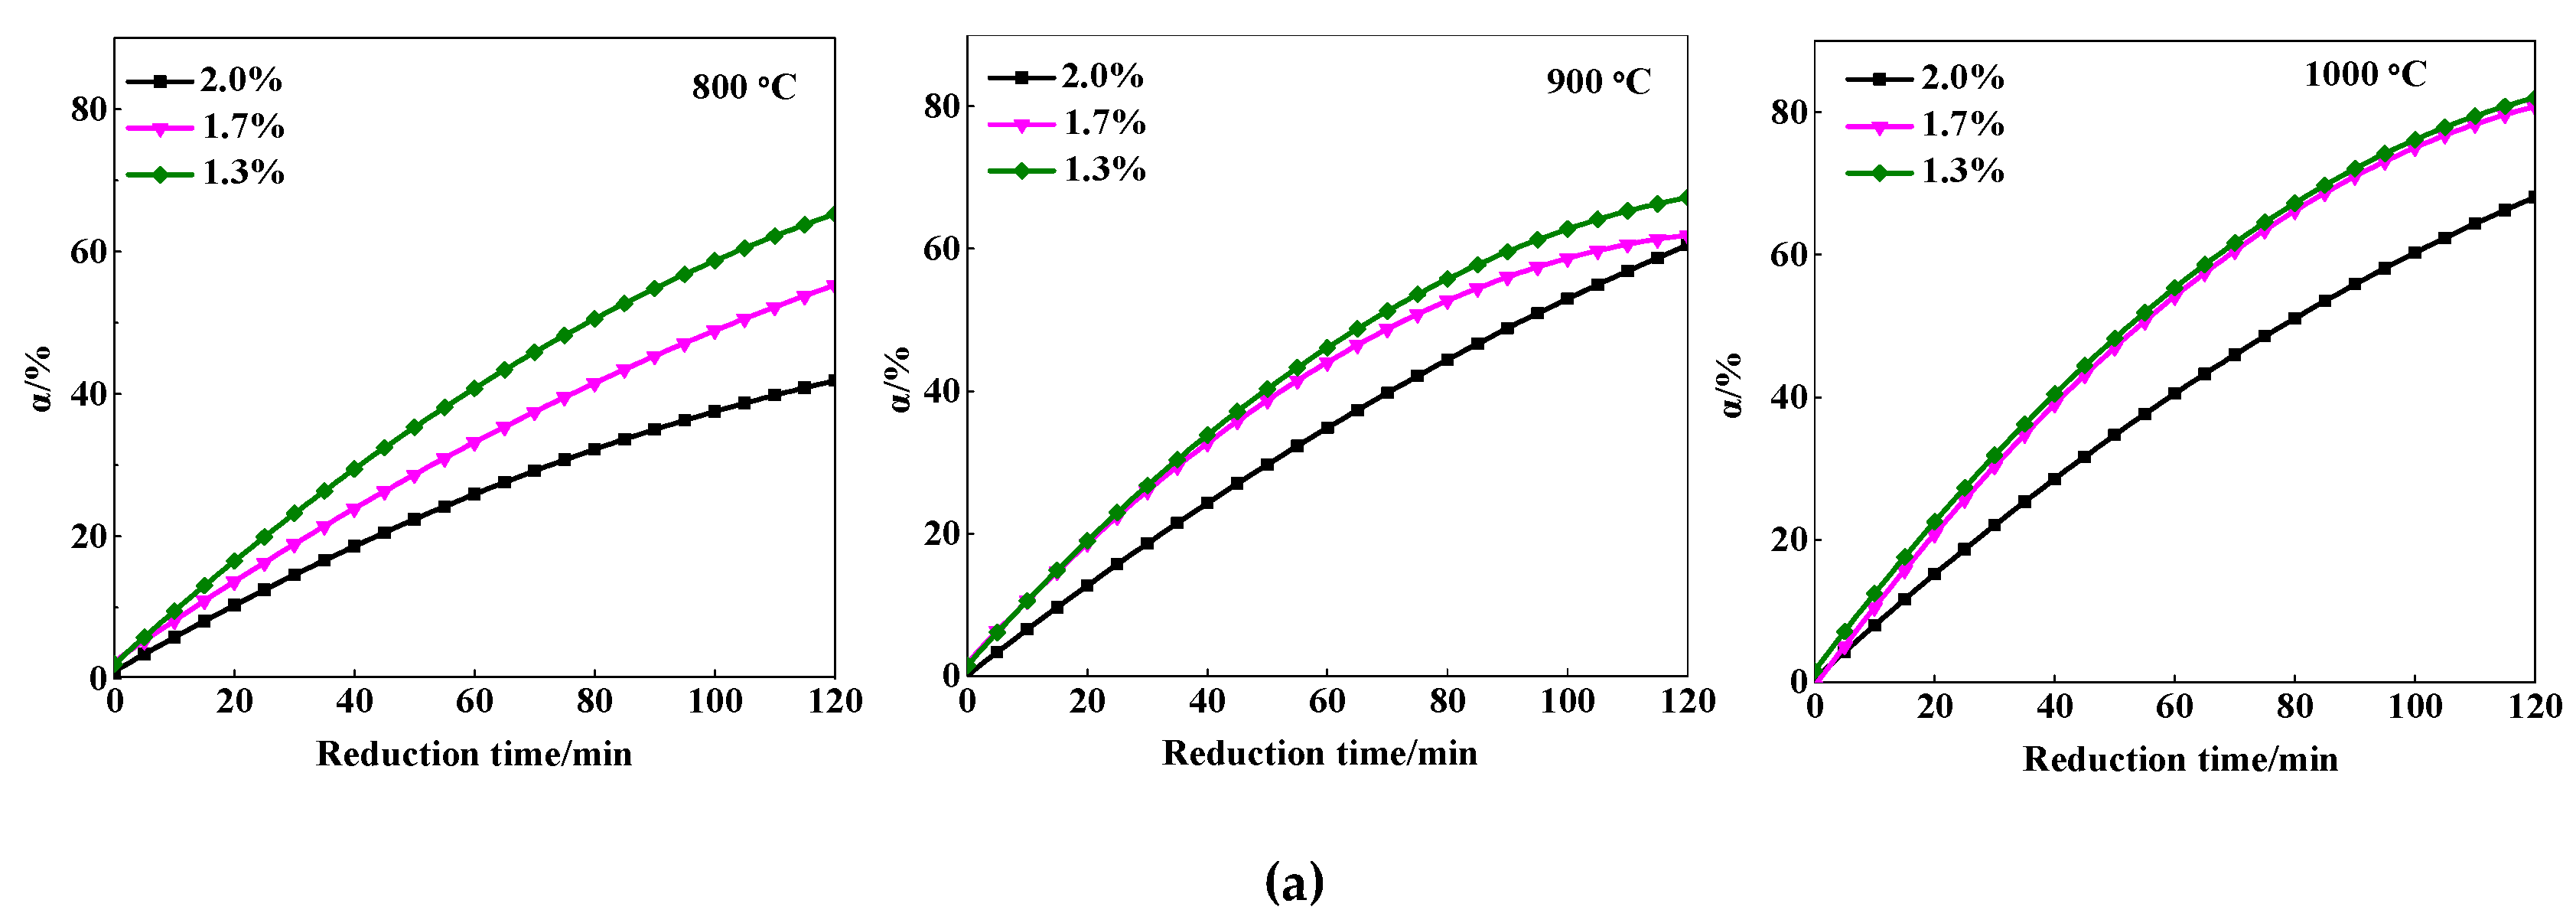
3.1.1. Effect of MgO Content and Reduction Temperature

The reduction degree of sinters with different MgO content is shown in Figure 4a. As can be seen from these results, the MgO content had a clear effect on the reduction of sinter. The reduction degree decreased obviously with increased MgO content from 1.3 to 2.0 wt% at the same reduction time and temperature. In the case of 800, 900 and 1000 °C, the sinter with 1.3 wt% MgO showed the highest reduction degree and that with 2.0 wt% exhibited the lowest reduction degree. The reduction degree was 65.45%, 55.17% and 41.98% with 1.3, 1.7, and 2.0 wt%, respectively at 120 min and 800 °C.
The typical reduction curves of isothermally reduced sinters are given in Figure 4b. It can be seen that the reduction degree increased sharply with increased temperature in all cases. The reduction degree was 67.49, 60.59 and 61.59% with 1.3, 1.7 and 2.0 wt%, respectively at 800 °C and 120 min. When the sinter was reduced at 1000 °C and 120 min, the reduction degree was 81.23 and 72.76% with 1.3 and 2.0 wt% sinter, respectively. The reduction degree was only 38.46, 31.93 and 24.37% with 1.3, 1.7 and 2.0 wt% sinter, respectively at 800 °C and 60 min.

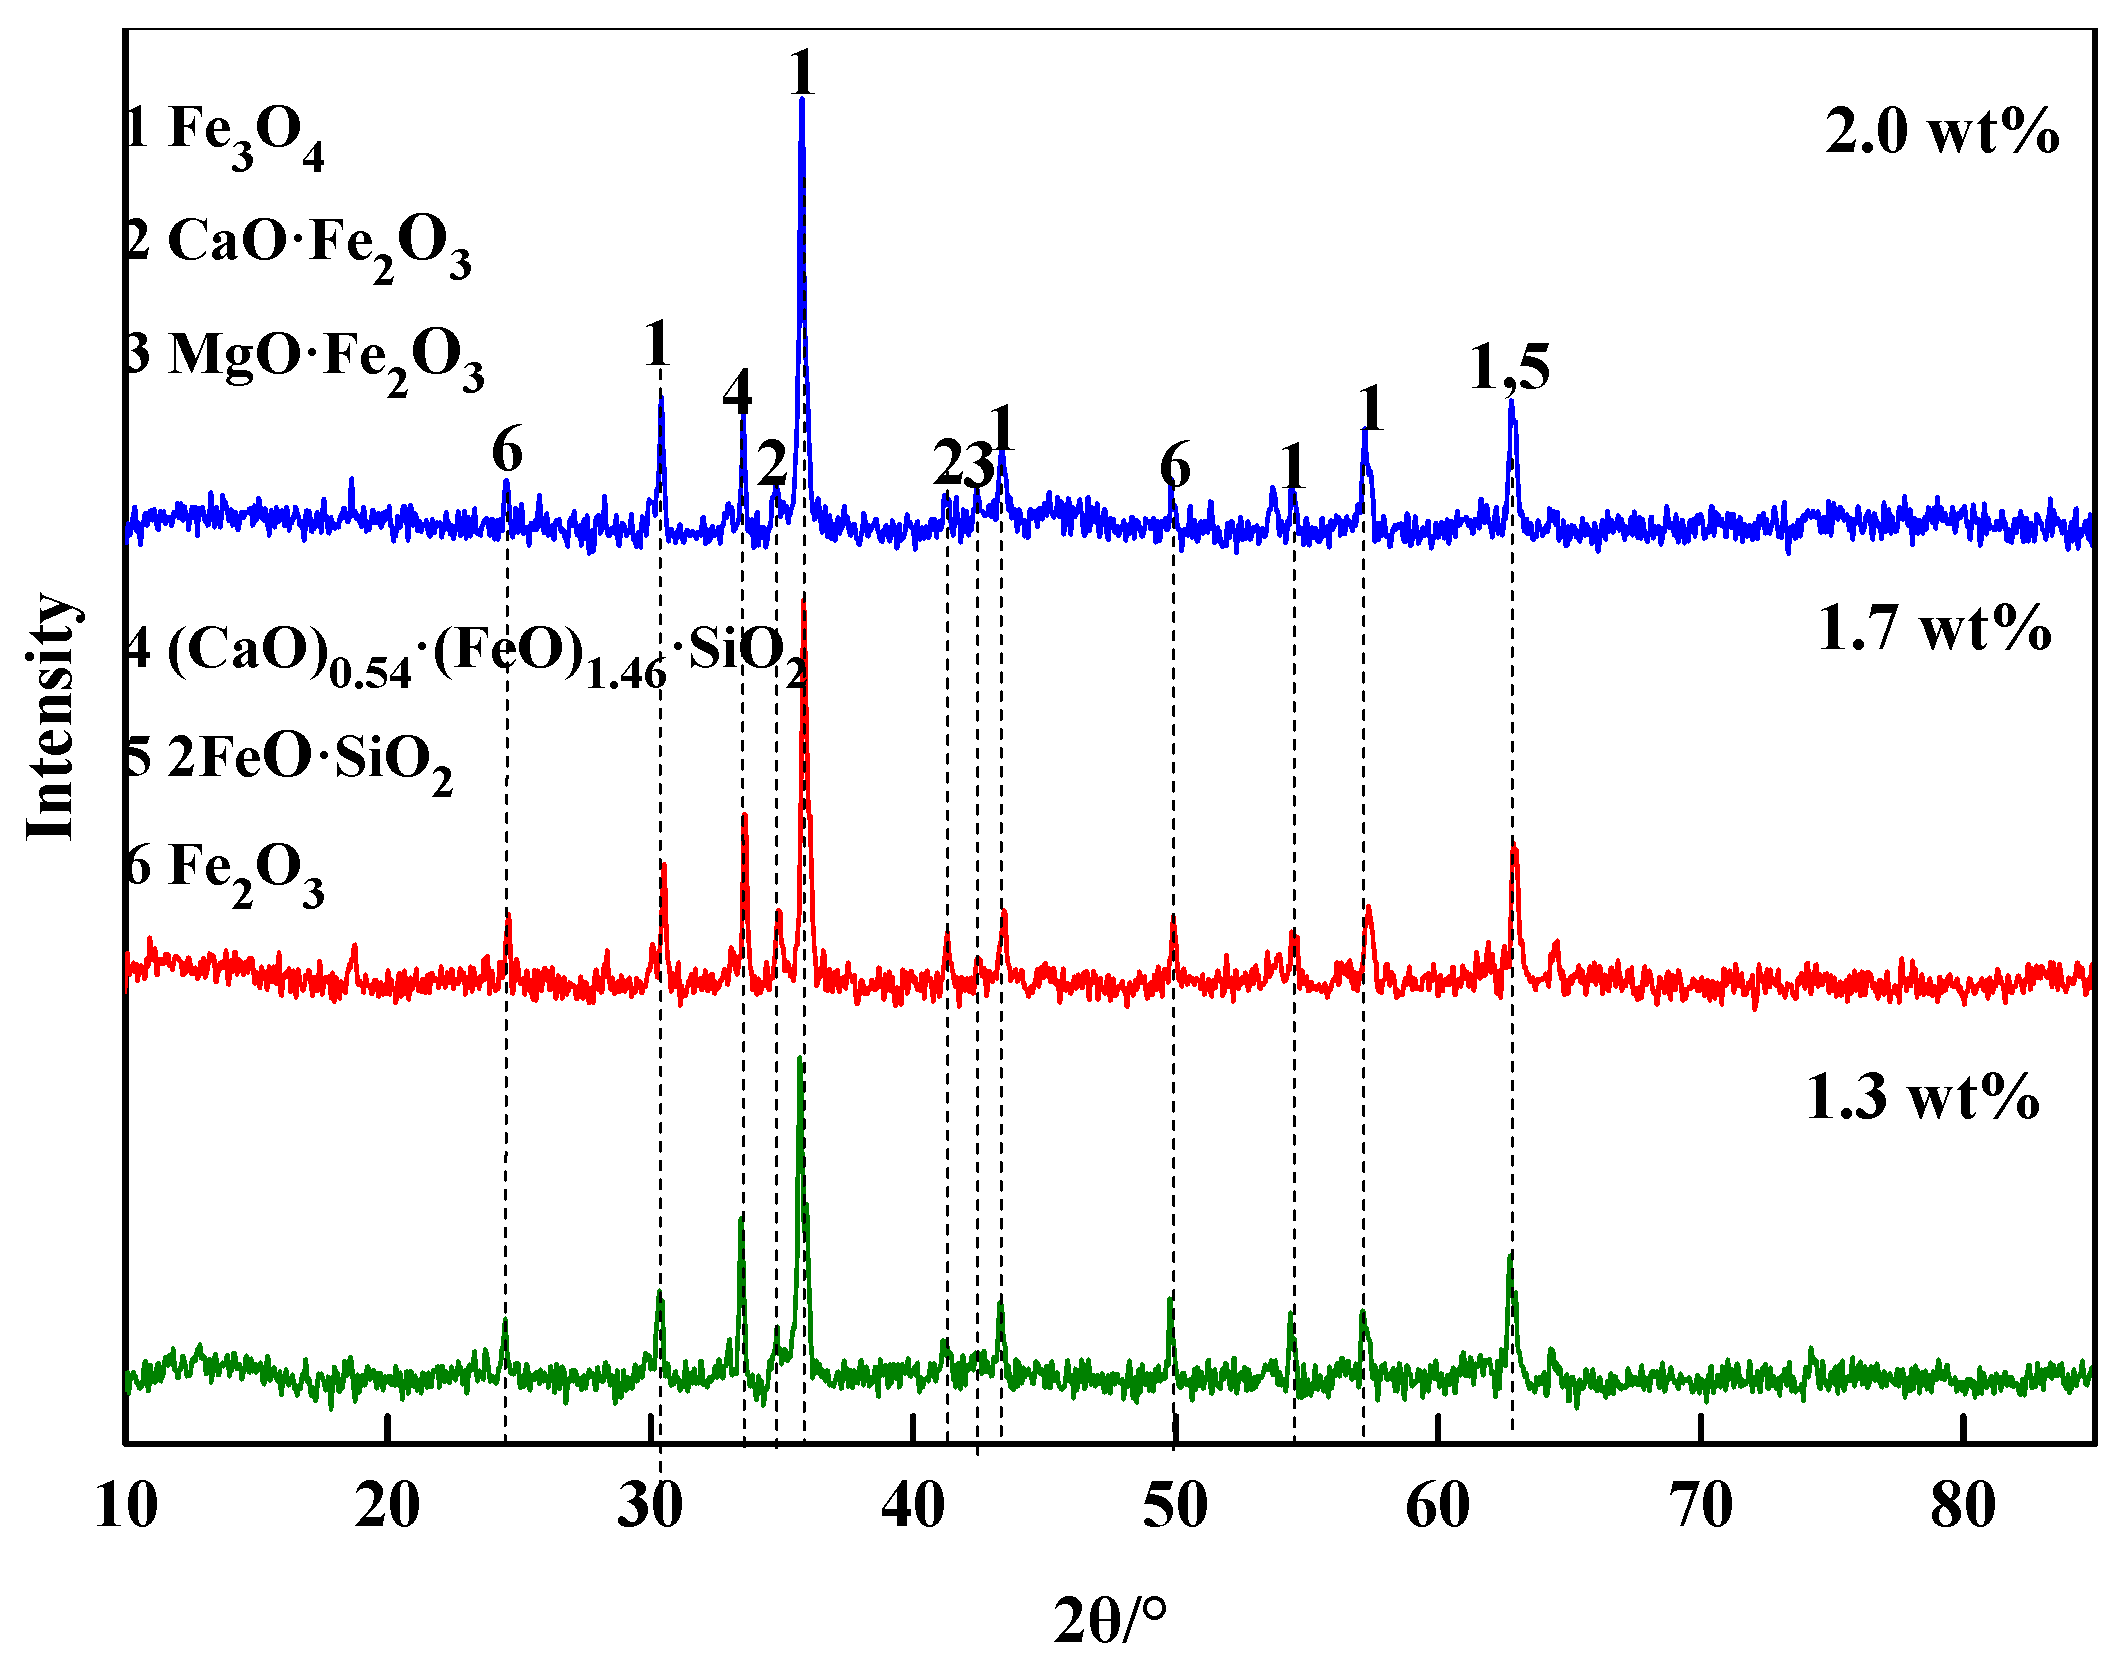
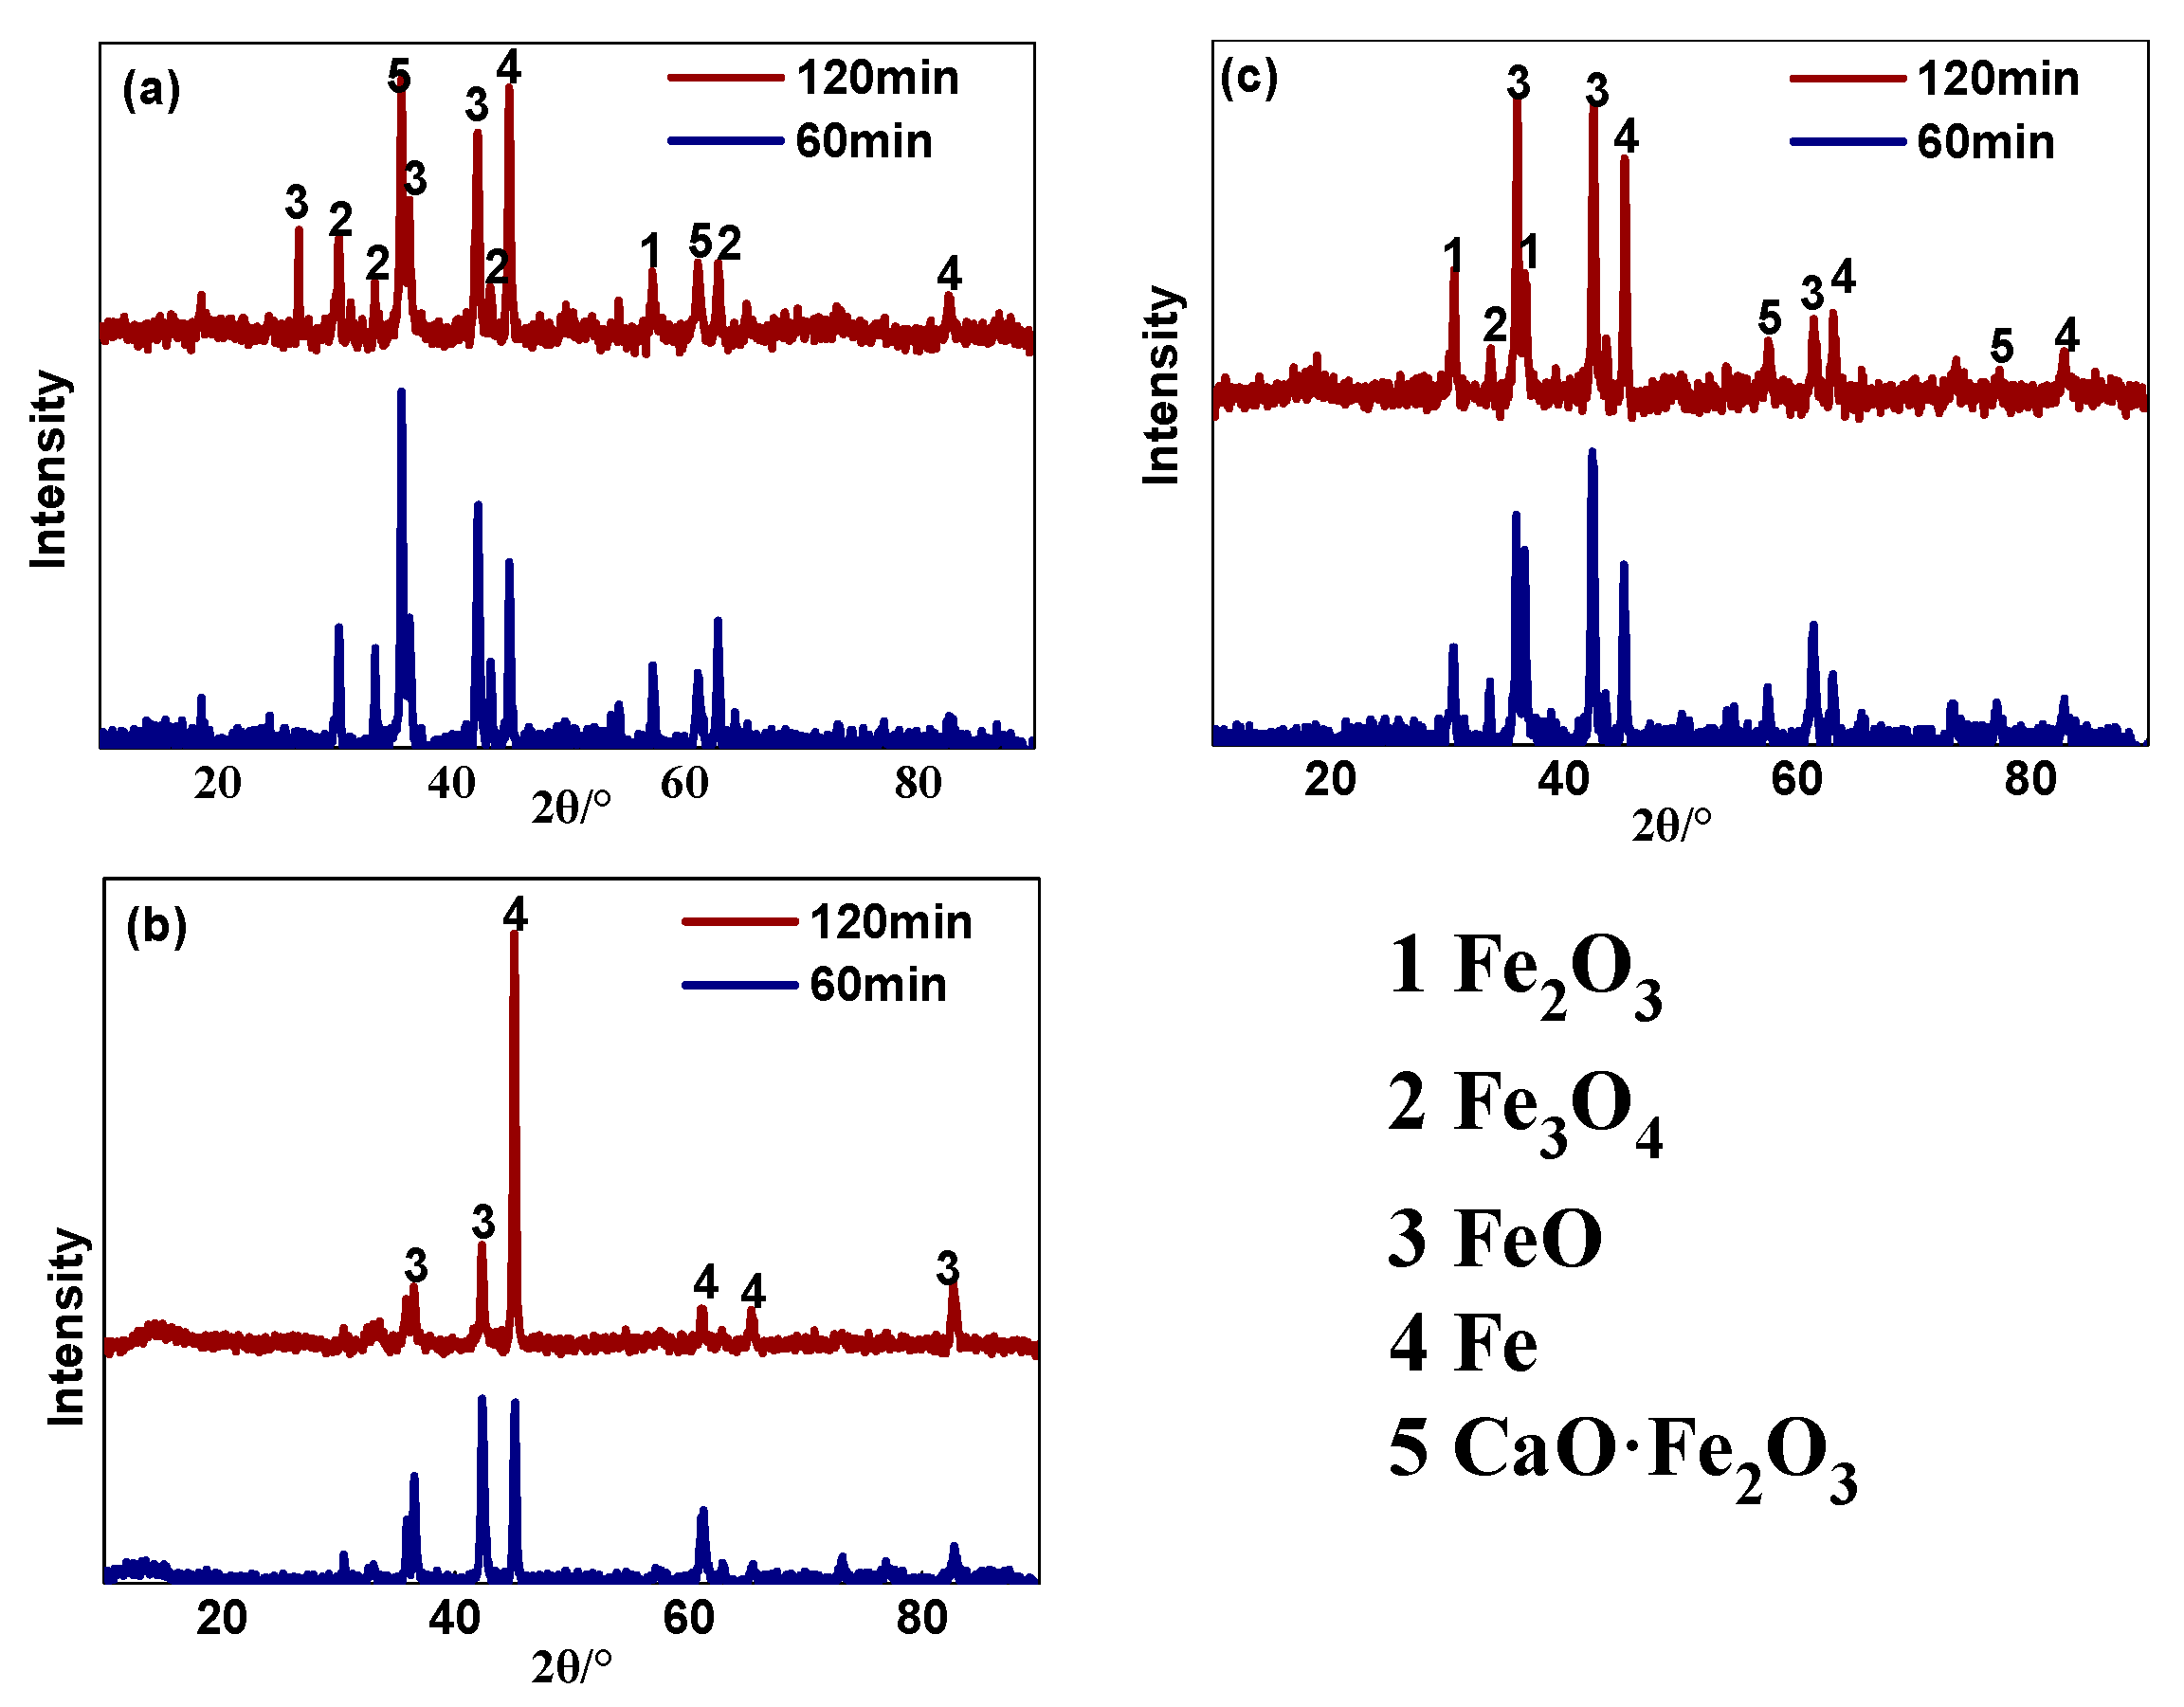
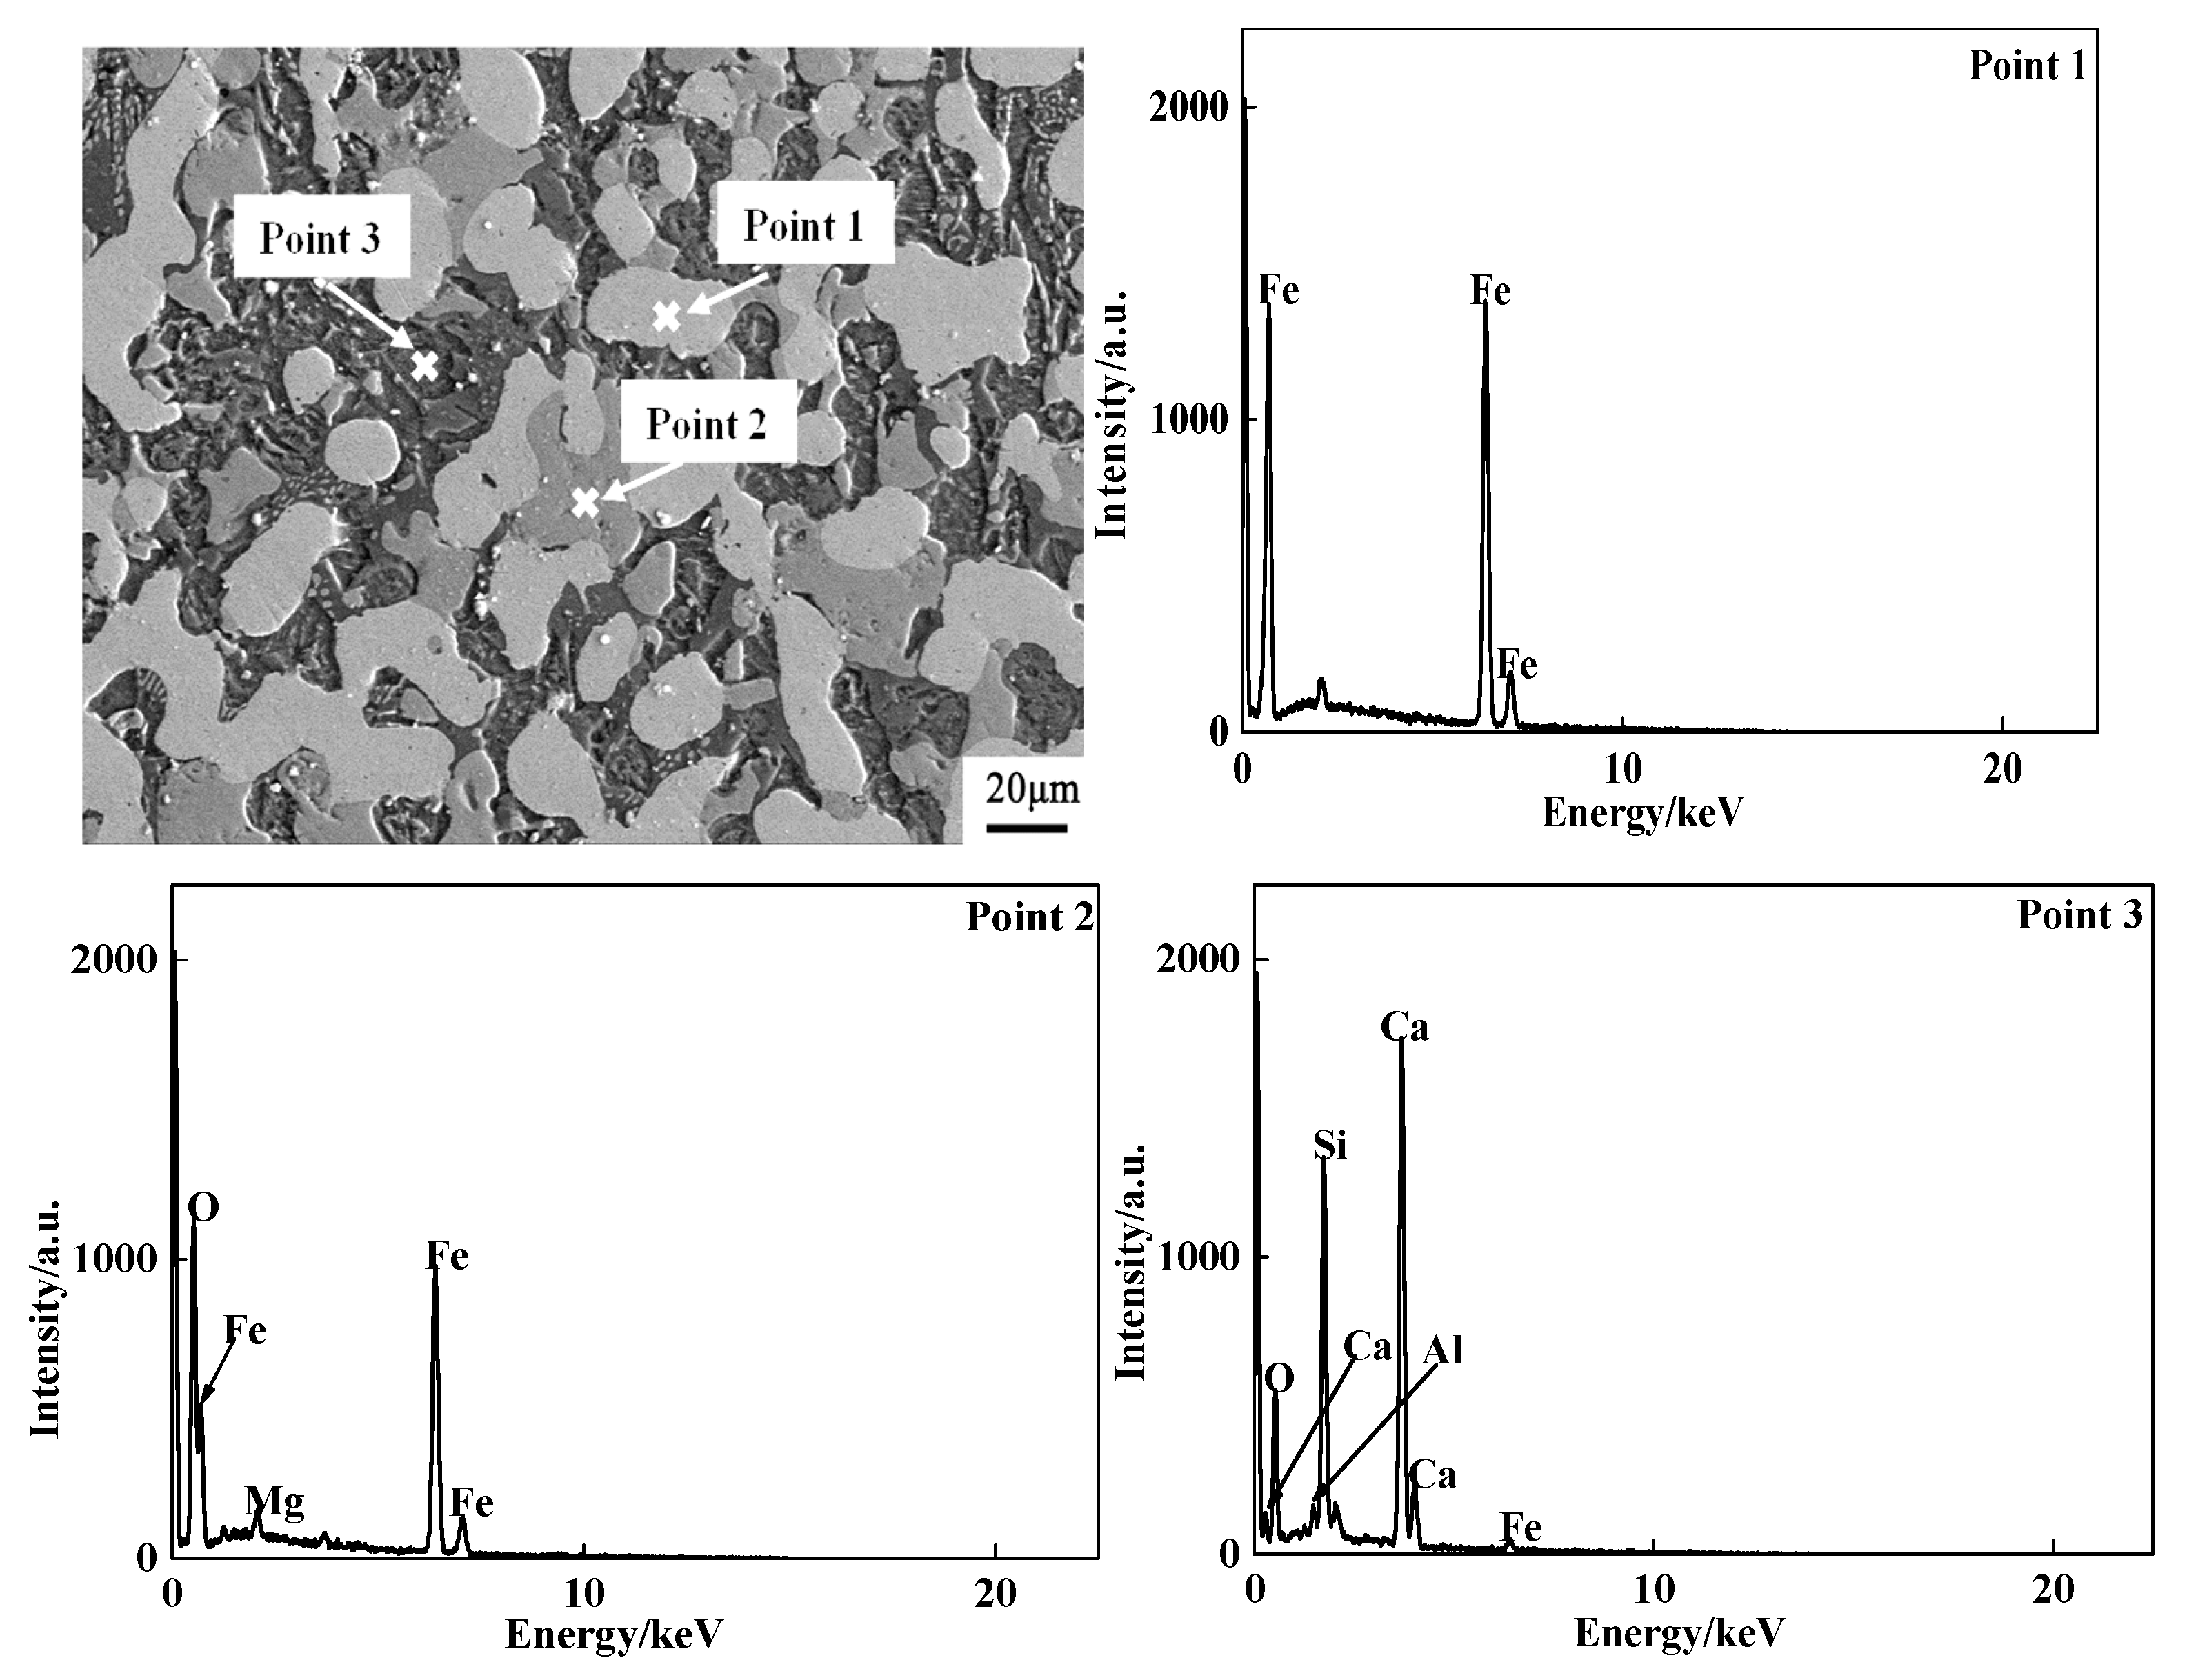
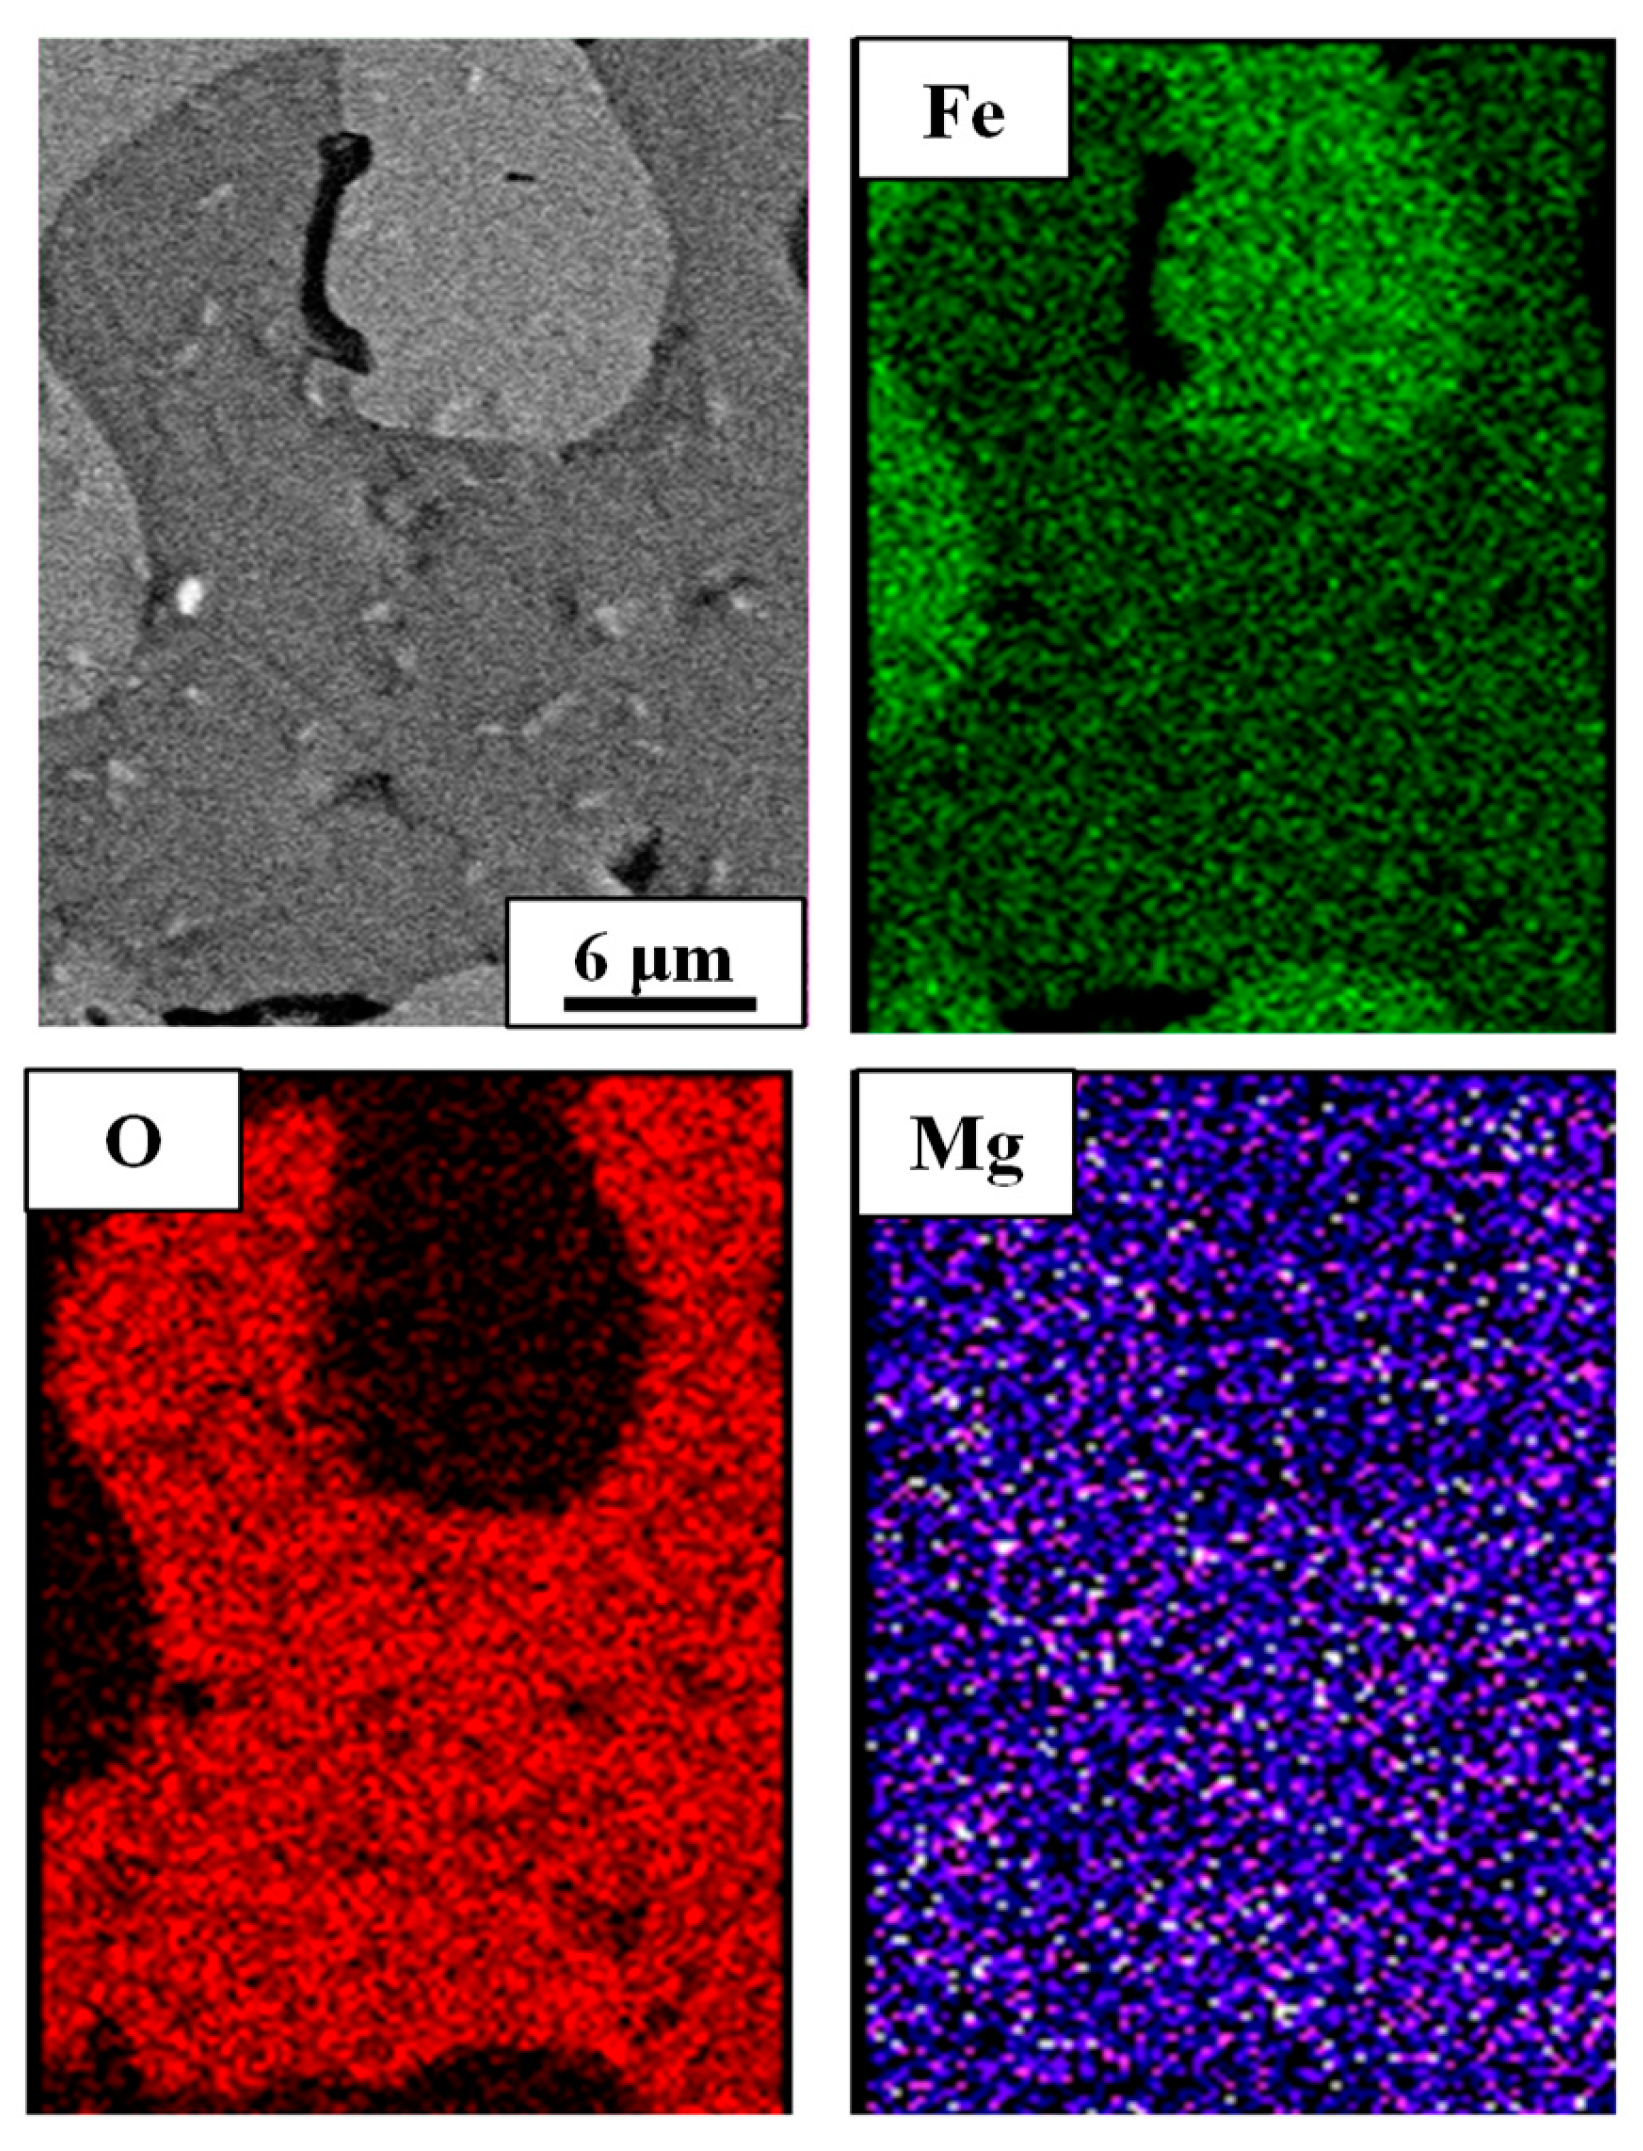
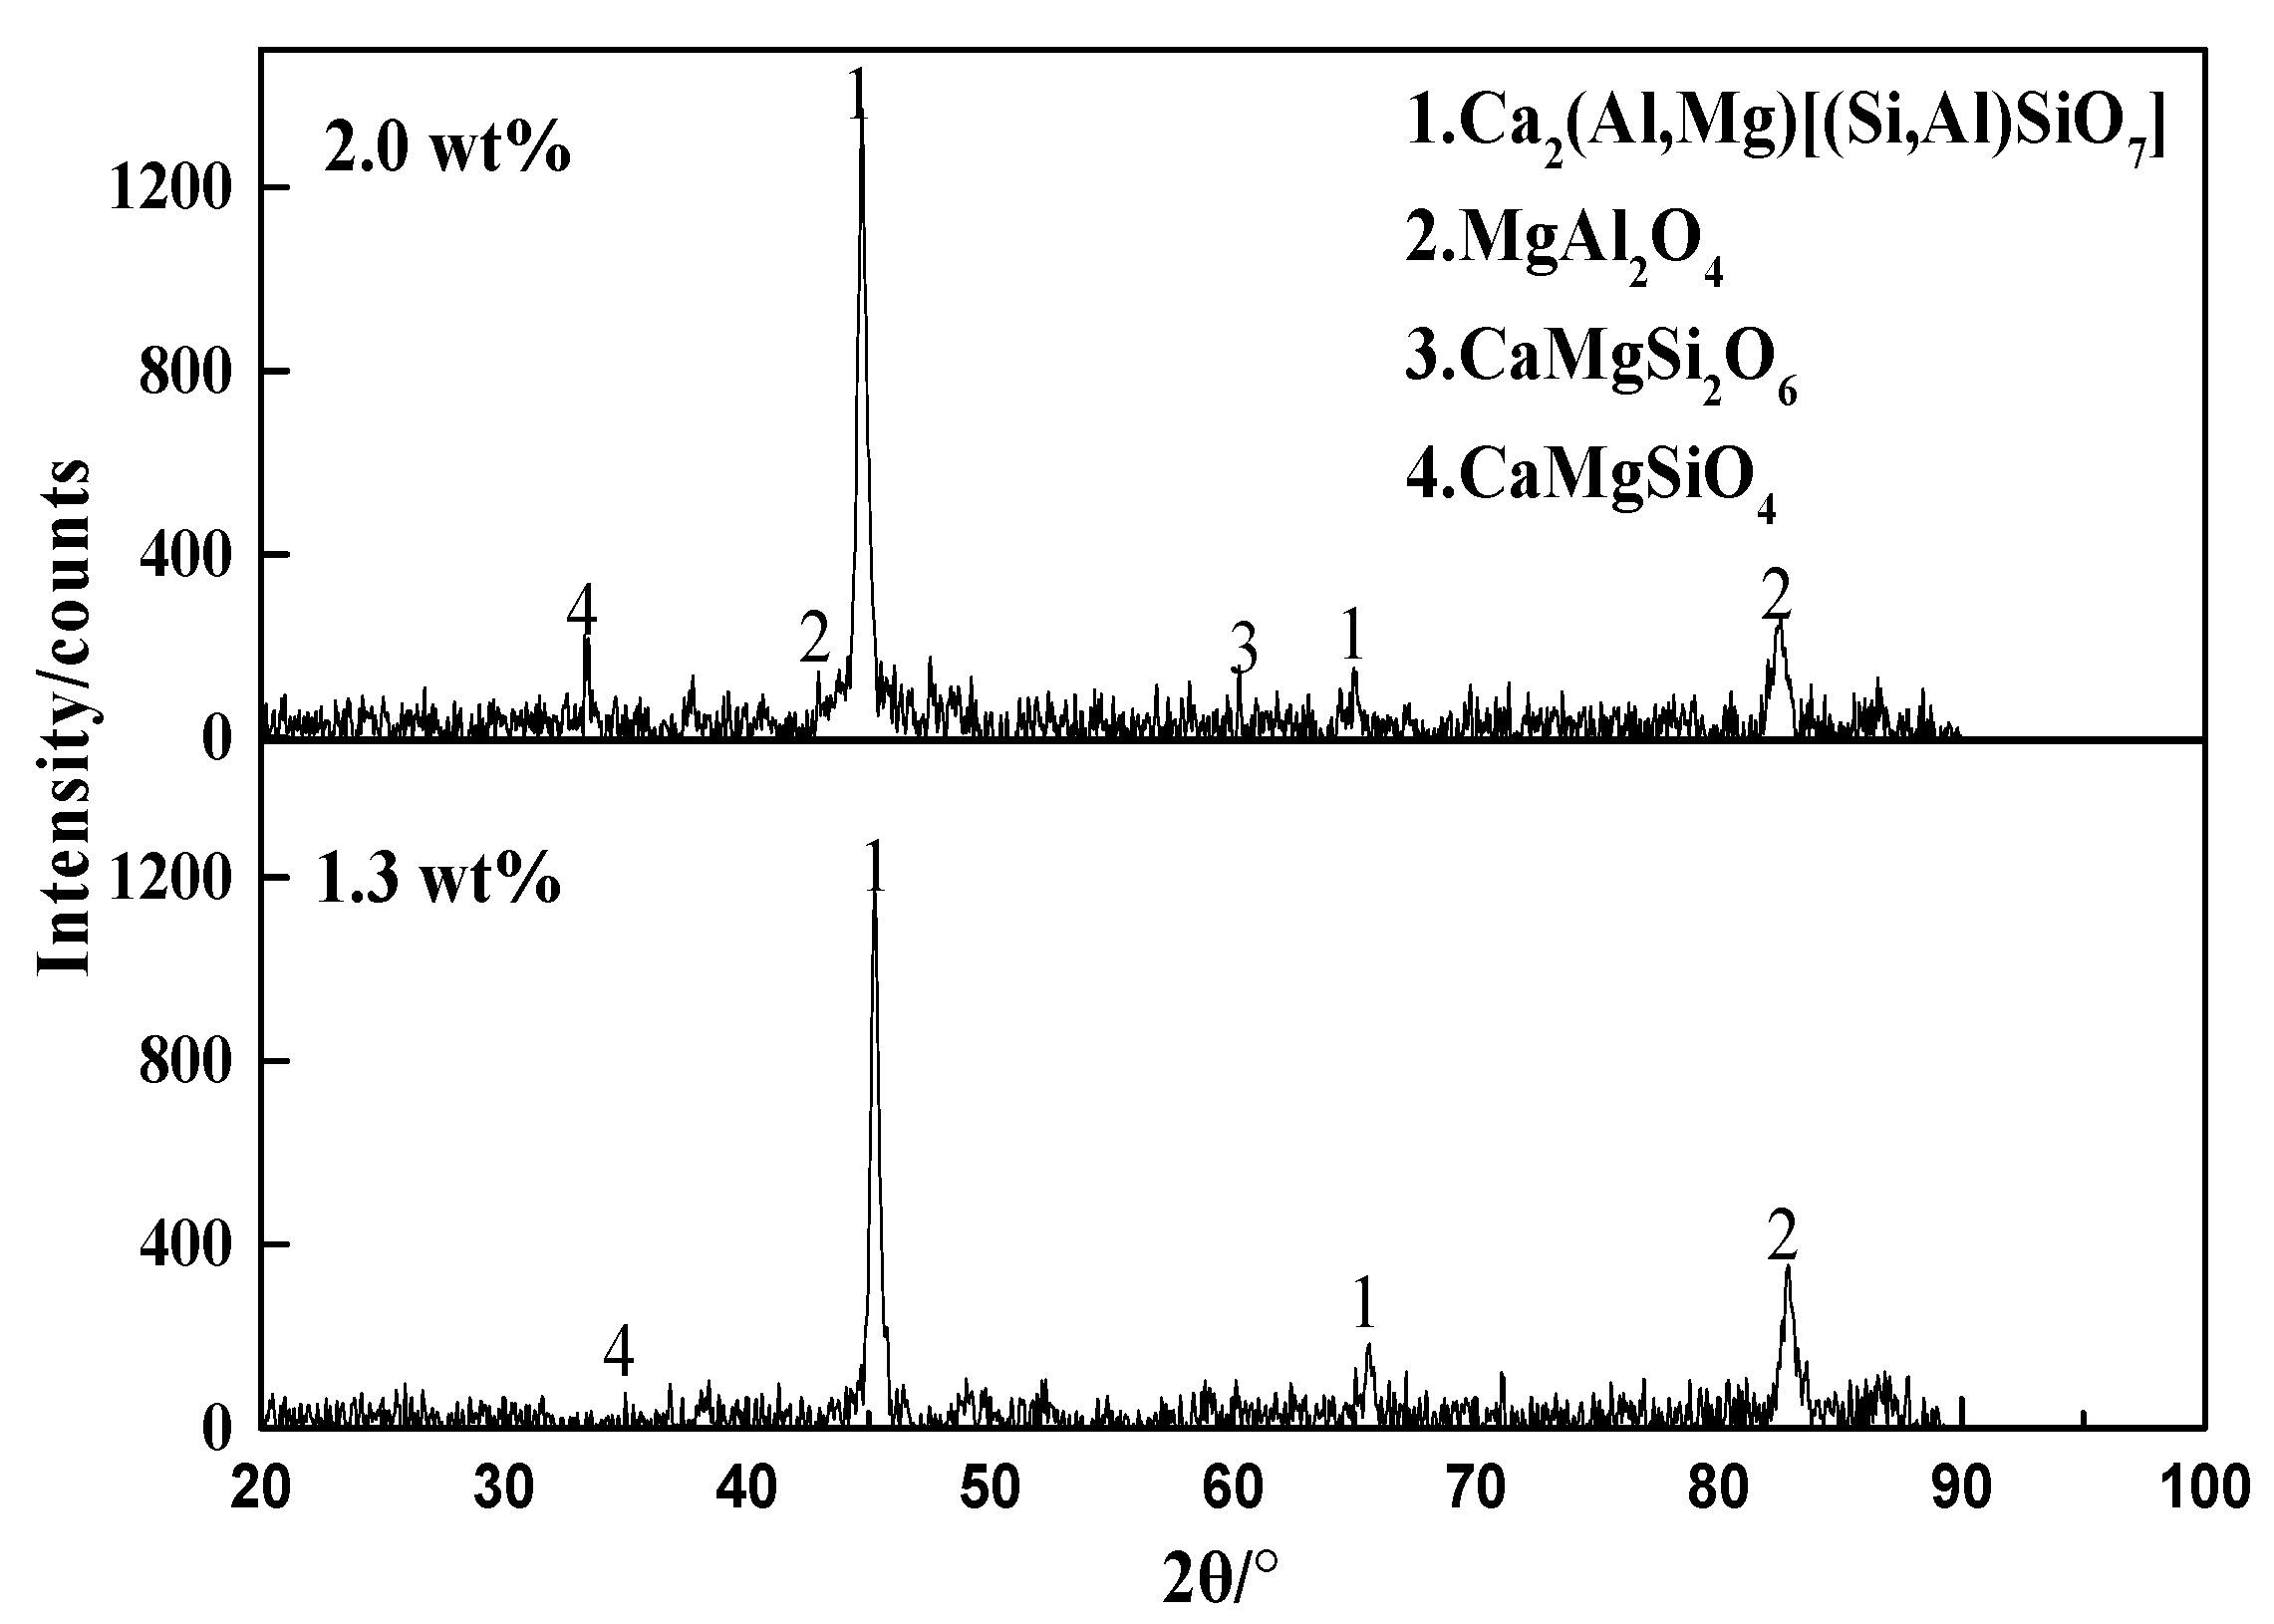
3.1.2. Phase Composition

The phase compositions of sinters with different MgO content are characterized by XRD and the results are shown in Figure 5. The main phase components were Fe, Fe2O3, FeO, and CaO·Fe2O3 for all samples. In the case of 1.3 wt% MgO and 800 °C (Figure 5a), the main phases were FeO, Fe and CaO·Fe2O3 at 60 min. However, as the time increased to 120 min, the intensity of the peaks of Fe2O3, FeO and CaO·Fe2O3 decreased and the diffraction peaks of Fe strengthened gradually. As the reduction temperature increased (Figure 5b), the main phase was only FeO and Fe and other phase compositions for low MgO sinter did not appear. In the case of 2.0 wt% MgO and 800 °C (Figure 5c), the main phases were FeO and Fe, and the intensity of CaO·Fe2O3 was weakened, compared with Figure 5a. The main reason was that the MgO inhibited the formation of CaO·Fe2O3.

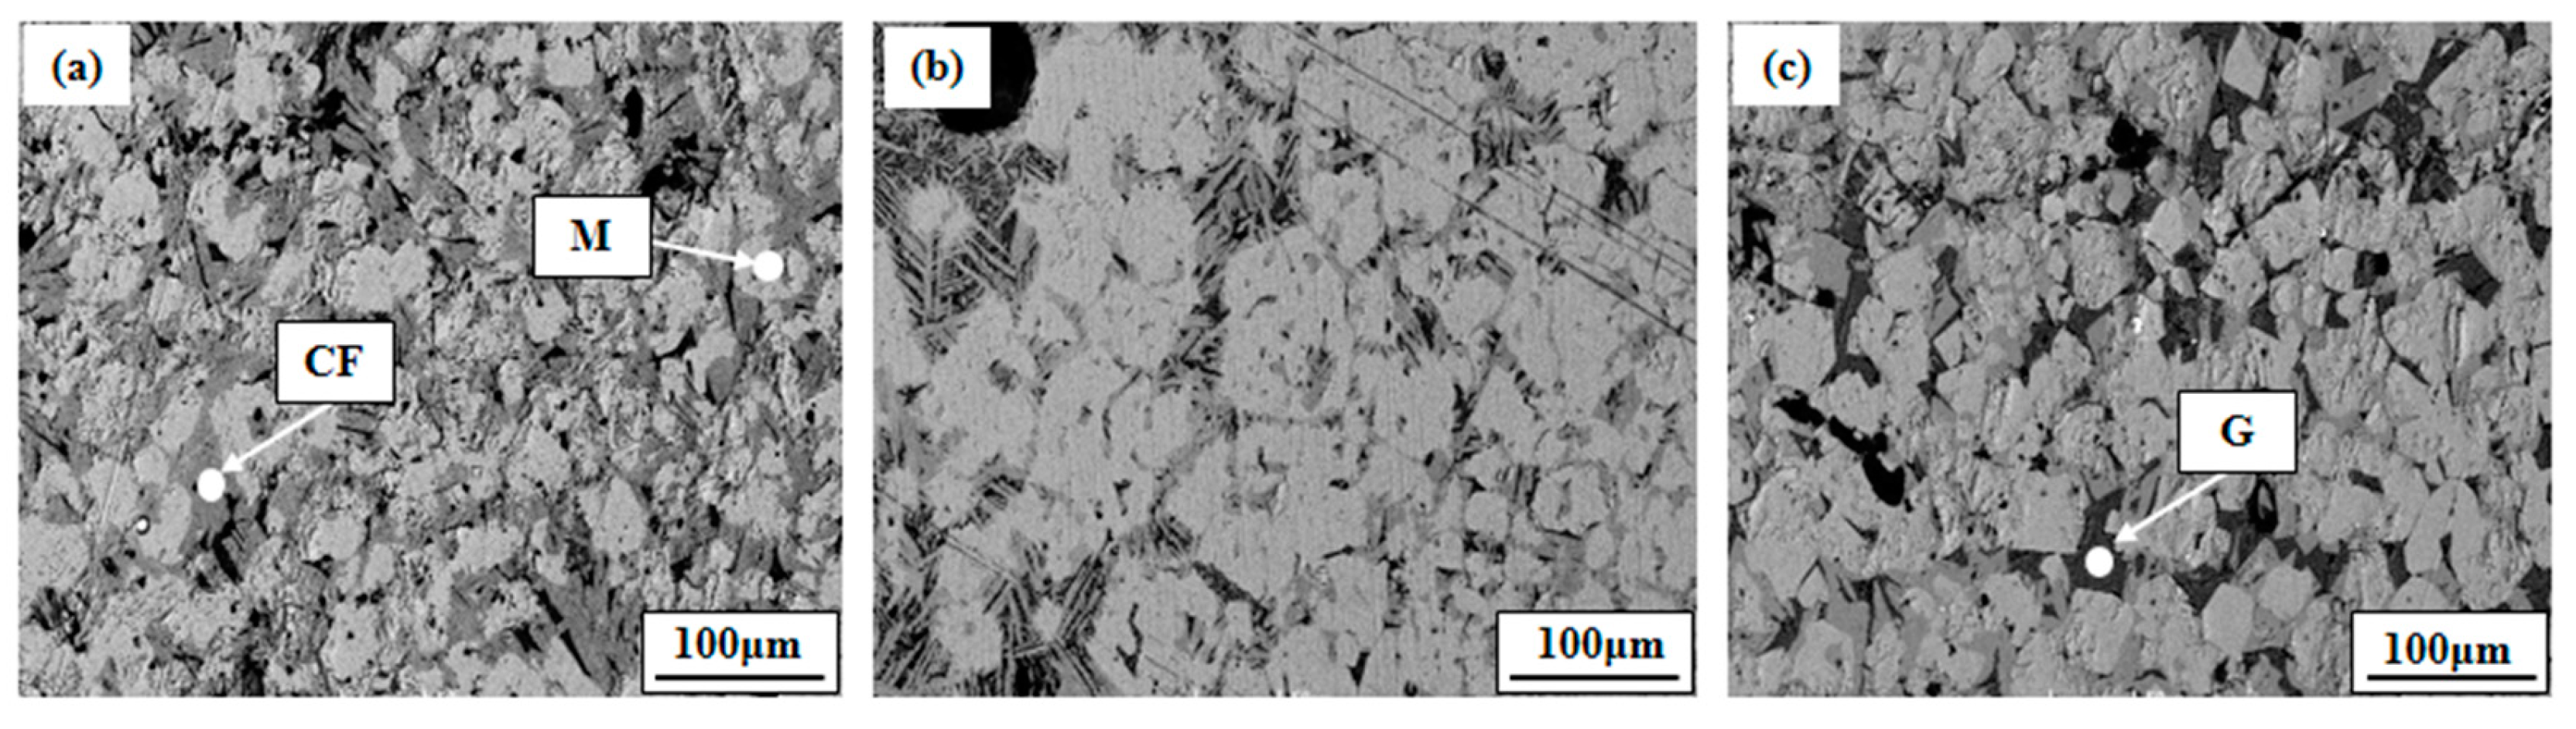
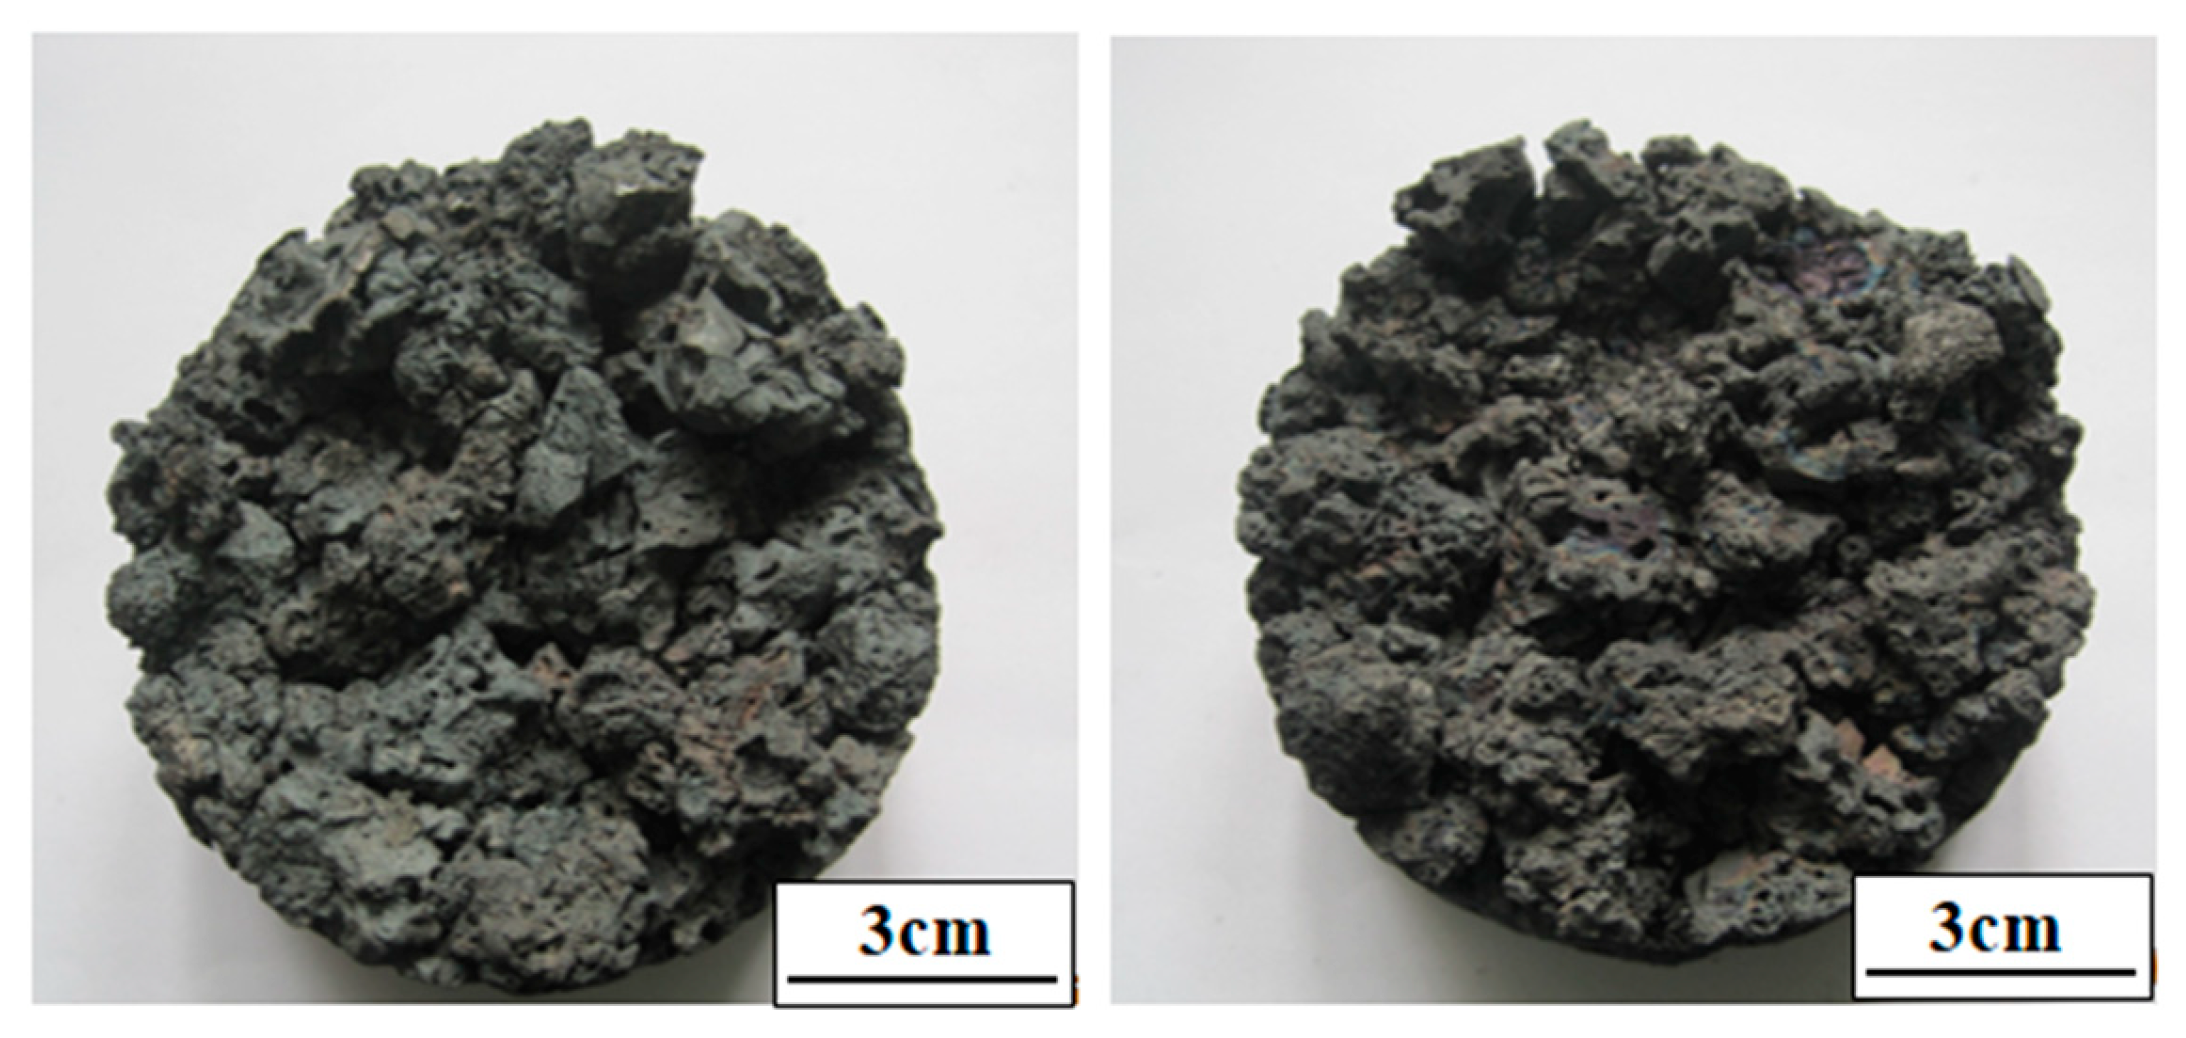
3.1.3. Morphology Change

It is well-known that the microstructure of high basicity sinter is an important factor affecting its reduction. Figure 6 shows SEM images of a polished cross-section of high basicity with different MgO content. It can be seen that these microstructure images changed significantly, and that the main phases were magnesioferrite, calciumferrite and glass phase. For the sinter with 1.3% wt% MgO (Figure 6a), a homogeneous microstructure with uniform grain size distribution was evident. Further, there was little glass between grains and the magnesioferrite, and they were connected hermetically to each other by calciumferrite.
The sinter with 1.7 wt% MgO (Figure 6b) showed dendrite distribution of calciumferrite across the surface. Compared to Figure 6a, a clear decrease in the calciumferrite amount was observed and the glass phase seemed to be starting to develop. When MgO was increased to 2.0 wt% (Figure 6c), a further decrease in calciumferrite was found, and the magnesioferrite amount and glass phase morphology increased, which caused decreased reducibility and strength of high MgO sinter. Thus, it could be concluded that the added MgO changed the grain morphology of high basicity sinter, and eventually had an effect on the reduction process. It was found that most of CaO that took part in the formation of Ca-ferrites was released as MgO replacing CaO with the increased MgO. Then the released CaO, which could crystallize from the melt in the form of silicate, could take part in forming slag under equilibrium conditions. However, the equilibrium conditions were seldom attained in the sintering process, and a considerable amount of CaO was retained in glass phase [25]. Based on the above reasons, the glass phase was increased with the increased MgO. A detailed discussion of the mechanism of magnesioferrite formation is presented in Section 4.3.

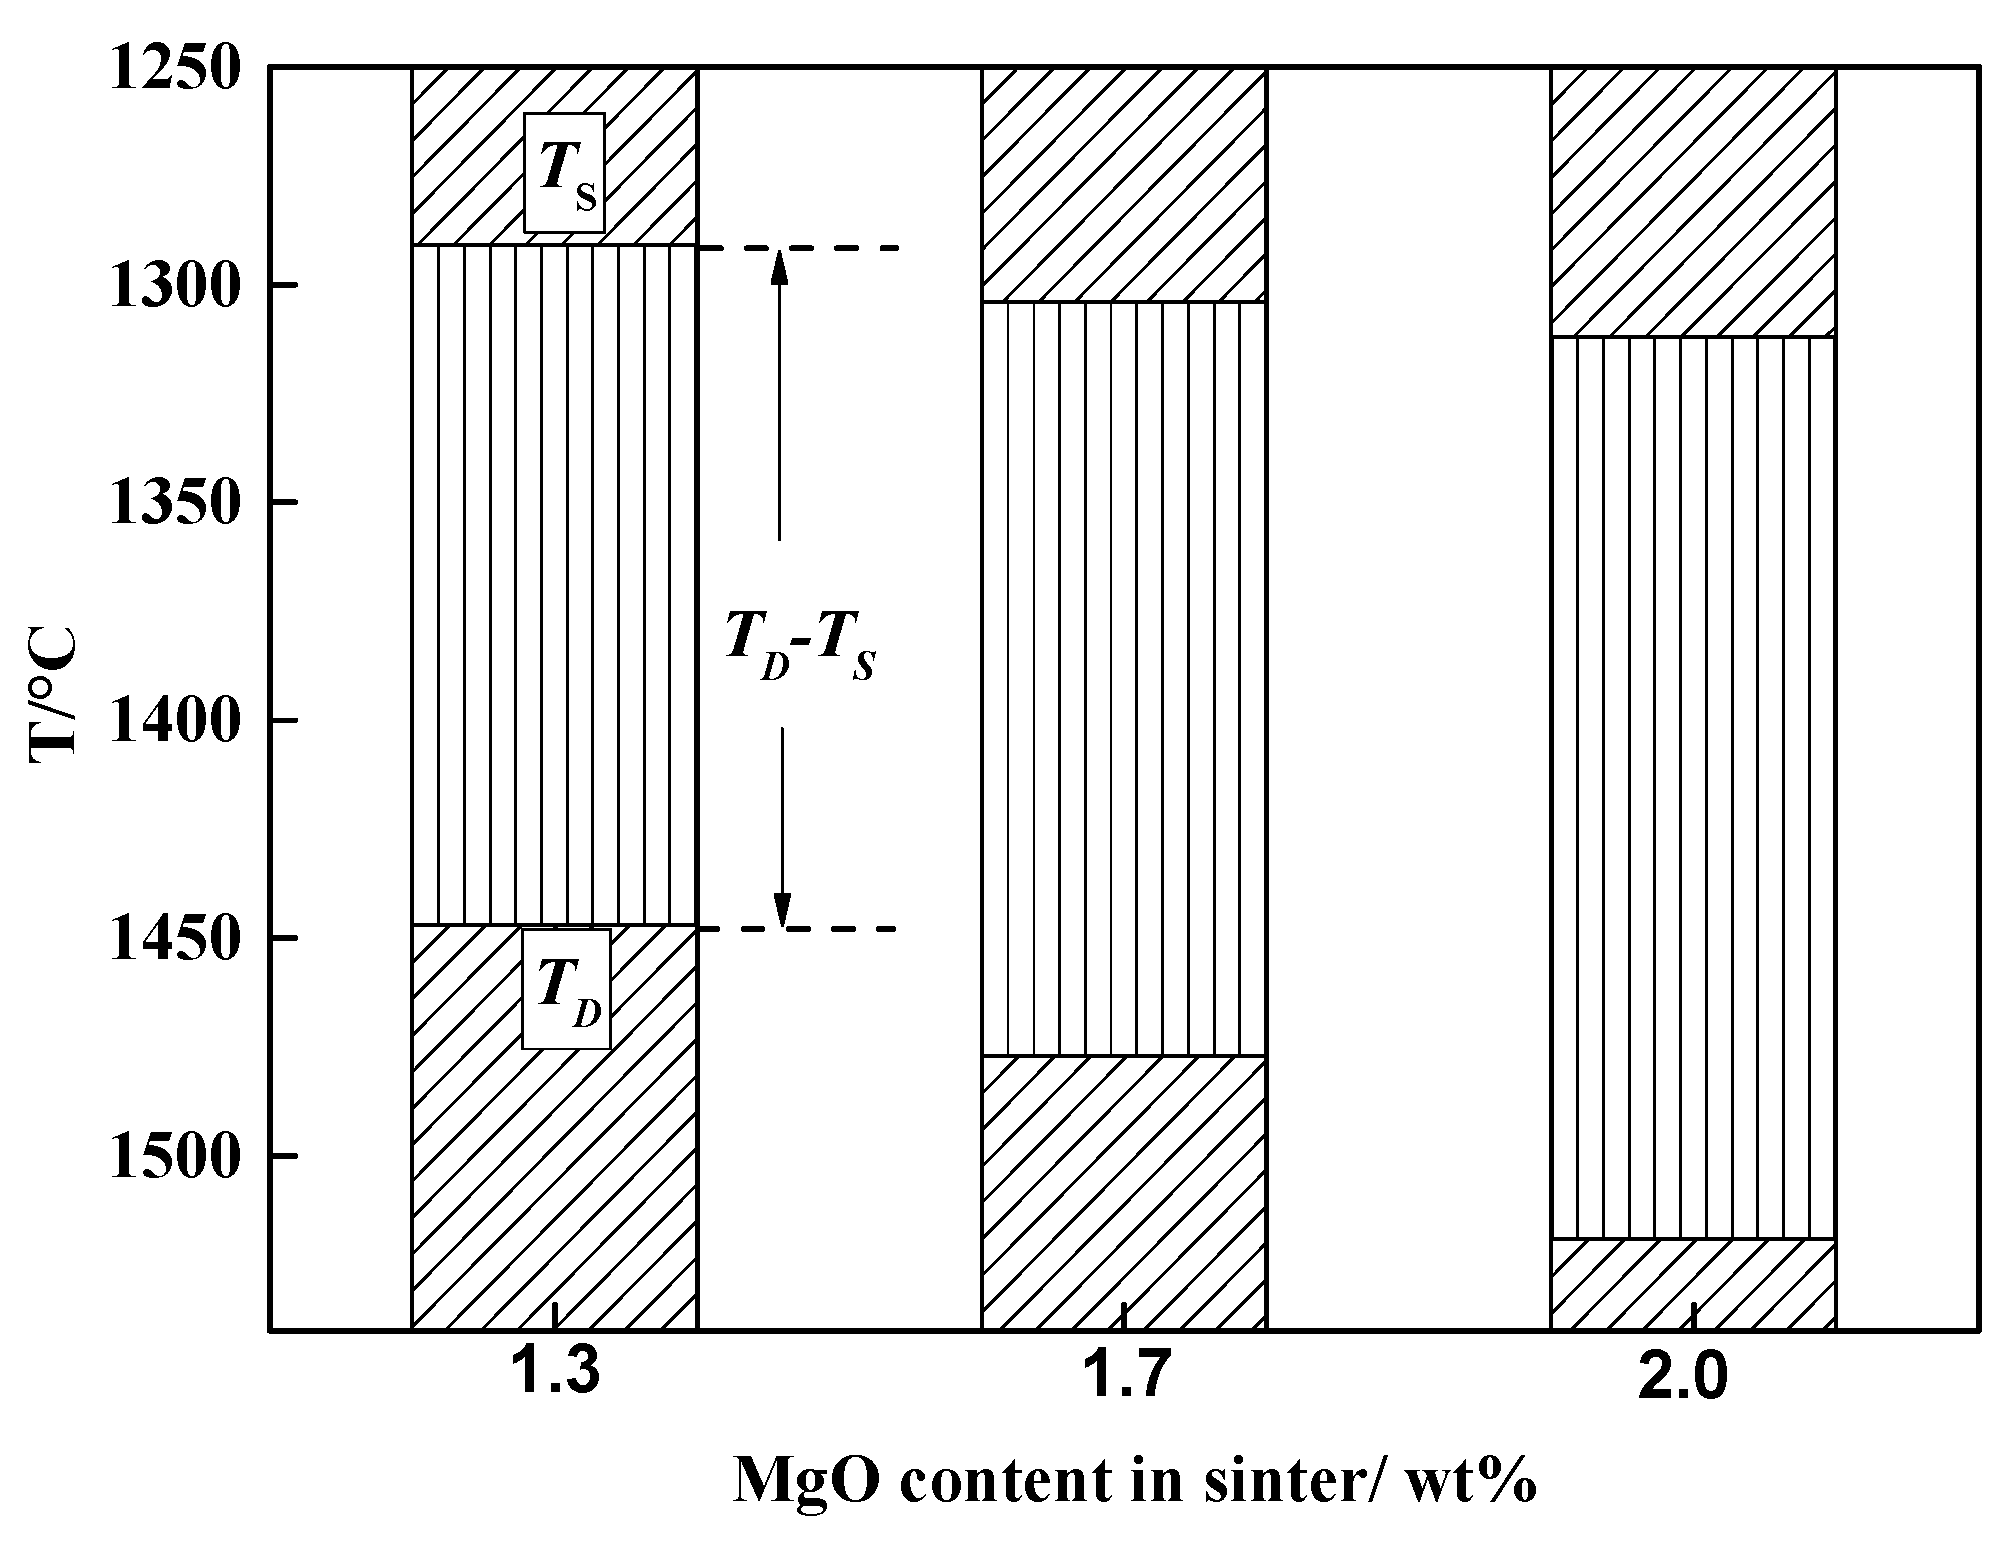
3.2. Softening-Melting Behavior

The softening properties results of different MgO content sinters are shown in Figure 7. The softening start temperature (T10) was defined as the temperature at which shrinkage of samples reached 10%; the softening temperature (T40) was defined as the temperature at which shrinkage of samples reached 40%; the softening zone (T40T10) was defined as the temperature difference between softening temperature and softening start temperature. From the Figure 7, it can be seen that softening start temperature gradually increased from 1128 °C to 1142 °C and softening temperature increased from 1255 °C to 1288 °C with the increased in the MgO content. The softening zone increased from 127 °C to above 145 °C with the increased of MgO from 1.3 to 2.0 wt% as whole. The increasing softening start temperature was helpful for the stability of furnace and the process of the gas-solid reducibility reaction. It was shown that the softening zone kept the expanding tendency, and correspondingly the softening index carried the deterioration trend as the softening zone increased adversely influencing the ironmaking and gas-solid reaction. When the MgO was increased, the iron oxide combined with magnesium oxide to formed magnesium iron oxide, which was more difficult to reduce than iron oxide. The high melting point slag of MgO was also increased with the increased MgO contents. For these reasons, the softening start temperature and softening temperature increased with the increased MgO content.
The melting temperature (TS) is usually defined as the temperature at which the pressure drop across the bed increases up to 2 kPa; the dripping temperature (TD) is commonly defined as the temperature at which the dripping material appears in the crucible; melting-dripping zone (TDTS): it reflects the thickness of the cohesive zone. The typical results of TS, TD and melting-dripping zone of furnace burdens with different MgO contents are presented in Figure 8.
It was found that the melting temperatures were similar, 1291 °C with an MgO content of 1.3 wt% and 1312 °C with an MgO content of 2.0 wt%. The suitable melting temperature was helpful to the BF strengthening smelting. The dripping temperature increased from 1447 °C to 1519 °C when the MgO content increased from 1.3 to 2.0 wt%. However, the melting-dripping zone advanced rapidly to a relatively high value above 200 °C, indicating the worsening of the melting-dripping index. The location of the melting-dripping zone moved down and the territory became thicker with the increased MgO content. Therefore, the melting properties of sinter worsened with the increased MgO content.
The results of dripping behavior of sinters with different MgO content are shown in Figure 9. The results indicate that the dripping iron was decreased, whereas the dripping slag was increased with increased MgO content in the sinter. The worse reduction of mixed burden and the generations of high melting point materials dispersed in the slag phase were the primary reasons for the decreased dripping iron.

3.3. Permeability of MgO Sinter

The fluidity and viscosity of slag could influence the permeability of BF due to the liquid phase held up in the dripping zone. To qualify the softening-melting behavior of sinter with different MgO content, the S-value was introduced. When the S-value is smaller, it indicates a better permeability of the sinter. The current S-value was defined as the integral of the pressure-drop function over the melting and dripping temperature interval, which represents the area below the pressure-drop curve, as shown in Equation (4):
S = T S T D ( P m Δ P s ) · d T
where Pm is the pressure drop at a certain temperature between TDTS, and Δ P s is the pressure drop at melting temperature TS.
The effect of MgO on the permeability of sinter is shown in Figure 10. The S-value, which was increased with the increased MgO, was 937.5, 1468.8 and 1510.6 kPa·°C, respectively. The S-value of sinter increased with the increasing MgO, indicating the permeability of sinter deteriorated with increased MgO. Meanwhile, the shrinking of the softening and melting intervals shows the bad permeability of contained MgO sinter burden. Therefore, the permeability of the sinter was better when the MgO content was 1.3 wt%; the main reason for this was that the liquid of the slag phase was improved with the decreased MgO content.

4. Discussion

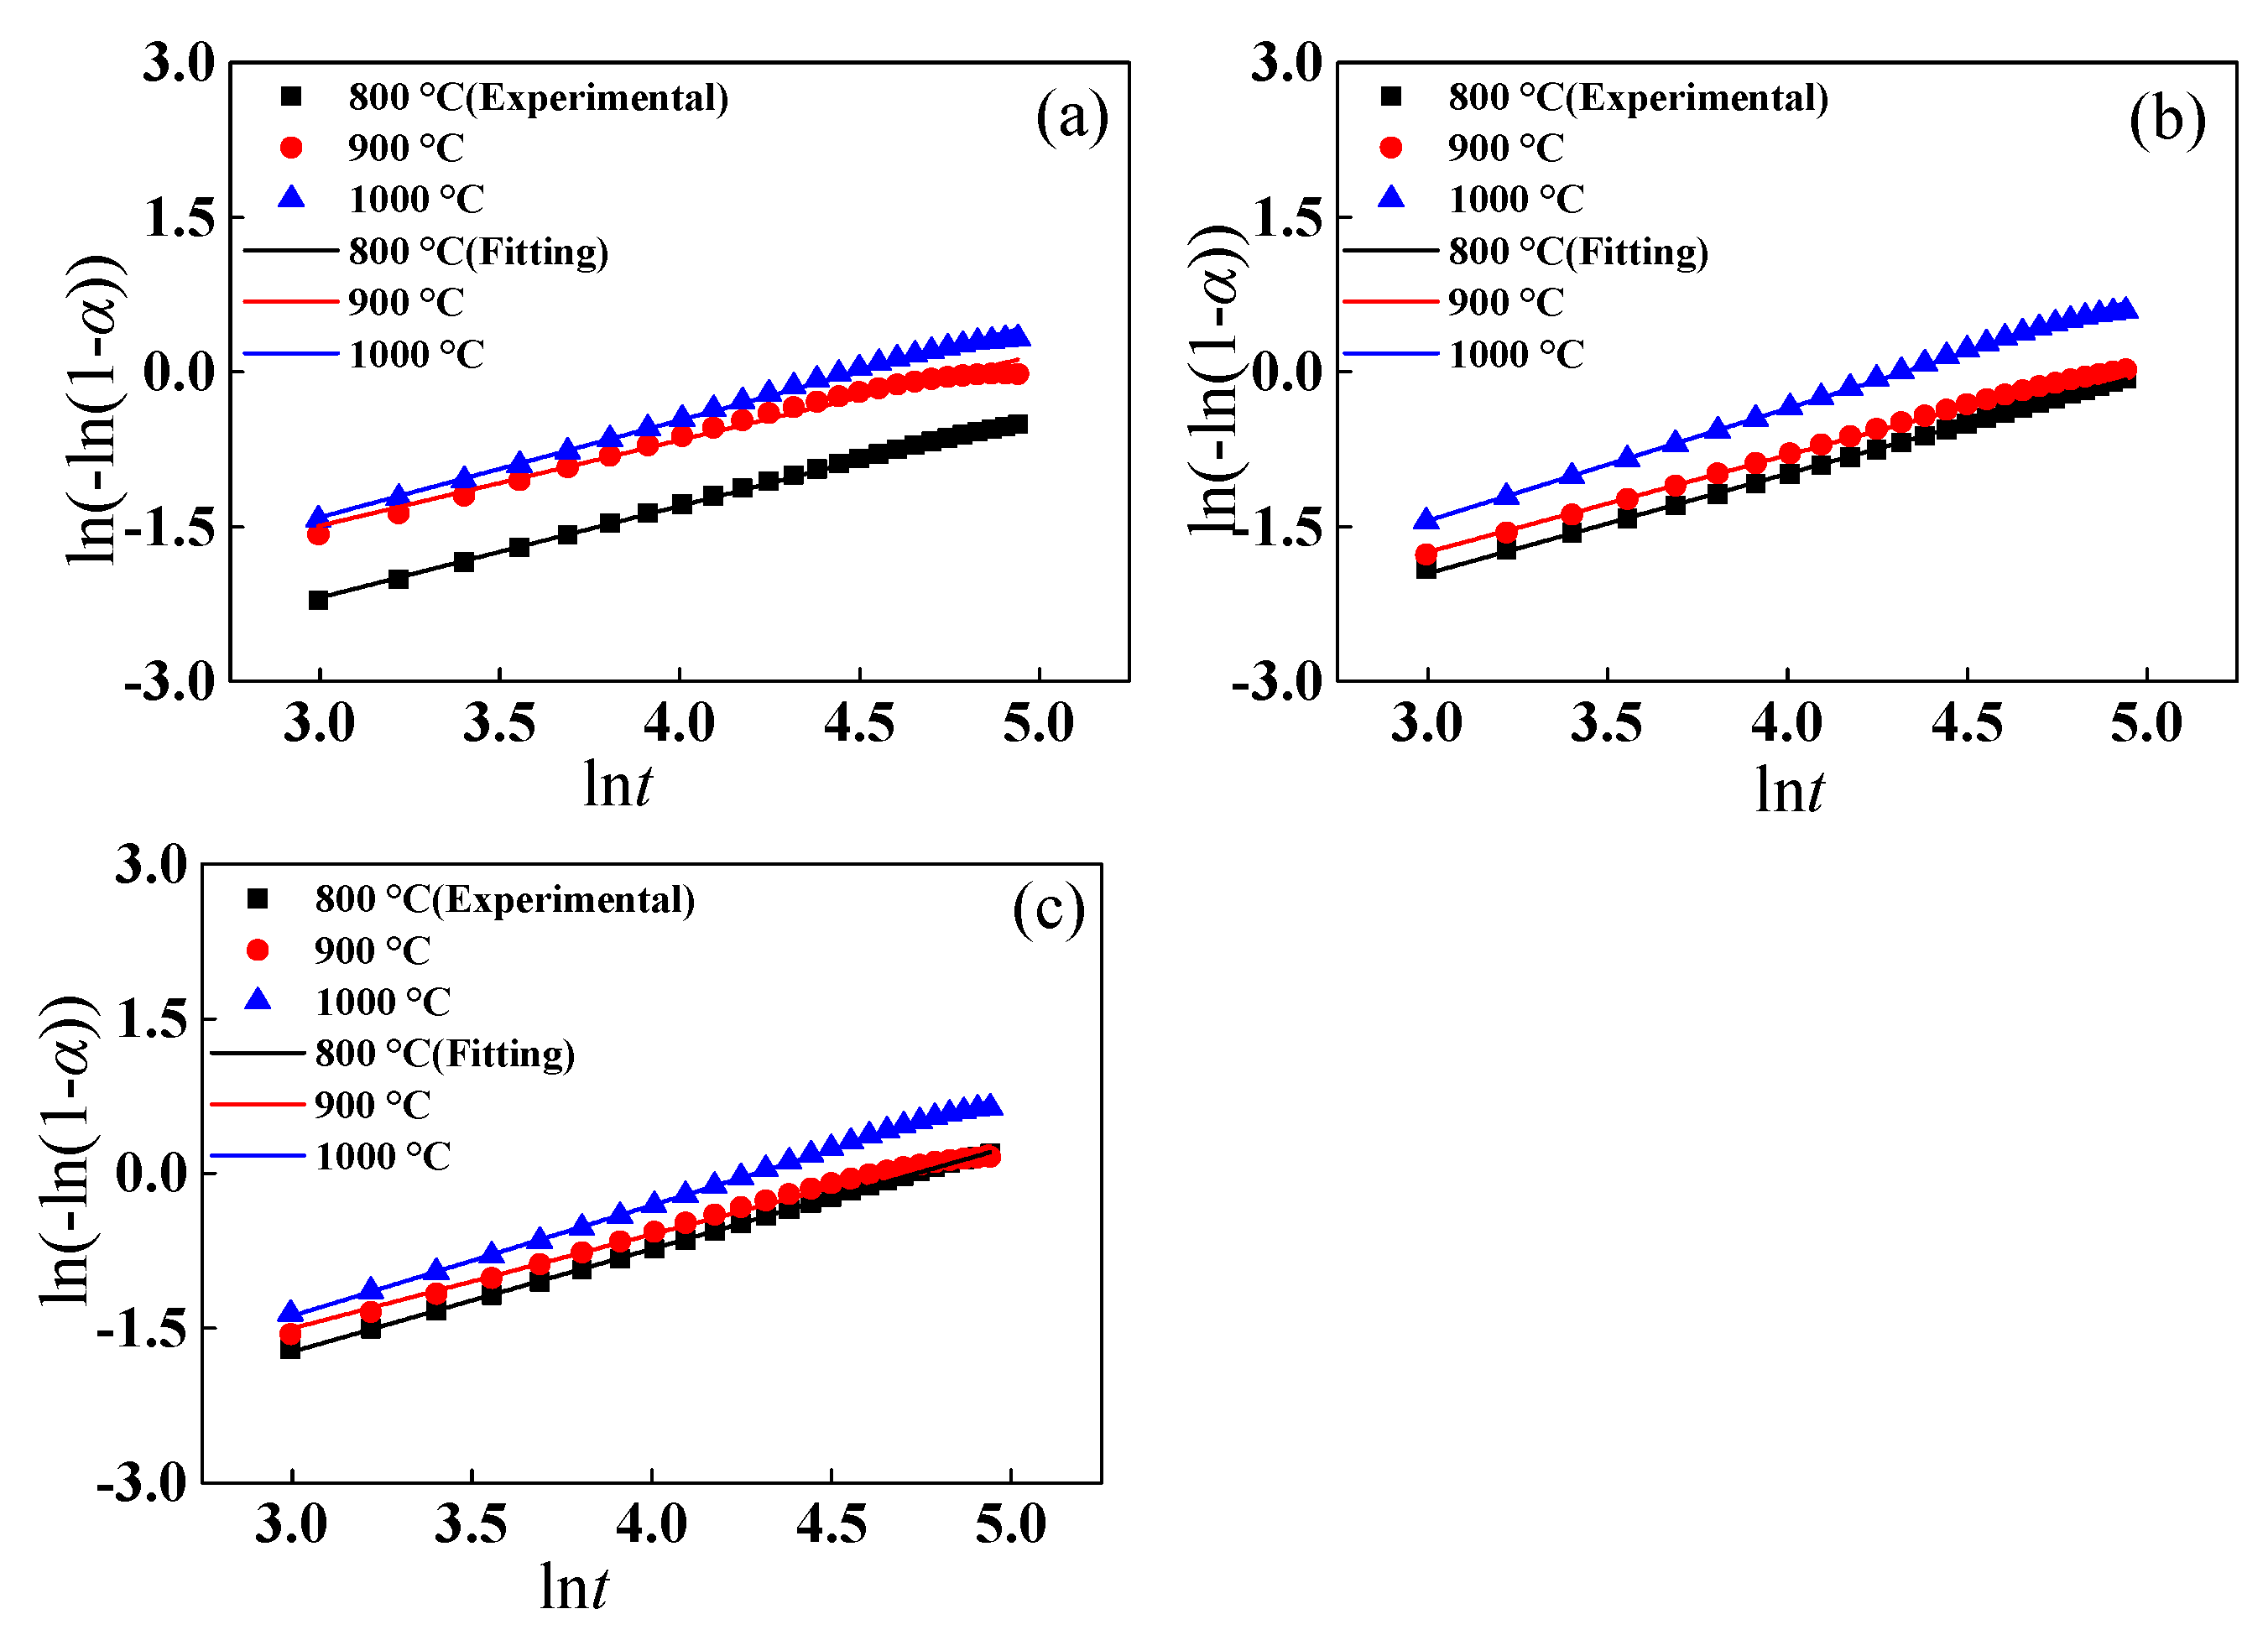
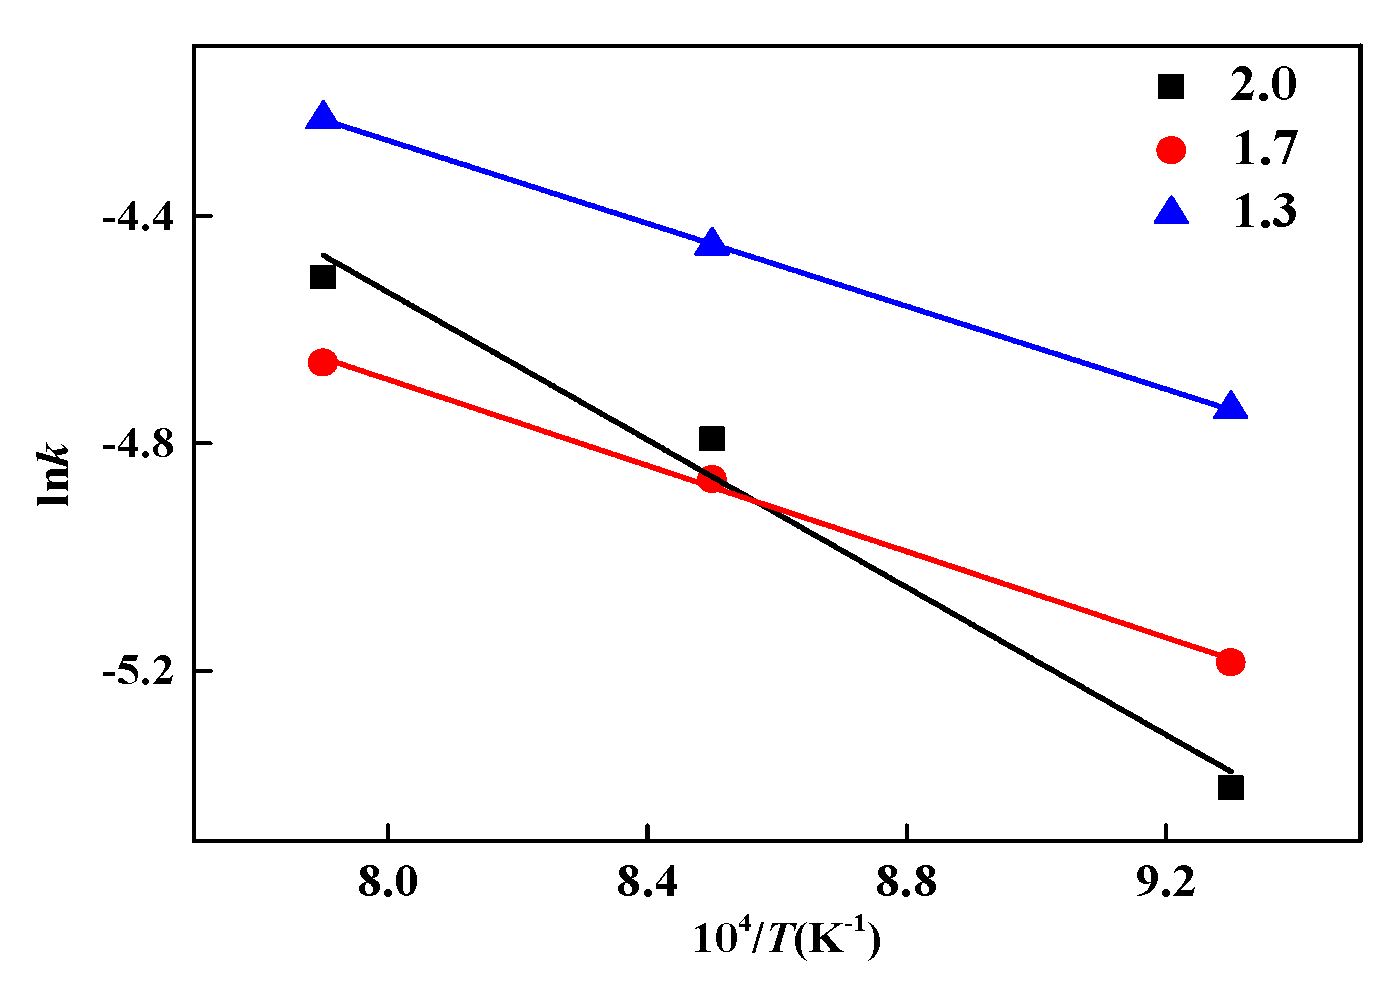
4.1. Reduction Kinetic Analysis

The kinetic results obtained were useful to establish the reduction mechanism as follows. The relationship between reduction rate and time can be expressed by the dynamic differential equation of heterogeneous phase system, as shown in Equation (5) [26].
d α d t = k ( T ) f ( α )
where d α d t is the reduction rate, k ( T ) is the reaction rate constant, and f ( α ) is the mode function that describes the reaction mechanism. k ( T ) is determined by the following the Arrhenius equation, as shown in Equation (6).
k ( T ) = A exp ( E R T )
where A is pre-exponential factor, E is the apparent activation energy, and R is the gas constant [8.314 J/(mol·K)]. Equation (6) is further expressed as:
d α d t = A exp ( E R T ) f ( α )
f ( α ) was obtained difficultly, and G ( α ) , which is the integral function of f ( α ) , can be described as:
G ( α ) = 0 α d α f ( α ) = 0 t A exp ( E R T ) d t = k ( T ) t
Based on the Avami-Erofeev equation [27,28,29], the reduction degree can be expressed by the relationship of time and rate constant:
1 α = exp k t n
where α is the reduction degree of samples (%) and n is the Avrami exponent. By obtaining the double natural logarithm on either side of the equal sign in Equation (9), we can formulate the following:
ln [ ln ( 1 α ) ] = n ln t + ln k
The value of n is directly related to G(α). In general, the main kinetic model (G(α)) of the reaction can be determined by the value of n. The relationship between n and G(α) is shown in Table 3 [30]. It is worth mentioning that function F1 (α) represents a first-order reaction with random nucleation.
Figure 11 shows the relationship between lnt and ln(−ln(1 − α)) for sinter with different MgO content, and Table 4 shows the slope of linear fitting and the degree of fitting (R2). The Avrami exponent can be obtained by the slope of the fitted line of lnt against ln(−ln(1 − α)). The degree of fitting was about 0.99, and the results were reasonable. When the MgO content in sinter was increased from 1.3 to 2.0 wt%, the average value of slope was 1.01847, 1.05108 and 0.93926, respectively. The results revealed that n corresponding to 1.3, 1.7 and 2.0 wt% MgO reduction lay at 1.02, 1.05 and 0.94, respectively, indicating the reduction of sinter as described by function F1(α) for all samples.
The Arrhenius equation method was used to calculate the activation energy for the obtained activation energy under different reactions. The rate constant k(T) was obtained by finding the plots of G(a) against t, and the fitting results are shown in Figure 12. Table 5 shows the k(T) of the linear fitting and the degree of fitting (R2). It can be seen that the fitting degree of different reactions was higher than 0.99, indicating high accuracy of the fitting result. The reaction rate constant was increased with the increased temperature.
The reaction rate constant for temperature was obtained by the Arrhenius equation, which can calculate the activity energy of the chemical reaction, the equal is shown in (11) and (12).
k = A e E a R T
ln k = ln A E a R T
where k is the constant of reaction rate, A is pre-exponential factor, Ea is activation energy and T is temperature. The activation energy can be obtained by the slope of fitting of lnk (T) against 1/T in Figure 13, and the activation energy Ea and pre-exponential factor are shown in Table 6. The average activation energy was 3.03, 3.14, and 5.39 kJ/mol, and the pre-exponential factor was 0.26, 0.19, and 1.92 min−1, respectively for 1.3, 1.7 and 2.0 wt %.
Based on the above analysis, the activation energy of 1.3 wt% MgO was the lowest, indicating that the sinter used the least energy to change from normal to active state prone to chemical reactions, and that of 2.0 wt% MgO was the highest. Therefore, 1.3 wt% MgO had the best reducibility and 2.0 wt% MgO had the worst.

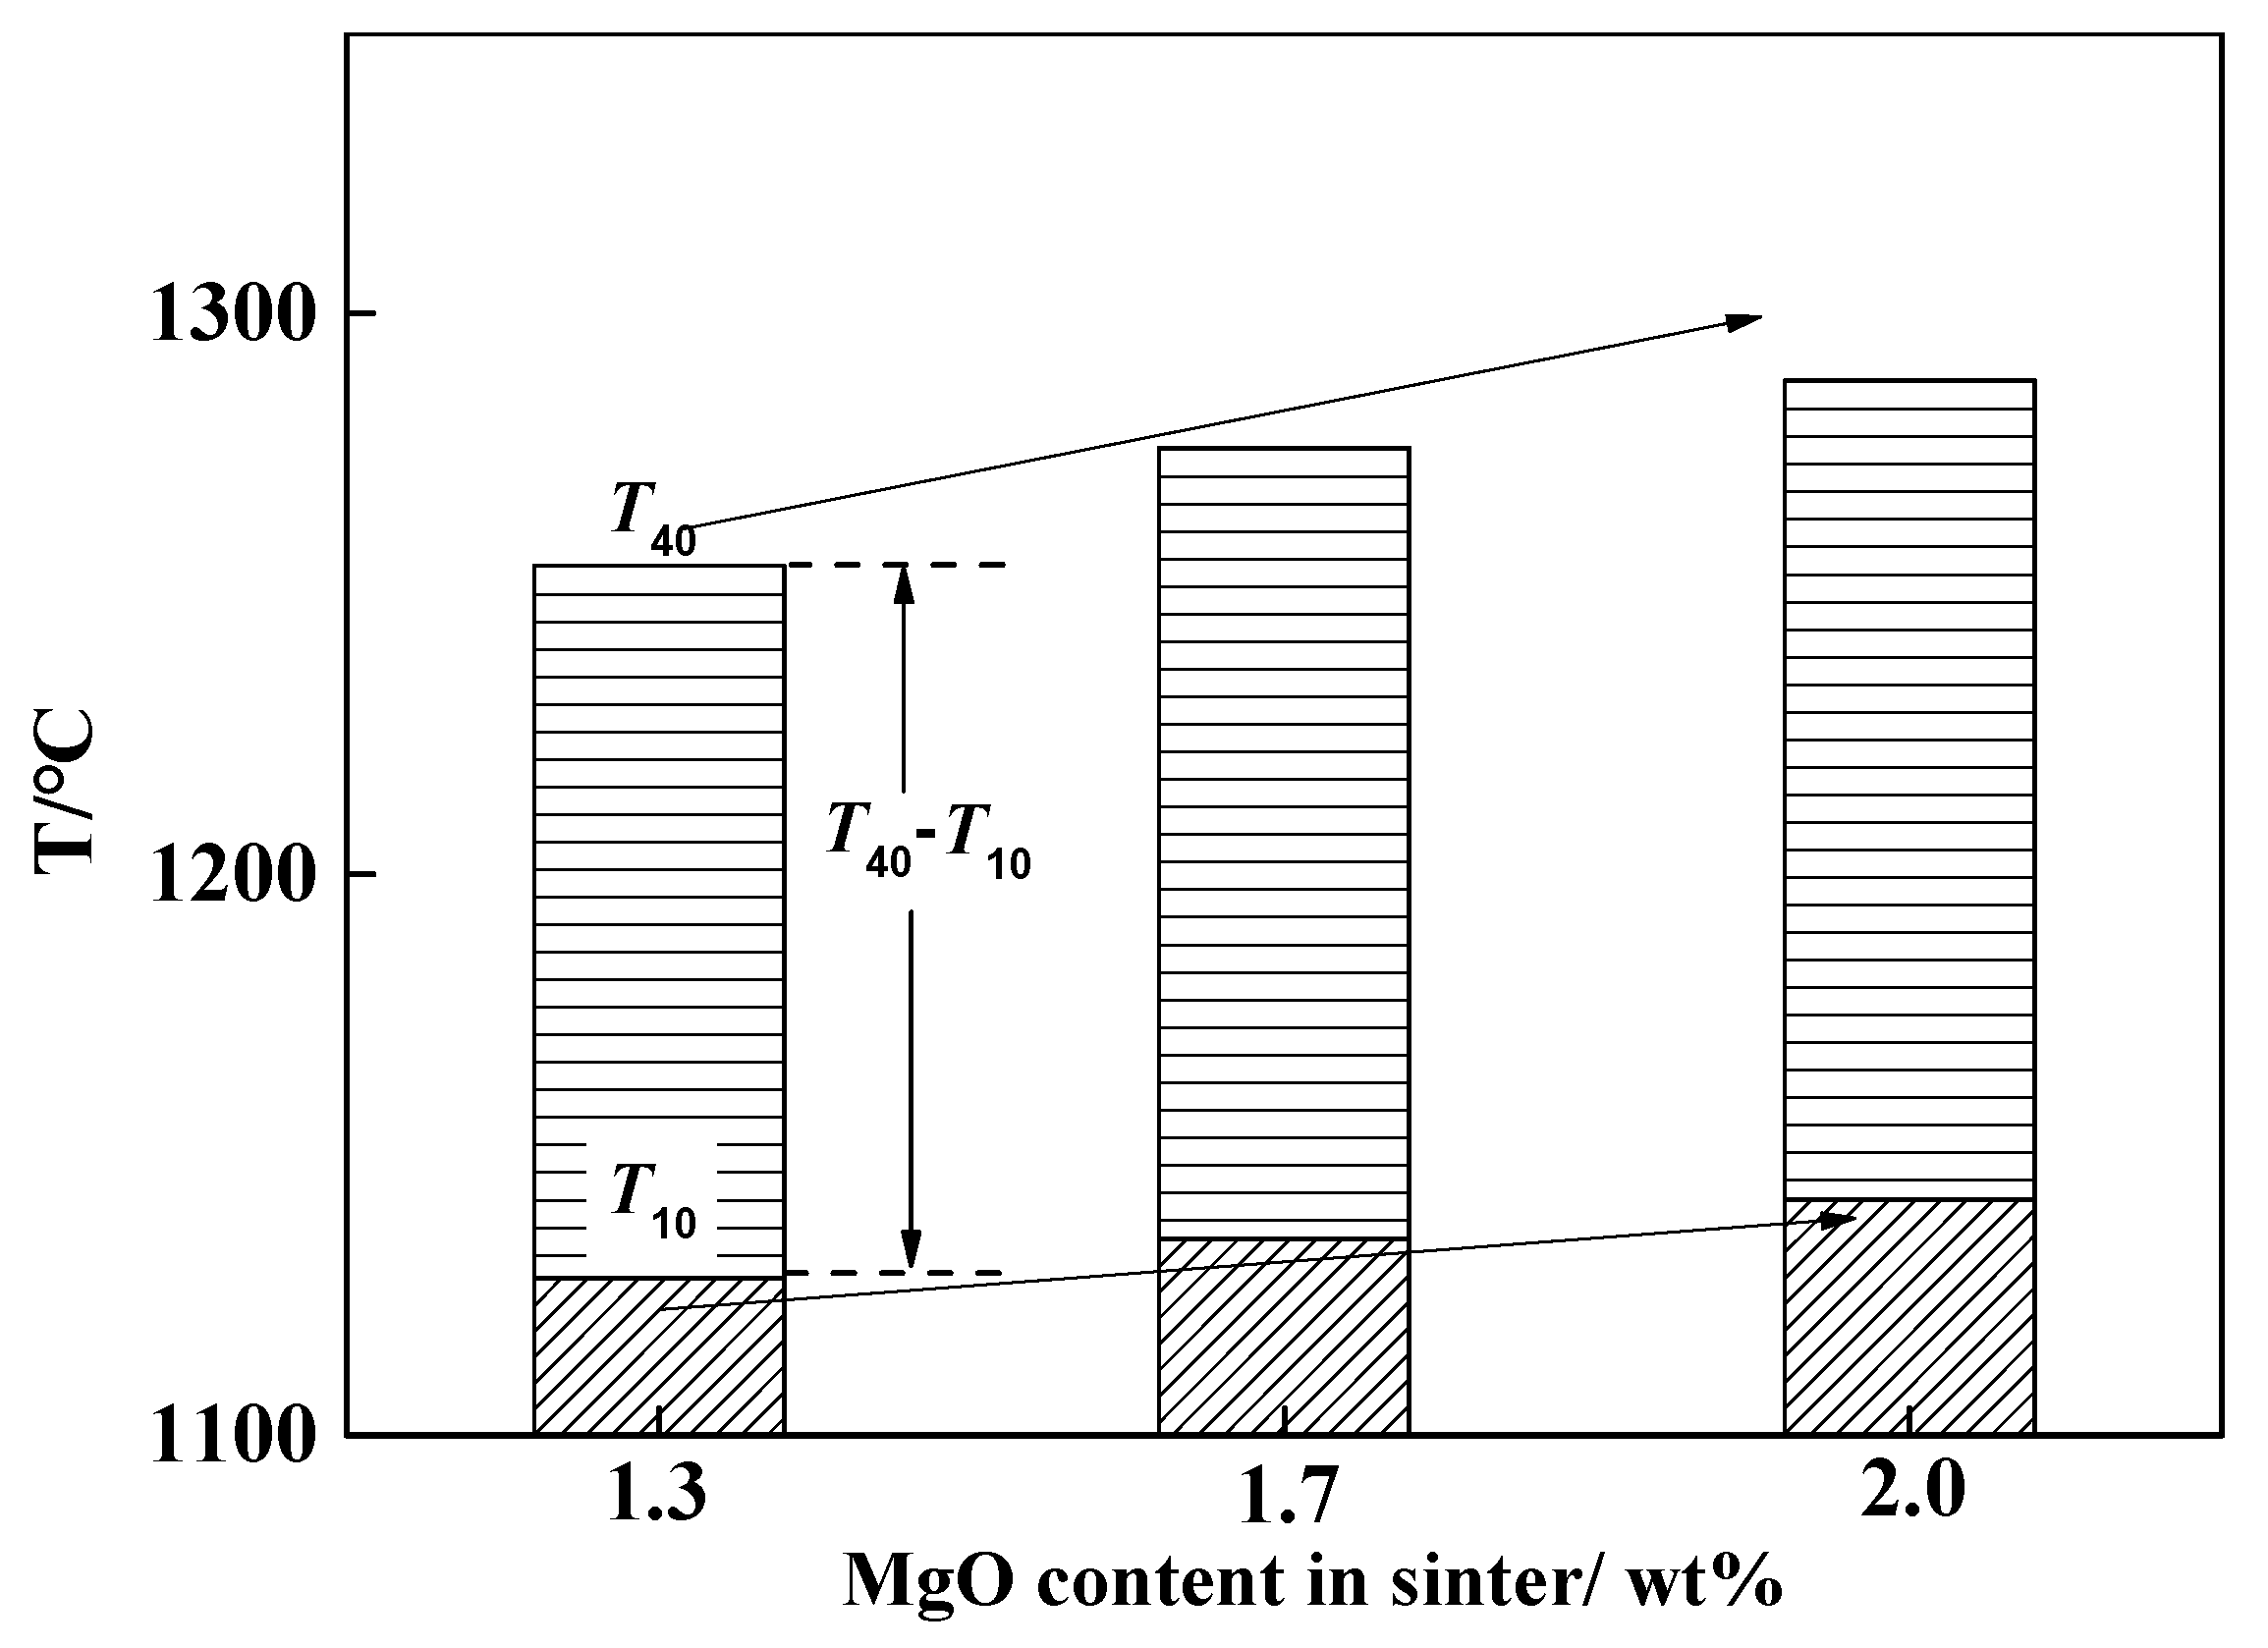
4.2. Factors Determining Melting Temperature

When the temperature reached TS, sinters with different MgO content were quenched by N2 and the photos are shown in Figure 14. It can be seen that the morphology was similar for the sinter with 1.3 and 2.0 wt% MgO content. The chemical compositions of different MgO sinters were analyzed at TS as shown in Table 7. As evident from the results in the tables, (1) Fe ion existed as wustite and metallic iron in sinter, and the wustite amount was more than the metallic iron for sinters with different MgO content; (2) the samples appeared more MgO in TS compared to the original sinter. The reduction degree of sinter was similar for different MgO sinter during TS because the wustite content and metallic iron of the samples were similar.
To clarify the influence mechanism of MgO on melting temperature, the sinter sample with 2.0 wt% MgO was further analyzed by SEM and EDS. Figure 15 shows SEM images of a polished cross-section of 2.0 wt% MgO sinter. It is easy to see that it consisted mainly of three phases: white, gray and black phase. According to the EDS analysis, it can be concluded that the white phase was metallic iron, the gray phase was wustite and the black phase was slag. The wustite was formed between the column metallic iron, which was compacted together and surrounded by slag. It can be seen from the energy spectrum analysis that Mg2+ existed in the wustite, but it did not appear in the slag phase. When the temperature reached TS, MgO existed as wustite solid solution, whereas a small quantity of MgO was found in the eutectic structure, in contrast with the other elements.
Figure 16 presents the elemental distribution with 2.0 wt% MgO sinter. It show that iron and oxygen were relatively more concentrated, while magnesium was more dispersed in the wustite. The conclusion was further confirmed that MgO existed as wustite solid solution. Therefore, MgO in the sinter had little effect on the melting temperature, and wustite was similar for sinter with different MgO content during TS. For this reason, the melting temperature was similar for different MgO sinter.

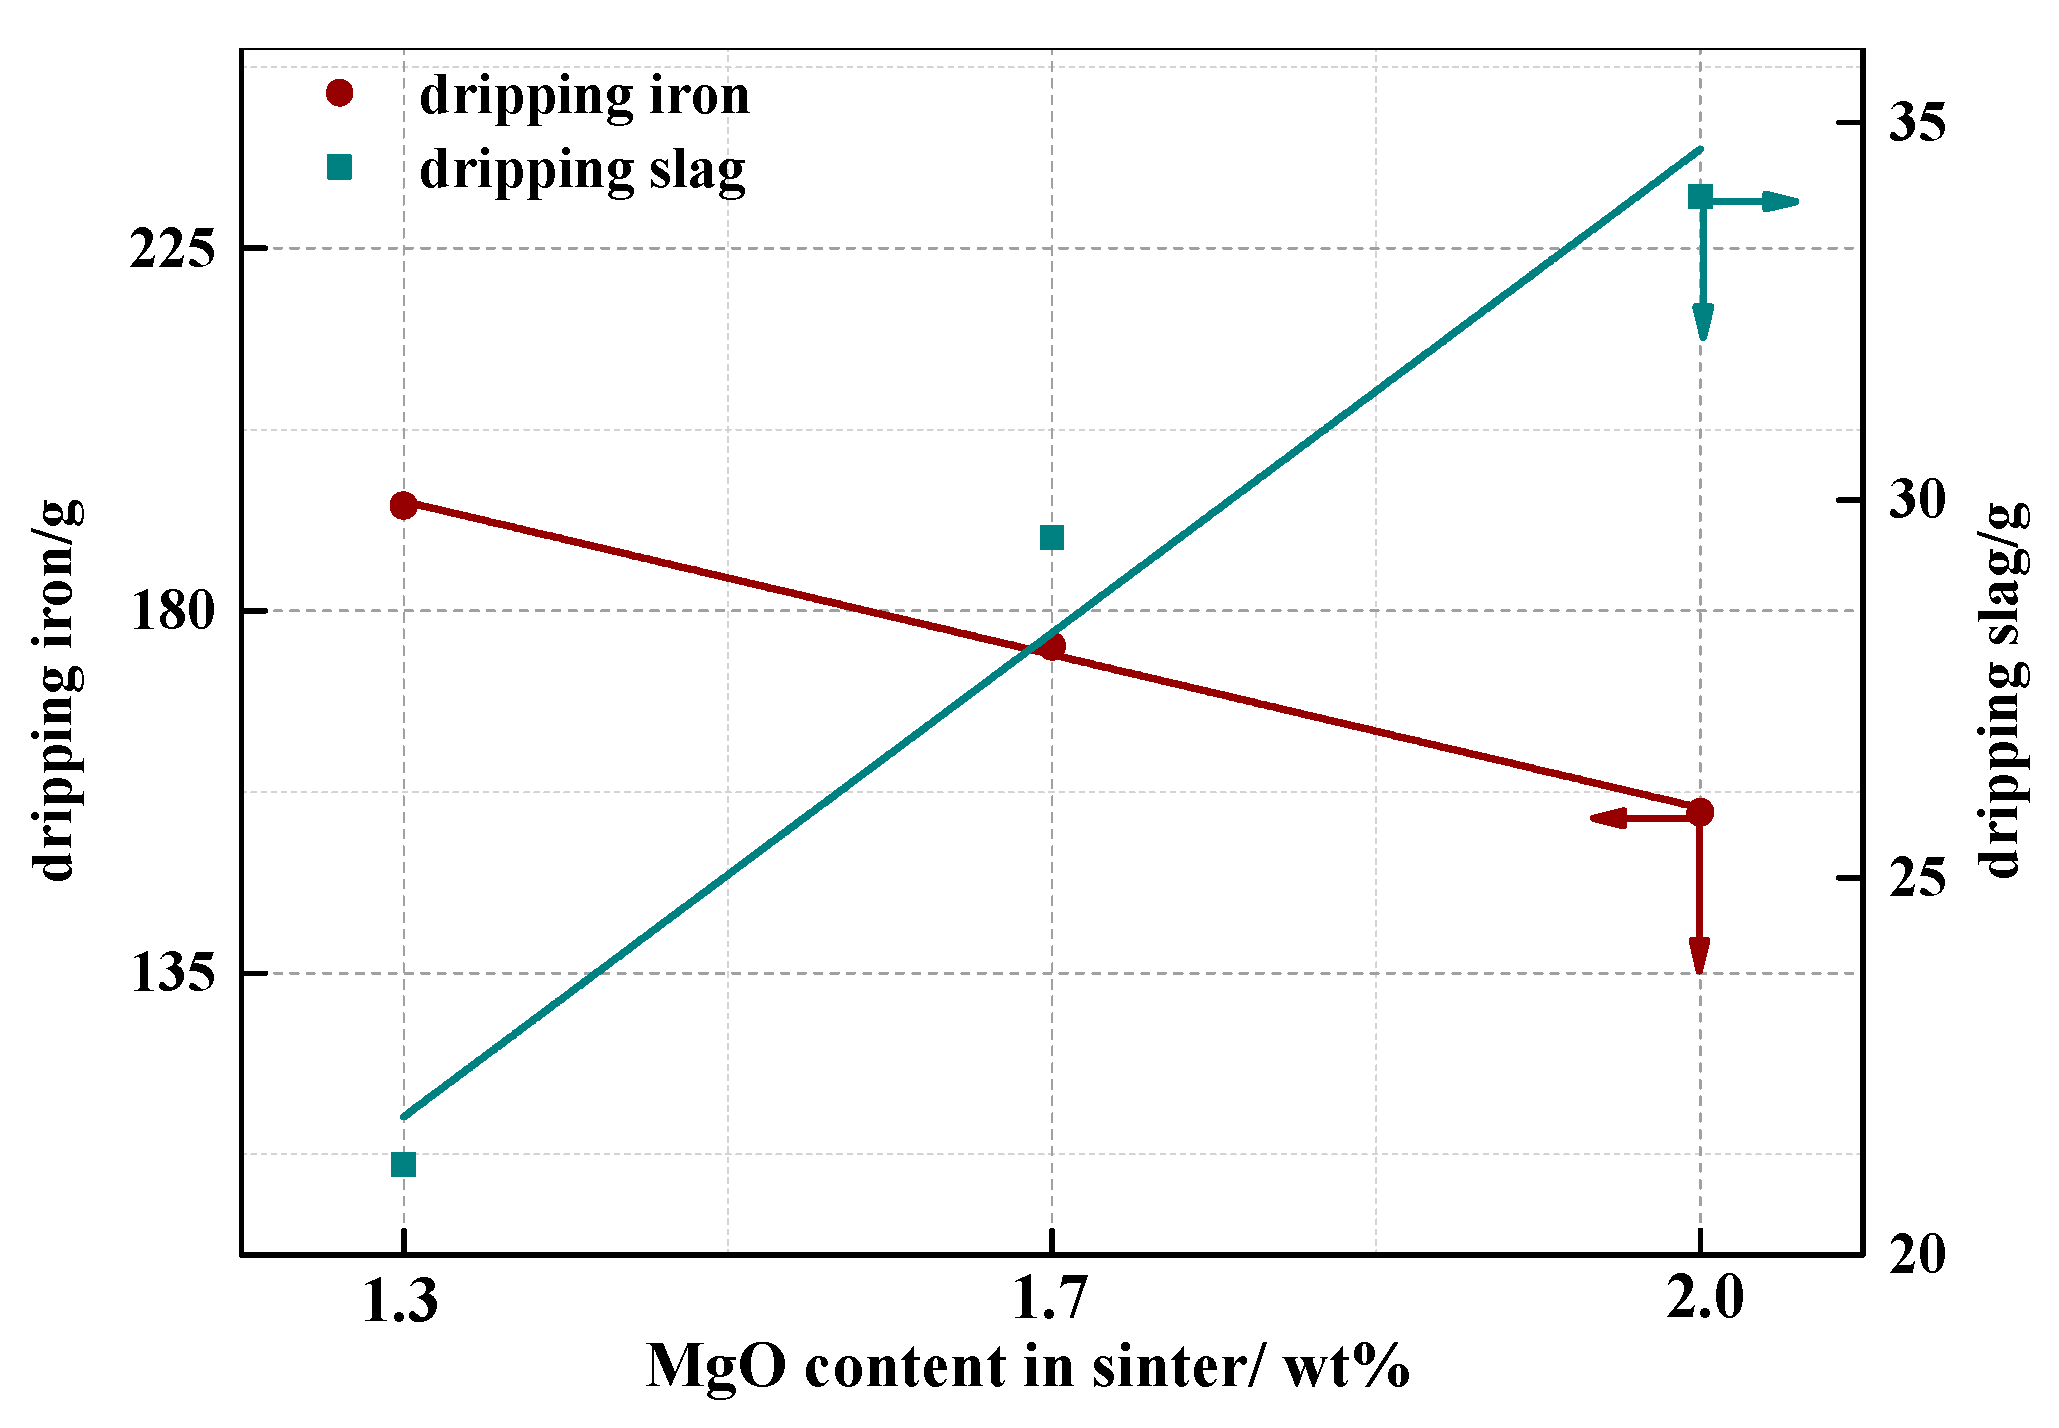
4.3. Effect of MgO on Dripping Behavior of Sinter

XRD patterns of primary slag with different MgO sinters are shown in Figure 17. It can be seen that the main phase compositions of primary slag were melilite (Ca2(Al,Mg)[(Si,Al)SiO7]), CaMgSi2O6, MgAl2O4 and CaMgSiO4. The peak intensities of melilite (Ca2(Al,Mg)[(Si,Al)SiO7]) and CaMgSi2O6 increased, but the phase of MgAl2O4 decreased with the increased MgO. This was the main reason that the sinter with high MgO content generated higher a melting point phase, resulting in an increased TD. These results agree with previous investigations [2].
The main reason for molten iron dripping was that carburization occurred during the melting-dripping process [9]. To better understand the mechanism of dripping, the dripping iron was analyzed by SEM and EDS as shown in Figure 18. It can be seen that the carbon content decreased with increased MgO content of sinter. The carbon content was 4.17% for sinter with low MgO content, but it was 3.25% for high MgO content. The effect of carbon content on the theoretical melting point is shown in Figure 19. As shown in the figure, the theoretical melting point increased from 1195 °C to 1294 °C with increased MgO content of sinter (from a to b). However, the actual dripping temperature was higher than the theoretical melting point; the main reason for this was that a certain extent of physical concentration of molten iron was not reached.
To further understand the distribution of valuable elements, an element analysis was carried out, as shown in Figure 20 and Figure 21. Figure 20 shows element scanning images of Fe, C, Mg, Si and O for dripped metallic iron of 2.0 wt% MgO sinter. As shown in the figure, Fe was the main phase in high-MgO sinter, and only some C could be found in the dripped metallic iron. These results indicate that carburization hardly occurred for high MgO sinter and caused less C to precipitate as shown in Figure 20. On the other hand, Figure 21 shows SEM and element scanning images of Fe, C, Mg, Si and O for dripped metallic iron of the original sinter with MgO of 1.3%. As shown in the figure, Fe was still the main phase in low-MgO sinter, but more C could be found in the dripped metallic iron. The main reason was that the liquidus temperature of metallic iron with high MgO was higher, which was not beneficial for the occurrence of carburization. Then, the amount of “C” in the dripped material was lower, and the amount of “C” precipitated from the iron was also lower (as shown in Figure 20). With the decreased MgO content, the liquidus temperature of iron with low MgO was lower, which was beneficial for the occurrence of carburization. Then, there was more “C” in the metallic iron, and more “C” precipitated from the metallic iron (as shown in Figure 21). Therefore, carbide precipitation resulted in the microstructure shown in Figure 20 and Figure 21. The experimental results were in agreement with the fundamental mechanism.
Data of the chemical composition analysis of dripping and residual products for sinter with 1.3 and 2.0 wt% MgO content are shown in Table 8. As evident from the results in the table, (1) the MgO content of dripping and residual product was increased with increased MgO content in the sinter, and the MgO content in the dripping product was greater than in the residual product. (2) It can also be seen that the wustite ratio in the residual product was clearly more than that in the dripping product and it was increased with the increased MgO content in the sinter and the slag containing a larger concentration of MgO could not drip efficiently. For these reasons, the temperature zone of the cohesive zone advanced.
The dripping iron decreased with the increased MgO content as shown in Figure 9. The main reason was that the magnetite, which was reduced with more difficulty, was increased with increased MgO content as shown in Figure 1. The mechanisms that occur during sintering are proposed and summarized in Figure 22. The added MgO could generate MF((FexMg1 − x))O·Fe2O3) and make the magnetite (Fe3O4) constant [31]. Phase diagrams of MgO-FeO and MgO-Fe2O3 are shown in Figure 23 [32]. It can be seen that the FeO and MgO, which could totally or partially replace in a wide homogenous phase, replaced each other as shown in Figure 23a. The Mg2+ and Fe3+ generated at solid solution as shown in Figure 23b. The reoxidation of magnetite to hematite partially appeared with the increased MgO during cooling. For these reasons, hematite decreased and magnetite increased with the increased MgO content. More magnetite caused decreased sinter reducibility, and the metallic iron of melting decreased with the increased MgO.

4.4. Comprehensive Assessment Index of Melting Properties

The melting properties of sinter could be improved by the appropriate MgO content and principal component analysis (PCA) was used to analyze the sinter. The purpose of PCA was that data loss was least by linear transformation and by discarding irrelevant information, and finally the compressive variable was obtained [33]. The method was used to corroborate the composite indicator of sinter, and the appropriate MgO content of sinter was calculated by PCA.
The parameters of the sinters were as follows: Sample amounts = n; observation variable of each sample = p; primitive matrix = X; the eigenvector corresponding to the largest eigenvalue for one dimensional data = P; the compressive assessment index = Y; the process of analysis was as follow:
(1) The original data can constitute the primitive matrix, for which the data were T10, T40, TS, Td, TSTD and dripping iron. The primitive matrix is shown in Equation (13).
X = [ 1128 1135 1142 1255 1276 1288 1291 1304 1312 1447 1477 1519 156 173 207 193.07 175.6 154.98 ]
(2) In order to data standardization, the primitive matrix was calculated by normalization and the average value of the disposing matrix turned to zero.
(3) The covariance matrix was defined as generalization from random variables of scalar to high dimensional.
(4) The corresponding eigenvector of the maximum eigenvalue was selected as the matrix of dimensionality reduction as shown in (14).
P = [ 0.13 0.31 0.2 0.69 0.49 0.36 ]
(5) A comprehensive assessment of the metallurgical properties for sinters with different MgO is shown in Equation (15).
Y = P X ' = [ 49.99 46.5 44.64 ]
The comprehensive assessment index is shown in Figure 24. It indicates that the compressive assessment index of the melting properties of different MgO sinter is decreased with increasing MgO content. The compressive assessment index achieves the maximum (49.99) during the MgO content in sinter is 1.3 wt%. Therefore, the index of sinter is optimized when the MgO content is 1.3 wt%. Given the utilization of low-price iron-bearing materials and the improvement of melting properties, the scheme of sinter is optimal when the MgO content in sinter is around 1.3 wt%.

5. Conclusions

The effect of MgO on the reduction-melting mechanism of high basicity sinters was investigated in the present paper. The following conclusions can be drawn:
(1) It was found that MgO had an obvious effect on the reduction of high basicity sinters. With an increased MgO content from 1.3 to 2.0 wt%, the reduction degree was obviously decreased, and through XRD, SEM, and kinetics analysis, the reduction mechanism was further investigated. The kinetics analysis indicated that the reaction corresponded to the modal function of F1 (α) and the integral form was −ln(1 − α) = kt, and the average activation energy was 5.39, 3.14 and 3.03 kJ/mol, respectively for MgO contents of 2.0, 1.7 and 1.3 wt%.
(2) With increased MgO content, the melting behavior of sinter became worse. When the MgO content in sinter was increased from 1.3 to 2.0 wt%, the softening start temperature (T10) increased from 1128 °C to 1142 °C, the softening temperature (T40) increased from 1255 °C to 1288 °C, TS was similar between 1290 °C and 1300 °C, and TD increased from 1447 °C to 1519 °C. The melting temperature zone increased from 156 °C to 207 °C.
(3) The reasons for similar TS (melting start temperature) value was that: MgO existed as wustite solid solution, whereas a small quantity of MgO was found in the eutectic structure compared to other elements. The reasons for TD increase (with the increase of MgO content in sinter) were the high point slag and the decreased carbon content in molten iron.
(4) Principal component analysis (PCA) was used to analyze the sinter; the higher content MgO sinter, the higher compressive assessment index.

Author Contributions

H.G. and X.J. contributed to the material synthesis, performed the experiments, material characterization, and data analysis, and wrote the paper; F.S. revised the paper and refined the language; Q.G. and H.Z. contributed to the design of the experiment.

Funding

This research was funded by National Science Foundation of China and Fundamental Research Funds for the Central Universities, grant number NSFC 51874080, NSFC 51604069 and N182504008.

Acknowledgments

The authors wish to acknowledge the contributions of associates and colleagues in Northeastern University of China.

Conflicts of Interest

The authors declare no conflict of interest.

References

  1. Hino, M.; Nagasaka, T.; Katsumata, A.; Higuchi, K.; Yamaguchi, K.; Kon-no, N. Simulation of primary-slag melting behavior in the cohesive zone of a blast furnace, considering the effect of Al2O3, FetO, and basicity in the sinter ore. Metall. Mater. Trans. B 1999, 30, 671–683. [Google Scholar] [CrossRef]
  2. Liu, Z.G.; Chun, M.S.; Wang, H.T.; Zhao, W.; Xue, X.X. Effect of MgO content in sinter on the softening-melting behavior of mixed burden made from chromium-bearing vanadium-titanium magnetite. Int. J. Miner. Metall. Mater. 2016, 23, 25–32. [Google Scholar] [CrossRef]
  3. Sugiyama, T.; Shirouchi, S.; Tsuchiya, O.; Ondda, M.; Fujita, I. High temperature reduction and softening properties of pellets with magnesite. ISIJ Int. 1983, 23, 153–160. [Google Scholar] [CrossRef]
  4. Liu, X.L.; Wu, S.L.; Huang, W.; Zhang, K.F.; Du, K.P. Influence of High Temperature Interaction between Sinter and Lump Ores on the Formation Behavior of Primary-slags in Blast Furnace. ISIJ Int. 2014, 9, 2089–2096. [Google Scholar] [CrossRef]
  5. Iljana, M.; Kemppainen, A.; Paananen, T.; Mattila, O.; Heikkinen, E.P.; Fabritius, T. Evaluating the reduction-softening behaviour of blast furnace burden with an advanced test. ISIJ Int. 2016, 56, 1705–1714. [Google Scholar] [CrossRef]
  6. Cheng, G.J.; Xue, X.X.; Gao, Z.X.; Jiang, T.; Yang, H.; Duan, P.N. Effect of Cr2O3 on the reduction and smelting mechanism of high-chromium vanadium-titanium magnetite pellets. ISIJ Int. 2016, 56, 1938–1947. [Google Scholar] [CrossRef]
  7. Hsieh, L. Effect of raw material composition on the sintering properties. ISIJ Int. 2005, 45, 551–559. [Google Scholar] [CrossRef]
  8. Li, T.L.; Sun, C.Y.; Liu, X.Y.; Song, S.; Wang, Q. The effects of MgO and Al2O3 behaviours on softening-melting properties of high basicity sinter. Ironmak. Steelmak. 2018, 8, 755–763. [Google Scholar] [CrossRef]
  9. Higuchi, K.; Naito, M.; Nakano, M.; Takamoto, Y. Optimization of chemical composition and microstructure of iron ore sinter for low-temperature drip of molten iron with high permeability. ISIJ Int. 2004, 44, 2057–2066. [Google Scholar] [CrossRef]
  10. Loo, C.E.; Heikkinen, J. Structural transformation of beds during iron ore sintering. ISIJ Int. 2012, 52, 2158–2167. [Google Scholar] [CrossRef]
  11. Loo, C.E.; Matthews, L.T.; O'Dea, D.P. Lump ore and sinter behaviour during softening and melting. ISIJ Int. 2011, 51, 930–938. [Google Scholar] [CrossRef]
  12. Kemppainen, A.; Ohno, K.; Iljana, M.; Panananen, T.; Heikkinen, E.P.; Maeda, T.; Kunitomo, K.; Fabritius, T. Softening behaviors of acid and olivine fluxed iron ore pellets in the cohesive zone of a blast furnace. ISIJ Int. 2015, 55, 2039–2046. [Google Scholar] [CrossRef]
  13. Guo, W.T.; Xue, Q.G.; Liu, Y.L.; Shen, X.F.; Wang, J.S. Microstructure evolution during softening and melting process in different reduction degrees. Ironmak. Steelmak. 2016, 43, 22–30. [Google Scholar] [CrossRef]
  14. Tang, W.D.; Yang, S.T.; Cheng, G.J.; Gao, Z.X.; Xue, X.X. Effect of MgO in sinter and primary-slag on smelting mechanism of chromium-bearing vanadium titanomagnetite. Steel Res. Int. 2018, 89, 1800226. [Google Scholar] [CrossRef]
  15. Zhao, W.; Chu, M.S.; Wang, H.T.; Liu, Z.G.; Tang, J.; Ying, Z.W. Effect of introducing coke into ore layer on softening-meltingdropping characteristics of vanadium-titanium mixed burden under simulating BF conditions. ISIJ Int. 2018, 58, 1989–1998. [Google Scholar] [CrossRef]
  16. Wu, S.L.; Tuo, B.Y.; Zhang, L.H.; Du, K.P.; Sum, Y. New evaluation methods discussion of softening–melting and dropping characteristic of bf iron bearing burden. Steel Res. Int. 2014, 85, 233–242. [Google Scholar] [CrossRef]
  17. Liu, J.X.; Cheng, G.J.; Liu, Z.G.; Chu, M.S.; Xue, X.X. Softening and melting properties of different burden structures containing high chromic vanadium titano-magnetite. Int. J. Miner. Process. 2015, 142, 113–118. [Google Scholar] [CrossRef]
  18. Matsumura, M.; Hoshi, M.; Kawaguchi, T. Improvement of sinter softening property and reducibility by controlling chemical compositions. ISIJ Int. 2005, 45, 594–602. [Google Scholar] [CrossRef]
  19. Nishimura, T.; Higuchi, K.; Nation, M.; Kunitomo, K. Evaluation of softening, shrinking and melting reduction behaviour of raw materials for blast furnace. ISIJ Int. 2011, 51, 1316–1321. [Google Scholar] [CrossRef]
  20. Kaushik, P.; Fruehan, R.J. Mixed burden softening and melting phenomena in the blast furnace operation Part 2-mechanism of softening and melting and impact on the cohesive zone. Ironmak. Steelmak. 2006, 33, 520–528. [Google Scholar] [CrossRef]
  21. Guha, M.; Sinha, M. Tracking softening-melting behaviour of blast furnace burden. ISIJ Int. 2015, 55, 2033–2035. [Google Scholar] [CrossRef]
  22. Sterneland, J.; Lahiri, A.K. Contraction and meltdown behaviour of olivine iron ore pellets under simulated blast furnace conditions. Ironmak. Steelmak. 1999, 26, 339–348. [Google Scholar] [CrossRef]
  23. Sterneland, J.; Andersson, M.; Jonsson, P. Comparison of iron ore reduction in the experiment blast furnace and laboratory scale simulation of blast furnace process. Ironmak. Steelmak. 2003, 30, 313–327. [Google Scholar] [CrossRef]
  24. Ding, C.Y.; Lv, X.W.; Xuan, S.W.; Tang, K.; Bai, C.G. Isothermal reduction kinetics of powdered hematite and calcium ferrite with CO–N2 gas mixtures. ISIJ Int. 2016, 56, 2118–2125. [Google Scholar] [CrossRef]
  25. Panigrahy, S.C.; Verstraeten, P.; Dilewijns, J. Influence of MgO addition on mineralogy of iron ore sinter. Metall. Trans. B 1984, 15B, 23–32. [Google Scholar] [CrossRef]
  26. Mccune, R.C.; Wynblatt, P. Calcium segregation to a magnesium oxide (100) surface. J. Am. Ceram. Soc. 1983, 66, 111–117. [Google Scholar] [CrossRef]
  27. Avrami, M. Kinetics of phase change. I General theory. J. Chem. Phys. 1939, 12, 1103–1112. [Google Scholar] [CrossRef]
  28. Avrami, M. Kinetics of phase change. II Transformation-time relations for random distribution of nuclei. J. Chem. Phys. 1940, 8, 212–224. [Google Scholar] [CrossRef]
  29. Avrami, M. Granulation, phase change, and microstructure kinetics of phase change. III. J. Chem. Phys. 1941, 9, 177–184. [Google Scholar] [CrossRef]
  30. Hancock, J.D.; Sharp, J.H. Method of comparing solid-state kinetic data and its application to the decomposition of kaolinite, brucite, and BaCO3. J. Am. Ceram. Soc. 1972, 55, 74–77. [Google Scholar] [CrossRef]
  31. Gao, Q.J.; Shen, F.M.; Wei, G.; Jiang, X.; Zheng, H.Y. Effects of MgO containing additive on low-Temperature metallurgical properties of oxidized pellet. J. Iron Steel Res. Int. 2013, 20, 25–28. [Google Scholar] [CrossRef]
  32. Eisenhüttenleute, V.D.; Allibert, M. Slag Atlas, 2nd ed.; Verlag Stahleisen GmbH: Düsseldorf, Germany, 1995. [Google Scholar]
  33. Martinze, A.M.; Kak, A.C. PCA versus LDA. IEEE Trans. Pattern Anal. Mach. Intell. 2001, 23, 228–233. [Google Scholar] [CrossRef]
Figure 1. XRD profile of sinter samples with different MgO content.
Metals 09 00510 g001
Figure 2. Experimental device for testing the melting properties of the sinter.
Metals 09 00510 g002
Figure 3. Experimental conditions for testing melting properties of sinter.
Metals 09 00510 g003
Figure 4. Reduction degree with different raw materials and temperatures: (a) reduction temperatures; (b) MgO content sinters.
Metals 09 00510 g004aMetals 09 00510 g004b
Figure 5. XRD patterns of sinter at different stages (a): 1.3 wt% MgO in 800 °C (b): 1.3 wt% MgO in 900 °C (c): 2.0 wt% MgO in 800 °C.
Metals 09 00510 g005
Figure 6. The SEM image of the different MgO content sinter (a): 1.3 wt%; (b): 1.7 wt%; (c): 2.0 wt%. (M: magnesioferrite CF: calciumferrite G: glass phase.)
Metals 09 00510 g006
Figure 7. T10, T40 and softening zone for different MgO content sinter.
Metals 09 00510 g007
Figure 8. TS, TD and melting zone for different MgO content sinter.
Metals 09 00510 g008
Figure 9. Changes of softening and melting of sinters with different MgO content.
Metals 09 00510 g009
Figure 10. Effect of MgO on S-value of high basicity sinter
Metals 09 00510 g010
Figure 11. Plot of ln(−ln(1 − α)) vs. lnt for different raw materials (a) 2.0 wt%;(b) 1.7 wt%;(c) 1.3 wt%.
Metals 09 00510 g011
Figure 12. Plot of G(a) vs. time for sinters with different MgO content.
Metals 09 00510 g012
Figure 13. Effect of reduction degree on activation energy.
Metals 09 00510 g013
Figure 14. Photos during melting temperature.
Metals 09 00510 g014
Figure 15. SEM image and EDS analysis of 2.0 wt% MgO sinter during TS.
Metals 09 00510 g015
Figure 16. Elemental distributions of sinter with 2.0% wt% MgO.
Metals 09 00510 g016
Figure 17. X-ray diffraction patterns of primary slag.
Metals 09 00510 g017
Figure 18. SEM image of dripping iron for sinter with (a) low MgO and (b) high MgO.
Metals 09 00510 g018
Figure 19. Effect of carbon content on theoretical melting point (a: low MgO; b: high MgO).
Metals 09 00510 g019
Figure 20. SEM and element mapping images of Fe, C, Mg, Si, and O for 2.0 wt% MgO sinter.
Metals 09 00510 g020
Figure 21. SEM and element mapping images of Fe, C, Mg, Si, and O for 1.3 wt% MgO sinter.
Metals 09 00510 g021
Figure 22. Schematic overview of the influence of MgO content on mineral compositions:(1) Mg2+ diffusion into magnetite lattice; (2) formation of MF; (3) reduction of hematite to magnetite; (4) reoxidation of magnetite to hematite during cooling; (5) reduction of magnetite to metallic iron.
Metals 09 00510 g022
Figure 23. Phase diagram (a) FeO-MgO and (b) Fe2O3-MgO.
Metals 09 00510 g023
Figure 24. Comprehensive assessment index of different MgO content sinter.
Metals 09 00510 g024
Table 1. Chemical composition of sinter [%].
MgO ContentsTFeFeOCaOSiO2MgOAl2O3R
1.357.639.028.765.151.311.911.70
1.757.659.018.635.051.691.891.71
2.057.558.898.655.092.021.931.69
Table 2. Experimental conditions in reduction under load tests reported in the literature.
ReferenceCrucible
Diameter
Bed HeightSample AmountDegree of Pre-ReductionTemperatureGas Atmosphe-reload
Nandy et al. [19]48 mm90 mmVariable
(constant bed height)
No pre-reduction<230 °C: 3.8 °C/min
230–900 °C: 8.4 °C/min
900–1100 °C: 2.2 °C/min
1100–1650 °C: 5 °C/min
30CO-70N210
kPa
Nishimura et al. [20]85 mm70 mmHundreds of gramsNo pre-reduction<1000 °C: 10 °C/min
1000–1550 °C: 5 °C/min
29.4CO-3.5H2-67.1N2[vol-%]100 kPa at above 800 °C
Kaushik and Fruehan
[21]
80 mm80 mm~500 gNo pre-reductionMainly 5 °C/minChanging CO-CO2-N2 gas50 kPa
Guha and Sinha
[22]
48 mm90 mmVariable (constant bed height)No pre-reductionDynamic temperature programChanging CO-CO2-N2 gas10 kPa
Sternelandand Labiri,
[23,24]
80 mm~55 mm500 gNo pre-reduction3 dynamic temperature programChanging CO-CO2-H2-N2 gas 3 dynamic load programs3 Differ-ent
dyna-mic load prog-rm
Table 3. The relationship of modal function and judgment index.
FunctionKinetic ModelEquationn
D1(α)One-dimensional diffusionα2 = kt0.62
D2(α)Two-dimensional diffusion(1 − α)ln(1 − α)+ α = kt0.57
D3(α)Three-dimensional diffusion[1 − (1 − α)1/3]2 = kt0.54
A1(α)Avrami-Erofeev, n = 1[−ln(1 − α)]1/2 = kt2
A2(α)Avrami-Erofeev, n = 2 [−ln(1 − α)]1/3 = kt3
F1(α)First-order reaction−ln(1 − α) = kt1
Table 4. Slope of linear fitting and R2.
ItemT/°CSlopeR2
1.3 wt%8000.996280.99971
9000.973160.99975
10001.085970.99951
1.7 wt%8000.955470.9995
9000.972110.99994
10001.117650.99989
2.0 wt%8000.915080.99988
9000.917550.99902
10000.985160.99988
Table 5. Rate constant and degree of fitting.
MgO ContentT/°Ck/TR2
1.3 wt%8000.008740.99968
9000.009550.99702
10000.014570.99809
1.7 wt%8000.006540.99976
9000.007810.99909
10000.014260.99866
2.0 wt%8000.004490.99785
9000.00830.99042
10000.011030.99888
Table 6. Activation energy and pre-exponential factor of different sinter.
MgO Content1.31.72.0
E/(kJ·mol−1)3.033.145.39
A/min−10.260.191.92
Table 7. Chemical component at TS (mass fraction) [%].
MgO ContentAl2O3CaOMgOTFeSiO2MFeFeO
1.3 wt%2.4311.071.5368.296.0525.3262.32
2.0 wt%2.1610.952.6869.265.3626.4861.01
Table 8. Chemical compositions of dripping and residual slag [%].
ItemCaOSiO2Al2O3MgOFeO
2.0 wt% MgOresidual40.1525.3210.1011.8914.58
dripping43.9327.4211.3112.585.32
1.3 wt% MgOresidual44.9628.1411.267.078.66
dripping45.9932.1411.847.902.00

