Article

Isothermal Kinetic Mechanism of Coke Dissolving in Hot Metal

1
The State Key Laboratory of Refractories and Metallurgy, Wuhan University of Science and Technology, Wuhan 430081, China
2
Key Laboratory for Ferrous Metallurgy and Resources Utilization of Ministry of Education, Wuhan University of Science and Technology, Wuhan 430081, China
3
School of Metallurgy, Northeastern University, Shenyang 110819, China
4
Hubei Provincial Key Laboratory for New Processes of Ironmaking and Steelmaking, Wuhan University of Science and Technology, Wuhan 430081, China
*
Authors to whom correspondence should be addressed.
Metals 2019, 9(4), 470; https://doi.org/10.3390/met9040470
Submission received: 31 March 2019 / Revised: 17 April 2019 / Accepted: 18 April 2019 / Published: 22 April 2019
(This article belongs to the Special Issue Selected Papers from 8th ICSTI 2018)

Abstract

:
The carburization of molten iron is close to saturation in the blast furnace process, while that in the flash ironmaking process is uncertain because there is no pressure from solid charge and no carburization reactions occurring between the deadman and hot metal. Some experiments were conducted to reveal the kinetic mechanism of coke dissolving in carbon-iron melts. Reduced iron powder, electrolytic iron as well as chemical pure graphite were used as experiment materials. With high-purity argon injected as the protective gas, the specimens were heated up to 1873 K in a tubular resistance furnace to study the isothermal mechanism. The results show that the composition of the ferrous sample affects the dissolution rate. When the FeO content of the iron-bearing material rises from 0% to 4.76%, the apparent dissolution rate constant, kt, falls from 7.98 × 10⁻⁶ m/s to 5.48 × 10⁻⁶ m/s. There are some differences amongst the dissolution rate coefficients of different cokes despite interacting with similar carbon-iron melts, with coke 1 of 7.98 × 10⁻⁶ m/s, coke 2 of 5.17 × 10⁻⁶ m/s, and coke 3 of 3.77 × 10⁻⁶ m/s. Besides, this index decreases with the increase of the dissolution time and solely depends on the procedure of the mass transfer. A negative correlation is demonstrated between kt and the sulfur content in the iron bath as well. The content of silicon dioxide in the coke has a significant influence on kt. Additionally, the dissolution rate coefficient increases with the increase of the graphitization degree of coke.

1. Introduction

The development of the blast furnace ironmaking process has been seriously restricted due to its long process and unsatisfying adaptability to poor and miscellaneous resources, and the environmental problems resulting from its preparation process, such as coking, sintering, and pelletizing, are also a concern. Therefore, non-blast furnace ironmaking technology [1,2,3,4,5] using non-coking coal as the main energy source has become a hot research topic in the iron and steel industry. The processes that produce iron by the reduction of iron ore below the melting point of the iron produced are generally classified as direct reduction processes, and the product is referred to as direct reduced iron. The non-BF (non Blast Furnace) processes, which are not classified as direct reduction, are smelting processes that use coal as the reduction agent. At the final reduction stage, molten iron is produced from solid iron ores.
After a large number of in-depth studies, with direct reduction [6,7,8,9] and smelting reduction [10,11,12,13,14,15,16,17,18,19] as its core, modern non-blast furnace ironmaking processes have been set up, and the flash ironmaking process [20,21,22,23] has stood out as one of them in recent years. In this process, a pile of coke bed is designed in the melting zone. Consequently, solid-liquid carburization occurs when molten iron passes through the coke bed, and this is the main path of carbon migration. A suitable C content of hot metal in the flash furnace is very critical, which is suggested to be 3.0% to 4.0% to achieve a lower freezing point so that the accidents, such as the pig iron freezing in the ladle or torpedo canister during transportation, can be reduced. Furthermore, with high C content, it is helpful to decrease the oxygen content in liquid steel during carbon oxidation in the converter steelmaking stage [24]. However, liquid iron carburization in the blast furnace process can almost reach a saturation state, while that in the flash ironmaking process is uncertain because there is no solid charge that would press the deadman into the hot metal and no carburization reactions that occur between the bottom deadman and the hot metal. Therefore, it is necessary to undertake a simulation experiment to discuss the kinetics of coke dissolution in molten iron, and analyze its mechanism to provide a theoretical basis for the industrialization of the flash ironmaking process.
Mourao et al. designed a series of experiments to investigate the mechanism of carbon dissolution in iron-carbon melts [25,26]. In their research, pure graphite powder and electrolytic iron were mixed and preheated up to 1873 K in a pure alumina crucible (99.8%), and argon was injected as a protective gas with a positive pressure and a flow rate of 1.67 × 10⁻⁵ m3/s throughout the experiments. After preheating, the carbon samples were fixed on an aluminum rod and immersed into the melts. The amount of carbon dissolved into the melts was determined according to the measurement of the carbon samples’ weight loss. With regard to this experimental method, the influence from the segregation of carbon in molten iron is decreased, whereby the reliability of the experimental results is ensured. However, the final carbon sample is covered with a layer of iron in order to measure the accurate carbon weight loss, and the analysis of Fe in the specimens is required. However, this might be hard to achieve since the surface of the carbon sample is irregular, which leads to a complex operation and long duration of measurement. In an attempt to improve this experiment, the authors of this article have conducted optimized experiments, in which C-S analysis is applied, and the dissolution rate coefficient, kt, is calculated to simplify the experimental results.

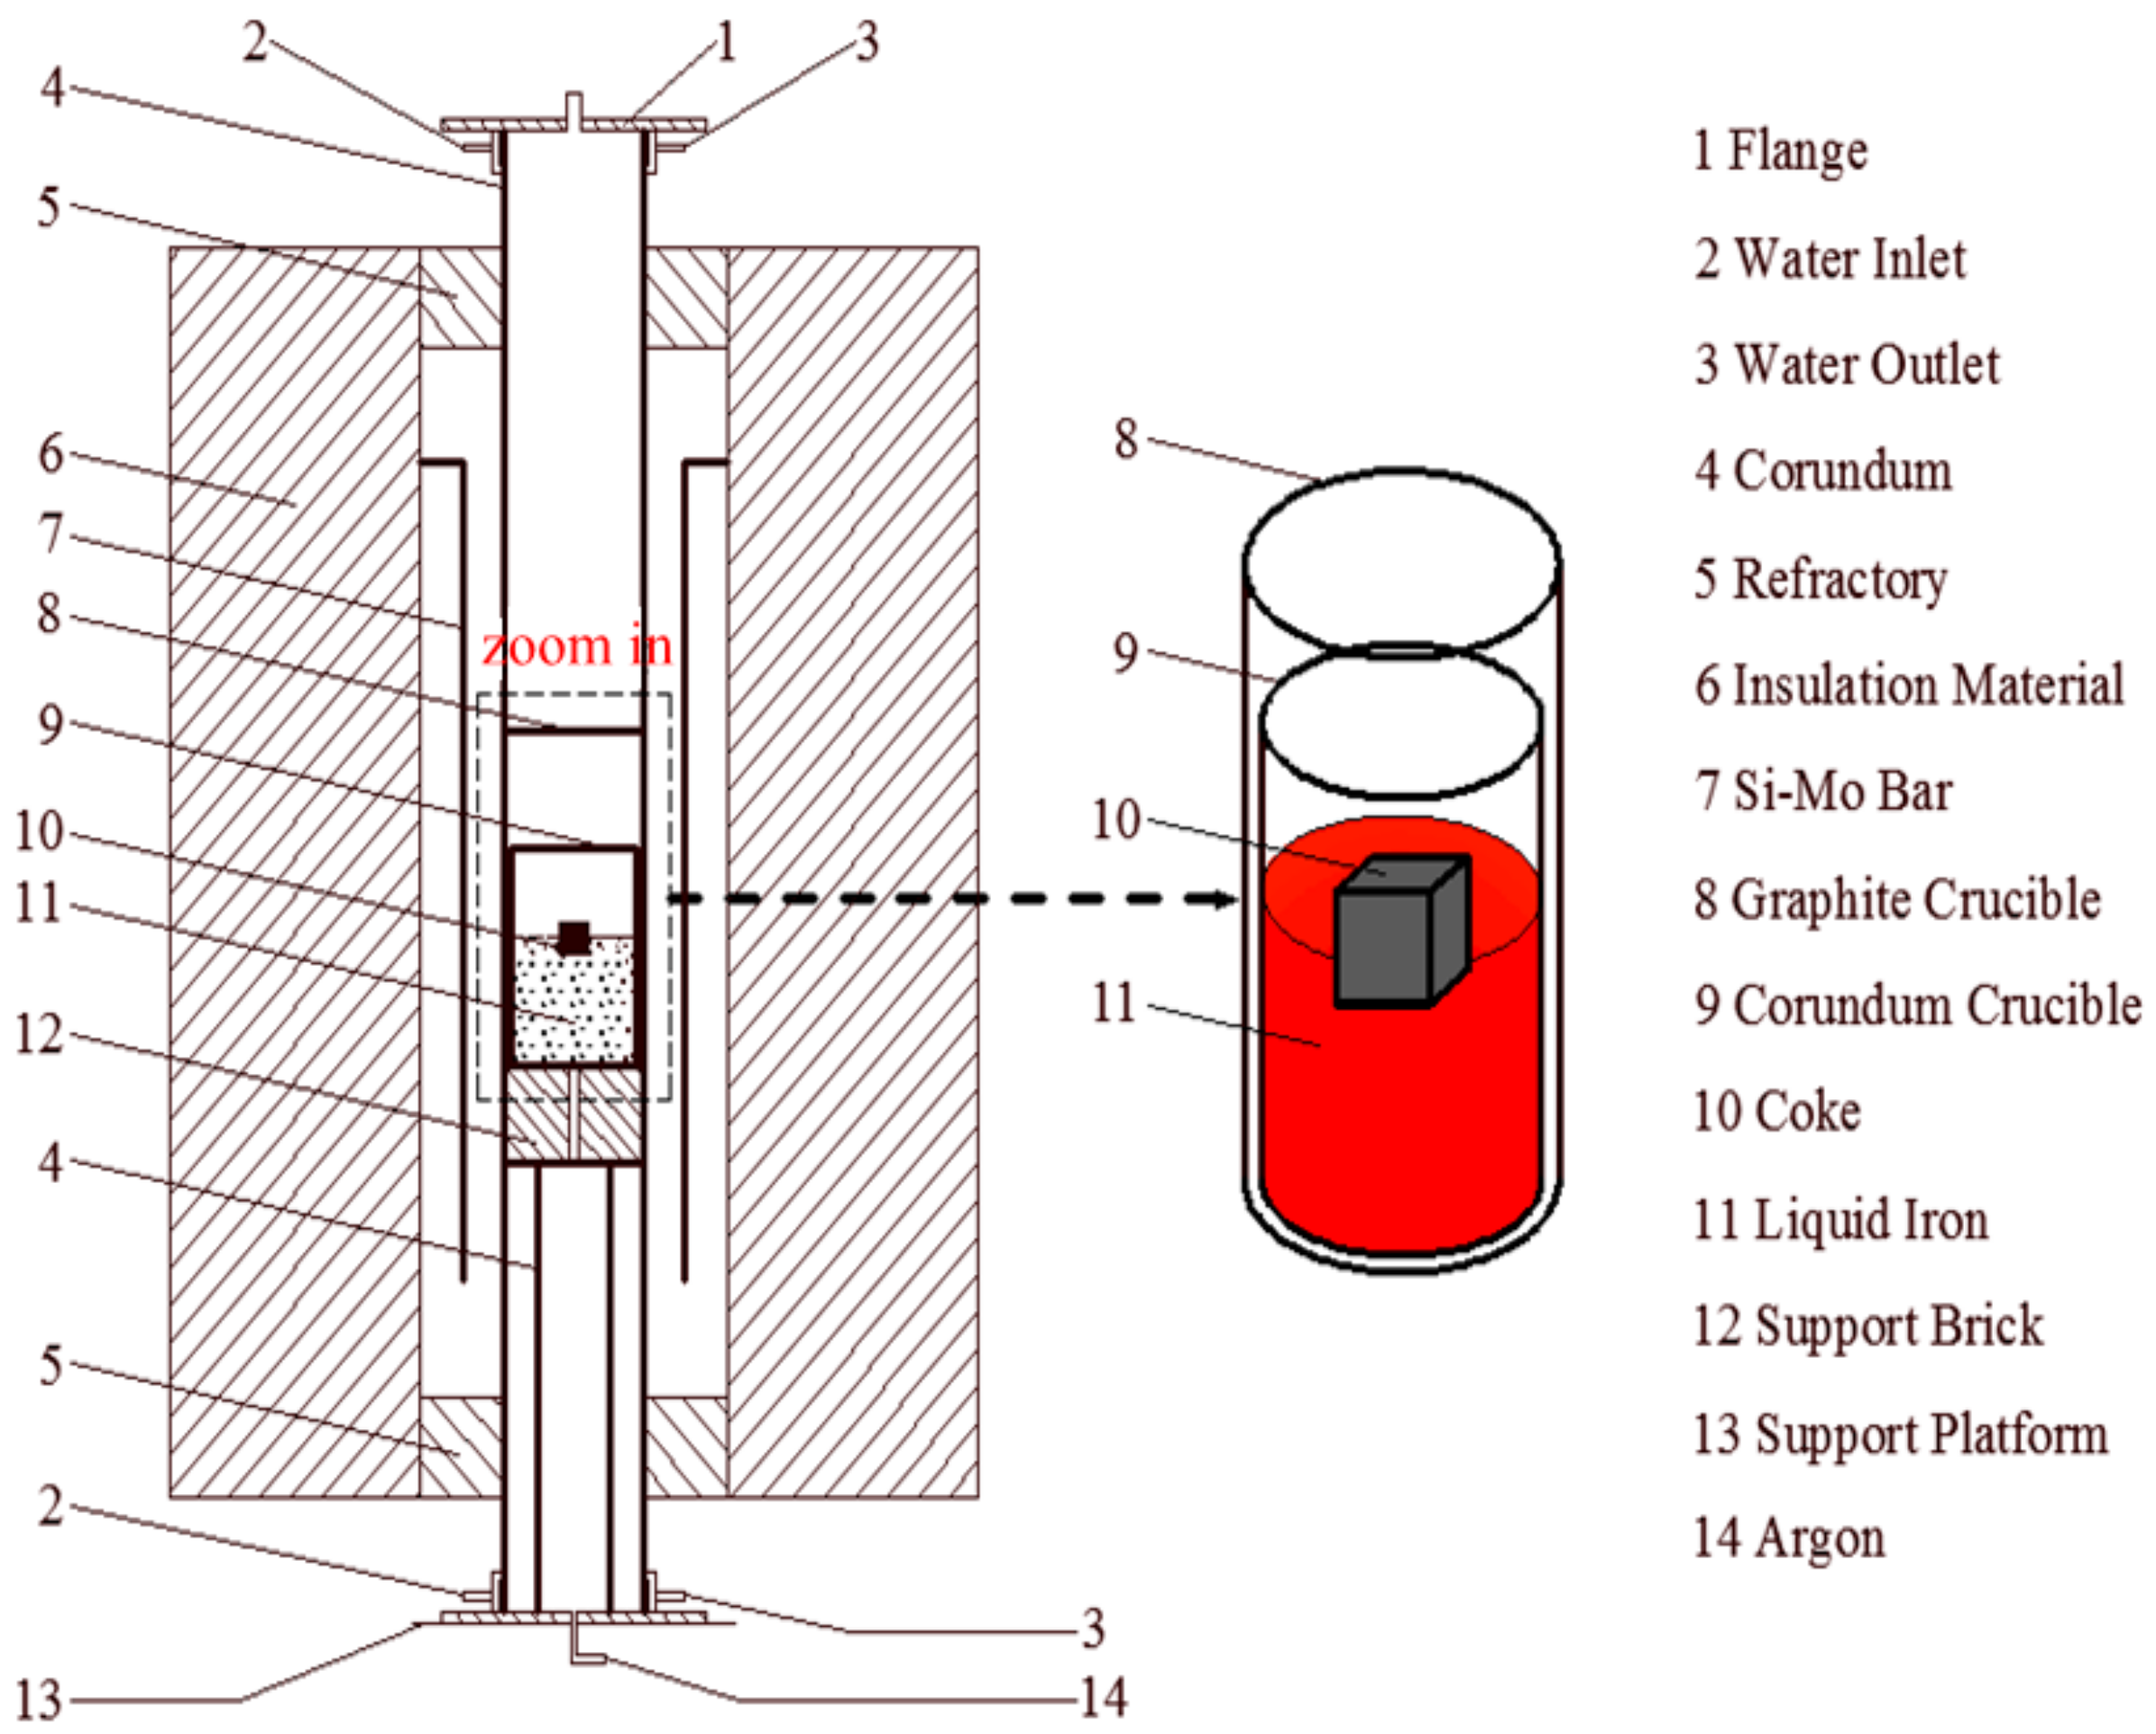
2. Material and Methods

The chemical compositions of the reduced iron powder and electrolytic iron are shown in Table 1 and Table 2, where a is total iron. Table 1 shows that there is FeO and a small quantity of sulfur in the reduced iron powder, and MFe reveals the total quantity of Fe3O4 and Fe (MFe means Fe content when there is no Fe3O4) In these experiments, the tube resistance furnace made by Shanghai Experimental Electric Furnace Factory was adopted as the heating equipment, with a corundum tube (inner diameter of 100 mm and length of 1200 mm), a corundum crucible (outer diameter of 82 mm and inner diameter of 74 mm), and a graphite crucible (outer diameter of 96 mm and inner diameter of 83 mm) installed in it. Figure 1 shows the schematic diagram of this furnace. In an attempt to obtain the original carbon content in the melts, a certain amount of chemically pure graphite (98%) was added into the ferrous sample during the preparation stage. Three types of coke samples with a shared particle size of about 20 mm were used in this research, and Table 3 and Table 4 display their chemical composition and ash chemical composition, respectively, where Ad and Vd are the ash and volatility of coke, respectively. The furnace was continuously infused with high-purity argon and a positive pressure was maintained throughout the experiment. At the end of the experiment, the iron samples were collected by a quartz tube of a 3 mm inner diameter, and its carbon content and sulfur content were then measured by C-S analysis. Additionally, the surface structure of the partially dissolved coke samples was examined by SEM and EDS (Energy Dispersive Spectrometer).
The graphite crucible, with a corundum crucible holding 400 g of reduced iron powder (or electrolytic iron) and a certain amount of chemical pure graphite in it, was put into the furnace before heating. During the experiment, argon gas was constantly injected into the furnace and a positive pressure was maintained. The coke bulk samples were added into the iron bath when the furnace temperature reached 1873 K, then this temperature was maintained for 140 min to ensure the sampling being carried out was under the same conditions. The quartz tube was inserted into the corundum tube from the top of the furnace, and the molten iron was extracted by an injector connected to the quartz tube with a rubber tube. The extraction was usually done after a slight agitation of the hot metal, so that the obtained sample would have a good representative component at that time. After successful extraction, it was quenched quickly in water, and then the bottom of the quartz tube was broken to obtain the iron sample.
In this duration, iron specimens were collected directly from the iron-carbon melt at 2, 4, 6, 8, 10, 15, 20, 30, 40, 50, 60, 70, 80, 90, 100, 110, and 120 min, then they were sent for C-S analysis, and the surface structure of the partially dissolved coke samples was examined by SEM and EDS. However, it is important to note that as the sampling continued, the volume of liquid iron gradually decreased, which might have affected the later experiments, thus the following calculations were carried out to discuss this problem:
V = S 1 L
S 1 = π R 1 2
V t = 17 V
m t = ρ V t
S 2 = π R 2
Δ h = m t ρ S 2
where V is the average volume of each sample, L is the average length of each sample, S 1 is the quartz tube cross-sectional area, R 1 is quartz tube inner diameter, V t and m t are the total volume and total mass of all samples, respectively, S 2 is the corundum crucible cross-sectional area, ρ is the density of molten iron, R 2 is the corundum crucible inner diameter, and Δ h is the height change of the molten iron level before and after sampling, which was calculated as 0.074 mm. Comparably, the original height of the hot metal was 13.04 mm, so the amount of molten iron meets the requirement of sampling and the decrease of the hot metal height had little influence on the experiment.

3. Kinetic Model

The procedure of the carbon dissolving into the hot metal can be divided into two basic steps [2,7,8,9,10,11,12,13,14,15,16,17,18,19,20,21,22,23,24,25,26,27,28,29,30,31,32,33]. The first one is the interface reaction, in which carbon atoms are transformed into the carbon to be dissolved, and the second one is the mass transfer, in which this carbon goes through the boundary layer near the solid coke and moves into the molten iron. The mass flux rate of coke dissolution, j, in the iron-carbon melt can be defined as:
j = k t ( C s C b )
where C s and C b are the saturated carbon concentration and instantaneous carbon concentration, respectively, and k t is the total dissolution rate coefficient, which is given by the following formula:
1 k t = 1 k m + 1 k b
where k m is the mass transfer coefficient of carbon in the liquid boundary layer between the solid char and bulk liquid, and k b is the phase interface reaction constant. These equations reveal how the physical and chemical conditions in the iron bath affect the dissolution process [20], respectively. Based on Equation (8), the value of k t depends on both k b and k m . If k b >> k m , this parameter would be mainly determined by the mass transport in the liquid boundary layer, and if k b << k m , it would depend on the phase interface reaction. The value of k t has been studied by a number of existing studies by changing the experimental conditions that might influence the liquid hydrodynamics around the solid samples. It was experimentally demonstrated that when the Reynolds number is less than a certain value, the mass transfer can control the coefficient rate of the liquid boundary layer near the solid, while the process may be controlled by the phase boundary reaction with a relatively high Reynolds number [20,21]. As shown in Table 4, SiO2 is the main chemical constituent of the ash in the coke, which increases the silicon content of the hot metal, and then increases the viscosity of the molten iron, and decreases the Reynolds number. Therefore, the dissolution rate might be commanded mainly by the mass transfer in the slag layer near the solid (coke) in this research.
The dissolution rate of coke in molten iron can be obtained by surveying the carbon content in the molten iron. The total mass of dissolved carbon, W cd , can be calculated by multiplying the carbon content of the final iron specimen by the mass of the reduced iron powder or electrolytic iron. Equation (9) is put forward to calculate k t :
k t = W cd t A s ( C s C b )
where t is the immersed time of the coke samples, and A s is the area of the samples exposed to liquid iron, which can be calculated by the following equations:
ρ g V 1 = m 1 g
V 1 = S 1 h
A s = S 1 + 4 a h
where V1 is the volume of the immersed part of the sample, g is the gravitational acceleration, m1 is the mass of the sample, S1 is the basal area, h is the immersed depth, and a is the side length. It can be seen in Equation (9) that the value of kt is related to t, Cb, and Wcd. In order to investigate how the surface structure and composition of the partially dissolved coke as well as the sulfur content in the iron bath affect the dissolution rate, the experimental results are sorted out and discussed as follows.

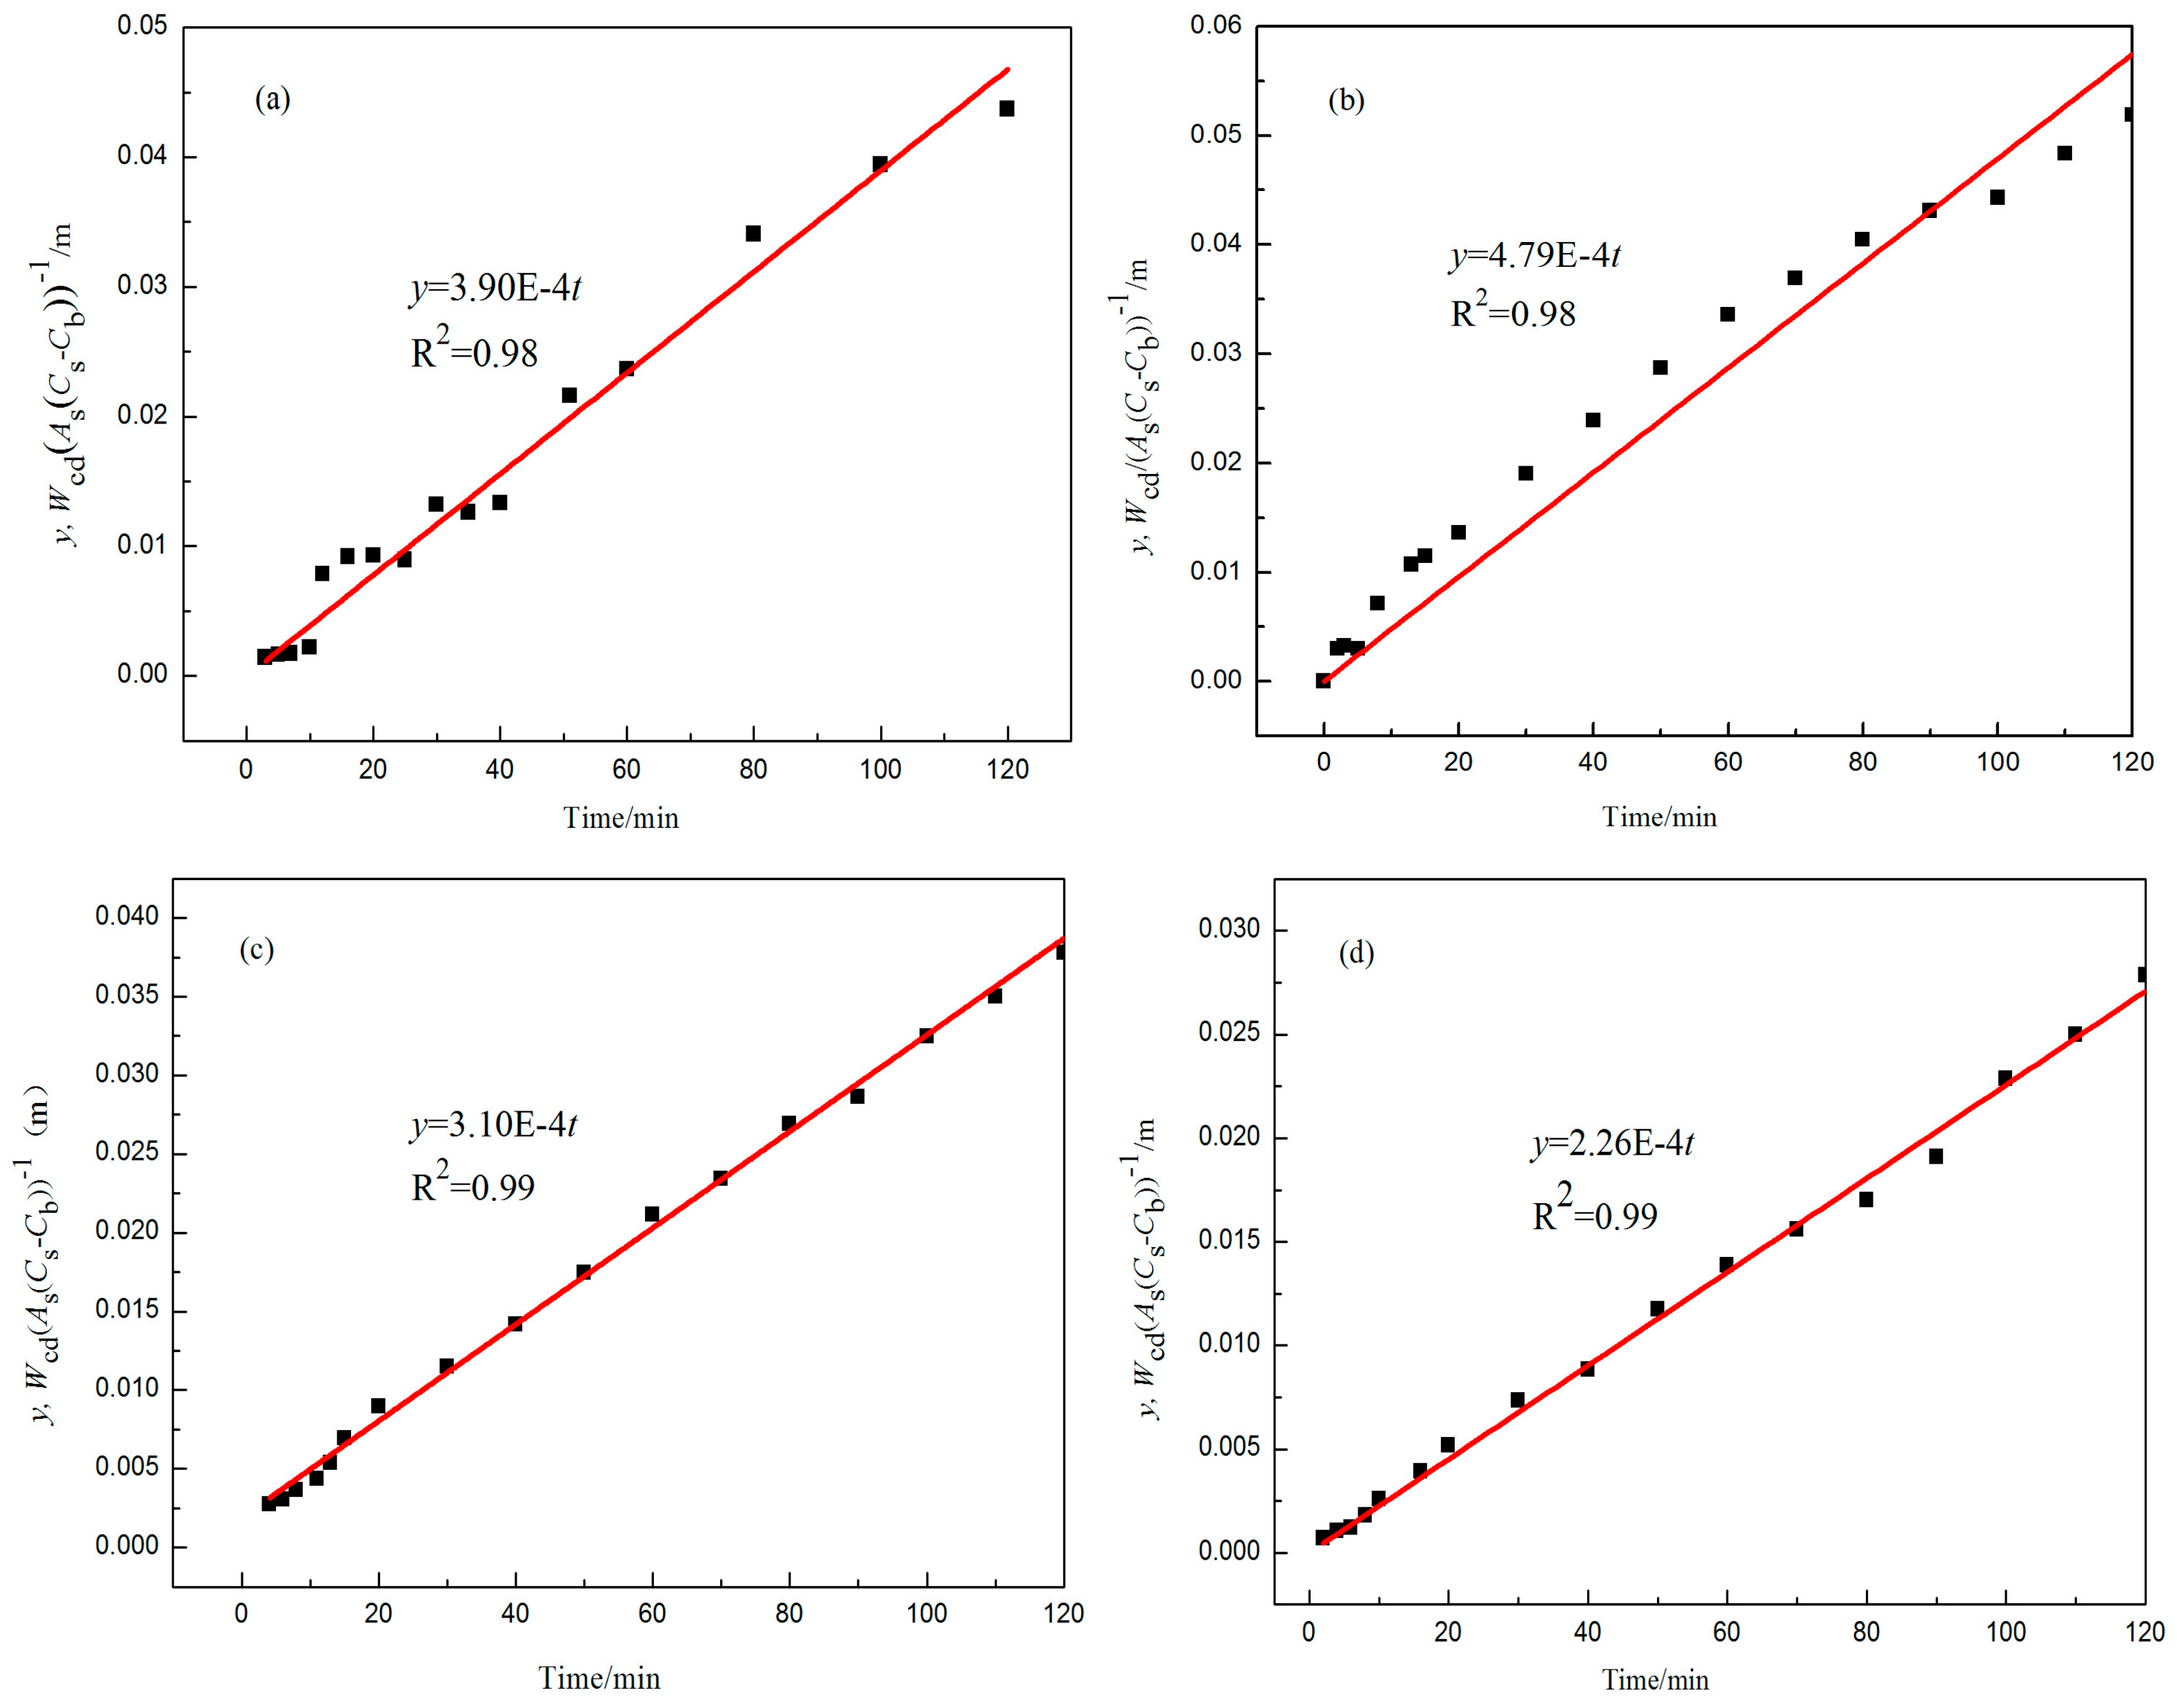
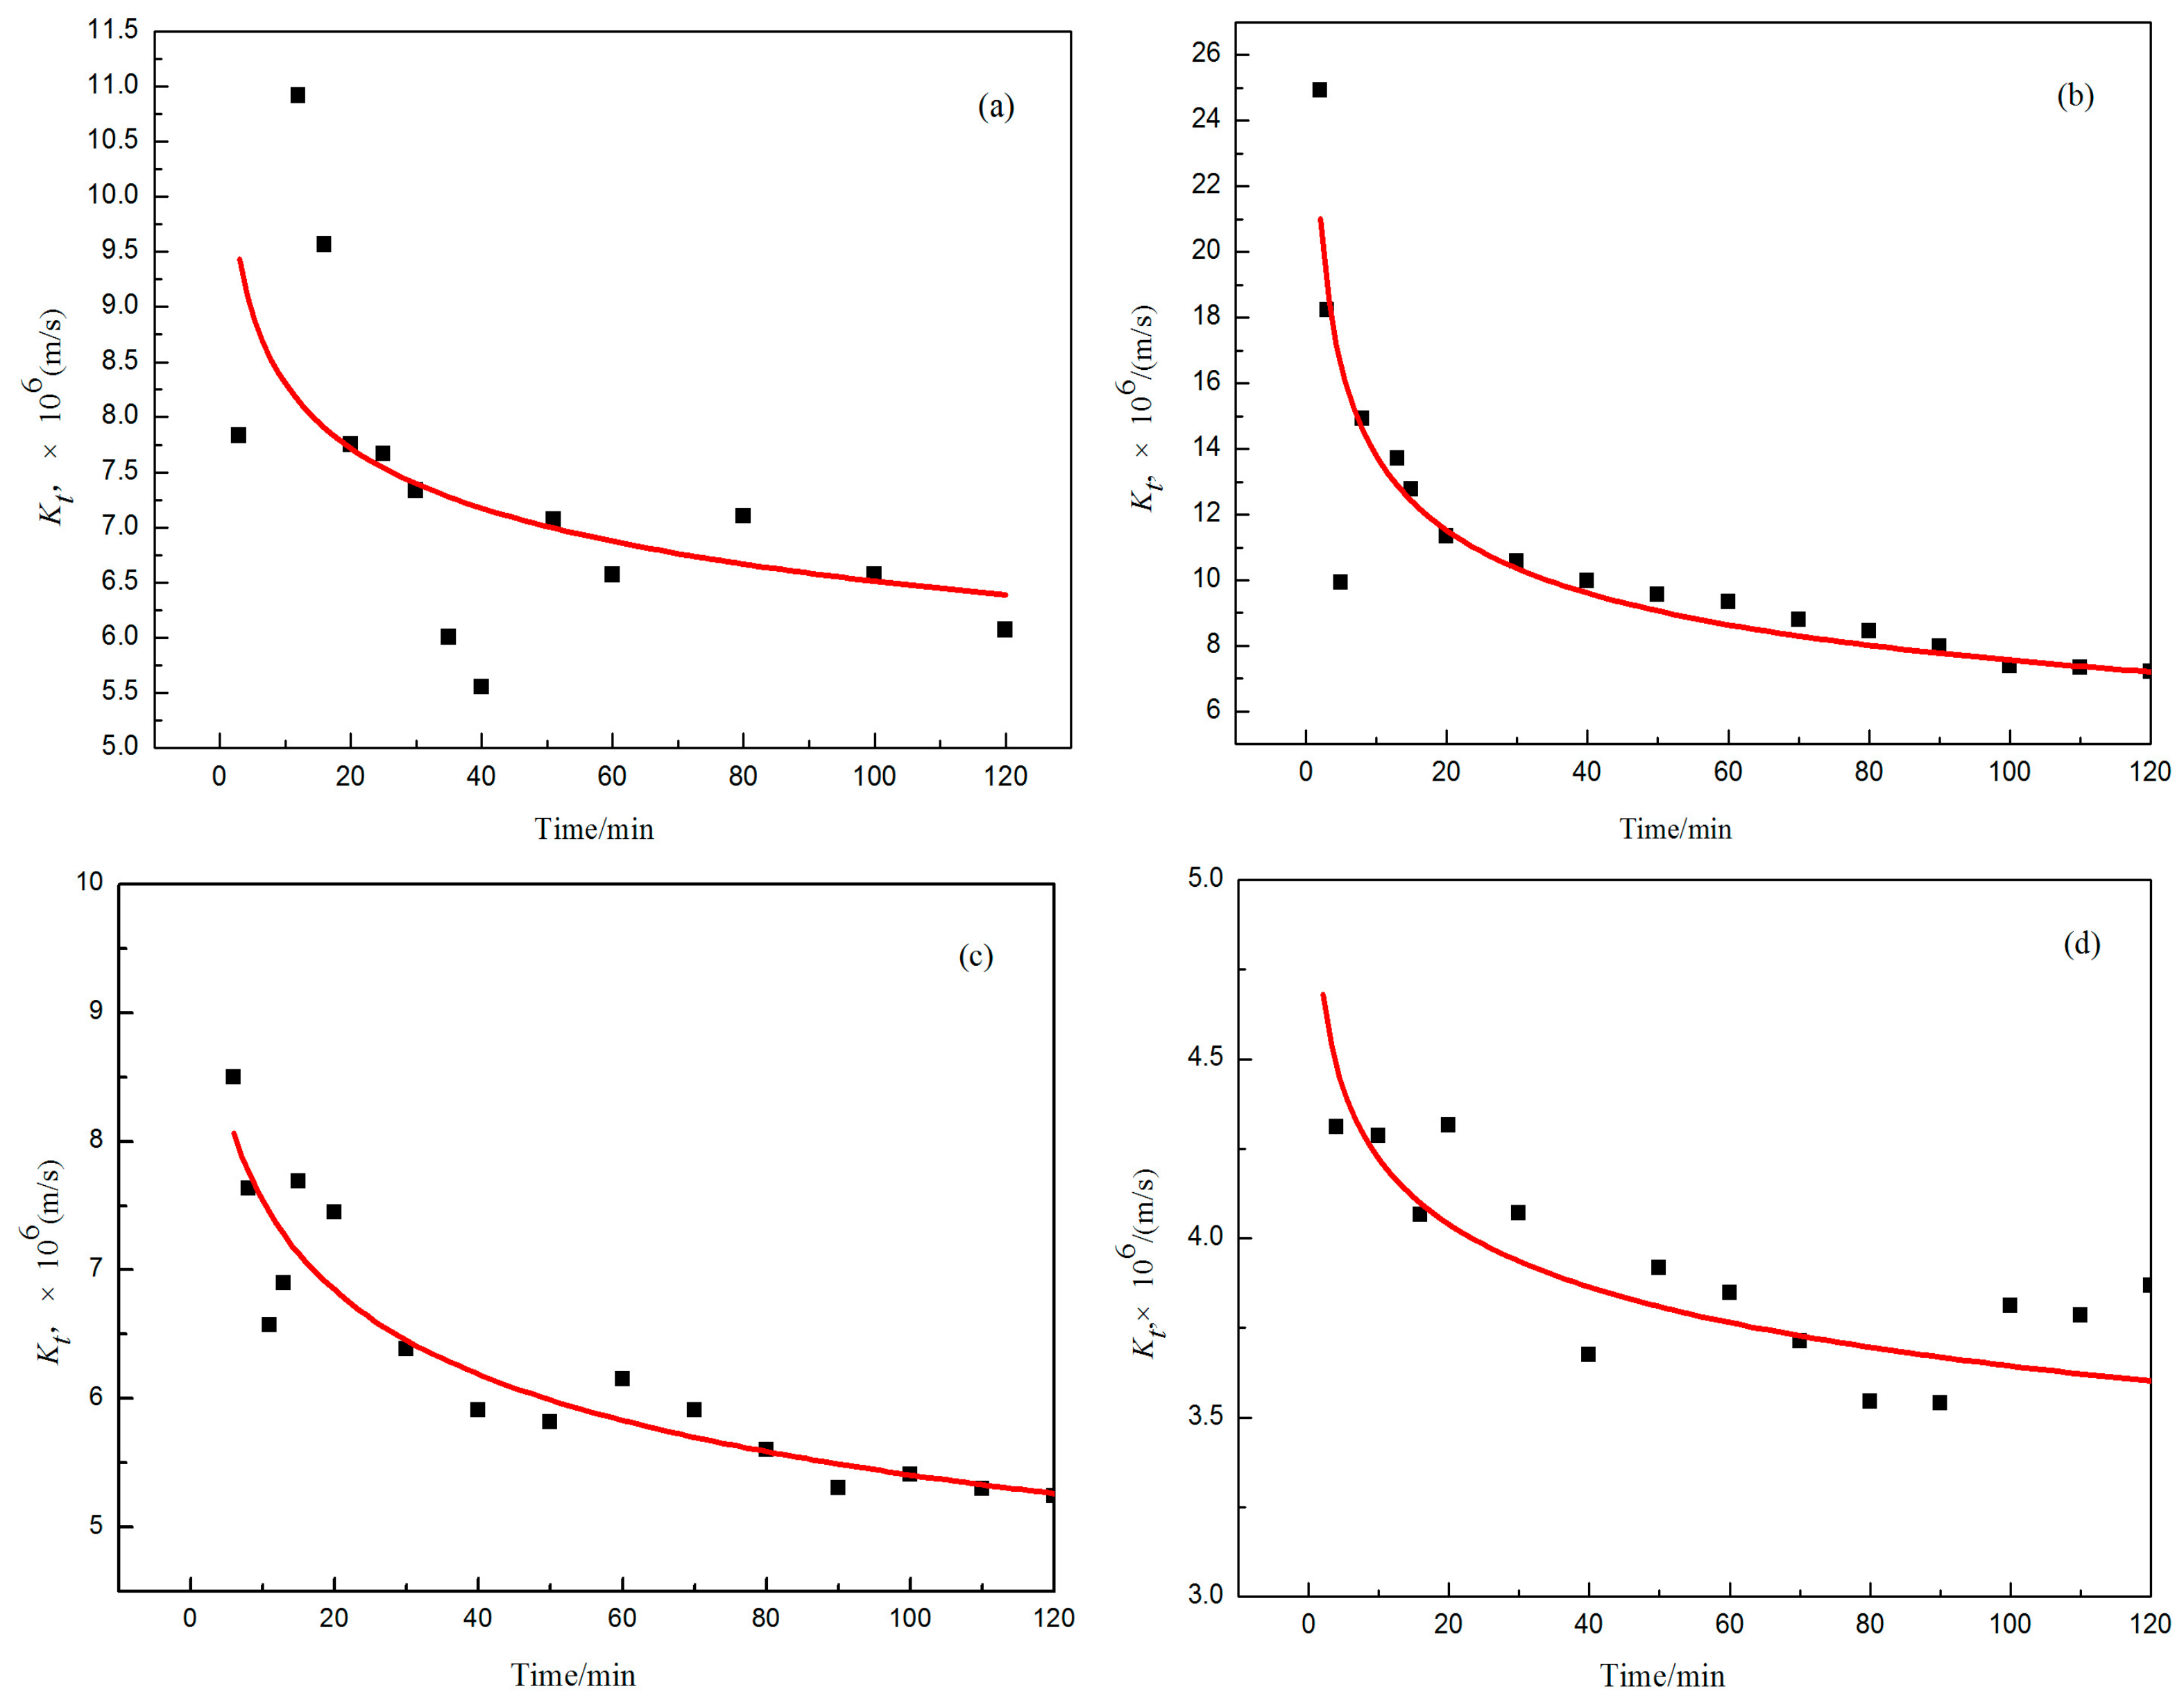
4. Results and Discussion

To investigate the mechanism of the dissolution of three different types of coke samples, their kinetic models were studied after the experiments. The operating variables include the initial weight of carbon, mci, and the metallization rate of the reduced iron powder, R.
The dissolution rate coefficient, kt, can be illustrated as the slope of the Wcd(As(CsCb))−1-t curve, as shown in Figure 2. The values of kt at 1873 K are listed in Table 5. It shows in the first three lines that kt is different when using different ferrous material samples. When the content of FeO rises in the iron-bearing material, the influence of FeO on the carbon dissolving rate constant is not negligible, because of the chemical reaction occurring between FeO and C. Therefore, the addition of some carbon into the ferrous material can increase kt. This is attributed to the variations of their ash components, sulfur contents, silicon contents, and graphitization degrees, and these coke samples each have different surface structures and chemical compositions, hence kt varies despite the other experimental conditions being similar. Additionally, the dissolution rate changes with the carbon content, immersion time, t, and the chemical activity of the iron bath.

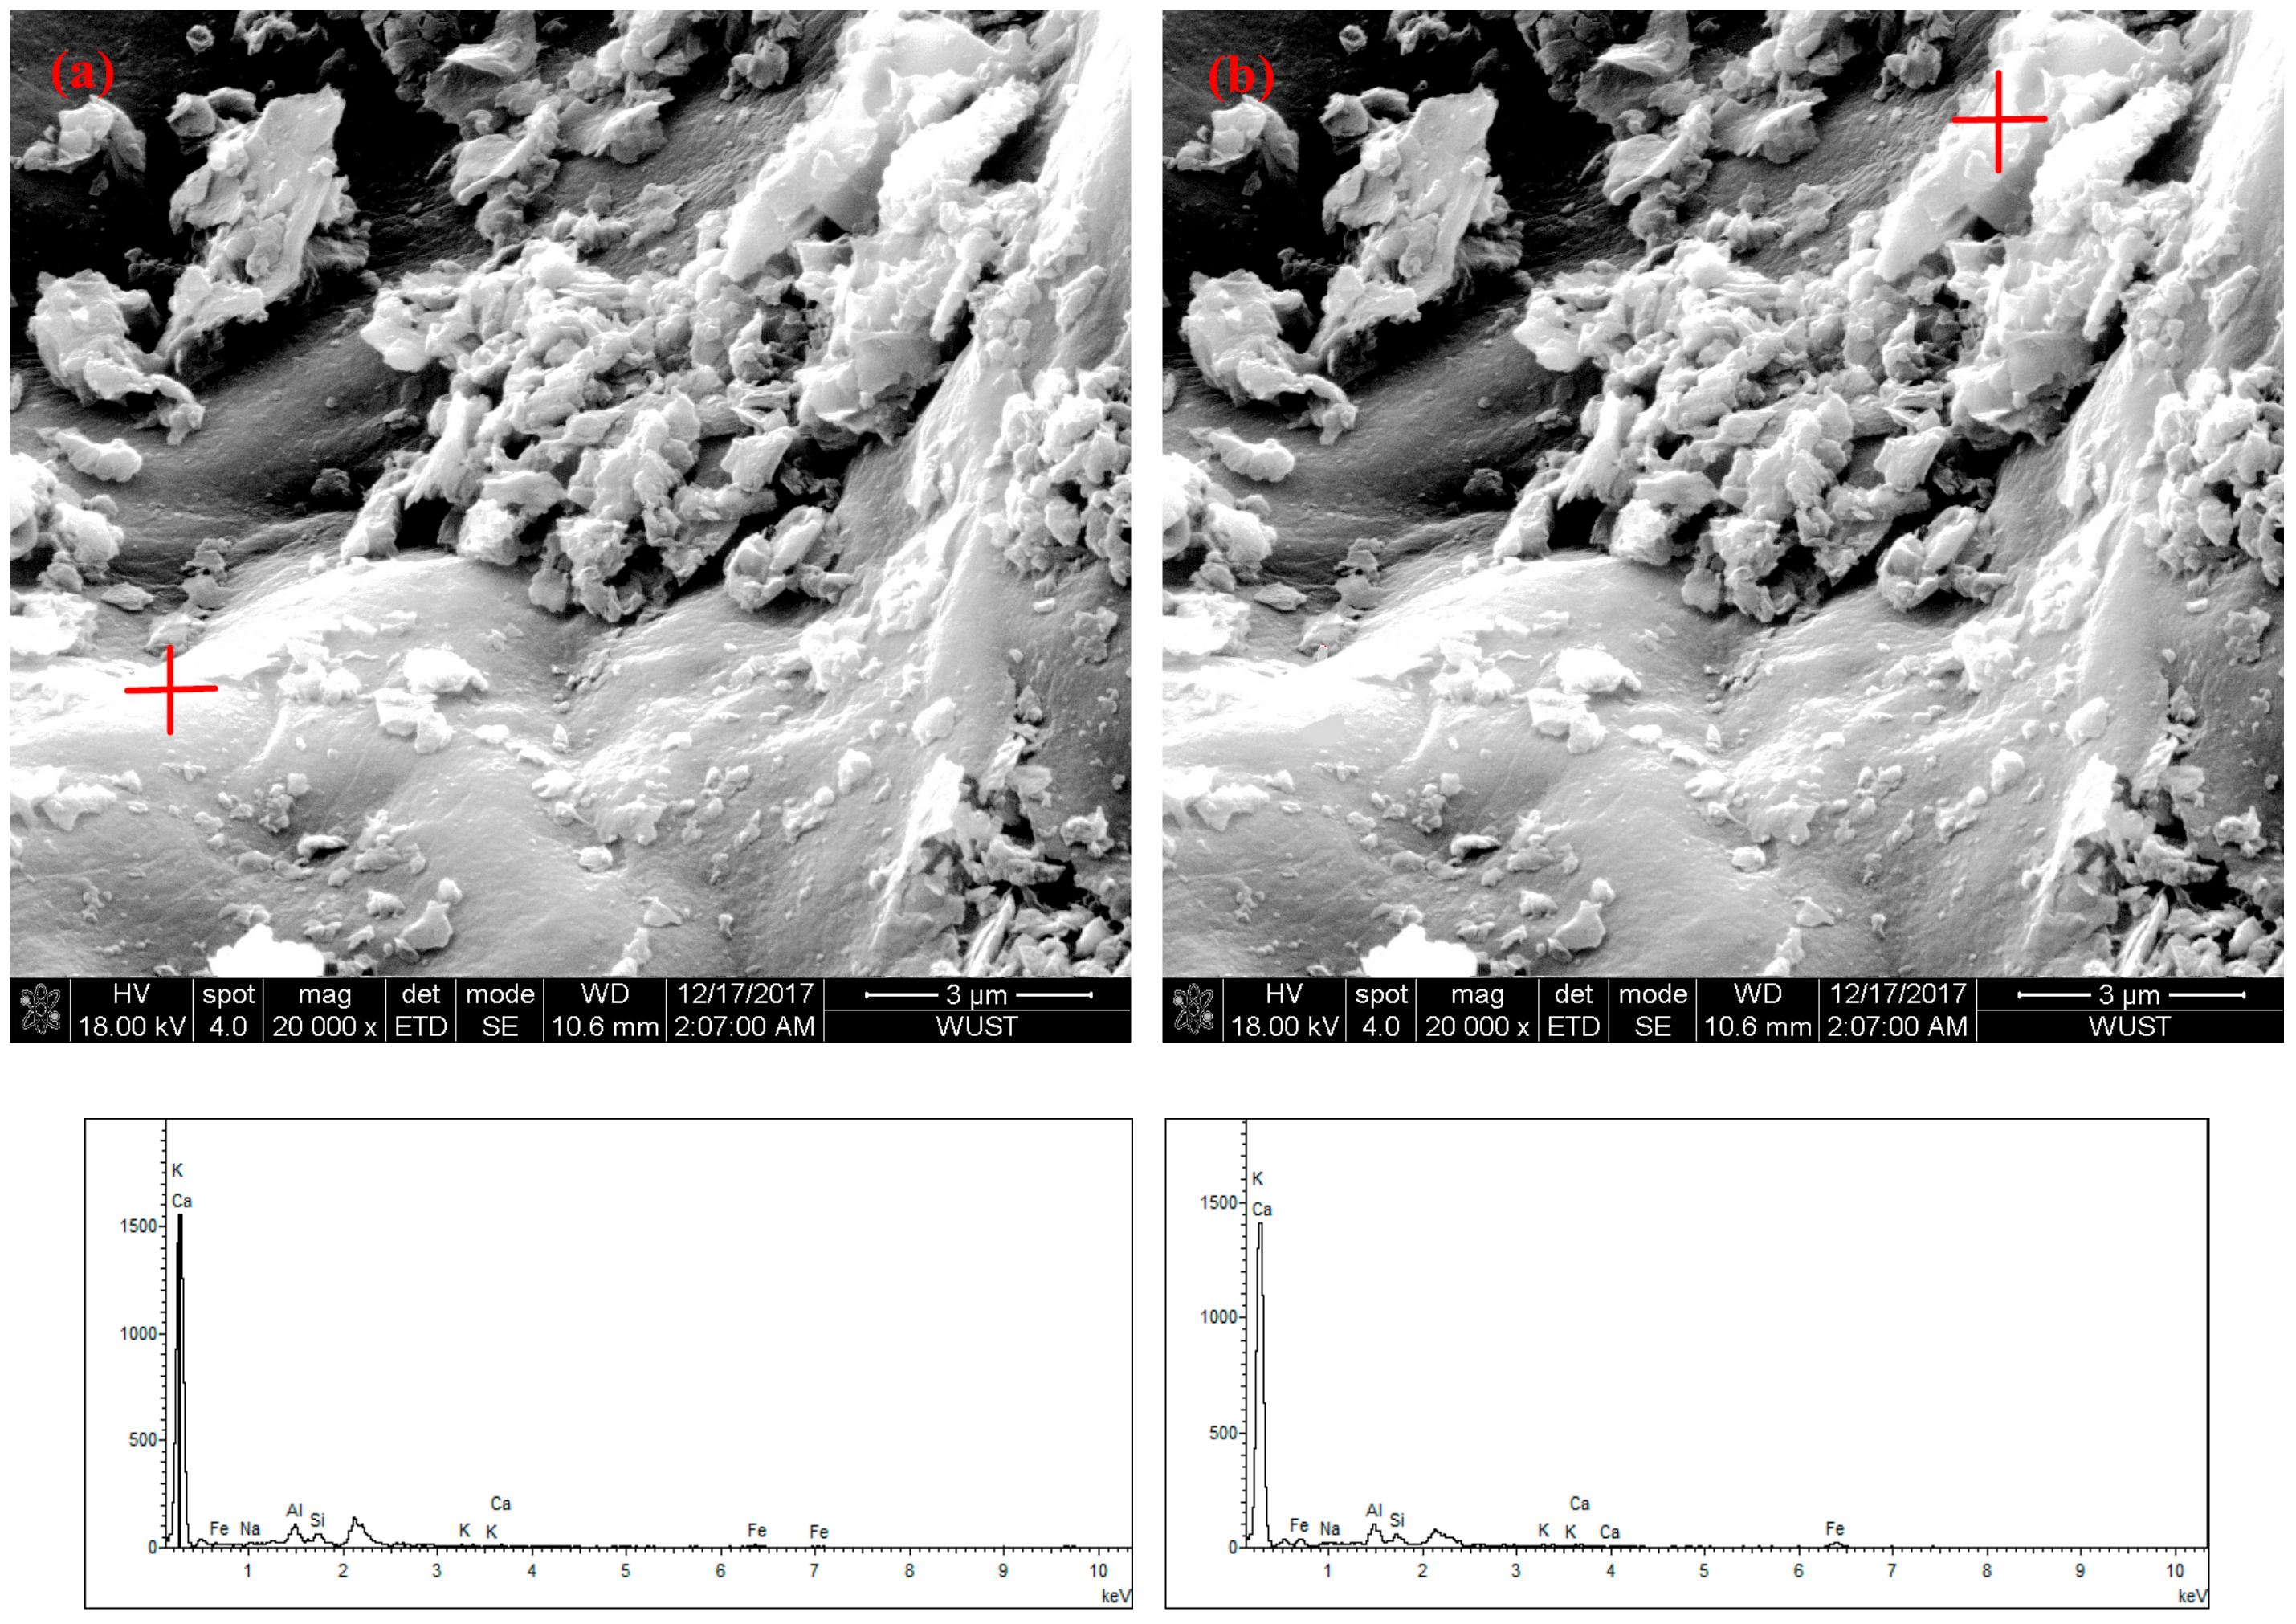
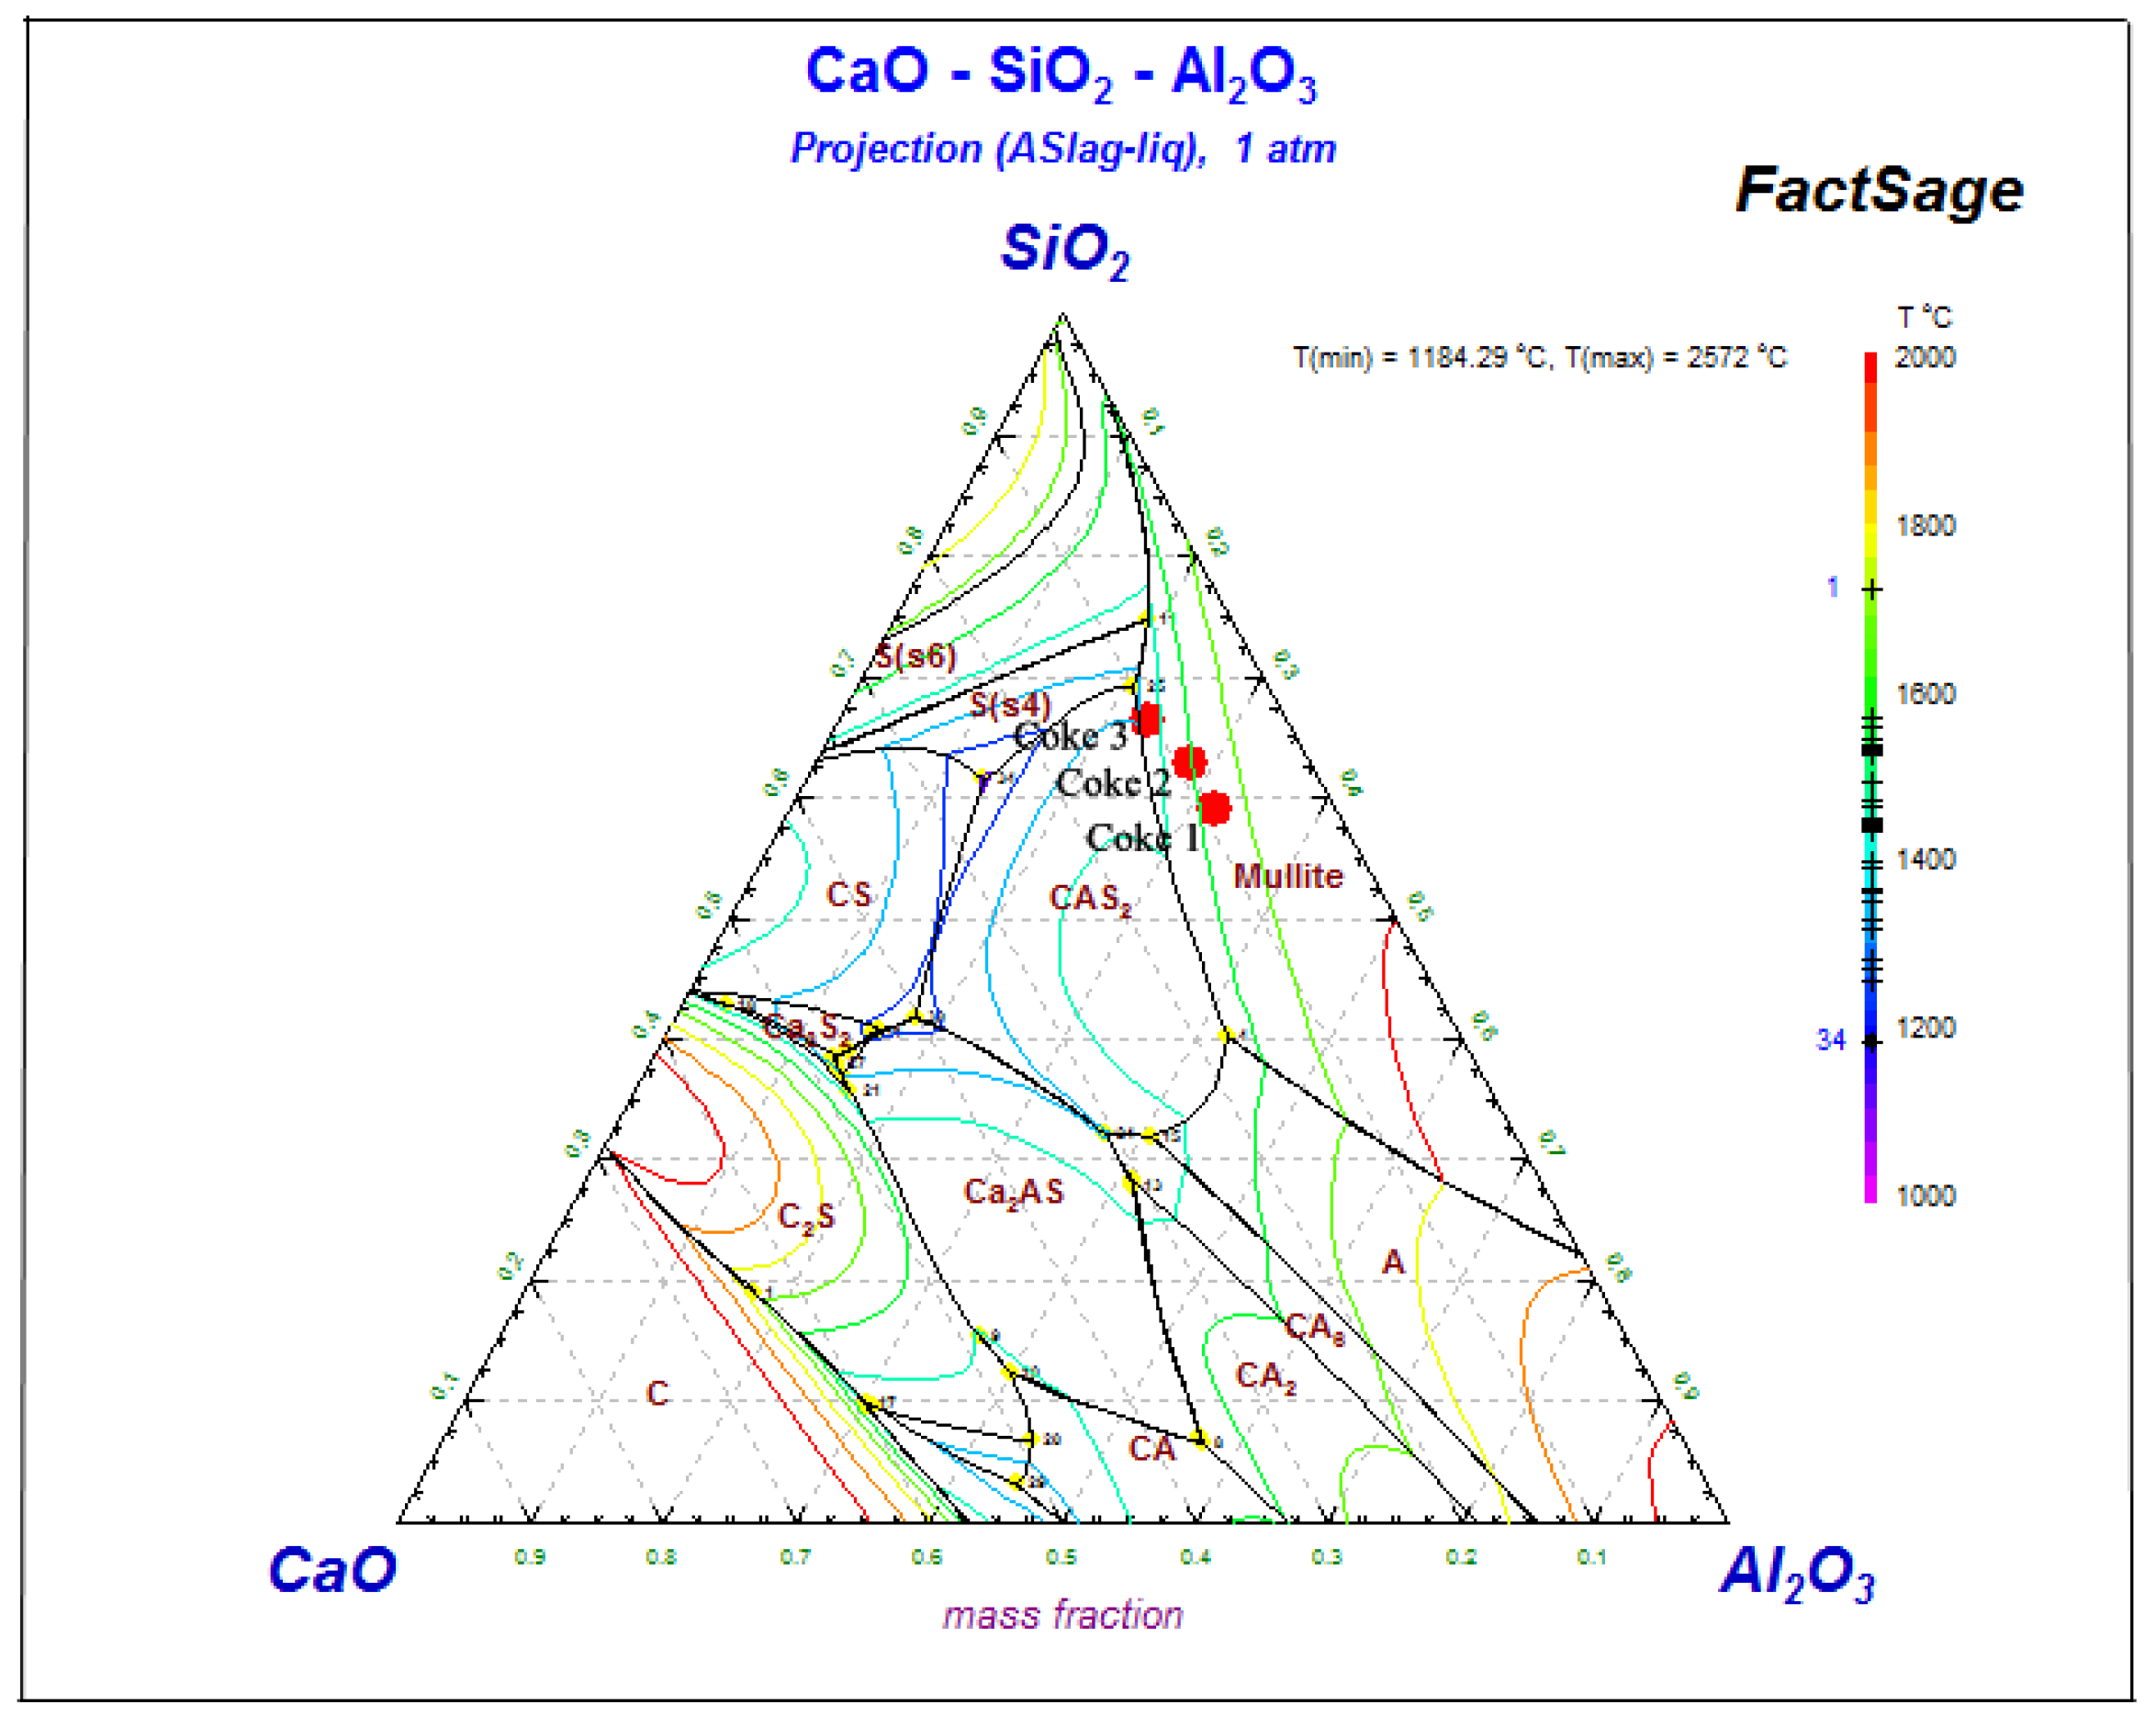
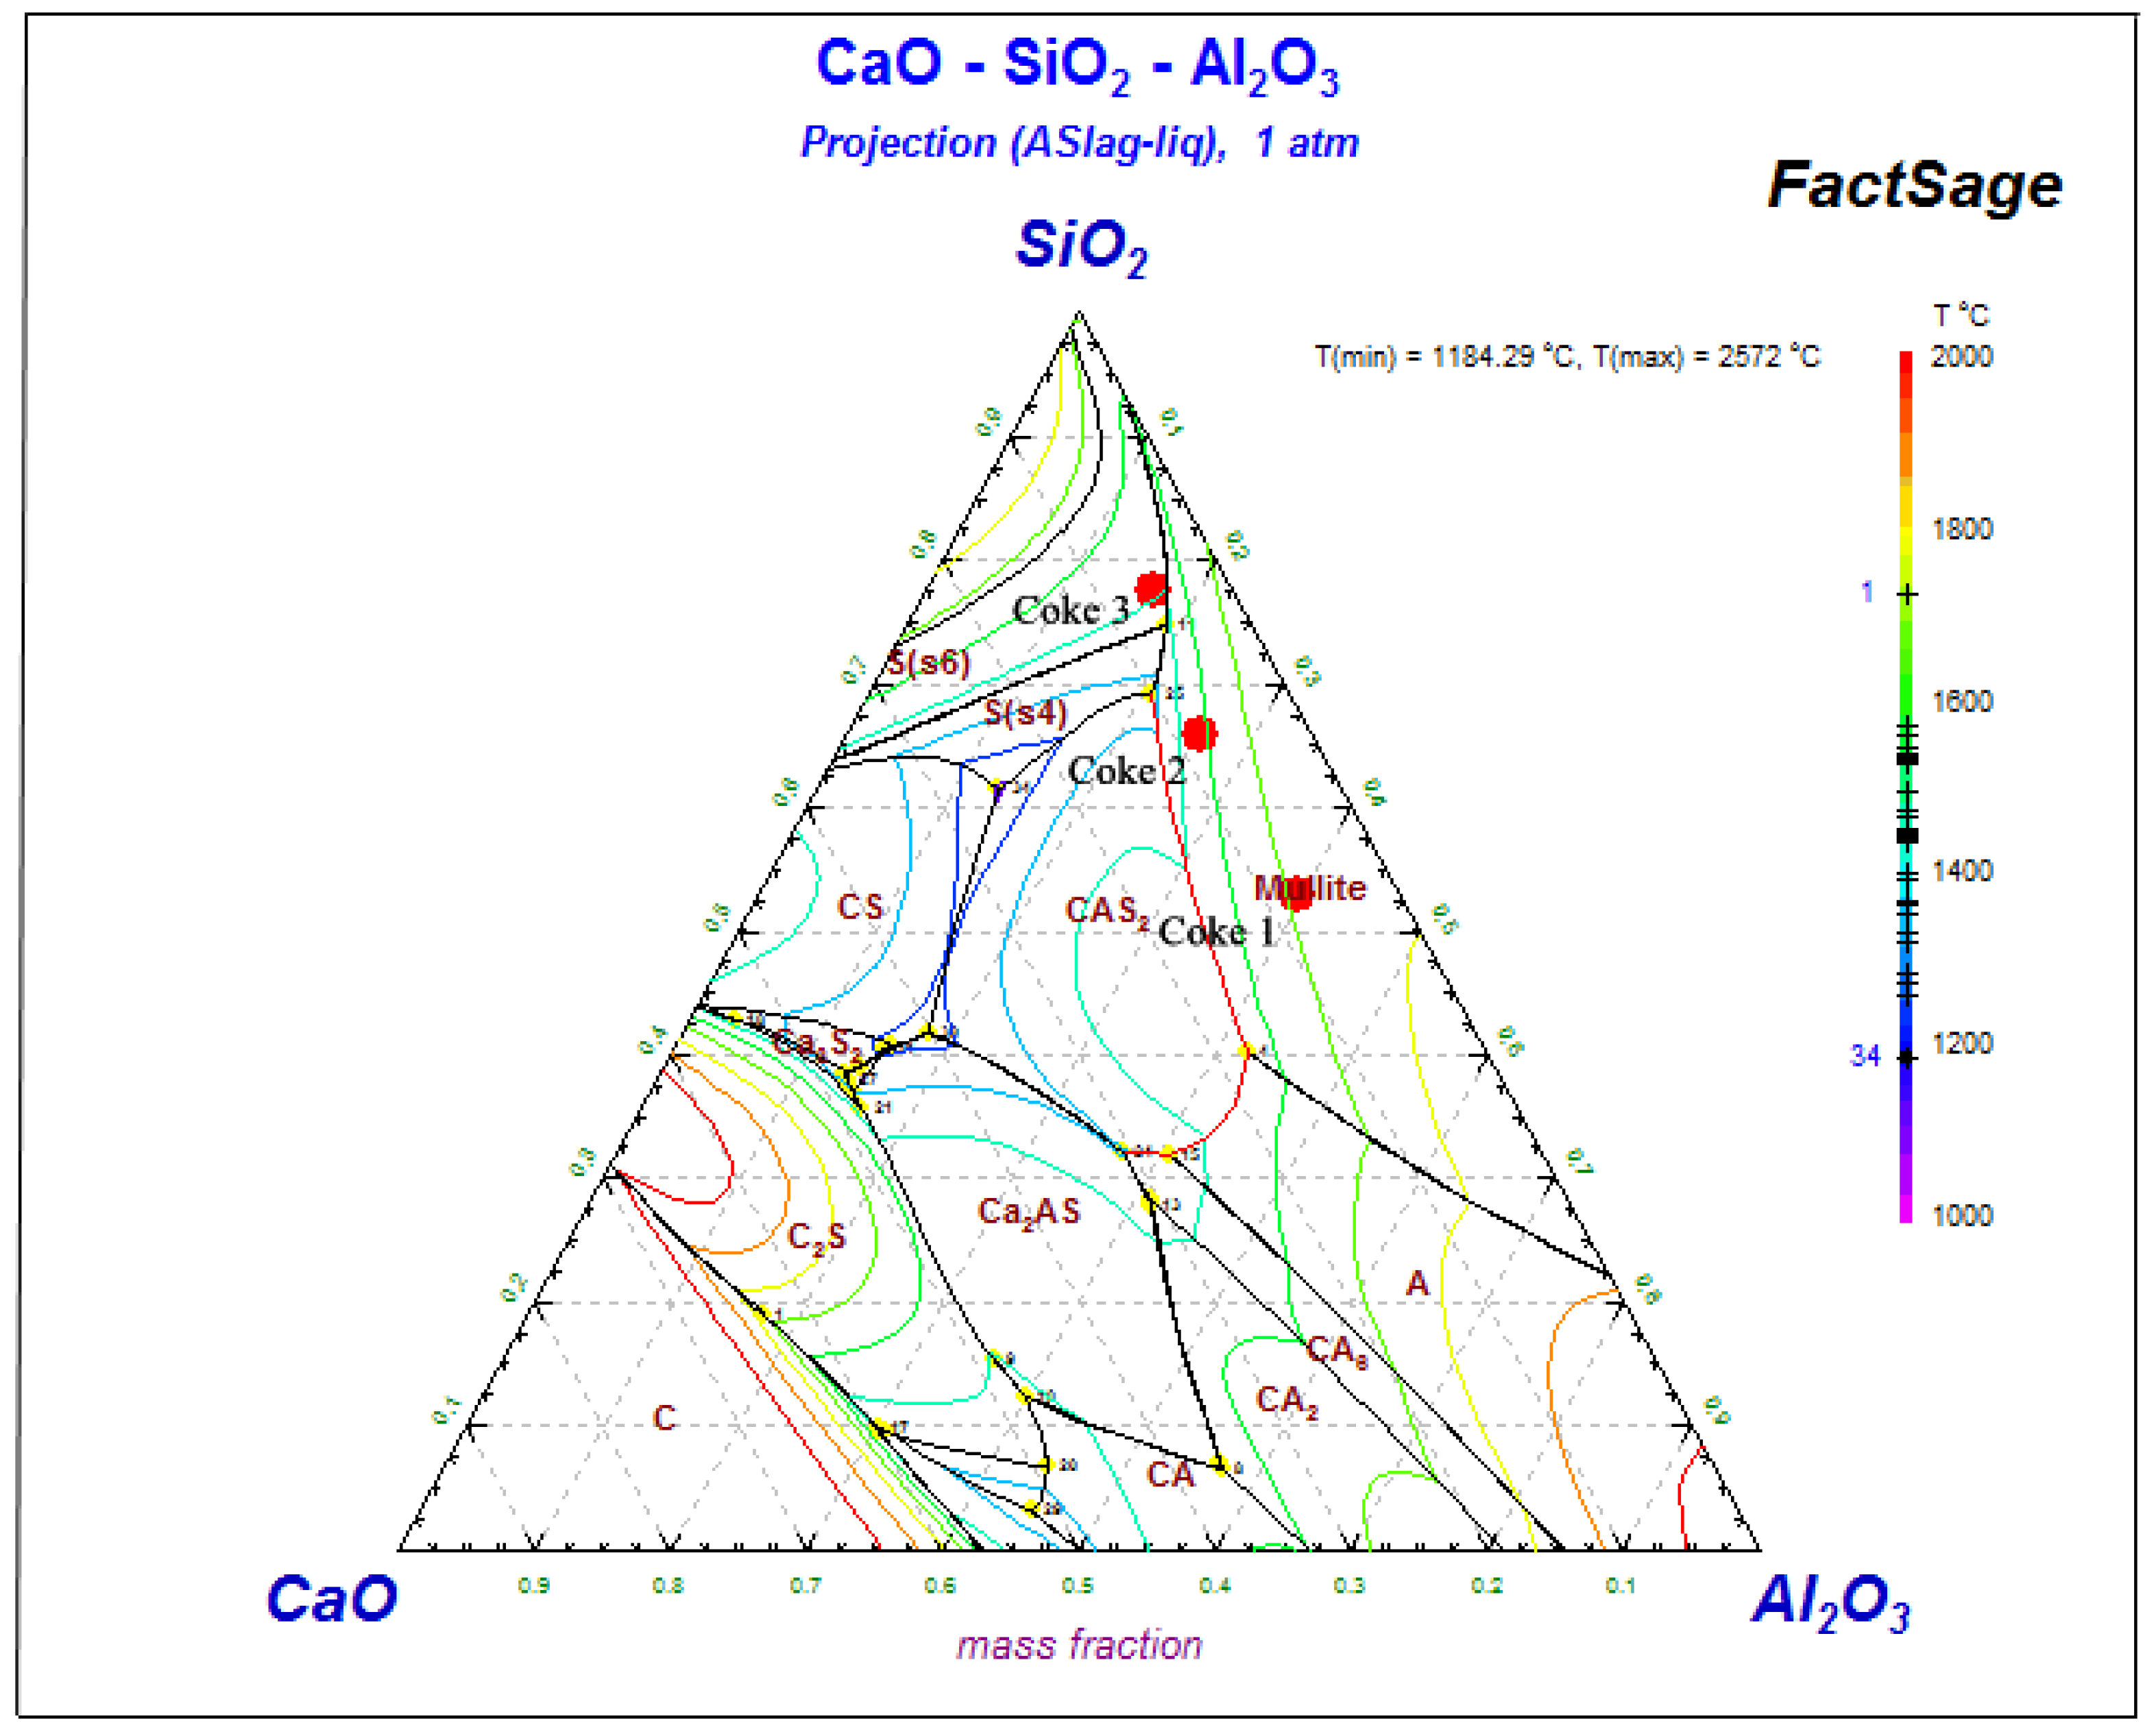
4.1. Effect of Ash Composition on the Dissolution Rate

When the dissolution rate coefficient is regarded as a variable, a certain value exists in every time point. The correlation between kt and t was calculated with Equation (9), as shown in Figure 3. With this method, the values of kt vary between 3.31 × 10⁻⁶ m/s and 24.93 × 10⁻⁶ m/s. It reveals that the value of kt decreases monotonically with the increase of the immersion time, t, and this variation law is triggered by the ash content and the porous structure of the coke samples.
Several coke samples were observed for their surface structure and surface chemical composition by SEM. The SEM images before and after the reactions are shown in Figure 4, which illustrate that most of the pores on the coke samples were filled with liquid slag and metal, reducing the factual contact area between the coke and hot metal. The results of SEM analysis of the partially dissolved coke sample are shown in Figure 5. It shows that with the coke dissolving, there might be viscous layer forming and attaching on the surface of the coke, thereby possibly limiting its dissolution. Furthermore, the chemical composition of the sample surface was surveyed by conducting the dot analysis method, and the results are shown in Figure 5 and Table 6, revealing that it mainly contains iron, calcium, aluminum, and silicon (assuming that these elements other than iron exist in the form of slag, namely the metal oxide (Al2O3, CaO, and SiO2)). The CaO-SiO2-Al2O3 ternary phase diagram of the partially dissolved coke sample surface is shown in Figure 6, and it can be seen that the melting temperatures of these substances are much lower than the furnace temperature (1873 K). Therefore, there is a negative relationship between the Al2O3 and SiO2 content and the liquidus temperature of the coke surface layer, which means this viscous layer might restrict the process of coke dissolution. Additionally, Figure 7 shows the SEM and EDS analysis of the reacted ferrous sample. The results indicate that stratification occurred in the hot metal after coke dissolution, with the upper layer (thin layer) as the slag phase (consisting of oxide of Ca, Si, Al etc.), while the lower one (thick layer) is mainly where the iron-coke melts. It can be confirmed by Table 3 and Figure 7 that when the coke sample dissolved, the ash content on the sample surface increased gradually, thus a thick viscous layer was formed, which diminished the effective area for dissolution.

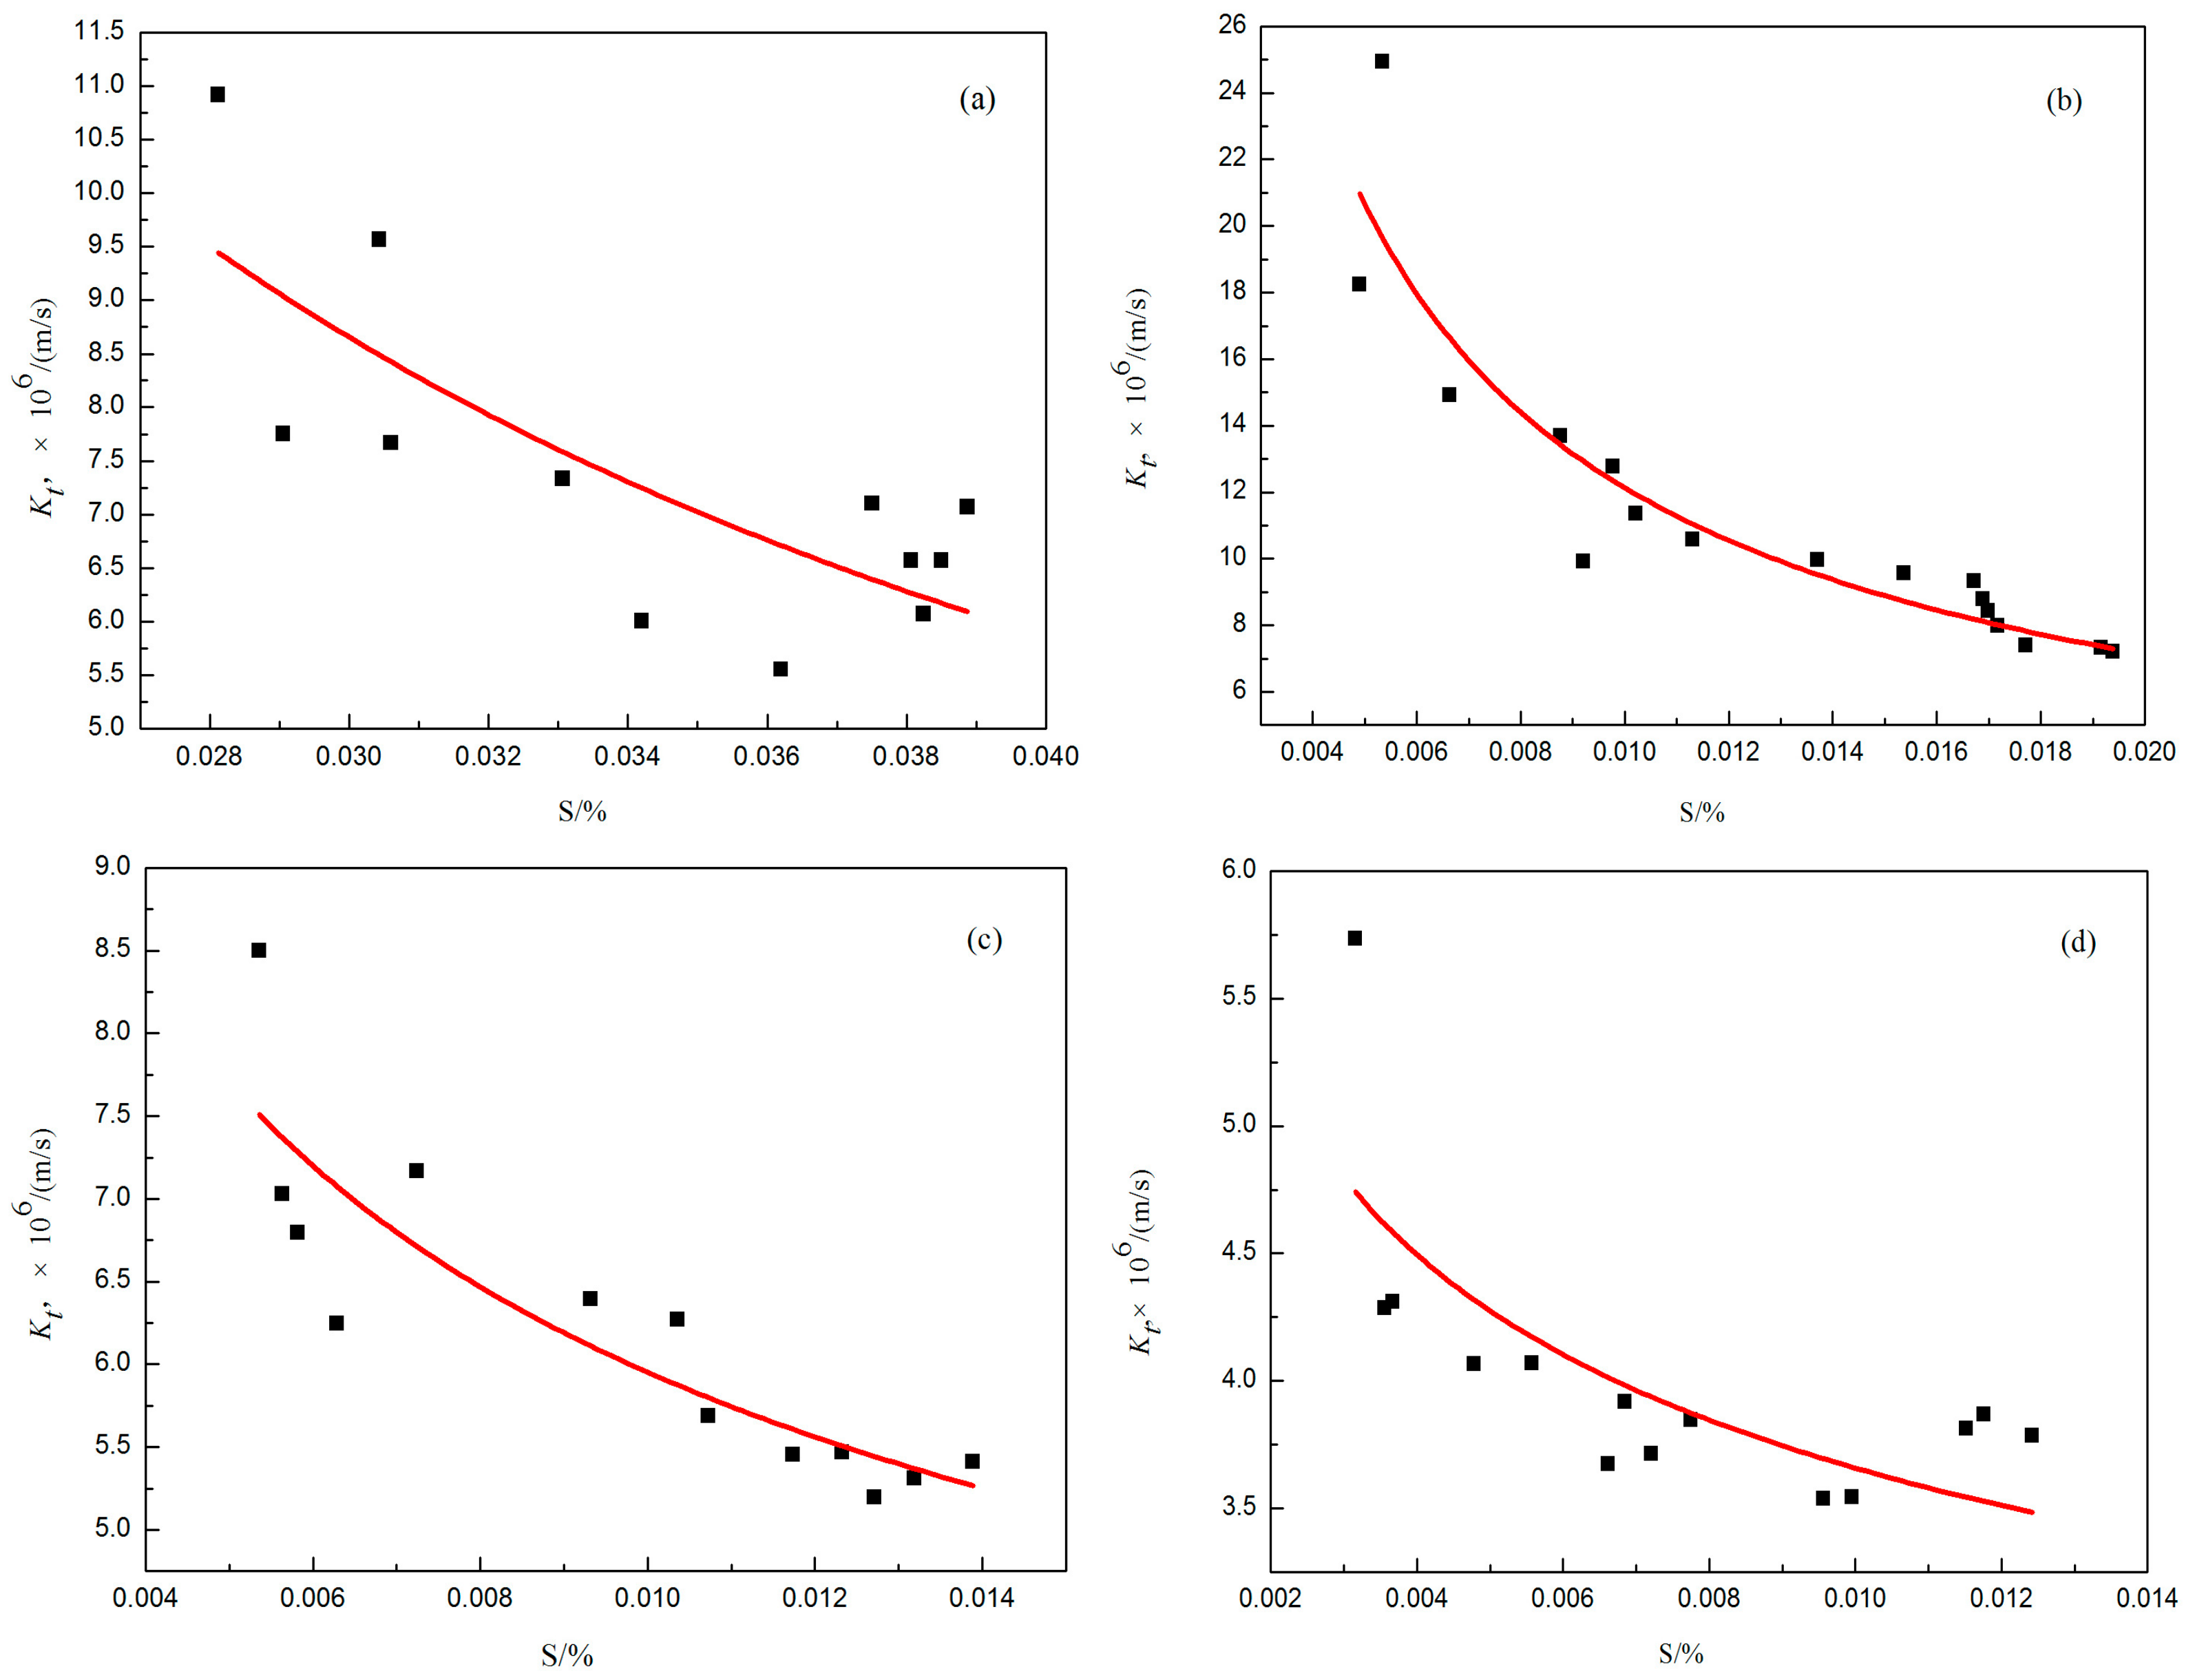
4.2. Effect of Sulfur on the Dissolution Rate

Although the dissolution rate is not determined by the phase interface reaction, the active elements on the sample surface, such as sulfur, may hinder the interfacial reaction and affect k t . Figure 8 shows that the value of k t decreases with the increase of the sulfur content in the iron bath, which is in agreement with the theoretical calculation and actual production. It can be seen from Figure 7 that as the dissolving occurred, the sulfur element migrated from inside of the coke to the surface and then into the molten iron. When the sulfur content is as low as less than 0.03%, a more plausible reason might be that the sulfur contaminates the coke surface, thus, reducing the reaction between C and Fe. With high sulfur contents, the surface of the coke could gather sulfur, which would reduce the contact area between the coke and molten iron, so the coke dissolution deteriorates.

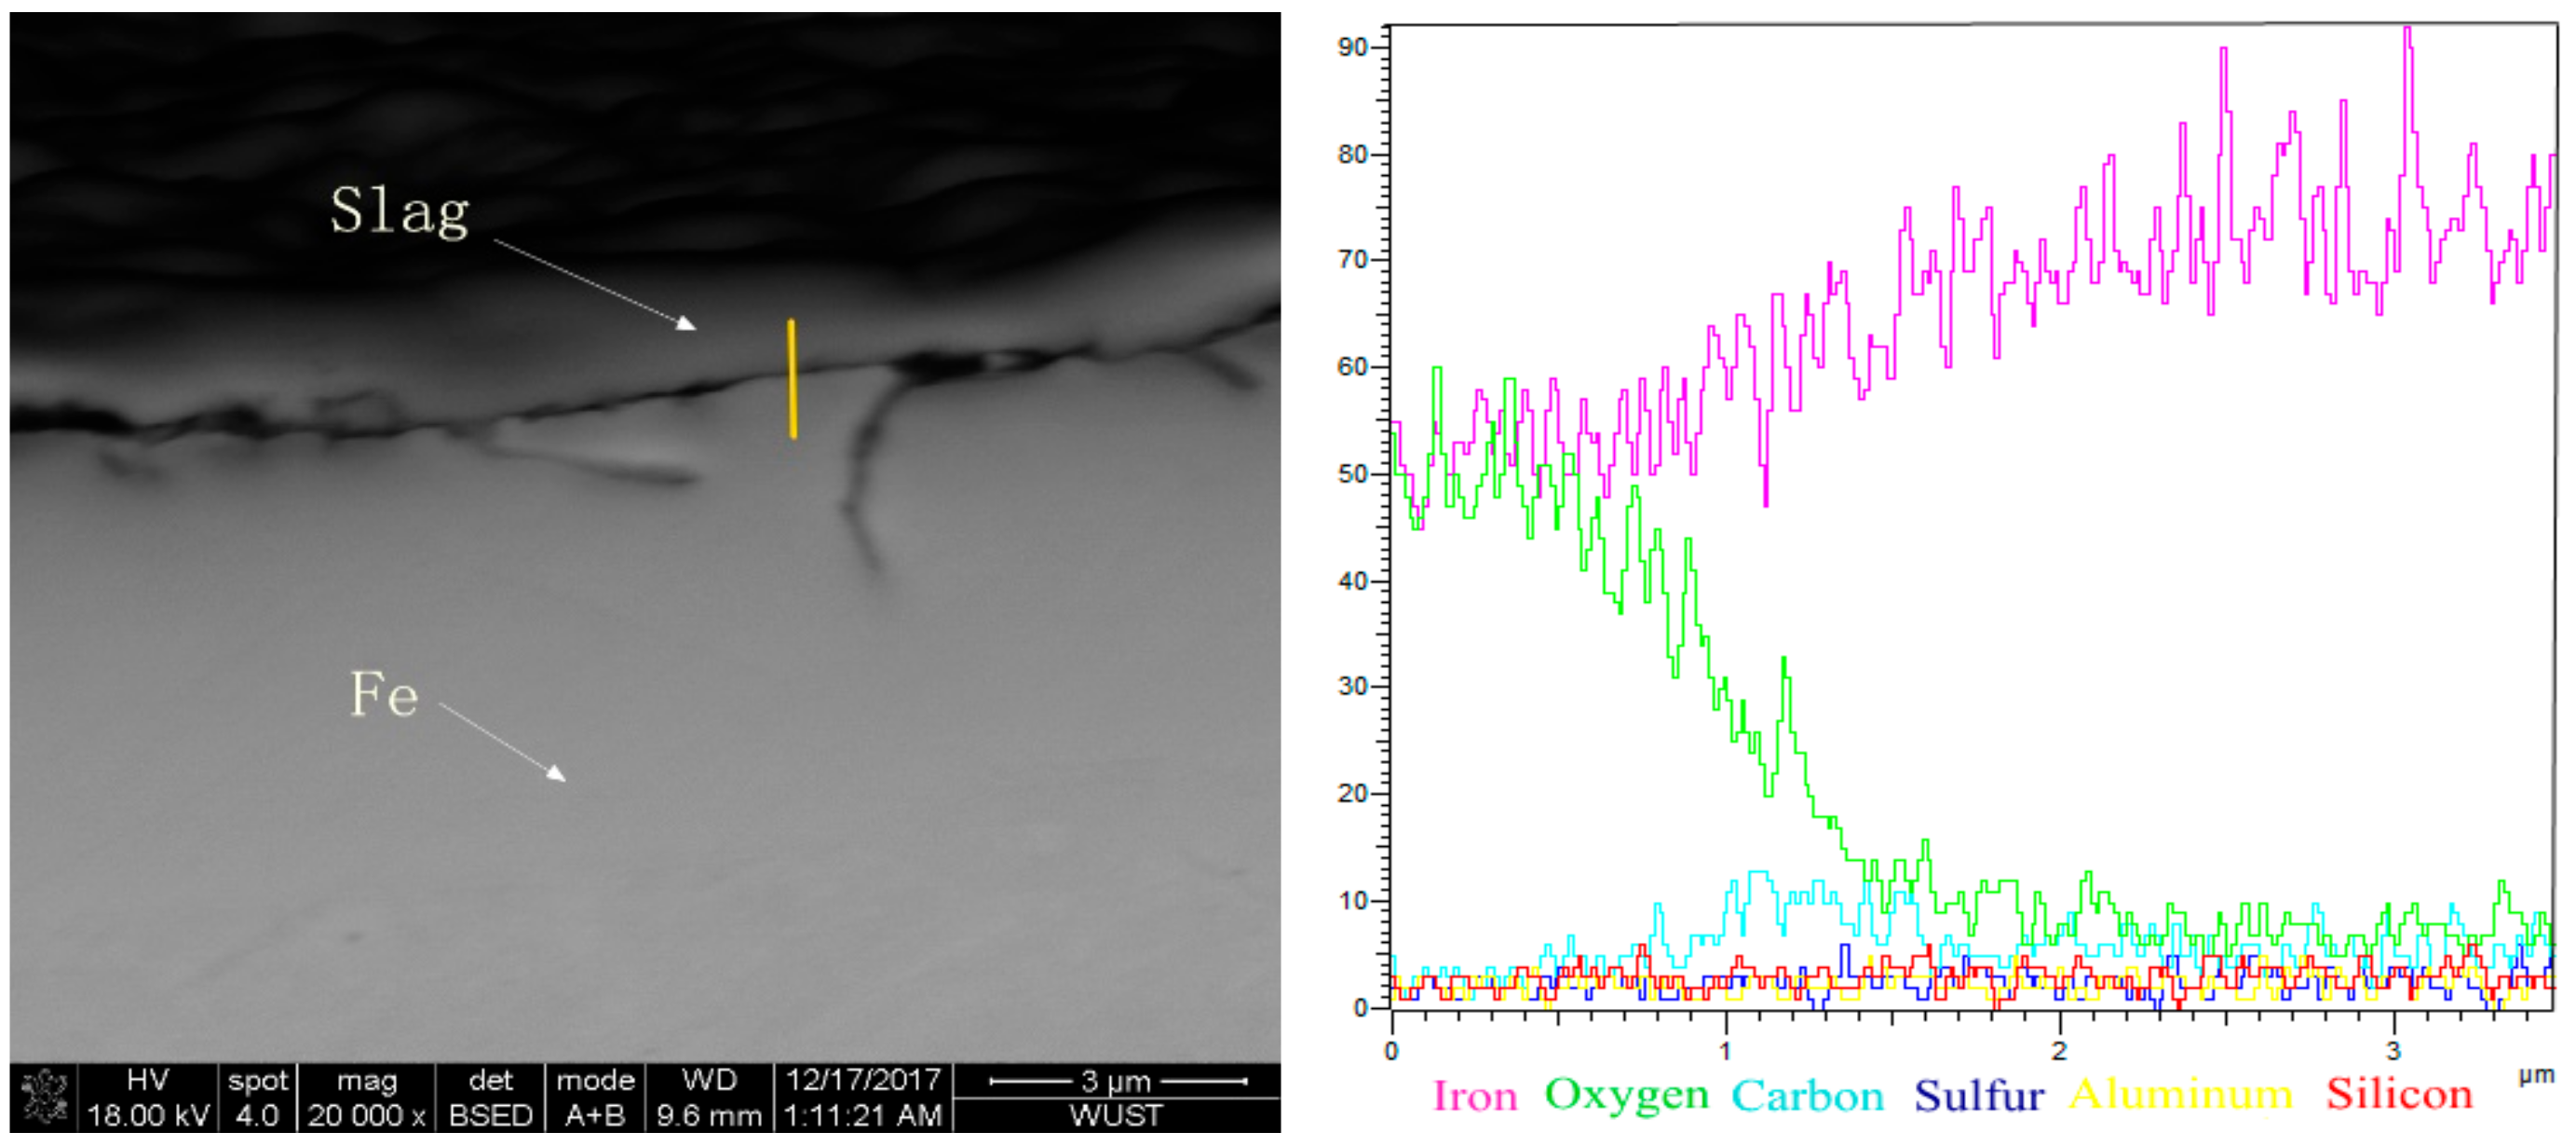
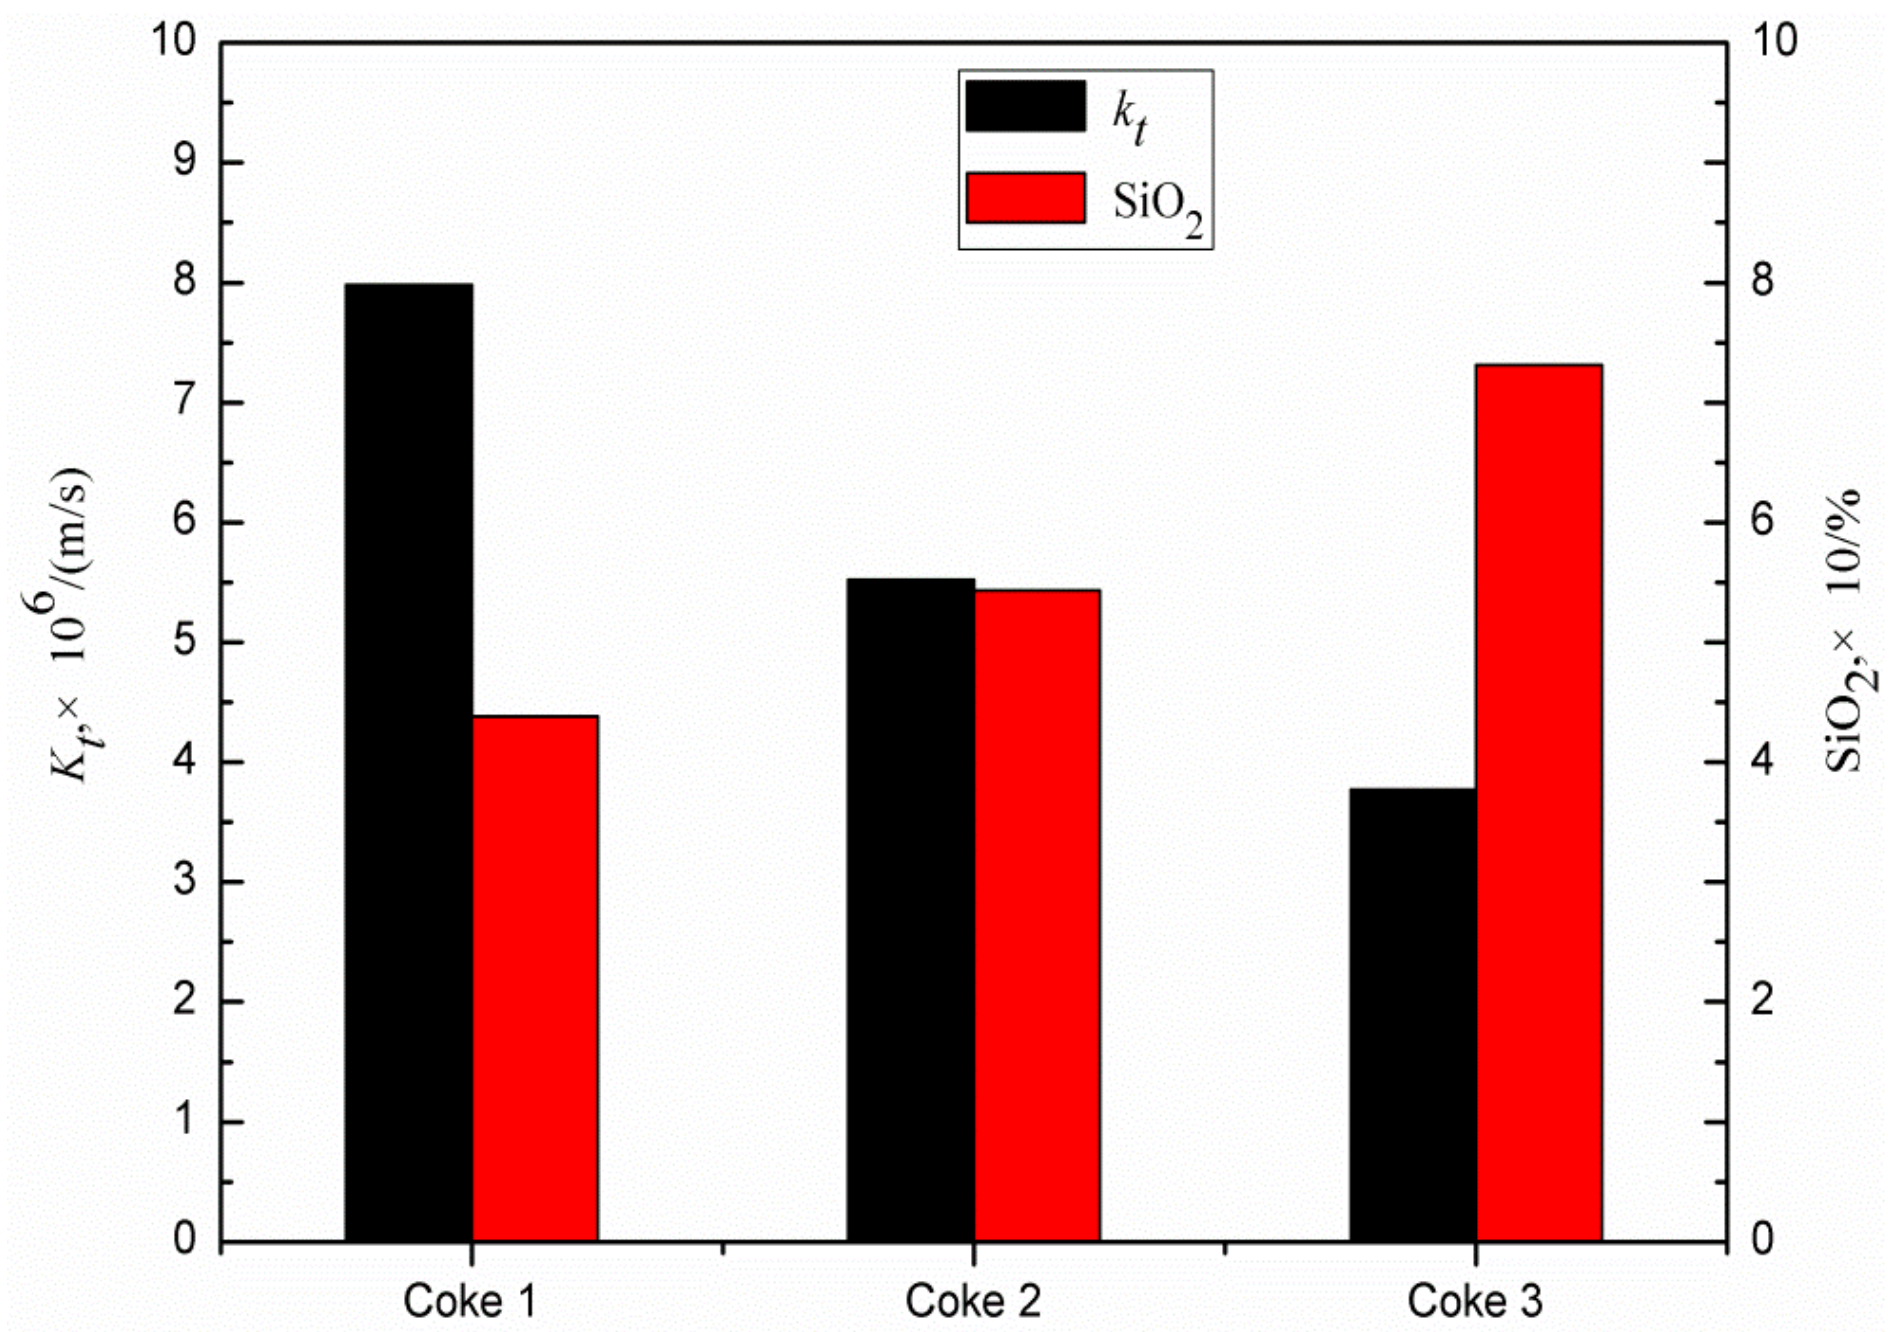
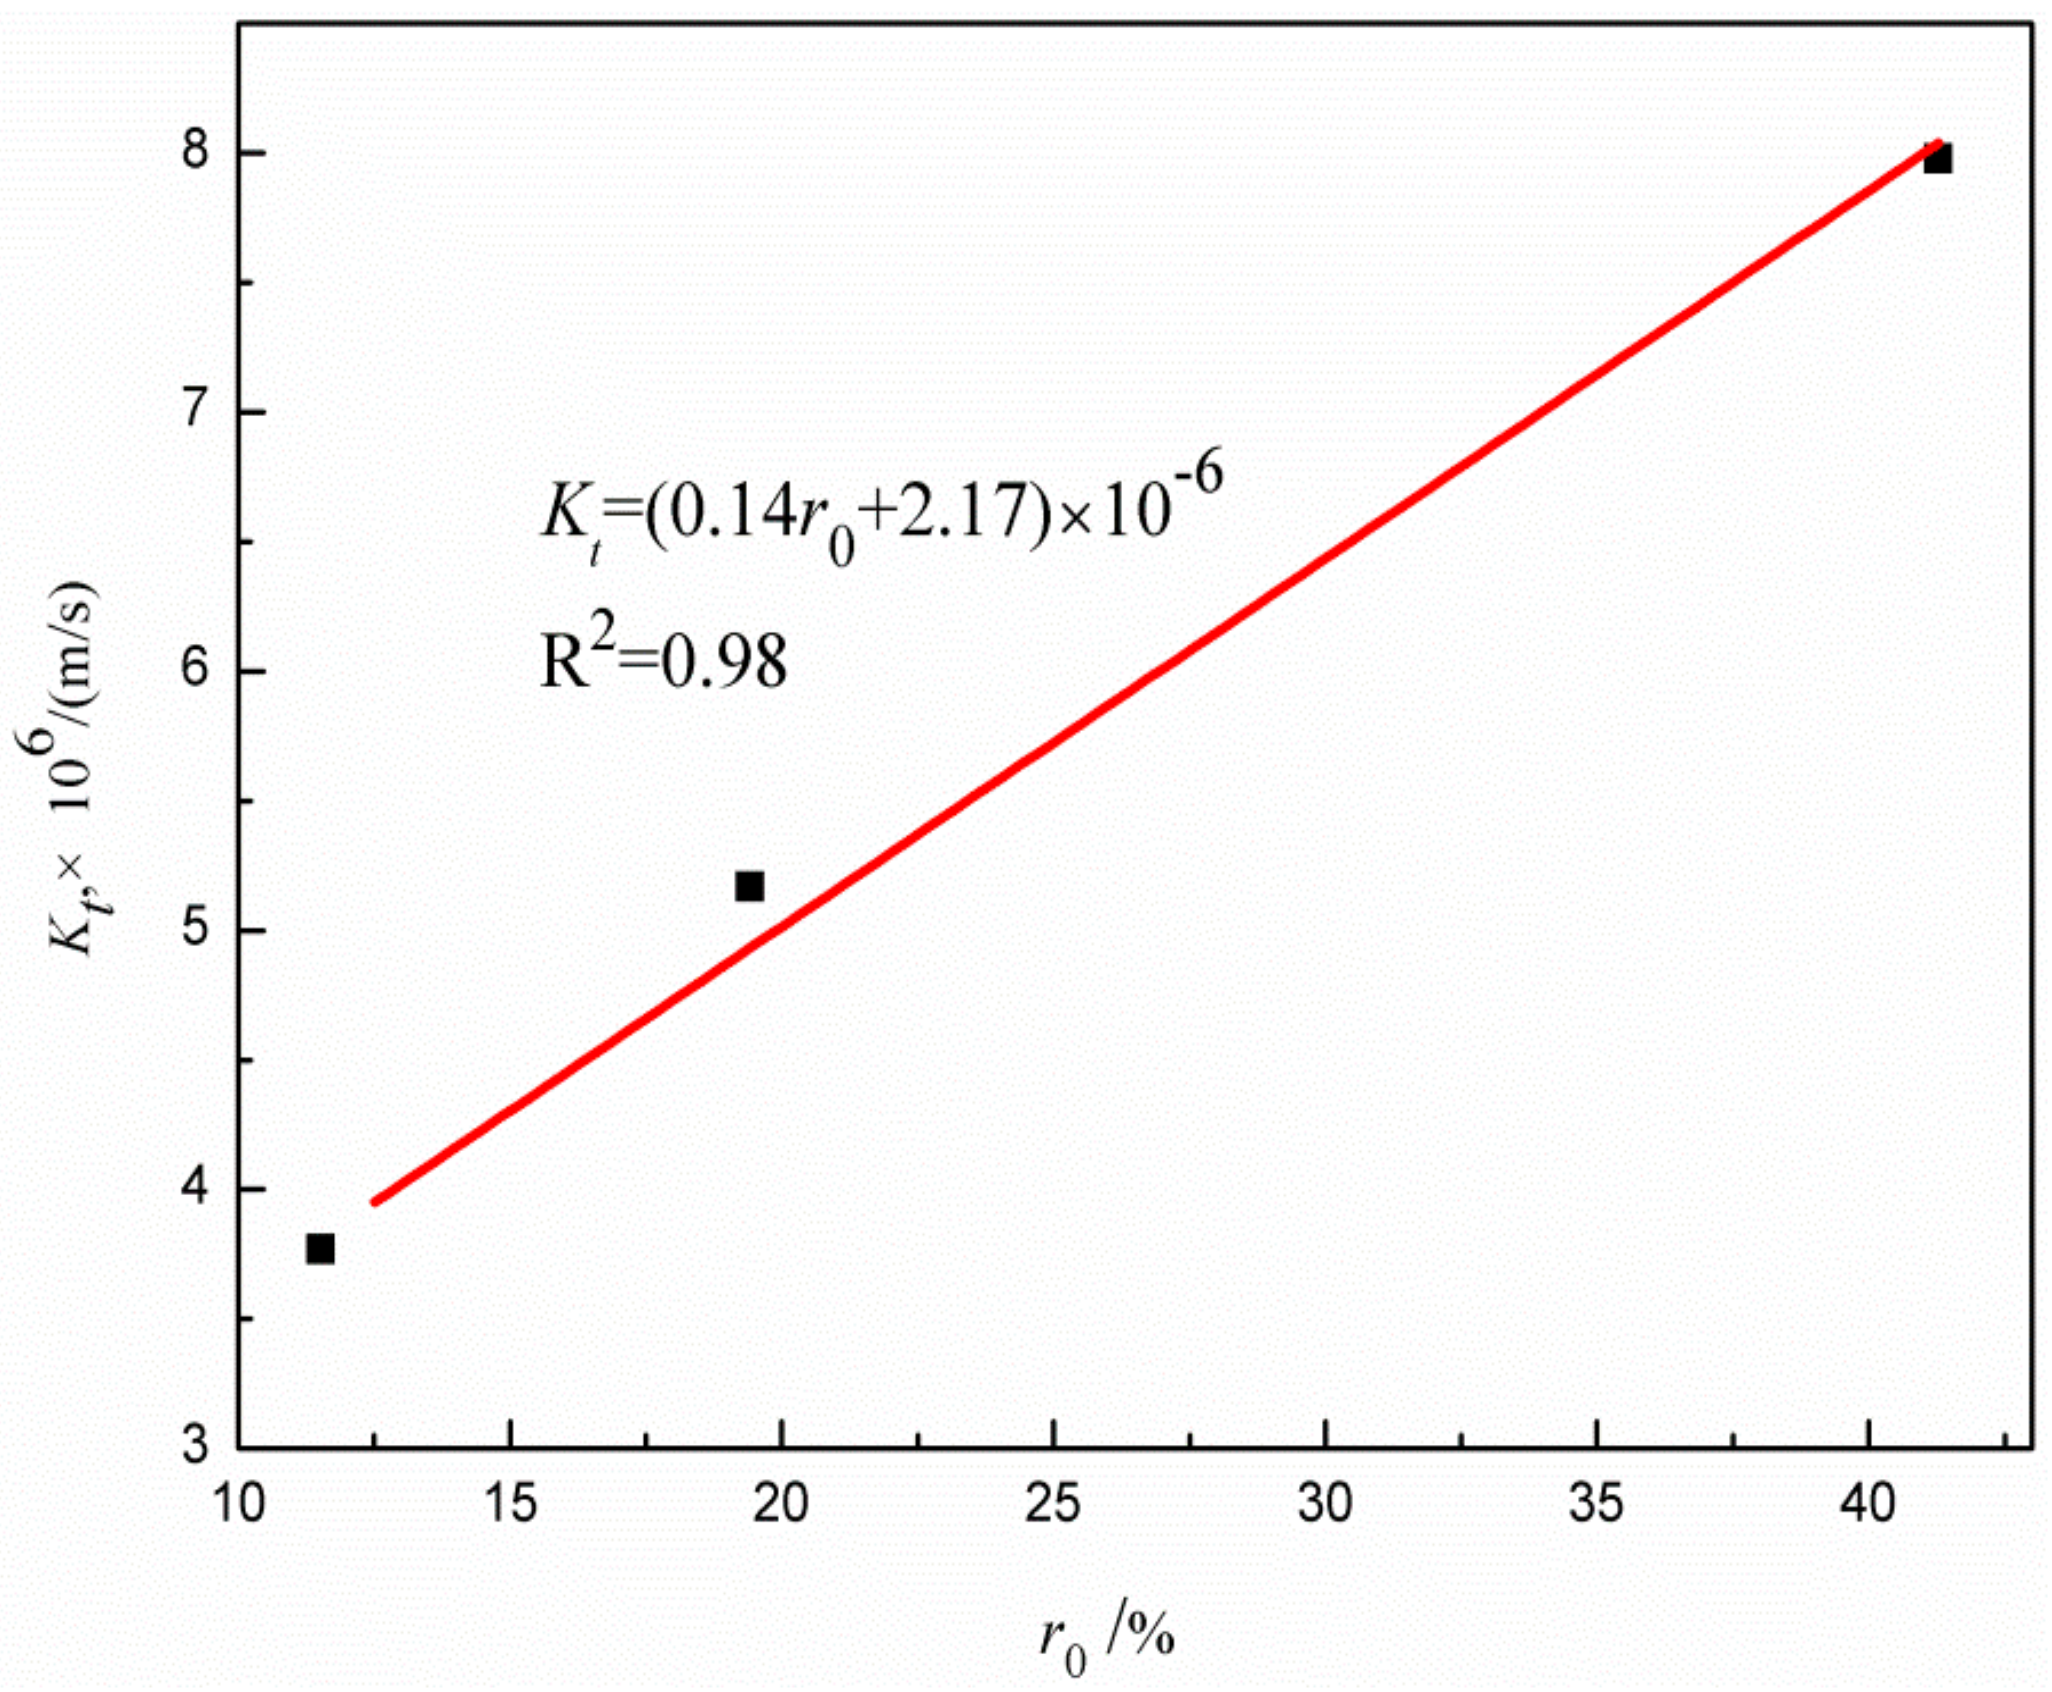
4.3. Effect of Silicon (SiO2) on the Dissolution Rate

As can be seen from Figure 9, high SiO2 contents could remarkably curtail the dissolution rate coefficient. Since SiO2 is a stable compound, its melting temperature is much higher than the furnace temperature, so with the SiO2 content increasing, the interfacial layer liquidus temperature would rise as well. Table 4 and Figure 10 show that the complex compound consisting of SiO2, Al2O3, and CaO features a low melting temperature and high viscosity, which could increase the viscosity of the slag layer covering the coke samples and hinder its dissolution. In addition, a high Si content in the molten iron could inhibit the generation of Fe3C.
.

4.4. Effect of Graphitization Degree on the Dissolution Rate

The existing studies show that in the same hot metal, there is a non-negligible difference between the dissolution rates, k t , of the cokes with similar fixed carbon contents (a diversity of an order of magnitude was observed once [34]). The authors of this essay infer that the trigger might be the graphitization degree of these coke samples, so a calculation of this index was conducted and its influences on the dissolution rate were investigated.
When heated, the microcrystalline structure of the graphite-like layer in the cokes grows with the increasing temperature, and both the distortion and defect in them gradually disappears. In order to describe the degree of this reaction, the notion of graphitization degree ( r 0 ) [35] is introduced, and this parameter can be tested by XRD. According to the relevant research, the graphite interlayer spacing ( d 002 ) and r 0 can be calculated by the classical Scherrer equations [36,37,38]:
r 0 = Δ d Δ 0 = 3.44000 d 002 0.08600 × 100 %
d 002 = λ 2 sin θ 002
where Δ d is the difference value between the interplanar distances of ungraphitized cokes (3.44000 Å) and that of the graphite being tested ( d 002 ), Δ 0 is the difference value between the interplanar distances of ungraphitized cokes (3.44000 Å) and that of the ideal graphite (3.35400 Å), λ is the wavelength of the X-ray, and θ 002 is the corresponding diffraction angle. When λ is fixed, there is a close relationship between r 0 and θ 002 , and the accuracy of the former depends on that of the latter. Besides, different cokes have different θ 002 .
After the three types of coke samples employed were analyzed by XRD, their diffraction angles were acquired, and the graphitization degrees were calculated by Equations (13) and (14). Figure 11 reveals the correlation between the dissolution rate coefficient and the r 0 values of these three types of cokes. It can be seen that the graphitization of coke promotes its dissolution in the hot metal. With the increase of r 0 , the amorphous coke converts into regular graphite, and the hexagonal carbon plane grids are transformed from a two-dimensional out-of-order overlap into a three-dimensional ordered one. Therefore, the binding force between C is enhanced, while that between carbon layers is weakened, which boosts the grain boundary sliding [39,40]. This means that the growth of r 0 could promote the coke layer to fall off and accelerate the coke dissolution.

5. Conclusions

In this paper, the dissolution behavior of three types of cokes in the high temperature zone of a flash ironmaking furnace was observed, and the effects that the ash composition and sulfur content have on the dissolution rate were investigated as well. The conclusions were mainly obtained as follows:
(1) The height change of the molten iron level before and after sampling, which was calculated as 0.074 mm, is comparable the original height of the hot metal, 13.04 mm, so the amount of molten iron meets the requirement of sampling and the decrease of the hot metal height has little influence on the experiment. Regarding the dissolution rate coefficients as constants, some distinctions between the dissolution rate coefficients of different coke samples were found, with this index of 7.98 × 10⁻⁶ m/s in coke 1, 5.17 × 10⁻⁶ m/s in coke 2, and 3.77 × 10⁻⁶ m/s in coke 3.
(2) Regarding the dissolution rate coefficients as a variable, the effects of the coke ash composition on kt were indicated by the impact of the dissolution time. According to the calculations, the dissolution rate coefficient decreases as the dissolution time increases, and the values of kt varied between 3.31 × 10⁻⁶ m/s and 24.93 × 10⁻⁶ m/s in this experiment.
(3) Ash composition is a key factor that influences the rate of carbon dissolution. Silicon in coke, especially the one that exists in the form of oxide, might increase the viscosity of the slag layer covering the coke samples and hinder its dissolution.
(4) The dissolution rate coefficient decreased with the increase of the sulfur content in the iron-carbon melt. The dissolution rate coefficient increased with the increase of the graphitization degree of the coke.
(5) The value of k t in natural convection is mainly controlled by the mass transfer occurring in the liquid boundary layer covering the solid, and the contribution of the interfacial reaction and other factors (aluminum and calcium in the carbon-iron melt) might be relatively negligible.

Author Contributions

Conceptualization, Z.X. and G.M.; methodology, W.Z. and C.L.; validation, F.H. and J.D.; formal analysis, F.H.; investigation, W.Z. and C.L.; resources, W.Z. and Z.X.; writing—original draft preparation, W.Z. and F.H.; writing—review and editing, J.D. and C.L.

Funding

This research was funded by the Natural Science Foundation of Hubei Province, grant number 2017CFB294, and National Natural Science Foundation of China (NSFC), grant number 51804228 and 51804230. The APC was funded by NSFC.

Conflicts of Interest

The authors declare no conflict of interest.

References

  1. Zhou, Y.S.; Qian, H.; Zhang, Y.P.; Feng, H.T. Development Direction and Strategy of Non-Blast Furnace Ironmaking Technology; World Steel: Brussels, Belgium, 2009; pp. 1–8. [Google Scholar]
  2. Qin, M.S. Non-Blast Furnace Ironmaking (Direct Reduction and Smelting Reduction); Metallurgical Industry Press: Beijing, China, 1988; pp. 1–178. [Google Scholar]
  3. Tang, E.; Zhou, Q.; Zhai, X.H.; Ruan, J.B. Non-blast furnace ironmaking technology suitable for the development of China. Iron Smelt. 2007, 26, 59–62. [Google Scholar]
  4. Chu, M.S.; Zhao, Q.J. Chinese development status and Prospect of non-blast furnace ironmaking. Chin. Metall. 2008, 18, 1–9. [Google Scholar]
  5. Ma, X.X. Status and Development of Direct Reduction Iron in the World. Available online: http://www.cnki.com.cn/Article/CJFDTotal-YJGL200602013.htm (accessed on 1 February 2006).
  6. Markotić, A.; Dolić, N.; Trujić, V. State of the direct reduction and reduction smelting processes. J. Min. Metall. 2002, 38, 123–141. [Google Scholar] [CrossRef]
  7. Liu, S.L.; Bai, C.G. Progress and prospect of direct reduction technology. J. Iron Steel Res. 2011, 23, 1. [Google Scholar] [CrossRef]
  8. Fan, X.H.; Qiu, G.Z.; Jiang, T.; Zhu, D.Q.; Huang, Z.C.; Xu, J.C. The present situation and development prospect of direct reduction iron production in China. Ironmaking 2002, 21, 53–55. [Google Scholar]
  9. Gojic, M.; Kozuh, S. Development of direct reduction process and smelting reduction processes for the steel production. Kem. U Ind. 2006, 55, 1338–1341. [Google Scholar]
  10. Dong, F.K. Smelting Reduction Process and Development. Available online: http://www.cnki.com.cn/Article/CJFDTotal-DTSJ201411200.htm (accessed on 20 November 2014).
  11. Jouhari, A.K. Smelting Reduction Technologies for Direct Ironmaking. Miner. Process. Extr. Metall. Rev. 1993, 12, 223–255. [Google Scholar]
  12. Wang, W.; Dai, B.; Xu, R.; Schenk, J.; Wang, J.; Xue, Z. The Effect of H2O on the Reactivity and Microstructure of Metallurgical Coke. Steel Res. Int. 2017, 88, e201700063. [Google Scholar] [CrossRef]
  13. Zhang, W.; Zhang, J.H.; Xue, Z.L. Exergy analyses of the oxygen blast furnace with top gas recycling process. Energy 2017, 121, 135–146. [Google Scholar] [CrossRef]
  14. Zhang, W.; Zhang, J.H.; Xue, Z.L.; Zou, Z.; Qi, Y. Unsteady analyses of the top gas recycling oxygen blast furnace. ISIJ Int. 2016, 56, 1358–1367. [Google Scholar] [CrossRef]
  15. Zhang, W.; Xue, Z.L.; Zhang, J.H.; Wang, W.; Cheng, C.; Zou, Z. Medium Oxygen Enriched Blast Furnace with Top Gas Recycling Strategy. J. Iron Steel Res. Int. 2017, 24, 778–786. [Google Scholar] [CrossRef]
  16. Mou, H.Y. Development of new process of smelting reduction ironmaking. Iron Steel 1992, 2, 59–64. [Google Scholar]
  17. Du, T. Research and development of smelting reduction technology in China. Iron Steel 1993, 9, 82–85. [Google Scholar]
  18. Zhou, Y.S. Review of current development of coal-based smelting reduction ironmaking process. Iron Steel 2005, 11, 1–8. [Google Scholar]
  19. Goodman, N.; Dry, R. HIsmelt Plant Ramp-Up. In Proceedings of the International Congress on the Science and Technology of Ironmaking, Shanghai, China, 20–22 October 2009; pp. 1228–1233. [Google Scholar]
  20. Gong, S.S.; Dai, X.; Zhang, W.H. Study on non-blast furnace flash iron smelting. Non Ferr. Metall. Des. Res. 2015, 36, 34–35. [Google Scholar]
  21. Song, X.M.; Xia, M. Flash iron technology. In Proceedings of the 2014 Annual Conference on Non-blast furnace Ironmaking, The Chinese Society for Metals, Suzhou, China, 23 April 2015. [Google Scholar]
  22. Yuan, Z.X.; Sohn, H.Y.; Olivas-Martinez, M. Re-oxidation kinetics of flash-reduced iron particles in H2-H2O (g) atmosphere relevant to a novel flash ironmaking process Metall. Mater. Trans. B 2013, 44B, 1520–1530. [Google Scholar] [CrossRef]
  23. Sohn, H.Y.; Mohassab, Y. Development of a novel flash ironmaking technology with greatly reduced energy consumption and CO2 emission. J. Sustain. Metall. 2016, 2, 216–227. [Google Scholar] [CrossRef]
  24. Wang, X.L. Iron and Steel Metallurgy; Metallurgical Industry Press: Beijing, China, 2000; pp. 1–279. [Google Scholar]
  25. Mourao, M.B.; Murthy, G.G.K.; Elliott, J.F. Experimental investigation of dissolution rates of carbonaceous materials in liquid iron-carbon melts. Metall. Mater. Trans. B 1993, 24, 629–637. [Google Scholar] [CrossRef]
  26. Cham, S.T.; Sahajwalla, V.; Sakurovs, R.; Sun, H.; Dubikova, M. Factors influencing carbon dissolution from cokes into liquid iron. ISIJ Int. 2004, 44, 1835–1841. [Google Scholar] [CrossRef]
  27. Huang, X.H. Iron and Steel Metallurgy Principle, 4th ed.; Metallurgical Industry Press: Beijing, China, 2013; pp. 132–147. [Google Scholar]
  28. Orsten, S.; Oeters, F. Process Technology Conference Proceedings; Institute for Scientific Information: Philadelphia, PA, USA, 1986; Volume 6, pp. 143–155. [Google Scholar]
  29. Sun, H. Factors influencing dissolution of carbonaceous materials in liquid iron. Metall. Mater. Trans. B 2005, 36, 893. [Google Scholar] [CrossRef]
  30. Wu, C.; Sahajwalla, V. Dissolution rates of coals and graphite in Fe-C-S melts in direct ironmaking: Dependence of carbon dissolution rate on carbon structure. Metall. Mater. Trans. B 2000, 31, 215–216. [Google Scholar] [CrossRef]
  31. Wu, C.; Wiblen, R.; Sahajwalla, V. Influence of ash on mass transfer and interfacial reaction between natural graphite and liquid iron. Metall. Mater. Trans. B 2000, 31, 1099–1104. [Google Scholar] [CrossRef]
  32. Jang, D.; Kim, Y.; Shin, M.; Lee, J. Kinetics of Carbon Dissolution of Coke in Molten Iron. Metall. Mater. Trans. B 2012, 43, 1308–1314. [Google Scholar] [CrossRef]
  33. Chapman, M.W.; Monaghan, B.J.; Nightingale, S.A.; Mathieson, J.G.; Nightingale, R.J. Formation of a Mineral Layer during Coke Dissolution into Liquid Iron and Its Influence on the Kinetics of Coke Dissolution Rate. Metall. Mater. Trans. 2008, 39, 418–430. [Google Scholar] [CrossRef] [Green Version]
  34. Tsuey, C.S.; Khanna, R.; Sahajwalla, V.; Sakurovs, R.; French, D. Influence of Mineral Matter on Carbon Dissolution from Metallurgical Coke into Molten Iron: Interfacial Phenomena. ISIJ Int. 2009, 49, 1860–1867. [Google Scholar] [Green Version]
  35. Liang, N.; Wu, K.; Sun, C.; Zhan, W.; Pang, Q.; Zhang, J.; He, Z.; University of Science and Technology Beijing. University of Science and Technology Beijing; Liaoning University of Science and Technology. Effect of blast furnace coke graphitizing its high temperature metallurgical properties. Metall. Energy 2018, 37, 29–33. [Google Scholar]
  36. Duan, K.H.; Cao, Q.Y.; Bu, J.Y.; Yang, Z.L. Correlation Analysis on Coke Reaction Indexing and Coke Strength after Reaction towards Degree of Graphitization. Kunming Iron Steel Technol. 2009, 4, 32–36. [Google Scholar]
  37. Zhang, S.F.; Peng, H.J.; Zhang, X.; Liu, W.; Wen, L.I.; Qiu, G. Structure characterization and metallurgical properties of the chars formed by devolatilization of lump coals. Fuel Process. Technol. 2015, 129, 174–182. [Google Scholar] [CrossRef]
  38. Nabais, J.M.; Laginhas, C.E.; Carrott, P.J.; Carrott, M.R. Production of activated carbons from almond shell. Fuel Process. Technol. 2011, 92, 234–240. [Google Scholar] [CrossRef]
  39. Li, K.; Zhang, J.; Liu, Y.; Barati, M.; Liu, Z.; Zhong, J.; Su, B.; Wei, M.; Wang, G.; Yang, T. Graphitization of coke and its interaction with slag in the hearth of a blast furnace. Metall. Mater. Trans. B 2016, 47, 811–818. [Google Scholar] [CrossRef]
  40. Deng, S.Q. Study on Carbon Behavior in Molten Iron. Available online: http://www.cqvip.com/qk/95175X/199703/2730778.html (accessed on 27 March 1997).
Figure 1. Schematic diagram of the experimental device.
Metals 09 00470 g001
Figure 2. The relationship between W cd ( A s ( C s C b ) ) 1 and t of different cokes and ferrous materials. (a) Coke 1 (R = 96.22%, mci = 7.5 g), (b) coke 1 (R = 99.95%, mci = 0 g), (c) coke 2 (R = 99.95%, mci = 0 g), (d) coke 3 (R = 99.95%, mci = 0 g).
Metals 09 00470 g002
Figure 3. The relationship between k t and t of different cokes. (a) Coke 1 (R = 96.22%, mci = 7.5 g), (b) coke 1 (R = 99.95%, mci = 0 g), (c) coke 2 (R = 99.95%, mci = 0 g), (d) coke 3 (R = 99.95%, mci = 0 g).
Metals 09 00470 g003
Figure 4. SEM images before (left) and after (right) the reaction of the coke surface.
Metals 09 00470 g004
Figure 5. SEM images (a,b) and EDS analyses of the reacted coke.
Metals 09 00470 g005
Figure 6. CaO-SiO2-Al2O3 slag system phase diagram of the partially dissolved coke sample surface.
Metals 09 00470 g006
Figure 7. SEM image and EDS analyses of the reacted iron sample.
Metals 09 00470 g007
Figure 8. Effect of sulfur content in the iron-carbon bath on the k t of coke samples. (a) Coke 1 (R = 96.22%, mci = 7.5 g), (b) coke 1 (R = 99.95%, mci = 0 g), (c) coke 2 (R = 99.95%, mci = 0 g), (d) coke 3 (R = 99.95%, mci = 0 g).
Metals 09 00470 g008
Figure 9. Effect of silicon content in the iron-carbon bath on k t
Metals 09 00470 g009
Figure 10. CaO-SiO2-Al2O3 slag system phase diagram of unreacted coke samples.
Metals 09 00470 g010
Figure 11. The relationship between the values of k t and r 0 .
Metals 09 00470 g011
Table 1. The chemical composition of reduced iron powder (wt%).
MaterialFeOMFeTFeSulfur CompoundsInsoluble Matter
Reduced iron powder4.7694.1197.81≤0.06≤0.1
Table 2. The chemical composition of electrolytic iron (wt%).
MaterialFeAlSiSCuMnP
Electrolytic iron99.950.0260.0020.0110.0040.0010.001
Table 3. The chemical composition of coke samples (wt%).
SamplesCAdVdSH2O
Coke 185.3213.740.940.350.05
Coke 283.8213.182.580.720.98
Coke 385.8812.991.130.300.87
Table 4. The chemical composition of the ash in coke samples (wt%).
SamplesSiO2Al2O3Fe2O3CaOMgONa2O
Coke 149.8437.154.346.981.240.38
Coke 255.3021.667.426.723.760.58
Coke 373.1416.014.445.350.341.42
Table 5. The typical values of k t in each experimental condition.
SamplesMaterialT/KR/% m ci /gt/minWcd/g k t × 10 6 ( m / s )
Coke 1reduced iron powder187396.2201208.855.48
Coke 1reduced iron powder187396.227.51209.616.50
Coke 1electrolytic iron187399.95012010.557.98
Coke 2electrolytic iron187399.9501208.155.17
Coke 3electrolytic iron187399.9501208.913.77
Table 6. Chemical composition of slag-like found on partially dissolved coke samples.
At a Point AverageElemental Analysis (wt pct)
FeAlSiCaKNaP
Coke 135.6818.1231.257.283.362.13-
Coke 236.5617.0233.567.362.841.76-
Coke 337.2517.0735.458.242.181.84-
At a Point AverageOxide, Estimated Using Elemental Analysis (wt pct)
Al2O3CaOSiO2K2ONa2OP2O5
Coke 128.228.5457.503.362.38-
Coke 226.858.6159.702.842.00-
Coke 322.279.6363.262.861.98-

