Article

Effect of Thermodynamic Melt Formation Characteristics on Liquid Phase Fluidity of Iron Ore in the Sintering Process

1
School of Metallurgical and Ecological Engineering, University of Science and Technology Beijing, Beijing 100083, China
2
Meishan Iron & Steel Co. LTD, Nanjing 210012, Jiangsu, China
*
Author to whom correspondence should be addressed.
Metals 2019, 9(4), 404; https://doi.org/10.3390/met9040404
Submission received: 1 March 2019 / Revised: 24 March 2019 / Accepted: 26 March 2019 / Published: 2 April 2019
(This article belongs to the Special Issue Selected Papers from 8th ICSTI 2018)

Abstract

:
The liquid phase fluidity of iron ore is a vital index of fundamental sintering characteristics. In this paper, FactSage software and a visible microsintering test device were used to research the influence of the thermodynamic melt characteristics on the liquid phase fluidity under fixed CaO content conditions. The results show that the laws governing liquid phase fluidity of iron ore are significantly different with a fixed alkalinity and fixed CaO content of the sample. The liquid phase content at the sintering temperature is the most important thermodynamic melt formation characteristic affecting the liquid phase fluidity. In addition to the liquid phase content, other minerals also have a greater impact on liquid phase fluidity. Decreasing the viscosity of the liquid phase improves the liquid phase fluidity of the iron ore, and the effect of the SiO2 content of the iron ore on the mixed phase viscosity is greater than that of the Al2O3 content.

1. Introduction

Sinter is the main raw material for blast furnace ironmaking in China, and the quality of the sinter directly affects the stable operation of blast furnace ironmaking [1] and the economic and technical indexes [2,3]. Therefore, improving the yield and quality of sinter is of great practical significance for an energy-saving and efficient ironmaking process. The melt formation capacity of the adhesive powder and the bonding effect between each component have vital effects on the sinter strength. Wu et al. [4] first proposed the concept of liquid phase fluidity, which is a very important index of the fundamental sintering characteristics of iron ore. The fluidity of the liquid phase reflects the effective bonding range in the bonding phase. A suitable liquid phase fluidity could ensure a solid-liquid contact area, which can result in sufficient bonding strength. Thus, the liquid phase fluidity of iron ore is very important for optimizing ore matching [4,5,6,7].
In the past, study of the liquid phase fluidity of iron ore was carried out at a fixed sample alkalinity, Ratio of CaO content to SiO2 content in the samples, (such as sample alkalinity is = 4.0), which led to a high SiO2 content of iron ore being allocated with more CaO reagent [8,9]. However, for a practical sintering process, enterprises commonly need to use a variety of iron ores to maintain the SiO2 content of the mixed ore in a certain range (approximately 4.5~5.5 wt%) in order to obtain better sintering technology and economic indicators. As a result, the SiO2 content in sinter could be regarded as a fixed value. In addition, as the blast furnace for sinter alkalinity has a certain requirement, the proportion of calcium flux is basically constant in general. Assuming that the different kinds of fine powders (e.g., iron ore, flux, fuel) in the adhering fines are evenly mixed, the probability that the various iron ore powders contact the flux is similar. Thus, the sample model of different iron ore powders with the same proportion of calcium flux could be abstracted from the part of adhering fines in the sintering quasi-particle model. Therefore, the contact state between iron ore particles and flux in adhering fine powder and the formation condition of primary melt can be better simulated by using fixed calcium oxide-specific volume agent content in order to evaluate the melt formation capacity and the liquid phase fluidity of each iron ore in the mixed ore adhering fines to more accurately obtain the influence of the self-characteristics of iron ore on its liquid phase fluidity.
Although experimental studies on the liquid phase fluidity of iron ore have been extensively conducted, there have been few studies on the relationship between the liquid phase fluidity and the thermodynamic equilibrium phase in sintering. Lv et al. [10] studied the liquid phase formulation during the sintering and the effect of the chemical compositions on the liquid projection by FactSage thermodynamic calculation, and the calculation values were compared with experimental measured results. It was found that the calculations of the mass of liquid phase generation cannot give a very good and accurate agreement with the measurement of the melting behavior of the sample quantificationally, but for the ability of the liquid phase formation, the thermodynamic calculations can give a useful and relatively accurate information. It should be noted that the above studies were conducted at a fixed alkalinity (such as the ratio of CaO content to SiO2 content in the samples is four); however, research on the liquid phase fluidity of different iron ores and its influencing factors under the condition of a fixed CaO content (such as the CaO mass content in the samples is 15%) has not been reported, especially the thermodynamic analysis of the liquid phase formation conditions, such as the melt formation temperature, mass of the liquid phase and melt viscosity.
In this study, a visible microsintering test device was used to measure the generation temperature of the effective liquid phase and the liquid phase fluidity of iron ore with a fixed CaO mass content. Moreover, the melt formation temperature, liquid phase content and liquid viscosity under different sintering temperatures were calculated by FactSage 7.0 software to study the influence of these thermodynamic melt formation characteristics on the liquid phase fluidity of iron ore in sintering process.

2. Materials and Methods

2.1. Materials

The small particles of iron ore are easier to adhere to flux and coke particles during mixing and granulating process result in primary liquid phase forms within adhering fines layer. [11] Therefore, the chemical compositions of fine ores, 0.5-mm in diameter, were analyzed by the X-ray fluorescence and chemical analysis, as Table 1 shown. Among them, OA, OB, OC and OD are Australian iron ore, OE and OF are Brazil hematite, OG, OH, OI are three kinds of concentrate fines.

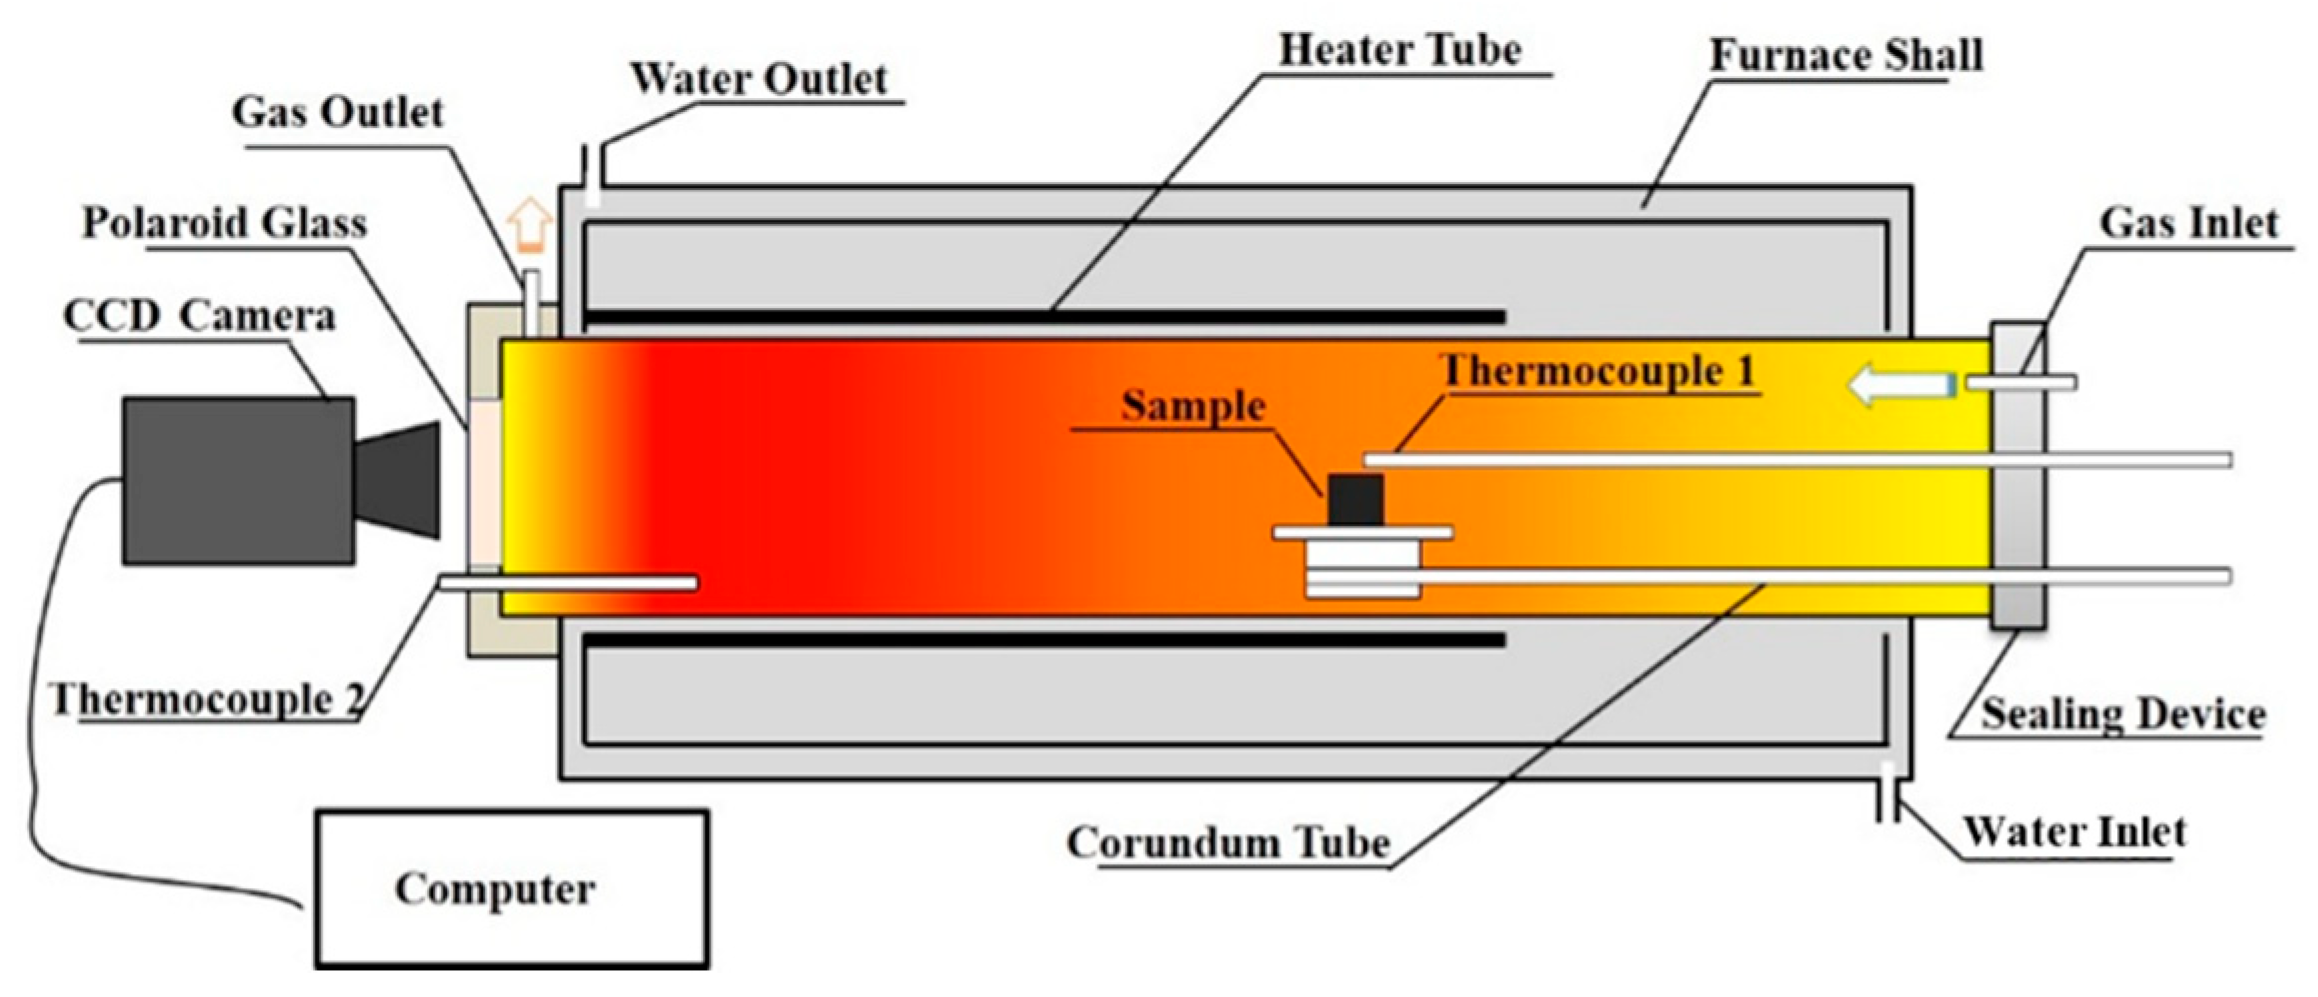
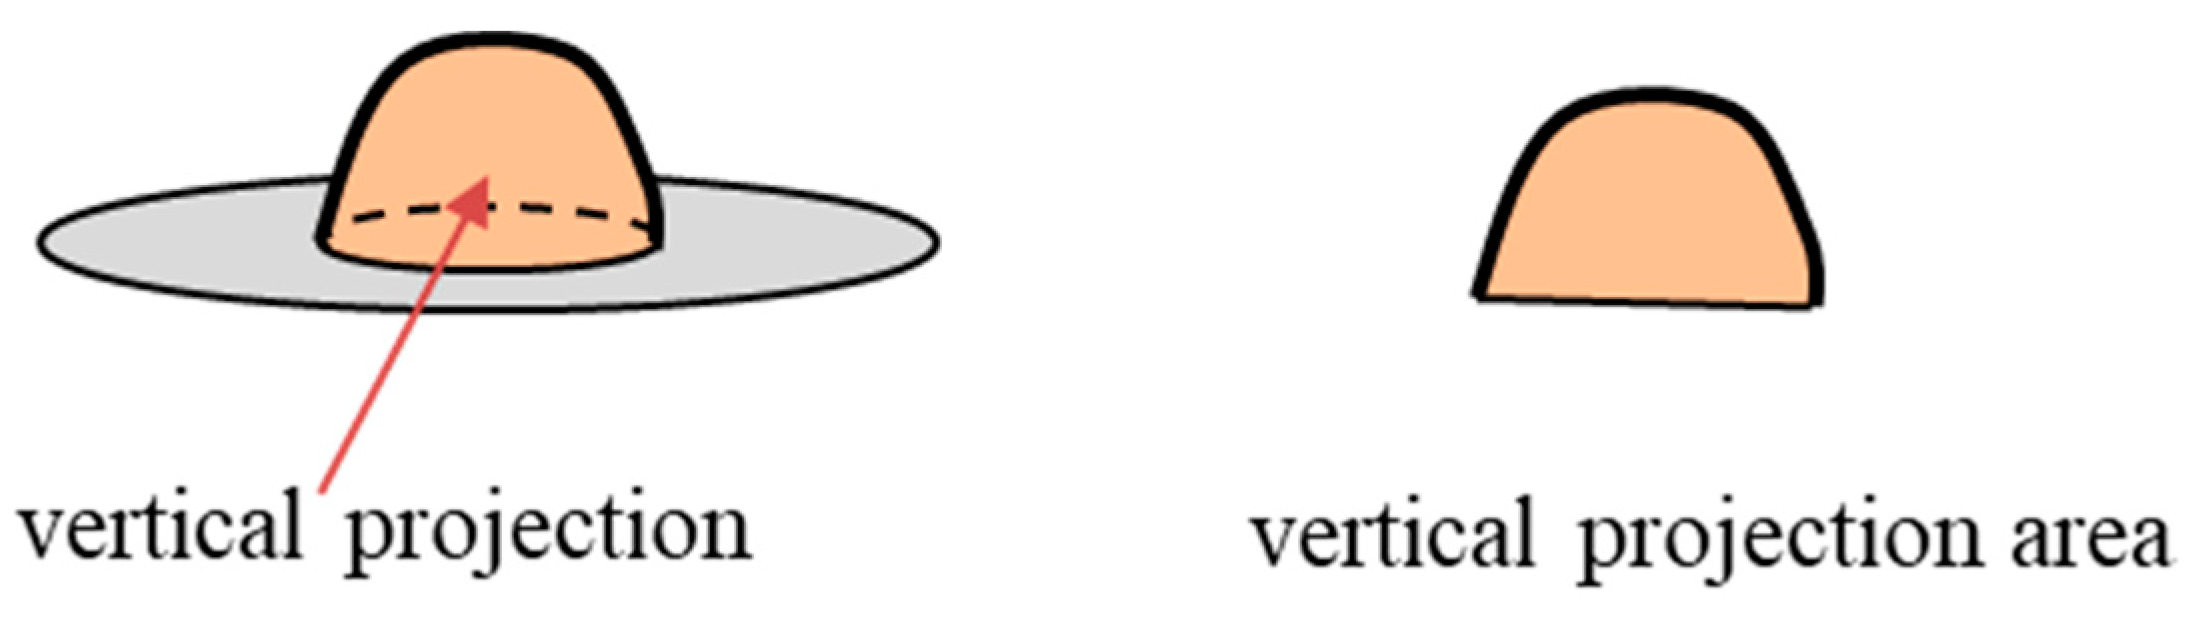
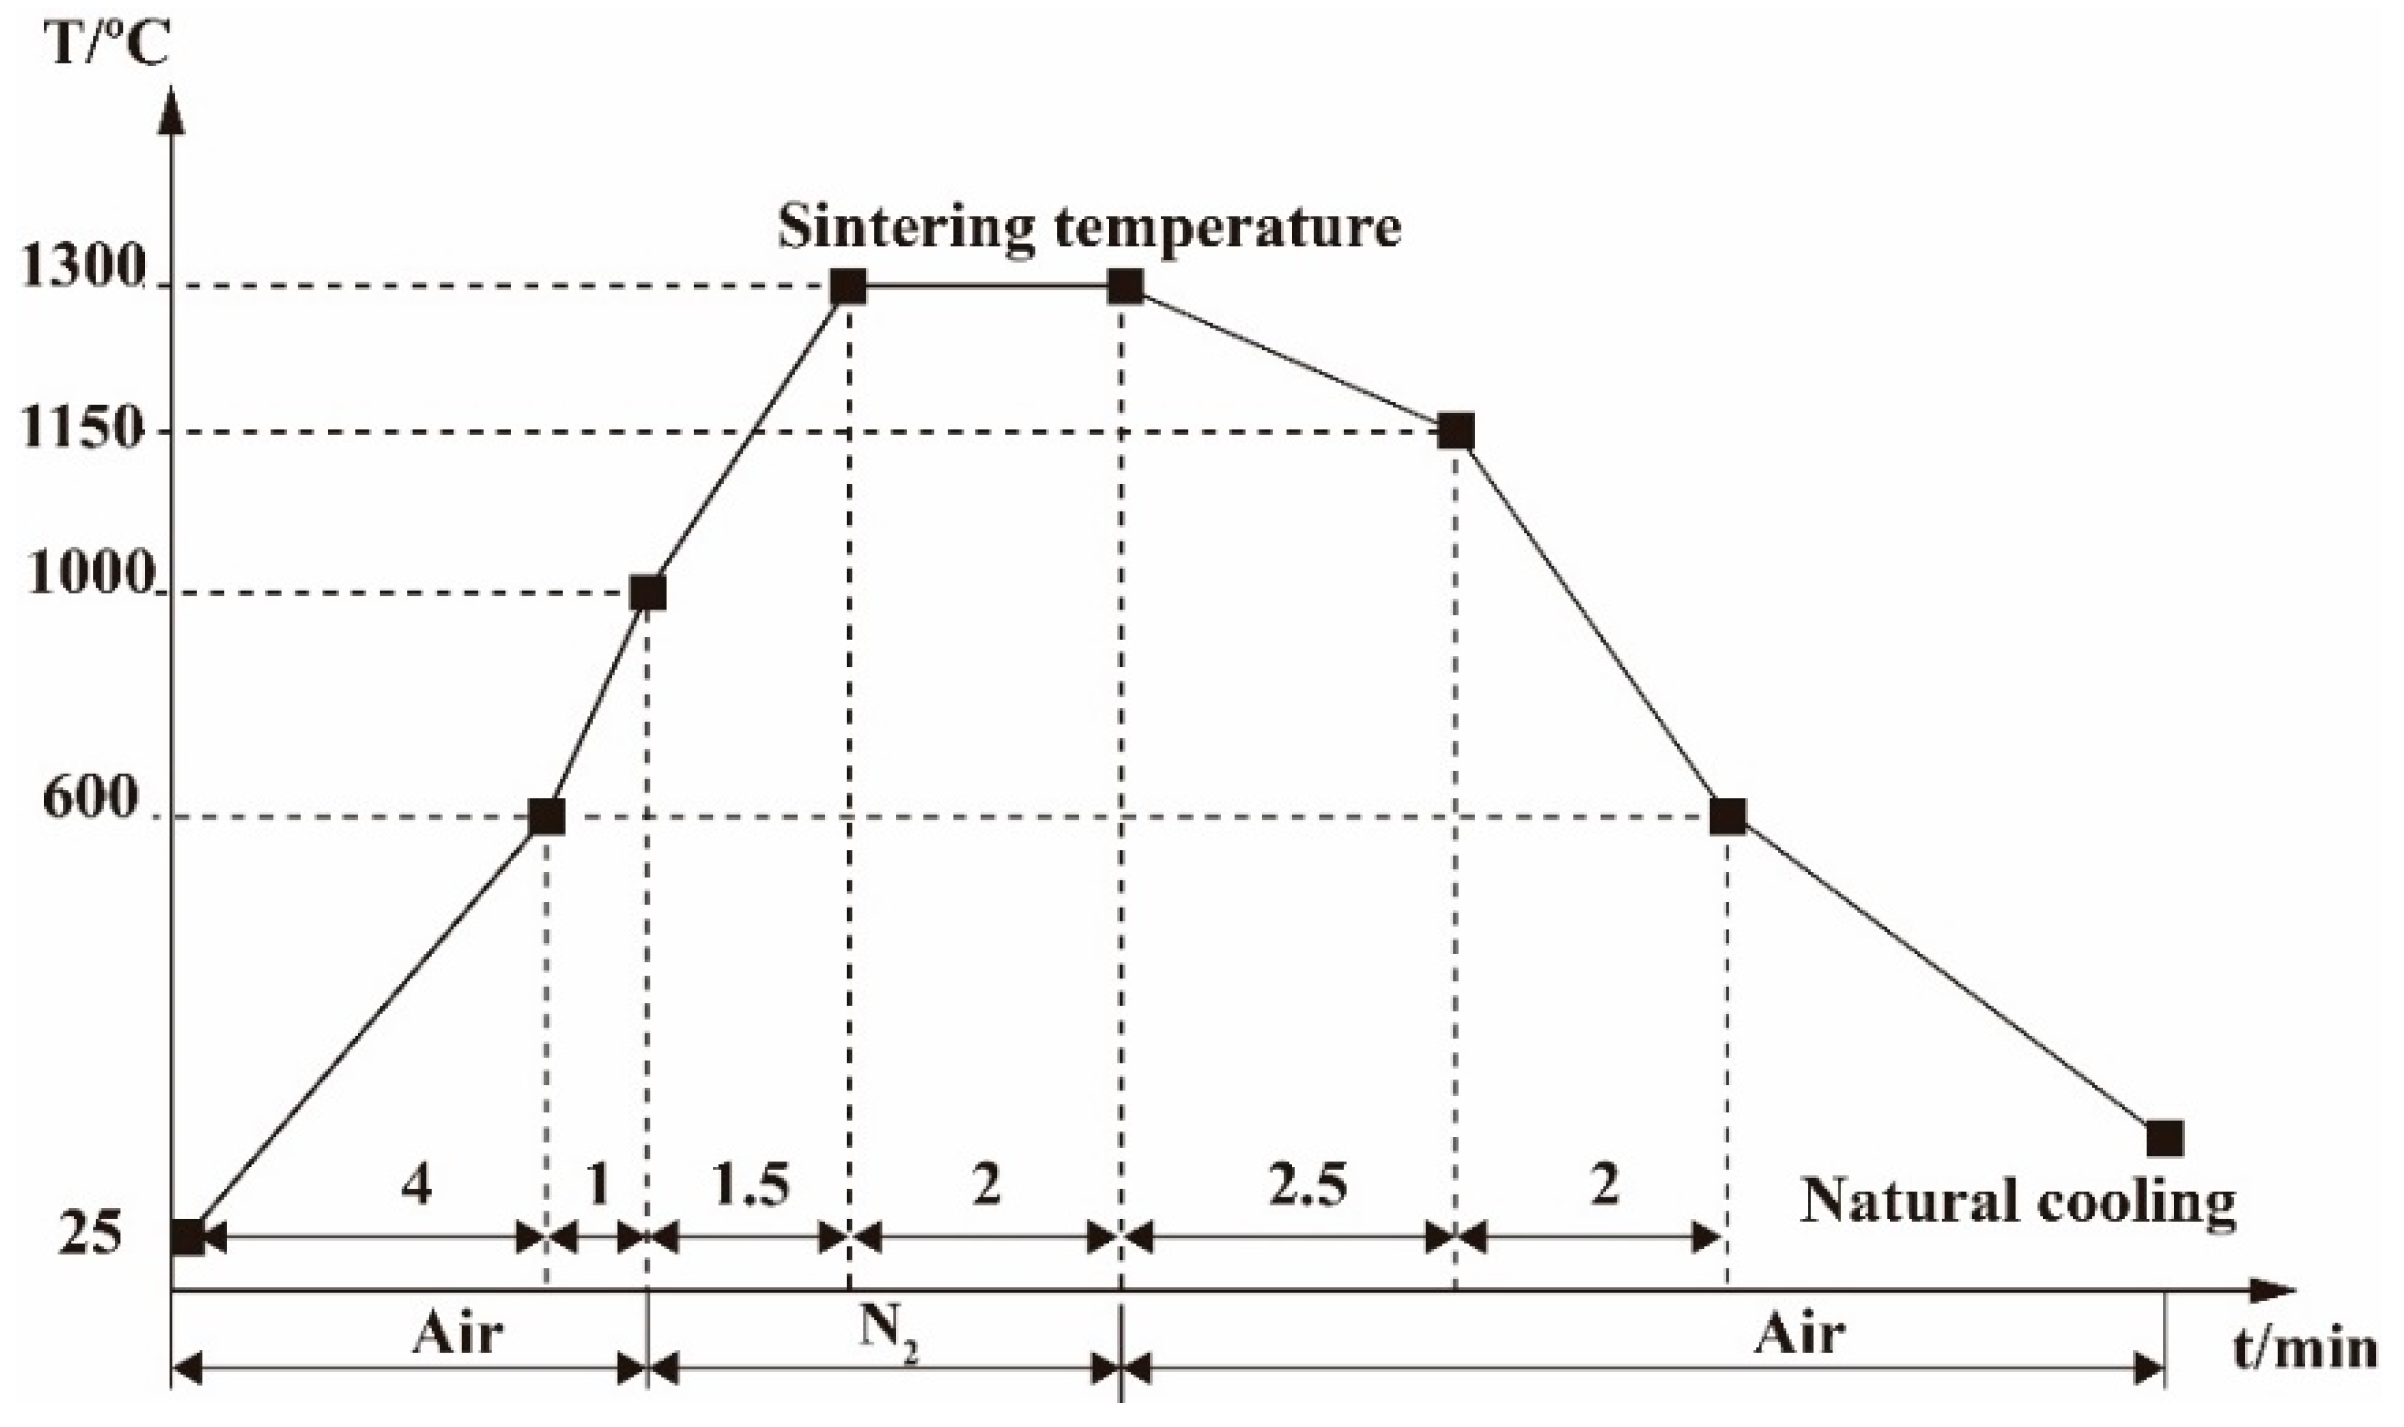
2.2. Experimental Procedure

(1) Generation temperature of effective liquid phase and the liquid phase fluidity
The visible micro-sintering test device (as Figure 1) was conducted to measure the generation temperature of effective liquid phase and liquid phase fluidity of iron ore with fixed CaO mass ratio. The 0.5-mm size fraction iron ores were crushed into 0.05-mm fines, and the CaO content of the adhering fines is calculated to be about 15 wt% based on the actual sinter burden constituent. Therefore, in the research, each ore was added with 15 wt% content of CaO chemical reagents; 0.8 g blended sample was pressed to an 8-mm diameter cylinder tablet under 20 MPa to simulate adhering fines, and then put it on an inert iron chrome aluminum plate (Φ = 25 mm) to avoid the sample reacted with the corundum platform and to diminish the effect of the surface roughness of platform on the liquid phase fluidity.
Figure 2 shows the temperature and atmosphere system of the micro-sintering test. The heating rate of the sample was adjusted by the in-and-out speed of the platform automatically. During experimental process, airflow with flux was 3 L/min, nitrogen was used in the sintering stage (1000~1300 °C) to simulate the weakly reducing atmosphere in the high temperature zone of sinter layer. Then, in the cooling process, switch the atmosphere back to the air. The temperature of the sample was measured by thermocouple 1 during the test, and the CCD camera connecting the computer could collect state picture of the sample in the furnace every 1 °C after 800 °C. High light transmittance polaroid glass was used in a micro-sintering test device to obtain clear pictures.
The liquid phase fluidity index (FLP) was measured by the vertical projecting area method. The vertical project schematic diagram of the sample was shown in Figure 3. The fluidity index of the liquid phase was calculated according to Equation (1). The FLP of each iron ore was decided by at least 3 times tests.
F L P = ( A after A before ) / A before
where Aafter is vertical projecting area after experiment (mm2), and Abefore is vertical projecting area before experiment (mm2).
Referring to previous studies [12,13], the generation temperature of effective liquid phase (T10) is defined as the temperature when the height shrinkage rate of the sample reaches 10% after 1000 °C (excluding the influence of carbonate and crystal water decomposition). T10 represents the lowest temperature at which the liquid phase begins to generate and is prepared to flow.
(2) Thermodynamic calculation by FactSage
According to chemical composition of 0.5-mm iron ore in Table 1, sample adding with 15 wt% CaO reagent in each ore are calculated out, and convert into the corresponding oxide from. It was assumed that the total mass of all the Fe2O3, Fe3O4, SiO2, CaO, Al2O3 and MgO is 100 g. Therefore, the chemical composition of samples for calculation with Factsage is shown in Table 2.
It is critical that choose the appropriate thermodynamics database to calculation results using FactSage software (CRCT-ThermFact Inc. & GTT-Technologies, Canada & Germany). In present study, the thermodynamic calculation databases are selected according to Lv et al.’s research [10]. In contrast, considering the weakly reductive atmosphere in sintering high-temperature stage the atmosphere parameters in the calculation process need to be changed accordingly. Therefore, set the PO2 = 0.21 atm before 1000 °C as the primary calculation condition, then the calculation results of 1000 °C were taken as the initial material into the calculation of the next stage and changed the PO2 to 5 × 10⁻³ atm to simulate the weakly reductive atmosphere.
In this paper, the liquid phase formation characteristics of the nine kinds of iron ore with fixed CaO mass content were calculated respectively. Including: (a) the melt generation temperature; (b) the liquid phase content; (c) the thermodynamic equilibrium phases composition and the mixed phase viscosity. The equation of the mixed phase viscosity is shown as Equation (2) [14].
Viscosity ( solid + liquid   mixture ) Viscosity ( liquid ) ( 1 solid   fraction ) 2.5

3. Results

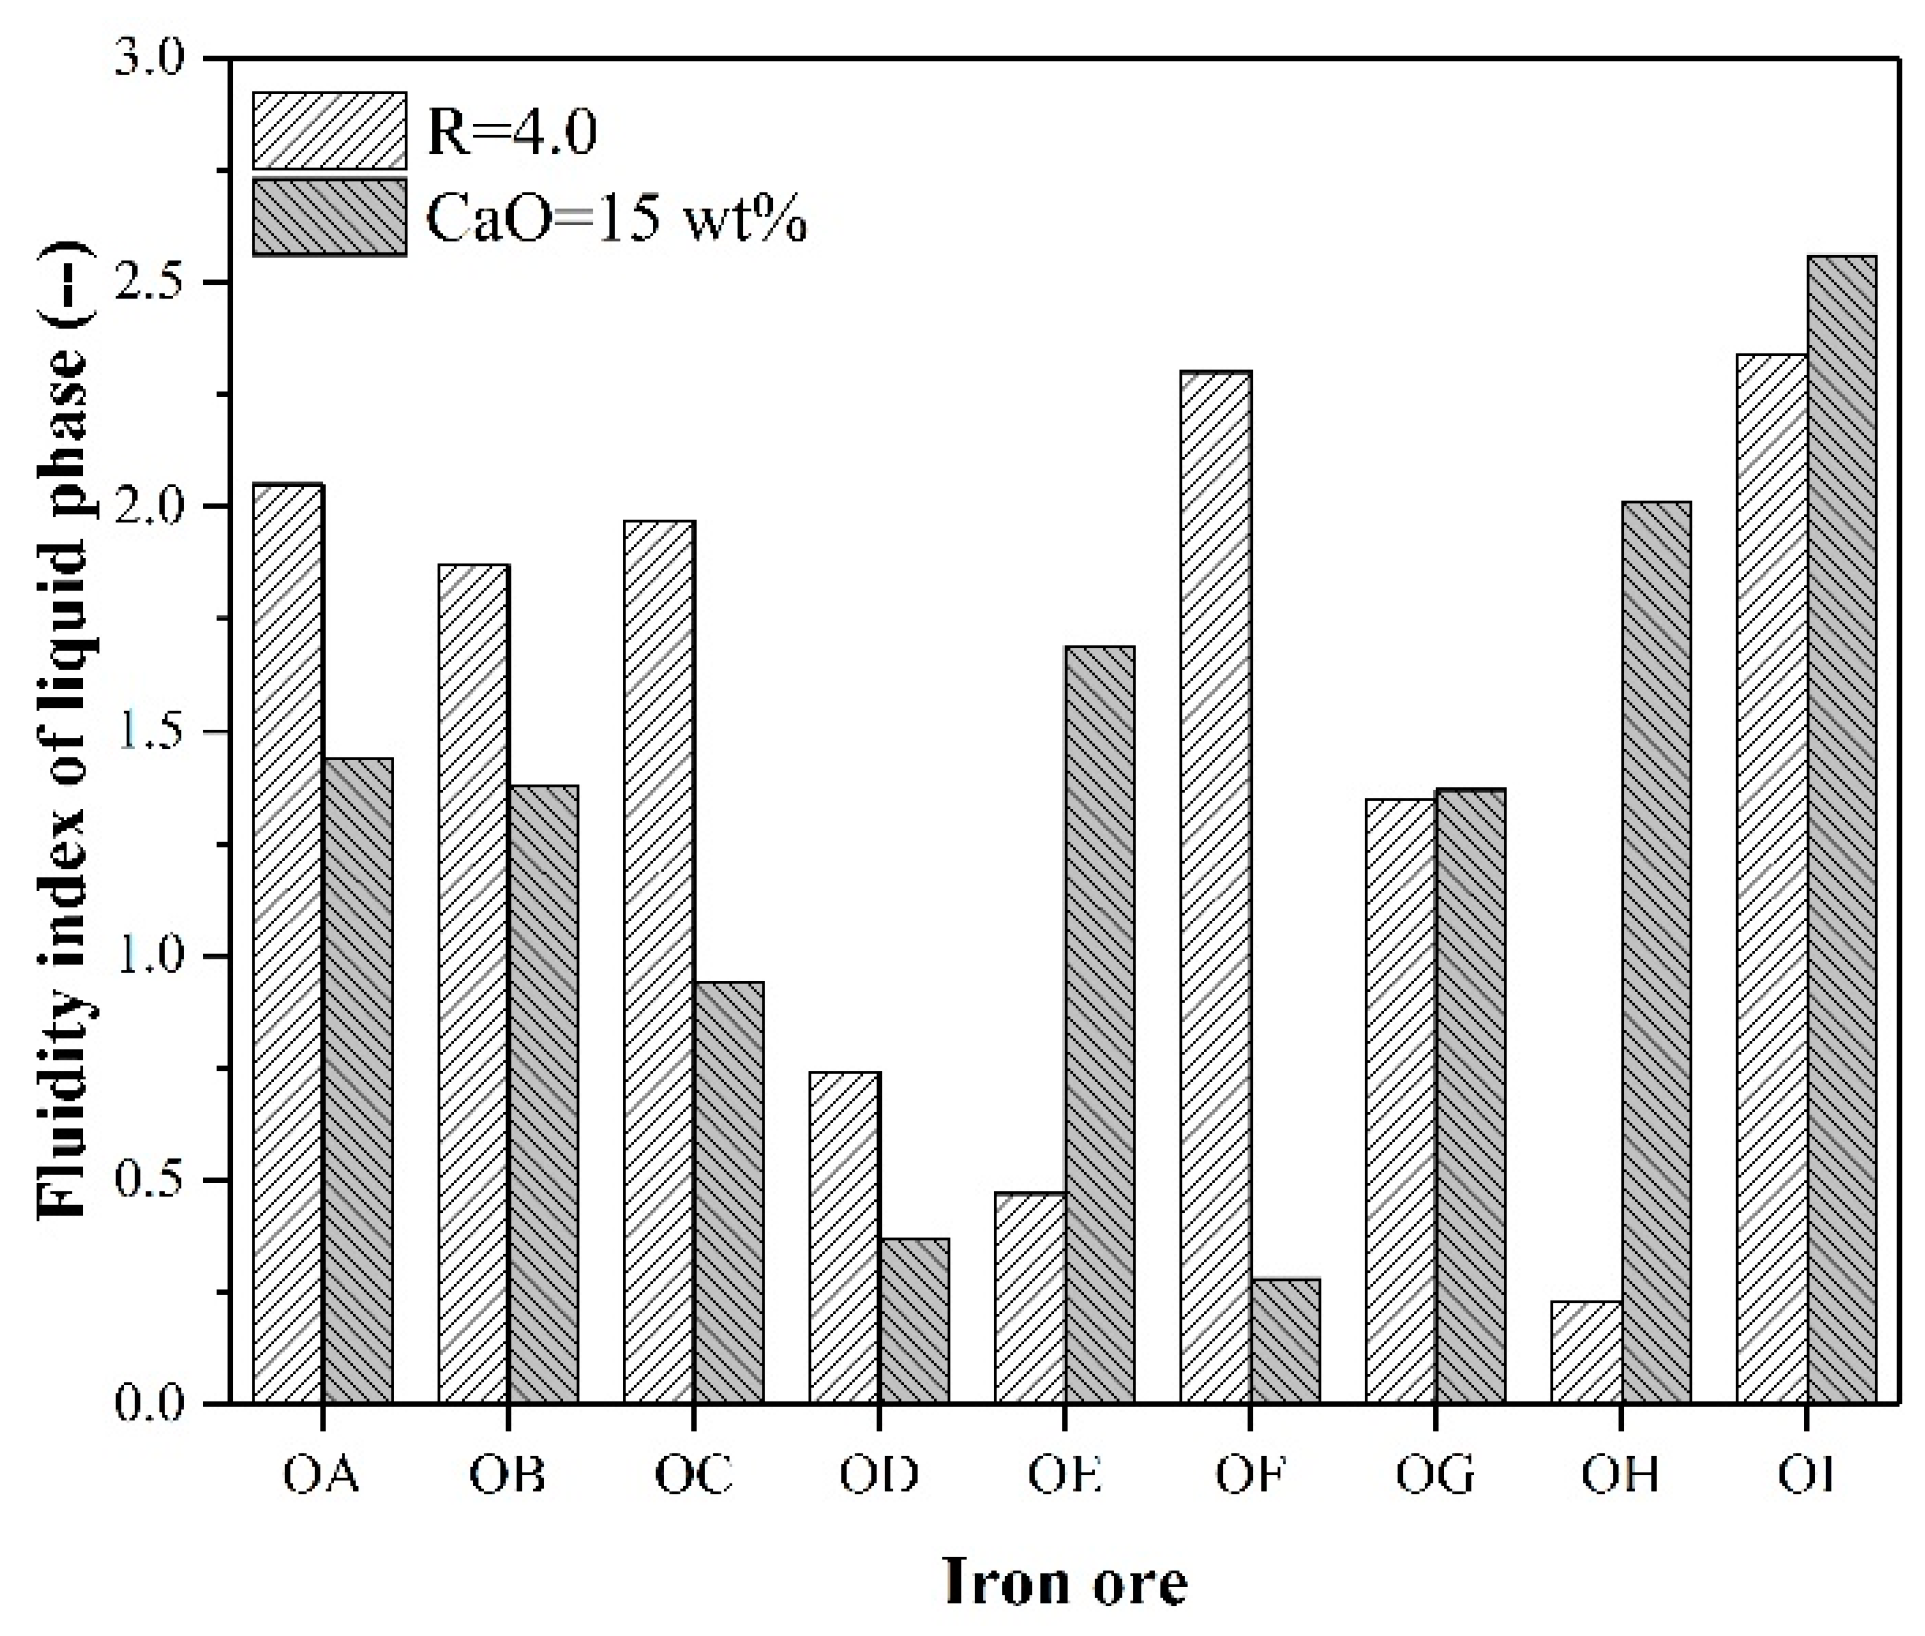
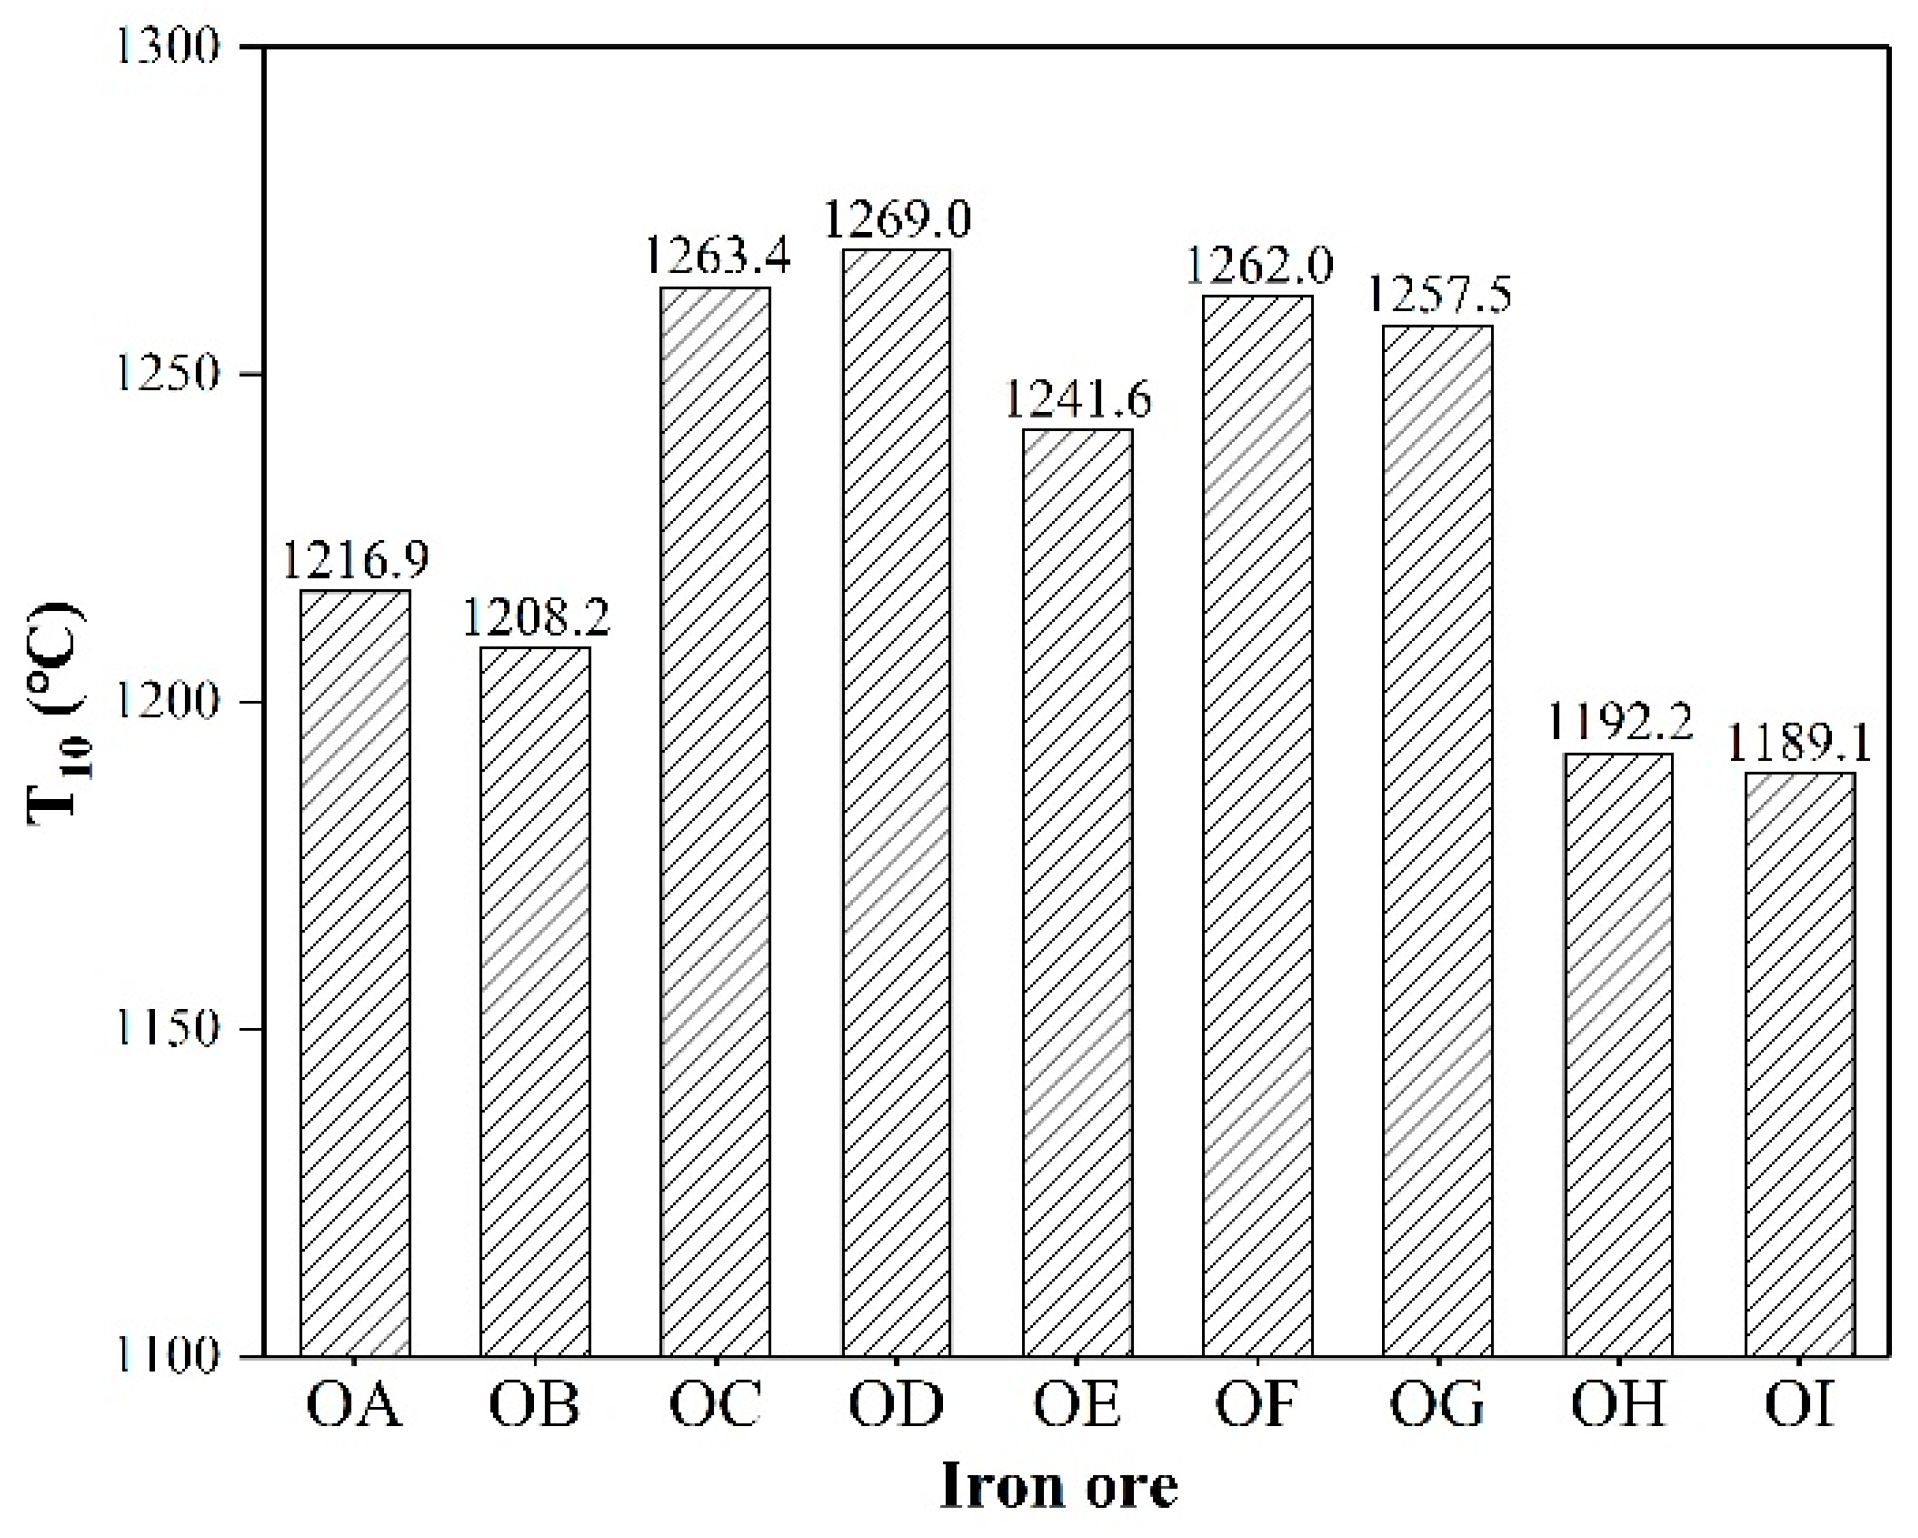
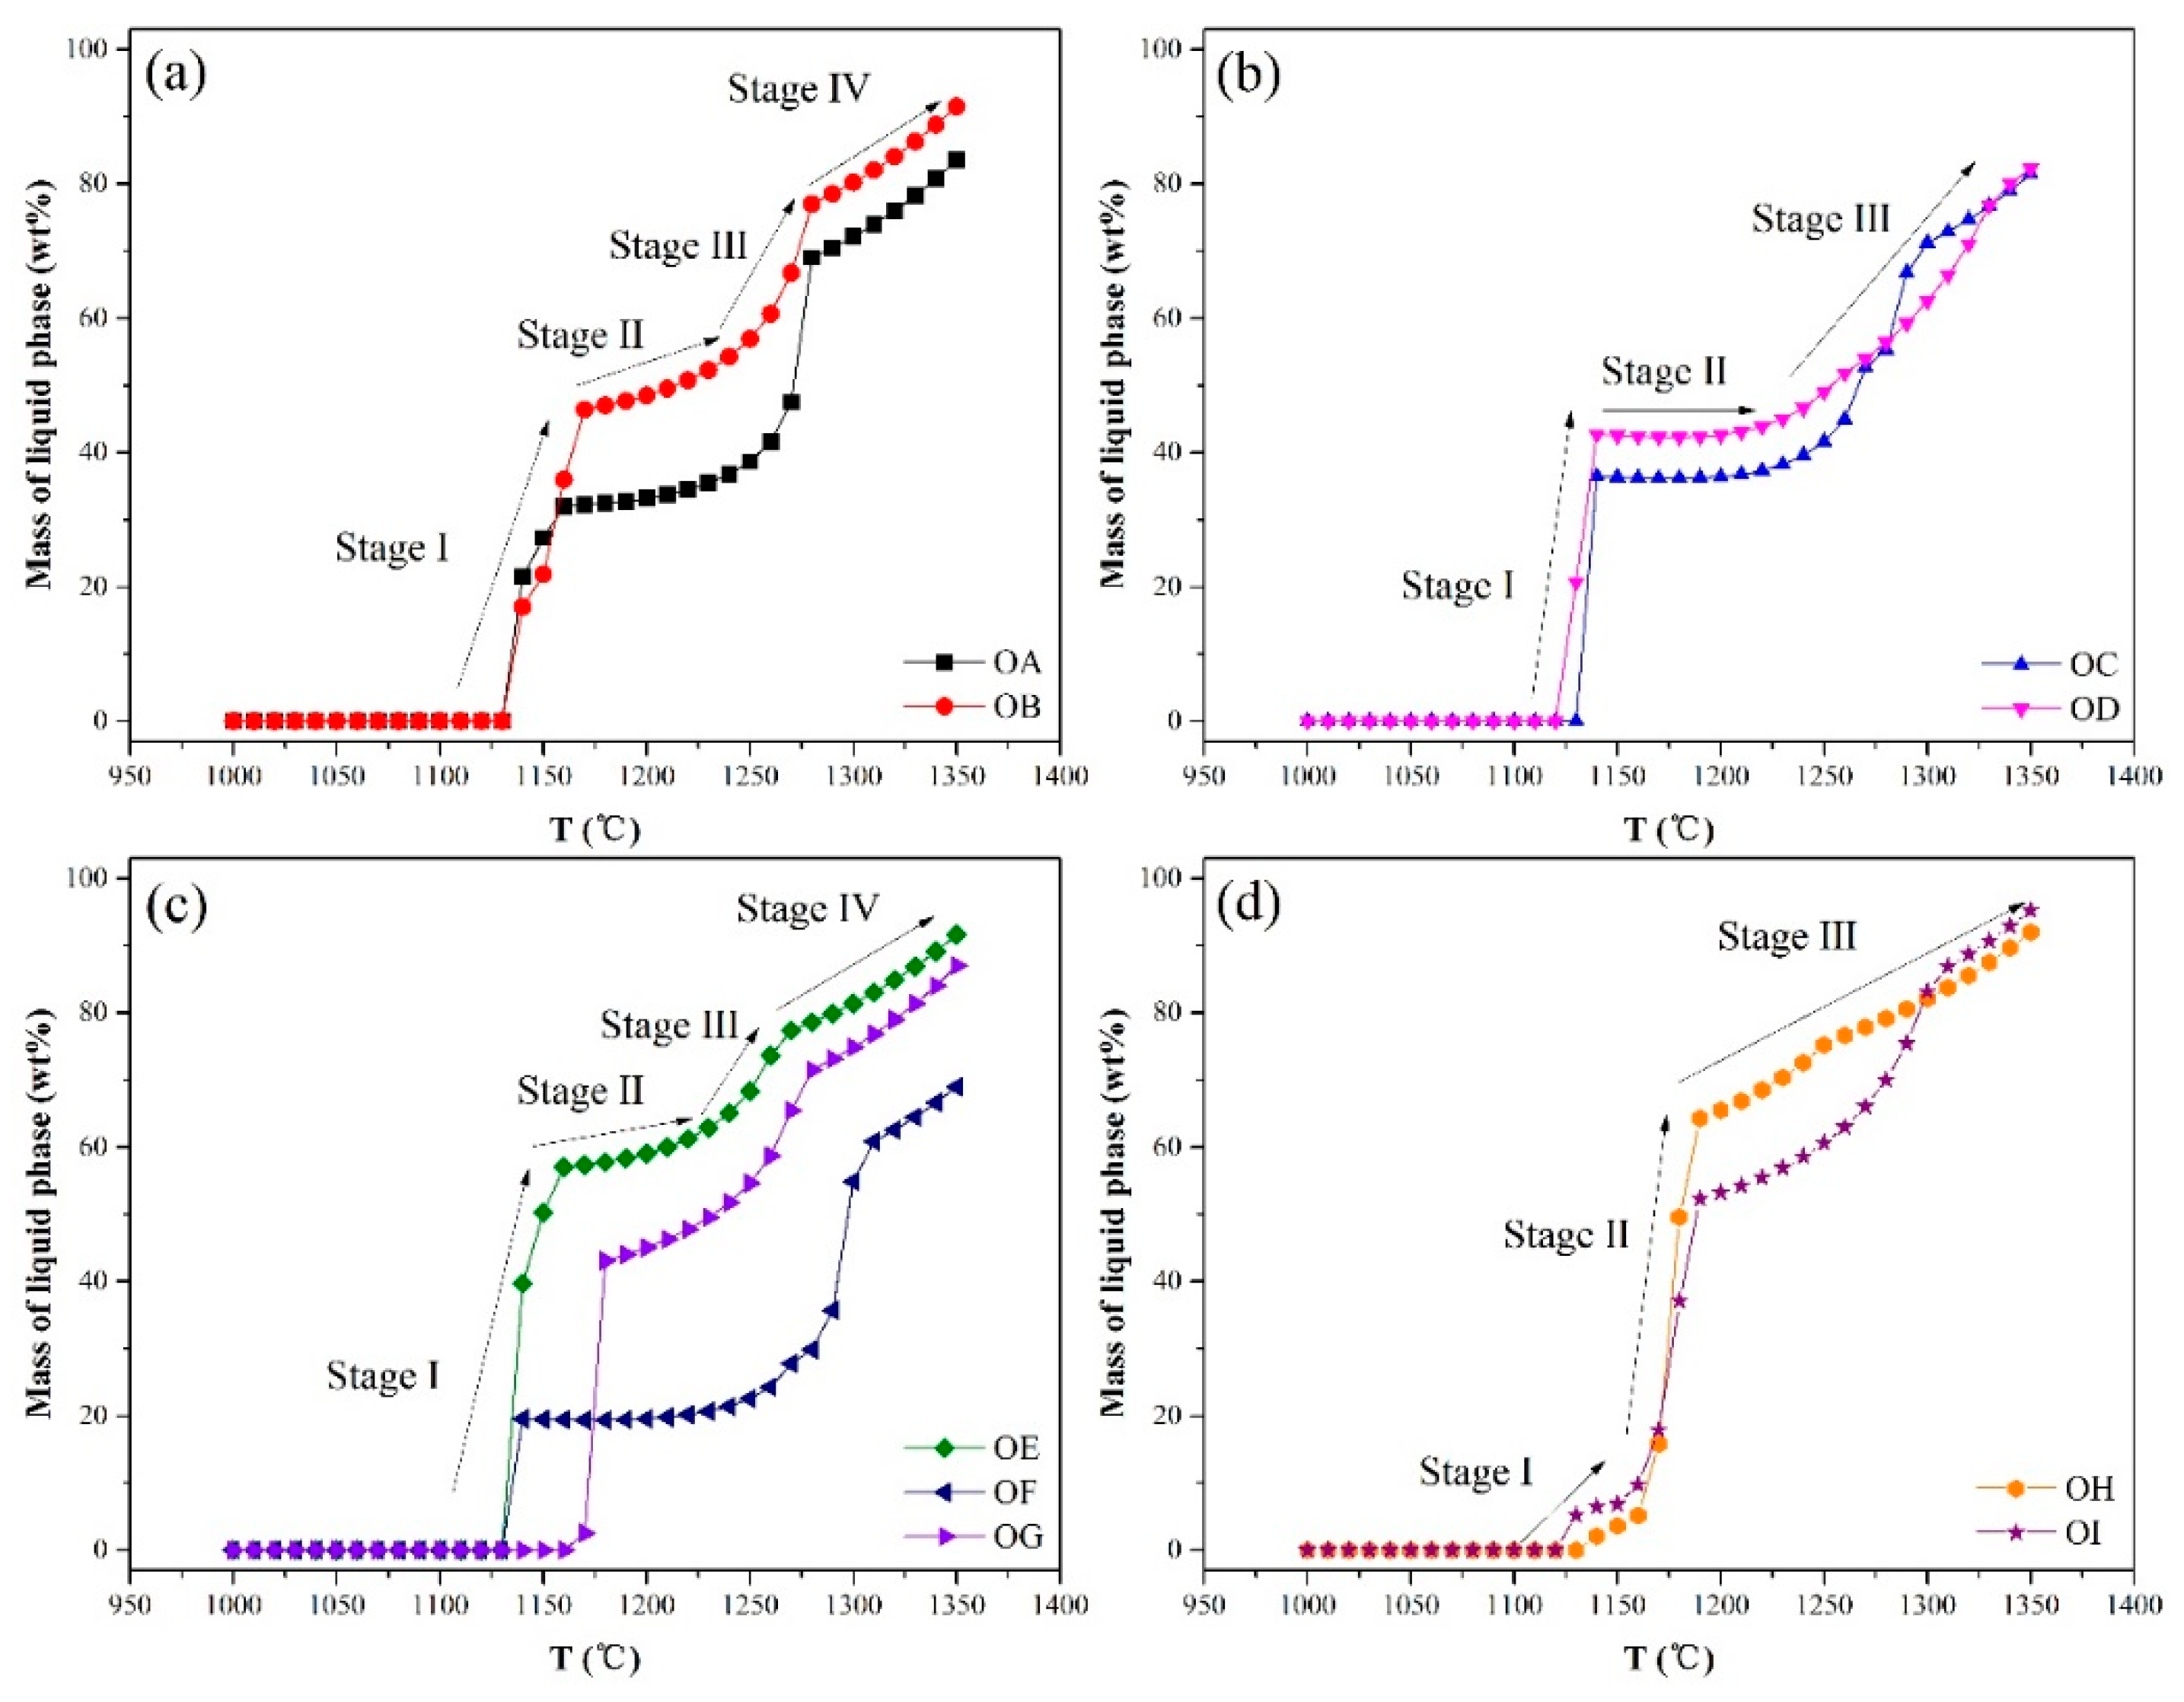
3.1. Liquid Phase Fluidity and Generation Temperature of Effective Liquid Phase

The fluidity indexes of liquid phase (FLP) of the nine iron ore samples under fixed alkalinity conditions (R = 4.0) and a fixed CaO mass content were measured by the visible microsintering test device respectively. The sintering temperature was 1300 °C, and the FLP results are shown in Figure 4.
As seen from Figure 4, there are significant differences between the FLP of iron ore under the condition of fixed alkalinity (R = 4.0) and fixed CaO mass ratio, especially for the samples of OE, OF and OH. Four groups of parallel tests were carried out on Fluidity index of liquid phase of OA with the R = 4. The results of the four parallel tests are 2.01, 2.03, 2.05, 2.07. Because the standard deviation is small enough, the data of once test in the figure are sufficient to represent its own characteristics and all samples data are statistically different. In the case of fixed alkalinity, the high SiO2 content hematite OF has the largest FLP, while the lower SiO2 content hematite OE and magnetite OH show relatively small FLP. This is because the alkalinity is constant, and when the SiO2 content increases, the added CaO content also increases. However, when simulating the adhering fines of sinter mixed ore and taking into account the fixed CaO mass content method, such as 15% in this study, the rule of FLP is completely opposite to that of the fixed alkalinity situation. The FLP of OE and OH with low gangue content are higher and that of OF with a high gangue content becomes the lowest. As described above, it is assumed that the raw material particles can be evenly distributed during the granulation process (ignoring the influence of segregation), and the contact probability of each iron ore particle in the adhering fines is the same as that in the flux. This will not cause the high SiO2 content ore to be in greater contact with the flux to generate an ore with a large liquid phase and low SiO2 content in less contact with the flux. Therefore, in view of the adhering fines of actual sinter mixed ores, it is more practical to research the difference between the FLP of iron ores with fixed CaO mass content.
The generation temperatures of the effective liquid phase (T10) of iron ores with fixed CaO mass content are illustrated in Figure 5. Four groups of parallel tests were carried out on T10 of OA. The results of the four parallel tests on T10 are 1215.7, 1218.2, 1215.9, 1217.8. Because the standard deviation is small enough, the data of once test in the figure are sufficient to represent its own characteristics and all samples data are statistically different. It can be found that the T10 of iron ore is quite different under the condition of fixed CaO mass content. Among them, the T10 values of magnetite OH and OI are lower, followed by those of limonite OA and OB. Meanwhile, the T10 values of Australian Marramanba-type ore OC and OD with high Al2O3 contents are relatively high, and the T10 values of hematite OE, OF and OG are in the range of 1240~1260 °C.

3.2. Thermodynamic Equilibrium and Viscosity Calculations

The theoretical generation temperature of liquid phase (TG), the mass of liquid phase during sintering and the viscosity of liquid phase and mixed phase in the sintering of different iron ore samples with 15 wt% CaO were calculated using FactSage 7.0 software, and the modules of “Equilib” and “Viscosity” were applied [14]. The calculation results are shown in Table 3.

4. Discussion

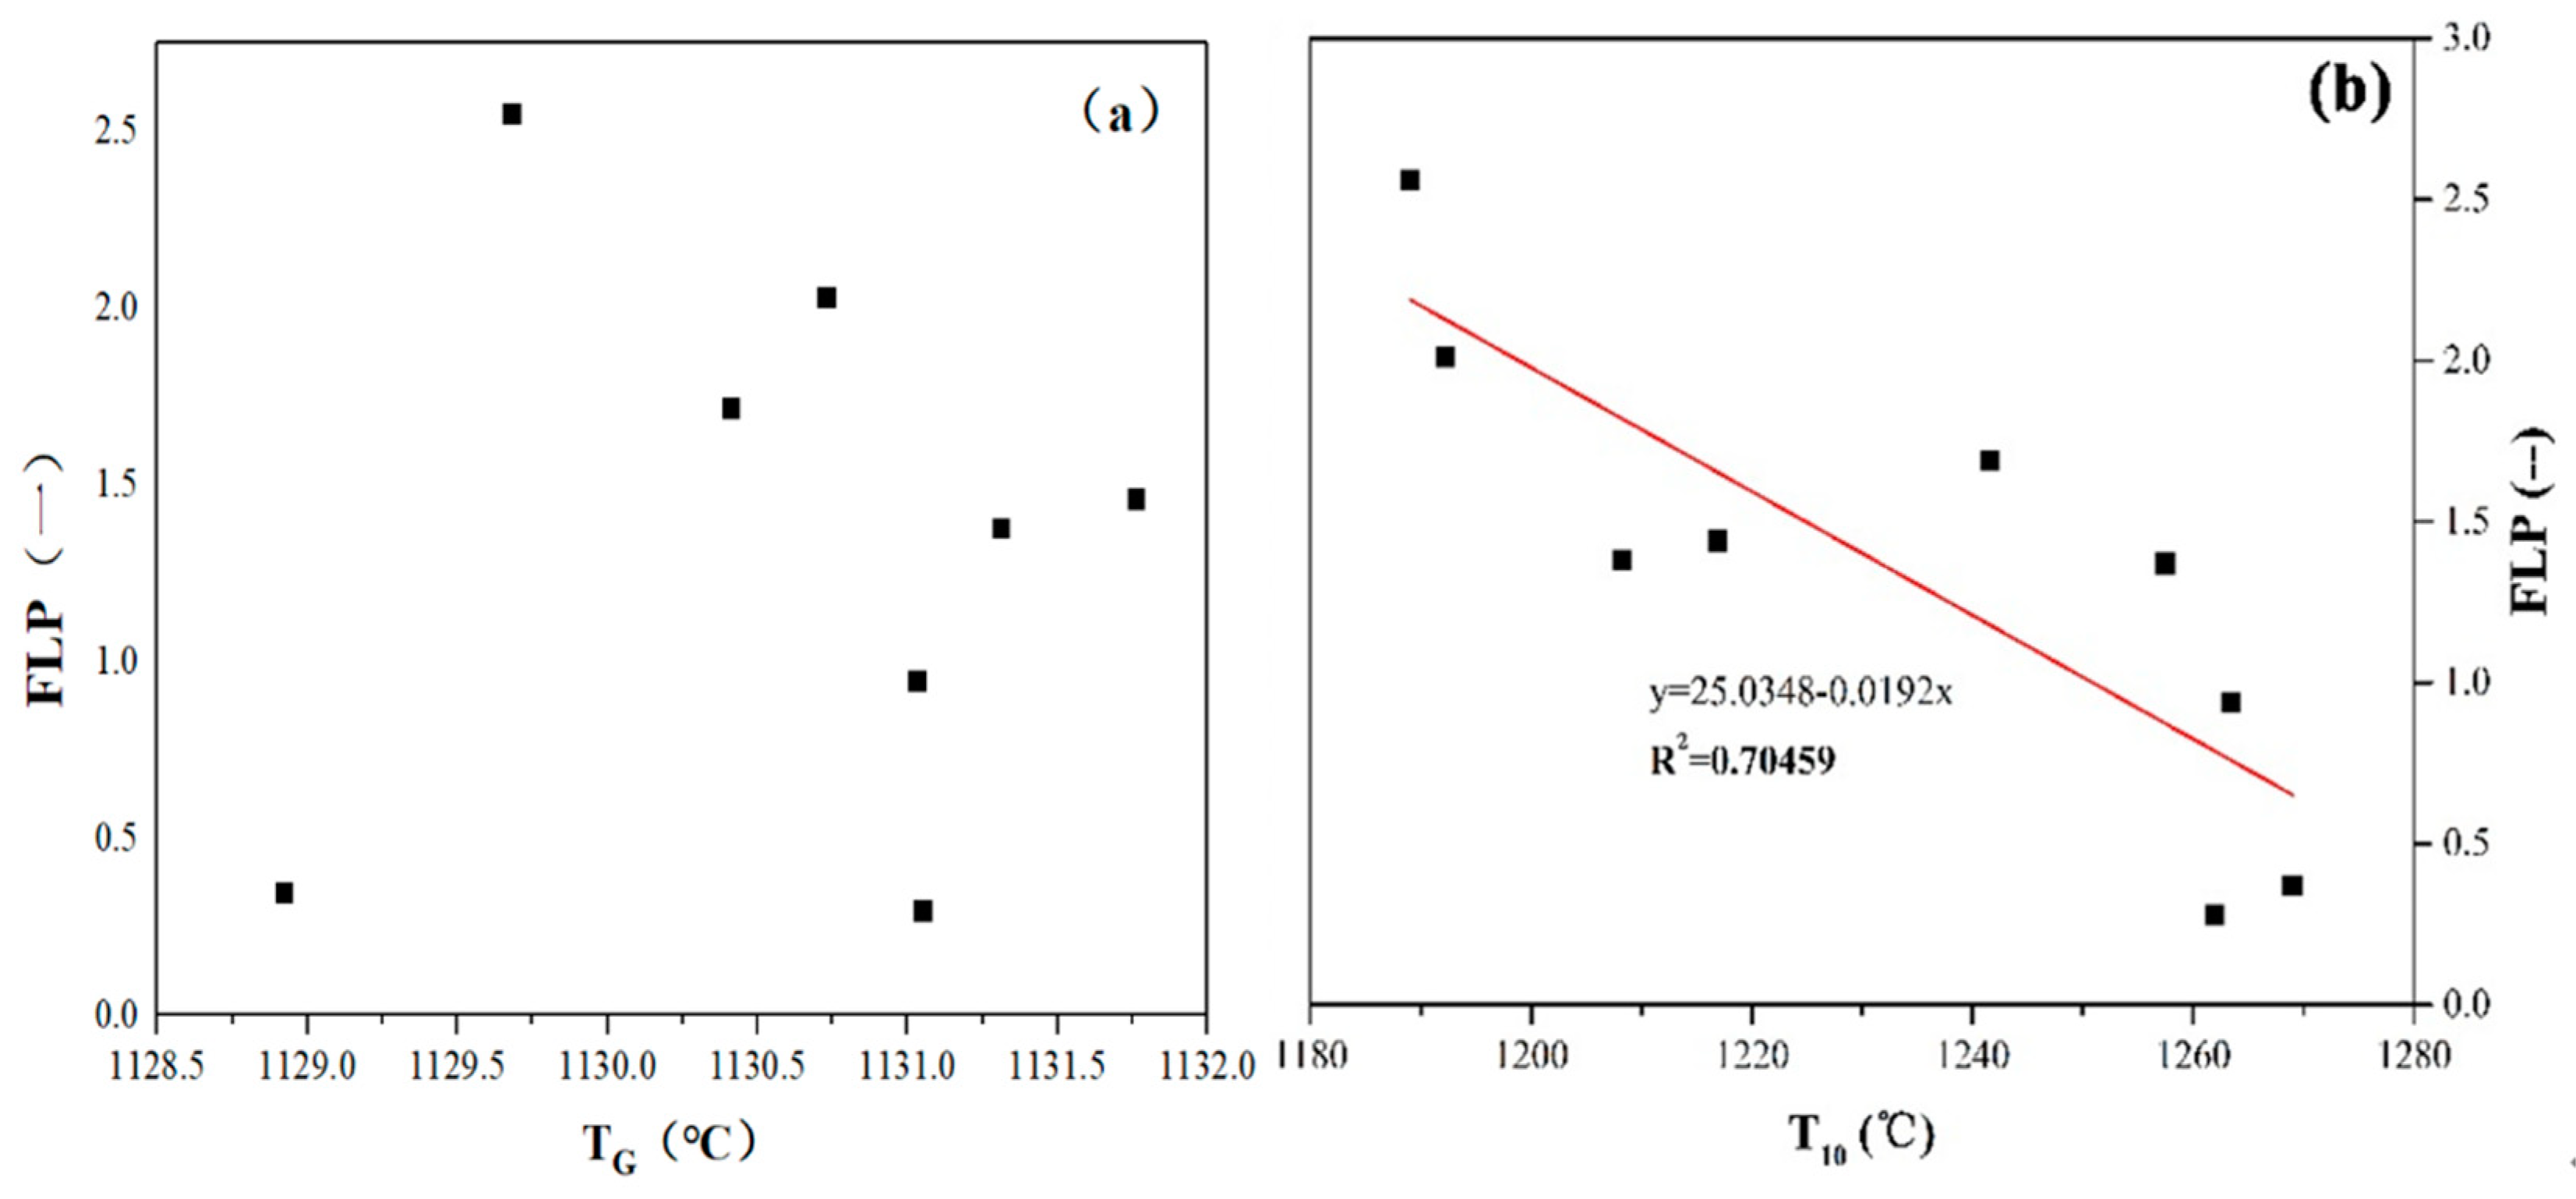
4.1. The Effect of the Melt Formation Temperature on FLP

Figure 6 shows the relationships between FLP of iron ore and TG, which were calculated by FactSage 7.0 software, and T10, which was measured by visible microsintering test.
Figure 6a shows that the T10 calculation results of iron ores are similar, which are substantially concentrated in the range of 1129~1132 °C in the case of treating the last point as an abnormal point. This is due to the initial liquid phase formed, which is mainly calcium ferrite with a low melting point under the same amount of flux mass content during the sintering process. Thus, the T10 of different iron ores are similar. The results show that there is no relationship between FLP and TG. From Figure 6b, it can be found that the FLP decreases with the increase in T10, and they have a good negative correlation. Since the sintering temperature and time are certain, on the one hand, the lower melt formation temperature means that the liquid phase is more likely to be formed in the sintering process [15]; on the other hand, the low melt formation temperature leads to a higher superheat, so the melt has a low viscosity, which contributes to the wetting and spreading of the liquid phase.
The comparative analysis shows that the theoretical liquid phase temperature from the thermodynamic calculation could not characterize the liquid phase fluidity of iron ore during the sintering process because the FactSage software deals only with ideal conditions and does not take into account the actual kinetic conditions, i.e., the porous structure generated by the decomposition of combined water is conducive for improving the specific surface of iron ore particles which enhances the reaction of the kinetic conditions, thus affecting the melt formation temperature [9]. Different kinetic conditions will produce errors in different directions, and further research is needed to solve this error-related problem.

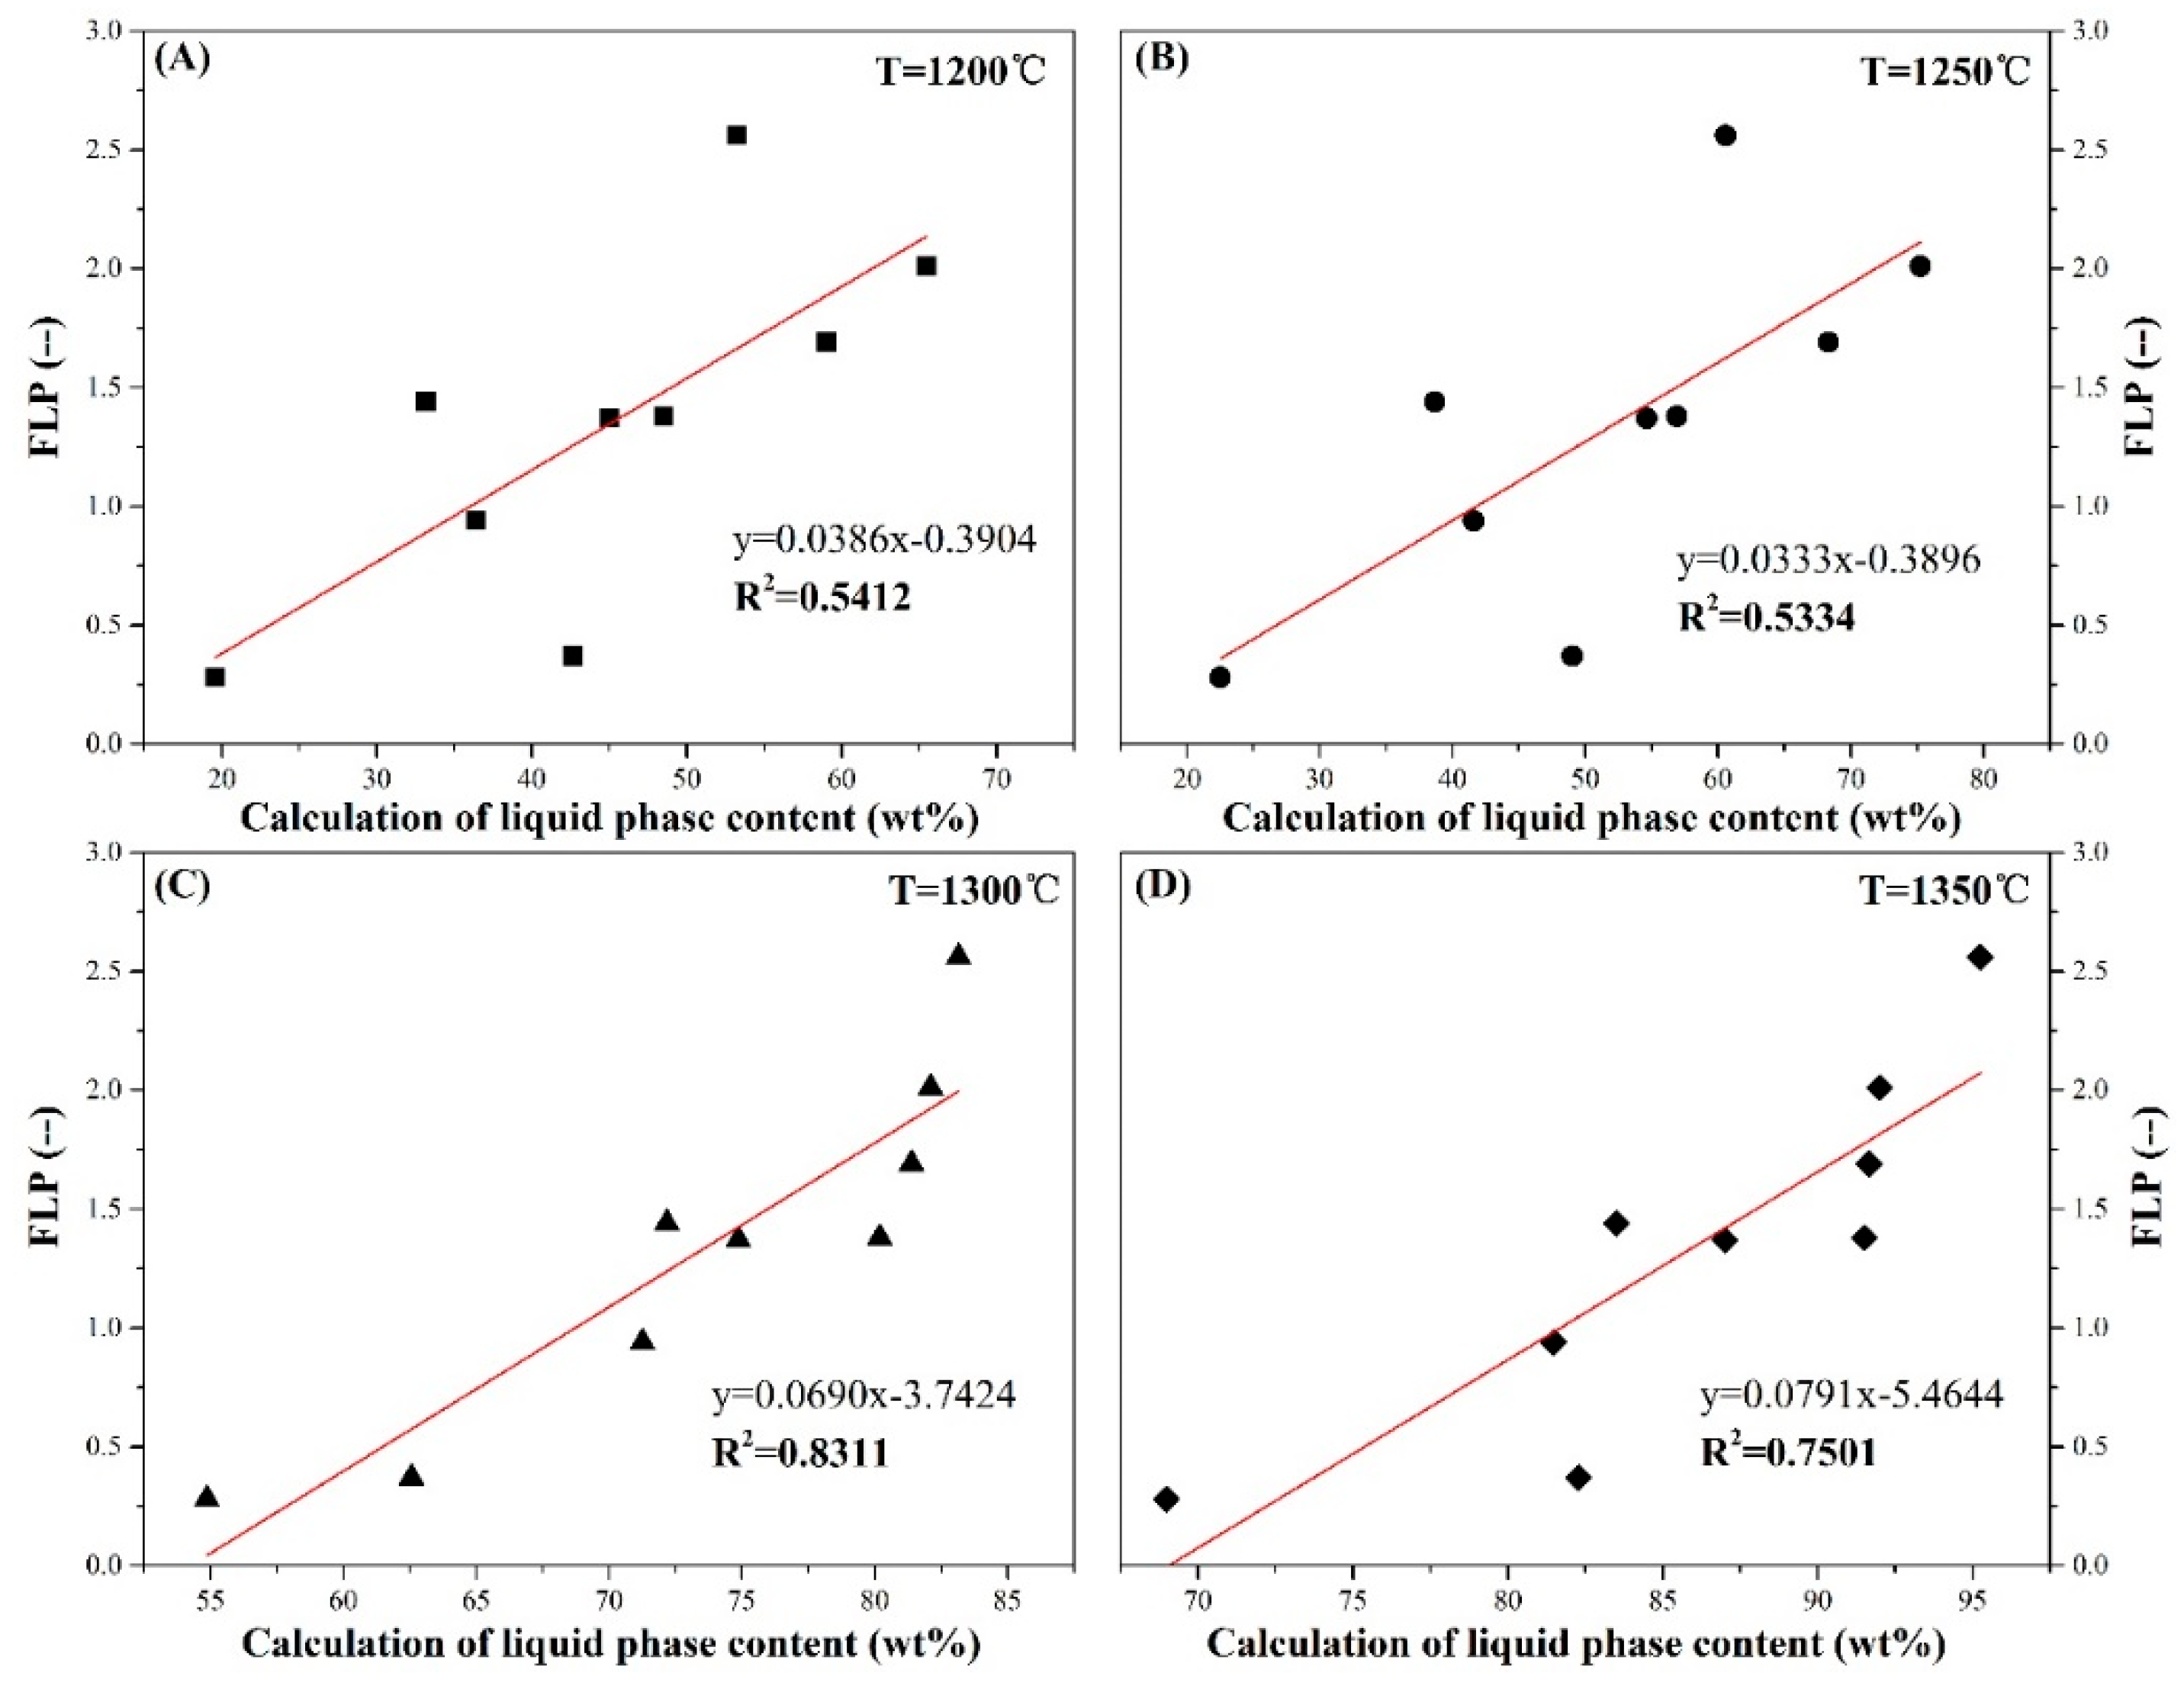
4.2. The Relationship between Liquid Phase Content and FLP

With the increase in the sintering temperature, the low melting point material is produced by the solid-phase reaction in the adhering fines layer of quasi-particle, which begins to melt and accelerate the mineralization reaction and liquid phase formation. A large amount of liquid phase is generated in the burning zone of the sinter layer. The mass of liquid phase in the range of 1000~1350 °C was calculated by the “Equilib” module of FactSage 7.0 software. Moreover, the nine kinds of iron ores are divided into four typical mineral types, as shown in Figure 7, and Table 4 shows the results of the thermodynamic equilibrium calculations for some iron ores.
In the table, SLAGA refers to the liquid phase; SPINA refers to the spinel; C2SA refers to the silicates, etc; Mel A refers to Ca2(Fe,Al)Si2O7, Ca2FeAl2O7, Ca2Al3O7.
When the temperature rises, the atomic vibration is intensified in solid phase, and then the reaction kinetic conditions in the iron ore fines are improved, so the rate of the solid phase reaction is accelerated. Meanwhile, the crystallization water is decomposed to generate pores, further improving the reaction conditions, which is favorable for the solid phase reaction.
As shown in Figure 7a,c, for Australian limonite OA and OB, hematite OE, OF and OG, with the increase in sintering temperature, the liquid phase formation curve of limonite can be divided into four stages. First, the liquid phase begins to generate in abundance when the sintering temperature reaches 1131 °C. In the temperature range of 1159~1250 °C, the liquid phase content grows slowly. After 1280 °C, the liquid phase is generated dramatically. As the temperature rises, the liquid phase content continues to grow, but the growth rate is significantly slower. According to Table 2, it can be inferred that the liquid phase content is related to its SiO2 content; the iron ore with higher gangue content has lower mass of liquid phase (i.e., OF).
From Figure 7b, it can be seen that the liquid phase formation curves of OC and OD are different. The liquid phase content profile of OC is similar to that of limonite OA, which has undergone four characteristic stages. Although stages I and II of the liquid phase formation curve of OD are similar (only the mass of liquid phase of OD is slightly larger than that of OC), OD does not show a significant two-stage liquid phase formation curve (i.e., stages III and IV) as OC after 1250 °C. According to the calculation results of the phase composition in Table 4, the contents of the “Melilite” phase (Ca2(Fe,Al)Si2O7, Ca2FeAl2O7, Ca2Al3O7) of OC and OD are significantly different. They are 3.33 wt% and 14.94 wt% at 1250 °C, respectively. This suggests that OD has a higher Al2O3 content to promote the formation of high melting point minerals. With the increase in sintering temperature, melilite minerals gradually react to decompose and form liquid phase; thus, the formation rate of the liquid phase slows down in the high temperature stage (1250~1300 °C) [16,17].
As seen from Figure 7d, the characteristics of the liquid phase formation curves of the two magnetite are different from those of the other ore. The amount of liquid phase produced by the domestic magnetic concentrate fines OI is lower than that of OH in the temperature range of 1190~1300 °C. Comparing the calculation results of the phase composition in Table 4, it can be found that OI forms more silicates (C2SA), thus suppressing the liquid phase produced. This also proves that a higher SiO2 content will reduce the liquid phase content under fixed CaO content conditions.
Based on the above analysis, some iron ores (i.e., OE and OH) have a greater liquid phase content at the beginning of the liquid phase formation. However, for some ores (i.e., OA, OC and OG), although the mass of liquid phase formation is low (approximately 40~45 wt%) in the initial reaction stage (approximately 1200 °C), the liquid phase content increases dramatically in the temperature range of 1250~1300 °C. Therefore, the liquid phase content of iron ore is different in the high temperature stage (1200~1350 °C). Figure 7 and Figure 8 show the relationship between the measured FLP and the calculated liquid phase content under different sintering temperatures.
It is shown that the FLP of iron ore is positively correlated with the liquid phase content in the sintering high-temperature section. The greater the amount of liquid phase generated, the higher the FLP of iron ore. This is because the formation of liquid phase is a prerequisite for the occurrence of its flow phenomenon. In the case of a certain degree of viscosity, the greater amount of liquid phase produced, the greater the extent of its spreading. In addition, comparing the fitting results, the liquid phase content calculated at 1300 °C can best reflect its liquid phase fluidity, and the deterministic coefficient (R2) is 0.8311. Moreover, the calculation results of liquid phase content at 1200 °C and 1250 °C have a relatively poor fitting relationship with the FLP. It should be noted that the experimental sintering temperature of FLP was also 1300 °C, and the atmosphere system of the thermodynamic calculation by FactSage was consistent with that of the experimental process. Thus, it is expected that the liquid phase fluidity of iron ore can be characterized to a certain extent by the liquid phase content at its sintering temperature. Wuet al.’s research also attests to this point [6].

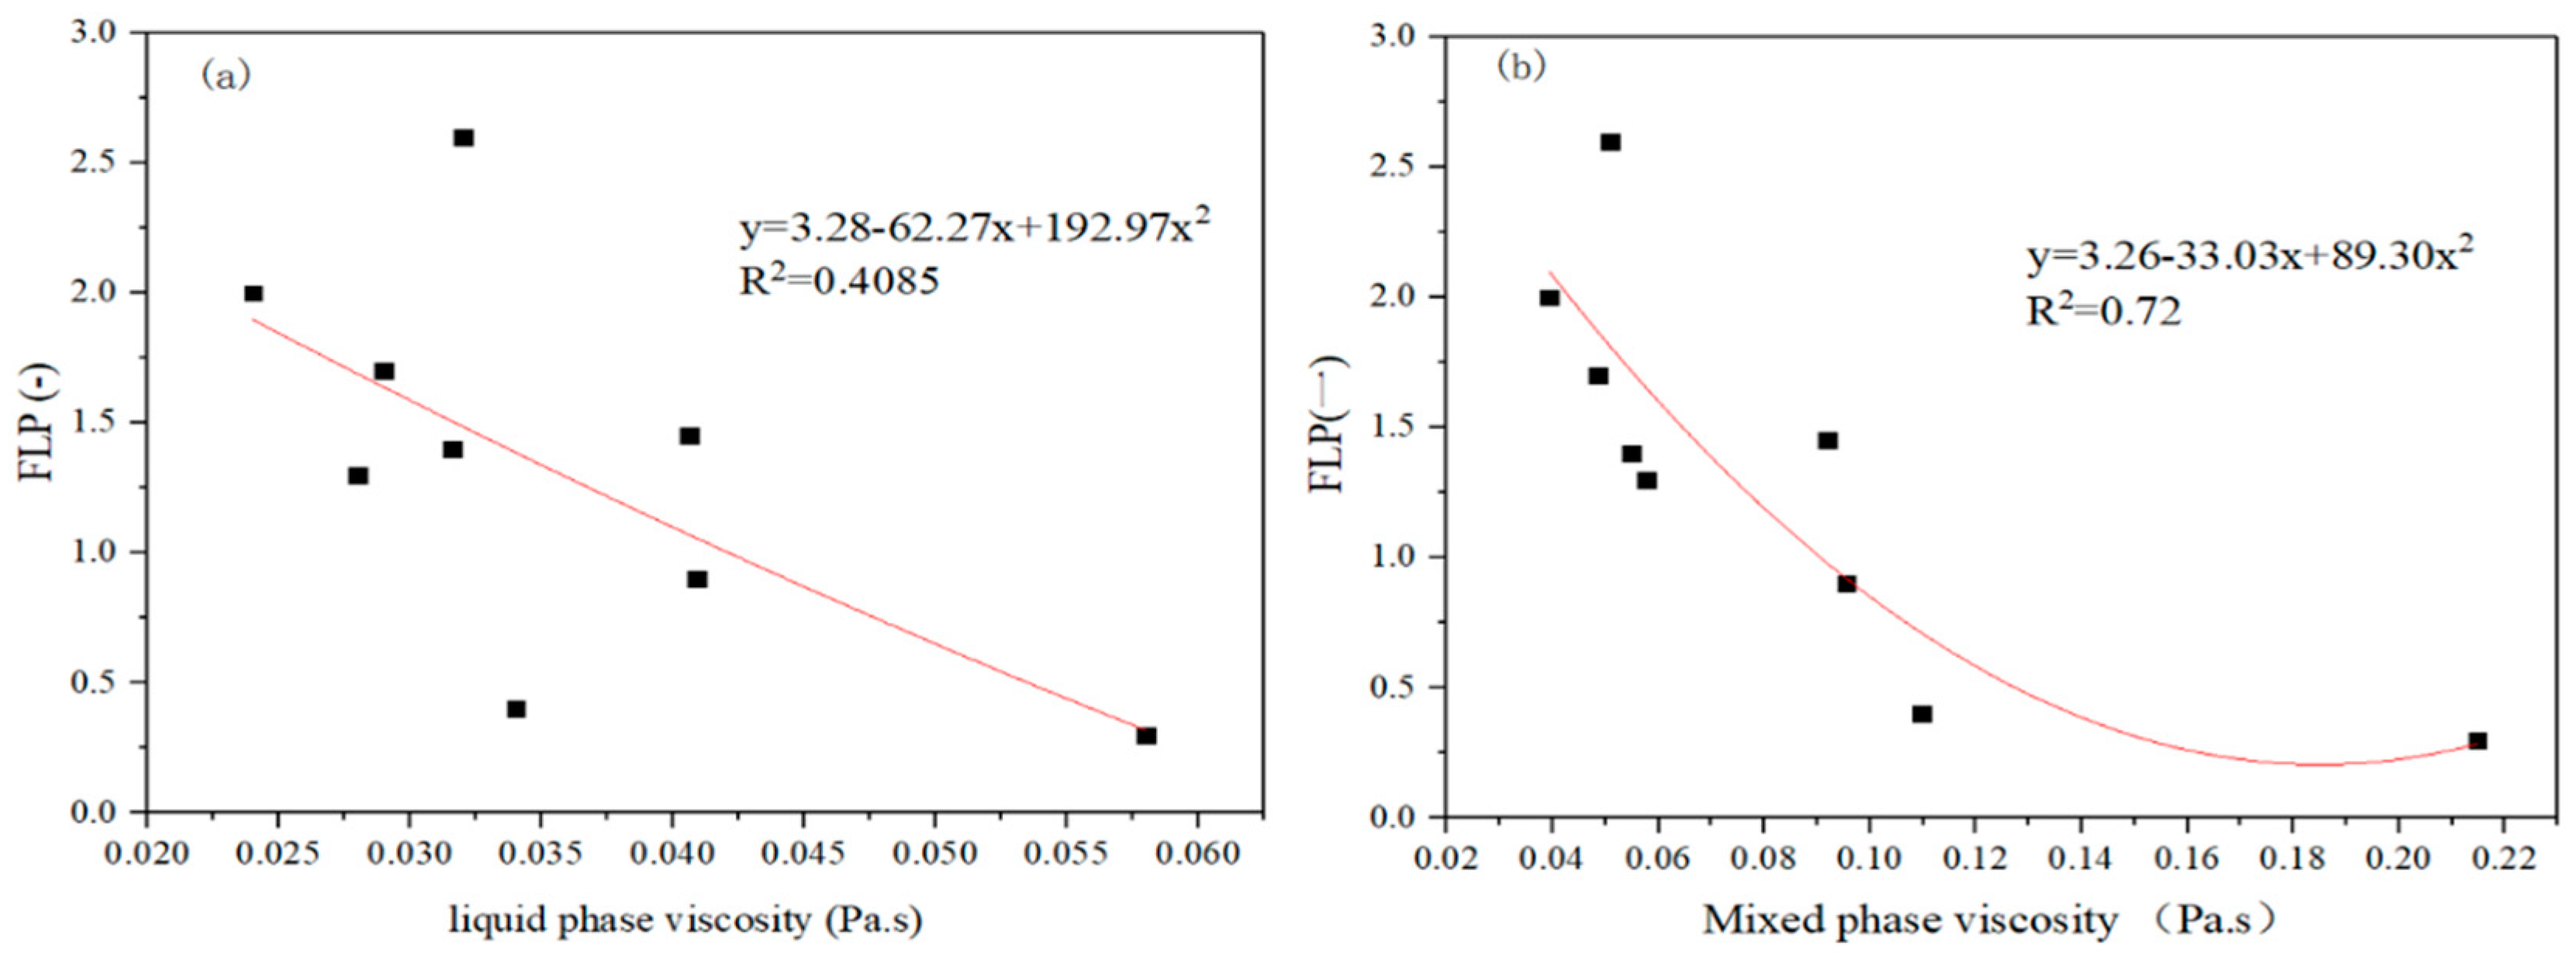
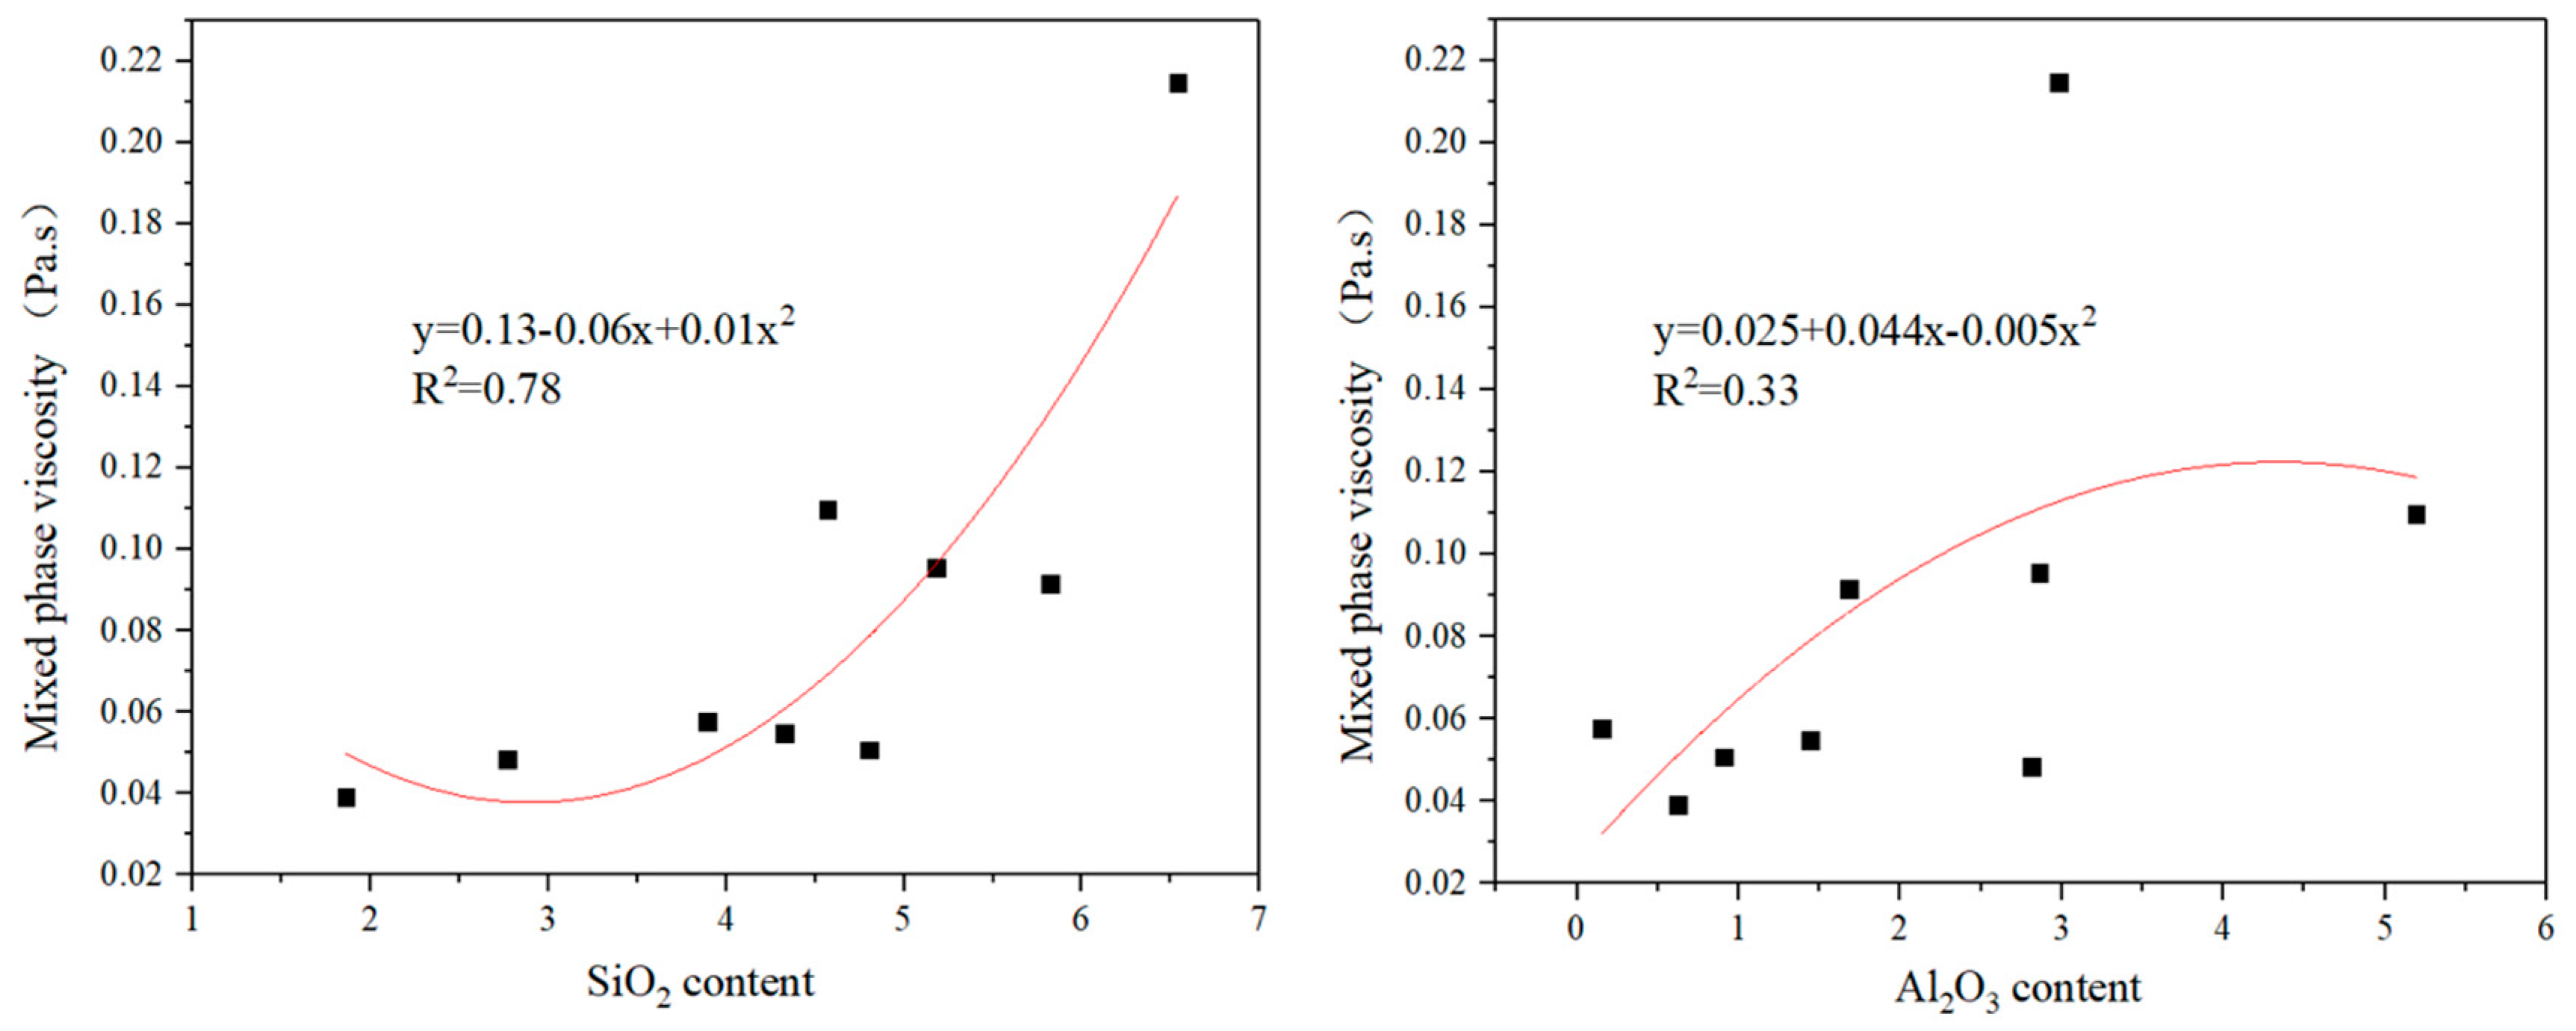
4.3. The Effect of the Liquid Phase Viscosity on FLP

In the sintering process, some physical properties of the generated liquids, such as the viscosity of liquid phase, are considered to affect the fluidity of the liquid phase and the microstructure of the iron ore sinter [18]. However, for the practical sintering process, it is very complex, the sintering temperature is relatively low, the bonding phase is identified as a solid-liquid coexistence phase, and the measurement of mixed phase viscosity is relatively cumbersome [19]. The FactSage software can be used to calculate the liquid phase content and the viscosity of the pure liquid phase; then, the viscosity of the mixed phase can be obtained by Equation (2).
The relationship between the pure liquid viscosity and the mixed phase viscosity with FLP under sintering temperature of 1300 °C is shown in Figure 9.
The results indicate that the FLP of iron ore decreases with the increase in the viscosity of the liquid phase. In other words, decreasing the viscosity of the liquid phase improves its fluidity. This study is in line with the results of previous studies [20,21,22]. They concluded that the spreading rate inversely correlates with the viscosity of the melt and the viscosity principally affects spreading in the horizontal direction. Therefore, the lower the viscosity of the liquid phase is, the greater the ability to spread or wet is, and the higher the FLP is. Compared with the fitting relationship of the FLP and the pure liquid viscosity, the fitting degree of the mixed phase viscosity is better. As a consequence, regarding the viscosity of the formed liquid phase during sintering process, the mixed phase viscosity is more important than the widely studied pure liquid viscosity, which can better characterize the fluidity of the liquid phase produced by its adhering fines during the sintering process [19].
The relationship between the mixed phase viscosity and gangue (SiO2 and Al2O3) content is illustrated in Figure 10. It shows that the viscosity of the liquid phase increases with increasing SiO2 or Al2O3 content, and the effect of SiO2 content of iron ore on the mixed phase viscosity is greater than that of Al2O3 content. According to the ionic theory of slag [23], SiO44− has been widely realized as a strong network-former, which has a tetrahedral structure. Al2O3 has been categorized as an amphoteric oxide and behaves as a network-former in a highly basic system, but AlO33− only provides three covalent bonds of O2−. Therefore, the increase in the viscosity of liquid phase is considered to be due to the increase in the size of flow units with the addition of SiO2 or Al2O3.
In conclusion, a comparative analysis of the effect of liquid phase content and mixed phase viscosity on the liquid phase fluidity was conducted, and the liquid phase content at the sintering temperature is the most important thermodynamic liquid phase formation characteristic affecting the liquid phase fluidity. Moreover, there is a good positive correlation between the liquid phase content and the liquid phase fluidity.

5. Conclusions

The effects of thermodynamic melt characteristics on the liquid phase fluidity under fixed CaO mass content condition were studied by using the FactSage software and a visible microsintering test device. The following results were obtained:
(1) The laws of liquid phase fluidity of the iron ores are significantly different under fixed alkalinity and fixed CaO mass content of the sample. Under the condition of fixed CaO mass content, the liquid phase fluidity decreases with the increase in gangue mineral content for the same type of iron ore. Moreover, the method of fixed CaO mass content is more consistent with the liquid phase formation behavior of iron ore in the adhering fines during the actual sintering process.
(2) The theoretical liquid formation temperature from the FactSage calculation could not characterize the liquid phase fluidity because the FactSage software does not take into account the actual kinetic conditions. However, the formation temperature of the effective liquid phase can better reflect the liquid phase fluidity of iron ore, and the liquid phase fluidity increases with decreasing formation temperature of the effective liquid phase.
(3) The liquid phase content at the sintering temperature is the most important thermodynamic melt formation characteristic affecting the liquid phase fluidity. In addition to the liquid phase content, other minerals also have a greater impact on liquid phase fluidity. Due to the formation of high melting point minerals, such as silicate or melilite, the liquid phase content of iron ore with a high gangue (SiO2 or Al2O3) content would be relatively decreased.
(4) Decreasing the viscosity of the liquid phase improves the liquid phase fluidity of iron ore. The mixed phase viscosity is more important than the widely studied pure liquid viscosity, and it can better characterize the liquid phase fluidity during the sintering process. Moreover, the effect of SiO2 content of iron ore on the mixed phase viscosity is greater than that of Al2O3 content.

Author Contributions

Conceptualization, S.W. and B.S.; Data curation, S.W., W.Z. and B.S.; Formal analysis, W.Z.; Funding acquisition, S.W. and H.L.; Investigation, S.W.; Methodology, W.Z. and B.S.; Project administration, S.W. and B.S.; Resources, S.W. and B.S.; Software, B.S.; Supervision, S.W. and H.L.; Visualization, H.L.; Writing—original draft, B.S.; Writing—review & editing, W.Z.

Funding

This work was supported by the National Natural Science Foundation of China (Grant Number 51804027), the China Postdoctoral Science Foundation (Grant Number 2017M610769).

Acknowledgments

The authors would like to thank the financial support of Fundamental Research Funds for the Central Universities (Grant Number FRF-IC-18-010).

Conflicts of Interest

The authors declare no conflict of interest.

References

  1. Webster, N.A.S.; Pownceby, M.I.; Madsen, I.C. Silico-ferrite of calcium and aluminum (SFCA) iron ore sinter bonding phases: New insights into their formation during heating and cooling. Metall. Mater. Trans. B 2012, 43, 1344–1357. [Google Scholar] [CrossRef]
  2. Sinha, M.; Nistala, S.H.; Chandra, S.; Mankhand, T.R.; Ghose, A.K. Correlating mechanical properties of sinter phases with their chemistry and its effect on sinter quality. Ironmak. Steelmak. 2017, 44, 100–107. [Google Scholar] [CrossRef]
  3. Umadevi, T.; Brahmacharyulu, A.; Sah, R.; Mahapatra, P.C.; Prabhu, M. Optimisation of MgO addition in low and high silica iron ore sinter to improve sinter reducibility at JSW Steel Limited. Ironmak. Steelmak. 2014, 41, 270–278. [Google Scholar] [CrossRef]
  4. Wu, S.L.; Liu, Y.; Du, J.X.; Mi, K.; Lin, H. Experiment study of assimilation ability between iron ores and CaO. J. Univ. Sci. Technol. Beijing 2002, 24, 254–257. (In Chinese) [Google Scholar] [CrossRef]
  5. Wu, S.L.; Du, J.X.; Ma, H.B.; Tian, Y.Q.; Xu, H.F. Fluidity of liquid phase in iron ores during sintering. J. Univ. Sci. Technol. Beijing 2005, 27, 291–293. (In Chinese) [Google Scholar] [CrossRef]
  6. Wu, S.L.; Pei, Y.D.; Chen, H.; Peng, P.; Yang, F. Evaluation on liquid phase fluidity of iron ore in sintering. J. Univ. Sci. Technol. Beijing 2008, 30, 1095–1100. (In Chinese) [Google Scholar] [CrossRef]
  7. Xiao, Z.X.; Chen, L.K.; Yang, Y.D.; Li, X.C.; Barati, M. Effect of Coarse-grain and Low-grade Iron Ores on Sinter Properties. ISIJ Int. 2017, 57, 795–804. [Google Scholar] [CrossRef]
  8. Wu, S.L.; Oliveira, D.; Dai, Y.M.; Xu, J. Ore-blending optimization model for sintering process based on characteristics of iron ores. Int. J. Miner. Metall. Mater. 2012, 19, 217–224. [Google Scholar] [CrossRef]
  9. Wu, S.L.; Zhang, G.L.; Chen, S.G.; Su, B. Influencing factors and effects of assimilation characteristic of iron ores in sintering process. ISIJ Int. 2014, 54, 582–588. [Google Scholar] [CrossRef]
  10. Lv, X.W.; Bai, C.G.; Deng, Q.Y.; Huang, X.B.; Qiu, G.B. Behavior of liquid phase formation during iron ores sintering. ISIJ Int. 2011, 51, 722–727. [Google Scholar] [CrossRef]
  11. Okazaki, J.; Higuchi, K.; Hosotani, Y.; Shinagawa, K. Influence of iron ore characteristics on penetrating behavior of melt into ore layer. ISIJ Int. 2003, 43, 1384–1392. [Google Scholar] [CrossRef]
  12. Wu, S.L.; Bian, M.L.; Wang, Q.F.; Zhang, G.L.; Du, Y. Fusion characteristics of iron ore fines and its evaluation method. J. Univ. Sci. Technol. Beijing 2010, 32, 1526–1531. (In Chinese) [Google Scholar] [CrossRef]
  13. Liu, D.M.; Loo, C.E.; Pinson, D.; Burgess, S.; Evans, G.; Lucas, J. Understanding coalescence in iron ore sintering using two bench-scale techniques. ISIJ Int. 2014, 54, 2179–2188. [Google Scholar] [CrossRef]
  14. FactSage official Chinese website. Available online: http://www.factsage.com/ (accessed on 3 May 2018).
  15. Kasai, E.; Sakano, Y.; Kawaguchi, T. Influence of iron ore properties on the flow of melt formed in the sintering process. Tetsu Hagané 2000, 86, 139–145. [Google Scholar] [CrossRef]
  16. Zhang, G.L.; Wu, S.L.; Chen, S.G.; Su, B.; Hou, C.G. Influence of gangue existing states of iron ore on formation and flow of liquid phase in sintering process. Int. J. Miner. Metall. Mater. 2014, 10, 962–968. [Google Scholar] [CrossRef]
  17. Sinha, M.; Nistala, S.H.; Chandra, S.; Mankhand, T.R. Thermodynamic study of evolution of sinter phases at different alumina level. Ironmak. Steelmak. 2017, 44, 92–99. [Google Scholar] [CrossRef]
  18. Sukenaga, S.; Gonda, Y.; Yoshimura, S.; Saito, N.; Nakshima, K. Penetration behavior of calcium ferrite melts into hematite substrate. ISIJ Int. 2010, 50, 195–199. [Google Scholar] [CrossRef]
  19. Machida, S.; Nushiro, K.; Ichikawa, K.; Nada, H.; Sdakai, H. Experimental evaluation of chemical composition and viscosity of melts during iron ore sintering. ISIJ Int. 2005, 45, 513–521. [Google Scholar] [CrossRef]
  20. Schonhorn, H.; Frisch, H.L.; Kwei, T.K. Kinetics of wetting of surfaces by polymer melts. J. Appl. Phys. 1966, 37, 4967–4973. [Google Scholar] [CrossRef]
  21. Yin, L.; Murray, B.T.; Singler, T.J. Dissolutive wetting in the Bi-Sn system. Acta Mater. 2006, 54, 3561–3574. [Google Scholar] [CrossRef]
  22. Long, H.M.; Wu, X.J.; Chun, T.J.; Di, Z.X. Assimilation Behavior of Calcium Ferrite and Calcium Diferrite with Sintered Al2O3 and MgO. Metall. Mater. Trans. B 2016, 47, 2830–2836. [Google Scholar] [CrossRef]
  23. Liu, W.X. (Ed.) Metallurgy of Iron and Steel, 2nd ed.; Metallurgical Industry, Publishing House: Beijing, China, 2010; pp. 113–116. (In Chinese) [Google Scholar]
Figure 1. The visible micro-sintering test device.
Metals 09 00404 g001
Figure 2. Temperature and atmosphere systems of micro-sintering test.
Metals 09 00404 g002
Figure 3. Vertical project schematic diagram.
Metals 09 00404 g003
Figure 4. Fluidity index of liquid phase of iron ore.
Metals 09 00404 g004
Figure 5. Results of generation temperature of effective liquid phase.
Metals 09 00404 g005
Figure 6. Relationship between FLP and melt formation temperature. (a) The theoretical generation temperature of liquid phase (b) The generation temperature of effective liquid phase.
Metals 09 00404 g006
Figure 7. Liquid phase content under different sintering temperatures: (a) limonite, (b) hematite and goethite mixed ore, (c) hematite and (d) magnetite.
Metals 09 00404 g007
Figure 8. Relationship between FLP and liquid phase content under different sintering temperatures.
Metals 09 00404 g008
Figure 9. Relationship between FLP and liquid phase viscosity: (a) pure liquid viscosity and (b) mixed phase viscosity.
Metals 09 00404 g009
Figure 10. Relationship between the mixed phase viscosity and gangue content: (a) SiO2 content and (b) Al2O3 content.
Metals 09 00404 g010
Table 1. Chemical composition of 0.5-mm iron ore fines (wt%).
Iron OreTFeFeOCaOSiO2Al2O3MgOLOI
OA51.260.130.116.211.790.3510.72
OB52.030.110.104.601.530.3110.97
OC58.320.270.115.773.180.335.69
OD58.690.220.065.135.820.354.80
OE64.140.180.113.083.120.123.05
OF63.620.260.107.513.430.792.19
OG65.644.450.024.480.170.020.30
OH68.5929.020.42.170.720.771.05
OI57.5118.383.425.170.981.175.31
Table 2. Composition of the samples used in calculation with Factsage (wt%).
SampleFe2O3Fe3O4SiO2CaOAl2O3MgO
OA75.440.125.8216.611.680.33
OB77.200.104.3316.641.440.29
OC75.550.245.1815.872.860.30
OD74.030.204.5715.695.190.31
OE78.650.162.7715.502.810.11
OF74.190.236.5415.372.980.69
OG77.043.863.8915.060.150.02
OH1.0880.301.8615.480.620.66
OI19.3854.954.8018.880.911.09
Table 3. Calculation results of thermodynamic equilibrium and viscosity.
Iron OreTG (°C)Liquid Phase Content (wt%)Viscosity (Pa∙s)
1200 °C1250 °C1300 °C1350 °CPure LiquidMixed Phase
OA1131.7633.1838.6772.1783.520.04060.0918
OB1131.3148.5156.9280.2091.510.03160.0549
OC1131.0336.4241.6171.2581.490.04090.0955
OD1128.9242.6849.0562.5682.280.03400.1098
OE1130.4159.0568.3481.3891.660.02900.0486
OF1131.0519.5822.5454.8668.990.05800.2148
OG1168.3445.0654.6374.8787.000.02800.0577
OH1130.7365.5075.2282.1092.000.02400.0393
OI1129.6853.2360.5783.1595.250.03200.0508
Table 4. Thermodynamic equilibrium calculations for OC, OD, OH and OI.
Iron OreTemperature (°C)Phase Composition (wt%)
SLAGASPINAC2SAMel_A
OC120036.4247.1713.611.09
125041.6143.0210.213.33
130071.2526.880.000.00
OD120042.6838.294.5912.96
125049.0533.570.8114.94
130062.5627.050.008.61
OH120065.5032.742.900.00
125075.2225.650.170.00
130082.1018.750.000.00
OI120053.2335.1712.000.00
125060.5729.7210.010.00
130083.1515.921.160.00

