Article

Investigation of the Dynamic Recrystallization of FeMnSiCrNi Shape Memory Alloy under Hot Compression Based on Cellular Automaton

1
College of Mechanical and Electrical Engineering, Harbin Engineering University, Harbin 150001, China
2
College of Materials Science and Chemical Engineering, Harbin Engineering University, Harbin 150001, China
*
Authors to whom correspondence should be addressed.
Metals 2019, 9(4), 469; https://doi.org/10.3390/met9040469
Submission received: 29 March 2019 / Revised: 16 April 2019 / Accepted: 19 April 2019 / Published: 22 April 2019

Abstract

:
Dynamic recrystallization (DRX) takes place when FeMnSiCrNi shape memory alloy (SMA) is subjected to compression deformation at high temperatures. Cellular automaton (CA) simulation was used for revealing the DRX mechanism of FeMnSiCrNi SMA by predicting microstructures, grain size, flow stress, and dislocation density. The DRX of FeMnSiCrNi SMA has a characteristic of repeated nucleation and finite growth. The size of recrystallized grains increases with increasing deformation temperatures, but it decreases with increasing strain rates. The increase of deformation temperature leads to the decrease of the flow stress, whereas the increase in strain rate results in the increase of the flow stress. The dislocation density exhibits the same situation as the flow stress. The simulated results were supported by the experimental ones very well. Dislocation density is a crucial factor during DRX of FeMnSiCrNi SMA. It affects not only the nucleation but also the growth of the recrystallized grains. Occurrence of DRX depends on a critical dislocation density. The difference between the dislocation densities of the recrystallized and original grains becomes the driving force for the growth of the recrystallized grains, which lays a solid foundation for the recrystallized grains growing repeatedly.

1. Introduction

Much attention has been paid to FeMnSi shape memory alloys (SMAs) since they were discovered because they possess low manufacturing costs, good formability, high mechanical properties, etc. [1,2]. The shape memory effect of FeMnSi SMAs stems from the transformation of γ austenite to ε martensite induced by external stress, where the corresponding crystal structure is changed from face-centered cubic (FCC) to close-packed hexagonal (HCP) structure [3,4,5]. Many researchers have devoted themselves to adding the alloying elements based on the FeMnSi SMAs in order to further enhance the shape memory effect or mechanical properties. The alloying elements deal with Cr, Ni, Sm, Ta, Nb, and Ti [6,7,8,9]. Among the alloying elements, the addition of Cr and Ni contributes to improving the corrosion resistance of FeMnSi SMAs. The FeMnSiCrNi SMAs have been widely investigated by many researchers [10,11,12]. It is generally accepted that hot working is an indispensable approach to making FeMnSiCrNi SMAs into products for engineering application. In particular, it is of great importance to reveal the DRX mechanism of FeMnSiCrNi SMAs because DRX microstructures have an important influence on the transformation behavior of FeMnSiCrNi SMAs.
It is well known that cellular automaton (CA) is a typical algorithm that is able to represent the discrete spatial and temporal evolution of complex system, where a local or global transformation rule is used for the involved cells [13,14]. In addition, the transformation rule, which is likely to be deterministic or probabilistic, is used to determine the state variables of a lattice point according to its previous state variables along with the state variables of the neighboring sites [15,16]. Therefore, CA has been an effective simulation tool to predict the microstructures of metal materials. In particular, many researchers have been dedicated to developing all kinds of CAs to be used for describing DRX behavior of metals, including steels [17,18], magnesium alloy [19,20,21], Ni-based superalloy [22], and vanadium alloy [23]. The CA model is able to succeed in clarifying the nucleation and growth of the recrystallized grains during DRX of metal materials.
In the current study, a CA model is developed to understand the DRX behavior of FeMnSiCrNi SMAs undergoing plastic deformation at elevated temperature. The simulation results are supported by the experimental ones as well. The involved contents have not been reported in the literature until now.

2. Materials and Methods

The as-received Fe66Mn15Si5Cr9Ni5 (wt.%) SMA was used in the present study and it is simply termed as FeMnSiCrNi alloy. The FeMnSiCrNi samples, which possess a diameter of 6 mm and a height of 9 mm, were fabricated from the as-received FeMnSiCrNi alloy in order to be used for the compression experiments on the AG-Xplus equipment (Shimadzu Corporation, Hadano, Japan). In the compression experiments, the strain rates selected were 0.005, 0.05, and 0.5 s−1, and the temperatures determined were 850, 900, 950, and 1000 °C, respectively. In addition, the compressed deformation degree was 60%, which corresponds to the true strain of 0.9. The FeMnSiCrNi samples were firstly put into the heating furnace of the AG-Xplus equipment and then were heated to the desired temperatures, followed by being held for two minutes. Subsequently, they were subjected to compression and then were immediately put into water at room temperature. The compressed FeMnSiCrNi samples were cut along the compressive direction to observe the microstructures of the axial section. The FeMnSiCrNi specimens for optical microstructure analysis were firstly subjected to coarse grinding by means of abrasive paper with 1500 meshes and then underwent a fine grind using abrasive paper with 3000 meshes. Subsequently, they were polished by polishing cloth. Finally, they were etched in a solution with 6.7% CuSO4 + 26.3% HCl + 67% H2O, and the corresponding microstructures were characterized using a LEICA DM IRM optical microscope (Leica Camera AG, Solms, Germany).

3. Fundamentals of CA modeling

3.1. Model of Dislocation Evolution

The two competitive processes, namely, work hardening and DRX, coexist during plastic deformation of FeMnSiCrNi SMA at high temperatures. Consequently, the two processes lead to the variation of dislocation density. For clarifying the deformation characteristic of FeMnSiCrNi SMA, the Kocks-Mecking (K-M) model was adopted in the present work, where dislocation density is associated with the strain according to the following equation [24].
d ρ d ε = k 1 ρ k 2 ρ
where ɛ is true strain, k1 represents the parameter responsible for work hardening and k2 stands for the parameter responsible for softening. In addition, k1 and k2 are expressed by the following two Equations [25].
k 1 = 2 θ 0 / α G b
k 2 = 2 θ 0 / σ s
where σ s is saturation stress, α represents interaction between dislocations, whose value generally is 0.5–1.0, G is the shear modulus, depending on Young’s modulus E as well as Poisson’s ratio μ , b is Burgers vector, and θ 0 stands for work-hardening rate and it is solved by the following Equation [25].
d σ d ε = θ 0 ( 1 σ σ s )
where σ is flow stress, which is associated with dislocation density. Consequently, it satisfies the following equation [24,26].
σ = α G b ρ ¯
where ρ ¯ is the average dislocation density, and it can be expressed by the dislocation density of each cell ρ i , namely,
ρ ¯ = 1 N i = 1 n ρ i
where N represents the total cell number.

3.2. Model for Nucleation Rate

The successive nucleation model used in the present study was established by Ding and Guo [27]. According to their model, nucleation rate n ˙ depends on deformation temperature T as well as strain rate ε ˙ , namely,
n ˙ ( ε ˙ , T ) = C ε ˙ m exp ( Q act R T )
where C is a constant, R represents gas constant, m stands for material constant and it equals 1.0 based on References [25,28], and Q a c t is the activation energy. Therefore, the constitutive behavior of FeMnSiCrNi SMA during plastic deformation at high temperatures satisfies the Arrhenius equation [13], namely,
ε ˙ = A 0 [ sinh ( α σ ) ] n exp ( Q act R T )
where A 0 , α , and n are the material constants. According to the mathematical transformation of Equation (8), Q act is able to be expressed as follows [29].
Q act = R [ ln   ε ˙ lnsinh ( α σ ) ] T [ lnsinh ( α σ ) ( 1 / T ) ] ε ˙
The constant C in Equation (7) is able to be solved based on the experimental data. After the DRX percentage η is measured by experiment, n ˙ is calculated as follows [25].
η = n ˙ ε ε ˙ 4 3 π r d 3
where r d represents average radius of recrystallized grains, and it is calculated as follows [30].
σ G ( 2 r d b ) n = K
where n is approximately 2/3, and K is about 10 for most metals.
The critical dislocation density, where DRX begins to occur, is expressed by the following Equation [31].
ρ c = ( 20 γ   ε ˙ 3 b l M τ 2 ) 1 / 3
where τ is dislocation line energy, M represents grain boundary mobility ratio, l stands for mean free path of dislocation, and γ is the grain boundary energy. Furthermore, they are capable of be calculated by Equations (13)–(16), respectively [24].
τ = c 2 G b 2
where c 2 is a constant, and it is determined as 0.5.
M = δ D ob b k T exp ( Q b R T )
where δ represents characteristic thickness of grain boundary, D ob represents boundary self-diffusion coefficient, k stands for Boltzmann’ s constant, and Q b represents activation energy of boundary diffusion.
l = K G b σ
γ i = { γ m θ i 15 ° γ i = γ m θ i θ m ( 1 ln ( θ i θ m ) ) θ i < 15 °
where θ i represents misorientation between the ith recrystallized grain and its adjacent one, θ m and γ m represent grain boundary misorientation and grain boundary energy, respectively, when a high angle boundary (greater than 15°) occurs. In addition, γ m is calculated as follows [32].
γ m = G b θ m 4 π ( 1 μ )

3.3. Model for CA

In the present study, a two-dimensional model for CA was established in order to simulate the microstructural evolution during DRX of FeMnSiCrNi SMA. A 235 × 235 square lattice was used for implementing the involved simulation. One lattice corresponded to the size of 1 μm in the real material. Consequently, the simulation area was equivalent to 0.235 × 0.235 mm2 in a genuine FeMnSiCrNi SMA sample. In addition, the periodic boundary condition was used to simulate an infinite space. The V. Neumann’s neighboring rule was adopted. The involved simulation parameters are shown in Table 1. The other details with respect to the CA model can be found in literature [33].

4. Results and Discussion

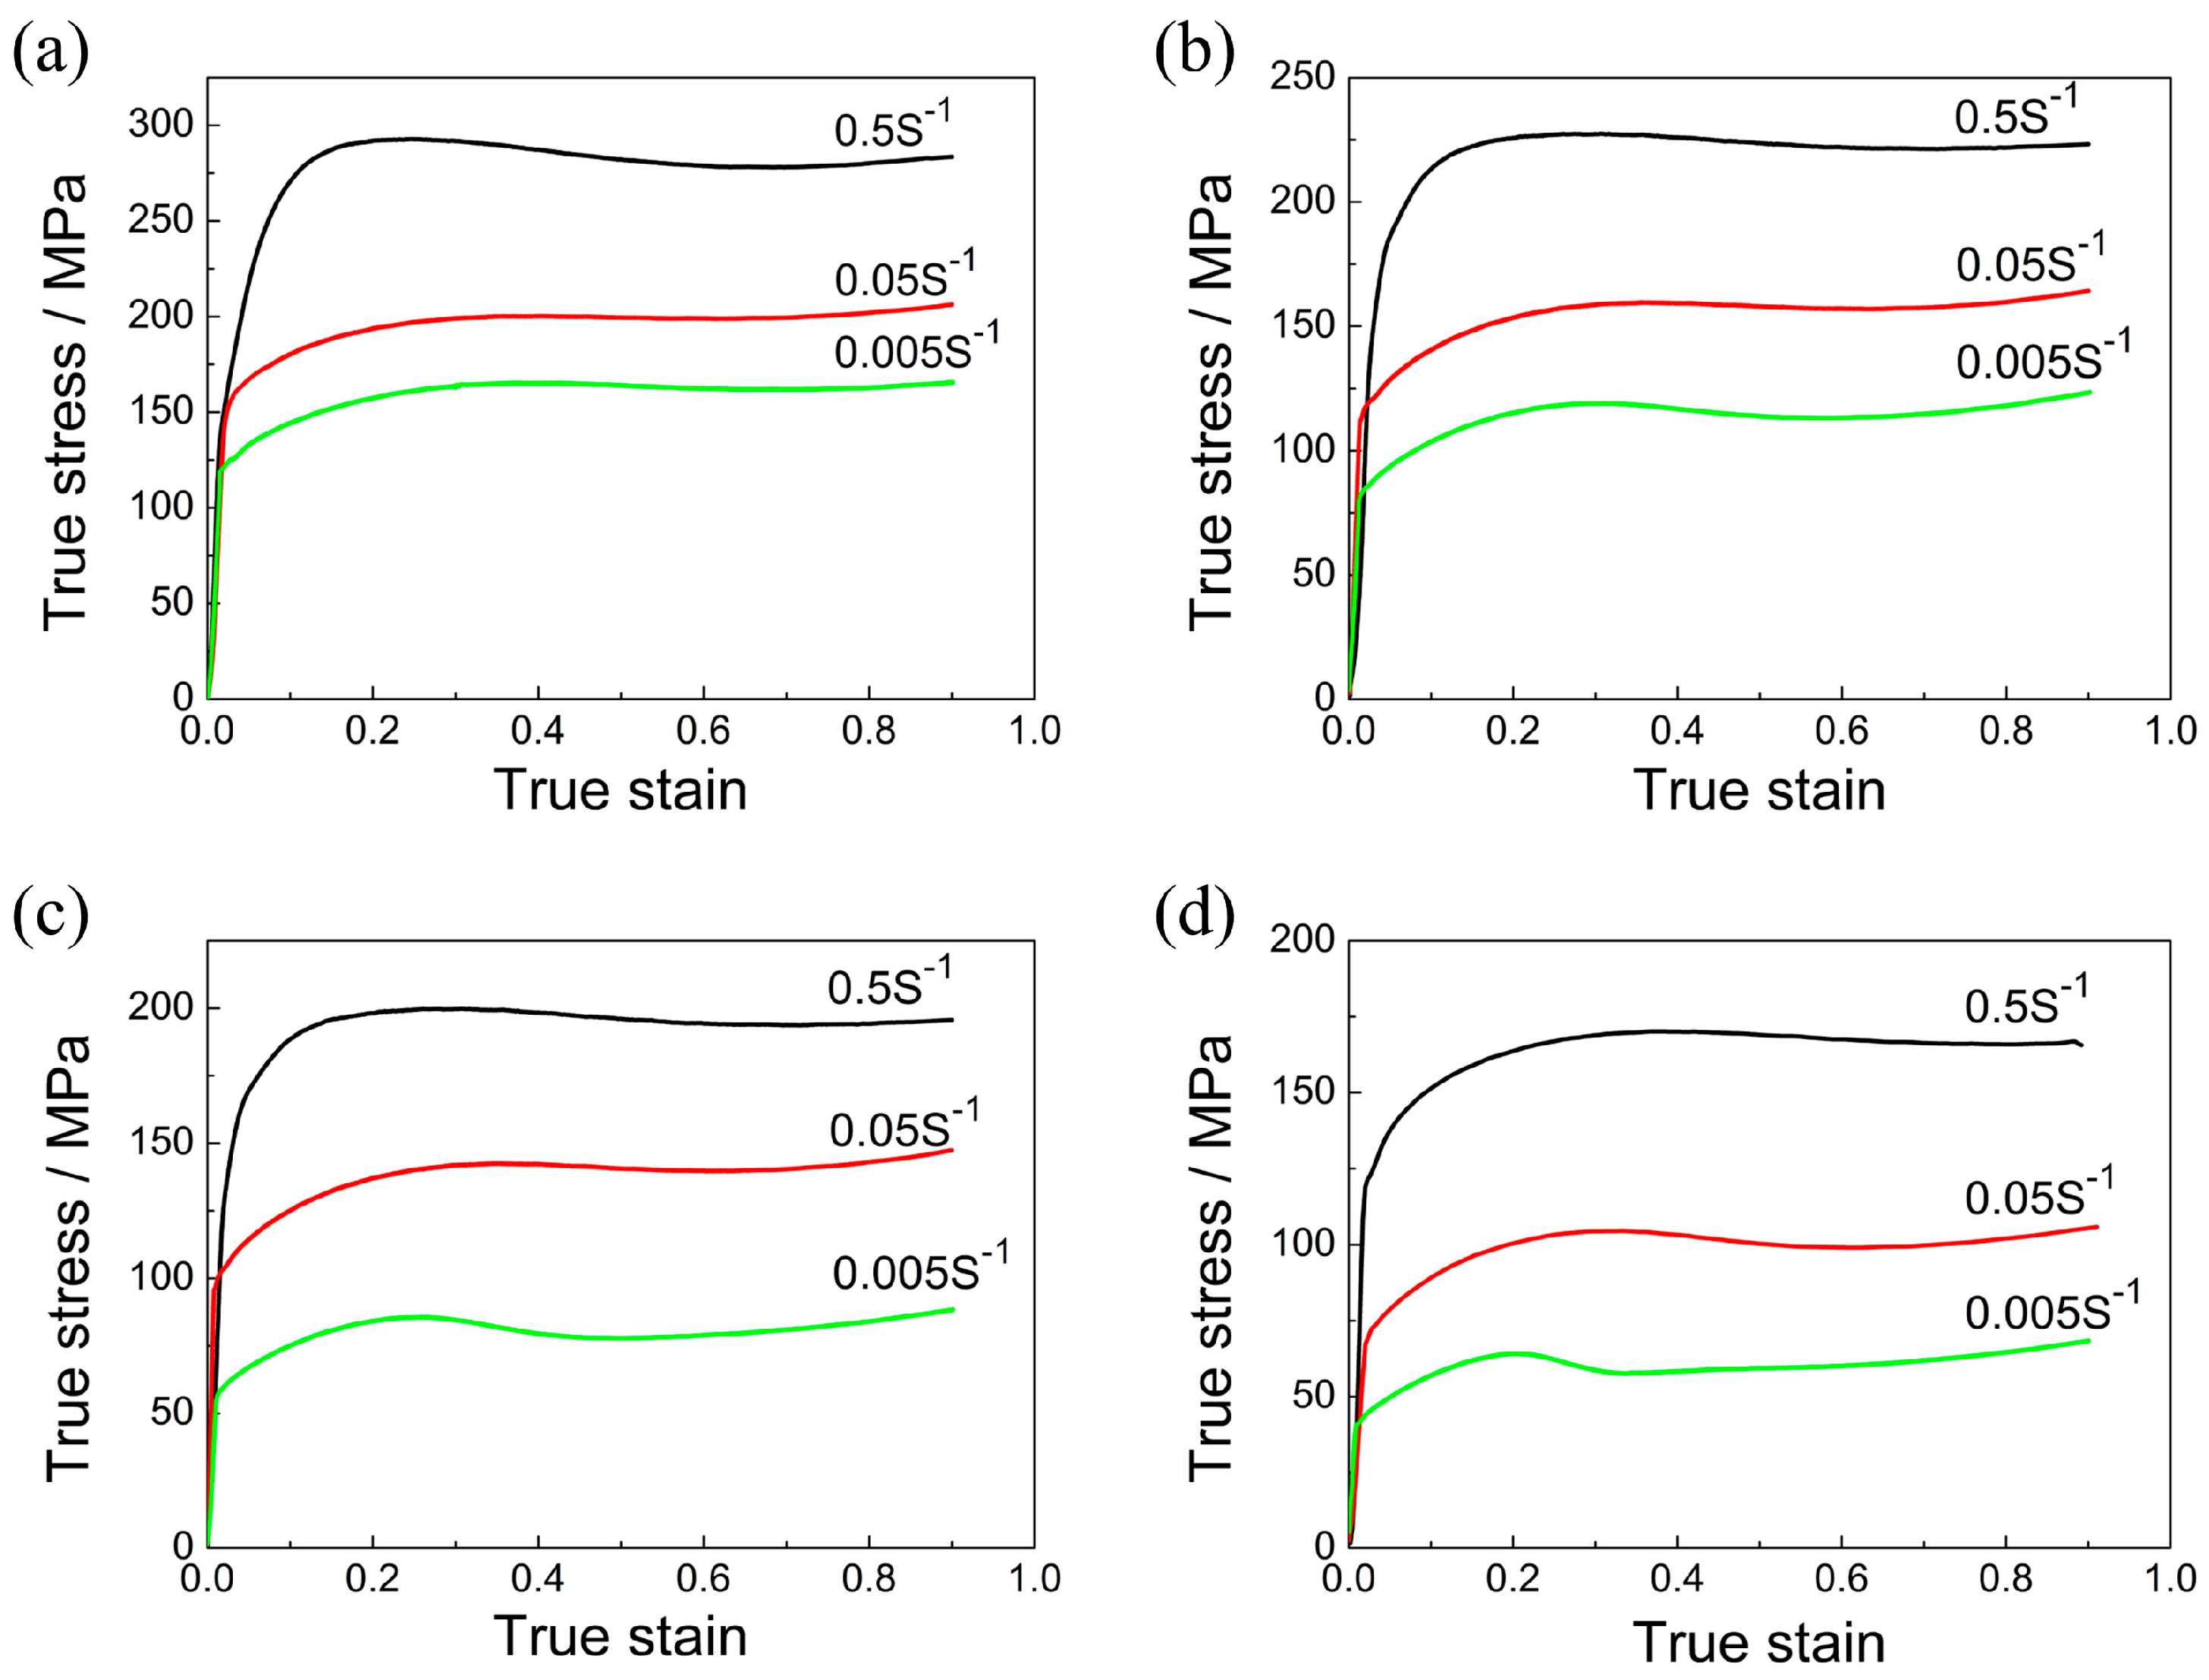
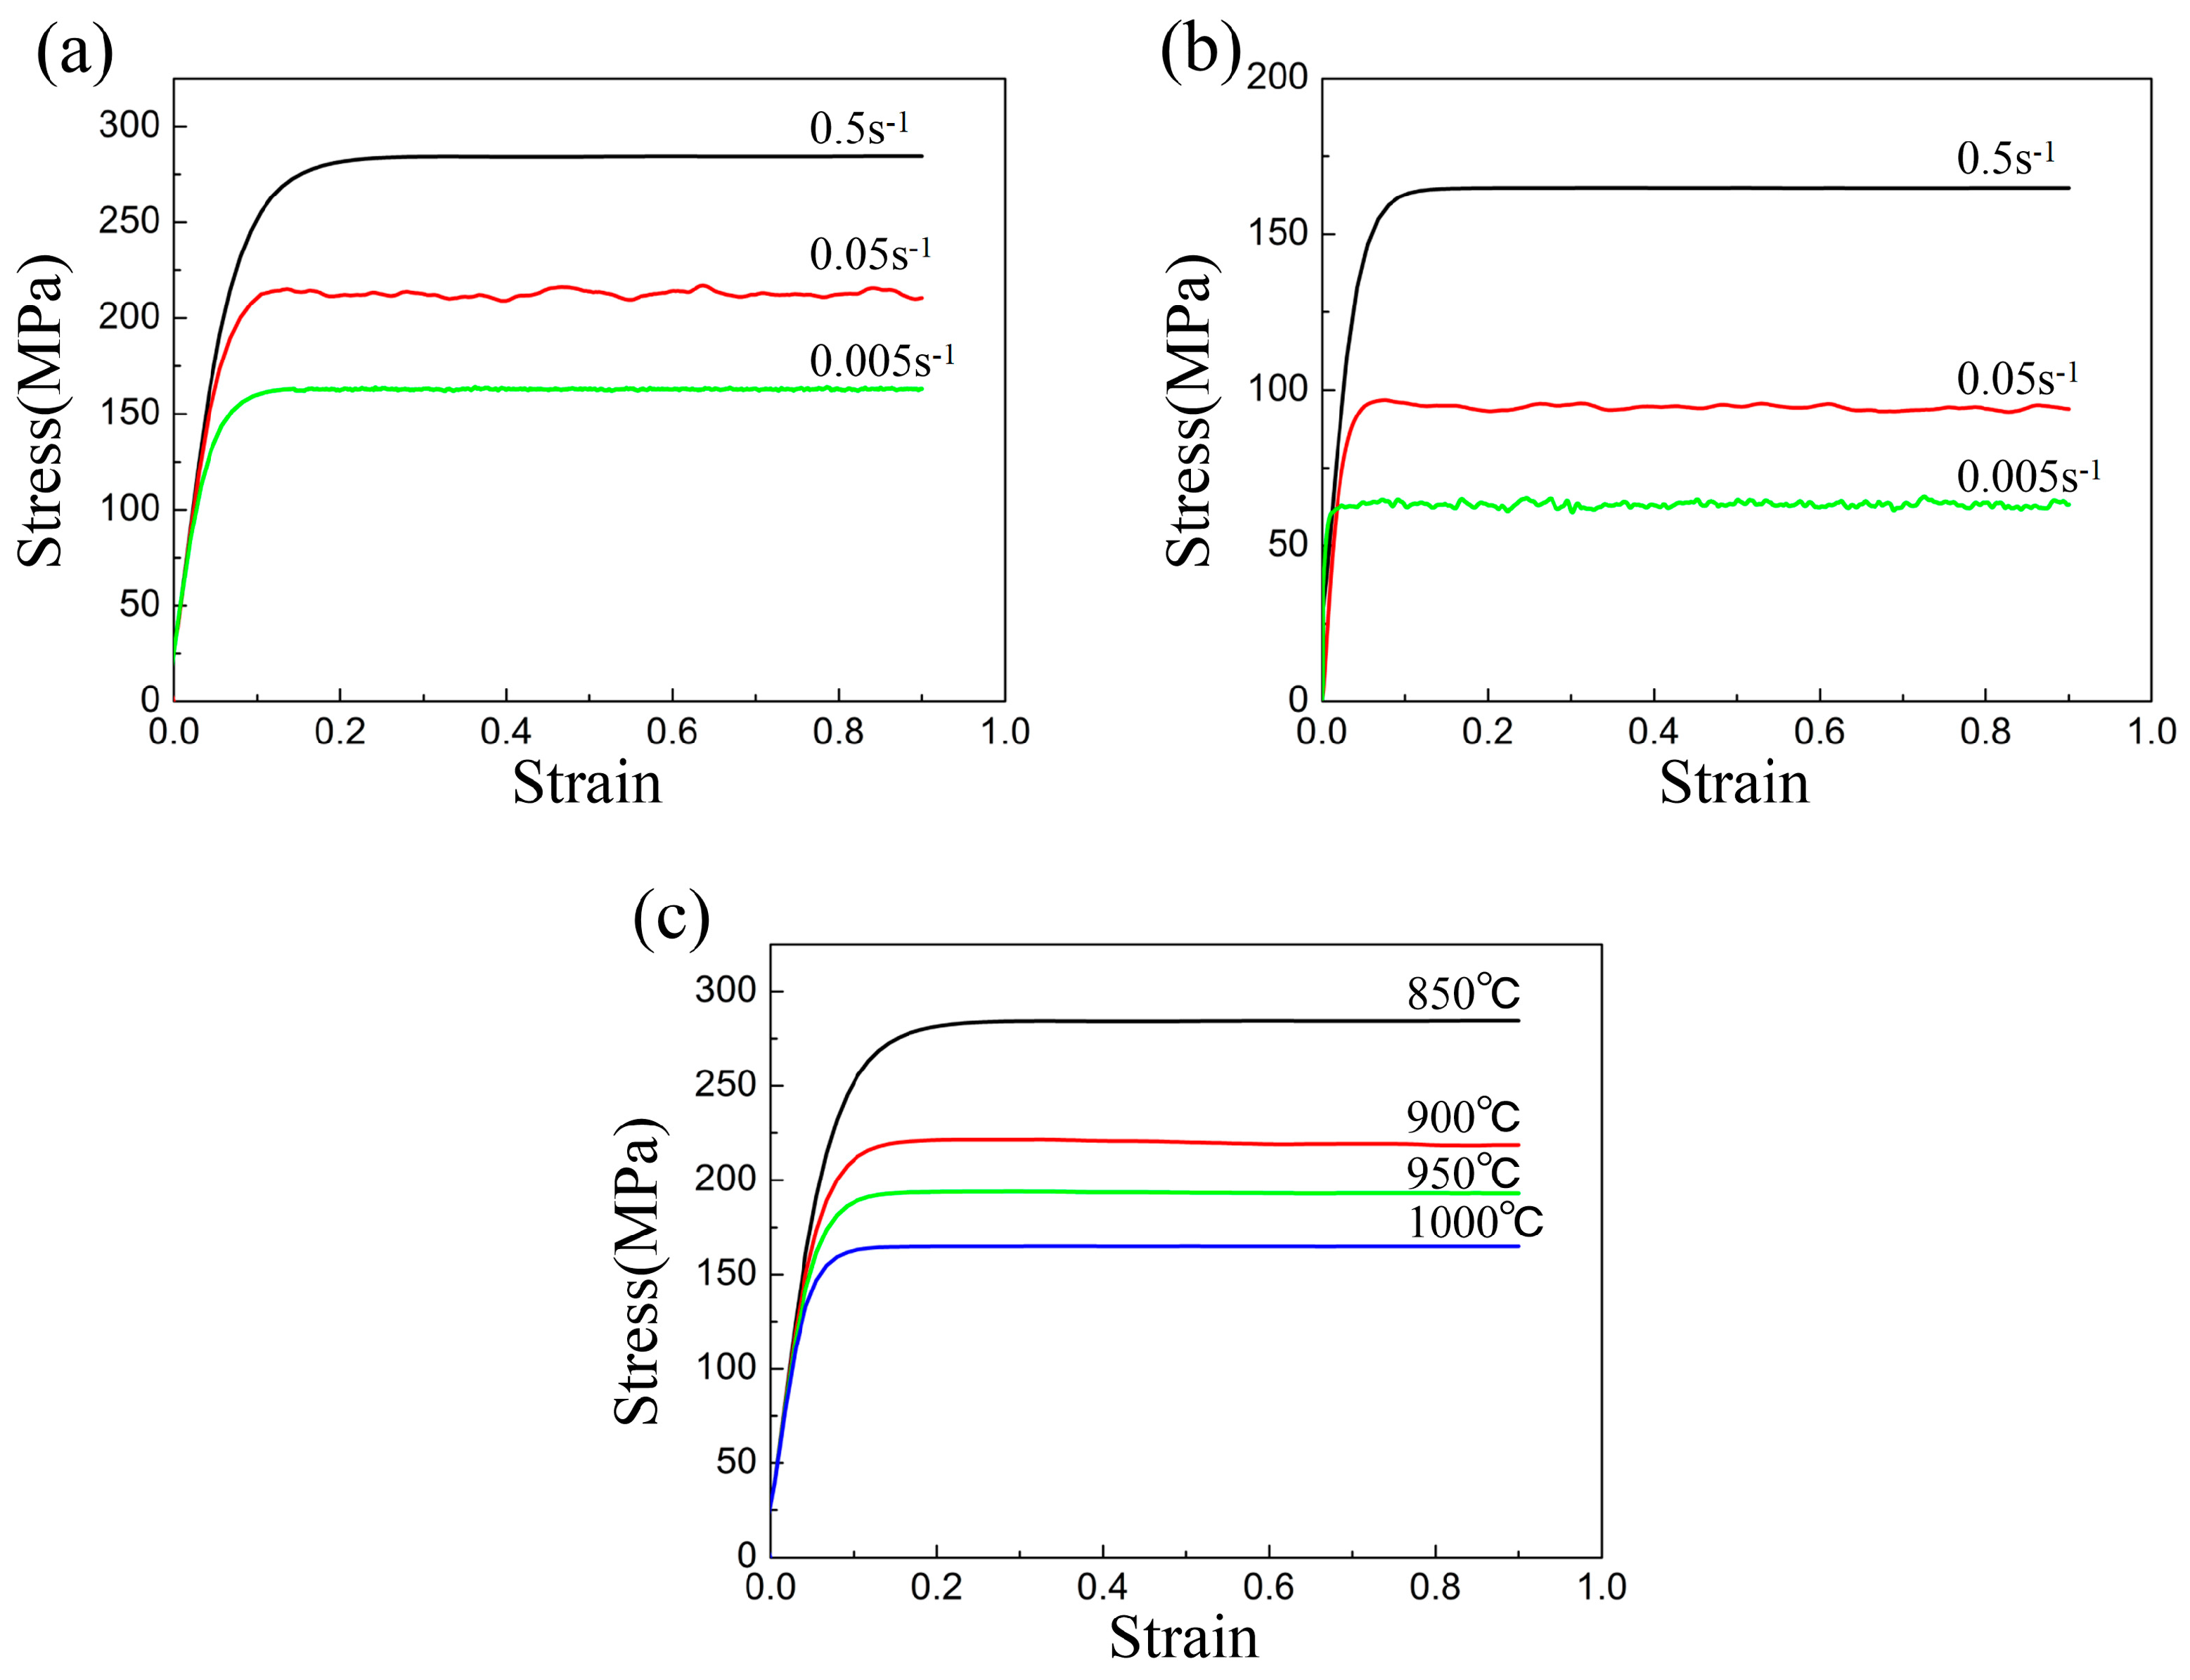
4.1. Flow Behavior of FeMnSiCrNi SMA

Figure 1 demonstrates true stress–strain curves of FeMnSiCrNi SMA subjected to compressive deformation. It is obvious that the stress value of FeMnSiCrNi SMA increases with strain rate, whereas they decrease with deformation temperature. In particular, the true stress increases with increasing true strain at the beginning, which indicates that the increasing dislocation density leads to the occurrence of working hardening. When plastic deformation continues to take place, flow stress possesses a stable value with increasing true strain. This reveals that DRX takes place during plastic deformation of FeMnSiCrNi SMA.

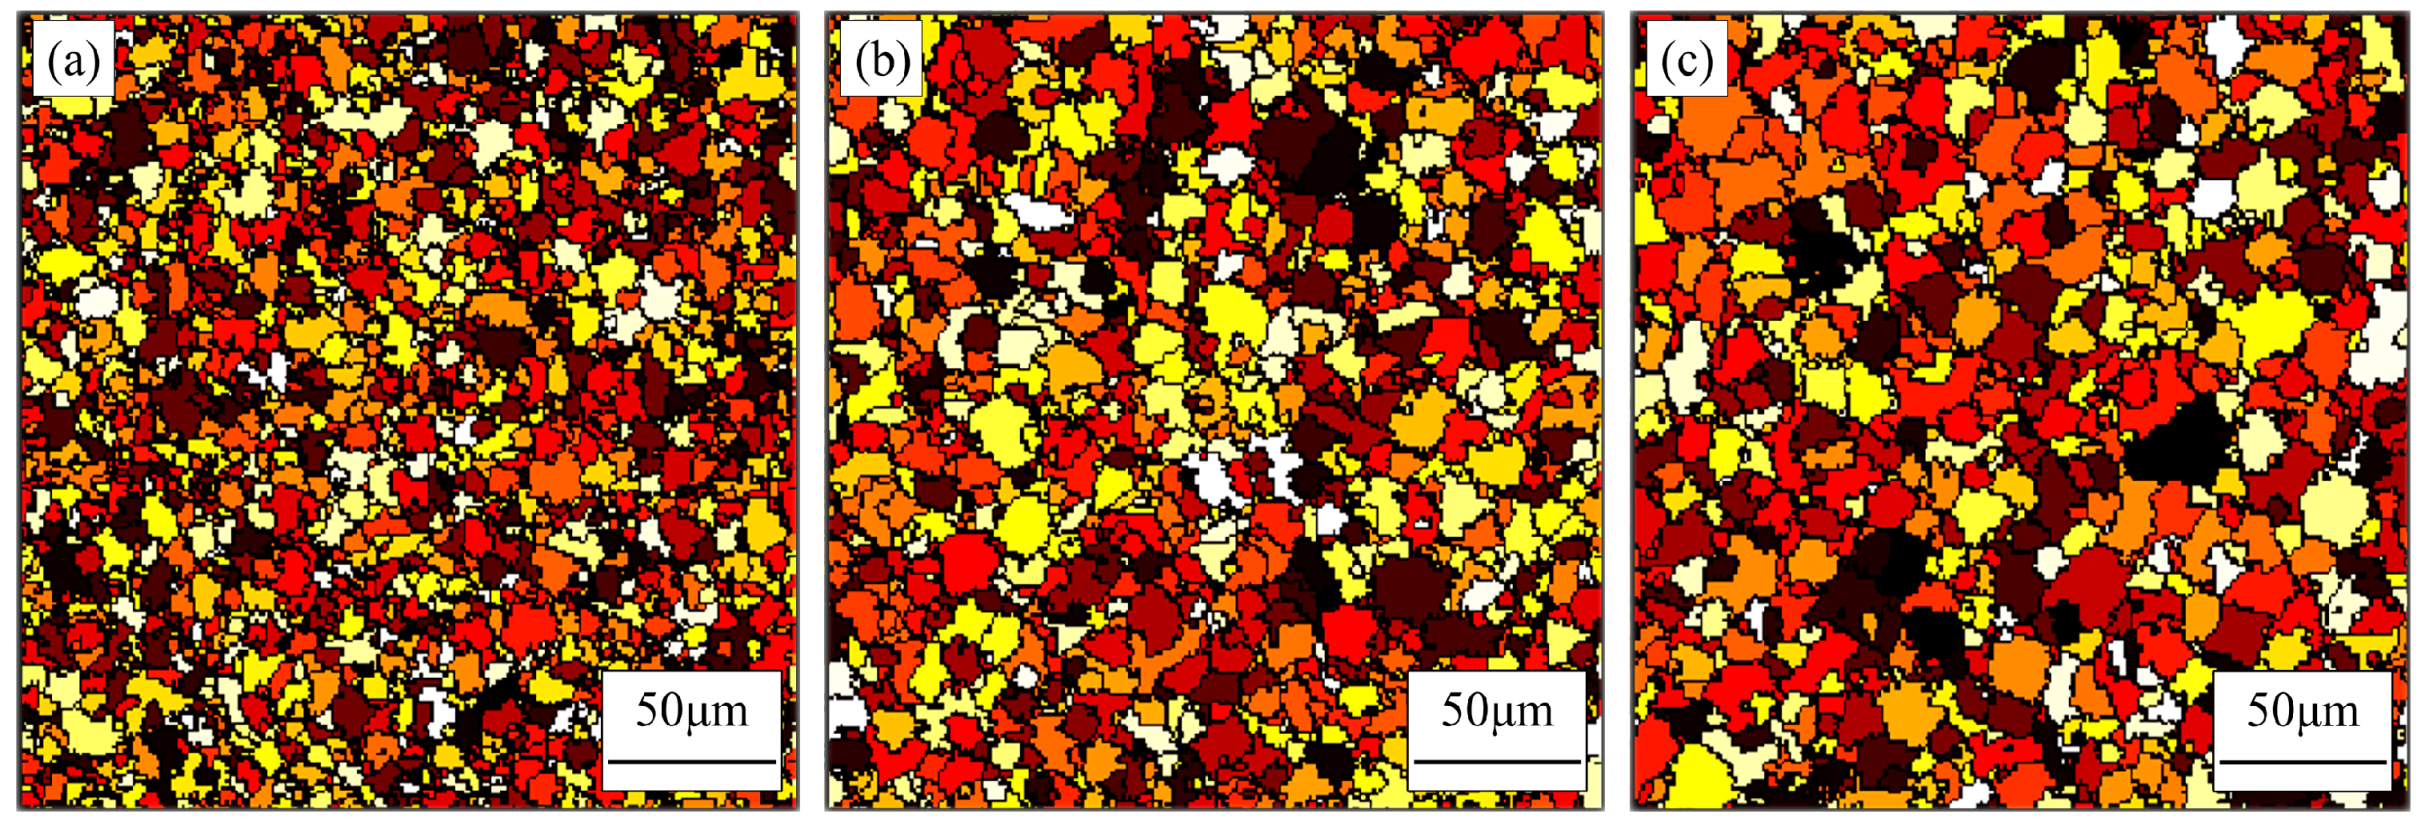
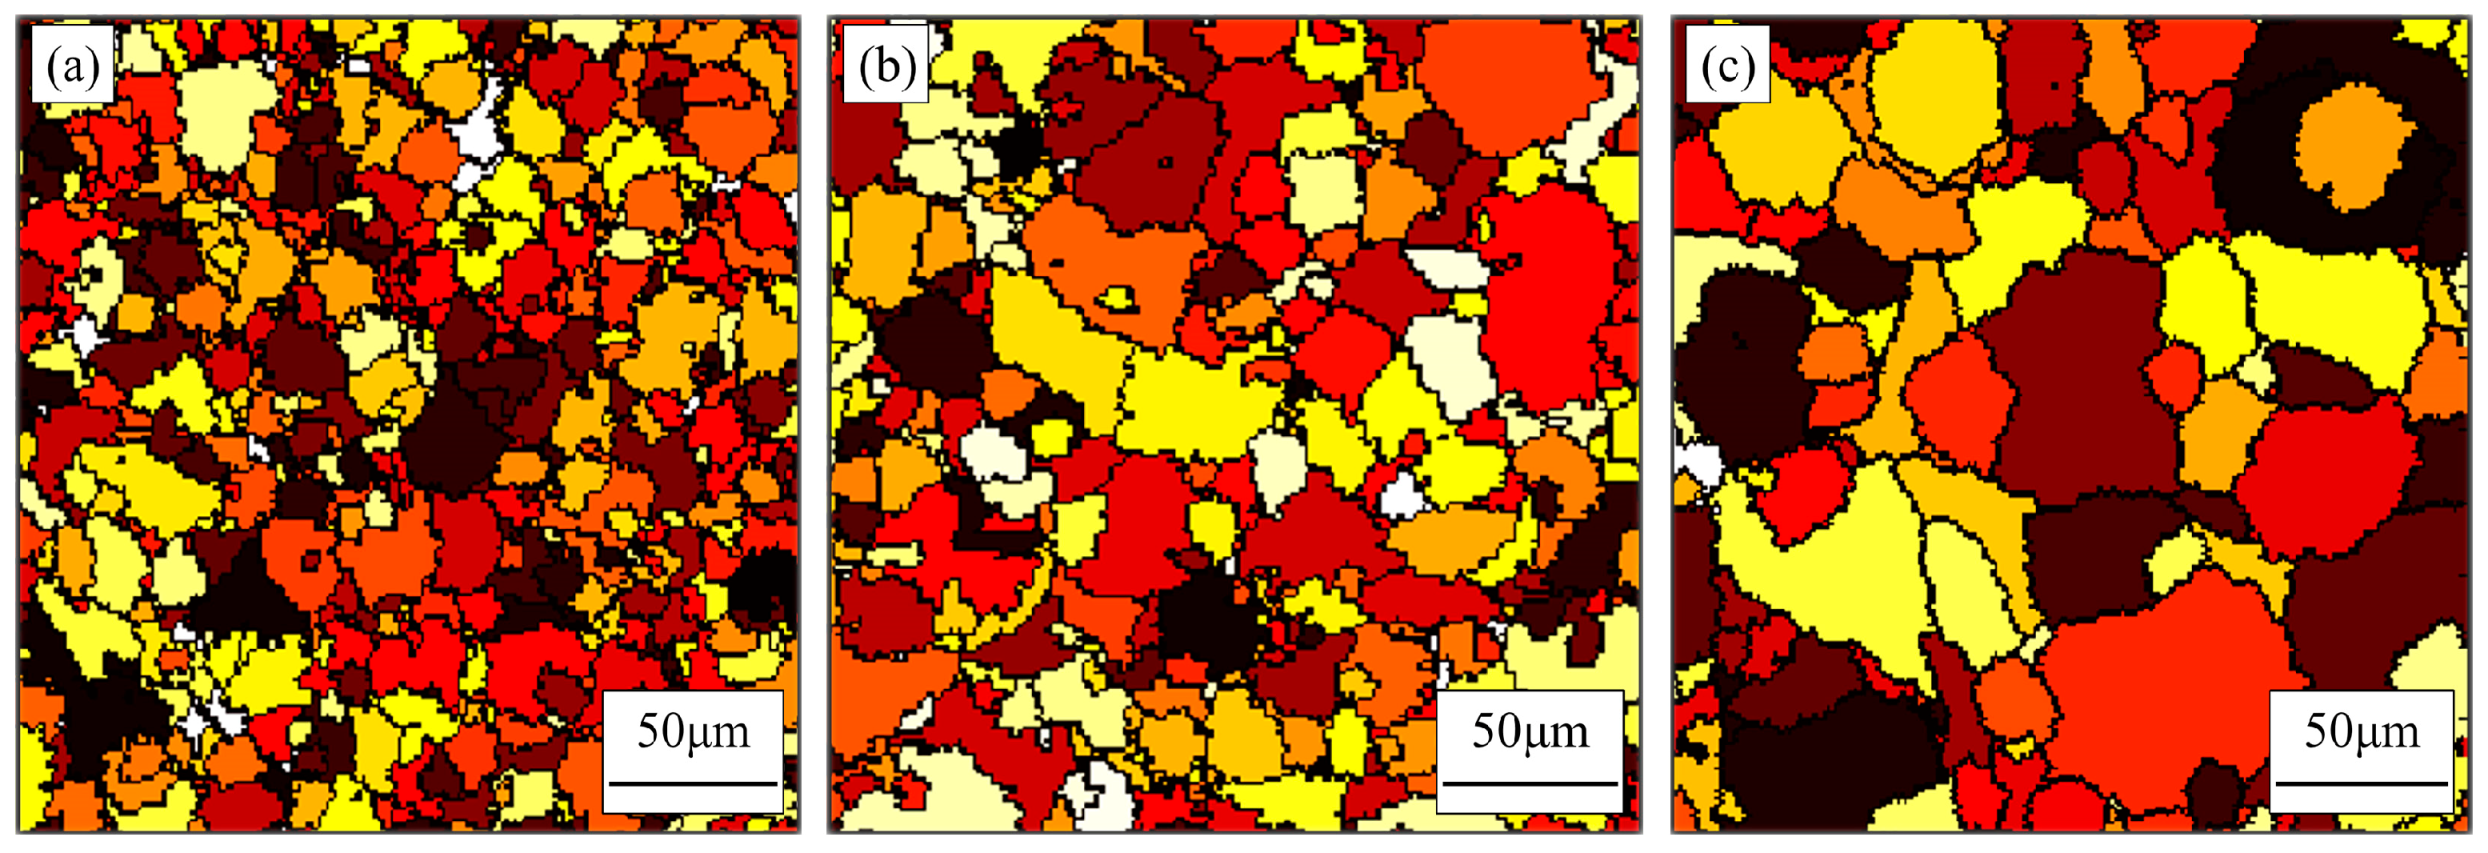
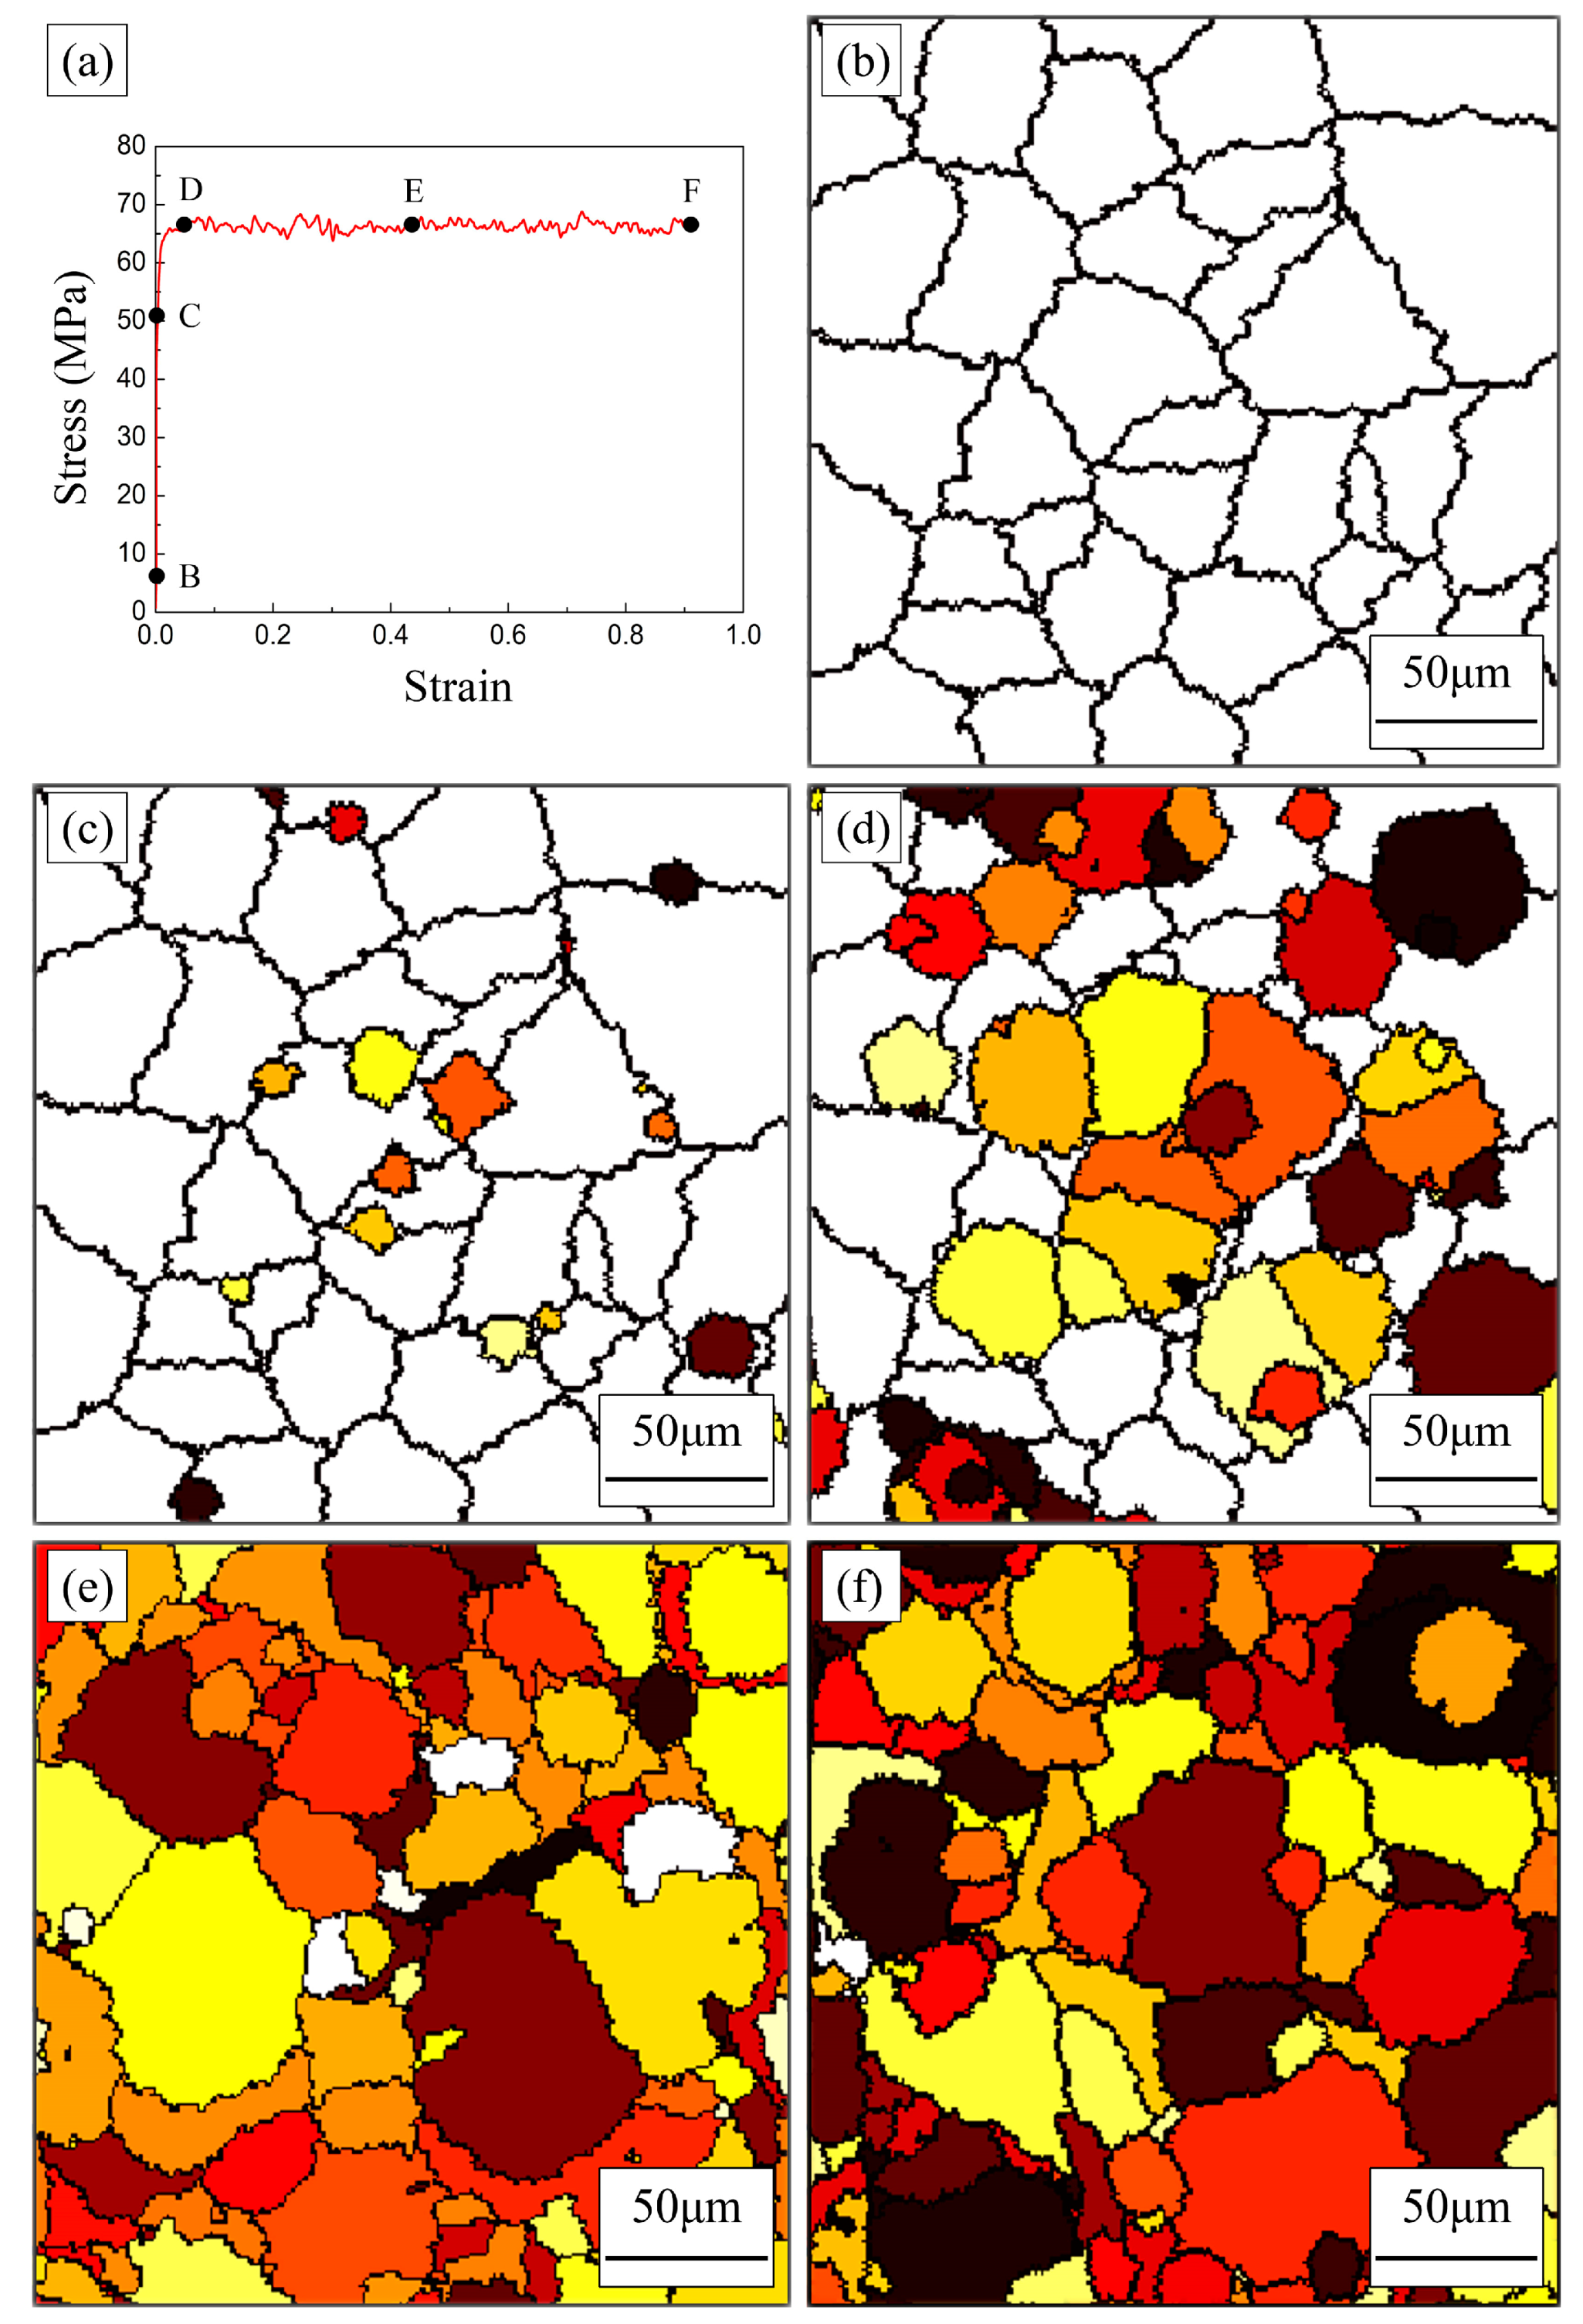
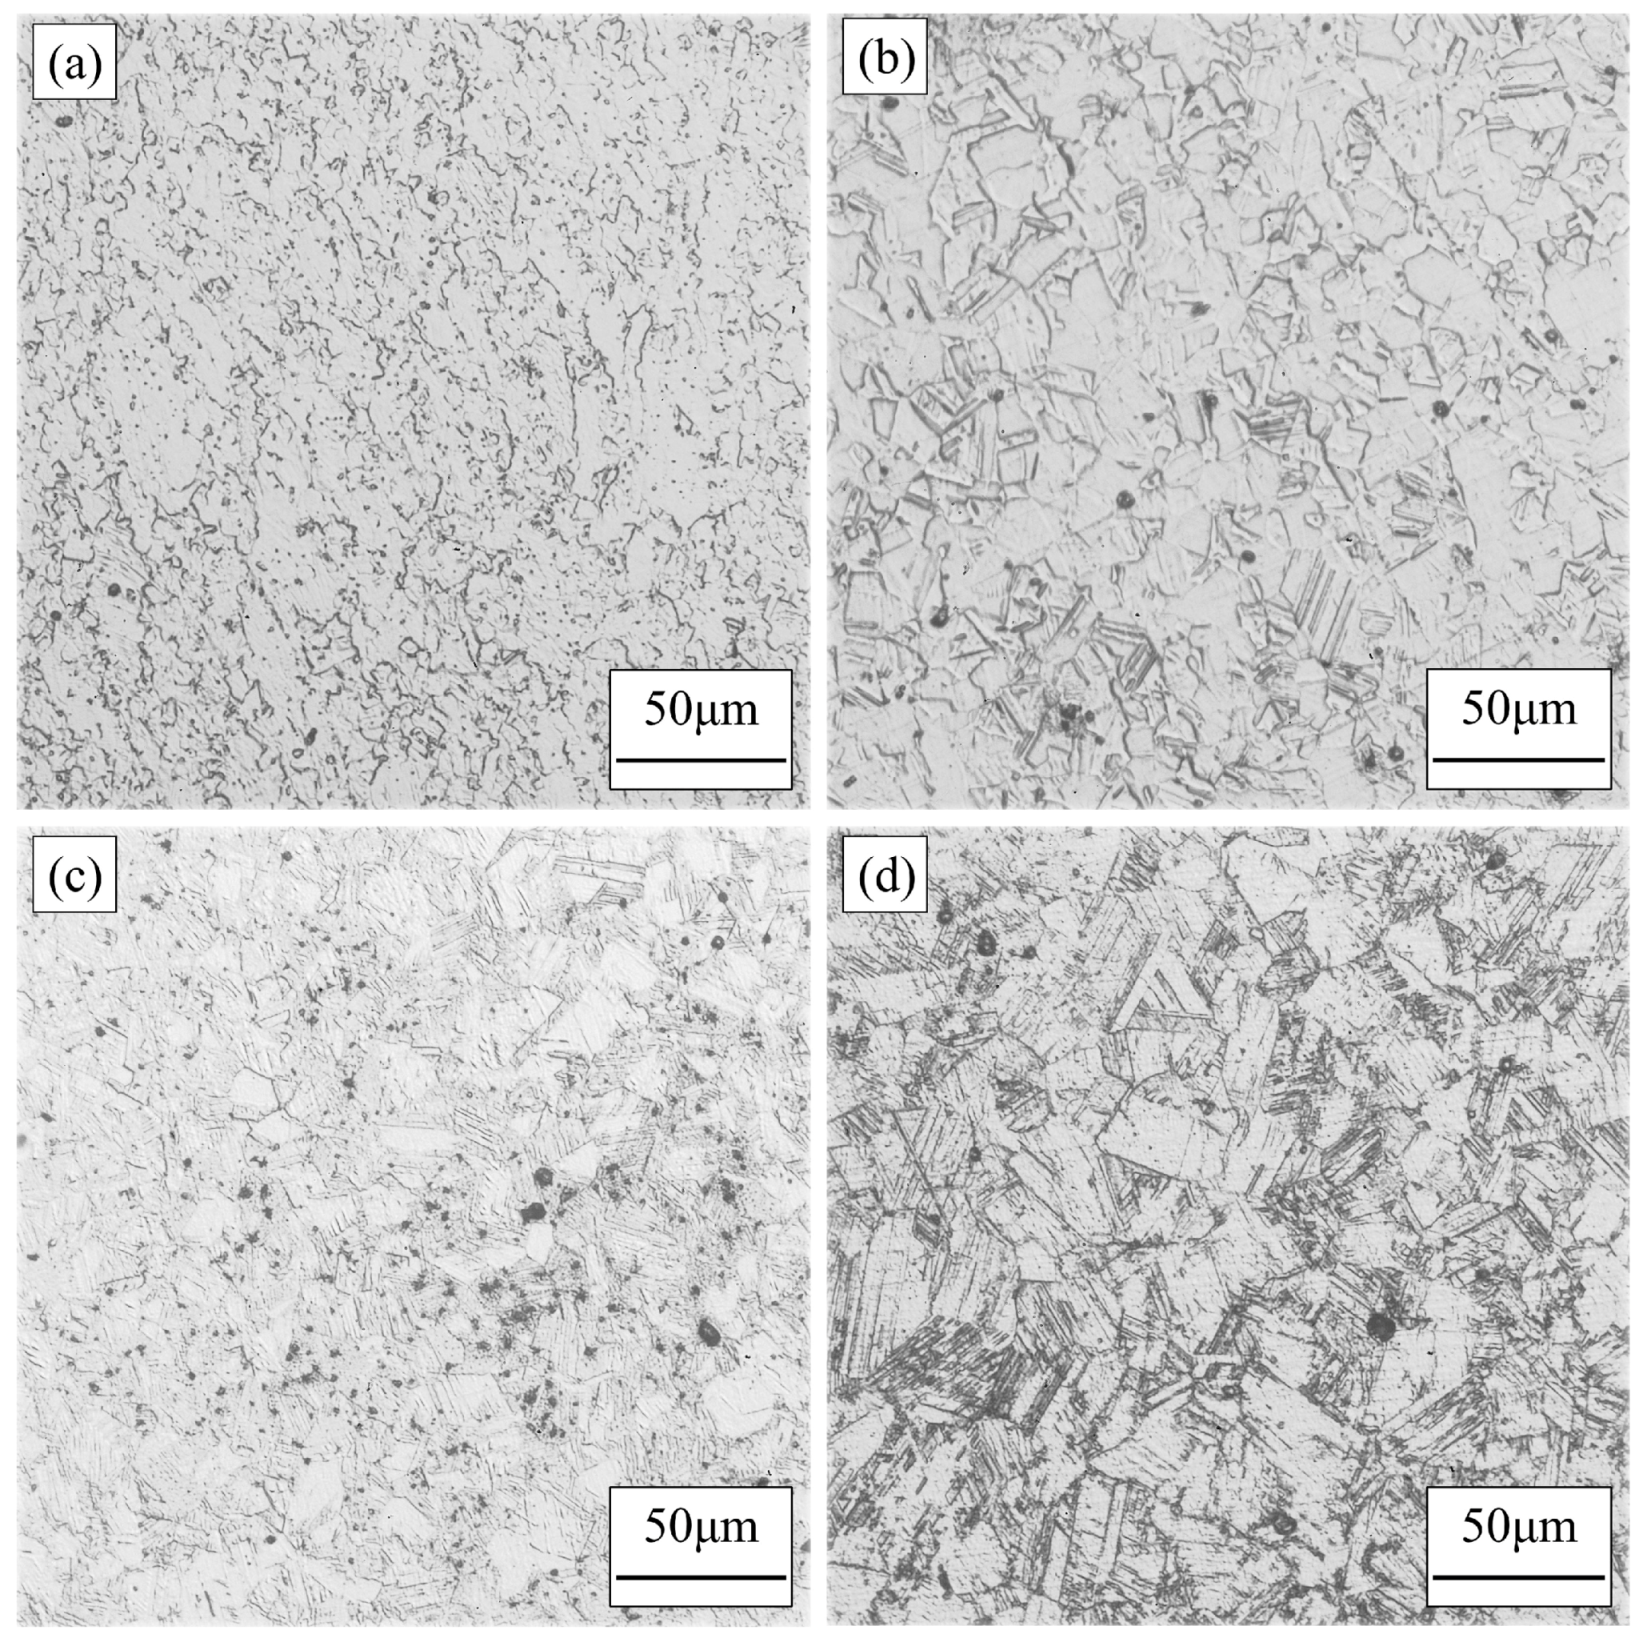
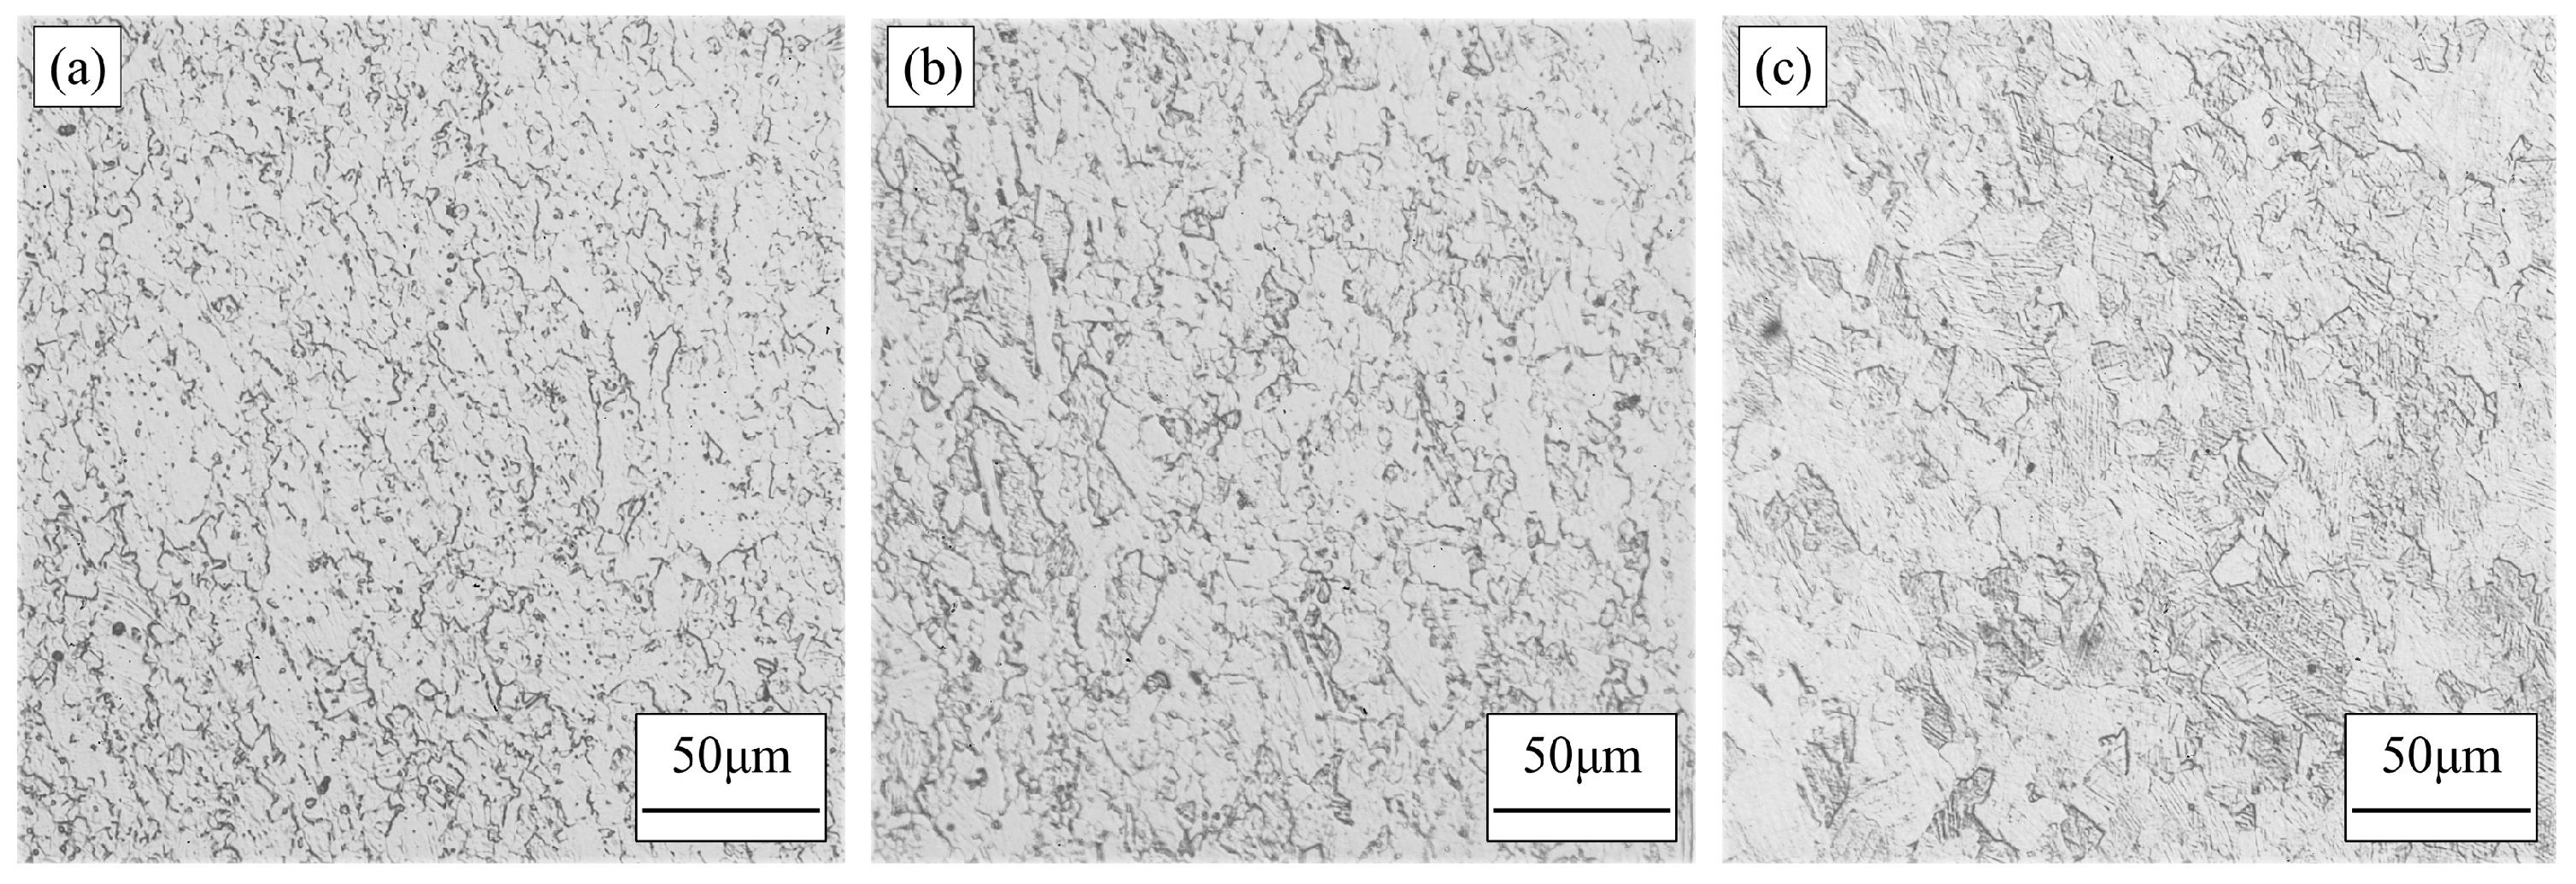
4.2. Microstructural Evolution of DRX

In order to reveal the mechanism of DRX, CA simulation was used to capture microstructural evolution of FeMnSiCrNi SMA subjected to compression, where the temperature and the strain rate were selected as 1000 °C and 0.005 s−1, respectively. The corresponding simulation results are illustrated in Figure 2. It was noted that no new grains occur at the point B of stress-strain curve in Figure 2a, as illustrated in Figure 2b. The stage can be viewed as the elastic deformation zone, and thus no new dislocations were induced. With increasing plastic strain, plenty of dislocations are formed. When the dislocation density achieved a critical value, new grains nucleated at the grain boundary, which corresponded to point C of the stress-strain curve in Figure 2a, as shown Figure 2c. It is well known that DRX is able to repeatedly nucleate and finitely grow. For example, it can be observed from Figure 2d that the new grains arose in the dynamically recrystallized grains. With the repeated progression of DRX, almost complete DRX occurred, as shown Figure 2f.

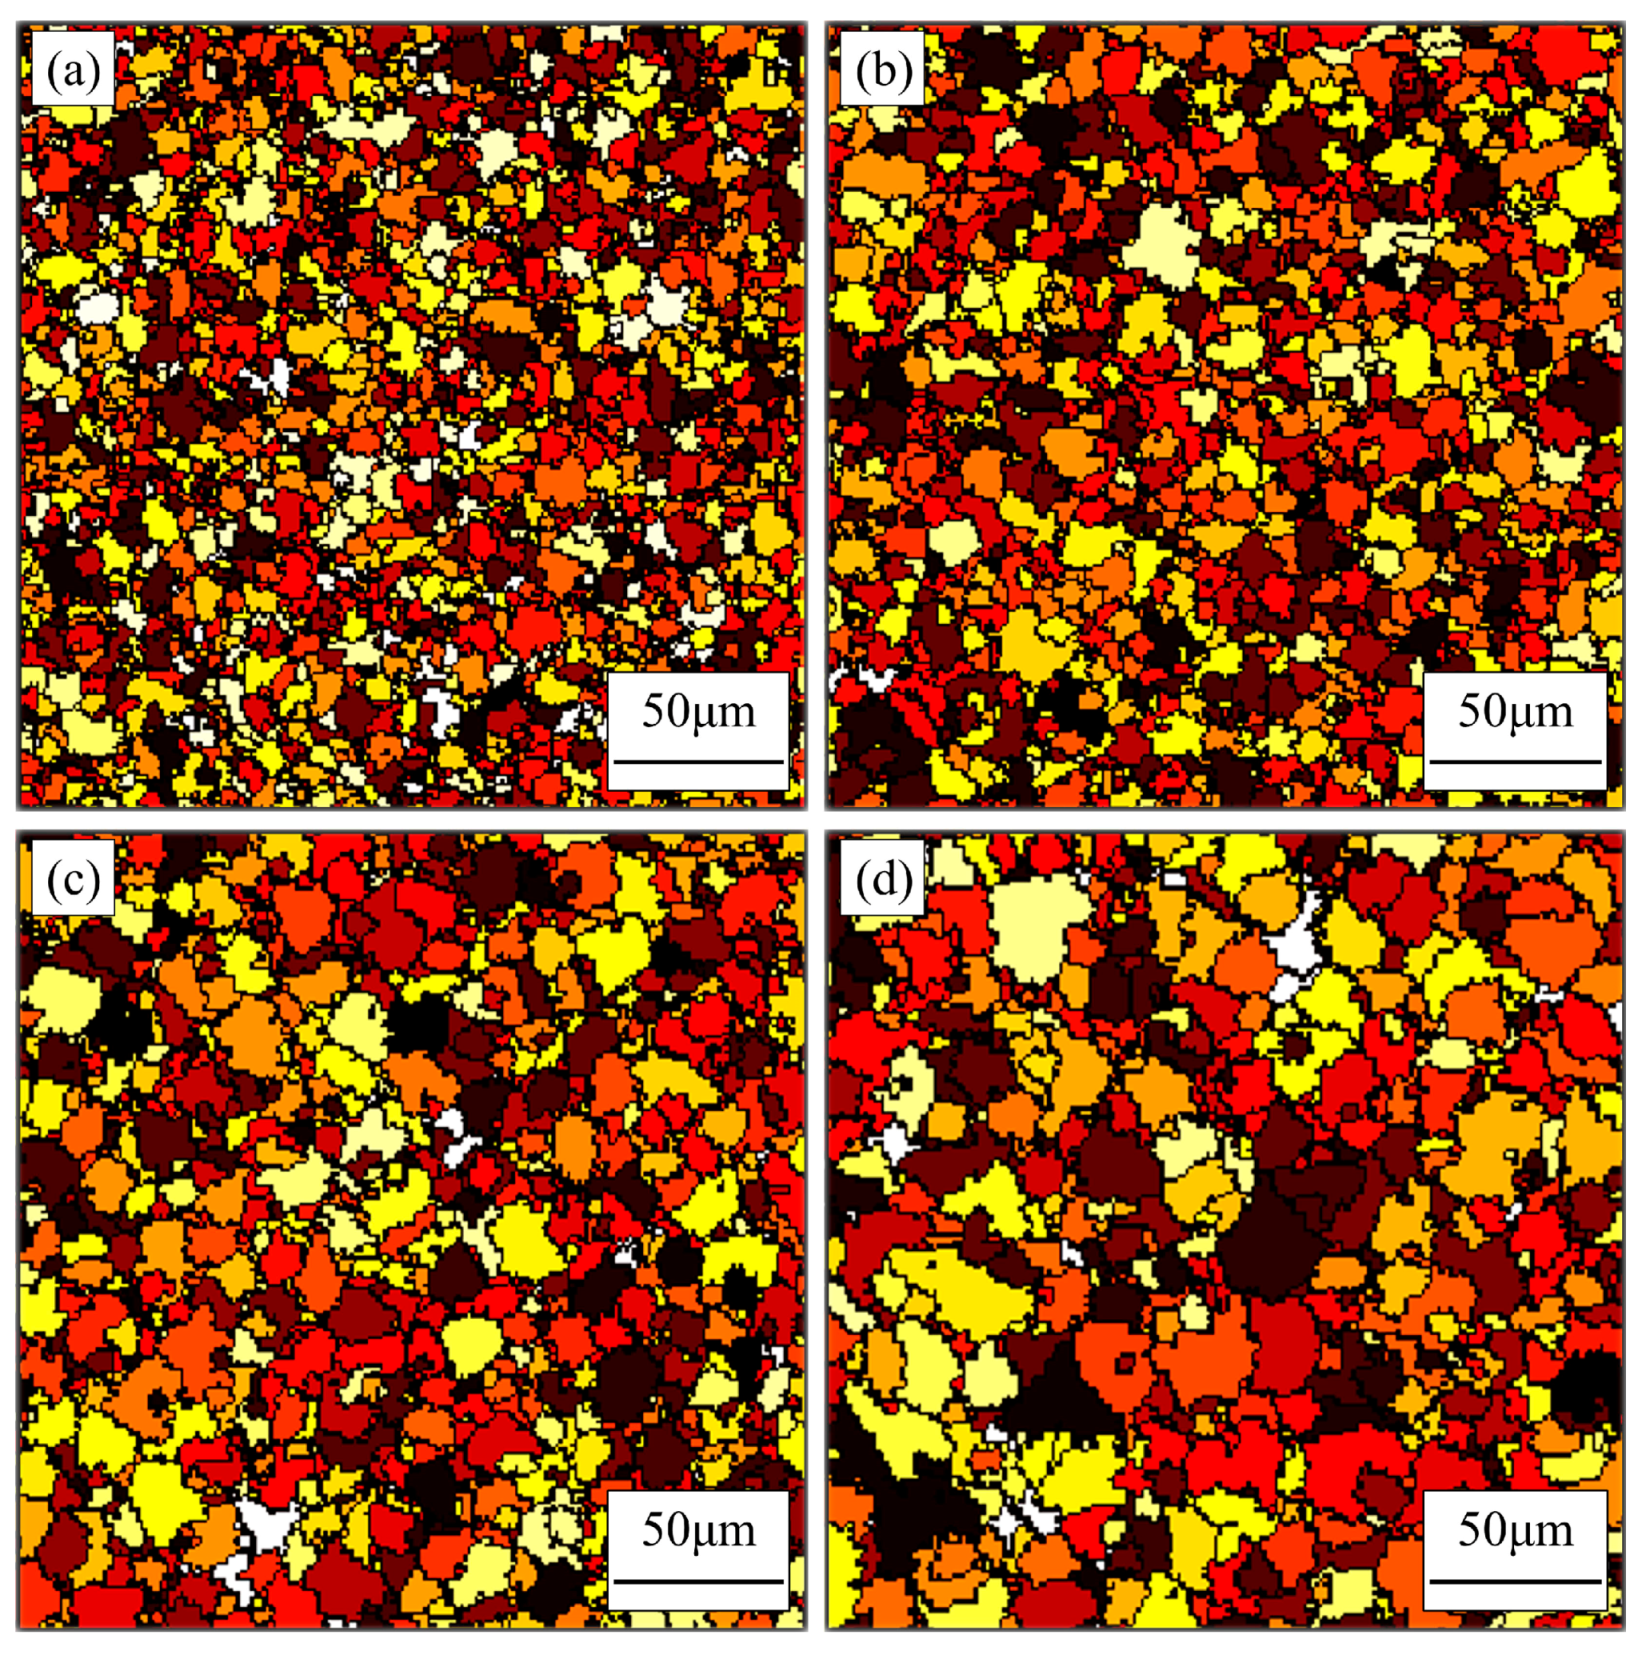
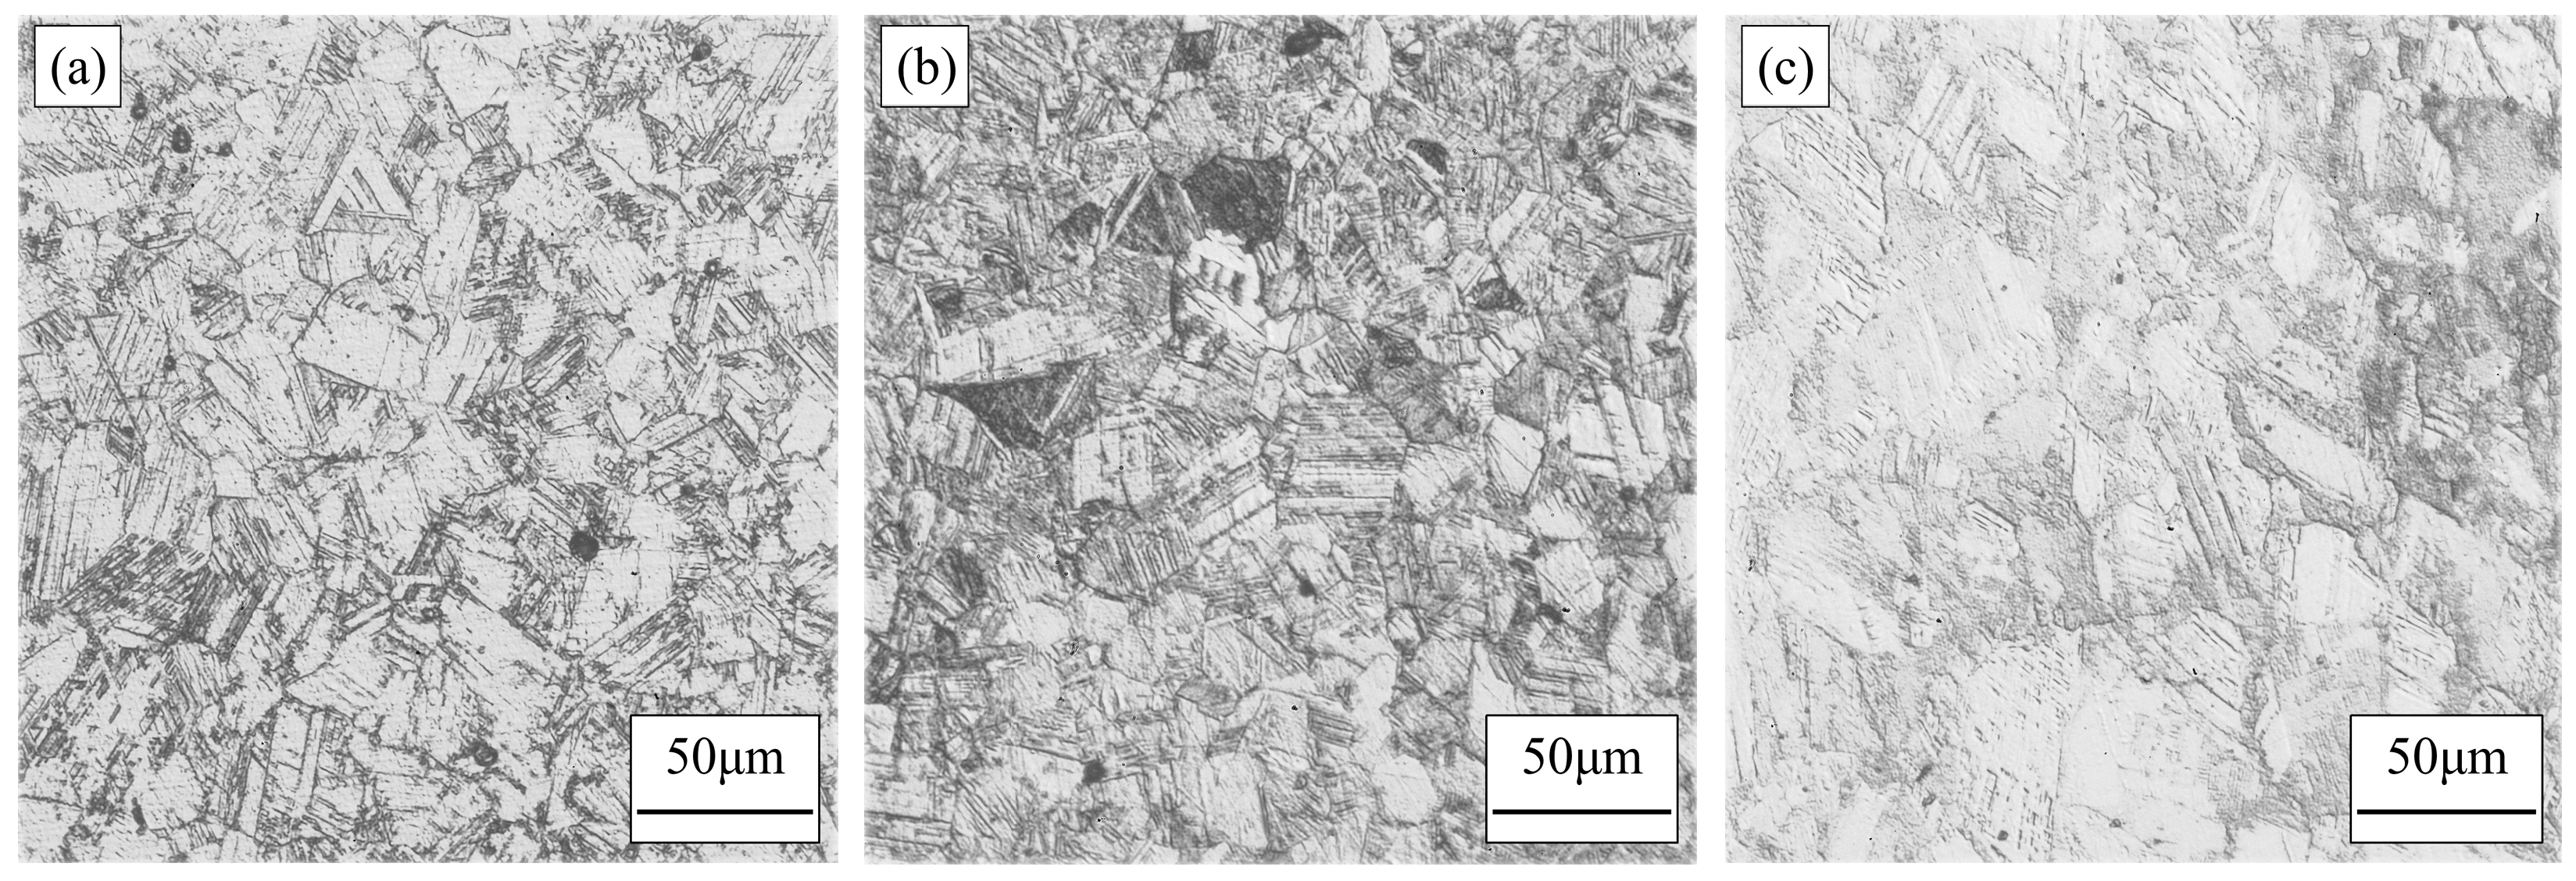
4.3. Prediction of Microstructures

Figure 3 indicates microstructures of FeMnSiCrNi SMA undergoing compression at the various temperatures by virtue of CA simulation, where a strain rate of 0.5 s−1 as well as a true strain of 0.9 is chosen. It can be observed from Figure 3 that the size of dynamically recrystallized grains increases with temperature. In addition, the fraction of recrystallization increases with temperature as well. To validate the CA simulation results, the corresponding optical microstructures of FeMnSiCrNi SMA are characterized, as shown in Figure 4. It is very obvious that the size of grains also increases with temperature. The simulation results are supported by the experimental ones very well. In addition, it can be found from Figure 4 that martensite and twin occur in FeMnSiCrNi SMA. As Straumal et al. [34,35] stated, the twins frequently appear in FCC metals with low-to-medium stacking fault energy. Martensite and the twins are readily observed in FeMnSiCrNi SMA since FeMnSiCrNi SMA possesses low stacking fault energy [9,10,11]. The formation mechanisms of martensite and the twins in FeMnSiCrNi SMA are out of the scope of the manuscript and shall be investigated by means of further experimental evidence in the future.
Figure 5 shows microstructures of FeMnSiCrNi SMA undergoing compression at various strain rates at 850 °C via the CA model, which corresponds to a true strain of 0.9. In Figure 5, the size of recrystallized grains increases with strain rate, but the effect of strain rate is not as considerable as the effect of temperature. In the same manner, the simulation results are also supported by the experimental ones, as illustrated in Figure 6. It is very obvious that the slower strain rate provides more nucleation and growth time for DRX of FeMnSiCrNi SMA. However, the strain rate is only able to exert a slight impact on the growth of grains during DRX of FeMnSiCrNi SMA due to the limitation of temperature.
Figure 7 shows microstructures of FeMnSiCrNi SMA undergoing compression at the various strain rates at 1000 °C in the CA model, which corresponds to a true strain of 0.9. It is noted in Figure 7 that the increase in strain rate leads to the increase in the size of recrystallized grains as well. However, with increasing deformation temperature, strain rate more significantly influences the size of recrystallized grains. Furthermore, the simulation results are also supported by the experimental ones, as shown in Figure 8. Therefore, it is of greater significance to comprehensively consider the influence of deformation temperature and strain rate on DRX of FeMnSiCrNi SMA.

4.4. Prediction of Flow Stress

Figure 9 indicates the compressive stress–strain curves of FeMnSiCrNi SMA at the various temperatures and strain rates based on CA simulation. Comparing Figure 9 to Figure 1, obviously, the simulated results are supported by the experimental ones. However, it is not denied that there exists a certain difference between the simulating and experimental results except at 0.5 s−1. In the case of the other two strain rates, in particular, a certain fluctuation appears in the stress-strain curves of FeMnSiCrNi SMA. The fluctuation is closely associated with evolution of dislocation density. This stems from the sharp competition between dynamic softening and work hardening. This also demonstrates that the present CA simulation possesses a certain limitation in predicting the flow behavior of FeMnSiCrNi SMA during compression deformation.

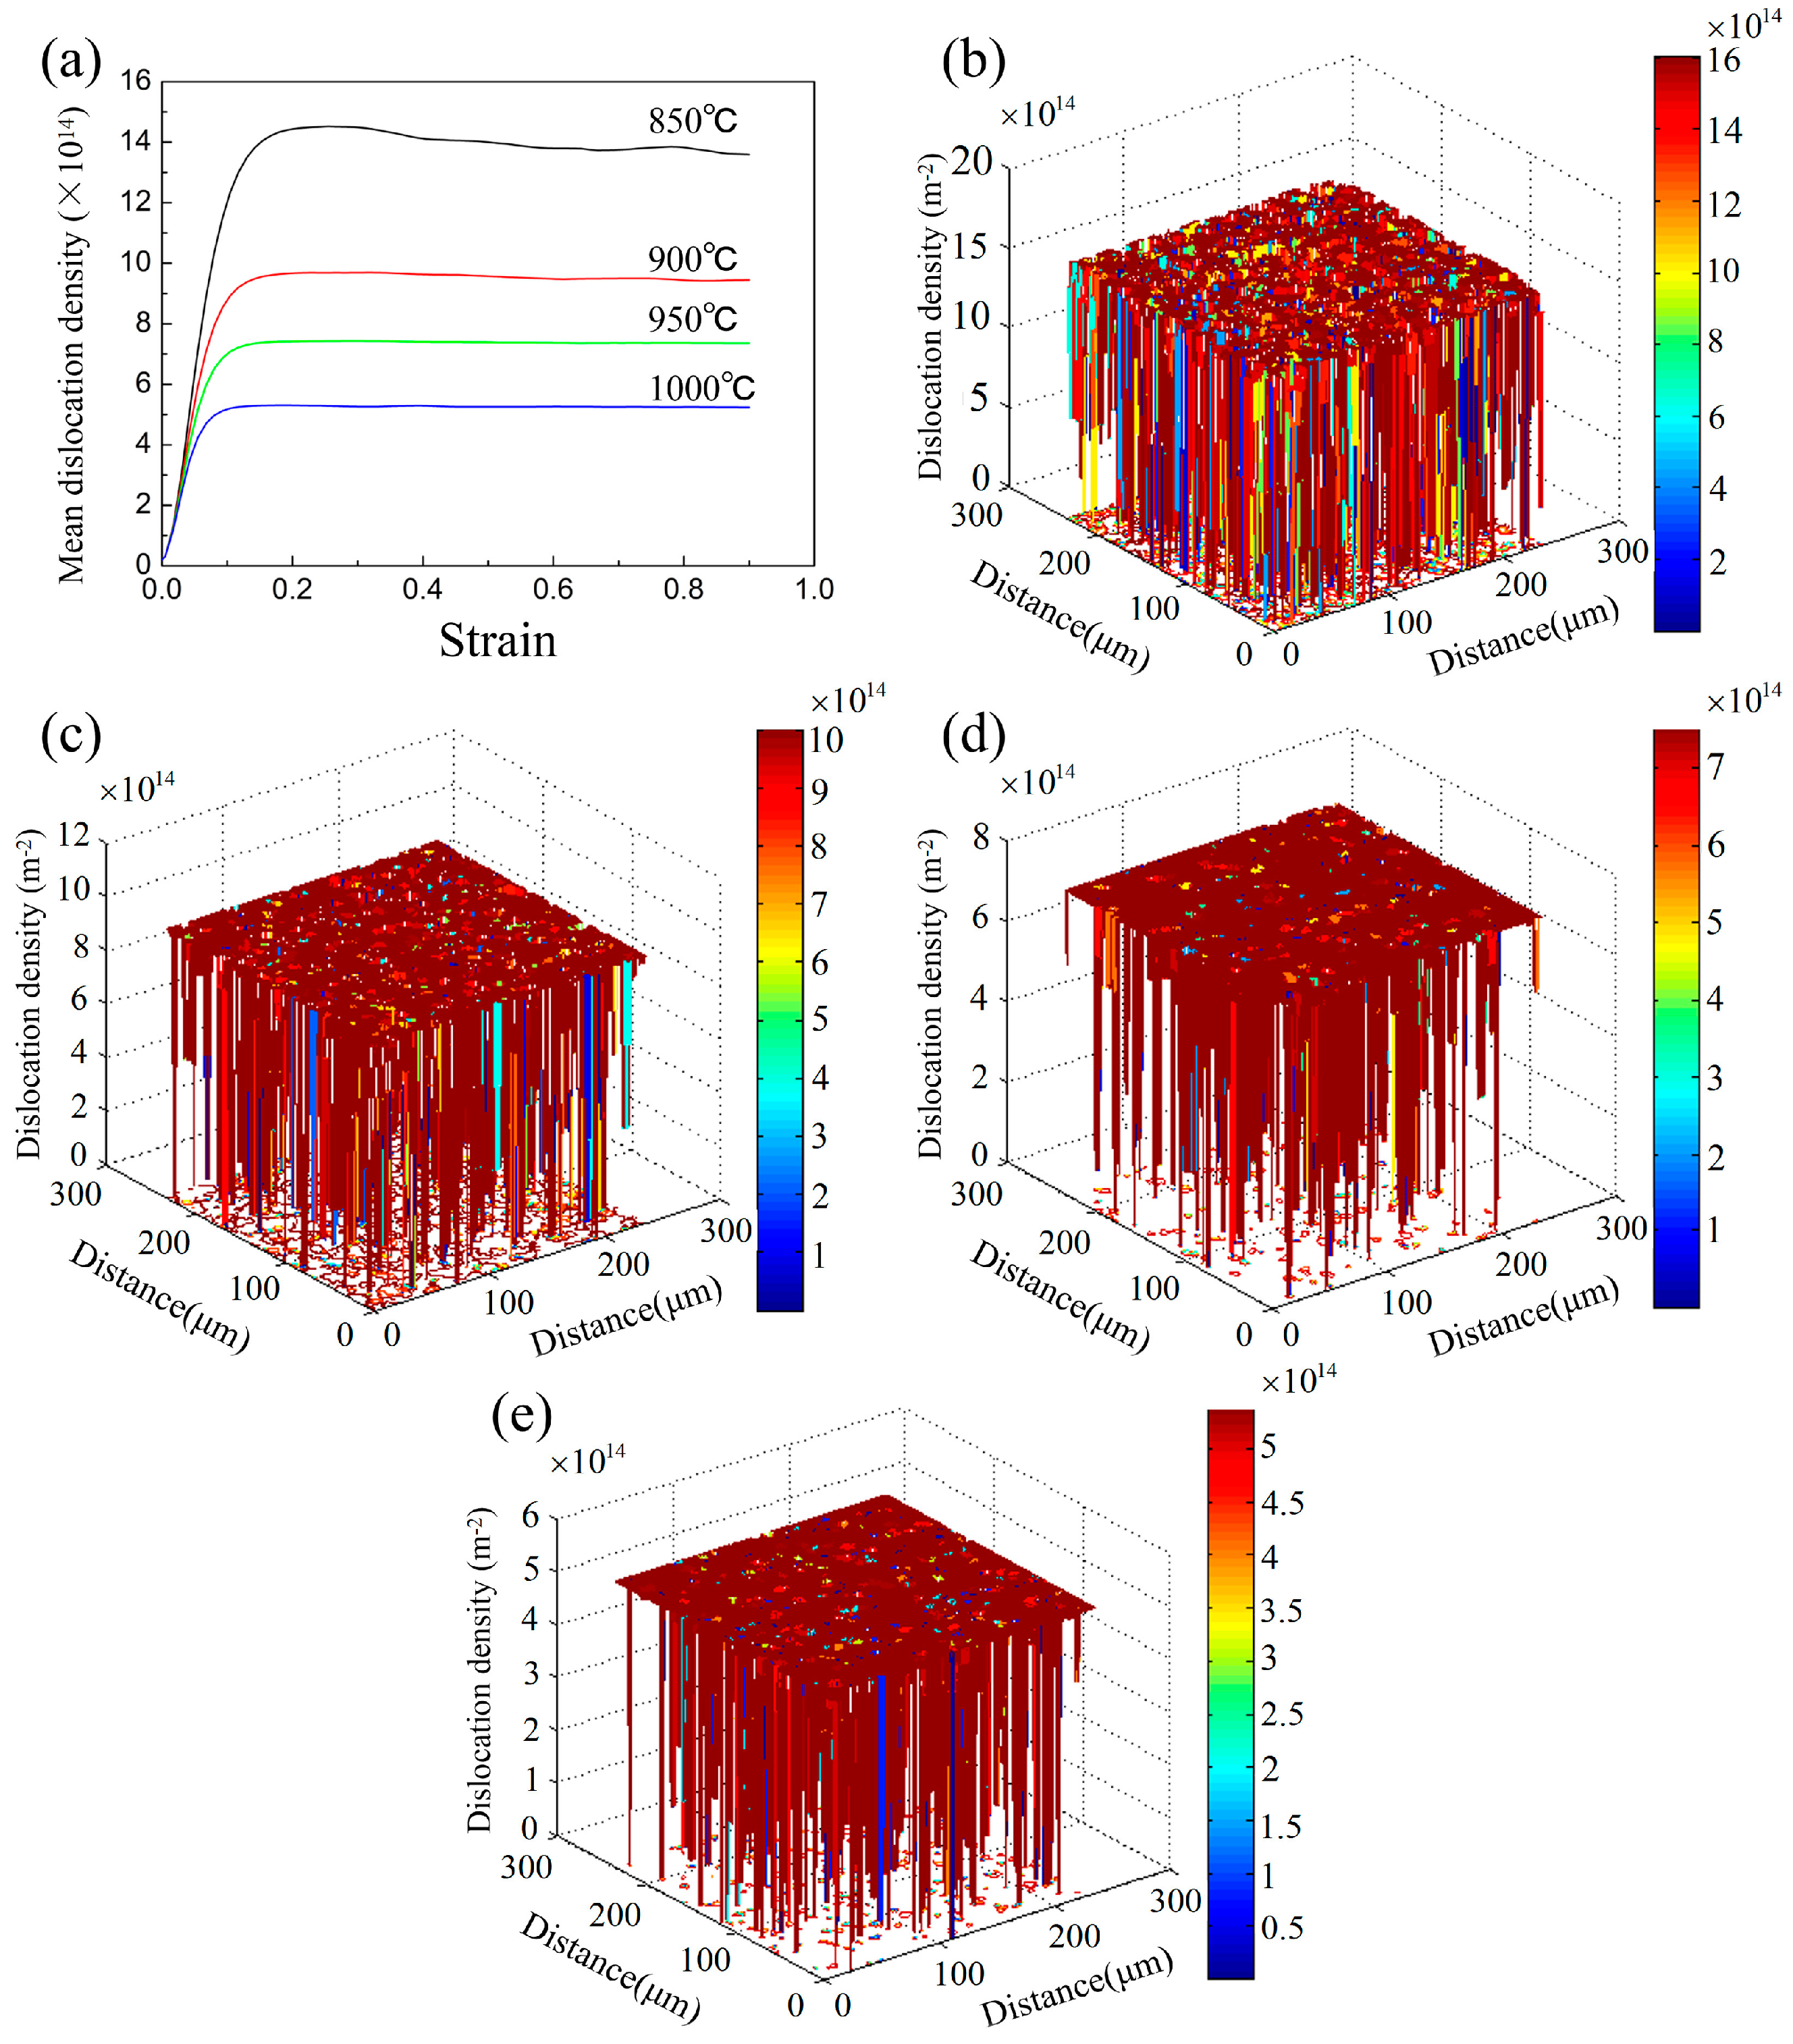
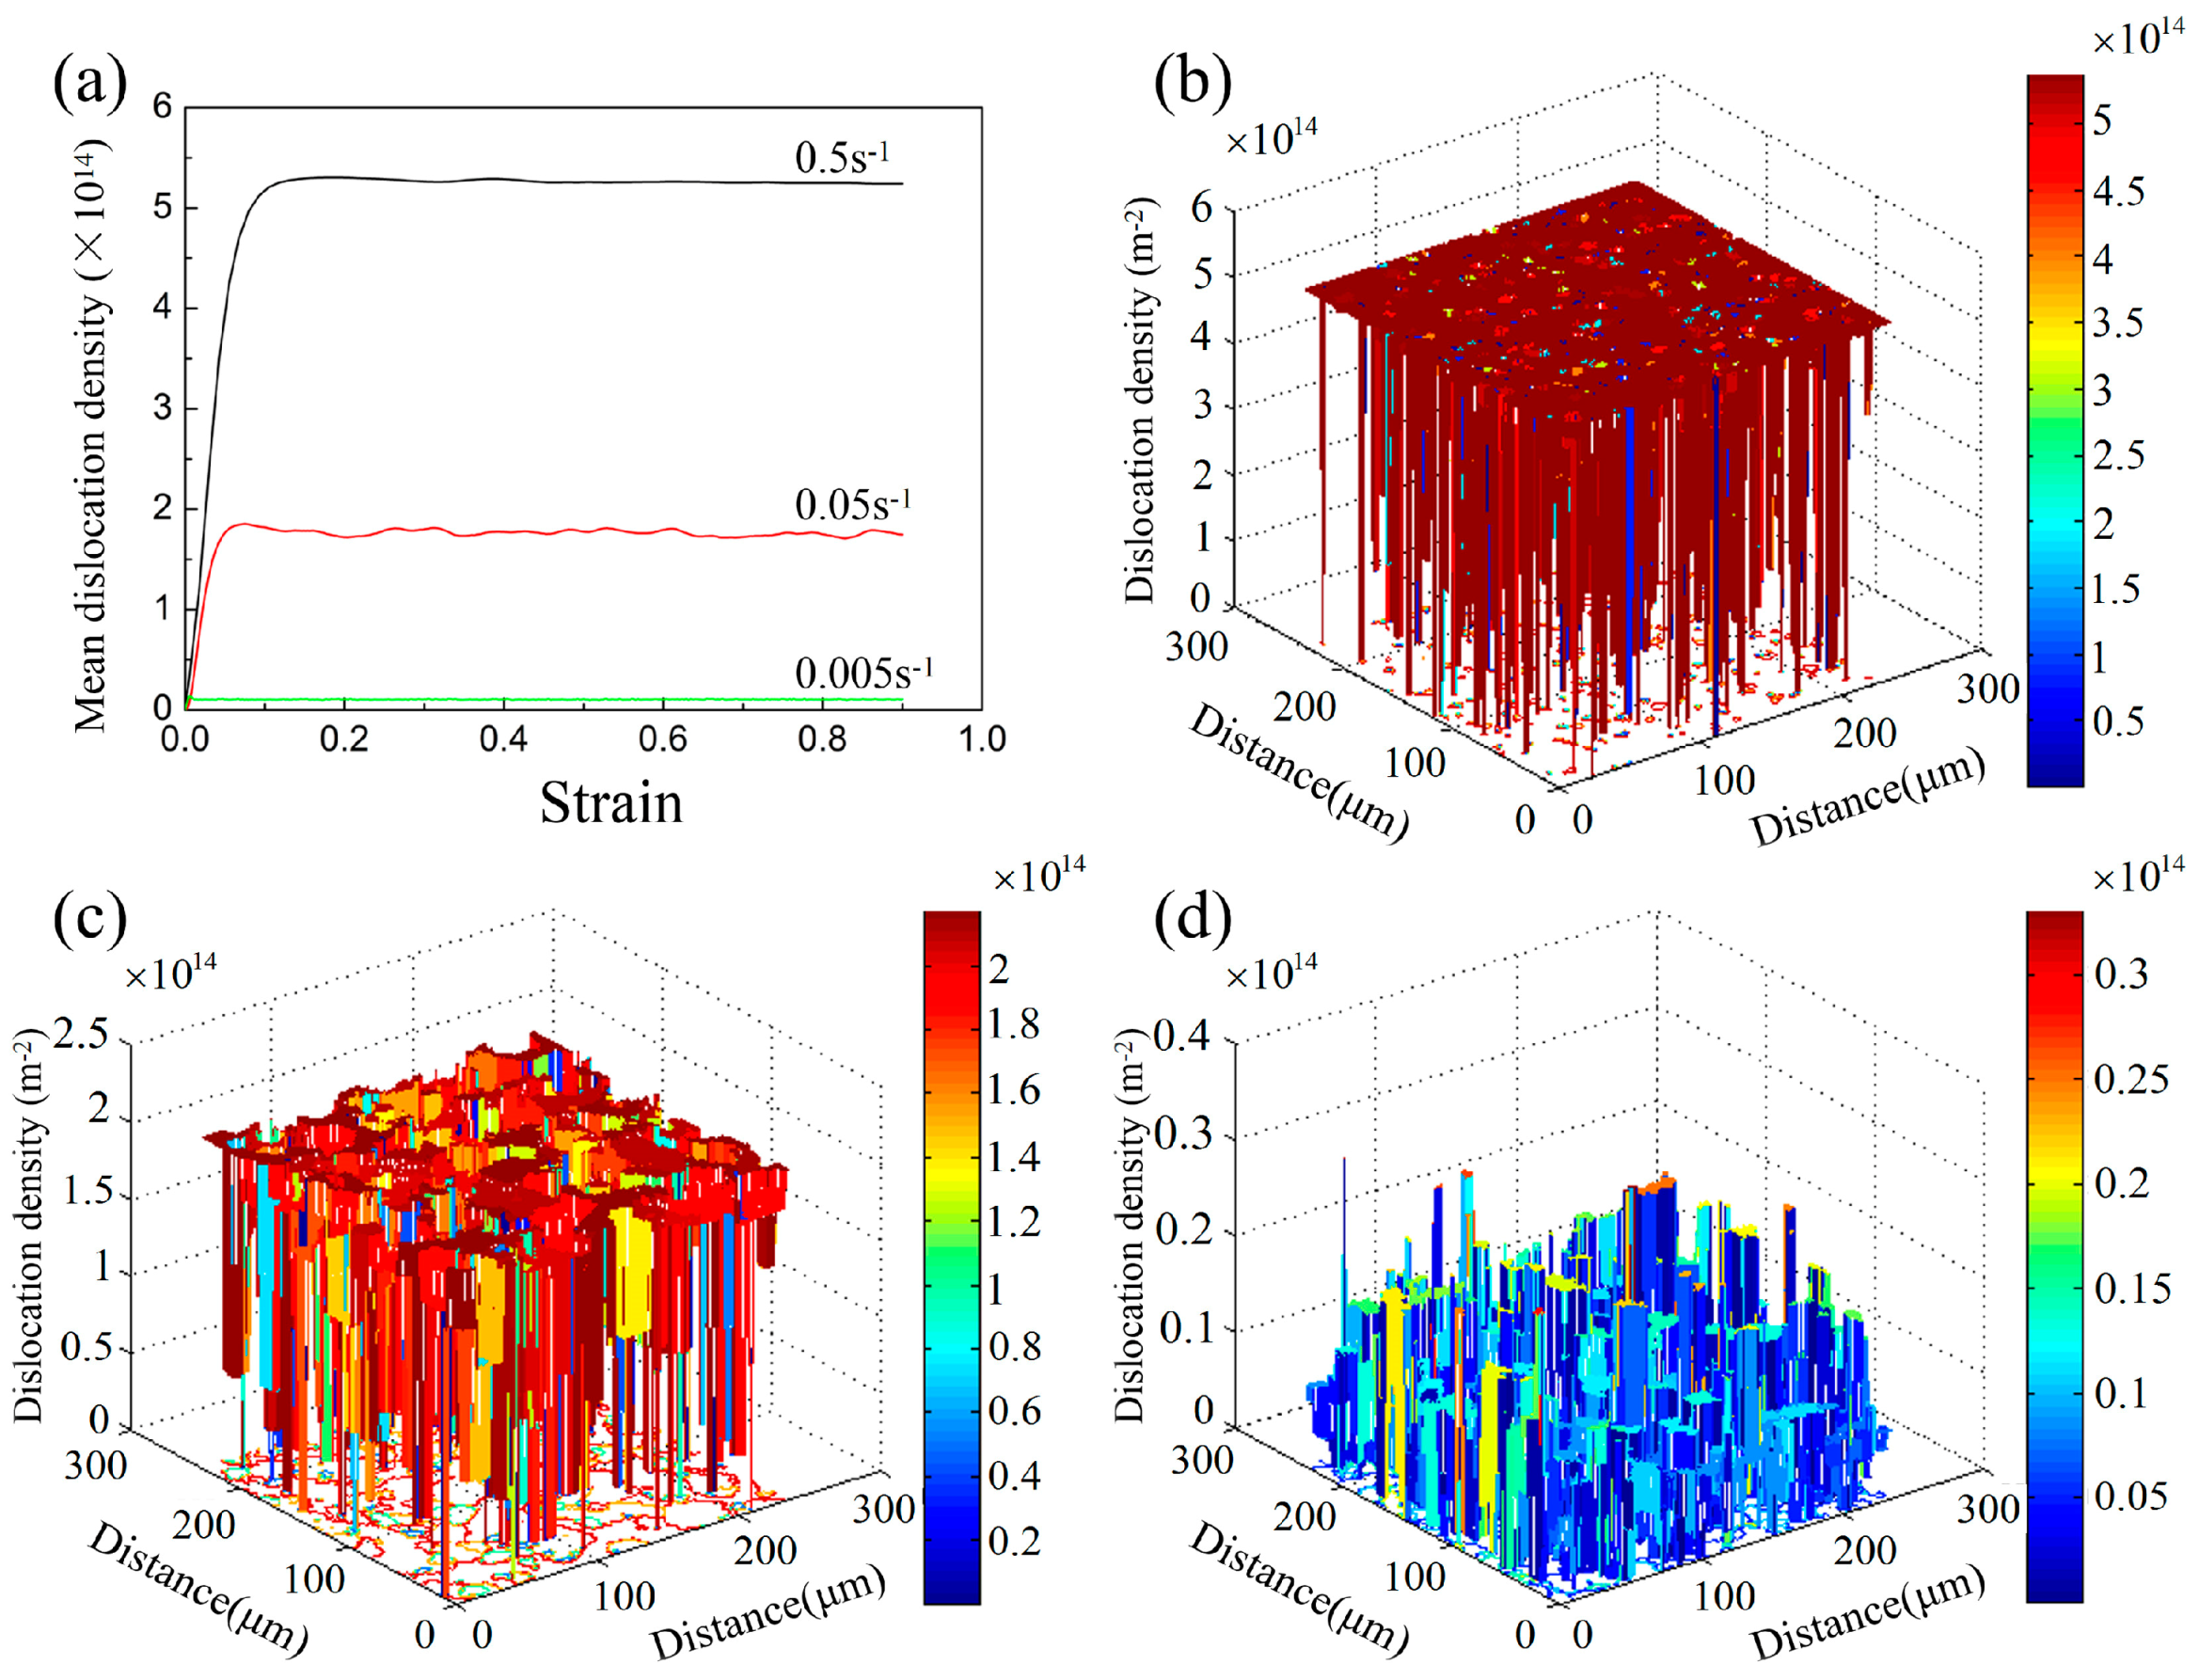
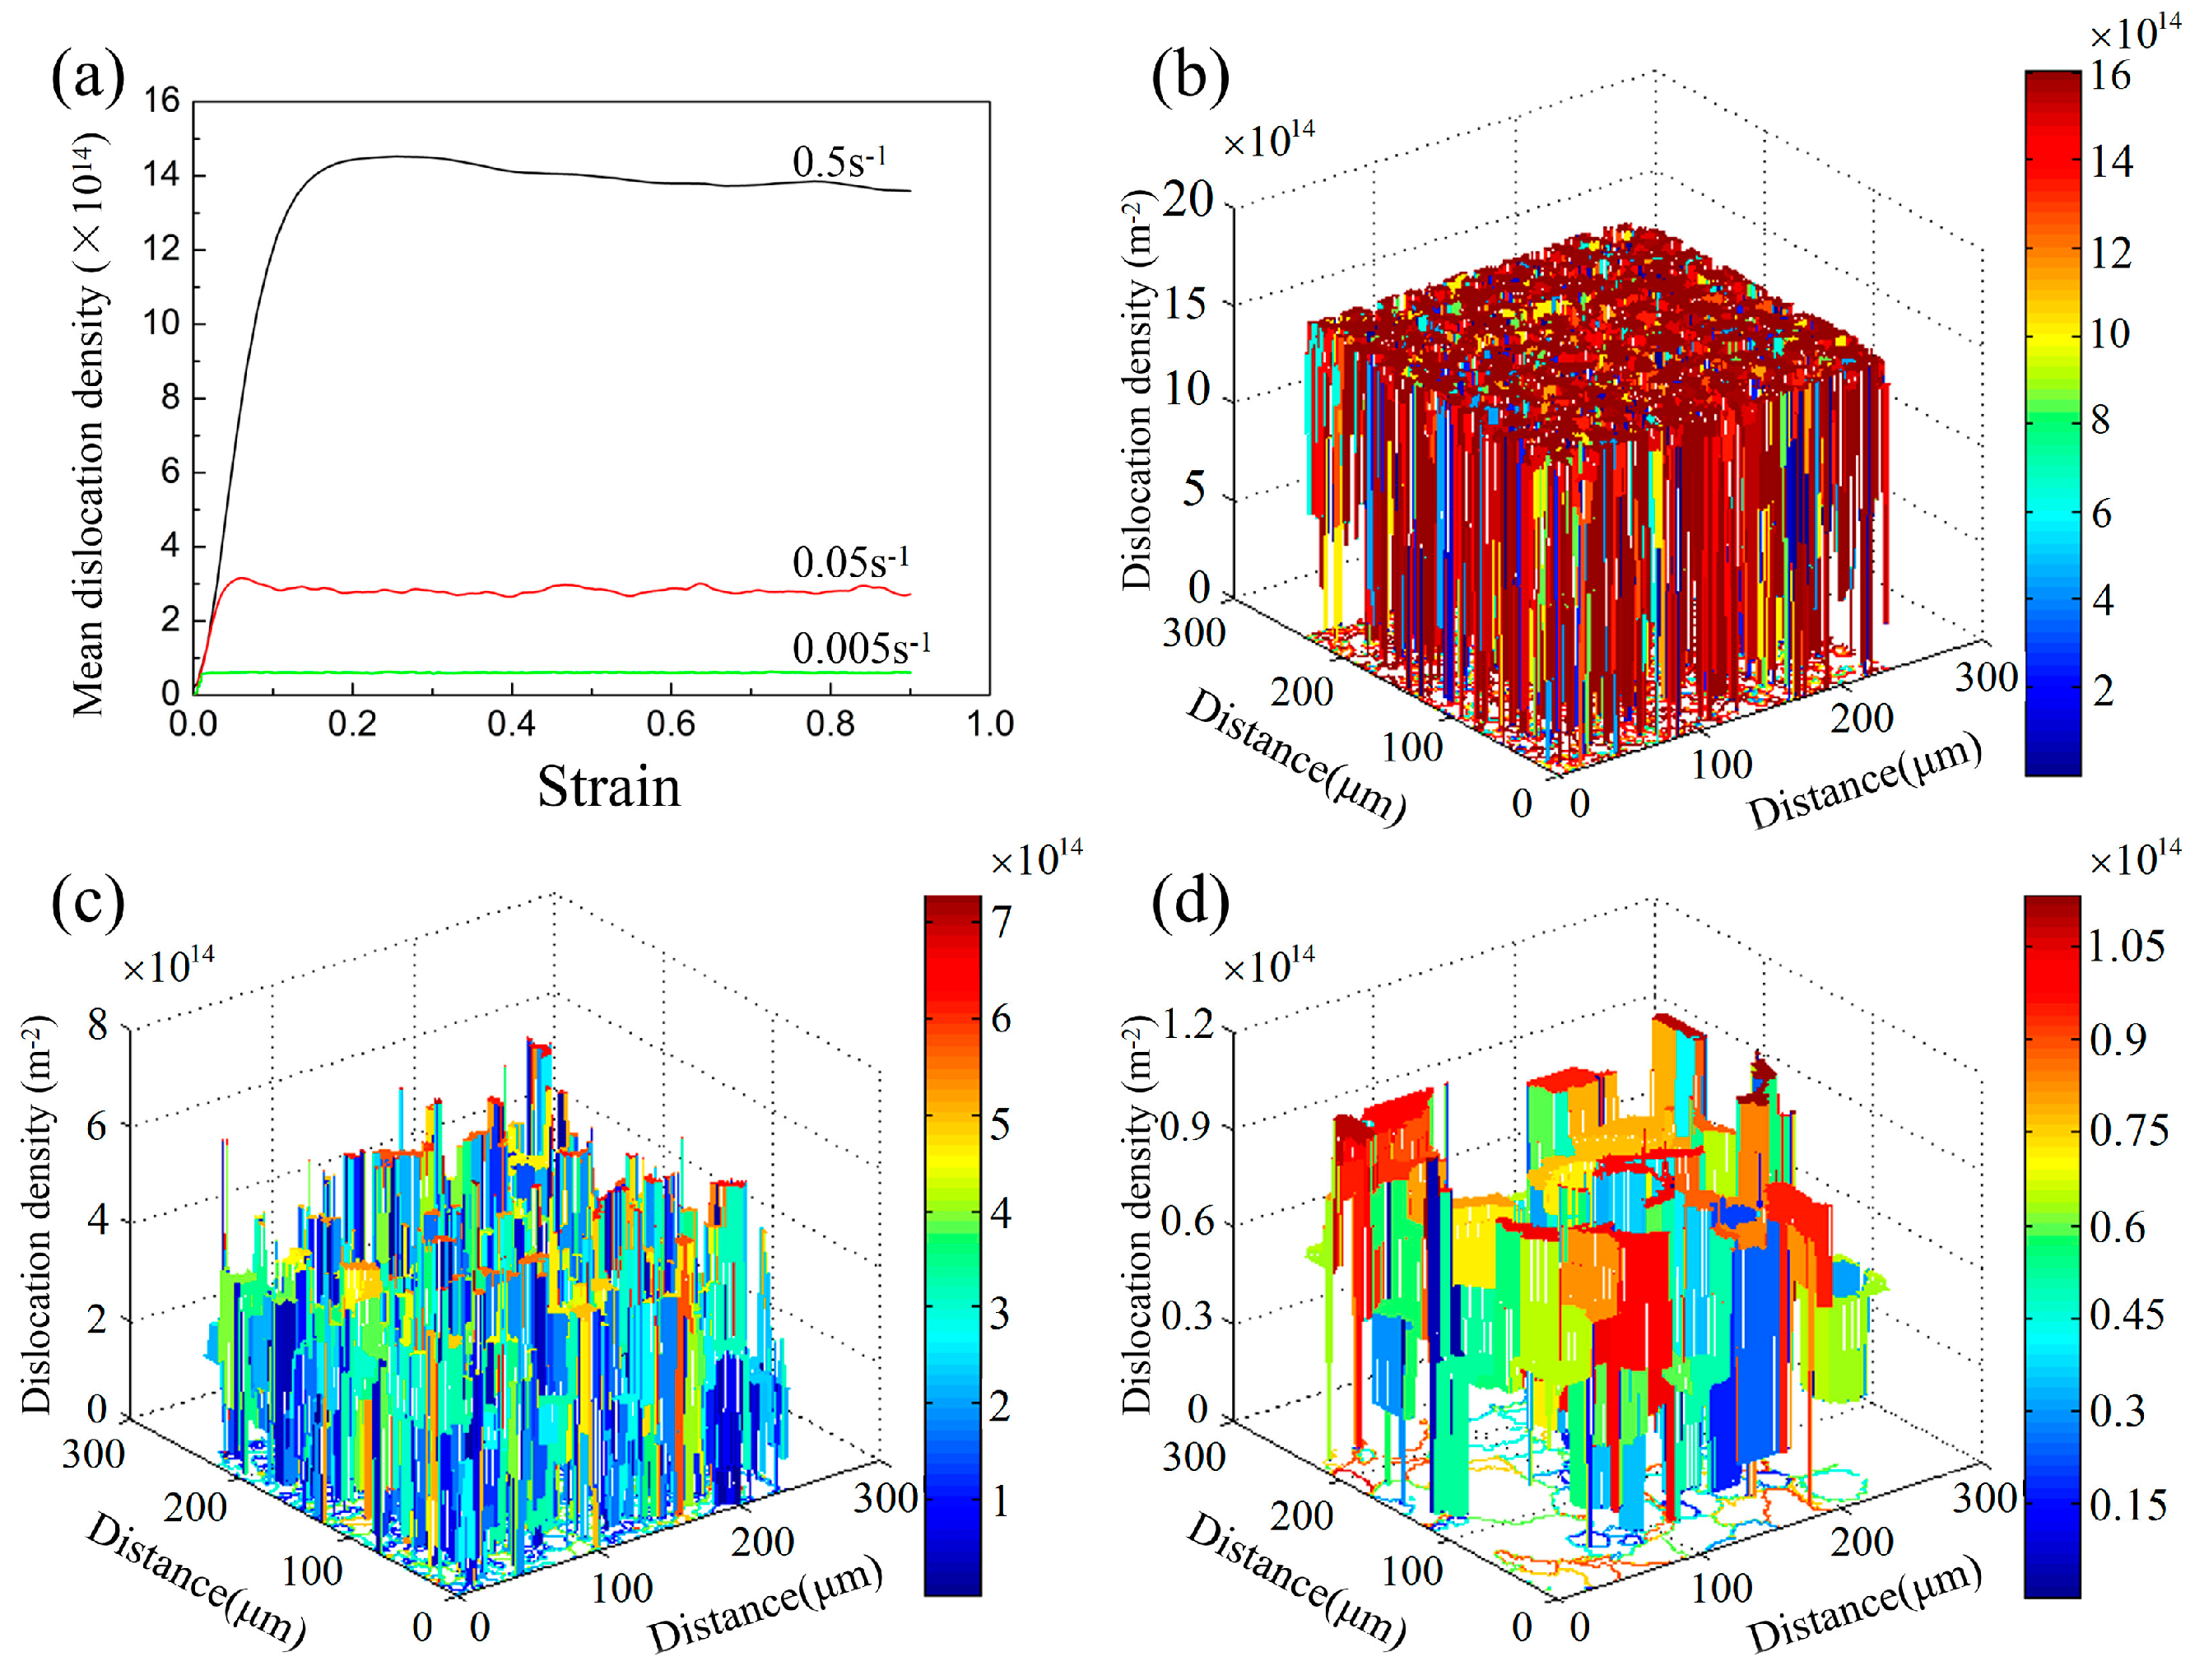
4.5. Prediction of Dislocation Density

Generally, dislocation density a substantial factor during DRX of FeMnSiCrNi SMA. In other words, dislocation density is a crucial factor in terms of determining whether DRX of FeMnSiCrNi SMA takes place. The new crystal nucleus was formed only when a critical dislocation density was reached. Therefore, it was quite necessary to simulate the evolution of dislocation density via CA, which provides a theoretical foundation for clarifying the DRX mechanism of FeMnSiCrNi SMA. For the purpose, dislocation density of FeMnSiCrNi SMA corresponding to various deformation temperatures and strain rates was predicted by CA simulation, where a true strain of 0.9 was selected, as shown in Figure 10, Figure 11, and Figure 12. Figure 10 indicates a dislocation density of FeMnSiCrNi SMA corresponding to various deformation temperatures, where the strain rate was selected as 0.5 s−1. It is very clear that the dislocation density was reduced with increasing deformation temperature. Furthermore, according to CA simulation, the dislocation density of FeMnSiCrNi SMA corresponding to various strain rates at 850 and 1000 °C is illustrated in Figure 11 and Figure 12, respectively. It is evident that dislocation density increases with stain rate. Consequently, it is of great importance for interpreting DRX mechanism of FeMnSiCrNi SMA to comprehensively take into account effect of deformation temperature and strain rate on dislocation density. Dislocation density particularly exhibits a similar trend with flow stress. As is described in the aforementioned section, the occurrence of DRX is based on the fact that dislocation density is lower in the recrystallized grains than in the original ones. In other words, the difference of the two dislocation densities shall become the driving force to cause the recrystallized grains to grow, which lays the theoretical foundation for the recrystallized grains growing repeatedly.

5. Conclusions

(1) Dynamic recrystallization (DRX) is found to appear during plastic deformation of FeMnSiCrNi SMA at elevated temperatures. Cecullar automaton (CA) simulation becomes an effect candidate for revealing the DRX mechanism of FeMnSiCrNi SMA by predicting microstructures, grain size, flow stress, and dislocation density. Dynamic recrystallization (DRX) of FeMnSiCrNi SMA has a characteristic of repeated nucleation and finite growth. The size of dynamically recrystallized grains increases with deformation temperature, but it decreases with strain rate. The increasing deformation temperature leads to the decrease of flow stress, whereas the decreasing strain rate results in the increase of flow stress. The dislocation density exhibits the same situation as the flow stress. The simulated results are supported by the experimental ones very well.
(2) Dislocation density plays a crucial role during DRX of FeMnSiCrNi SMA experiencing plastic deformation at high temperatures. It has an important influence on the nucleation as well as the growth of the dynamically recrystallized grains. The new crystal nucleus is generated only when a critical dislocation density is achieved. The difference between dislocation densities of the recrystallized and original grains shall become the driving force for causing the recrystallized grains to grow, which lays the solid foundation for the recrystallized grains growing repeatedly.

Author Contributions

Y.W. performed the experimental research and wrote the manuscript; X.X. compiled the cellular automaton program; Y.Z. developed cellular automaton software; S.J. supervised the manuscript.

Funding

The work was financially supported by the National Natural Science Foundation of China (Nos. 51475101 and 51871070).

Conflicts of Interest

The authors declare no conflict of interest.

References

  1. Yang, C.F.; Lin, H.C.; Lin, K.M.; Tsai, H.K. Effect of thermo-mechanical treatment on a Fe-30Mn-6Si shape memory alloy. Mater. Sci. Eng. A 2008, 497, 445–450. [Google Scholar] [CrossRef]
  2. Amini, R.; Shamsipoor, A.; Ghaffari, M.; Alizadeh, M.; Okyay, O.K. Phase transformation during mechano-synthesis of nanocrystalline/amorphous Fe-32Mn-6Si alloys. Mater. Charact. 2013, 84, 169–174. [Google Scholar] [CrossRef]
  3. Stanford, N.; Dunne, D.P. Effect of Si on the reversibility of stress-induced martensite in Fe-Mn-Si shape memory alloy. Acta Mater. 2010, 58, 6752–6762. [Google Scholar] [CrossRef]
  4. Caenegem, N.N.; Duprez, L.; Verbeken, K.; Segers, D.; Houbaert, Y. Stresses related to the shape memory effect in Fe-Mn-Si-based shape memory alloys. Mater. Sci. Eng. A 2008, 481, 183–189. [Google Scholar] [CrossRef]
  5. Stanford, N.; Dunne, D.P. Thermo-mechanical processing and the shape memory effect in an Fe-Mn-Si-based shape memory alloy. Mater. Sci. Eng. A 2006, 422, 352–359. [Google Scholar] [CrossRef]
  6. Shakoor, R.A.; Khalid, F.A. Thermomechanical behavior of Fe-Mn-Si-Cr-Ni shape memory alloys modified with samarium. Mater. Sci. Eng. A 2009, 499, 411–414. [Google Scholar] [CrossRef]
  7. Lin, H.C.; Wu, S.K.; Peng, Y.T.; Cheng, T.C.; Lin, K.M. Pseudoelasticity of thermo-mechanically treated Fe-Mn-Si-Cr-Ta alloys. J. Alloy Compd. 2013, 577, S338–S343. [Google Scholar]
  8. Stanford, N.; Dunne, D.P.; Li, H. Re-examination of effect of NbC precipitation on shape memory in Fe-Mn-Si-based alloys. Scr. Mater. 2008, 58, 583–586. [Google Scholar] [CrossRef]
  9. Wang, G.X.; Peng, H.B.; Sun, P.P.; Wang, S.L.; Wen, Y.H. Effect of titanium addition on shape memory effect and recovery stress of training-free cast Fe-Mn-Si-Cr-Ni shape memory alloys. Mater. Sci. Eng. A 2016, 657, 339–346. [Google Scholar] [CrossRef]
  10. Zhang, W.; Jiang, L.Z.; Li, N.; Wen, Y.H. Improvement of shape memory effect in an Fe-Mn-Si-Cr-Ni alloy fabricated by equal channel angular pressing. J. Mater. Process. Technol. 2008, 208, 130–134. [Google Scholar]
  11. Druker, A.V.; Baruj, A.; Isola, L.; Fuster, V.; Malarría, J.; Bolmaro, R. Gaining flexibility in the design of microstructure, texture and shape memory properties of an Fe-Mn-Si-Cr-Ni alloy processed by ECAE and annealing. Mater. Des. 2016, 107, 153–162. [Google Scholar] [CrossRef]
  12. Kwon, E.P.; Fujieda, S.; Shinoda, K.; Suzuki, S. Texture evolution and fcc/hcp transformation in Fe-Mn-Si-Cr-Ni alloys by tensile deformation. Mater. Sci. Eng. A 2010, 527, 6524–6532. [Google Scholar] [CrossRef]
  13. Jin, Z.Y.; Cui, Z.S. Investigation on dynamic recrystallization using a modified cellular automaton. Comput. Mater. Sci. 2012, 63, 249–255. [Google Scholar] [CrossRef]
  14. Timoshenkov, A.; Warczok, P.; Albu, M.; Klarner, J.; Kozeschnik, E.; Bureau, R.; Sommitsch, C. Modelling the dynamic recrystallization in C-Mn micro-alloyed steel during thermo-mechanical treatment using cellular automata. Comput. Mater. Sci. 2014, 94, 85–94. [Google Scholar] [CrossRef]
  15. Popova, E.; Staraselski, Y.; Brahme, A.; Mishra, R.K.; Inal, K. Coupled crystal plasticity-Probabilistic cellular automata approach to model dynamic recrystallization in magnesium alloys. Int. J. Plast. 2015, 66, 85–102. [Google Scholar] [CrossRef]
  16. Hallberg, H.; Wallin, M.; Ristinmaa, M. Simulation of discontinuous dynamic recrystallization in pure Cu using a probabilistic cellular automaton. Comput. Mater. Sci. 2010, 49, 25–34. [Google Scholar] [CrossRef] [Green Version]
  17. Chen, M.S.; Yuan, W.Q.; Lin, Y.C.; Li, H.B.; Zou, Z.H. Modeling and simulation of dynamic recrystallization behavior for 42CrMo steel by an extended cellular automaton method. Vacuum 2017, 146, 142–151. [Google Scholar] [CrossRef]
  18. Chen, F.; Qi, K.; Cui, Z.S.; Lai, X.M. Modeling the dynamic recrystallization in austenitic stainless steel using cellular automaton method. Comput. Mater. Sci. 2014, 83, 331–340. [Google Scholar] [CrossRef]
  19. Chen, M.S.; Yuan, W.Q.; Li, H.B.; Zou, Z.H. Modeling and simulation of dynamic recrystallization behaviors of magnesium alloy AZ31B using cellular automaton method. Comput. Mater. Sci. 2017, 136, 163–172. [Google Scholar] [CrossRef]
  20. Wang, L.X.; Fang, G.; Qian, L.G. Modeling of dynamic recrystallization of magnesium alloy using cellular automata considering initial topology of grains. Mater. Sci. Eng. A 2018, 711, 268–283. [Google Scholar] [CrossRef]
  21. Li, X.L.; Li, X.L.; Zhou, H.T.; Li, F.B.; Liu, Q. Simulation of dynamic recrystallization in AZ80 magnesium alloy using cellular automaton. Comput. Mater. Sci. 2017, 140, 95–104. [Google Scholar]
  22. Liu, Y.X.; Lin, Y.C.; Li, H.B.; Wen, D.X.; Chen, X.M.; Chen, M.S. Study of dynamic recrystallization in a Ni-based superalloy by experiments and cellular automaton model. Mater. Sci. Eng. A 2015, 626, 432–440. [Google Scholar] [CrossRef]
  23. Cao, Z.H.; Sun, Y.; Wan, Z.P.; Yang, W.H.; Ren, L.L.; Hu, L.X. Cellular automaton simulation of dynamic recrystallization behavior in V-10Cr-5Ti alloy under hot deformation conditions. Trans. Nonferrous Met. Soc. China 2019, 29, 98–111. [Google Scholar] [CrossRef]
  24. Ding, R.; Guo, Z.X. Microstructural modelling of dynamic recrystallisation using an extended cellular automaton approach. Comput. Mater. Sci. 2002, 23, 209–218. [Google Scholar] [CrossRef]
  25. Kugler, G.; Turk, R. Modeling the dynamic recrystallization under multi-stage hot deformation. Acta Mater. 2004, 52, 4659–4668. [Google Scholar] [CrossRef]
  26. Mecking, H.; Kocks, U.F. Kinetics of flow and strain-hardening. Acta Metall. 1981, 29, 1865–1875. [Google Scholar] [CrossRef]
  27. Ding, R.; Guo, Z.X. Coupled quantitative simulation of microstructural evolution and plastic flow during dynamic recrystallization. Acta Mater. 2001, 49, 3163–3175. [Google Scholar] [CrossRef]
  28. Mcqueen, H.J.; Ryan, N.D. Constitutive analysis in hot working. Mater. Sci. Eng. A 2002, 322, 43–63. [Google Scholar] [CrossRef]
  29. Derby, B. Dynamic recrystallisation: The steady state grain size. Scr. Metall. Mater. 1992, 27, 1581–1585. [Google Scholar] [CrossRef]
  30. Sandstorm, R.; Lagneborg, R. A model for hot working occurring by recrystallization. Acta Metall. 1975, 23, 387–398. [Google Scholar] [CrossRef]
  31. Yazdipour, N.; Davies, C.H.J.; Hodgson, P.D. Microstructural modeling of dynamic recrystallization using irregular cellular automata. Mater. Sci. 2008, 44, 566–577. [Google Scholar] [CrossRef]
  32. Chen, F.; Cui, Z.S.; Liu, J.; Chen, W.; Chen, S.J. Mesoscale simulation of the high-temperature austenitizing and dynamic recrystallization by coupling a cellular automaton with a topology deformation technique. Mater. Sci. Eng. A 2010, 527, 5539–5549. [Google Scholar] [CrossRef]
  33. Zhang, Y.Q.; Jiang, S.Y.; Liang, Y.L.; Hu, L. Simulation of dynamic recrystallization of NiTi shape memory alloy during hot compression deformation based on cellular automaton. Comput. Mater. Sci. 2013, 71, 124–134. [Google Scholar] [CrossRef]
  34. Straumal, B.B.; Polyakov, S.A.; Mittemeijer, E.J. Temperature inflfluence on the faceting of ∑3 and ∑9 grain boundaries in Cu. Acta Mater. 2006, 54, 167–172. [Google Scholar] [CrossRef]
  35. Straumal, B.B.; Kogtenkova, O.A.; Gornakova, A.S.; Sursaeva, V.G.; Baretzky, B. Review: Grain boundary faceting–roughening phenomena. J. Mater. Sci. 2016, 51, 382–404. [Google Scholar] [CrossRef]
Figure 1. Compressive stress-strain curves of FeMnSiCrNi SMA undergoing compression: (a) T = 850 °C; (b) T = 900 °C; (c) T = 950 °C; (d) T = 1000 °C.
Metals 09 00469 g001
Figure 2. Microstructural evolution of FeMnSiCrNi SMA undergoing compression (T = 1000 °C, ε ˙ = 0.005 s−1) based on CA simulation: (a) Stress-strain curve; (b) point B in (a); (c) point C in (a); (d) point D in (a); (e) point E in (a); (f) point F in (a).
Metals 09 00469 g002
Figure 3. Microstructures of FeMnSiCrNi SMA undergoing compression ( ε ˙ = 0.5 s−1, ε = 0.9 ) based on CA simulation: (a) T = 850 °C; (b) T = 900 °C; (c) T = 950 °C; (d) T = 1000 °C.
Metals 09 00469 g003
Figure 4. Optical microstructures of FeMnSiCrNi SMA undergoing compression ( ε ˙ = 0.5 s−1, ε = 0.9 ): (a) T = 850 °C; (b) T = 900 °C; (c) T = 950 °C; (d) T = 1000 °C.
Metals 09 00469 g004
Figure 5. Microstructures of FeMnSiCrNi SMA undergoing compression (T = 850 °C, ε = 0.9) using CA simulation: (a) ε ˙ = 0.5 s−1; (b) ε ˙ = 0.05 s−1; (c) ε ˙ = 0.005 s−1.
Metals 09 00469 g005
Figure 6. Optical Microstructures of FeMnSiCrNi SMA undergoing compression ( T = 850 °C, ε = 0.9 ): (a) ε ˙ = 0.5 s−1; (b) ε ˙ = 0.05 s−1; (c) ε ˙ = 0.005 s−1.
Metals 09 00469 g006
Figure 7. Microstructures of FeMnSiCrNi SMA undergoing compression ( T = 1000 °C, ε = 0.9 ) based on CA simulation: (a) ε ˙ = 0.5 s−1; (b) ε ˙ = 0.05 s−1; (c) ε ˙ = 0.005 s−1.
Metals 09 00469 g007
Figure 8. Optical microstructures of FeMnSiCrNi SMA undergoing compression ( T = 1000 °C, ε = 0.9 ): (a) ε ˙ = 0.5 s−1; (b) ε ˙ = 0.05 s−1; (c) ε ˙ = 0.005 s−1.
Metals 09 00469 g008
Figure 9. Compression stress-strain curves of FeMnSiCrNi SMA at the various temperatures and strain rates based on CA simulation: (a) T = 850 °C; (b) T = 1000 °C; (c) ε ˙ = 0.5 s−1.
Metals 09 00469 g009
Figure 10. Dislocation density of FeMnSiCrNi SMA under dynamic recrystallization (DRX) at the various deformation temperatures at the strain rate of 0.5 s−1 based on CA: (a) variation of dislocation density with strain at the various temperatures; (b) ε = 0.9, 850 °C; (c) ε = 0.9, 900 °C; (d) ε = 0.9, 950 °C; (e) ε = 0.9, 1000 °C.
Metals 09 00469 g010
Figure 11. Dislocation density of FeMnSiCrNi SMA under DRX at the various strain rates at 850 °C based on CA: (a) variation of dislocation density with strain; (b) ε = 0.9, 0.5 s−1; (c) ε = 0.9, 0.05 s−1; (d) ε = 0.9, 0.005 s−1.
Metals 09 00469 g011
Figure 12. Dislocation density of FeMnSiCrNi SMA under DRX at the various strain rates at 1000 °C based on CA: (a) variation of dislocation density with strain; (b) ε = 0.9, 0.5 s−1; (c) ε = 0.9, 0.05 s−1; (d) ε = 0.9, 0.005 s−1.
Metals 09 00469 g012
Table 1. The parameters for Cellular automaton (CA) simulation in FeMnSiCrNi shape memory alloy (SMA).
Parameterb (m)G (MN·m−2)Qact (KJ·mol−1)Qb (KJ·mol−1)δD0 (m3·s−1)
Value2.58 × 10−102.67 × 1043501597.5 × 10−14

