A New Compression Test for Determining Free Surface Roughness Evolution in Thin Sheet Metals


Abstract
1. Introduction
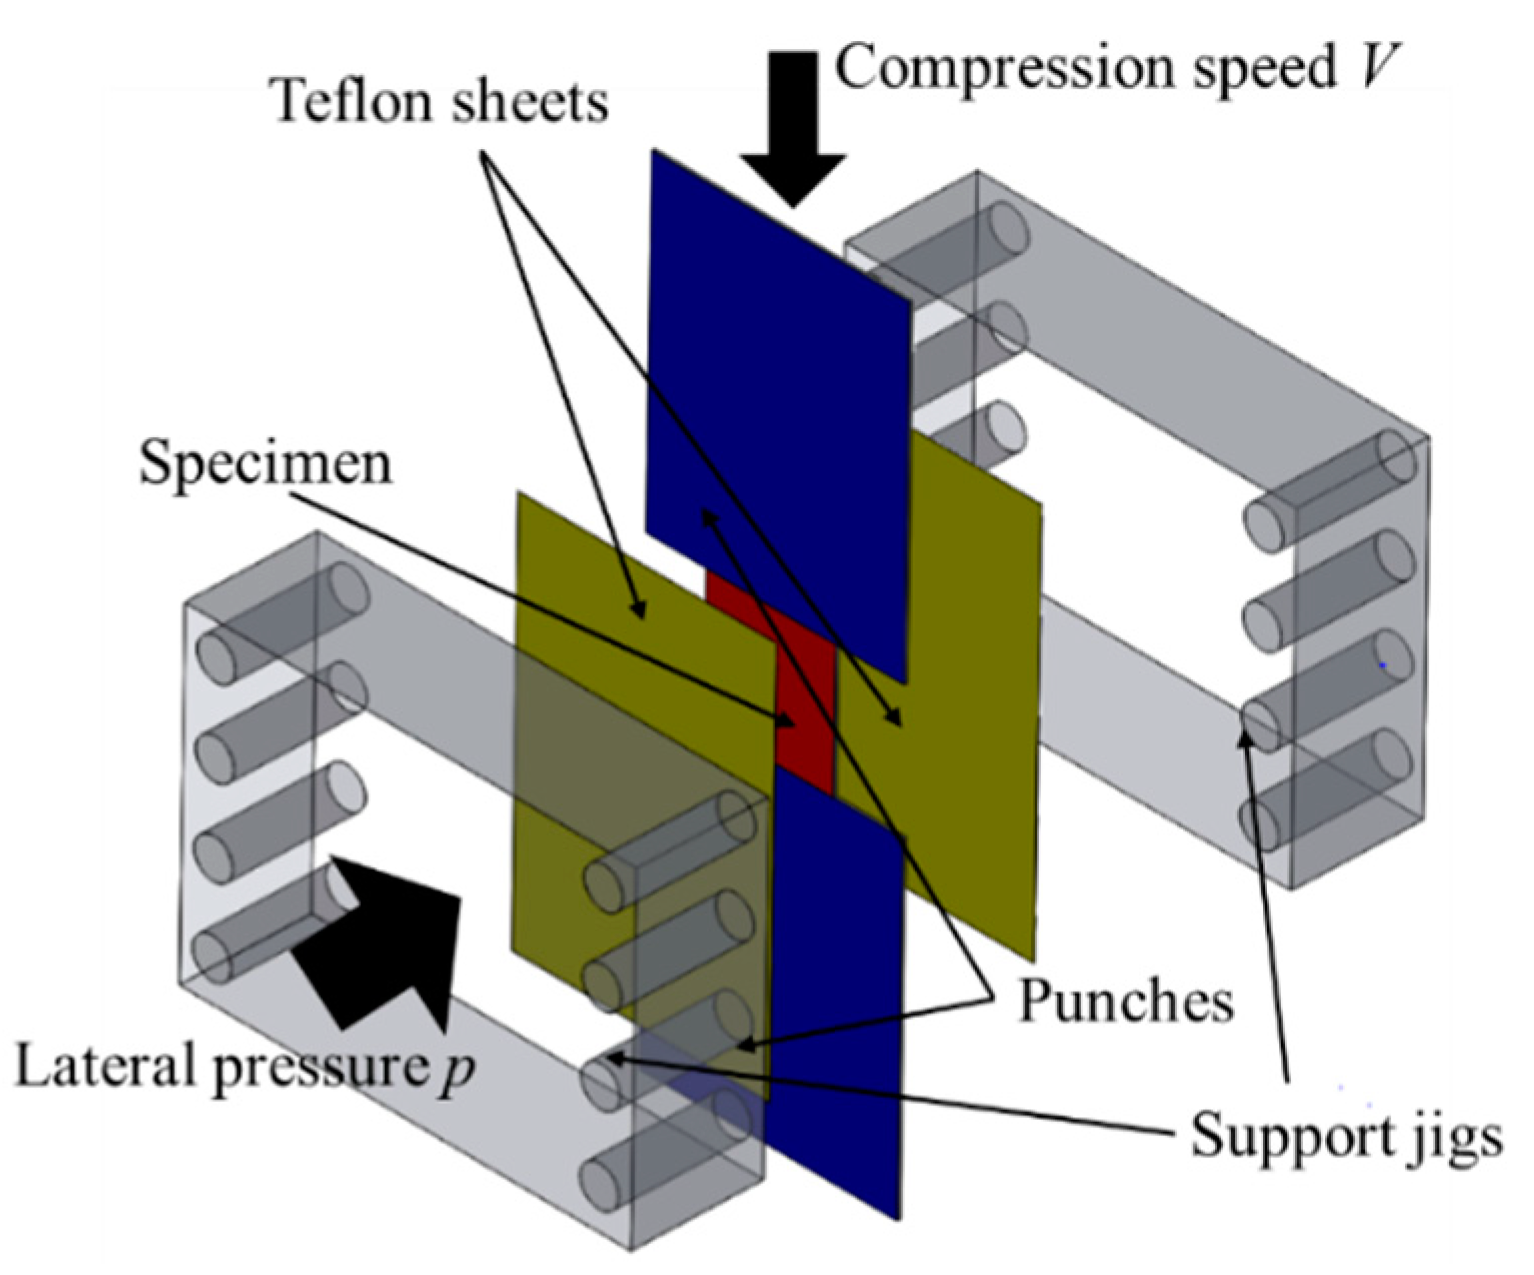
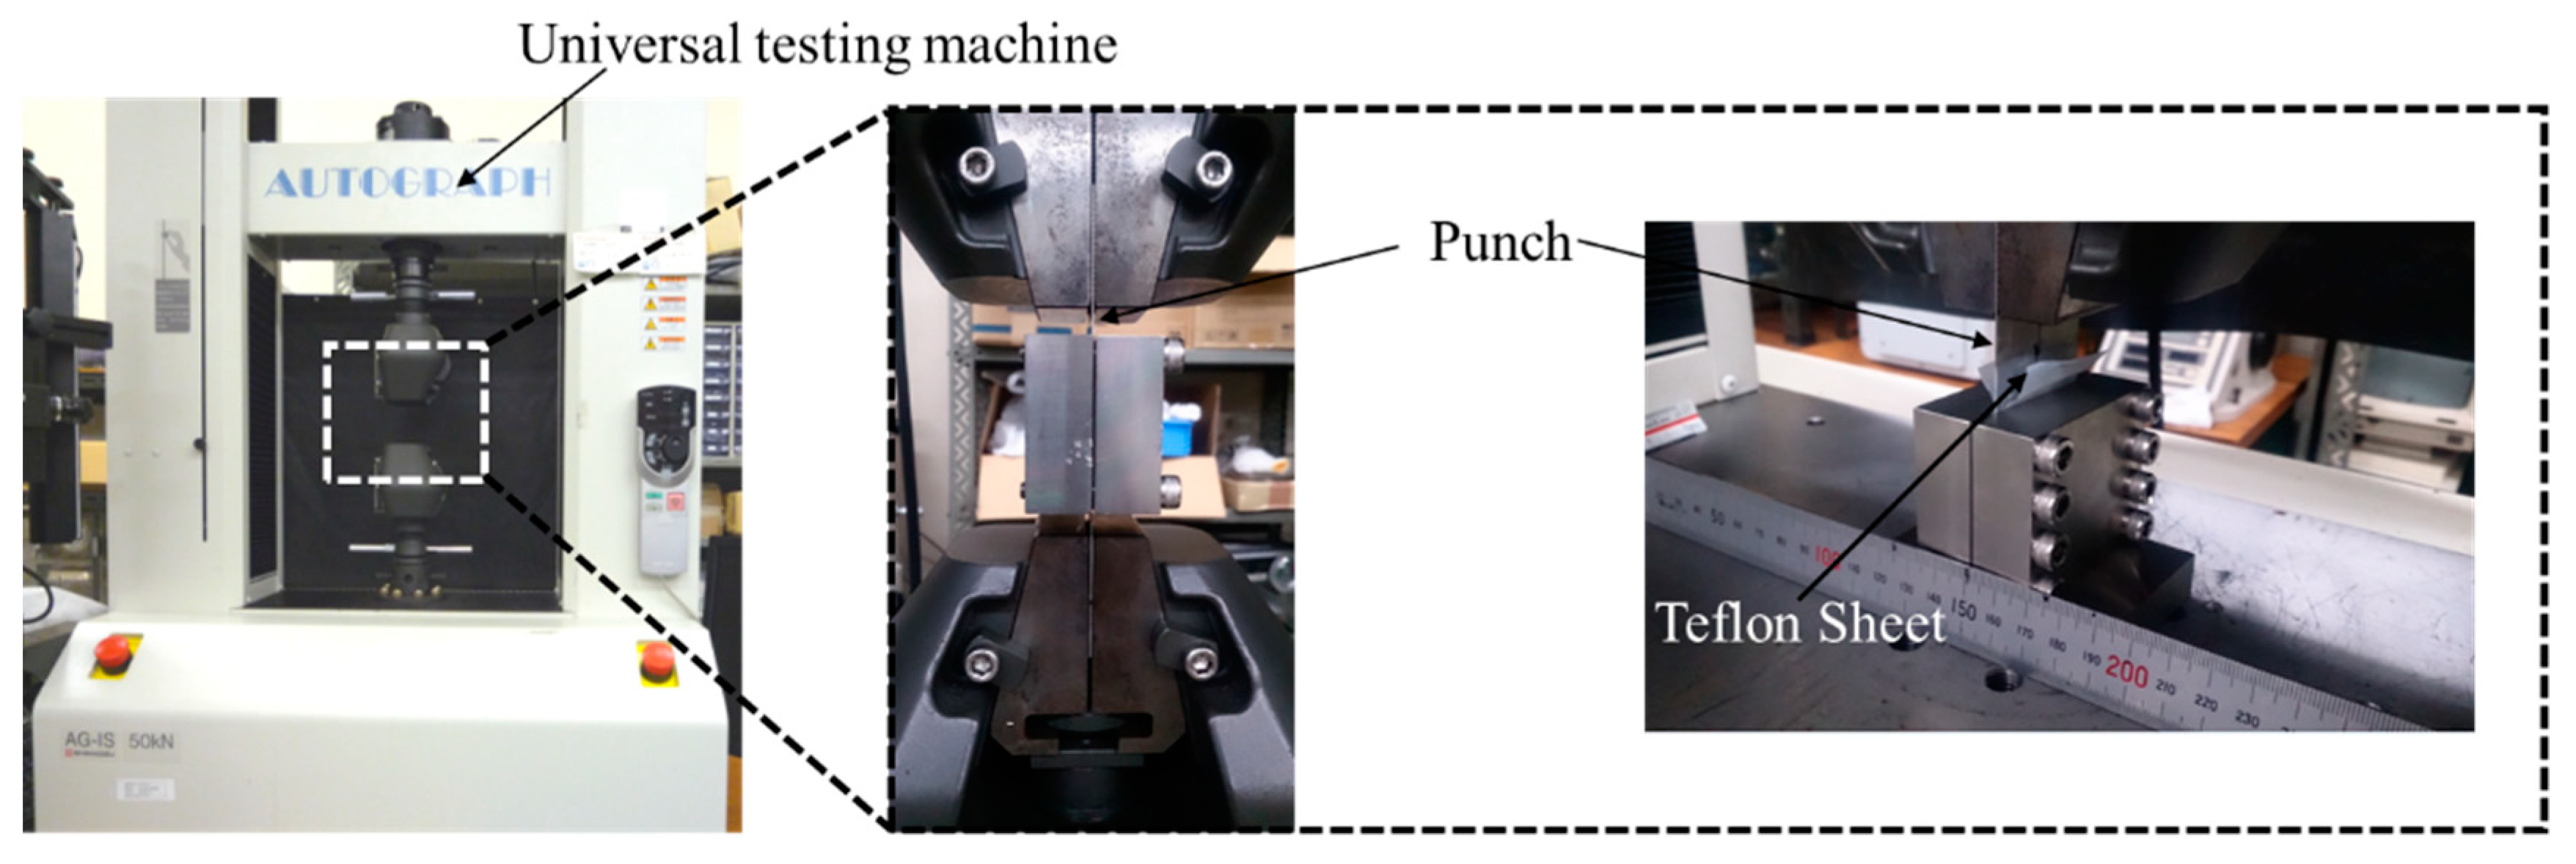
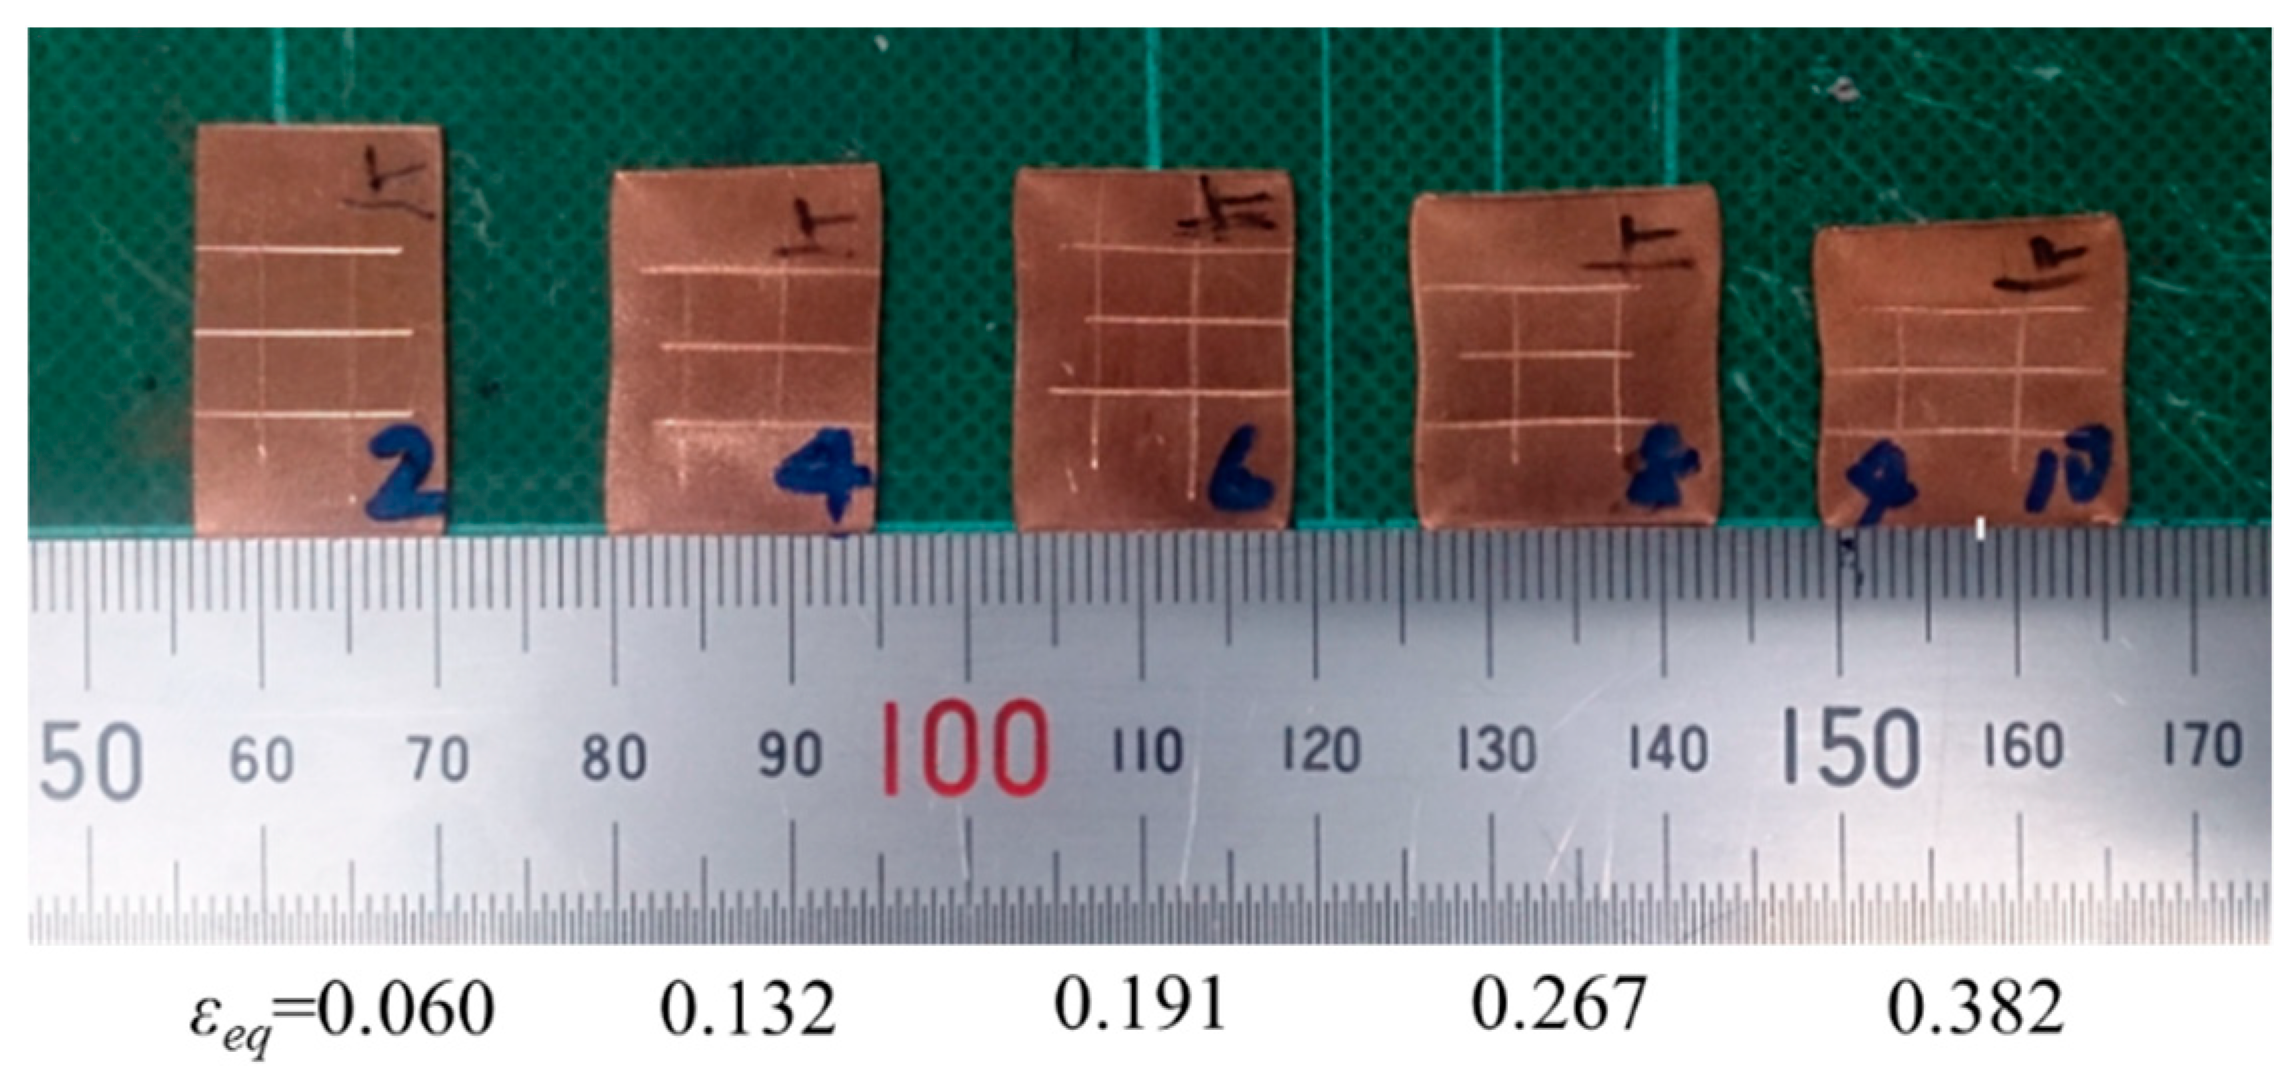
2. Compression Test
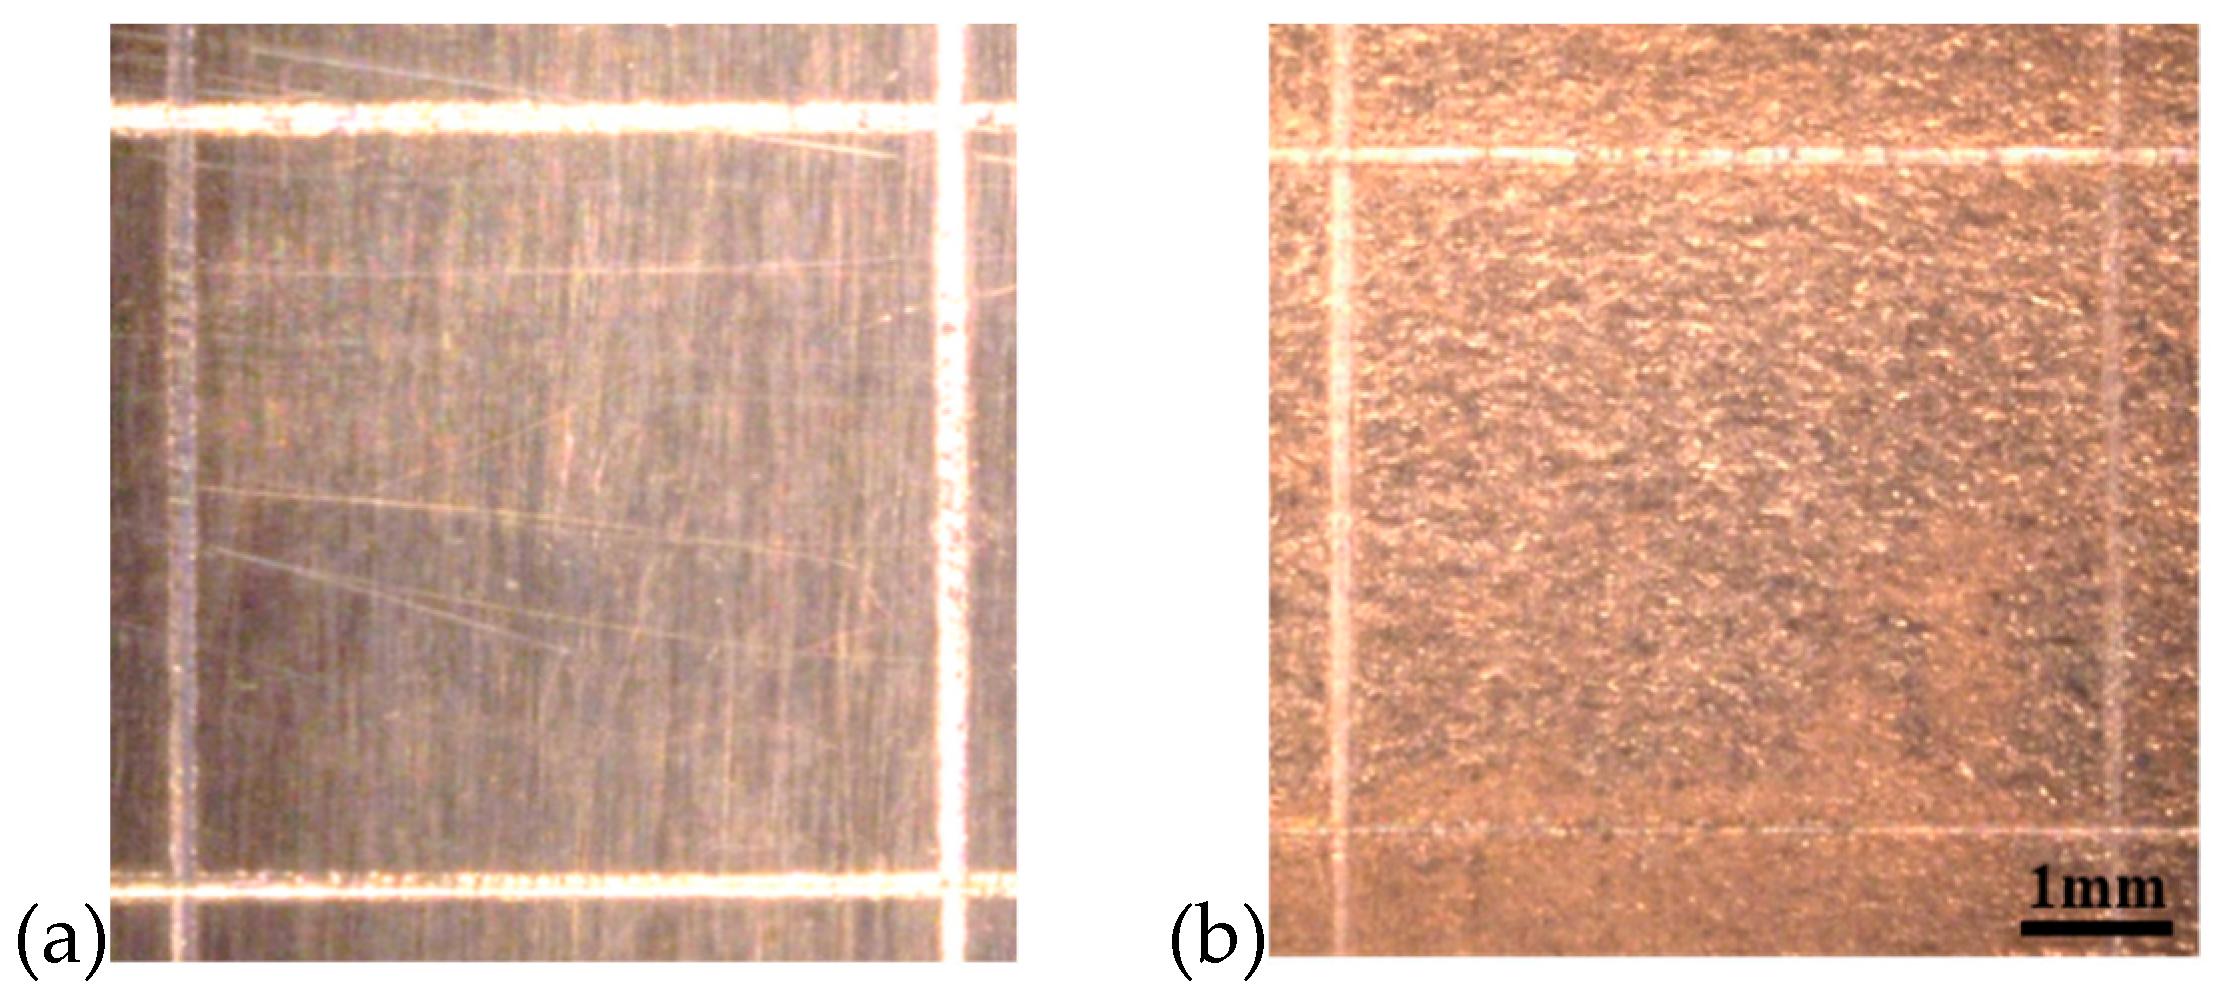
3. Evolution of Surface Roughness in C1220-O Sheets in the Range εn > 0
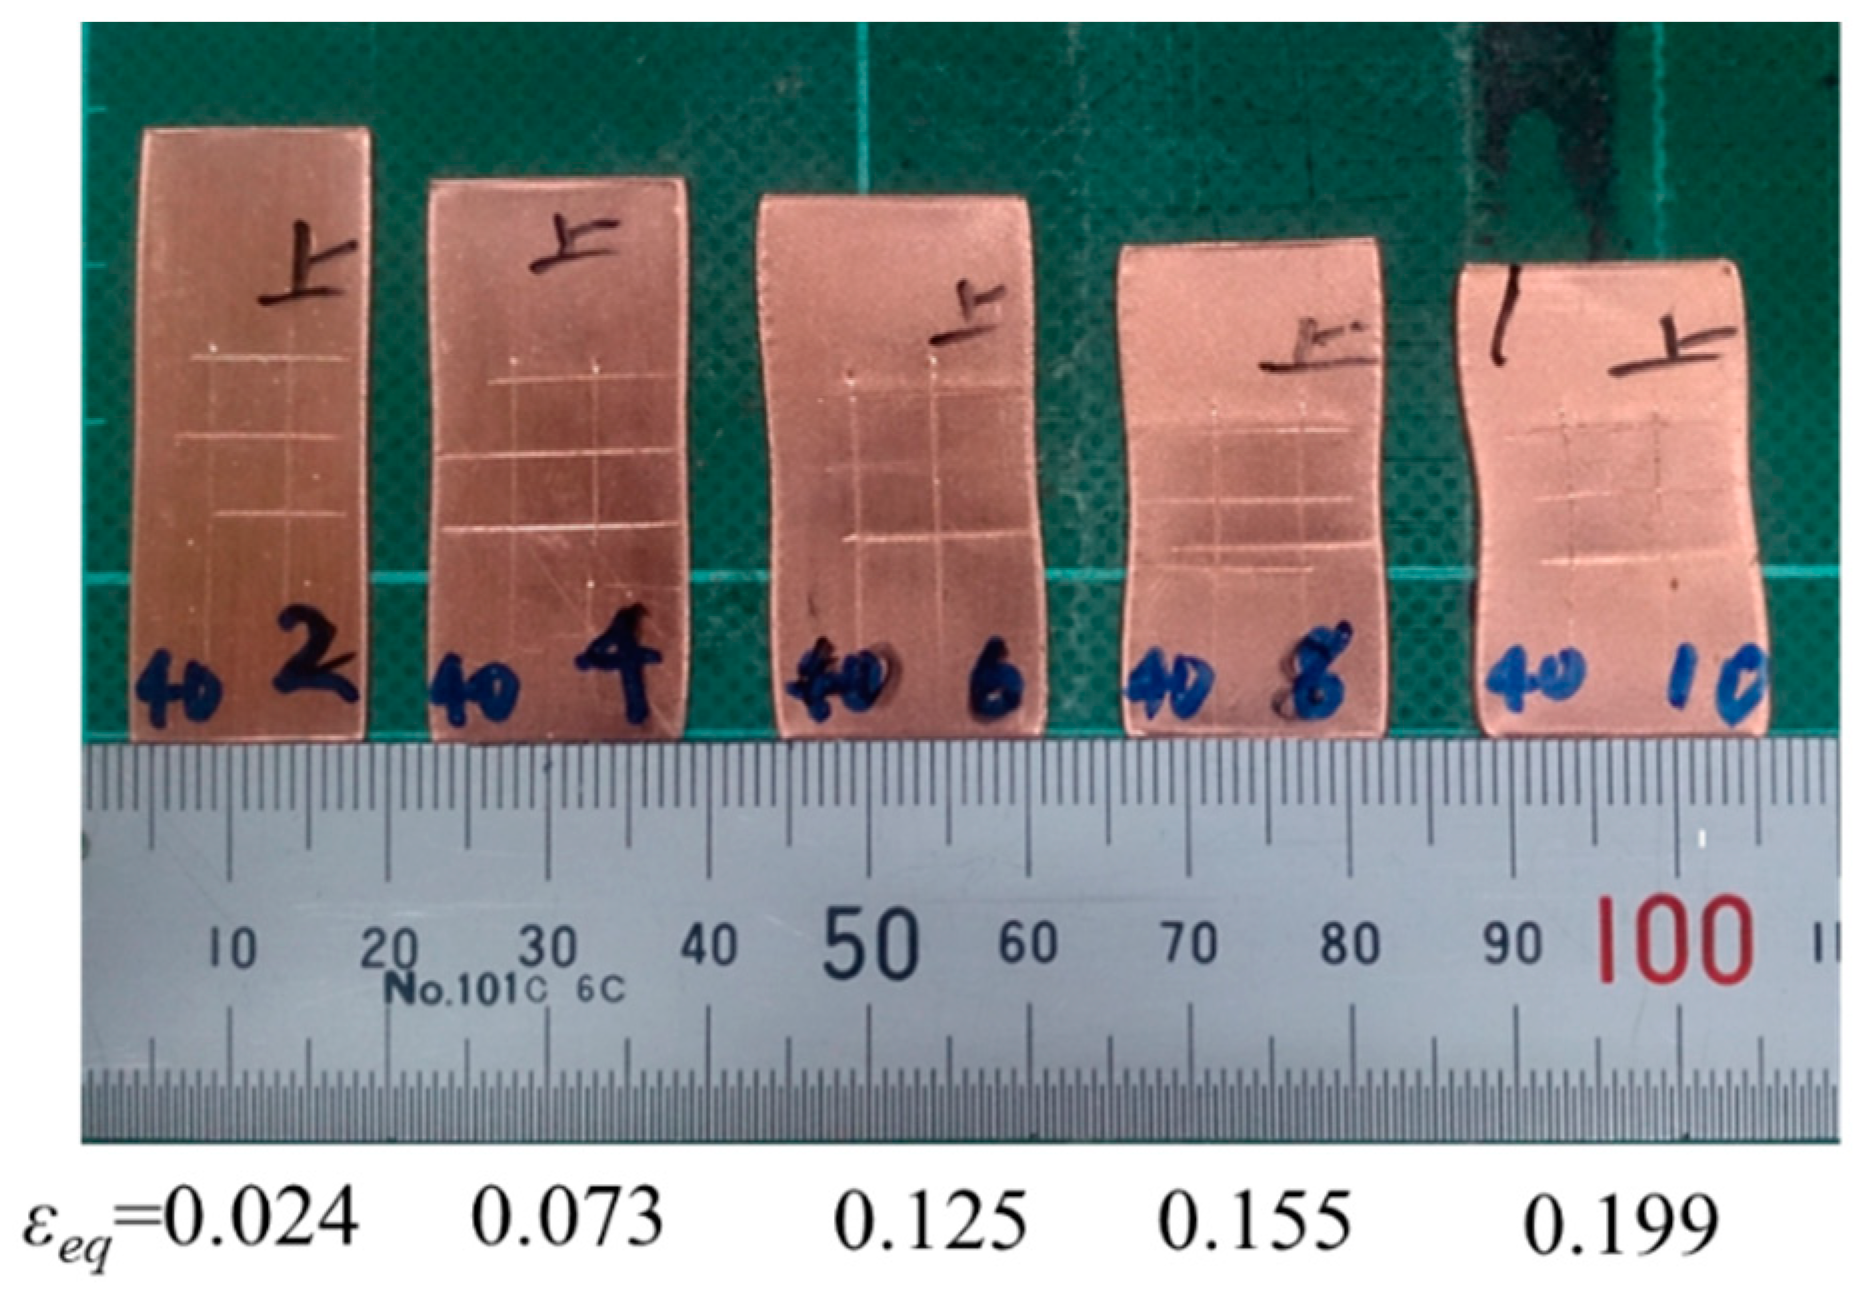
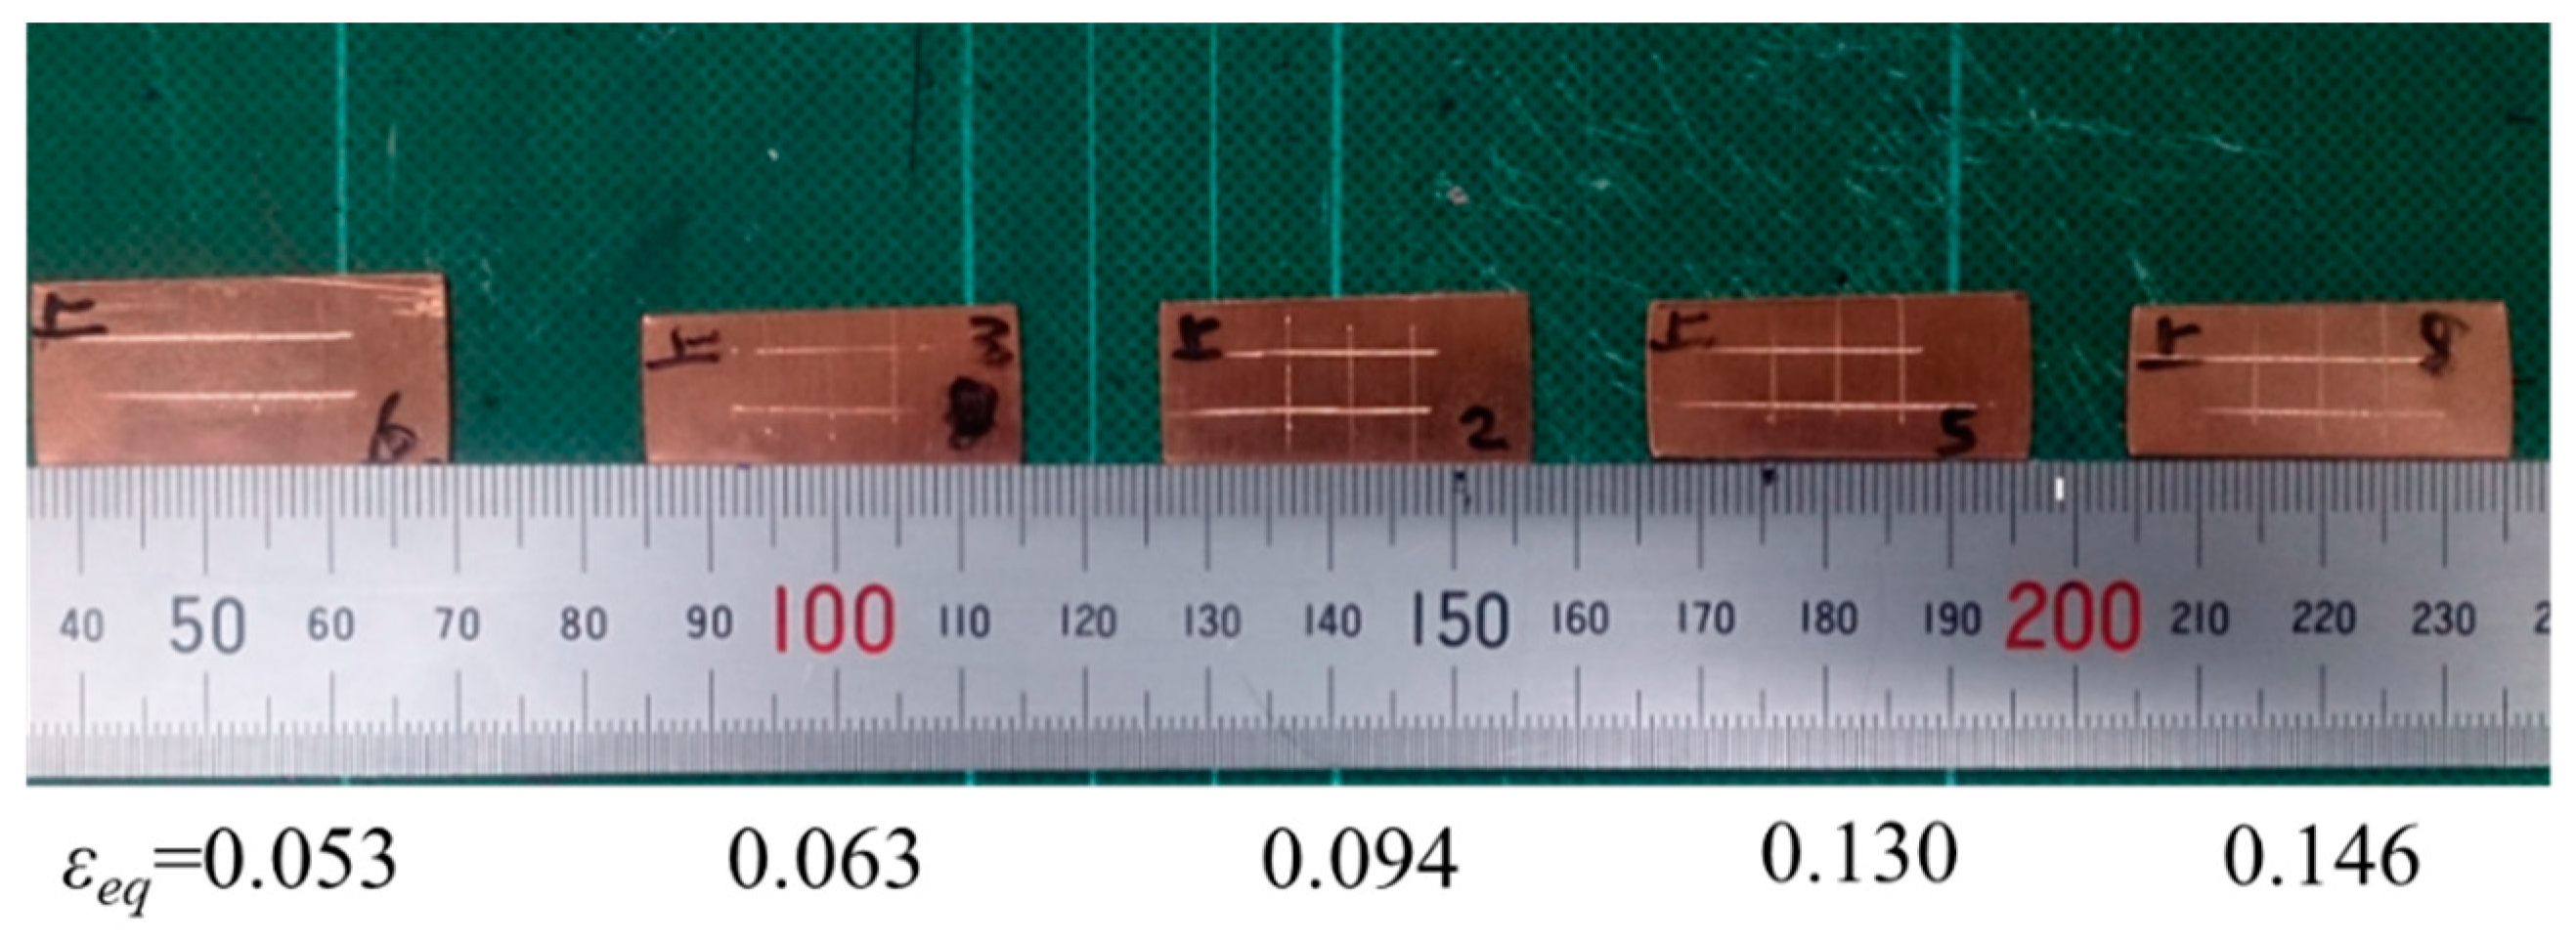
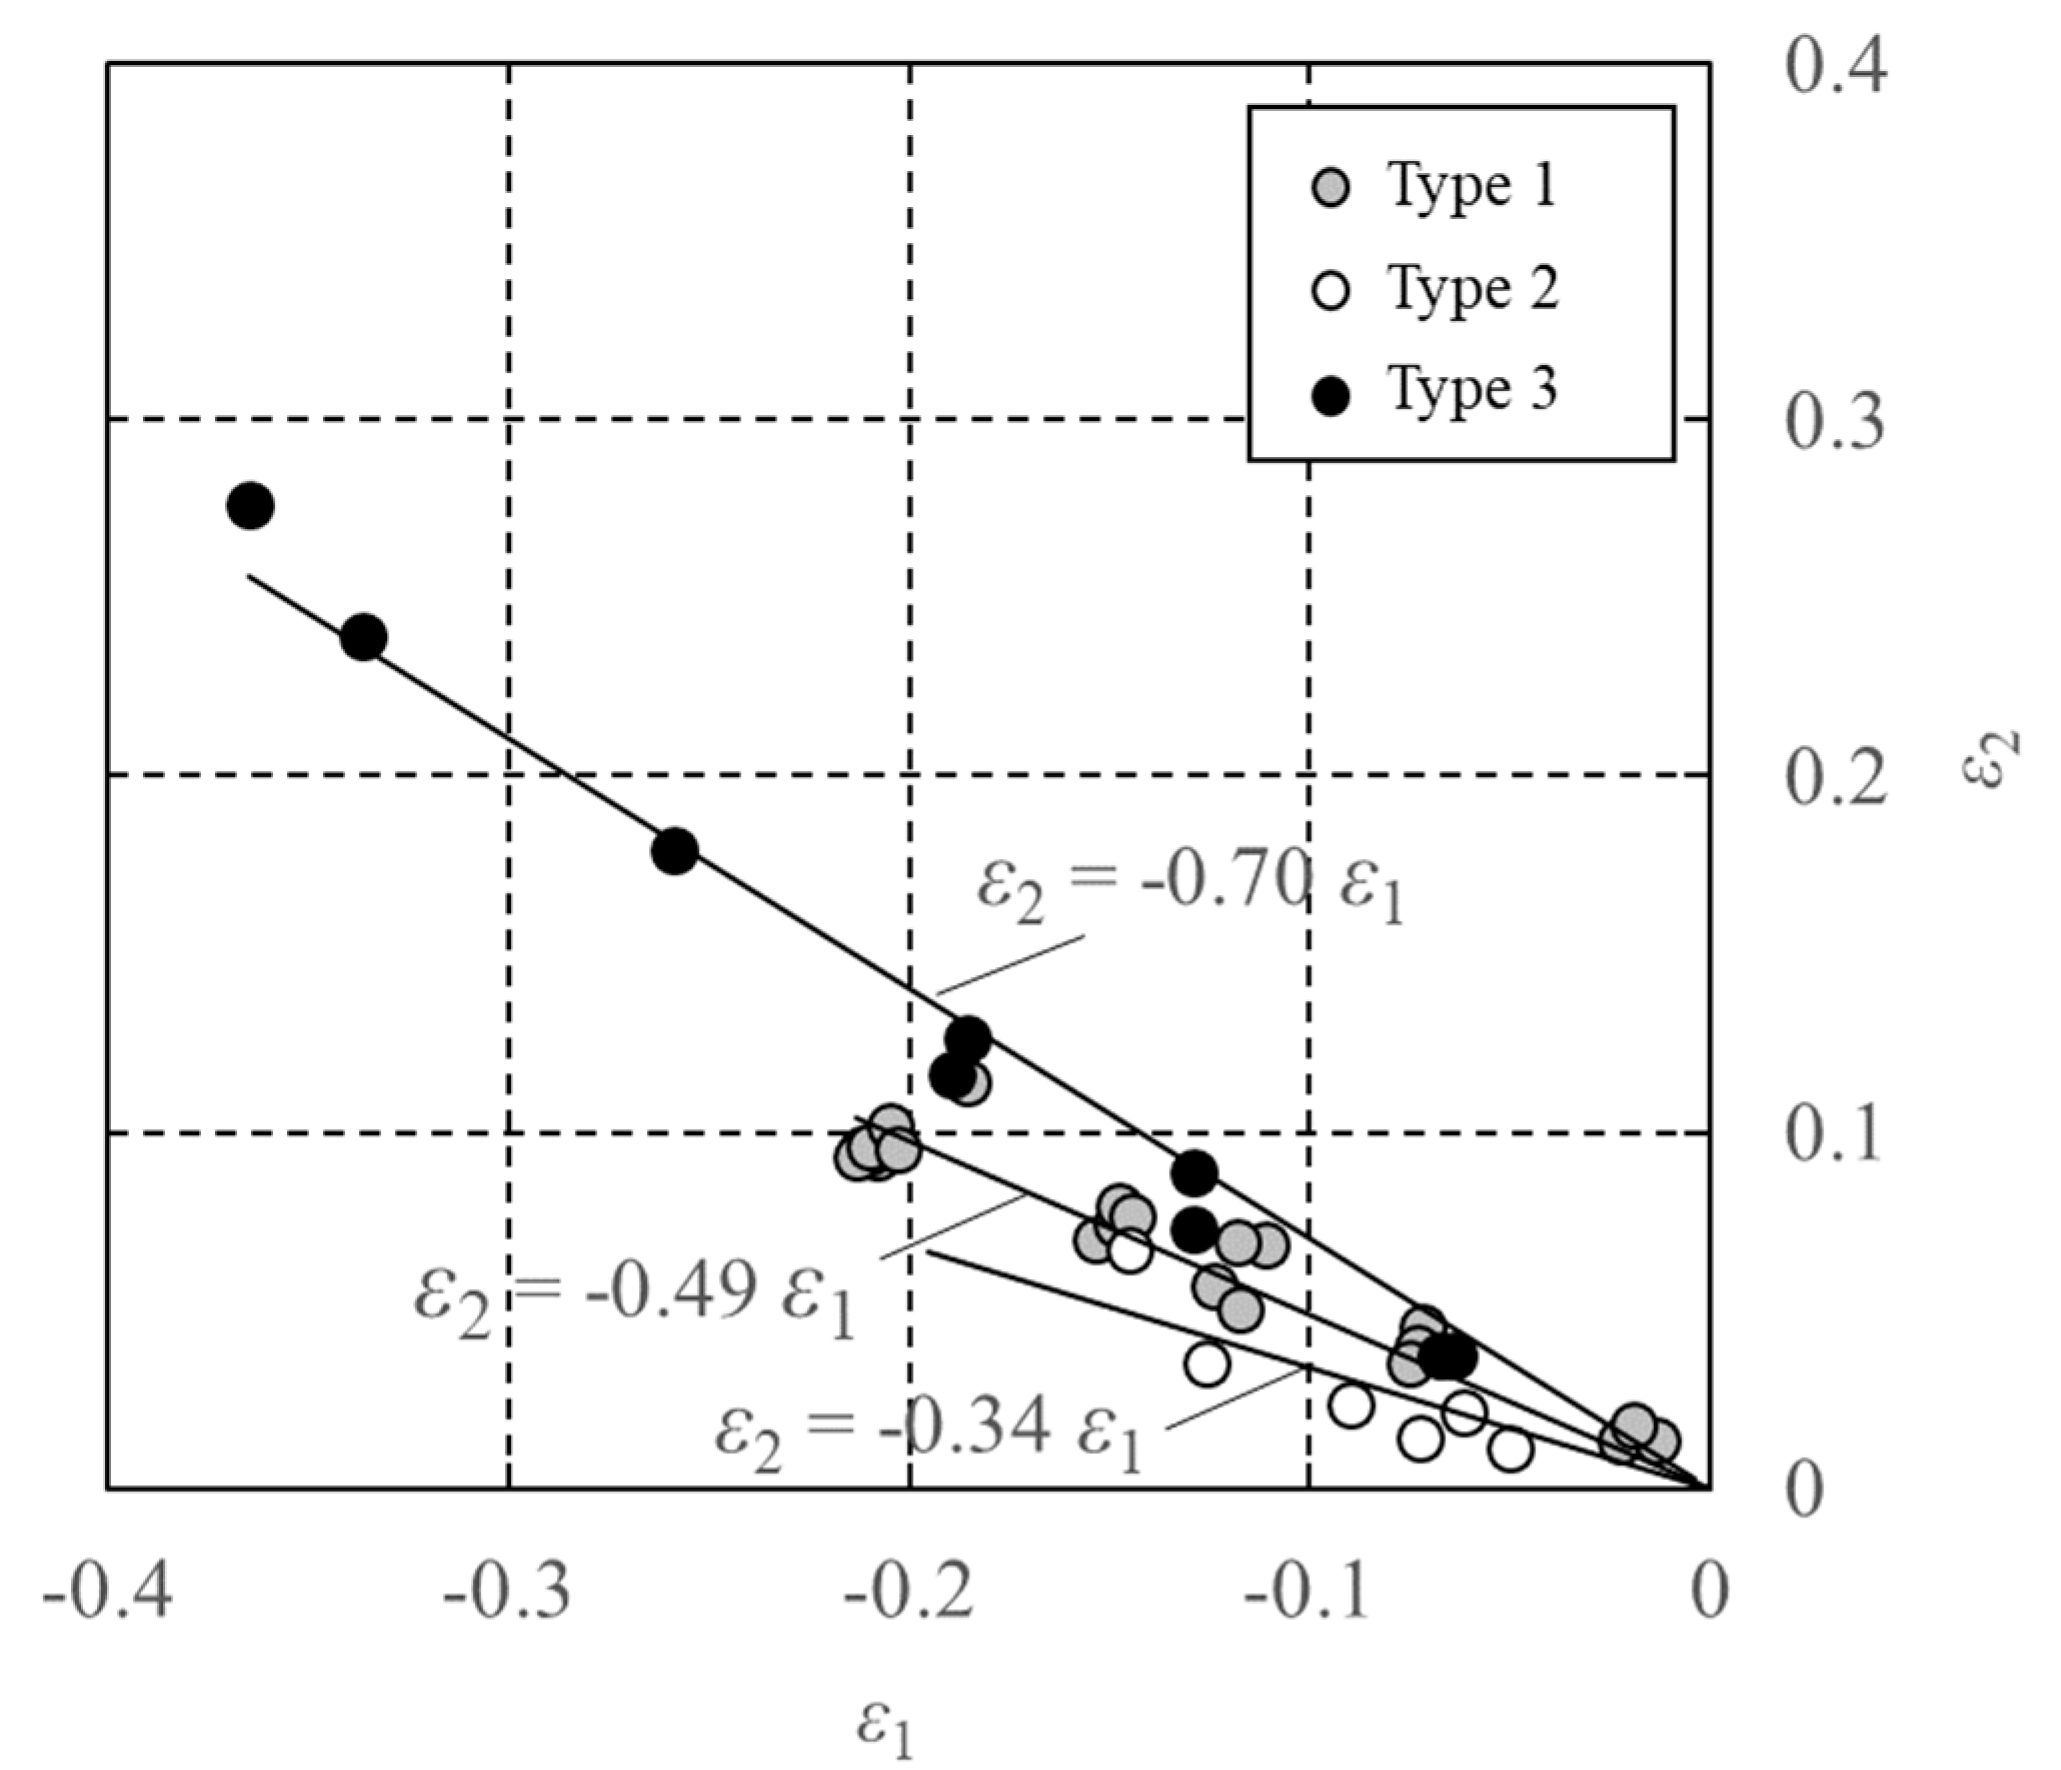
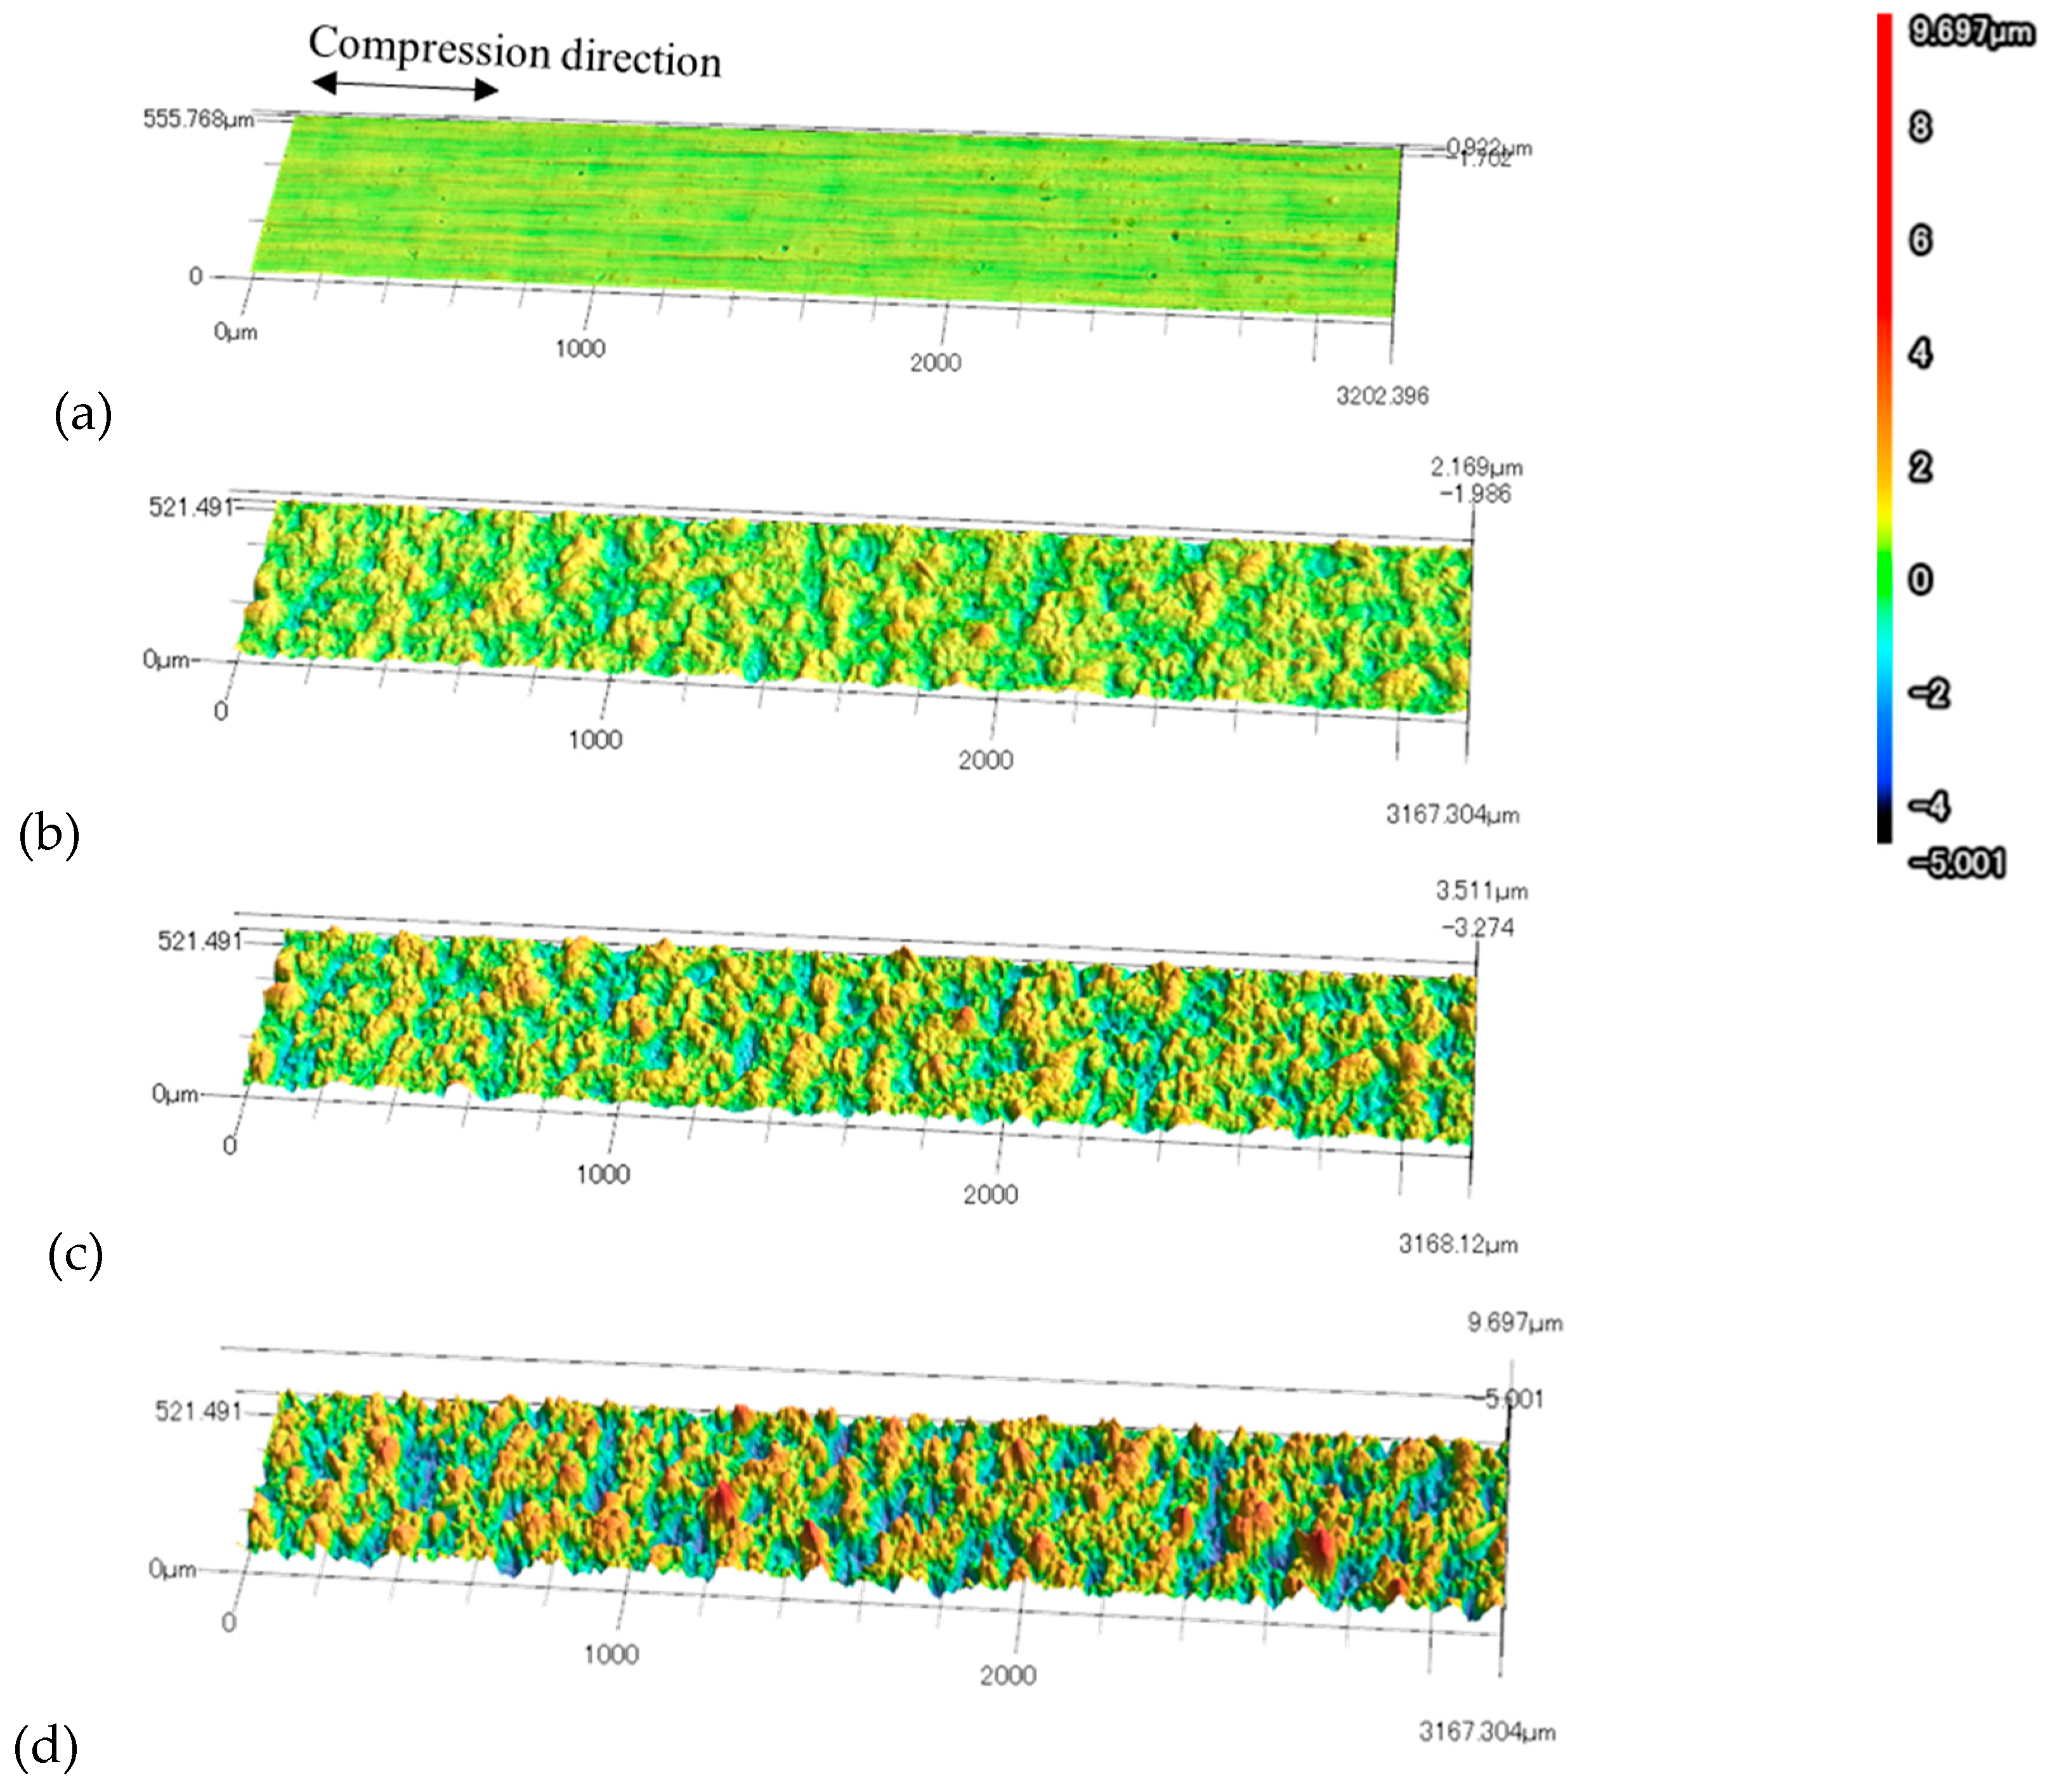
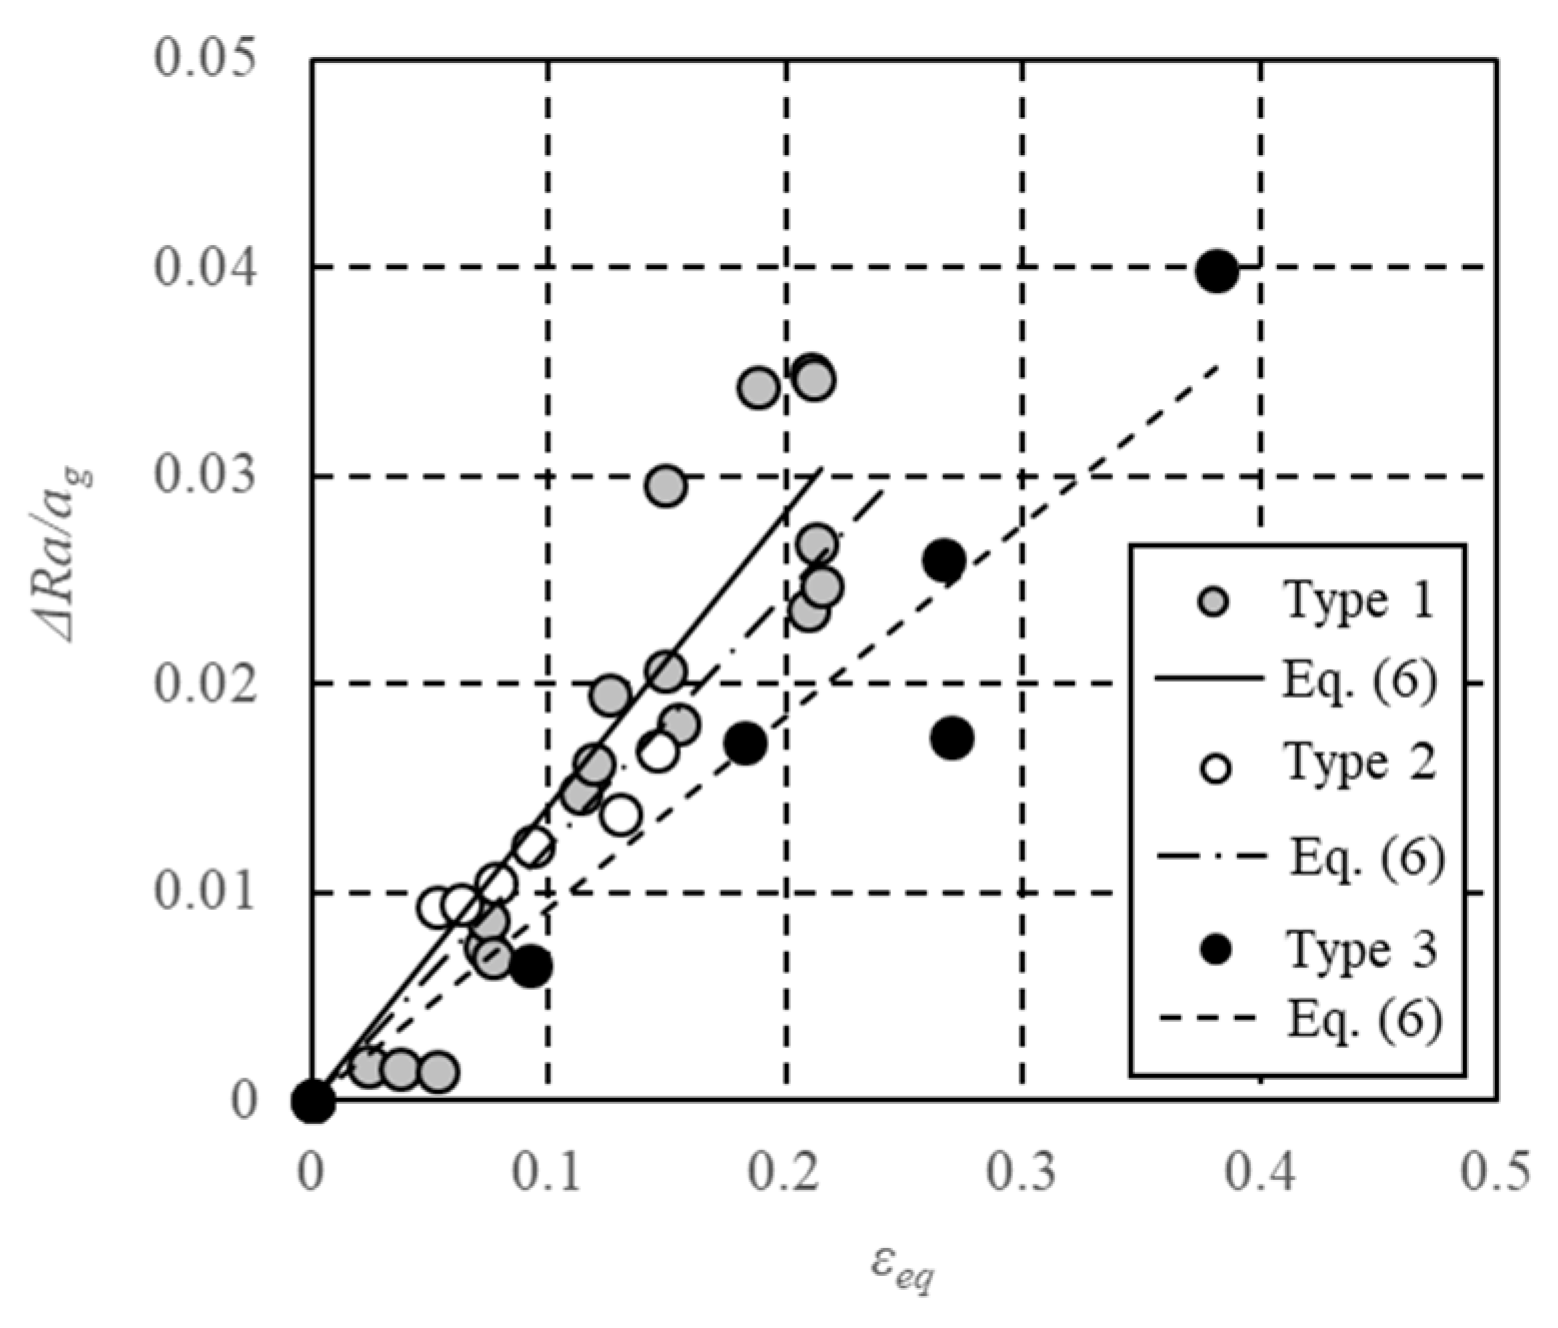
4. Results
5. Conclusions
Author Contributions
Funding
Conflicts of Interest
References
- Geiger, M.; Kleiner, M.; Eckstein, R.; Tiesler, N.; Engel, U. Microforming. CIRP Annals 2001, 50, 445–462. [Google Scholar] [CrossRef]
- Vollertsen, F.; Biermann, D.; Hansen, H.N.; Jawahir, I.S.; Kuzman, K. Size effects in manufacturing of metallic components. CIRP Annals 2009, 58, 566–587. [Google Scholar] [CrossRef]
- Furushima, T.; Manabe, K. FE analysis of size effect on deformation and heat transfer behavior in microtube dieless drawing. J. Mater. Process. Technol. 2008, 201, 123–127. [Google Scholar] [CrossRef]
- Engel, U. Tribology in microforming. Wear 2006, 260, 265–273. [Google Scholar] [CrossRef]
- Liu, H.; Zhang, W.; Gau, J.-T.; Shen, Z.; Ma, Y.; Zhang, G.; Wang, X. Feature Size Effect on Formability of Multilayer Metal Composite Sheets under Microscale Laser Flexible Forming. Metals 2017, 7, 275. [Google Scholar] [CrossRef]
- Kals, T.A.; Eckstein, R. Miniaturization in sheet metal working. J. Mater. Process. Technol. 2000, 103, 95–101. [Google Scholar] [CrossRef]
- Fu, M.W.; Chan, W.L. Geometry and grain size effects on the fracture behavior of sheet metal in micro-scale plastic deformation. Mater. Des. 2011, 32, 4738–4746. [Google Scholar] [CrossRef]
- Furushima, T.; Tsunezaki, H.; Manabe, K.I.; Alexsandrov, S. Ductile fracture and free surface roughening behaviors of pure copper foils for micro/meso-scale forming. Int. J. Mach. Tools Manuf. 2014, 76, 34–48. [Google Scholar] [CrossRef]
- Osakada, K.; Oyane, M. On the Roughening of Free Surface in Deformatio Process. Bull. JSME 1971, 14, 171–177. [Google Scholar] [CrossRef]
- Yamaguchi, K.; Mellor, P.B. Thickness and Grain Size Dependence of Limit Strains in Sheet Metal Stretching. Int. J. Mech. Sci. 1976, 18, 85–90. [Google Scholar] [CrossRef]
- Furushima, T.; Masuda, T.; Manabe, K.; Alexandrov, S. Inhomogeneous 3D Finite Element Model for Prediction of Free Surface Roughening. Adv. Mater. Res. 2012, 418–420, 1040–1043. [Google Scholar] [CrossRef]
- Shimizu, T.; Yang, M.; Manabe, K. Classification of mesoscopic tribological properties under dry sliding friction for microforming operation. Wear 2015, 330–331, 49–58. [Google Scholar] [CrossRef]
- Luo, L.; Jiang, Z.; Wei, D.; Manabe, K.I.; Zhao, X.; Wu, D.; Furushima, T. Effects of surface roughness on micro deep drawing of circular cups with consideration of size effects. Finite Elem. Anal. Des. 2016, 111, 46–55. [Google Scholar] [CrossRef]
- Hu, P.; Li, D.Y.; Li, Y.X. Analytical models of stretch and shrink flanging. Int. J. Machine Tools and Manuf. 2003, 43, 1367–1373. [Google Scholar] [CrossRef]
- Shimizu, T.; Ogawa, M.; Yang, M.; Manabe, K. Plastic anisotropy of ultra-thin rolled phosphor bronze foils and its thickness strain evolution in micro-deep drawing. Mater. Design 2014, 56, 604–612. [Google Scholar] [CrossRef]
- Klimczak, T.; Dautzenberg, J.H.; Kals, J.A.G. On the Roughening of a Free Surface During Sheet Metal Forming. CIRP Annals 1988, 37, 267–270. [Google Scholar] [CrossRef][Green Version]
- Parmar, A.; Mellor, P.B.; Chakrabarty, J. A New Model for the Prediction of Instability and Limit Strains in Thin Sheet Metal. Int. J. Mech. Sci. 1977, 19, 389–398. [Google Scholar] [CrossRef]
- Jain, M.; Lloyd, D.J.; Macewen, S.R. Hardening Laws, Surface Roughness and Biaxial Tensile Limit Strains of Sheet Aluminium Alloys. Int. J. Mech. Sci. 1996, 38, 219–232. [Google Scholar] [CrossRef]
- Alexandrov, S.; Manabe, K.; Furushima, T. A New Empirical Relation for Free Surface Roughening. Trans. ASME J. Manufact. Sci. Eng. 2011, 133, 014503. [Google Scholar] [CrossRef]
- Furushima, T.; Sato, H.; Manabe, K.; Alexandrov, S. Identification of an Empirical Equation for Predicting Free Surface Roughness Evolution in Thin Sheets of Aluminum Alloy and Pure Copper. J. Manuf. Sci. Eng. Trans. ASME 2018, 140, 034501. [Google Scholar] [CrossRef]
- Becker, R. Effects of Strain Localization on Surface Roughening During Sheet Forming. Acta Mater. 1998, 46, 1385–1401. [Google Scholar] [CrossRef]
- Marciniak, Z.; Kuczynski, K. Limit strains in the processes of stretch-forming sheet metal. Int. J. Mech. Sci. 1967, 9, 609–612. [Google Scholar] [CrossRef]
- Bae, G.H.; Huh, H. Tension/compression test of auto-body steel sheets with the variation of the pre-strain and the strain rate. WIT Trans. Eng. Sci. 2011, 72, 213–225. [Google Scholar]
- Piao, K.; Lee, J.K.; Kim, J.H.; Kim, H.Y.; Chung, K.; Barlat, F.; Wagoner, R.H. A sheet tension/compression test for elevated temperature. Int. J. Plast. 2012, 38, 27–46. [Google Scholar] [CrossRef]
- Fukuda, M.; Yamaguchi, K.; Takakura, N.; Sakano, Y. Roughening Phenomenon on Free Surface of Products in Sheet Metal Forming. J. Japan Soc. Technol. Plast. 1974, 15, 994–1002. [Google Scholar]
- Azushima, A.; Miyagawa, M. Effect of Working Factors and Metallurgical Factors on Roughening Phenomenon on Free Surface of Sheets—Investigation on Free Surface of Sheet Deformed I. J. Japan Soc. Technol. Plast. 1986, 27, 1261–1267. [Google Scholar]


© 2019 by the authors. Licensee MDPI, Basel, Switzerland. This article is an open access article distributed under the terms and conditions of the Creative Commons Attribution (CC BY) license (http://creativecommons.org/licenses/by/4.0/).
Share and Cite
Furushima, T.; Aoto, K.; Alexandrov, S. A New Compression Test for Determining Free Surface Roughness Evolution in Thin Sheet Metals. Metals 2019, 9, 451. https://doi.org/10.3390/met9040451
Furushima T, Aoto K, Alexandrov S. A New Compression Test for Determining Free Surface Roughness Evolution in Thin Sheet Metals. Metals. 2019; 9(4):451. https://doi.org/10.3390/met9040451
Chicago/Turabian StyleFurushima, Tsuyoshi, Kohei Aoto, and Sergei Alexandrov. 2019. "A New Compression Test for Determining Free Surface Roughness Evolution in Thin Sheet Metals" Metals 9, no. 4: 451. https://doi.org/10.3390/met9040451
APA StyleFurushima, T., Aoto, K., & Alexandrov, S. (2019). A New Compression Test for Determining Free Surface Roughness Evolution in Thin Sheet Metals. Metals, 9(4), 451. https://doi.org/10.3390/met9040451