Article

Characterisation and Performance Optimisation of WC-MC/M(C,N)-Co Hardmetals †

Institute for Chemical Technologies and Analytics, Vienna University of Technology, A-1060 Vienna, Austria
*
Author to whom correspondence should be addressed.
This paper is an extended version of our paper published in Brookes, K.J.A., Characterisation of hard materials—Hardmetal characterisation part two at EPMA’s 2017 Milan Congress. Met. Power Rep. 2018, 73, 243–256.
Metals 2019, 9(4), 435; https://doi.org/10.3390/met9040435
Submission received: 18 March 2019 / Revised: 6 April 2019 / Accepted: 9 April 2019 / Published: 12 April 2019
(This article belongs to the Special Issue Design of Cemented Carbides and Cermet)

Abstract

:
WC-MC/M(C,N)-Co hardmetals with 10 wt% Co were prepared in undoped, as well as in either Cr- or V-doped form. The starting formulations contained 5 wt% TiC or 5% (TiC+TiN), the latter with two different TiC/TiN ratios, and 10 wt% (Ta,Nb)C. For each composition, a low-C grade (Ms ≈ 75%) and a high-C grade (Ms ≈ 88%) was adjusted by C or W addition, to end up with 18 different hardmetal formulations, prepared in an industrial process. Model alloys, MC and M(C,N) phases with a composition reflecting the composition of these phases in the hardmetal were prepared, too. A variety of data was collected: binder phase and hard phase compositions of model alloys by wavelength-dispersive electron-probe microanalysis (WDS-EPMA), liquid phase formation temperatures in model alloys with free C and eta by differential thermal analysis (DTA), respectively, thermal conductivities of MC and M(C,N) phases and hardmetals by laser-flash temperature conductivity and heat capacity measurements up to 950 °C, crystallite-size distribution by electron backscatter diffraction EBSD, hardness HV30, Palmqvist-Shetty fracture toughness KIC, Weibull evaluation of the transverse rupture strength (TRS), oxidation resistance in air as well as milling tests on coated hardmetals with Ti(C,N)/Al2O3 and (Ti,Al)N layers.

Graphical Abstract

1. Introduction

WC-Co hardmetals with additions of fcc “MC” phases, such as TiC, TaC and NbC (or solid solutions of these fcc compounds), belong to ISO P and M classes of hardmetals [1] and are used primarily for steel machining. Individual MC phases in the starting formulation homogenise upon sintering, and the final composition of the resulting cubic phase is composed of all metals “M” contained in the hardmetal, except Co. If nitrogen is added in the form of a nitride or carbonitride, for example, TiN, Ti(C,N), or nitrogen is applied upon sintering, the resulting fcc phase takes up nitrogen to form an fcc carbonitride phase – M(C,N). Nitrogen addition can influence the bulk microstructure of the M(C,N) grain substantially to form a core-rim structure, such as in cermets [2], as well as the near-surface microstructure by enrichment or depletion of nitrogen in near-surface regions to establish a graded body [3]. The presence of the MC or M(C,N) phase (“MC/M(C,N)”) makes hardmetals less tough, but the wear resistance and oxidation resistance increase substantially so that they represent an indispensable class of hardmetals in modern machining.
One target of our study was to characterise the fcc MC and M(C,N) phases and the binder phase. This was also performed by use of model alloys, which contained the same type of phases but are enriched in the binder phase or hard phase to be accessible by wavelength-dispersive microprobe analysis. To come close to invariant reactions, the model alloys were adjusted so that either free C or eta phase was present. Hence, these data can be used for thermodynamic modelling in a later study. Establishing model alloys with free C and eta phase, respectively, gives also the upper and lower limits of solubility of the various elements in the binder phase for an optimisation of the hardmetal formulations. This compositional optimisation was performed subsequently, that is, the hardmetals with an optimum doping level with grain-growth inhibitors VC and Cr3C2, respectively, were prepared within an industrial process by use of the evaluated data. These hardmetals were fully characterised and tested.

2. Materials and Methods

2.1. Model Alloy and Hardmetal Preparation

Powders were obtained from Treibacher Industrie AG, Austria (TiC, Ti(C,N), TaC, NbC, (Ta,Nb)C, Cr3C2, VC), H.C. Starck GmbH, Germany (WC, C) and Umicore, Belgium (Co). The composition of model alloys had an increased amount of binder phase, that of the hardmetals was 10 wt% Co, 10 wt% (Ta,Nb)C and 5 wt% TiC/TiN, the latter in three versions, ([N]/([C]+[N]) = 0, 0.3 and 0.5, respectively. The dopant levels of Cr3C2 or VC of model alloys was increased to identify free Cr-containing phases (such as Cr3C2 or M7C3) and VC in order to get a fully saturated binder phase. The balance of all these samples was WC. The model alloys were adjusted to show either free C or eta phase, in order to access the upper and lower limits of solubilities of the various metals (W, V, Cr, Ti, Ta, Nb) in the binder phase, which are dependent on C activity. Another set of model alloys with an increased amount of hard phases was established to get access to the composition of the fcc hard phase.
For preparation in laboratory scale, all powder blends were mixed/de-agglomerated for 24 h in hardmetal drums and hardmetal grinding balls under cyclohexane, dried, pressed to cylinders with 12.5 mm in diameter and 8 mm in height (at 15 kN·cm2). These cylinders were vacuum sintered at 1440 °C, with a dwell at 1100 °C.
Another set of hardmetals was prepared after solubility data of grain-growth inhibitor from the model alloys was available. This set was prepared in an industrial fabrication process at Kennametal Widia, Essen, Germany. Two versions of hardmetal grades with optimised dopant levels were established, one grade at higher C activity (magnetic saturation, Ms ≈ 88% of pure Co binder) and one grade at lower C activity (Ms ≈ 75%) to end up with a total of 18 hardmetal grades. Sintering (sinterHIPing) was performed with ±5 and ±10 °C/min heating/cooling rates, a dwell at 1100 °C for 30 min as well as at 1440 °C for another 50 min. The latter included a HIP (hot-isostatic pressing) section at 54 bar Ar for 20 min.

2.2. Hot Pressing

Hot pressing of MC/M(C,N) phases was performed in a hot press (FCT Systeme GmbH, Germany) with graphite dies with 30 or 50 mm sample diameter at 2000 °C and a pressure of 4 kN·cm−2 to obtain low-porosity (0.5–2.1%) homogenised sample disks with about 10 mm in height. These disks were fabricated by EDM (electric discharge machining) and polished according to the requirements of the following measurements.

2.3. Characterisation

2.3.1. Metallography, Hardness, Fracture Toughness and Magnetic Data

Polishing and testing of hardness (HV30) and fracture toughness (Palmqvist-Shetty) KIC, as well as magnetic measurements (magnetic saturation, Ms; coercive force, Hc; Foerster-Koerzimat CS 1.096, Dr. Förster, Germany), were made by state-of-the-art methods following the various ISO rules. The Ms data were corrected for total Cr added, the amount of Cr in the MC/M(C,N) phase was not taken into account by this procedure as the error is well below 1% in Ms. For each grade, transverse rupture strength (TRS) was measured on typically about 20 sinterHIPed and ground hardmetal rods with a diameter of 2.9 mm.

2.3.2. SEM and WDS-EPMA

SEM (scanning electron microscopy), both conventional and with a FEG (field ion gun), was performed in BSE (back-scattered electrons) mode. EBSD (electron backscatter diffraction) was carried out in a FEG-SEM microscope (FEI Quanta 200 SEG, ThermoFisher, USA), and WDS-EPMA (wavelength-dispersive electron-probe microanalysis) was performed with a microprobe equipped with 5 spectrometers (Cameca SX100, Cameca, France) and by use of a cold trap to minimise C contamination. Various chemically analysed carbide and carbonitride standards were used for the calibration of EPMA [4].

2.3.3. DTA

DTA (differential thermal analysis) investigations were performed at TUTEC GmbH, Austria, on a LINSEIS STA 1750 TG-DTA equipped with a furnace with MoSi2 heating elements. Powders were pressed at 1500 kg/cm2 to cylinders of 5.5 mm in diameter and height to achieve a sample weight of 200–210 mg. The pellets were placed in an Al2O3 crucible. High-purity Ar atmosphere was applied. The temperature was calibrated by using the Co-2.5 wt% C eutectic reaction, which is at 1320 °C. The alloys were adjusted to show free C or eta phase, respectively. In the WC-Co system, there are the two non-variant four phase reactions adjacent to the WC-Co two-phase field. Because of a higher number of constituents, the present hardmetals do not have a non-variant reaction, but the equilibrium temperatures are close to that of a non-variant reaction (compare [5]).

2.3.4. Thermal Conductivity

For the measurement of the thermal conductivity, the heat capacity and the temperature conductivity were measured by DSC (differential scanning calorimetry) and laser-flash technique, respectively (Anter Flashline 3000, Anter, USA). Plane-parallel mirror-lapped samples of 6 mm diameter and of 1 mm thickness were used. The two data sets were combined to calculate the thermal conductivity as a function of temperature. The measured data were corrected for porosity [6].

3. Results and Discussion

3.1. The Composition of the Binder Phase and of the MC/M(C,N) Hard Phase
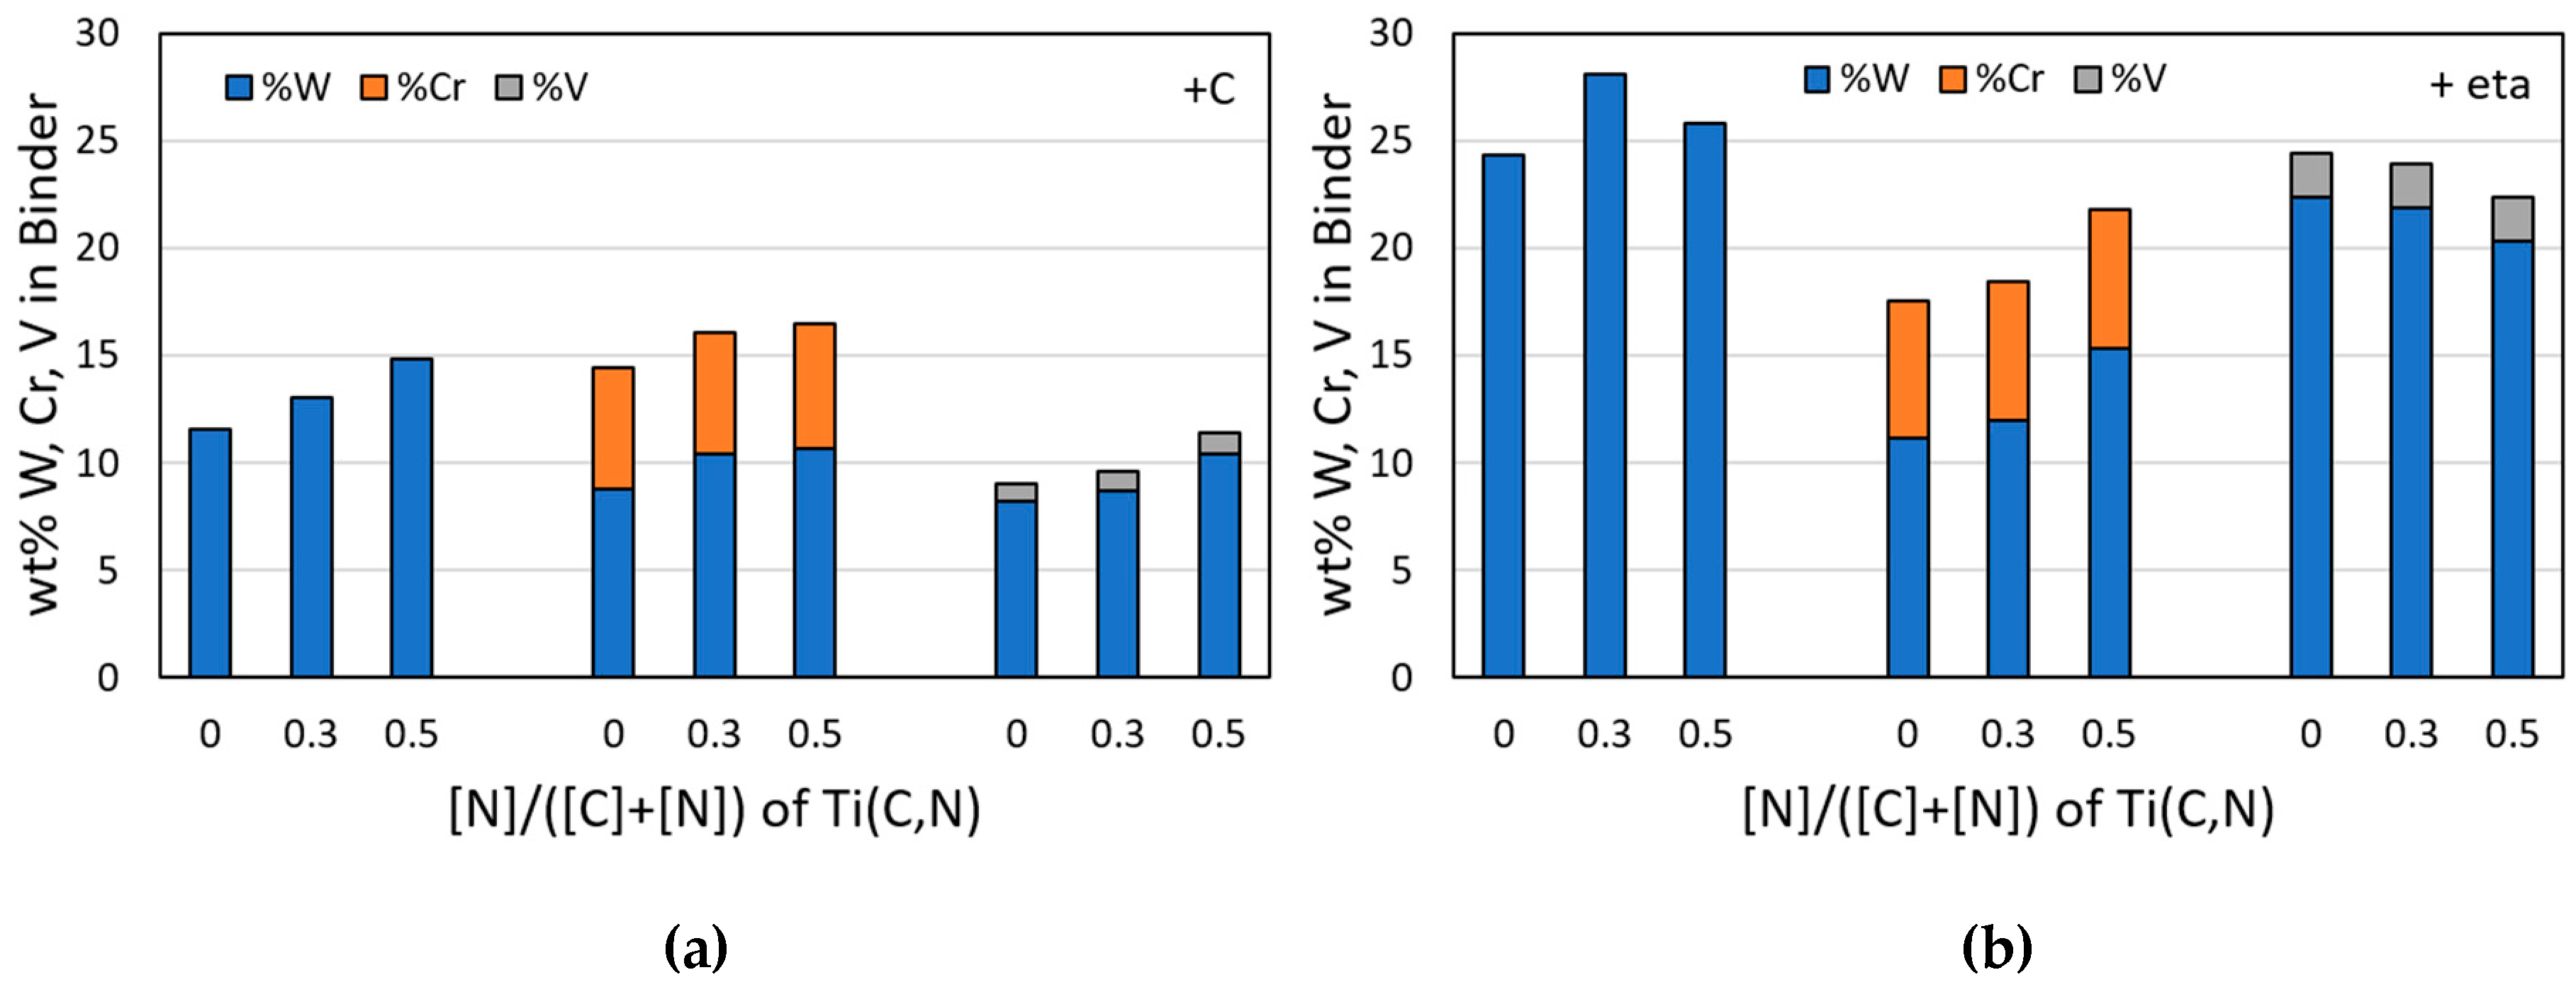
3.1.1. Binder Phase

For measurement of the composition of the binder phase by WDS-EPMA, Co-rich hardmetal model alloys were prepared for obtaining large areas of binder phase to compensate for the restricted lateral resolution of WDS-EPMA [4] so that the line scans in these areas are possible. In these model alloys, also WC and MC/M(C,N), the free carbide of dopants (Cr3C2, M7C3 with Cr, or VC) and either free C or eta phase were present to get the upper and lower limit of solubility at both carbon activities. The full set of solubility data is reported elsewhere [7].
For measuring the composition of the MC/(M(C,N) phases, model alloys with an increased amount of MC/M(C,N) were established to obtain large particles in which individual data points were set to collect composition data. These MC/M(C,N)-rich model alloys also contained free C or eta phase, respectively. Another set of MC/M(C,N) composition data could be directly collected from hardmetals annealed for 24 h during which the MC/M(C,N) phases coarsened and were large enough for WDS-EPMA measurement. Figure 1 represents two types of model alloys, a Co-rich model alloy (Figure 1a) and an MC/M(C,N)-rich model alloy (Figure 1b), both with free C.
The binder phase composition of the three doping grades (undoped, Cr-doped, V-doped) with, in turn, three levels of nitrogen content of the Ti-containing MC/M(C,N) phase ([N]/([C]+[N]) = 0, 0.3 and 0.5, respectively) is shown in Figure 2a for samples with free C (highest C activity) and in Figure 2b for samples with eta phase (lowest C activity).
It is shown that the W solubility in the binder was substantially increased if eta phase is present, which corresponds to the behaviour of continuous increase of the W solubility with decreasing C activity in the two-phase region of WC-Co hardmetals. It was also observed that the Cr solubility was much higher than the V solubility, and both, the Cr and V solubilities, increased with decreasing C activity. Both, Cr and V, decreased the W solubility in the binder substantially. Upon increasing [N]/([C]+[N]) ratio, the general trend was that the W solubilities increased with increasing nitrogen content of the added TiC/TiN in the starting formulation, with the exception of W solubility upon V doping for eta phase grades. No such trend was observed for Cr and V.

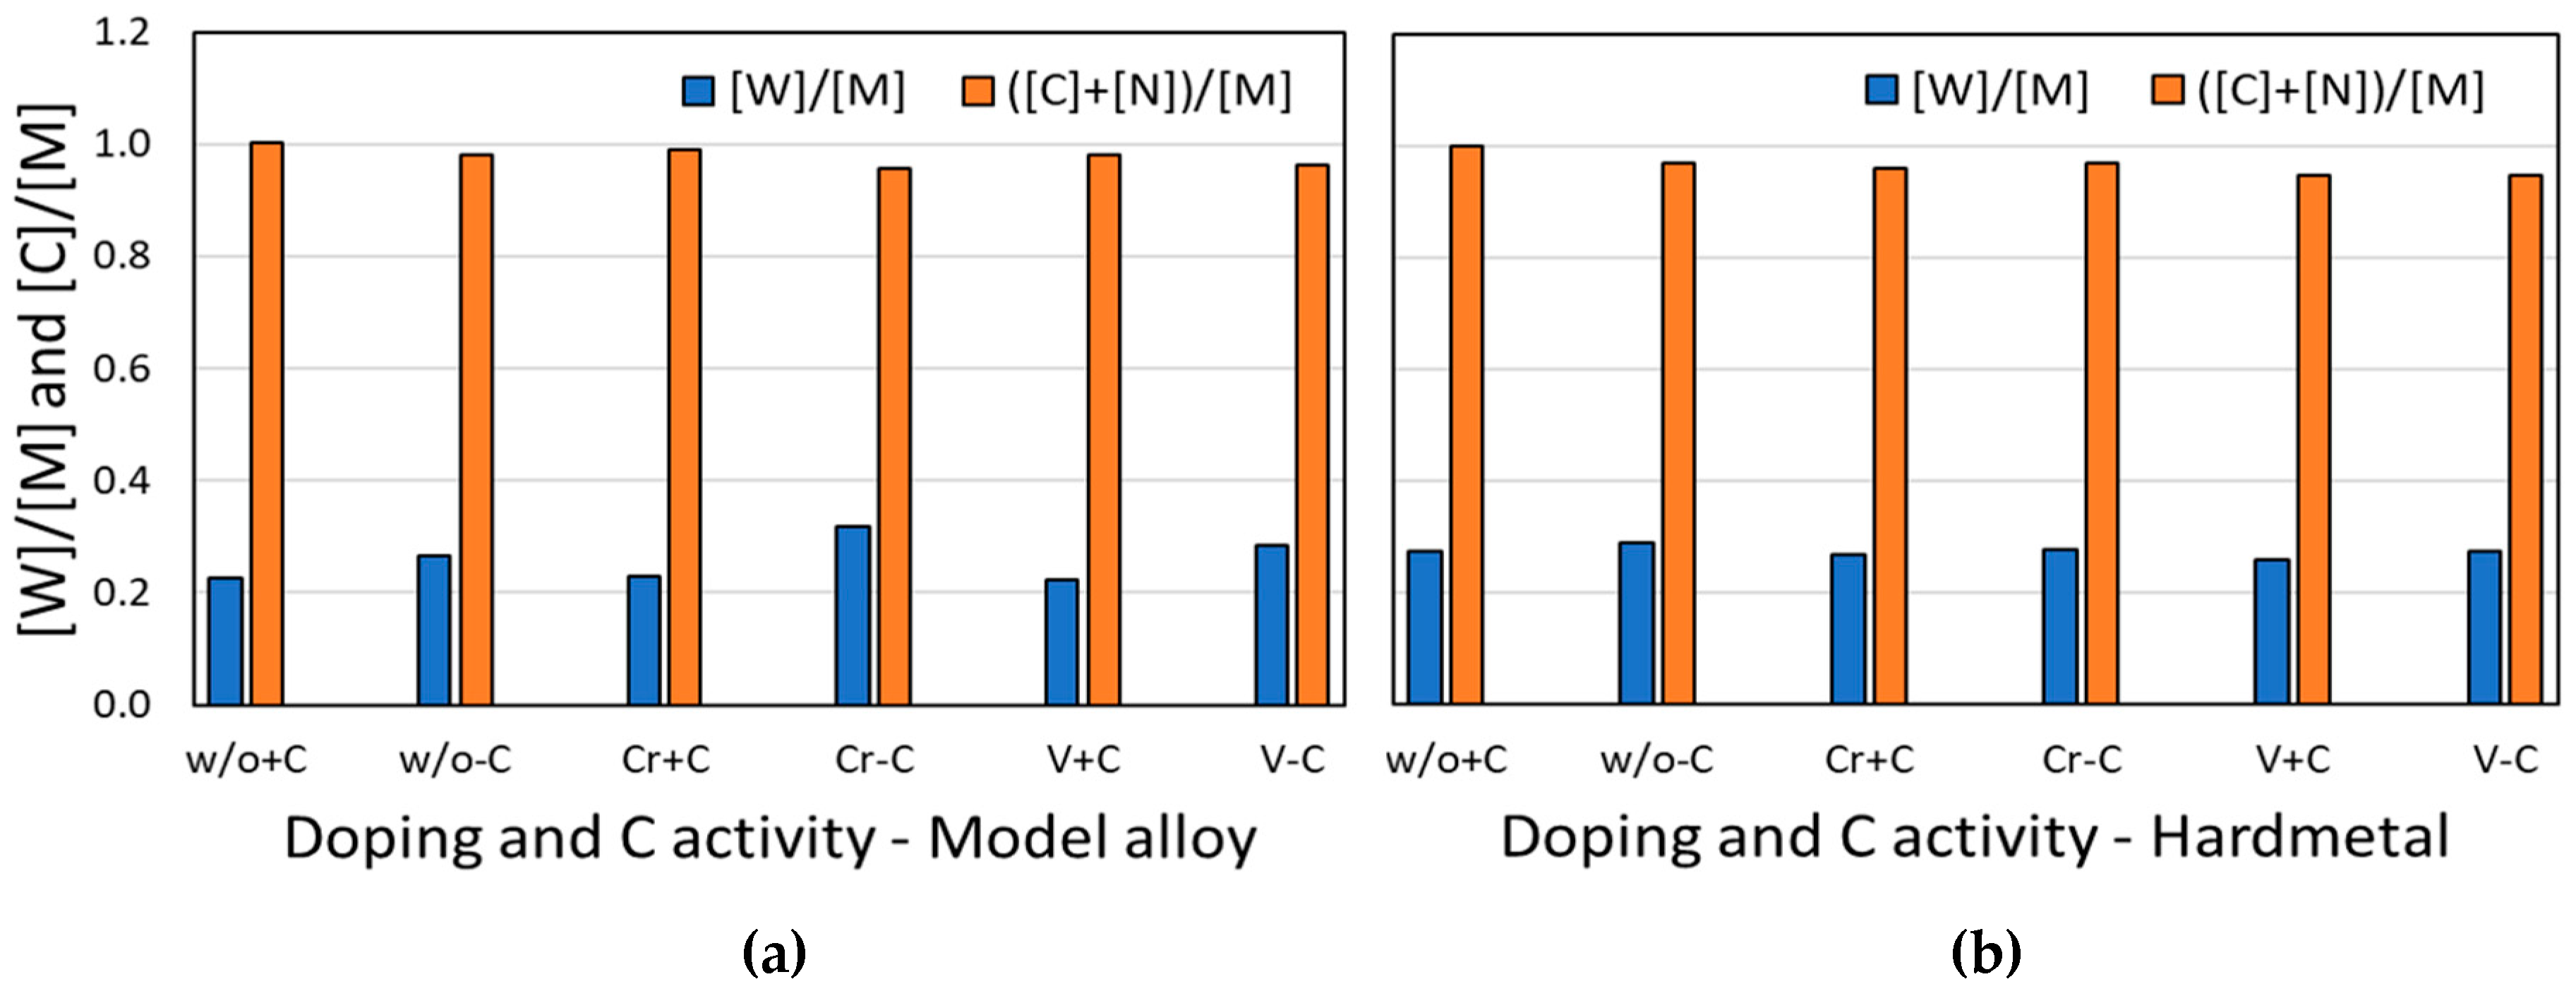
3.1.2. MC/M(C,N) Hard Phase

The composition of the MC/M(C,N) phase was measured in model alloys (where there is either free C or eta phase), as well as in hardmetals, which were annealed for extended time for coarsening. As mentioned, these hardmetals had a high and a low C activity, respectively, but no free C or eta phase. The two data sets correspond closely to each other—the small difference in C activity of model alloy and hardmetals (free C—high C, eta—low C) had obviously no significant influence on the composition of the MC/M(C,N) phase (as an example, only [W] in the fcc MC/M(C,N) is represented in Figure 3), also the non-metal deficiency of the fcc phase ([C]+[N])/[M] was almost identical. As the solubility of Ti, Ta and Nb in the binder phase was very low, almost the total amount of these metals was incorporated into the MC/M(C,N) phase. The mol fractions of dopants [V]/[M] and [Cr]/[M] in the MC/M(C,N) phase were 1–2%.

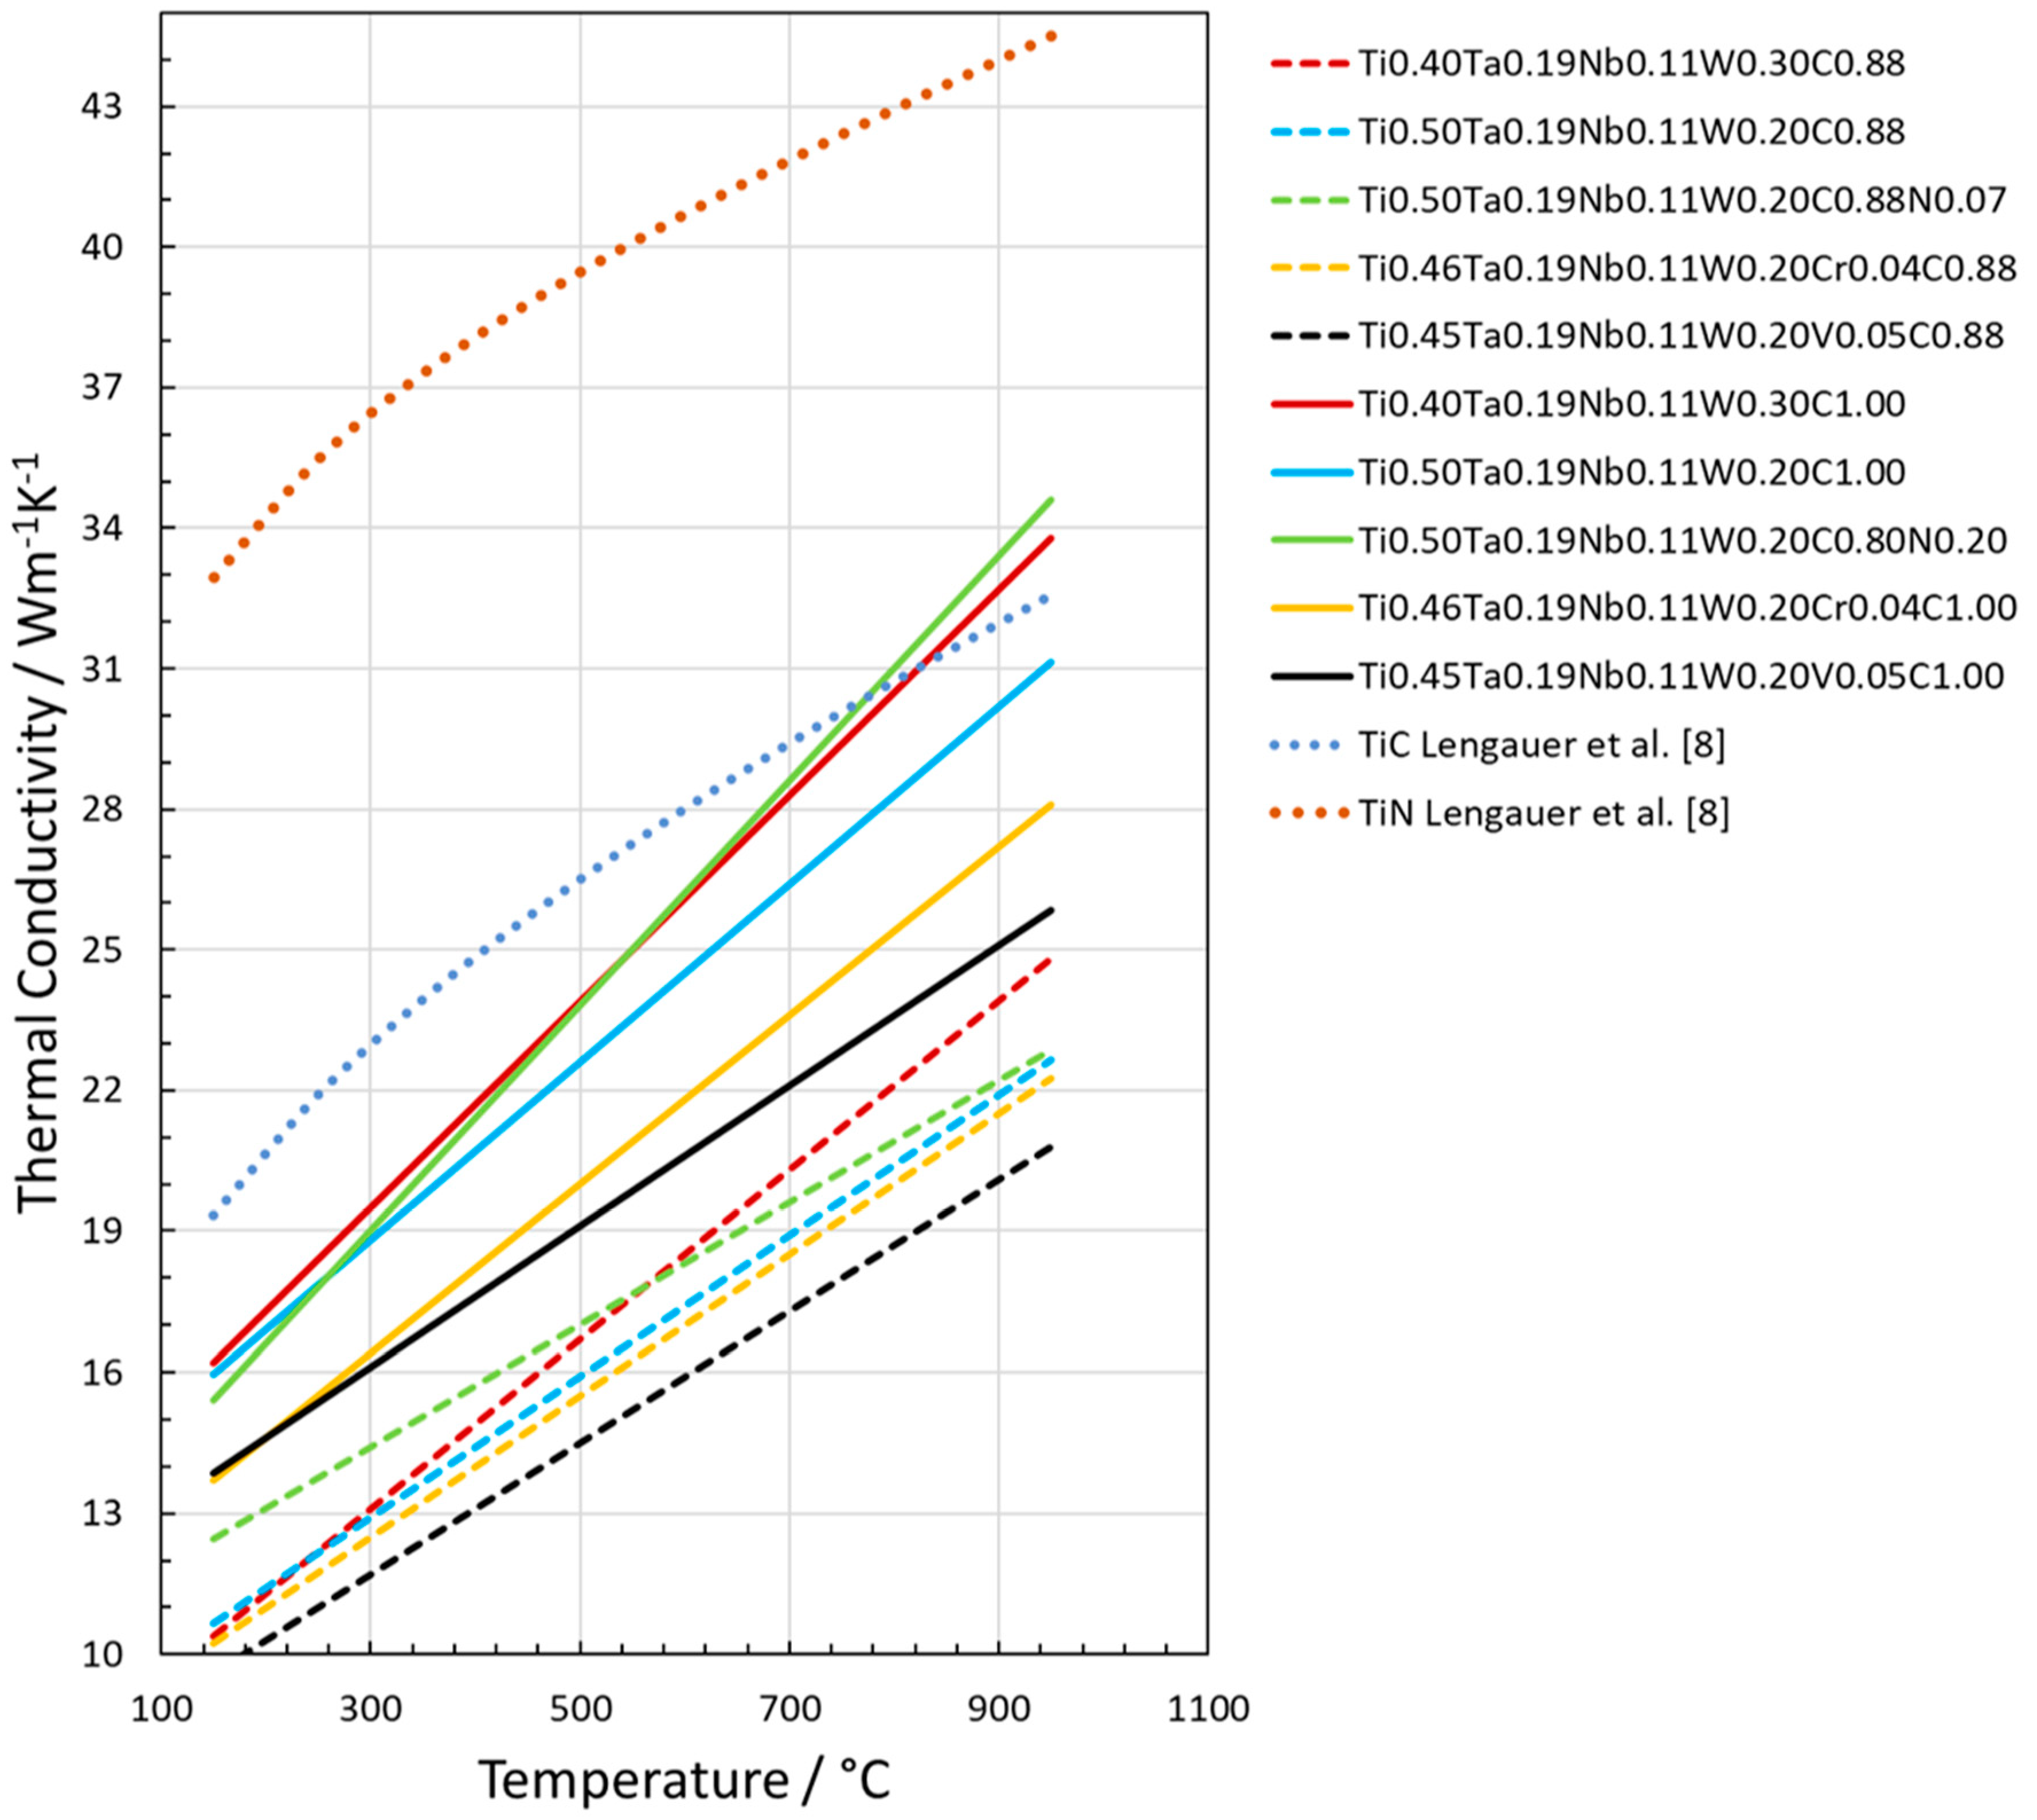
3.2. Properties of the MC/M(C,N) Phase
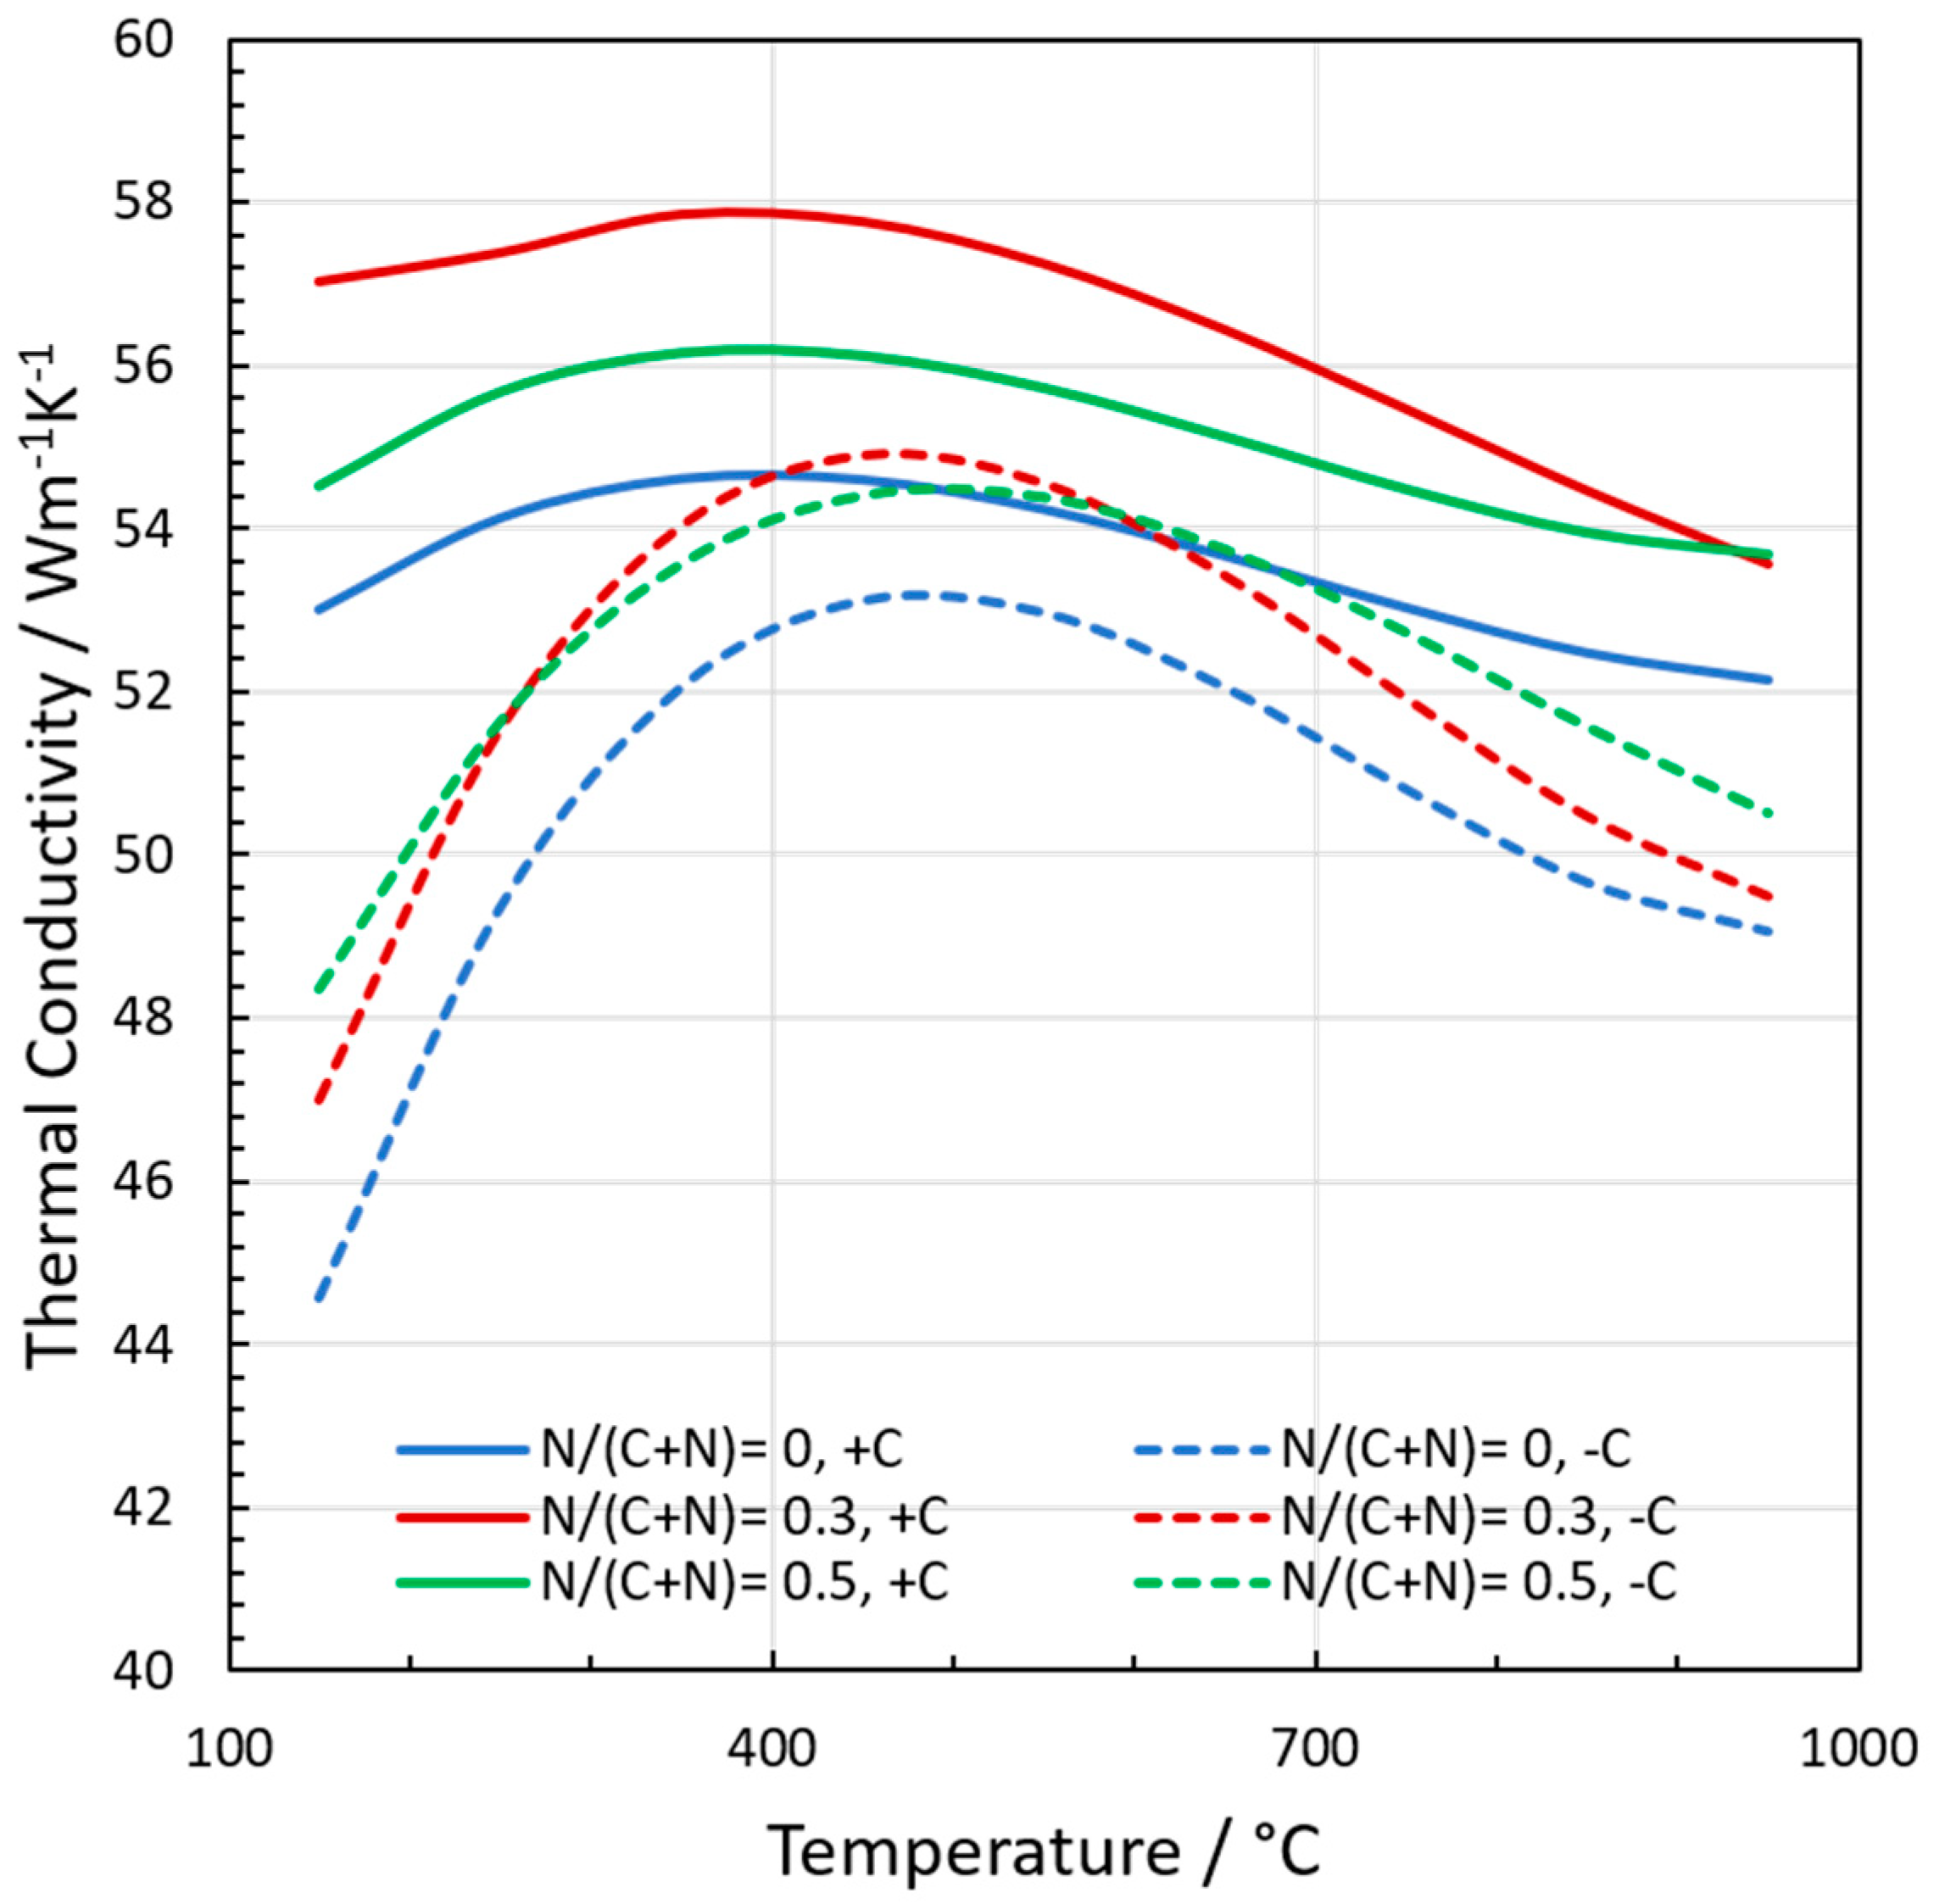
As the MC/M(C,N) phases incorporate only a small amount of Cr and V in Cr- and V-doped hardmetals, we prepared MC/M(C,N) phases with an increased amount of 5 mol% V ([V]/[M]) and 4 mol% of Cr ([Cr]/[M]), respectively, in order to be able to enhance a possible influence on the properties of MC/M(C,N) phases.

Heat Conductivity

The heat conductivity was substantially lowered with the increase in the non-metal deficiency or “sub-stoichiometry” (Figure 4, broken lines). This is due to an increased phonon scattering at empty non-metal sites. The grain size of sub-stoichiometric samples is generally somewhat larger than that of stoichiometric ones. Hence, the difference would be even larger if the same grain size could be established because a larger amount of grain boundaries lowers the heat-conductivity. It is, however, not possible to adjust identical grain size upon hot pressing. Cr and V lowered the heat conductivity of these sub-stoichiometric MC/M(C,N) compounds, too, whereas W increased it, especially at high temperature, so did N at lower temperatures.
For stoichiometric compositions [C]+[N] near one (full lines in Figure 4), the doping elements Cr and V had the same lowering effect as in sub-stoichiometric MC/M(C,N) phases. Also, the same impact for N and W as in sub-stoichiometric compositions was seen: both increased the heat conductivity upon an increase in concentration. Interestingly, the heat conductivities of these multicomponent MC/M(C,N) phases were substantially lower than that of TiN and at lower T also than that of TiC [8] (Figure 4, dotted lines).

3.3. Properties of Hardmetals

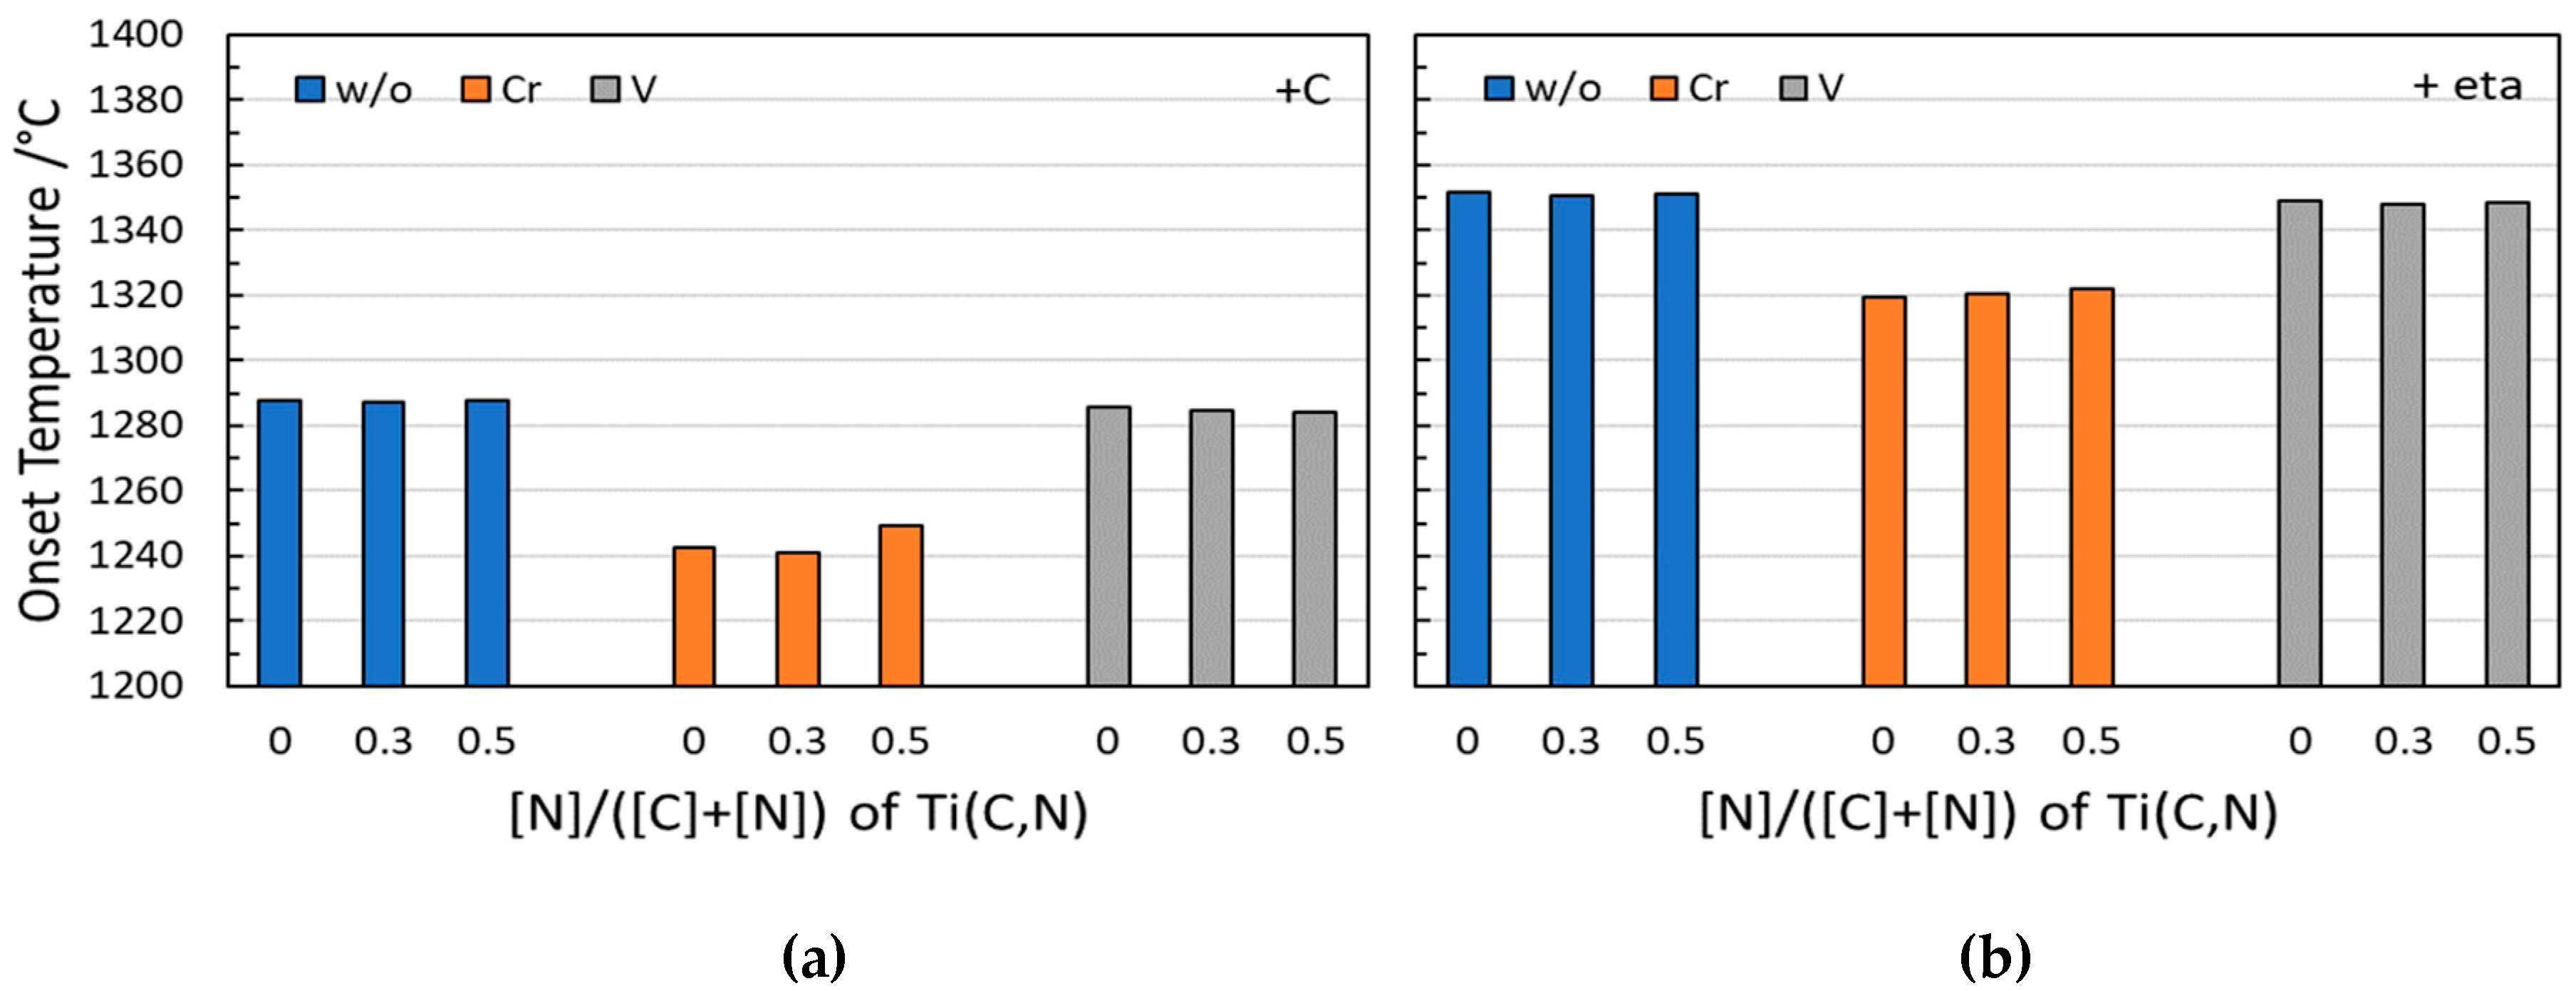
3.3.1. Liquid Phase Formation Temperature

In Figure 5, the liquid phase formation temperatures (TL) of the various grades are summarised. The alloys were adjusted to show free C or eta in order to come near to a non-variant reaction with fixed C activity. In the WC-Co system, these are true non-variant reactions (only within the WC-Co field the activity is not fixed, so TL is varying). Hence, the two temperatures give the maximum (with eta) and minimum (with free C) temperatures of liquid phase formation in these systems.
We observed a substantial lower TL in case of Cr-doped grades, whereas the V-doped grades showed only a slightly smaller TL. In addition, the Cr-doped grades showed a small increase of TL with increasing [N]/([C]+[N]), whereas the V-doped grades showed a very small decrease. The differences are quite small, and the differentiation was only possible because all of the analyses were made in consecutive runs and the excellent reproducibility of such analyses within ±1 °C.

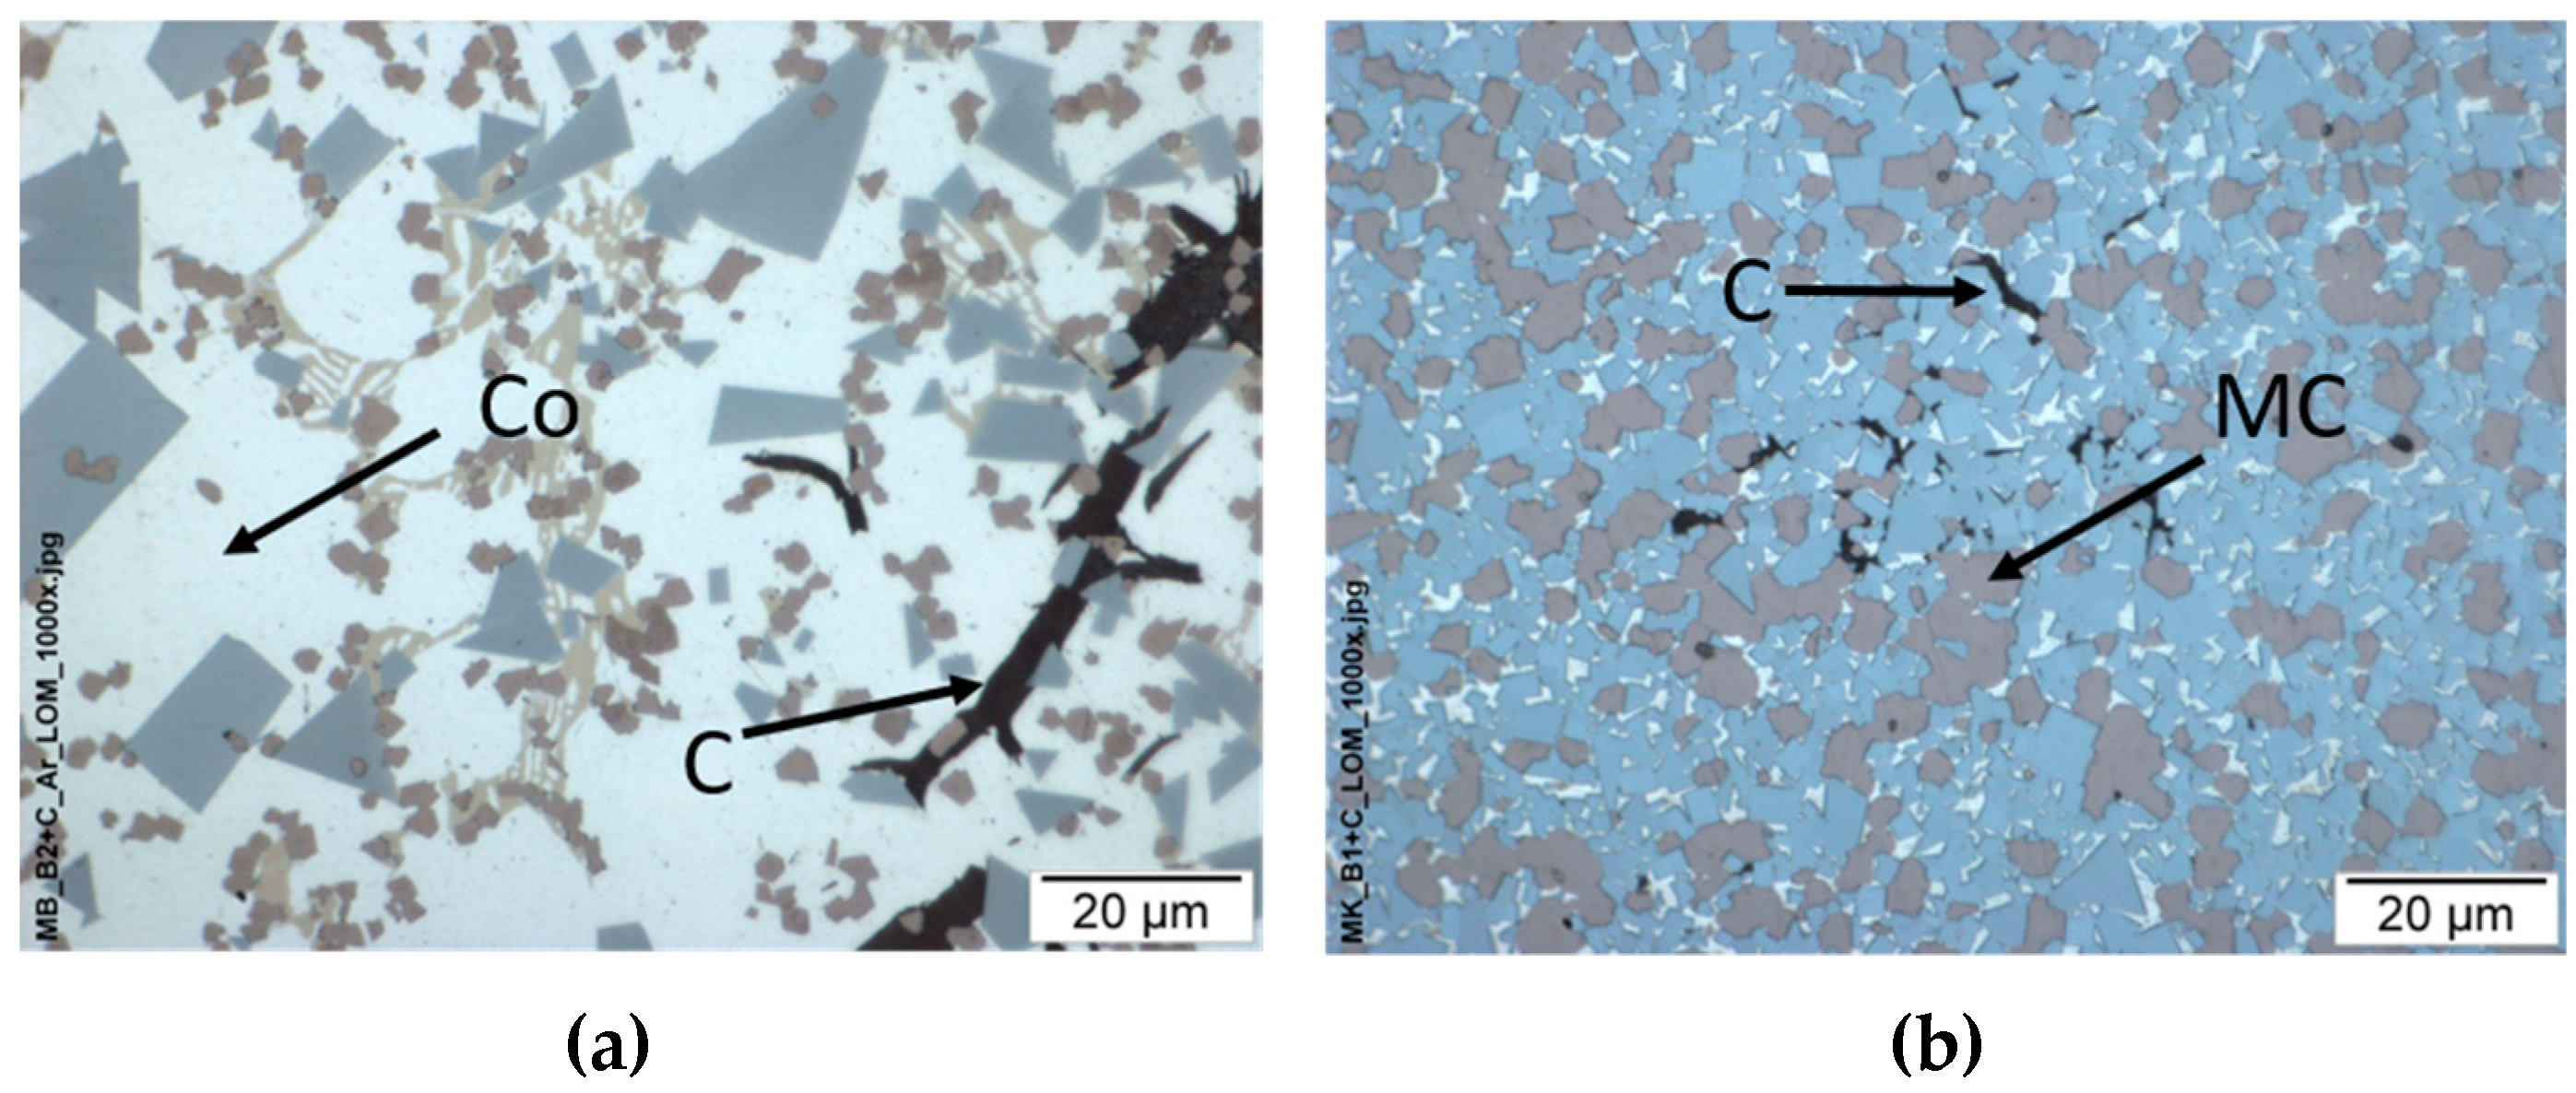
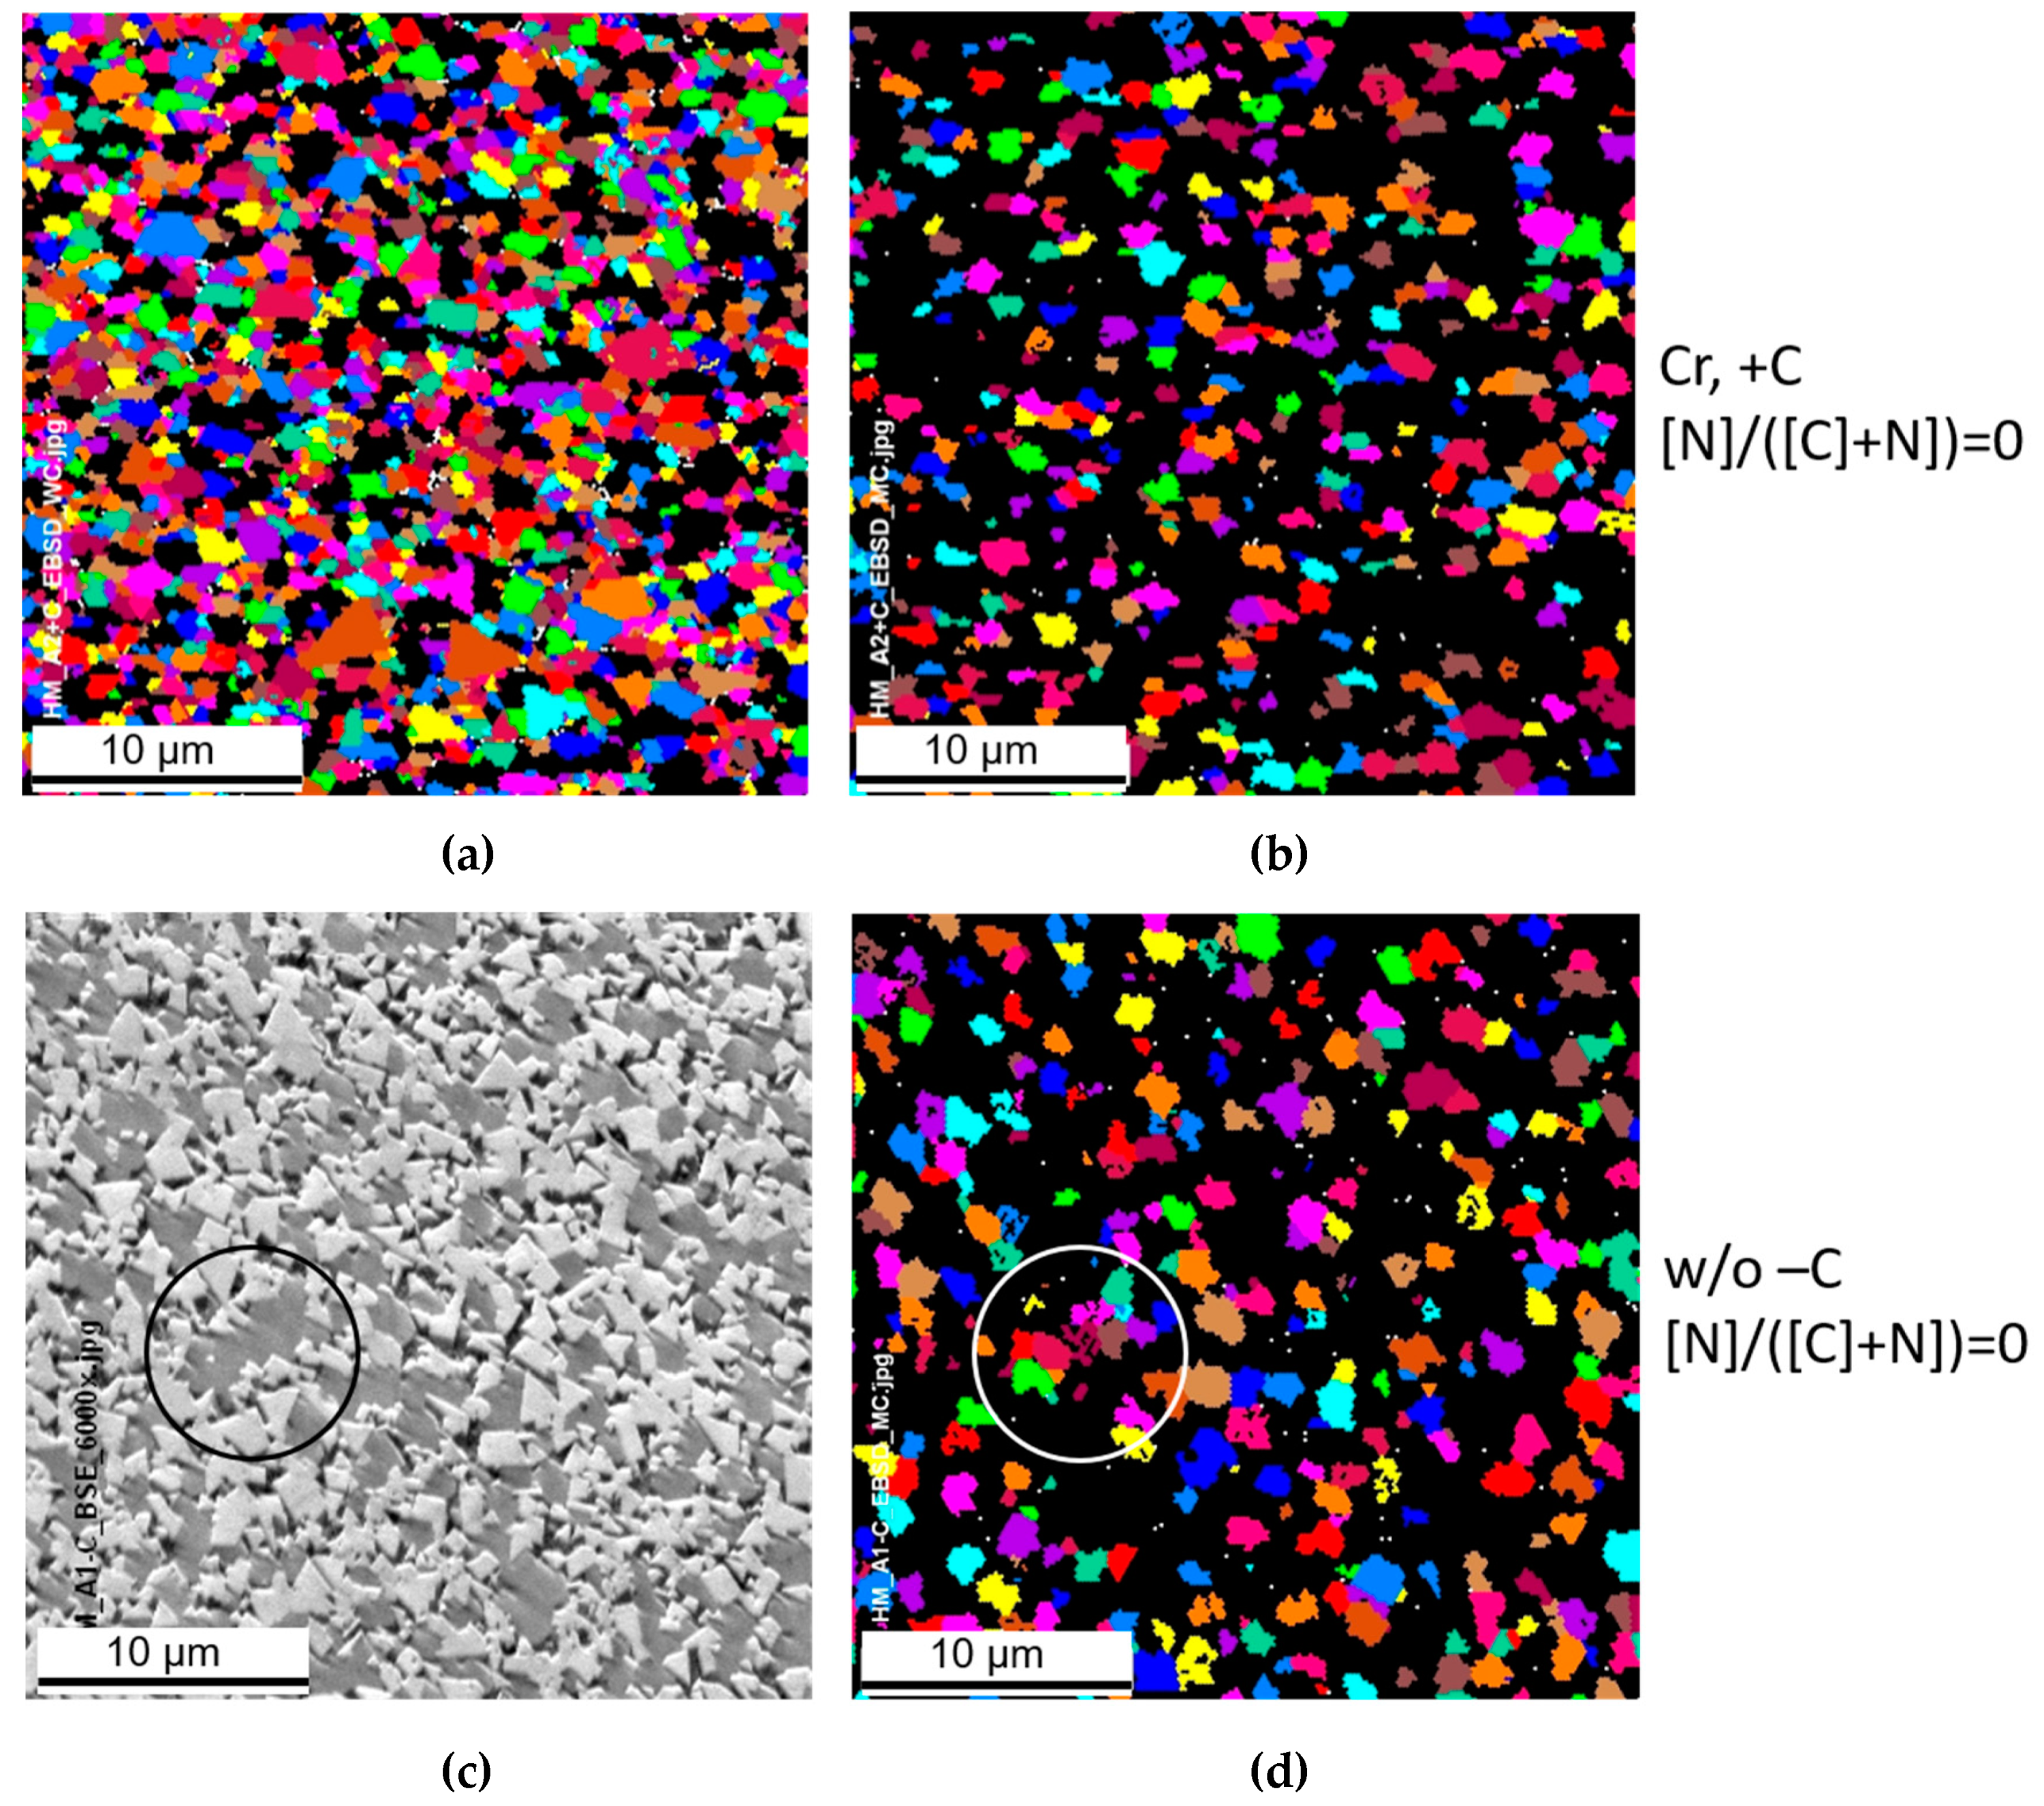
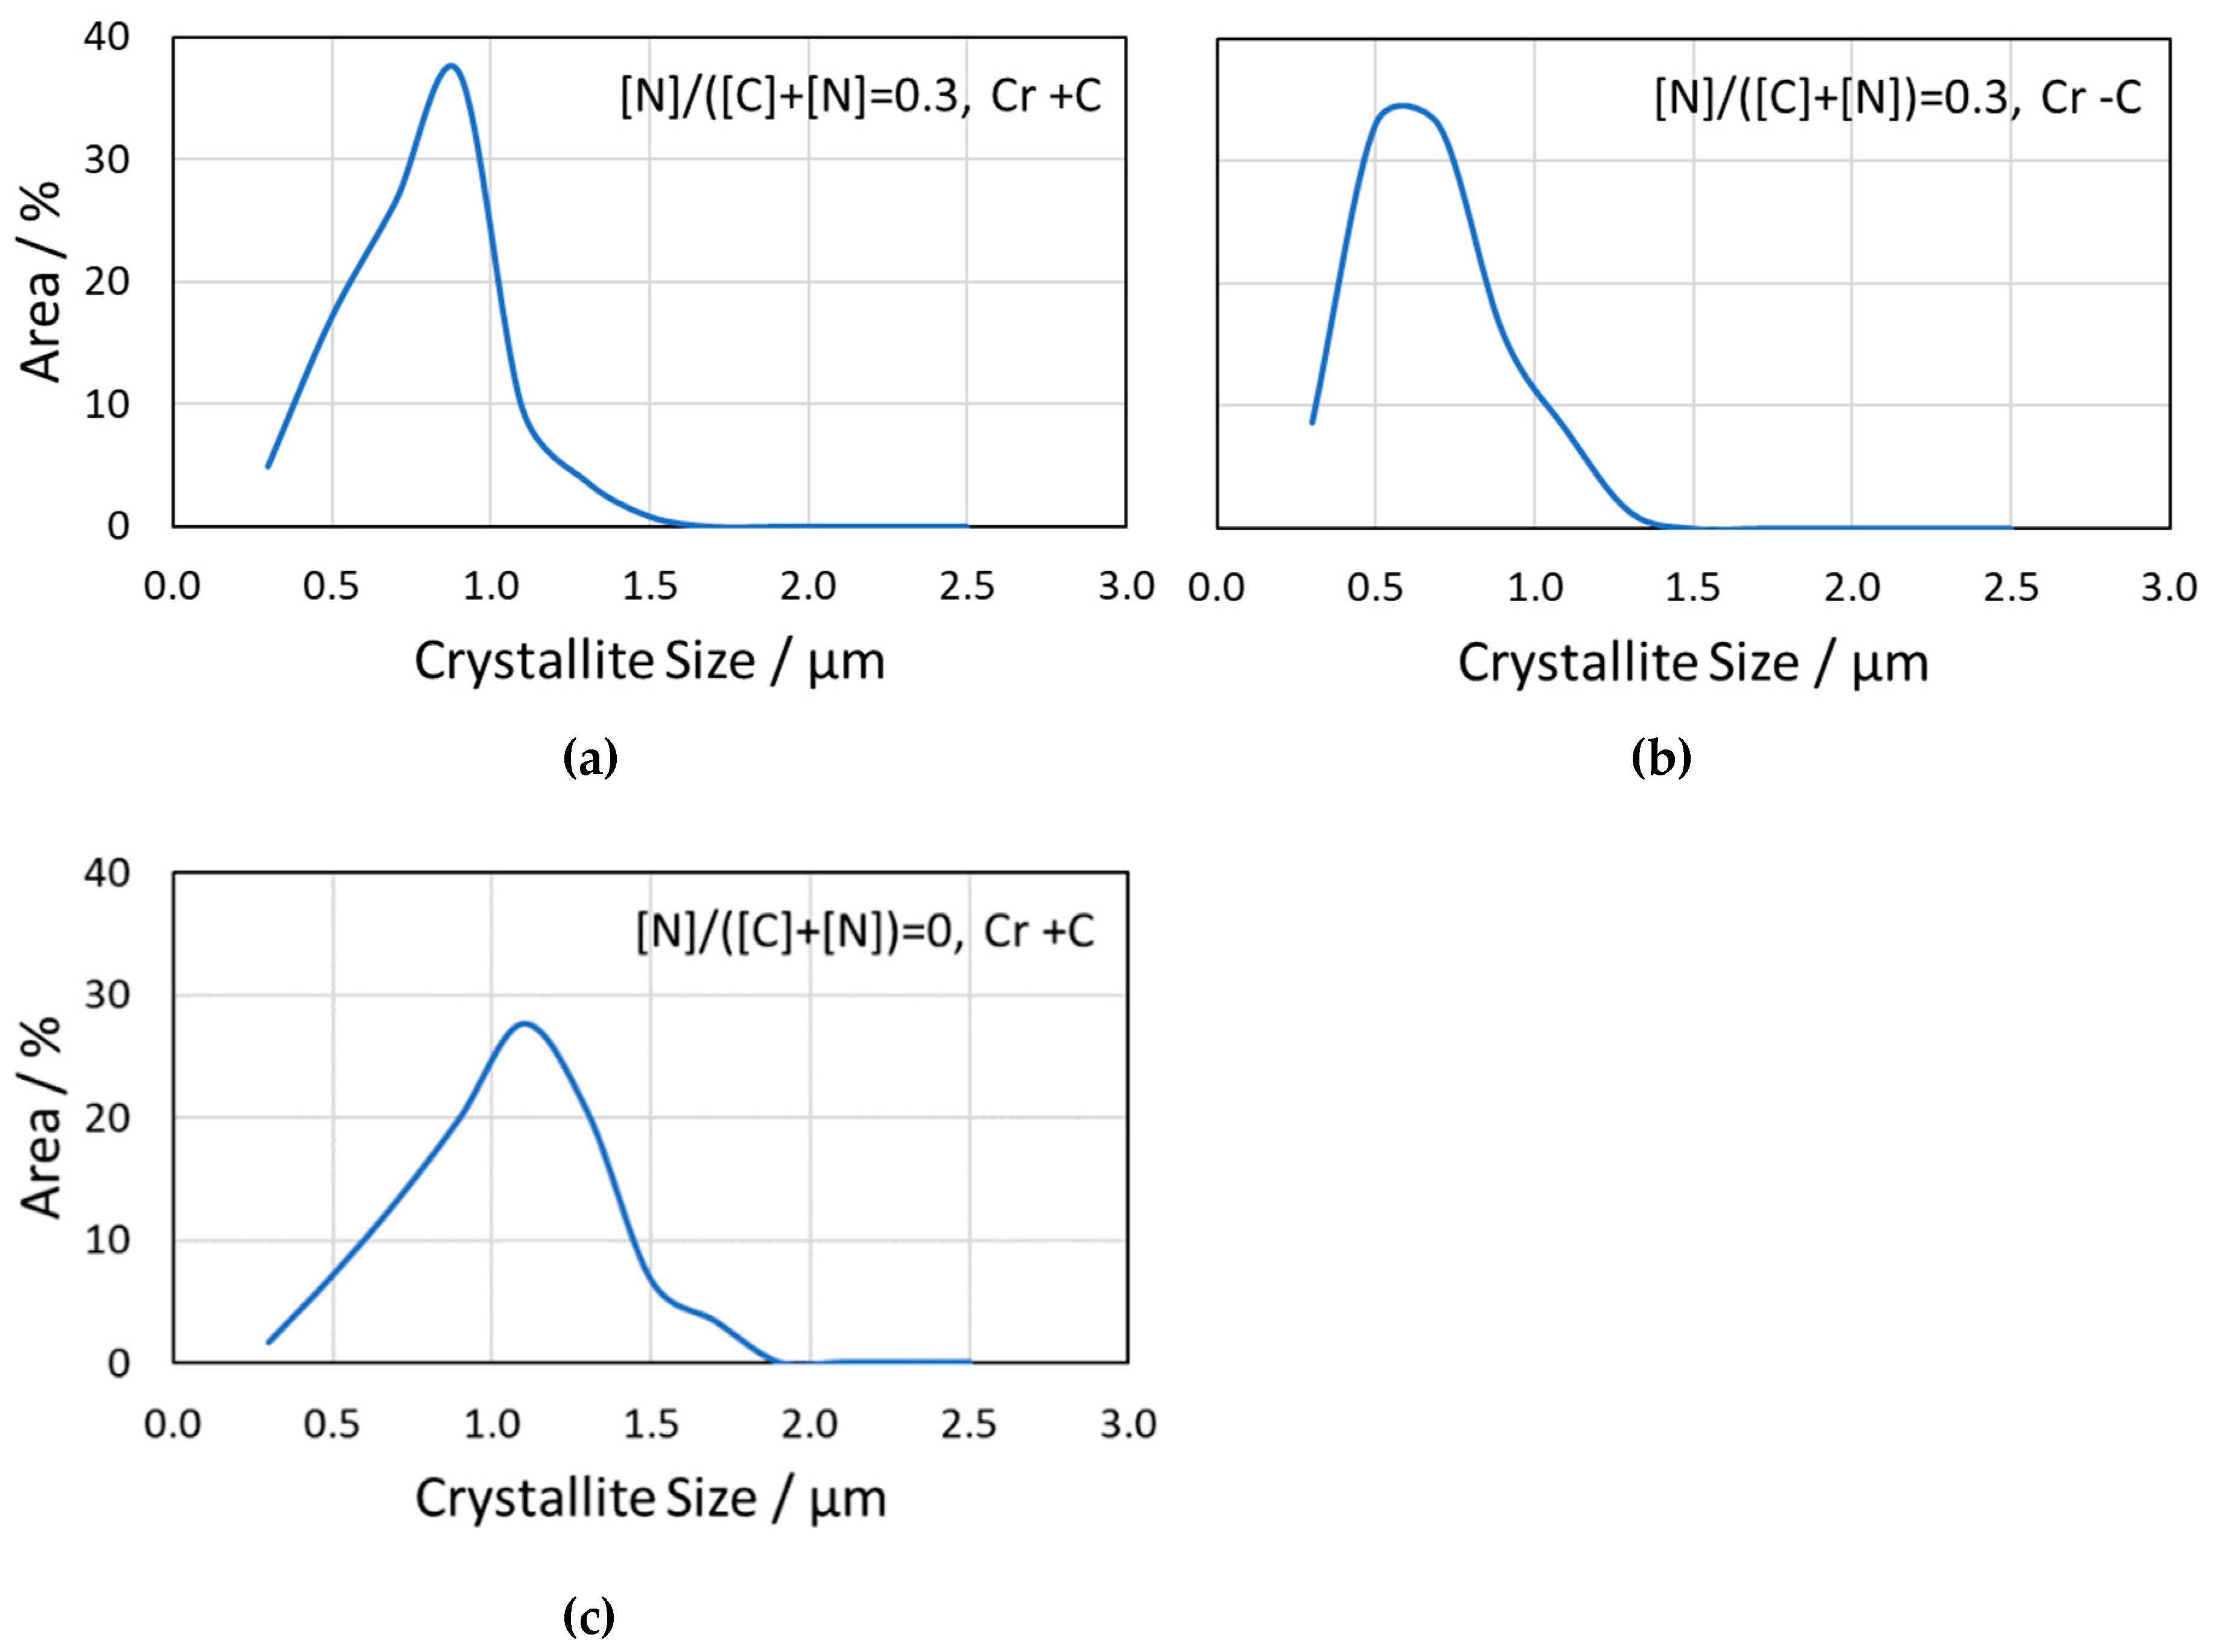
3.3.2. Microstructure and Crystallite-Size Distribution

EBSD and BSE microstructures are shown in Figure 6. It was observed that the MC/M(C,N) crystallites cluster to some extent, a phenomenon which could not be observed in SEM-BSE mode because of identical grey scale (compare crystallites in the circle in Figure 6c,d). Smaller MC/M(C,N) crystallites could be observed in the +C grade, Cr-doped, Figure 6b compared to −C grade, undoped, Figure 6d. This is proof that the refining effect of Cr doping overcompensates the coarsening effect of a larger C activity.
The EBSD images were processed to obtain the crystallite-size distribution of the WC and MC/M(C,N) phases, respectively. The carbon activity influence on the WC phase was identical to that known from WC-Co hardmetals: the larger the C activity, the larger the crystallite size.
The influence of carbon activity and nitrogen content of the crystallite-size distribution of the fcc MC/M(C,N) phase is shown in Figure 7. This shows that at the same nitrogen level [N]/([C]+[N]) = 0.3, the crystallite size increases with the larger C activity (compare Figure 7a,b). Thus, the influence of C on the fcc phase is similar to that on the WC phase. A substantial influence was also observed for nitrogen (compare Figure 7a,b): a higher N content of the MC/M(C,N) phase, [N]/([C]+[N]) = 0.3, at the same C activity of Ms ≈ 88% (“+C”), lowers the crystallite size as compared to a grade without nitrogen. A similar finding was also observed in nitrogen-containing Ti(C,N)-based cermets [2].

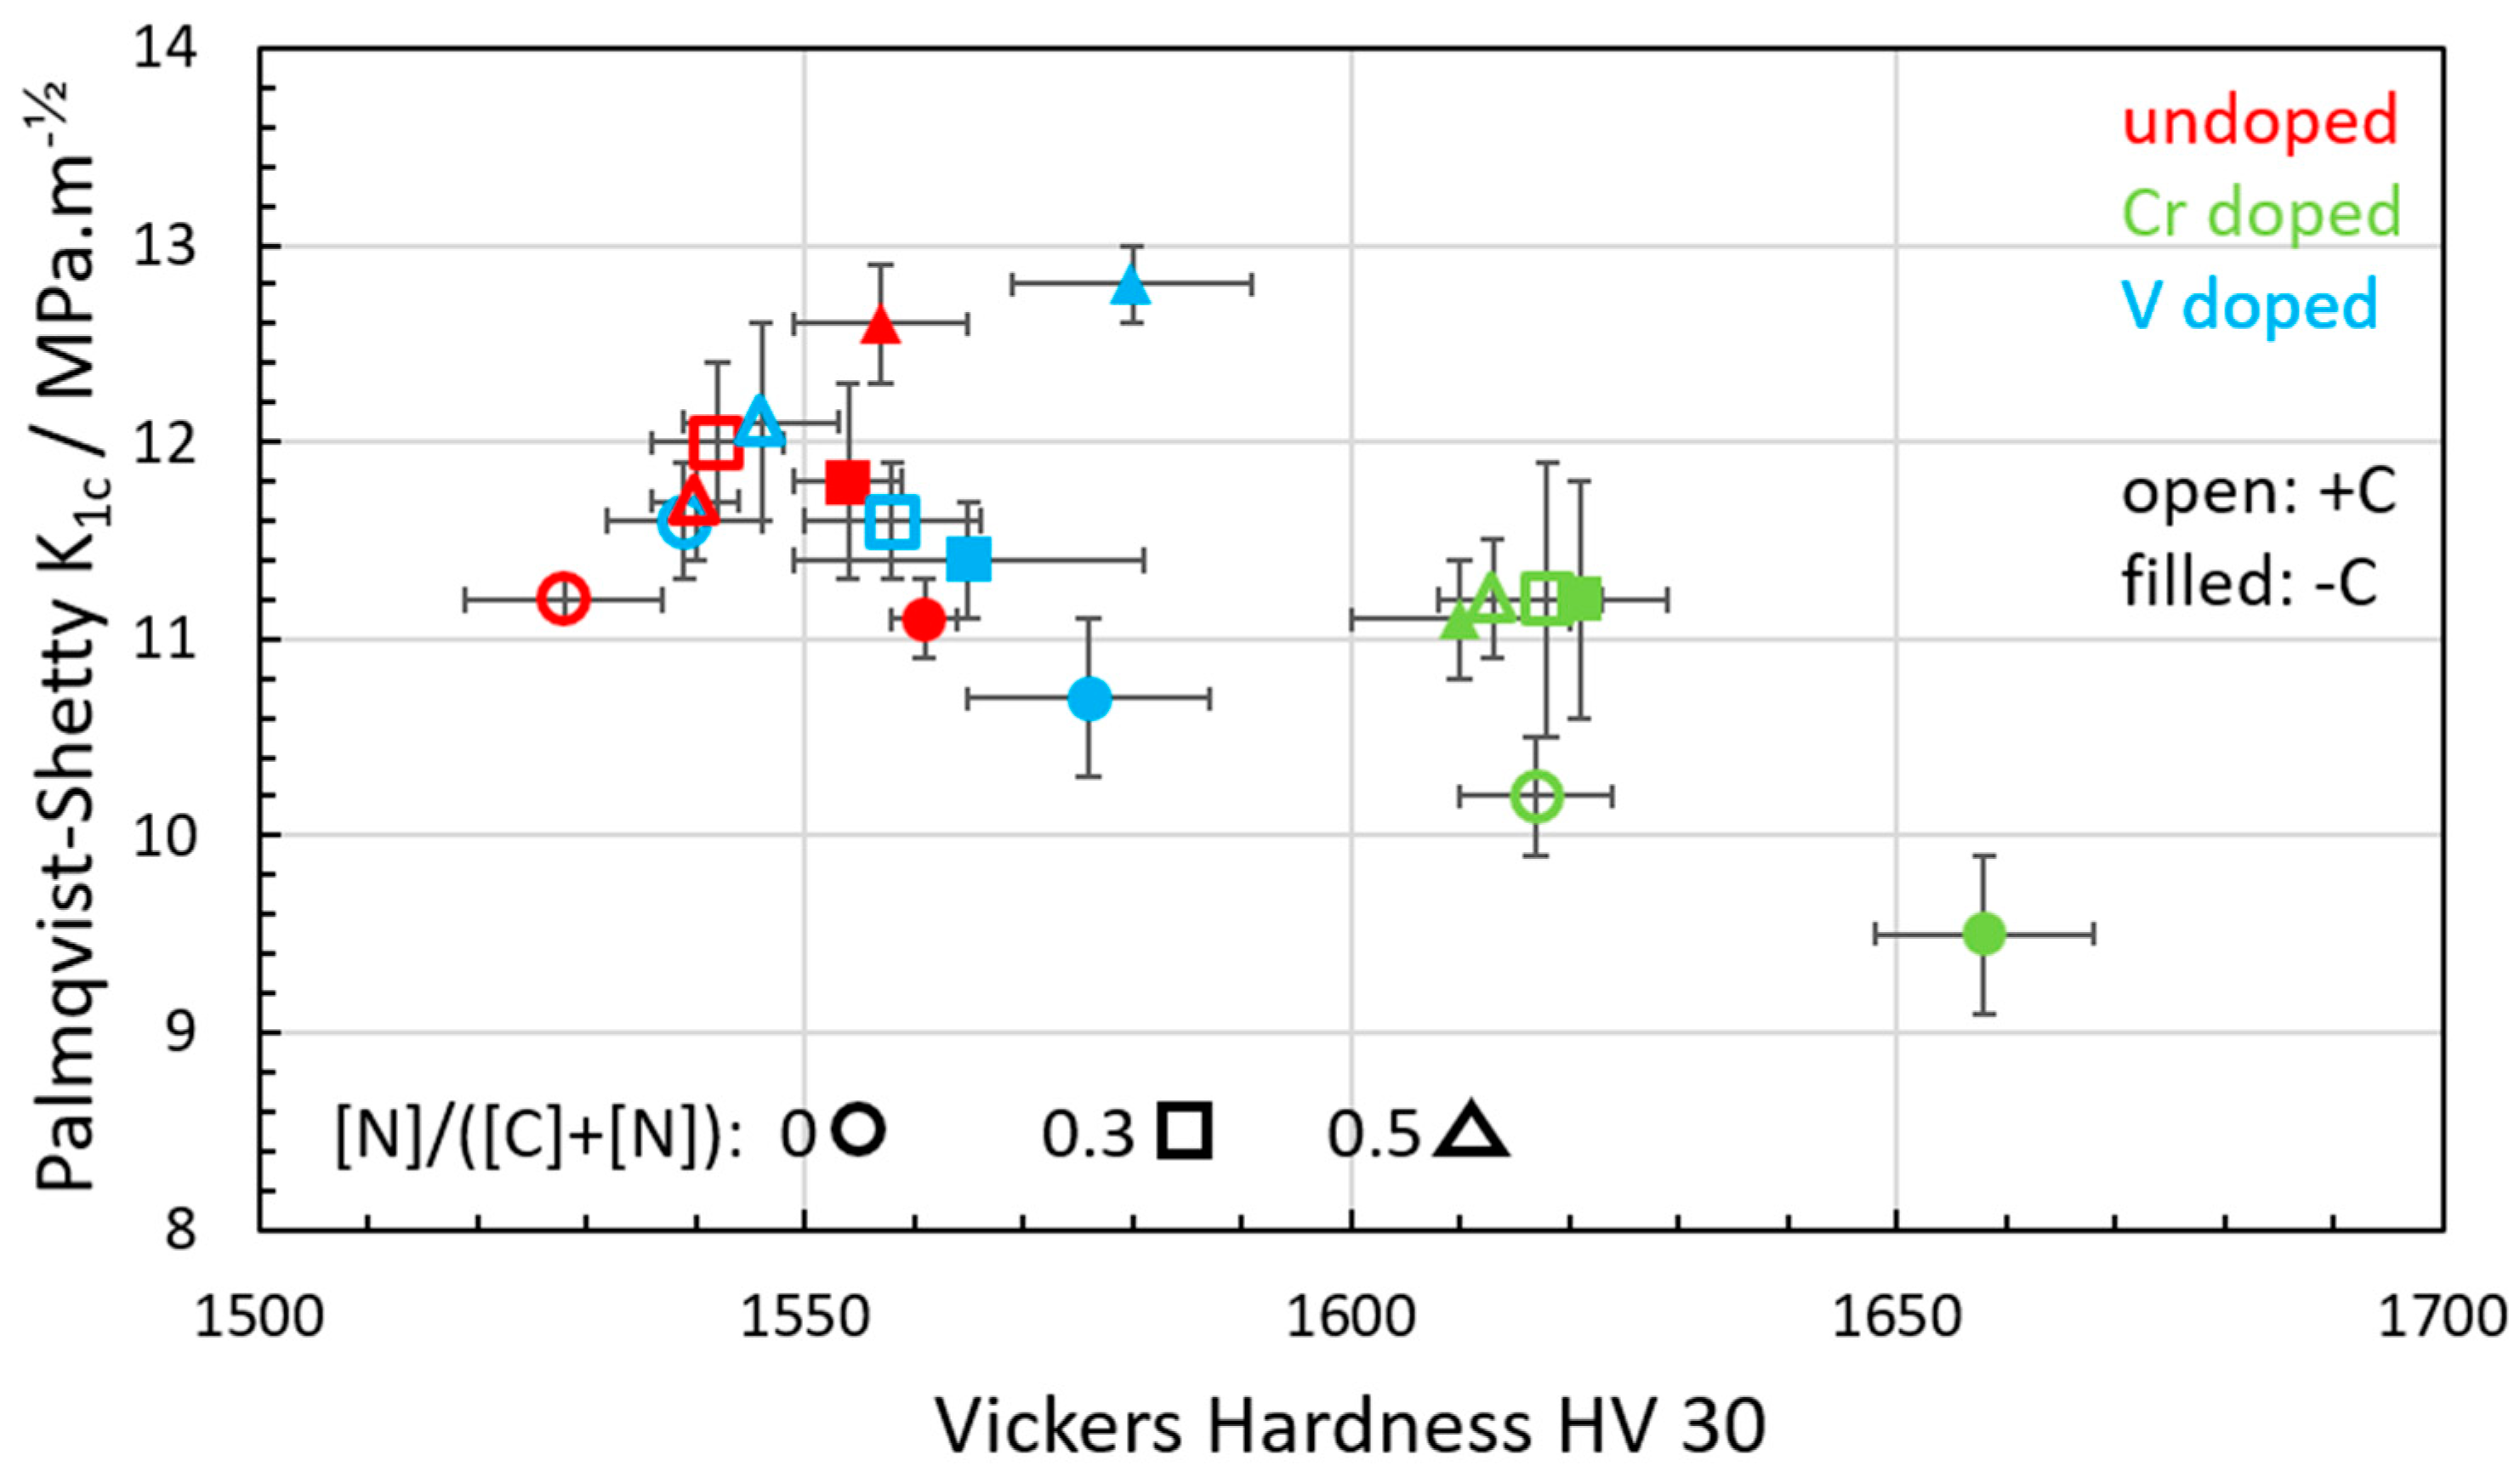
3.3.3. Hardness and Fracture Toughness

The fracture toughness (KIC) vs. hardness HV30 relationship of the studied hardmetals is shown in Figure 8. A quite broad range of hardness and KIC values can be established by changing only a few parameters, such as doping and C activity.
Undoped hardmetals are at the lower HV30 and upper KIC region, V-doped hardmetals at the higher HV30 and lower KIC region. Cr-doped hardmetals are located in between but closely neighboured to undoped hardmetals. The difference in hardness between high-C and low-C hardmetals is due to the above discussed grain-size influence of C and is most pronounced for hardmetals containing nitrogen in the MC/M(C,N) phase (compare open and filled circles in Figure 8).

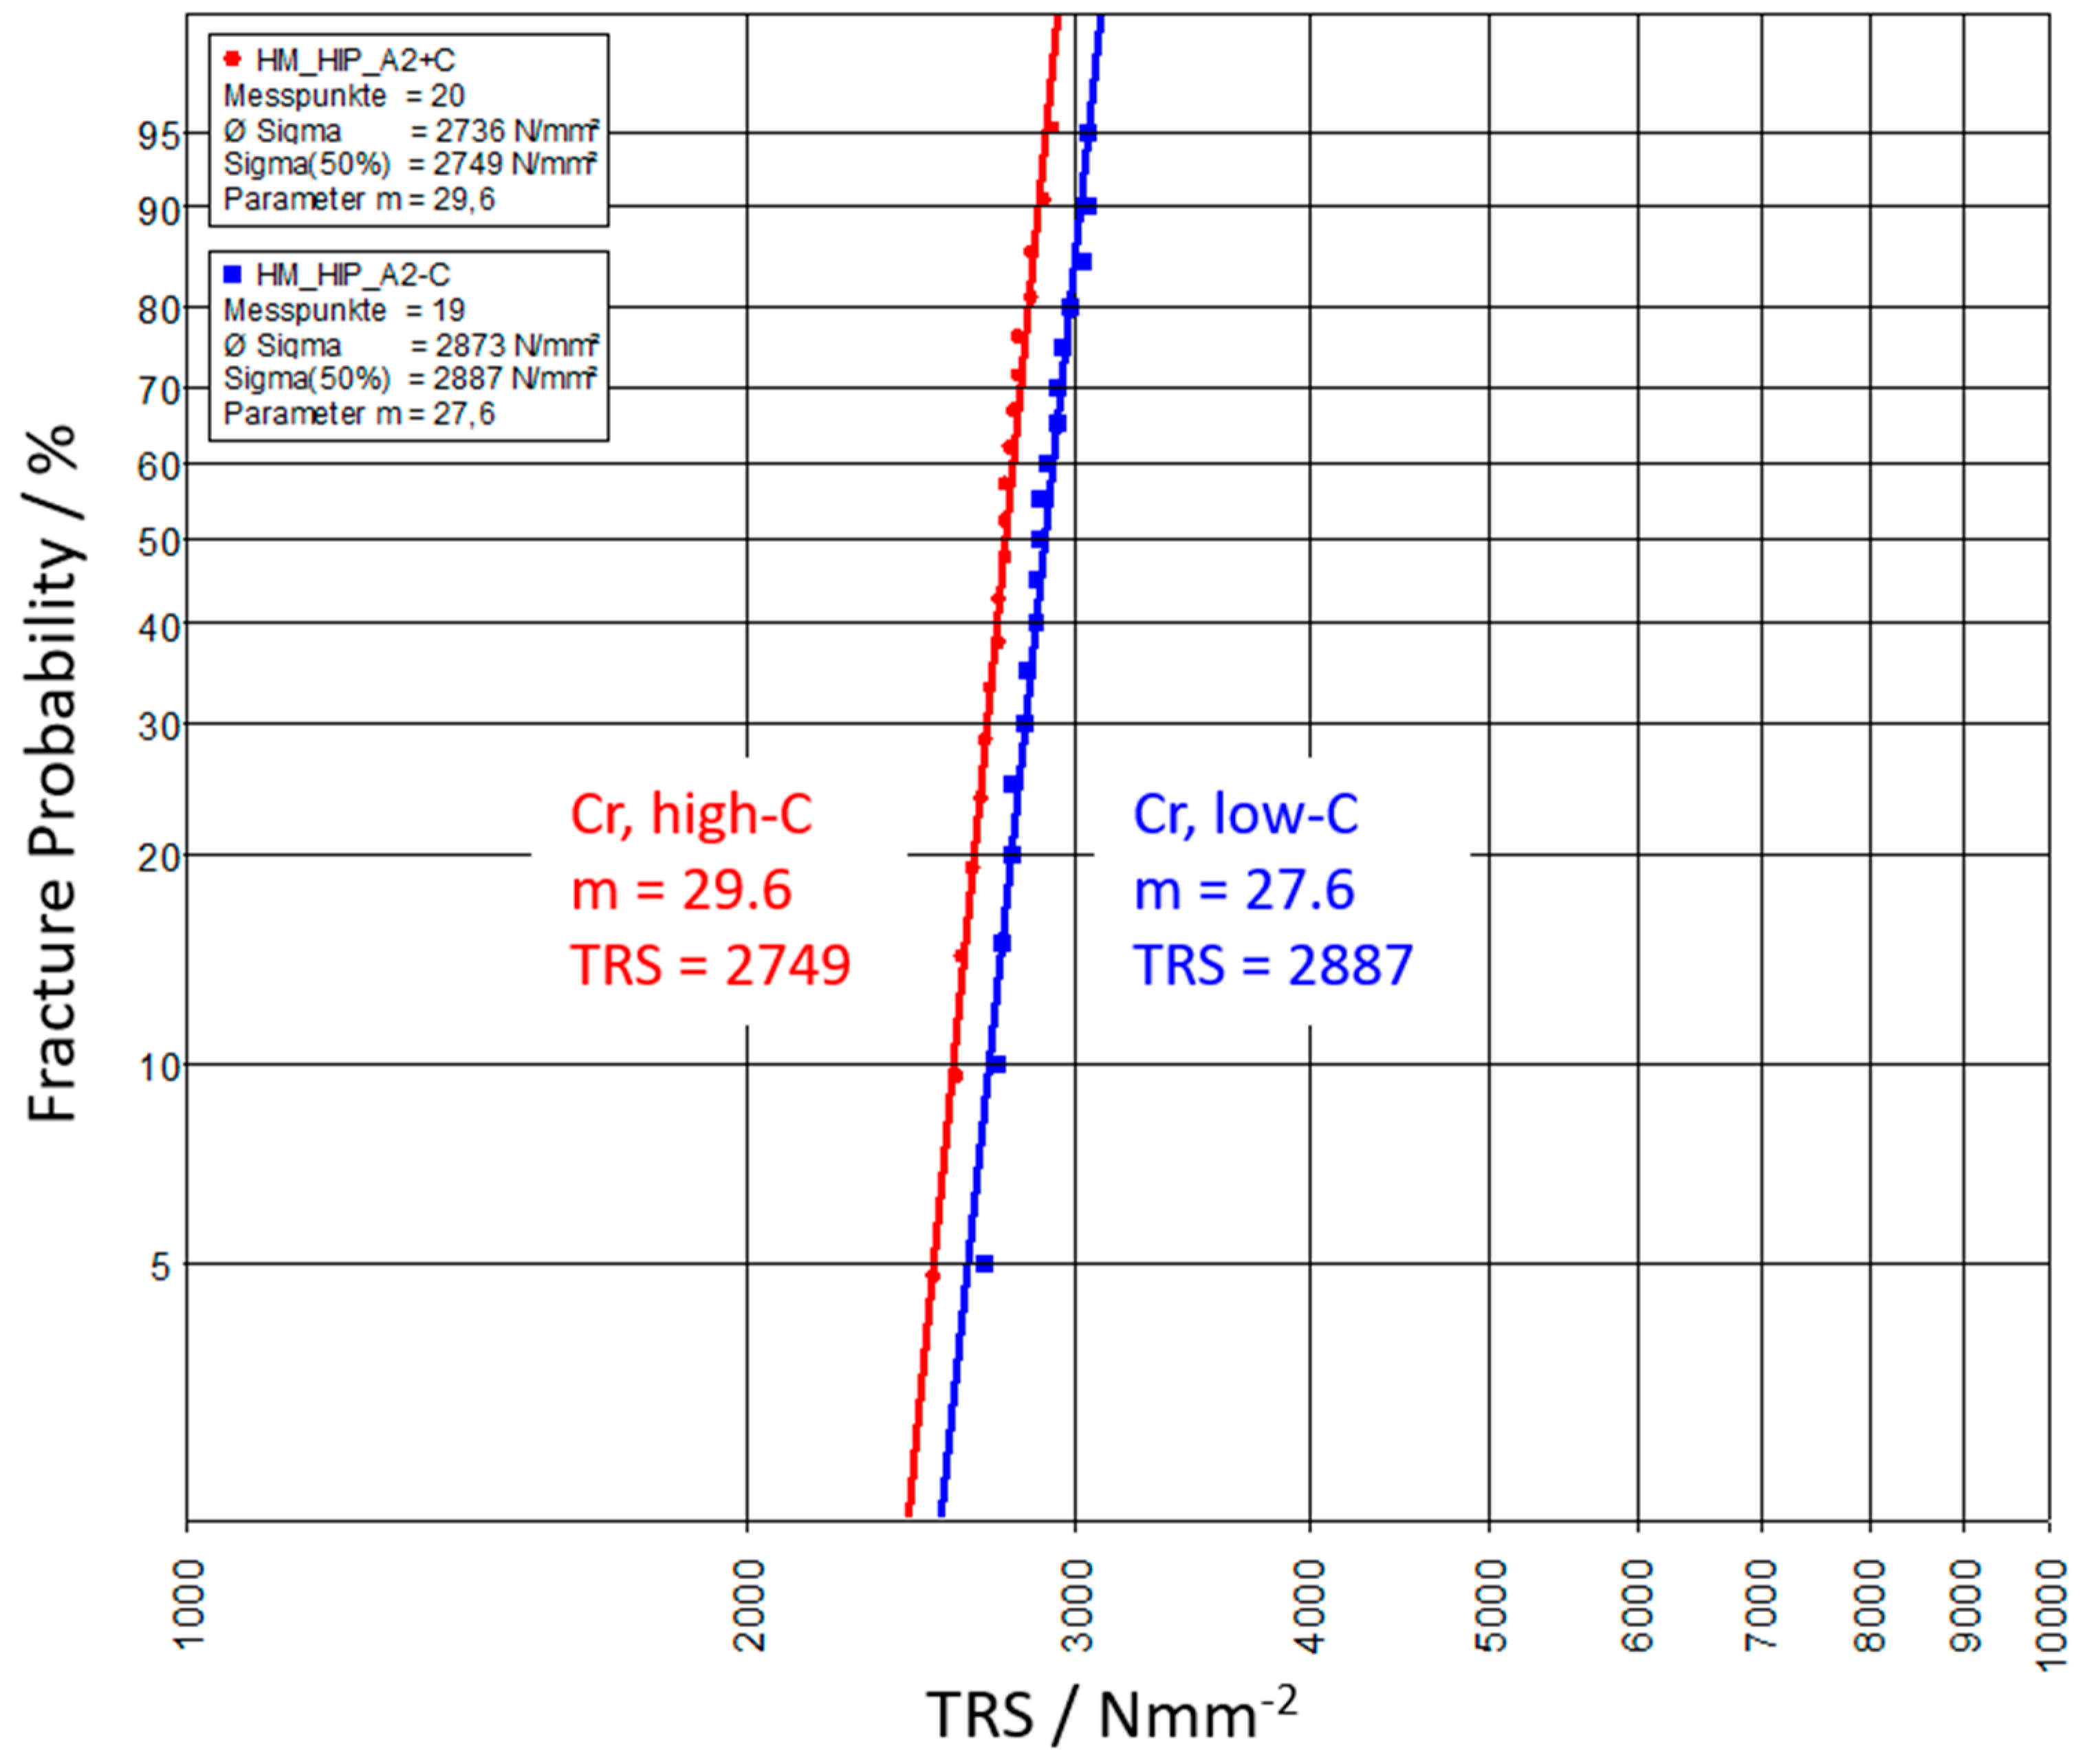
3.3.4. Weibull Evaluation and TRS

An example of measurements of the TRS (transverse rupture strength) is shown in the form of a Weibull plot in Figure 9. The TRS was read from the 50% fracture probability. A high slope m reflected high reliability of the materials because of the narrower the range of load at which the samples break.
From this example graph, the general behaviour with respect to C activity could be observed, and high C activity gave slightly lower TRS than low C activity. The individual Weibull evaluation data are represented in Figure 10 with the same symbol settings as in Figure 8. Undoped hardmetals (red) showed the highest TRS, while V- and Cr-doped hardmetals a somewhat lower. Most of the grades with low C activity (Ms ≈ 75%, “−C”) had higher TRS than the grades with high C activity (Ms ≈ 88%, “+C”). There were two groups of m data, one group between m = 15–20 and another group around m = 30. The V-doped [N]/([C]+[N]) = 0.3 grade was outside these data with a very high m, these [N]/([C]+[N]) = 0.3 grades (squares) were otherwise in the lower m region.

3.3.5. Thermal Conductivity of Hardmetals

The thermal conductivity of undoped hardmetals is contained in Figure 11. Hardmetals with high C activity showed higher thermal conductivity than with low C activity, which is especially pronounced at temperatures below 400 °C. Another phenomenon is interesting: hardmetals in a high-C version with the N-richest MC/M(C,N) did not show the highest heat conductivity as the data on pure MC/M(C,N) would imply. At low C activity, the difference between the two N-containing grades was, however, small.
The thermal conductivities reported by Frandsen and Williams [9] were substantially lower than our findings. Also, Neumann [10], Kny and Neumann [11] and Zhang et al. [12] have investigated the thermal diffusivity of various hardmetals, including MC/M(C,N) phases. These investigations showed that the thermal diffusivity decreased substantially with an increasing amount of MC/M(C,N) phases [9,10]. This is also implied by the data of Wang et al. [13], who measured the thermal conductivities of WC-Co hardmetals (no MC/M(C,N) phase) as a function of grain size and Co content. Their data showed that WC-Co hardmetals with similar grain size to that of the present study were located around 100 Wm−1K−1 at 100 °C, much higher than that of our MC/(M(C,N)-containing grades.

3.3.6. Oxidation Resistance

It is known that the oxidation resistance of WC-MC/M(C,N)-Co hardmetals stems from the passivation activity of the MC/M(C,N) phase as compared to WC-Co grades. The experiments were performed in a tube furnace under flowing air by pushing the samples quickly into/out of the hot zone. Figure 12 gives a good impression of this behaviour, and the WC-MC/M(C,N)-Co hardmetals showed only about half of the weight gain in such a test at 800 °C. On increasing [N]/([C]+[N]) ratio of the added TiC/TiN phase, the hardmetals became inferior (an increase of mass loss). Hardmetals in the low-C region (−C, right) were slightly superior to that of the high −C region (+C, left), the best behaviour could be found for Cr-doped grades.

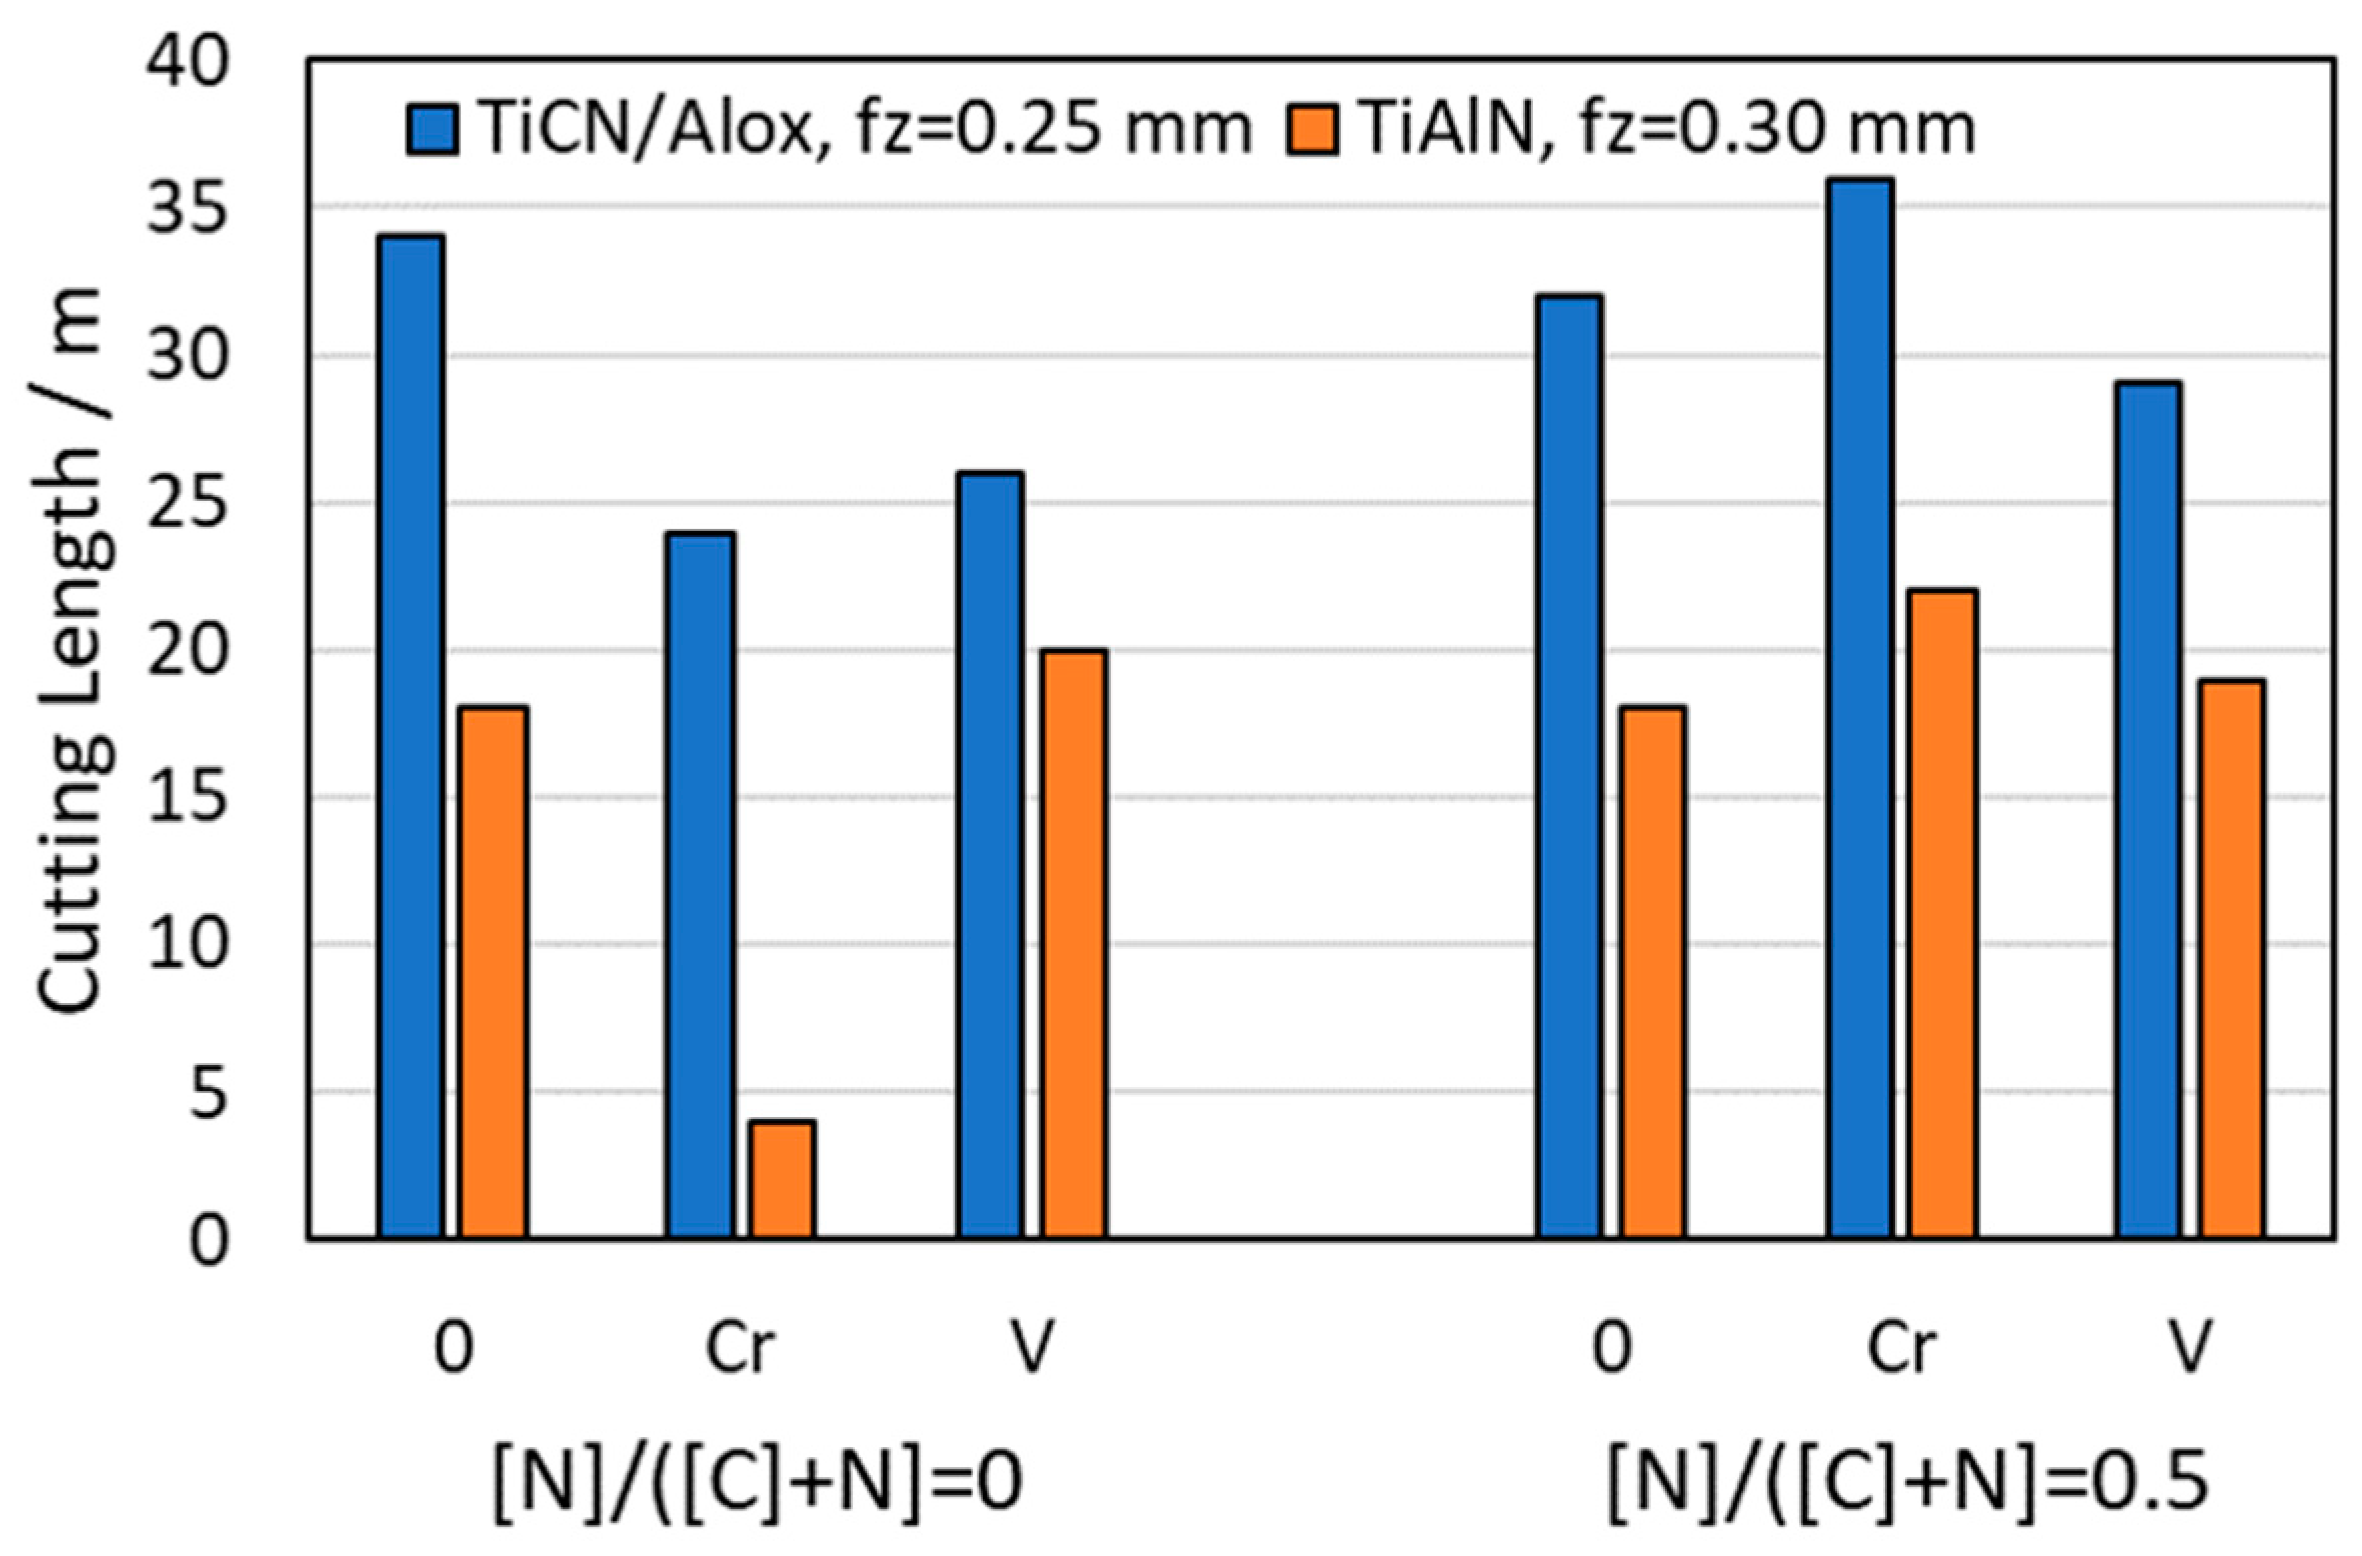
3.3.7. Milling Tests

Milling tests with a choice of low-C hardmetal inserts of XPHT 160412 geometry were performed on tempered Ck45 (1.1191) steel with Ti(C,N)/Al2O3-coated (CVD) and (Ti,Al)N-coated (PVD) grades. A milling M680 cutter with 63 mm cutting edge diameter was employed. Two feed rates, fz = 0.25 and 0.3 mm, with cutting depth of ap = 2.5 mm were chosen at a cutting speed of 220 m/min until a wear land of VBHS = 0.30 mm was reached.
The Ti(C,N)/Al2O3-coated hardmetals were the best at fz = 0.25 mm (at fz = 0.3 mm, most of these grades broke before the maximum wear land was reached), whereas the (Ti,Al)N were the best at fz = 0.3 mm. Both sets are introduced in Figure 13. It was observed that Cr doping with an MC/M(C,N) phase of [N]/([C]+[N]) = 0.5 was superior to other grades, also the undoped grade with [N]/([C]+[N]) = 0 showed good performance. A comparison of the milling test results with laboratory data (Figure 8 and Figure 10) is interesting: the best milling grade (filled green triangle and filled blue circle) had a high slope (m = 31.4), an intermediate TRS (2832 Nmm−2) (Figure 10), as well as an intermediate KIC and hardness (KIC = 11.1 MPa·m−½, HV30 = 1610) (Figure 8).

4. Conclusions

A detailed investigation of 18 different WC-MC/M(C,N)-Co hardmetal grades with two different C levels, three doping types and three types of fcc titanium carbide/nitride levels was performed. The MC/M(C,N) phase is composed of Ti, Ta, Nb and W and also contains Cr or V if the hardmetal is doped with the latter. If a nitride is used in the starting formulation, the MC/M(C,N) phase contains nitrogen, too. The experiments included a detailed investigation of model alloys with an increased amount of binder phase and hard phase, respectively, to study the phase composition, DTA investigations of liquid phase formation, heat conductivity as a function of temperature (from heat capacity and temperature conductivity), hardness, fracture toughness, transverse rupture strength with Weibull evaluation, oxidation resistance, to finally end up with milling tests on various hardmetal inserts with two different coatings. This study appears as one of the most complete study on material properties of WC-MC/M(C,N)-Co hardmetals and their constituents, reaching from a basic metallurgical study on the composition of the various constituents over the detailed characterisation of hardmetals to testing. It is also proof that a laboratory evaluation of properties, such as hardness and fracture toughness, alone cannot predict field testing results to find out the optimum grade. Hence, both series of testing are complementary and are assumed to be the best strategy to achieve optimum materials.

Author Contributions

Conceptualisation, W.L.; methodology, R.H. and W.L.; investigation, R.H.; writing—original draft preparation, W.L.; writing—review and editing, W.L.; visualisation, R.H. and W.L.; supervision, W.L.; project administration, W.L.; funding acquisition, W.L.

Acknowledgments

This study was conducted in the frame of the German Hardmetal Association within a research project sponsored by Ceratizit S. à r. l. (Luxembourg), Kennametal Widia GmbH (Germany), H.C. Starck GmbH (Germany), Treibacher Industrie AG (Austria), Tribo Hartstoff GmbH (Germany), Walter AG (Germany). Preparation of hardmetal grades, coating and testing were performed at Kennametal Widia (Essen, Germany) under the guidance of Henk van den Berg, Klaus Rödiger and Klaus Dreyer.

Conflicts of Interest

The authors declare no conflict of interest.

References

  1. Brookes, K.J.A. Hardmetals and Other Hard Materials, 3rd ed.; Intl. Carbide Data: East Barnet, UK, 1998. [Google Scholar]
  2. Ettmayer, P.; Kolaska, H.; Lengauer, W.; Dreyer, K. Ti(C,N) Cermets—Metallurgy and properties. Int. J. Refract. Met. Hard Mater. 1995, 13, 343–351. [Google Scholar] [CrossRef]
  3. Konyashin, I.; Lengauer, W. Sintering mechanisms in functionally graded cemented carbides. Mater. Sci. Forum 2016, 835, 116–198. [Google Scholar] [CrossRef]
  4. Lengauer, W.; Bauer, J.; Bohn, M.; Wiesenberger, H.; Ettmayer, P. Electron-probe microanalysis of light elements in multiphase diffusion couples. Microchim. Acta 1997, 126, 279–288. [Google Scholar] [CrossRef]
  5. Peng, Y.; Buchegger, C.; Lengauer, W.; Du, Y.; Zhou, P. Solubilities of grain-growth inhibitors in WC-Co based cemented carbides: Thermodynamic calculations compared to experimental data. Int. J. Refract. Met. Hard Mater. 2016, 61, 121–127. [Google Scholar] [CrossRef]
  6. Ondracek, G. The Quantitative microstructure-field property correlation of multiphase and porous materials. Rev. Powder Metall. Phys. Ceram. 1987, 3, 205–322. [Google Scholar]
  7. Lauter, L.; Hochenauer, R.; Buchegger, C.; Bohn, M.; Lengauer, W. Solid-state solubilities of grain-growth inhibitors in WC-Co and WC-MC-Co hardmetals. J. Alloys Compd. 2016, 675, 407–415. [Google Scholar] [CrossRef]
  8. Lengauer, W.; Binder, S.; Aigner, K.; Ettmayer, P.; Guillou, A.; Debuigne, J.; Groboth, G. Solid-state properties of group IVB carbonitrides. J. Alloys Compd. 1995, 217, 137–147. [Google Scholar] [CrossRef]
  9. Frandsen, M.V.; Williams, W.S. Thermal conductivity and electrical resistivity of cemented transition metal carbides at high temperatures. J. Hard Mater. 1990, 1, 159–167. [Google Scholar]
  10. Neumann, W. Thermal diffusivity of cemented carbides. In Thermal Conductivity 18; Ashworth, T., Smith, D.R., Eds.; Springer: Boston, MA, USA, 1985; pp. 473–481. [Google Scholar]
  11. Kny, E.; Neumann, W. Einflußgrößen auf Temperatur-und Wärmeleitfähigkeit von WC-Co Hartmetallen. High Temp.-High Press 1986, 18, 179–189. [Google Scholar]
  12. Zhang, L.; Xue, J.; Jiuru, W. Studies on the Thermal Diffusivity of Hard Metals. Int. J. Refract. Met. Hard Mater. 1990, 9, 167–169. [Google Scholar]
  13. Wang, H.; Webb, T.; Bitler, J.W. Study of thermal expansion and thermal conductivity of cemented WC-composite. Int. J. Refract. Met. Hard Mater. 2015, 49, 170–177. [Google Scholar] [CrossRef]
Figure 1. (a) Co-rich model alloy with free C (“C”) and large binder phase areas (“Co”), (b) model alloy with large MC/M(C,N) grains (“MC”) and free C (“C”) for electron-probe microanalysis (EPMA) point measurements.
Metals 09 00435 g001
Figure 2. Binder phase solubility of W, Cr and V from Co-rich model alloys as a function of the nitrogen content [N]/([C]+[N]) of Ti-containing MC/M(C,N) phases in the starting formulation. (a) with free C, (b) with the eta phase.
Metals 09 00435 g002
Figure 3. The composition of the MC/M(C,N) phase. Tungsten mol fraction ([W]/[M] of the metal lattice, and ([C]+[N])/[M] (with and without Cr or V) in the formula (Ti,Ta,Nb,W{Cr,V})(C,N) as a function of doping (without: w/o, Cr and V doping). (a) in hardmetals at low (−C) and high (+C) C activity, (b) in model alloys with eta phase (−C) and free carbon (+C).
Metals 09 00435 g003
Figure 4. Heat conductivity as a function of temperature for non-metal-deficient (“sub-stoichiometric”) MC/M(C,N) phases (broken lines) and stoichiometric (full lines).
Metals 09 00435 g004
Figure 5. Liquid phase formation temperature of the 18 grades of hardmetals, each with free C and free eta phase; w/o: without doping, Cr: with Cr doping, V: with V doping. (a) peak onset temperature of grades with free C, (b) peak onset temperature of grades with eta phase.
Metals 09 00435 g005
Figure 6. Electron backscatter diffraction (EBSD) and back-scattered electrons (BSE) patterns of WC-MC/M(C,N)-Co hardmetals: (a) and (b) Cr doping, high C activity (Ms ≈ 88%, +C), (a) coloured WC phase, black MC/(C,N) phase; (b) coloured MC/M(C,N) phase, black WC phase; (c) and (d) no doping, low C activity (Ms ≈ 75%, –C), (c) SEM-BSE image, (d) coloured MC/M(C,N) phase, black WC phase.
Metals 09 00435 g006
Figure 7. Crystallite-size distribution of the MC/M(C,N) phase in Cr-doped samples, (a) high C activity (“+C”, Ms ≈ 88%) and (b) low C activity (“−C”, Ms ≈ 75%) at ([N]/([C]+[N] = 0.3 of added TiC/TiN phase. (c) no nitrogen content, [N]/([C]+[N]) = 0, of the MC/M(C,N) phase at high C activity (“+C”) of the hardmetal (Ms ≈ 88%), C activity as (a).
Metals 09 00435 g007
Figure 8. Palmqvist-Shetty fracture toughness KIC vs. Vickers hardness HV30 of 18 hardmetal grades as a function of nitrogen content [N]/([C]+[N]) of Ti(C,N) (circles: 0, squares: 0.3 and triangles: 0.5), doping (red: undoped, green: Cr doped) and C activity (open, filled symbols). The low C activity (“−C”) is at Ms ≈ 75%, the high C (“+C”) at Ms ≈ 88%.
Metals 09 00435 g008
Figure 9. Example of Cr-doped hardmetal grade for a Weibull plot for evaluation of transverse rupture strength (TRS) and the slope m. Red: high C activity (Ms ≈ 88%), blue: low C activity (Ms ≈ 75%).
Metals 09 00435 g009
Figure 10. Weibull evaluation for the full set of hardmetals. Symbols correlate with Figure 8. TRS: transverse rupture strength.
Metals 09 00435 g010
Figure 11. Thermal conductivity of undoped hardmetals with high C activity Ms ≈ 88%, “+C”, full lines and low C activity Ms ≈ 75%, “−C”, broken lines and different nitrogen content in the TiC/TiN phase added, [N]/([C]+[N]) = 0, 0.3 and 0.5.
Metals 09 00435 g011
Figure 12. Oxidation behaviour of hardmetals in the air (15 min at 800 °C) as a function of doping and nitrogen content of the added TiC/TiN. (a) high-C (Ms ≈ 88%), (b) low-C (Ms ≈ 75%) doping.
Metals 09 00435 g012
Figure 13. Cutting tests of low C activity grades with two different coatings (CVD-Ti(C,N)/ Al2O3, PVD-(Ti,Al)N), at two different [N]/([C]+[N]) ratios of the added TiC/TiN phase as a function of doping.
Metals 09 00435 g013

